
Adaptation and Validation of the Perception of Anomie Scale in Chilean University Students

Abstract
1. Introduction
2. Materials and Methods
2.1. Participants
2.2. Instruments
2.3. Procedure
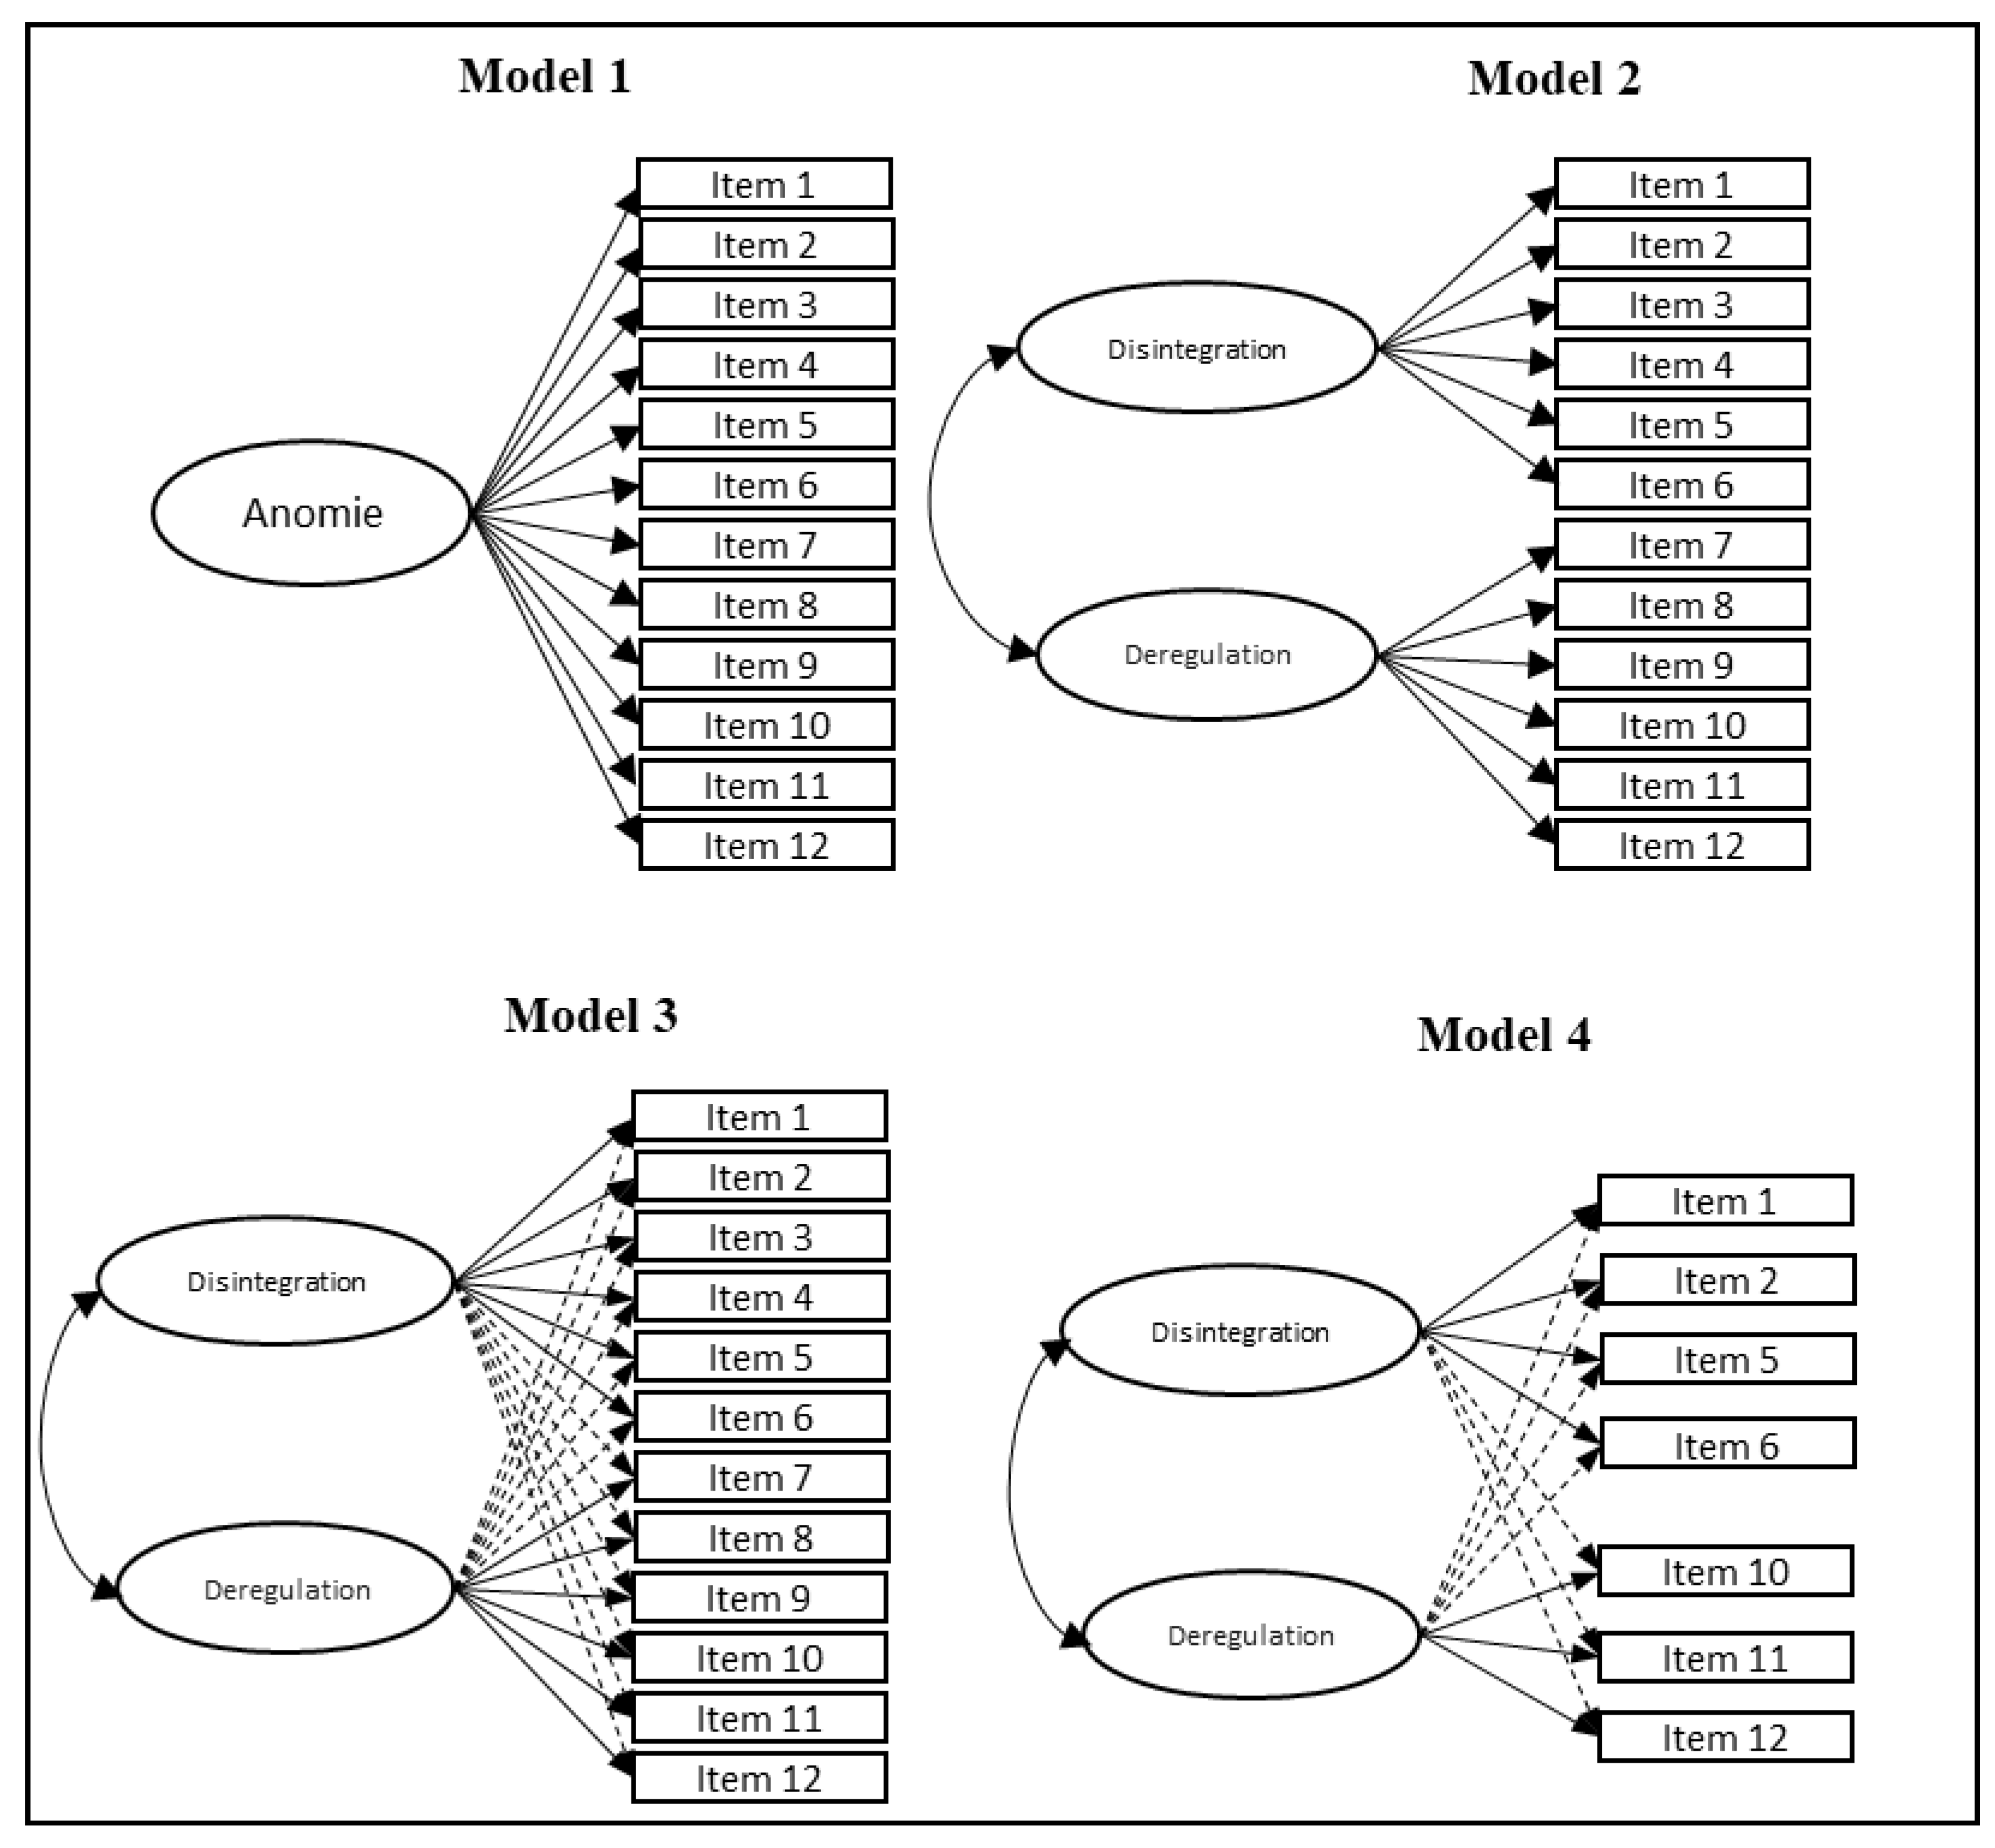
2.4. Data Analysis
3. Results
3.1. Descriptive Analysis
3.2. Factor Structure
3.3. Evidence of Reliability
3.4. Factorial Invariance by Sex
4. Discussion
Author Contributions
Funding
Institutional Review Board Statement
Informed Consent Statement
Data Availability Statement
Conflicts of Interest
References
- Fontanella, L.; Sarra, A.; Valentini, P.; Di Zio, S.; Fontanella, S. Varying Levels of Anomie in Europe: A Multilevel Analysis Based on Multidimensional IRT Models. Adv. Stat. Anal. 2018, 102, 589–610. [Google Scholar] [CrossRef]
- Deflem, M. Anomie: History of the Concept. In International Encyclopedia of the Social & Behavioral Sciences, 2nd ed.; Elsevier Inc.: Amsterdam, The Netherlands, 2015; pp. 718–721. ISBN 9780080970875. [Google Scholar]
- Durkheim, E. La División del Trabajo Social; Ediciones Akai: Madrid, Spain, 1987. [Google Scholar]
- Thorlindsson, T.; Bernburg, J.G. Durkheim’s Theory of Social Order and Deviance: A Multi-Level Test. Eur. Sociol. Rev. 2004, 20, 271–285. [Google Scholar] [CrossRef]
- Ramírez-de-Garay, D. El Enfoque Anomia-Tensión y el Estudio del Crimen. Sociológica 2013, 28, 41–68. [Google Scholar]
- Abrutyn, S. Toward a General Theory of Anomie The Social Psychology of Disintegration. Arch. Eur. Sociol. 2019, 60, 109–136. [Google Scholar] [CrossRef]
- Su, Z.; Ye, Y.; Wang, P. Social Change and Generalized Anomie: Why Economic Development Has Reduced Social Trust in China. Int. Sociol. 2019, 34, 58–82. [Google Scholar] [CrossRef]
- Ignatjeva, O.A.; Pletnev, A.V. A Reconstruction of Max Weber’s Conception of Anomie. Vestn. Tomsk. Gos. Univ. Filos. Sotsiol. Politol./Tomsk State Univ. J. Philos. Sociol. Political Sci. 2020, 53, 168–177. [Google Scholar] [CrossRef]
- Puffer, P. Durkheim Did Not Say “Normlessness”: The Concept of Anomic Suicide for Introductory Sociology Courses. J. Rural Soc. Sci. 2009, 24, 11. [Google Scholar]
- Meštrović, S.G.; Brown, H.M. Durkheim’s Concept of Anomie as Dérèglement. Soc. Probl. 1985, 33, 81–99. [Google Scholar] [CrossRef]
- Freud, S. El Malestar en la Cultura; Amorrortu Editores: Buenos Aires, Argentina, 2016. [Google Scholar]
- Merton, R. Social Structure and Anomie. Am. Sociol. Rev. 1938, 3, 672–682. [Google Scholar] [CrossRef]
- Messner, S.F.; Rosenfeld, R. Crime and the American Dream, 3rd ed.; Wadsworth Publishing: Belmont, CA, USA, 2001. [Google Scholar]
- Zito, R.C. Institutional Anomie and Justification of Morally Dubious Behavior and Violence Cross-Nationally: A Multilevel Examination. Aust. N. Z. J. Criminol. 2019, 52, 250–271. [Google Scholar] [CrossRef]
- Teymoori, A.; Jetten, J.; Bastian, B.; Ariyanto, A.; Autin, F.; Ayub, N.; Badea, C.; Besta, T.; Butera, F.; Costa-Lopes, R.; et al. Revisiting the Measurement of Anomie. PLoS ONE 2016, 11, e0158370. [Google Scholar] [CrossRef] [PubMed]
- Srole, L. Social Integration and Certain Corollaries: An Exploratory Study. Am. Sociol. Rev. 1956, 21, 709–716. [Google Scholar] [CrossRef]
- Davol, S.H.; Reimanis, G. The Role of Anomie as a Psychological Concept. J. Individ. Psychol. 1959, 15, 215. [Google Scholar]
- McClosky, H.; Schaar, J.H. Psychological Dimensions of Anomy. Am. Sociol. Rev. 1965, 30, 14–40. [Google Scholar] [CrossRef] [PubMed]
- Agnew, R.S. Success and Anomie: A Study of the Effect of Goals on Anomie. Sociol. Q. 1980, 21, 53–64. [Google Scholar] [CrossRef]
- Bjarnason, T. Anomie Among European Adolescents: Conceptual and Empirical Clarification of a Multilevel Sociological Concept1. Sociol. Forum 2009, 24, 135–161. [Google Scholar] [CrossRef]
- Steenvoorden, E. A General Discontent Disentangled: A Conceptual and Empirical Framework for Societal Unease. Soc. Indic. Res. 2014, 124, 85–110. [Google Scholar] [CrossRef]
- Gootjes, F.; Kuppens, T.; Postmes, T.; Gordijn, E. Disentangling Societal Discontent and Intergroup Threat: Explaining Actions Towards Refugees and Towards the State. Int. Rev. Soc. Psychol. 2021, 33, 1–14. [Google Scholar] [CrossRef]
- Mahfud, Y.; Adam-Troian, J. “Macron Demission!”: Loss of Significance Generates Violent Extremism for the Yellow Vests through Feelings of Anomia. Group Process. Intergroup Relat. 2021, 24, 108–124. [Google Scholar] [CrossRef]
- Sprong, S.; Jetten, J.; Wang, Z.; Peters, K.; Mols, F.; Verkuyten, M.; Bastian, B.; Ariyanto, A.; Autin, F.; Ayub, N.; et al. “Our Country Needs a Strong Leader Right Now”: Economic Inequality Enhances the Wish for a Strong Leader. Psychol. Sci. 2019, 30, 1625–1637. [Google Scholar] [CrossRef] [PubMed]
- Jetten, J.; Peters, K.; Casara, B.G.S. Economic Inequality and Conspiracy Theories. Curr. Opin. Psychol. 2022, 47, 101358. [Google Scholar] [CrossRef]
- Jetten, J.; Peters, K.; Álvarez, B.; Casara, B.G.S.; Dare, M.; Kirkland, K.; Sánchez-Rodríguez, Á.; Selvanathan, H.P.; Sprong, S.; Tanjitpiyanond, P.; et al. Consequences of Economic Inequality for the Social and Political Vitality of Society: A Social Identity Analysis. Polit. Psychol. 2021, 42, 241–266. [Google Scholar] [CrossRef]
- Crimston, C.R.; Selvanathan, H.P.; Jetten, J. Moral Polarization Predicts Support for Authoritarian and Progressive Strong Leaders via the Perceived Breakdown of Society. Polit. Psychol. 2022, 43, 671–691. [Google Scholar] [CrossRef]
- Swader, C.S. Modernization, Formal Social Control, and Anomie: A 45-Society Multilevel Analysis. Int. J. Comp. Sociol. 2017, 58, 494–514. [Google Scholar] [CrossRef]
- Roblain, A.; Gale, J.; Abboud, S.; Arnal, C.; Bornand, T.; Hanioti, M.; Klein, O.; Klein, P.P.L.E.; Lastrego, S.; Licata, L.; et al. Social Control and Solidarity during the COVID-19 Pandemic: The Direct and Indirect Effects of Causal Attribution of Insufficient Compliance through Perceived Anomie. J. Community Appl. Soc. Psychol. 2022, 32, 963–973. [Google Scholar] [CrossRef]
- Jiang, X.Y.; Hu, X.Y.; Liu, Z.Z.; Sun, X.M.; Xue, G. Greed as an Adaptation to Anomie: The Mediating Role of Belief in a Zero-Sum Game and the Buffering Effect of Internal Locus of Control. Pers. Individ. Dif. 2020, 152, 109566. [Google Scholar] [CrossRef]
- Aghayeeabianeh, B.; Stamatel, J.P. The Effects of Sociopolitical Factors on Divorce Rates after Political Upheavals in Post-Soviet Countries. Comp. Sociol. 2022, 21, 300–319. [Google Scholar] [CrossRef]
- Ionescu, O.; Tavani, J.L.; Collange, J. Political Extremism and Perceived Anomie: New Evidence of Political Extremes’ Symmetries and Asymmetries Within French Samples. Int. Rev. Soc. Psychol. 2021, 34, 1–16. [Google Scholar] [CrossRef]
- Bornand, T.; Klein, O. Political Trust by Individuals of Low Socioeconomic Status: The Key Role of Anomie. Soc. Psychol. Bull. 2022, 17, 1–22. [Google Scholar] [CrossRef]
- Ionescu, O.; Tavani, J.L.; Collange, J. Perceived Societal Anomie, Collective Memory, and Support for Collective Action: Perceiving That Current French Society Is Anomic Influences Present Support for Collective Action through the Reconstructed National Past. Asian J. Soc. Psychol. 2021, 24, 405–420. [Google Scholar] [CrossRef]
- Ionescu, O.; Collange, J.; Tavani, J.L. Perceived societal anomie and the implicit trajectory of national decline: Replicating and extending Yamashiro and Roediger (2019) within a French sample. Mem. Stud. 2022, 16, 861–877. [Google Scholar] [CrossRef]
- Fischer, C.S. On Urban Alienations and Anomie: Powerlessness and Social Isolation. Am. Sociol. Rev. 1973, 38, 311–326. [Google Scholar] [CrossRef]
- Teevan, J.J. On Measuring Anomia: Suggested Modification of the Srole Scale. Pac. Sociol. Rev. 1975, 18, 159–170. [Google Scholar] [CrossRef]
- Dean, D.G. Alienation: Its Meaning and Measurement. Am. Sociol. Rev. 1961, 26, 753–758. [Google Scholar] [CrossRef]
- Elmore, T.M. The Development of a Scale to Measure Psychological Anomie. Ph.D. Thesis, Ohio State University, Columbus, OH, USA, 1962. [Google Scholar]
- Ådnanes, M. Social Transitions and Anomie among Post-Communist Bulgarian Youth. Young 2007, 15, 49–69. [Google Scholar] [CrossRef]
- Heydari, A.; Davoudi, I.; Teymoori, A. Revising the Assessment of Feeling of Anomie: Presenting a Multidimensional Scale. Procedia Soc. Behav. Sci. 2011, 30, 1086–1090. [Google Scholar] [CrossRef]
- Bashir, H.; Bala, R. Development and Validation of a Scale to Measure Anomie of Students. Psychol. Stud. 2019, 64, 131–139. [Google Scholar] [CrossRef]
- Yarim, M.A.; Akan, D.; Morkoc, S. A Scale Development Study: Reliability and Validity Study of the Organizational Anomie Scale. Turk. J. Bus. Ethics 2021, 14, 411–421. [Google Scholar] [CrossRef]
- Vilca, L.W.; Gonzales, R.D.; Pariona-Millan, V.; Caycho-Rodriguez, T.; White, M. Development and Validation of the Social Anomie Brief Scale (SAS-10) Against the New Standards Implemented During the COVID-19 Pandemic. Electron. J. Gen. Med. 2022, 19, em375. [Google Scholar] [CrossRef] [PubMed]
- Villamil, A.; Forero, E.; Zubieta, K.; Ramírez Cortázar, F.; Gómez, A. Validación de la Perception of Anomie Scale (PAS) en Una Muestra Poblacional Colombiana. In Diversidad en la Percepción de Anomia Social; Corporación Universitaria Iberoamericana: Bogota, Colombia, 2020; pp. 105–124. ISBN 978-958-53173-7-6. Available online: https://www.researchgate.net/publication/358045855 (accessed on 5 December 2023).
- Soper, D.S. A-Priori Sample Size Calculator for Structural Equation Models. 2023. Available online: https://www.danielsoper.com/statcalc/calculator.aspx?id=89 (accessed on 20 July 2023).
- Hernández, A.; Hidalgo, M.D.; Hambleton, R.; Gómez-Benito, J. International Test Commission Guidelines for Test Adaptation: A Criterion Checklist. Psicothema 2020, 32, 390–398. [Google Scholar] [CrossRef]
- Marsh, H.W.; Morin, A.J.S.; Parker, P.D.; Kaur, G. Exploratory Structural Equation Modeling: An Integration of the Best Features of Exploratory and Confirmatory Factor Analysis. Annu. Rev. Clin. Psychol. 2014, 10, 85–110. [Google Scholar] [CrossRef]
- Mieres-Chacaltana, M.; Salvo-Garrido, S.; Dominguez-Lara, S.; Gálvez-Nieto, J.L.; Alarcón-Bañares, P. Psychometric Validation of the Adult Prosocialness Behavior Scale in a Professional Teaching Context. Behav. Sci. 2023, 13, 761. [Google Scholar] [CrossRef] [PubMed]
- Salvo-Garrido, S.; Polanco-Levicán, K.; Dominguez-Lara, S.; Mieres-Chacaltana, M.; Gálvez-Nieto, J.L. Psychometric Properties of the SV-RES60 Resilience Scale in a Sample of Chilean Elementary School Teachers. Behav. Sci. 2023, 13, 781. [Google Scholar] [CrossRef]
- Guay, F.; Morin, A.; Litalien, D.; Valois, P.; Vallerand, R. Application of Exploratory Structural Equation Modeling to Evaluate the Academic Motivation Scale. J. Exp. Educ. 2014, 83, 51–82. [Google Scholar] [CrossRef]
- Schmitt, T.A.; Sass, D.A. Rotation Criteria and Hypothesis Testing for Exploratory Factor Analysis: Implications for Factor Pattern Loadings and Interfactor Correlations. Educ. Psychol. Meas. 2011, 71, 95–113. [Google Scholar] [CrossRef]
- Morin, A.J.S.; Marsh, H.W.; Nagengast, B. Exploratory Structural Equation Modeling. In Structural Equation Modeling: A Second Course, 2nd ed.; Quantitative Methods in Education and the Behavioral Sciences: Issues, Research, and Teaching; IAP Information Age Publishing: Charlotte, NC, USA, 2013; pp. 395–436. ISBN 978-1-62396-246-3. [Google Scholar]
- Van Zyl, L.E.; Ten Klooster, P.M. Exploratory Structural Equation Modeling: Practical Guidelines and Tutorial With a Convenient Online Tool for Mplus. Front. Psychiatry 2022, 12, 795672. [Google Scholar] [CrossRef]
- Lara, S.D.; Merino-Soto, C. Estimación de la Magnitud del Efecto en Invarianza de Medición. Avaliação Psicológica 2019, 18, 328–332. [Google Scholar] [CrossRef]
- Muthén, L.; Muthén, B. MPLUS 7.11. Mplus User’s Guide, 8th ed.; Mplus: Los Angeles, CA, USA, 2017. [Google Scholar]
- Satorra, A.; Bentler, P.M. Corrections to Test Statistics and Standard Errors in Covariance Structure Analysis. In Latent Variables Analysis: Applications for Developmental Research; Sage Publications, Inc: Thousand Oaks, CA, USA, 1994; pp. 399–419. ISBN 0-8039-5330-5. [Google Scholar]
- Bagheri, A.; Saadati, M. Generalized Structural Equations Approach in the of Elderly Self-Rated Health. J. Phys. Conf. Ser. 2021, 1863, 012041. [Google Scholar] [CrossRef]
- Bovaird, J.A.; Koziol, N.A. Measurement Models for Ordered-Categorical Indicators. In Handbook of Structural Equation Modeling; Hoyle, R.H., Ed.; The Guilford Press: New York, NY, USA, 2012; pp. 495–511. [Google Scholar]
- Li, C.-H. Confirmatory Factor Analysis with Ordinal Data: Comparing Robust Maximum Likelihood and Diagonally Weighted Least Squares. Behav. Res. Methods 2016, 48, 936–949. [Google Scholar] [CrossRef]
- Li, C.H. The Performance of MLR, USLMV, and WLSMV Estimation in Structural Regression Models with Ordinal Variables; Michigan State University: East Lansing, MI, USA, 2014. [Google Scholar]
- Asparouhov, T.; Muthén, B. Exploratory Structural Equation Modeling. Struct. Equ. Model. 2009, 16, 397–438. [Google Scholar] [CrossRef]
- Shi, D.; Maydeu-Olivares, A.; Rosseel, Y. Assessing Fit in Ordinal Factor Analysis Models: SRMR vs. RMSEA. Struct. Equ. Model. 2020, 27, 1–15. [Google Scholar] [CrossRef]
- Schumacher, R.; Lomax, R. A Beginner’s Guide to Structural Equation Modeling; Lawrence Erlbaum Associates: Mahwah, NJ, USA, 1996. [Google Scholar]
- Browne, M.W.; Cudeck, R. Alternative Ways of Assessing Model Fit. Sociol. Methods Res. 1992, 21, 230–258. [Google Scholar] [CrossRef]
- Hu, L.; Bentler, P.M. Cutoff Criteria for Fit Indexes in Covariance Structure Analysis: Conventional Criteria versus New Alternatives. Struct. Equ. Model. 1999, 6, 1–55. [Google Scholar] [CrossRef]
- Dominguez-Lara, S. Propuesta de Puntos de Corte Para Cargas Factoriales: Una Perspectiva de Fiabilidad de Constructo. Enferm. Clin. 2018, 28, 401–402. [Google Scholar] [CrossRef] [PubMed]
- Fleming, J.S.; Soto, C.M. Medidas de Simplicidad y de Ajuste Factorial: Un Enfoque Para La Evaluación de Escalas Construidas Factorialmente. Rev. Psicol. 2005, 23, 249–266. [Google Scholar] [CrossRef]
- Dominguez-Lara, S.; Navarro-Loli, J.S. Revisión de Metodologías Empleadas en los Estudios Factoriales de la Escala de Bienestar Psicológico de Ryff. Rev. Evaluar 2018, 18, 17–30. [Google Scholar] [CrossRef]
- Cronbach, L.J. Coefficient Alpha and the Internal Structure of Tests. Psychometrika 1951, 16, 297–334. [Google Scholar] [CrossRef]
- Ponterotto, J.G.; Charter, R.A. Statistical Extensions of Ponterotto and Ruckdeschel’s (2007) Reliability Matrix for Estimating the Adequacy of Internal Consistency Coefficients. Percept. Mot. Ski. 2009, 108, 878–886. [Google Scholar] [CrossRef]
- Robinson, J.P.; Shaver, P.R.; Wrightsman, L.S. Measures of Personality and Social Psychological Attitudes; Academic Press: Cambridge, MA, USA, 1991. [Google Scholar]
- McDonald, R. Test Theory: A Unified Treatment; Lawrence Erlbaum Associates: Mahwah, NJ, USA, 1999. [Google Scholar]
- Hunsley, J.; Marsh, E.J. Developing Criteria for Evidence-Based Assessment: An Introduction to Assessment That Work. In Introduction to Assessment That Work; Hunsley, J., Marsh, E.J., Eds.; Oxford University Press: Oxford, UK, 2008. [Google Scholar]
- Pendergast, L.; Von der Embse, N.; Kilgus, S.; Eklund, K. Measurement Equivalence: A Non-Technical Primer on Categorical Multi-Group Confirmatory Factor Analysis in School Psychology. J. Sch. Psychol. 2017, 60, 65–82. [Google Scholar] [CrossRef] [PubMed]
- Cheung, G.W.; Rensvold, R.B. Evaluating Goodness-of-Fit Indexes for Testing Measurement Invariance. Struct. Equ. Model. 2002, 9, 233–255. [Google Scholar] [CrossRef]
- Chen, F. Sensitivity of Goodness of Fit Indexes to Lack of Measurement Invariance. Struct. Equ. Model. 2007, 14, 464–504. [Google Scholar] [CrossRef]
- Meade, A.; Johnson, E.; Braddy, P. Power and Sensitivity of Alternative Fit Indices in Tests of Measurement Invariance. J. Appl. Psychol. 2008, 93, 568–592. [Google Scholar] [CrossRef] [PubMed]
- Ferguson, C.J. An Effect Size Primer: A Guide for Clinicians and Researchers. Prof. Psychol. Res. Pract. 2009, 40, 532–538. [Google Scholar] [CrossRef]
- Danner, D.; Aichholzer, J.; Rammstedt, B. Acquiescence in Personality Questionnaires: Relevance, Domain Specificity, and Stability. J. Res. Pers. 2015, 57, 119–130. [Google Scholar] [CrossRef]
- Vigil-Colet, A.; Navarro-González, D. Fabia Morales-Vives To Reverse or to Not Reverse Likert-Type Items: That Is the Question. Psicothema 2020, 32, 108–114. [Google Scholar] [PubMed]
- Saris, W.E.; Satorra, A.; van der Veld, W.M. Testing structural equation modeling or detection of misspecifications? Struct. Equ. Model. 2009, 16, 561–582. [Google Scholar] [CrossRef]
- Taasoobshirazi, G.; Wang, S. The performance of the SRMR, RMSEA, CFI, and TLI: An examination of sample size, path size, and degrees of freedom. J. Appl. Quant. Methods 2016, 11, 31–39. [Google Scholar]
- Teymoori, A.; Bastian, B.; Jetten, J. Towards a Psychological Analysis of Anomie. Polit. Psychol. 2017, 38, 1009–1023. [Google Scholar] [CrossRef]
- Avendaño, O. Fracturas y Representación Política en el Movimiento Estudiantil: Chile 2011. Ultim. Década 2014, 22, 41–68. [Google Scholar] [CrossRef]
- Moyano-Díaz, E.; Palomo-Vélez, G.; Olivos-Jara, P.; Maya-López, Y. Anomie, Irritation, and Happiness in the Chilean Society Post-Social Outbreak. Front. Psychol. 2023, 14, 1145121. [Google Scholar] [CrossRef]
- Martínez, P.; Jiménez-Molina, Á.; Mac-Ginty, S.; Martínez, V.; Rojas, G. Salud Mental en Estudiantes de Educación Superior en Chile: Una Revisión de Alcance con Meta-Análisis. Ter. Psicológica 2021, 39, 405–426. [Google Scholar] [CrossRef]


| Item | Content |
|---|---|
| Instruction: Think of Chile society and indicate to what extent do you agree whit the following statements? In Chile today… | |
| Item 1 | People do not know who they can trust and rely on |
| Item 2 | Everyone thinks of himself/herself and does not help others in need |
| Item 3 | People are cooperative |
| Item 4 | Most of the people think that honesty doesn’t work all the time; dishonesty is sometimes a better approach to get ahead |
| Item 5 | People think that there are no clear moral standards to follow |
| Item 6 | Most of people think that if something Works, it doesn´t really matter whether it is left or wrong |
| Item 7 | Some laws are not fair |
| Item 8 | Politicians don´t care about the problems of average person |
| Item 9 | The government laws and policies are effective |
| Item 10 | The government works towards the welfare of people |
| Item 11 | The government is legitimate |
| Item 12 | The government uses its power legitimately |
| Item | M | SD | g1 | g2 |
|---|---|---|---|---|
| Item 1 | 5.48 | 1.38 | −1.27 | 1.71 |
| Item 2 | 5.00 | 1.41 | −0.68 | 0.19 |
| Item 3 | 4.26 | 1.27 | −0.74 | 0.20 |
| Item 4 | 4.23 | 1.77 | −0.35 | −0.90 |
| Item 5 | 4.38 | 1.47 | −0.40 | −0.39 |
| Item 6 | 4.99 | 1.47 | −0.79 | 0.21 |
| Item 7 | 5.95 | 1.19 | −1.36 | 1.88 |
| Item 8 | 5.67 | 1.25 | −1.06 | 1.12 |
| Item 9 | 3.77 | 1.34 | −0.34 | −0.40 |
| Item 10 | 4.05 | 1.39 | −0.45 | −0.58 |
| Item 11 | 4.41 | 1.61 | −0.13 | −0.65 |
| Item 12 | 4.15 | 1.46 | −0.07 | −0.40 |
| F1total | 4.72 | 0.77 | −0.42 | 0.65 |
| F2total | 4.67 | 0.77 | −0.36 | 0.12 |
| Models | χ2 (gl) | CFI | TLI | RMSEA (CI 90%) | SRMR |
|---|---|---|---|---|---|
| M1: AFC One-factor | 650.058 (54) * | 0.669 | 0.596 | 0.170 (0.158–0.182) | 0.092 |
| M2: AFC Two-factor | 350.251 (53) * | 0.835 | 0.795 | 0.121 (0.109–0.133) | 0.066 |
| M3: ESEM Two-factor 12 item | 222.351 (43) * | 0.900 | 0.847 | 0.104 (0.091–0.118) | 0.045 |
| M4: ESEM Two-factor 7 item | 33.377 (8) * | 0.982 | 0.953 | 0.091 (0.060–0.124) | 0.020 |
| ESEM n = 383 | ||||||
|---|---|---|---|---|---|---|
| 12 Item | 7 Item | |||||
| Items | F1 | F2 | FSI | F1 | F2 | FSI |
| Item 1 | 0.48 | 0.07 | 0.98 | 0.58 | 0.05 | 0.99 |
| Item 2 | 0.52 | 0.03 | 1.00 | 0.56 | −0.01 | 1.00 |
| Item 3 | 0.23 | 0.16 | 0.67 | |||
| Item 4 | 0.43 | −0.08 | 0.96 | |||
| Item 5 | 0.50 | 0.01 | 1.00 | 0.53 | 0.00 | 1.00 |
| Item 6 | 0.59 | 0.00 | 1.00 | 0.53 | −0.03 | 1.00 |
| Item 7 | 0.31 | 0.13 | 0.83 | |||
| Item 8 | 0.37 | 0.14 | 0.85 | |||
| Item 9 | 0.19 | 0.42 | 0.81 | |||
| Item 10 | 0.20 | 0.67 | 0.90 | 0.19 | 0.60 | 0.89 |
| Item 11 | −0.22 | 0.88 | 0.93 | −0.13 | 0.89 | 0.98 |
| Item 12 | −0.13 | 0.79 | 0.97 | 0.00 | 0.80 | 1.00 |
| ω McDonald | α Cronbach | rij | |
|---|---|---|---|
| Breakdown in social fabric | 0.566 | 0.566 | 0.246 |
| Breakdown of leadership | 0.800 | 0.785 | 0.549 |
| Model | χ2 | df | CFI | TLI | RMSEA | 90%CI | SRMR | ΔCFI | ΔTLI | ΔRMSEA | ΔSRMR |
|---|---|---|---|---|---|---|---|---|---|---|---|
| 1. Configural invariance | 58.588 | 35 | 0.984 | 0.981 | 0.060 | 0.031–0.086 | 0.025 | ||||
| 2. Weak invariance | 77.020 | 45 | 0.978 | 0.979 | 0.062 | 0.037–0.084 | 0.033 | −0.006 | −0.002 | 0.002 | 0.008 |
| 3. Strong invariance | 90.915 | 59 | 0.978 | 0.984 | 0.054 | 0.030–0.075 | 0.032 | 0.000 | 0.005 | −0.008 | −0.001 |
| 4. Strict invariance | 119.114 | 66 | 0.963 | 0.976 | 0.066 | 0.047–0.084 | 0.036 | −0.015 | −0.008 | 0.012 | 0.004 |
Disclaimer/Publisher’s Note: The statements, opinions and data contained in all publications are solely those of the individual author(s) and contributor(s) and not of MDPI and/or the editor(s). MDPI and/or the editor(s) disclaim responsibility for any injury to people or property resulting from any ideas, methods, instructions or products referred to in the content. |
© 2024 by the authors. Licensee MDPI, Basel, Switzerland. This article is an open access article distributed under the terms and conditions of the Creative Commons Attribution (CC BY) license (https://creativecommons.org/licenses/by/4.0/).
Share and Cite
Cea-Leiva, F.; Salvo-Garrido, S.; Dominguez-Lara, S. Adaptation and Validation of the Perception of Anomie Scale in Chilean University Students. Behav. Sci. 2024, 14, 172. https://doi.org/10.3390/bs14030172
Cea-Leiva F, Salvo-Garrido S, Dominguez-Lara S. Adaptation and Validation of the Perception of Anomie Scale in Chilean University Students. Behavioral Sciences. 2024; 14(3):172. https://doi.org/10.3390/bs14030172
Chicago/Turabian StyleCea-Leiva, Fredy, Sonia Salvo-Garrido, and Sergio Dominguez-Lara. 2024. "Adaptation and Validation of the Perception of Anomie Scale in Chilean University Students" Behavioral Sciences 14, no. 3: 172. https://doi.org/10.3390/bs14030172
APA StyleCea-Leiva, F., Salvo-Garrido, S., & Dominguez-Lara, S. (2024). Adaptation and Validation of the Perception of Anomie Scale in Chilean University Students. Behavioral Sciences, 14(3), 172. https://doi.org/10.3390/bs14030172