
Driving Fatigue Onset and Visual Attention: An Electroencephalography-Driven Analysis of Ocular Behavior in a Driving Simulation Task

 ,
,  , , , ,
  , , , , ,
  ,
,  and
and 
Abstract
1. Introduction
- (1)
- Does the visual attention of professional drivers change in a fatigued (vs. non-fatigued) condition?
- (2)
- Does the kind of professional activity (short-range vs. long-range delivery) affect the impact of fatigue on visual attention while driving?
2. Materials and Methods
2.1. Participants and Experimental Setup
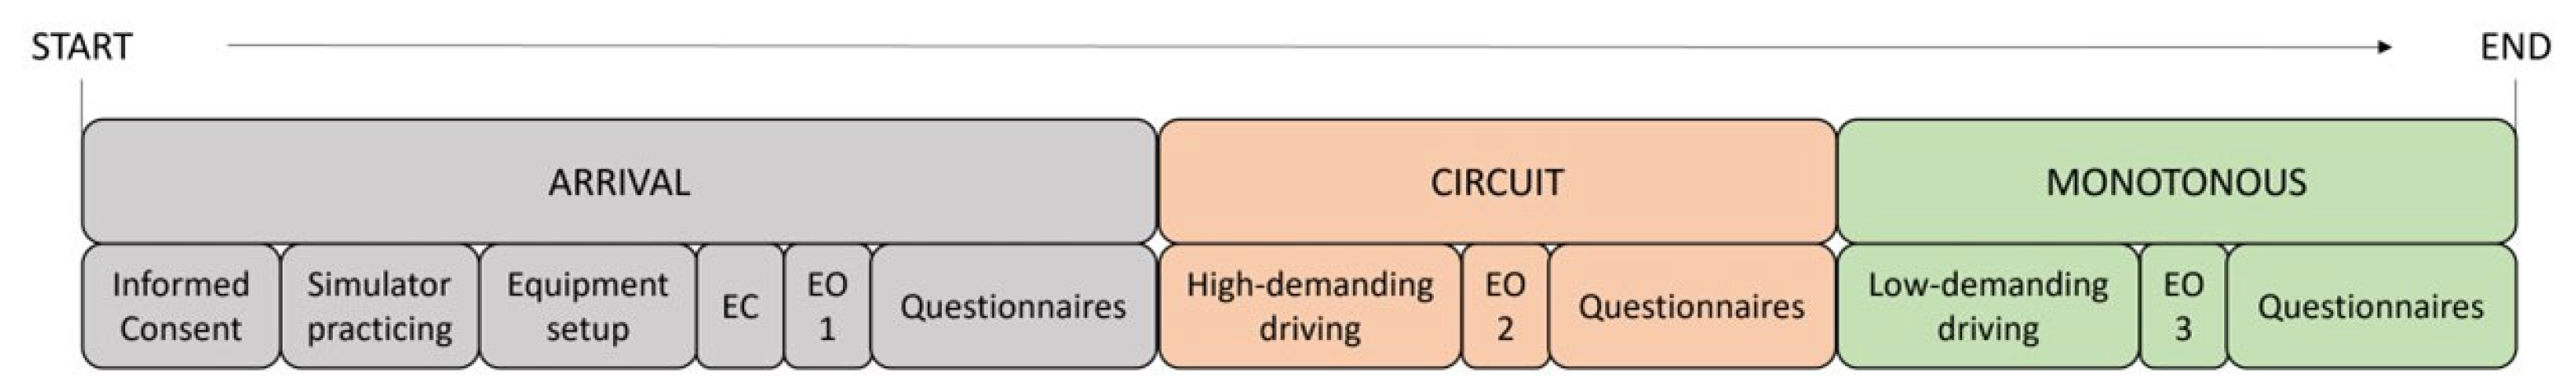
2.2. Experimental Protocol
2.3. Subjective Assessment
2.3.1. Karolinska Sleepiness Scale
2.3.2. Chalder Fatigue Scale
2.4. Electroencephalographic Assessment
2.5. Ocular Assessment
- Road: including the road infrastructure (Figure 3, in green);
- Cockpit: including the speedometer area (Figure 3, in orange);
- External Environment: including the external environment that is not the road (Figure 3, in blue);
- Cockpit Total: including the whole cockpit (Figure 3, in purple). For the analysis, this AoI was not considered because it contained information that was not related to the driving task.
2.6. Statistical Analysis
3. Results
3.1. Behavioral Assessment
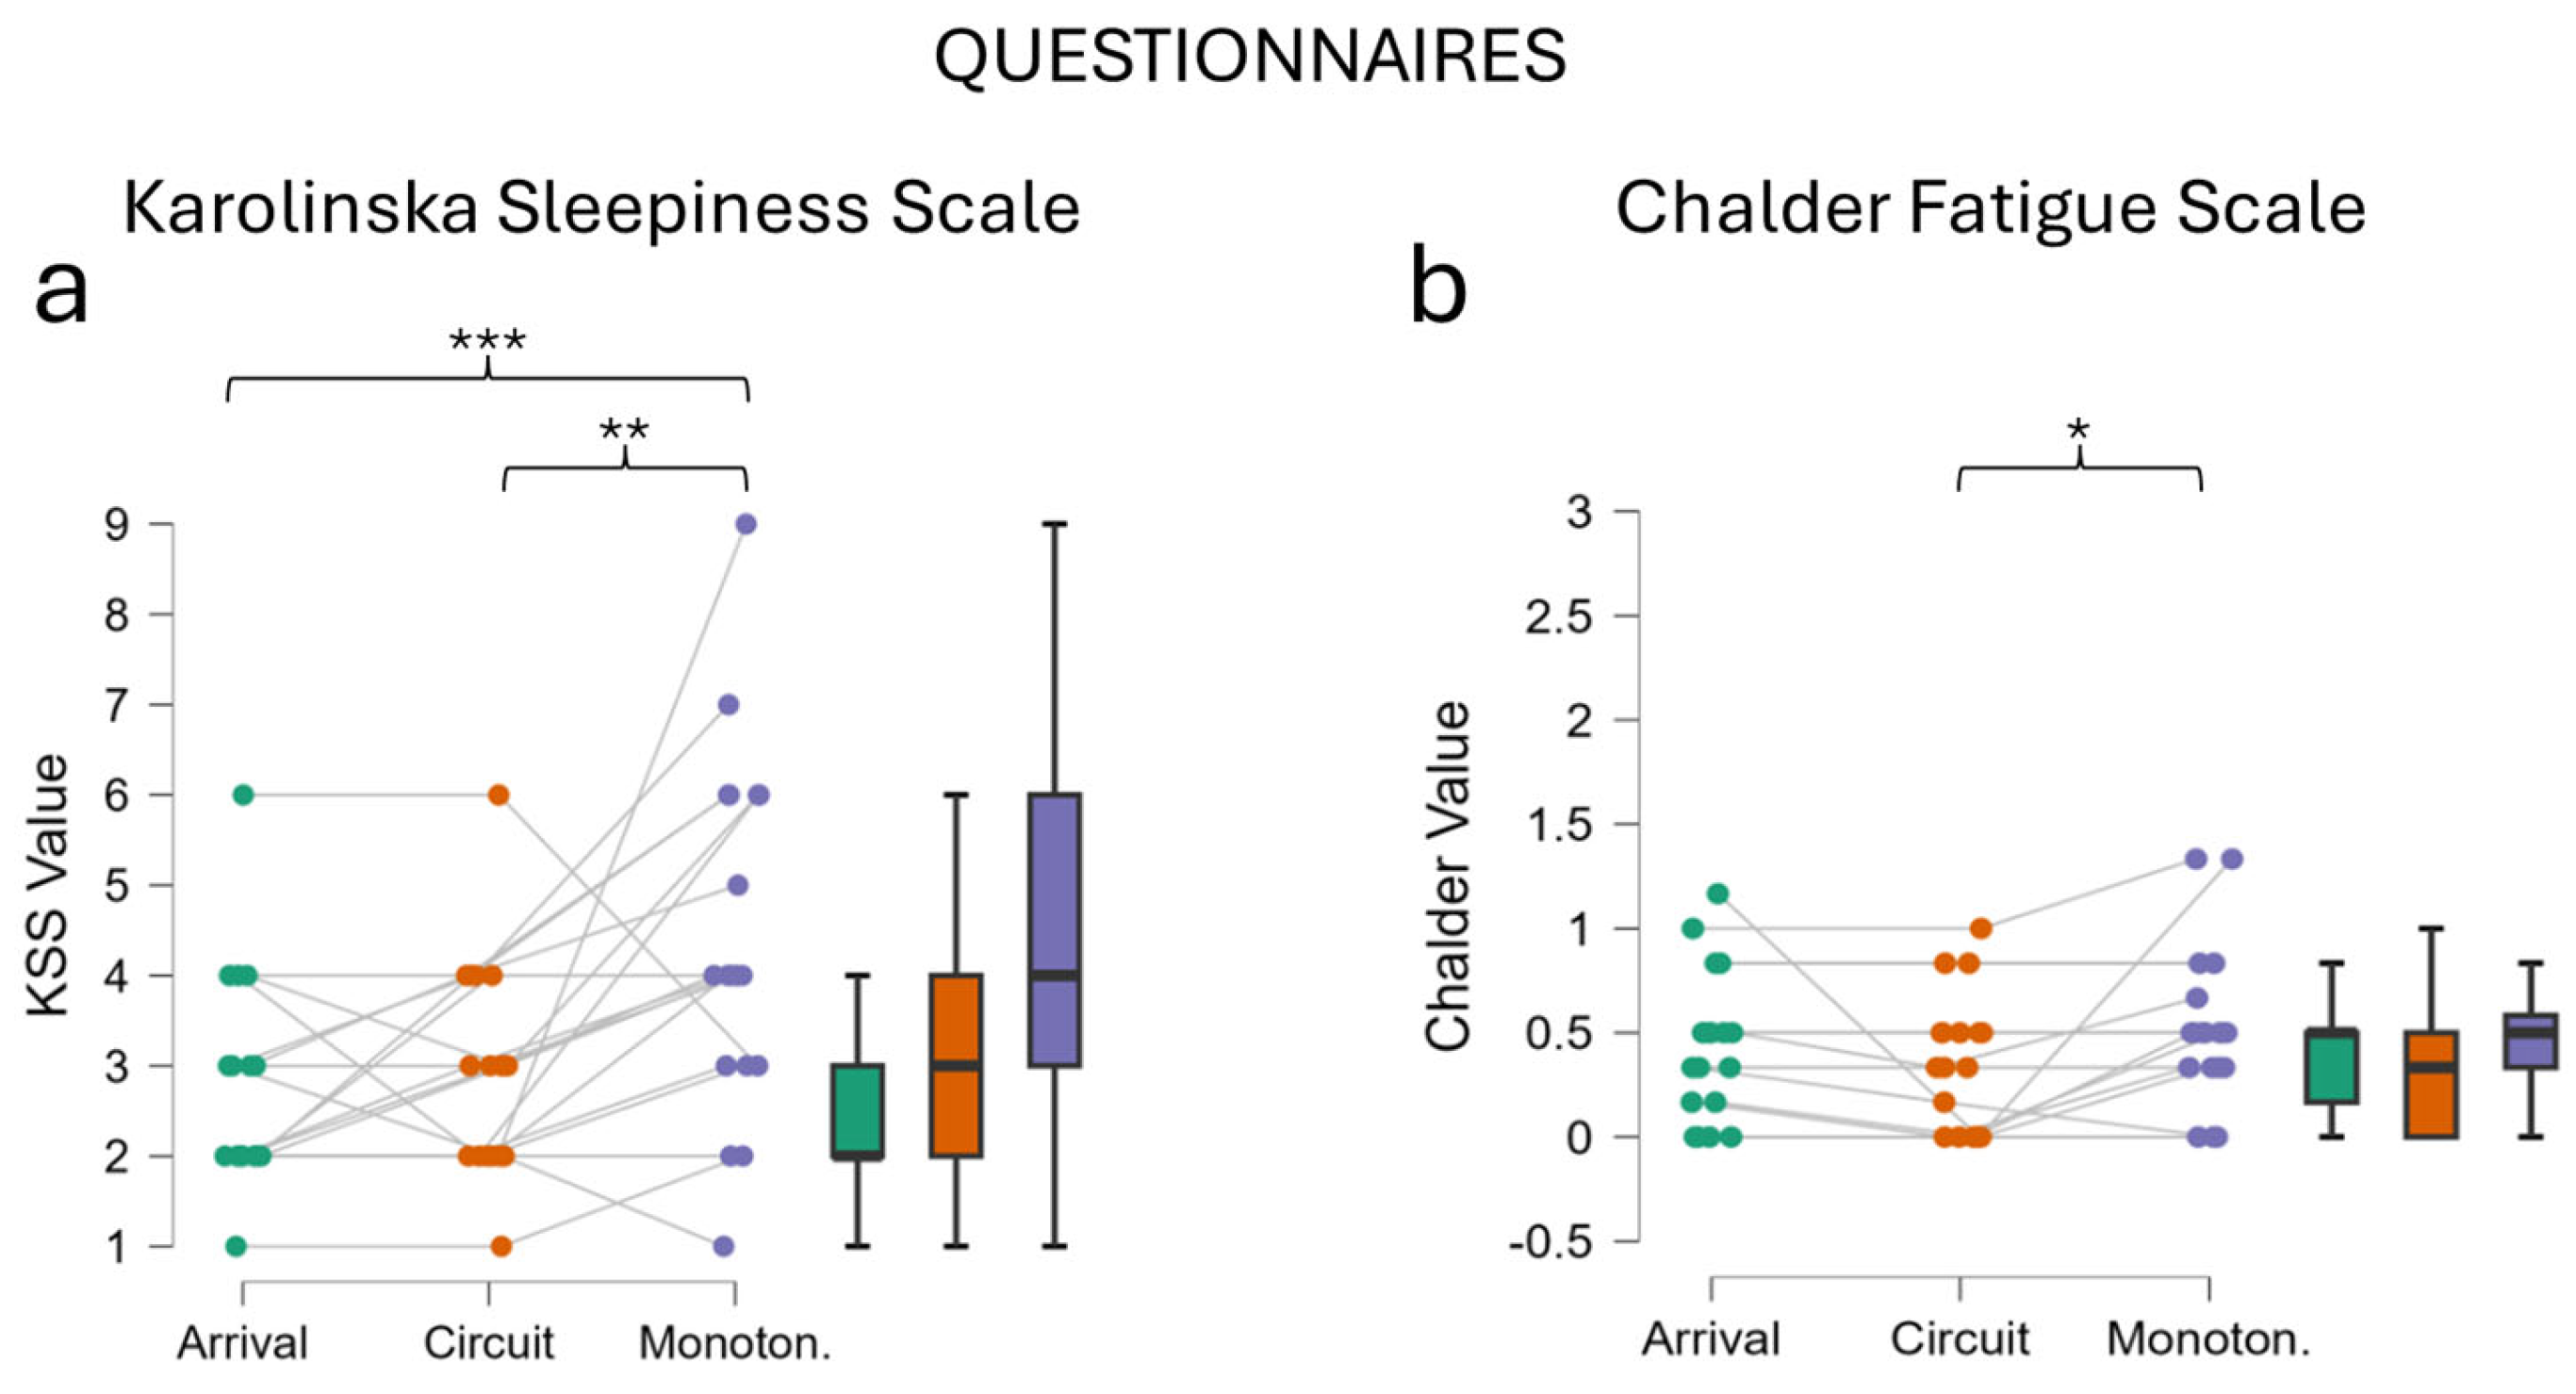
3.1.1. Karolinska Sleepiness Scale
3.1.2. Chalder Fatigue Scale
3.2. EEG Assessment
3.3. Ocular Assessment
3.3.1. Road AoI
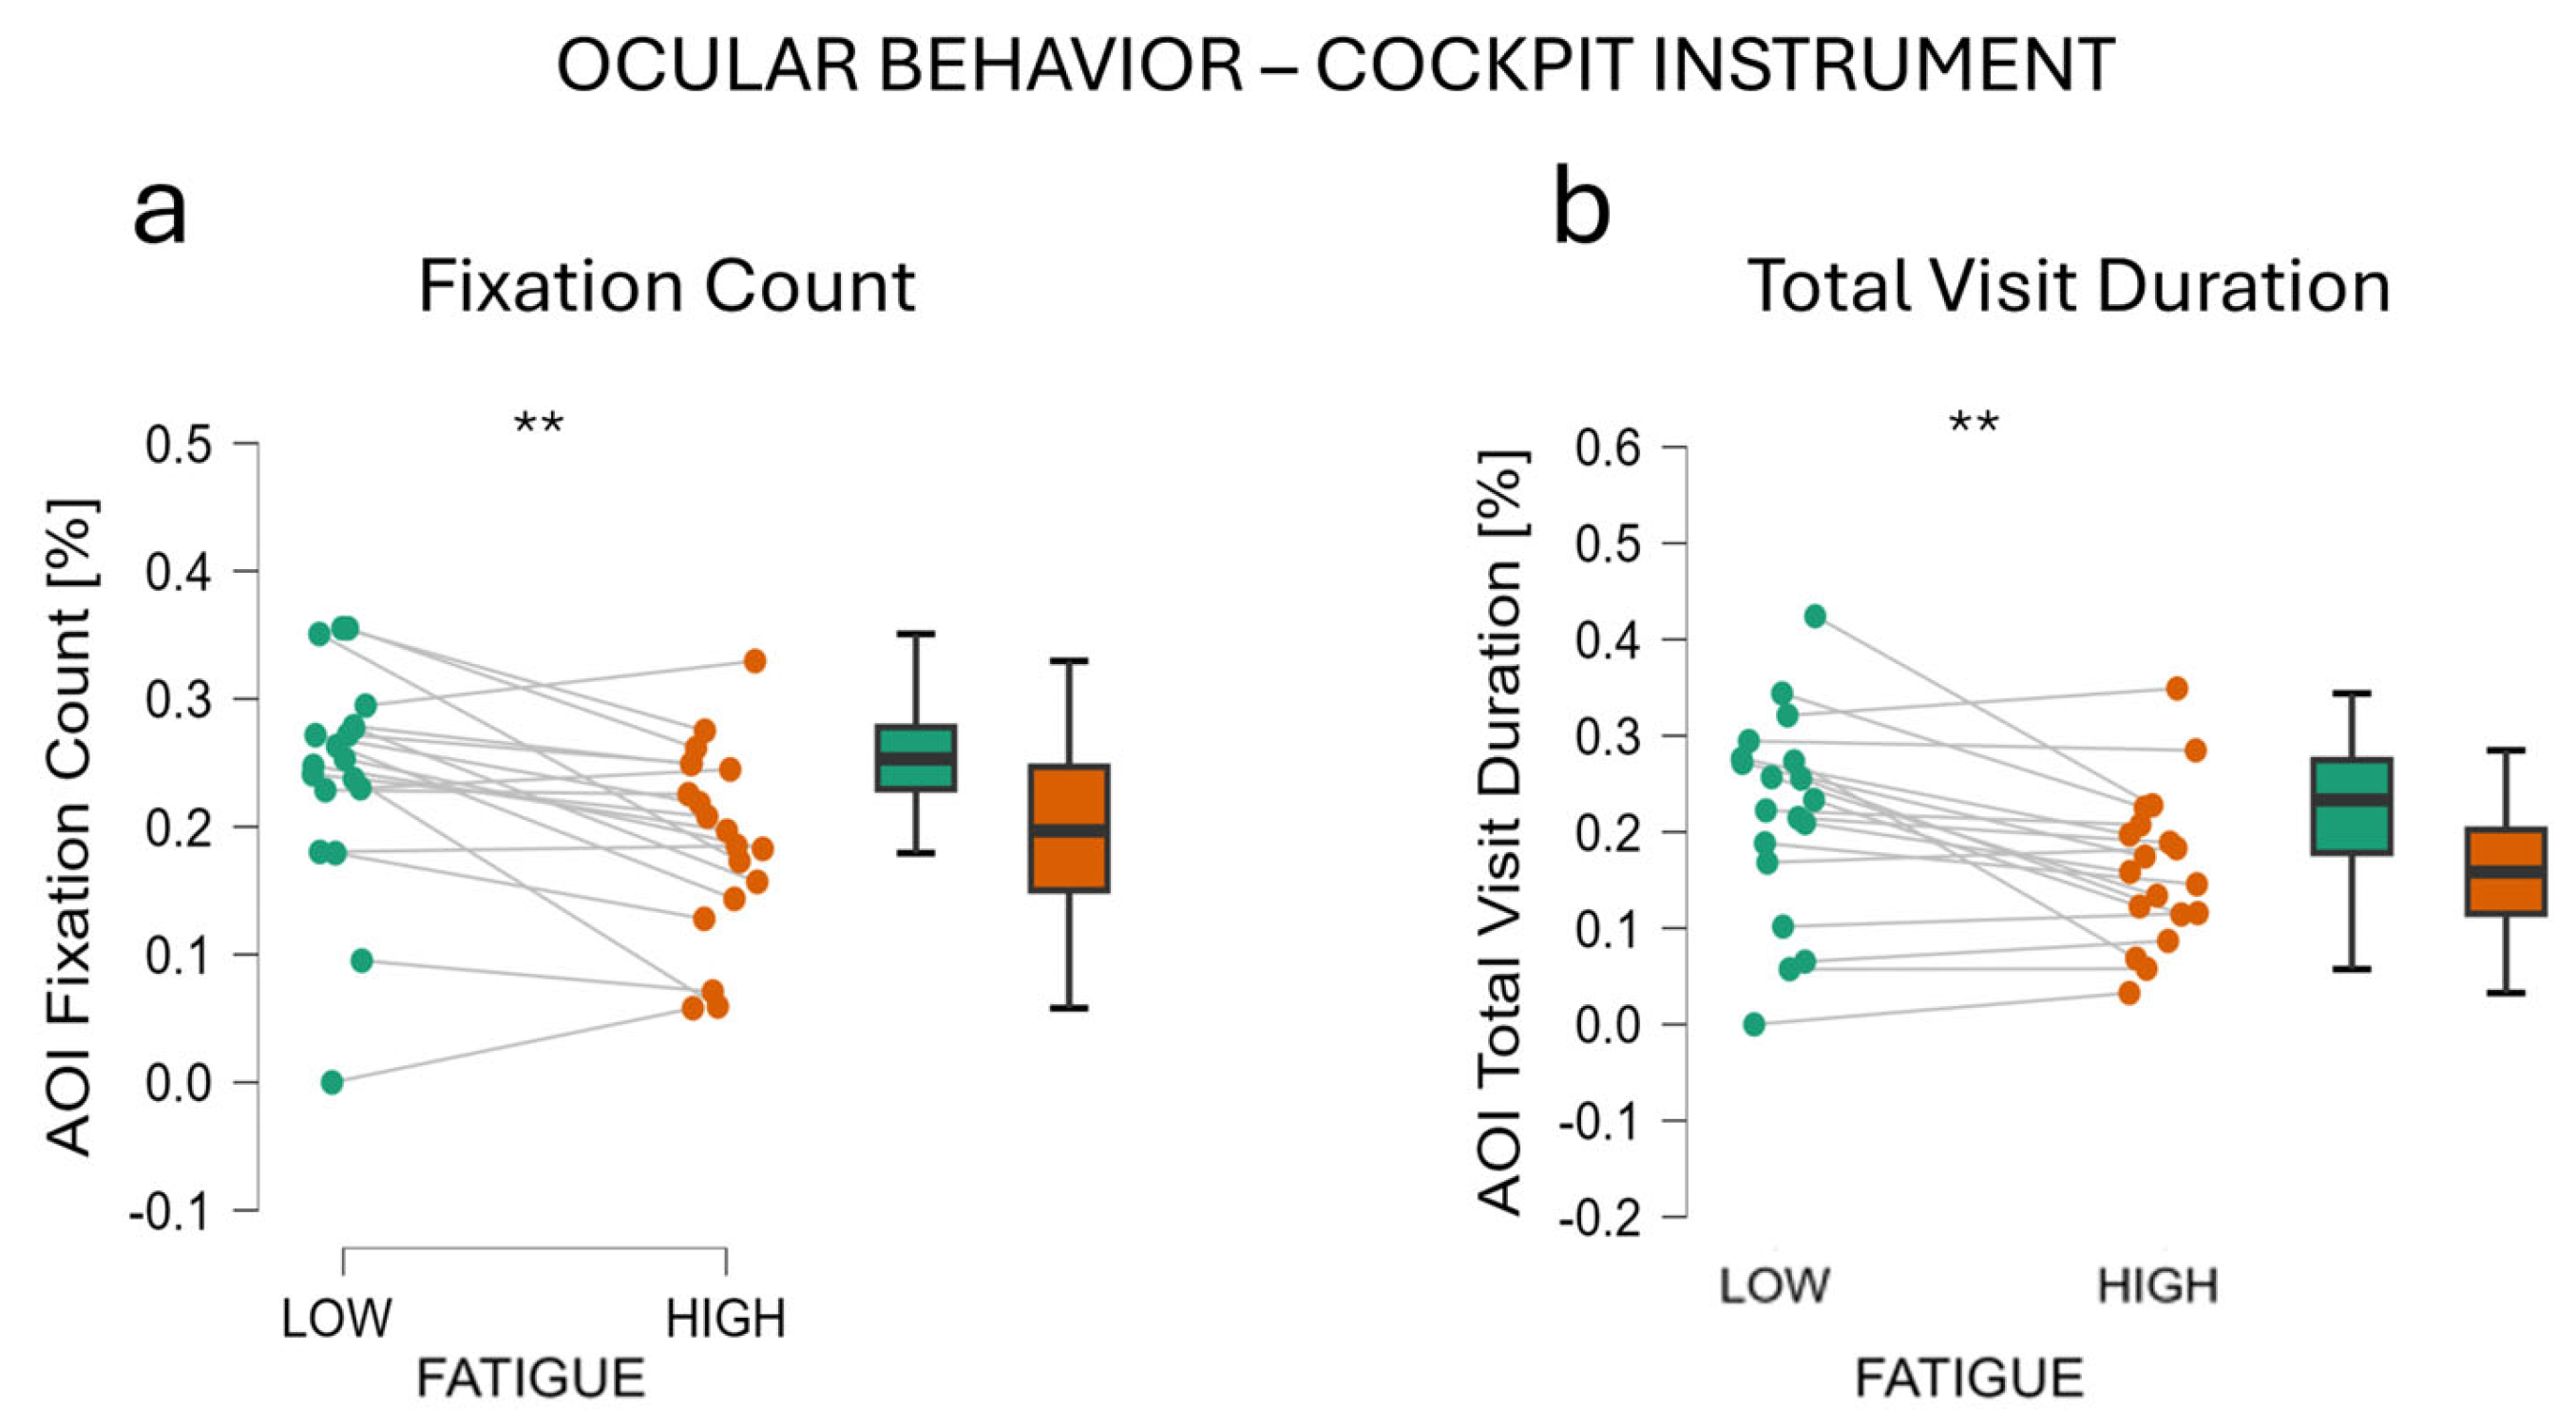
3.3.2. Cockpit AoI
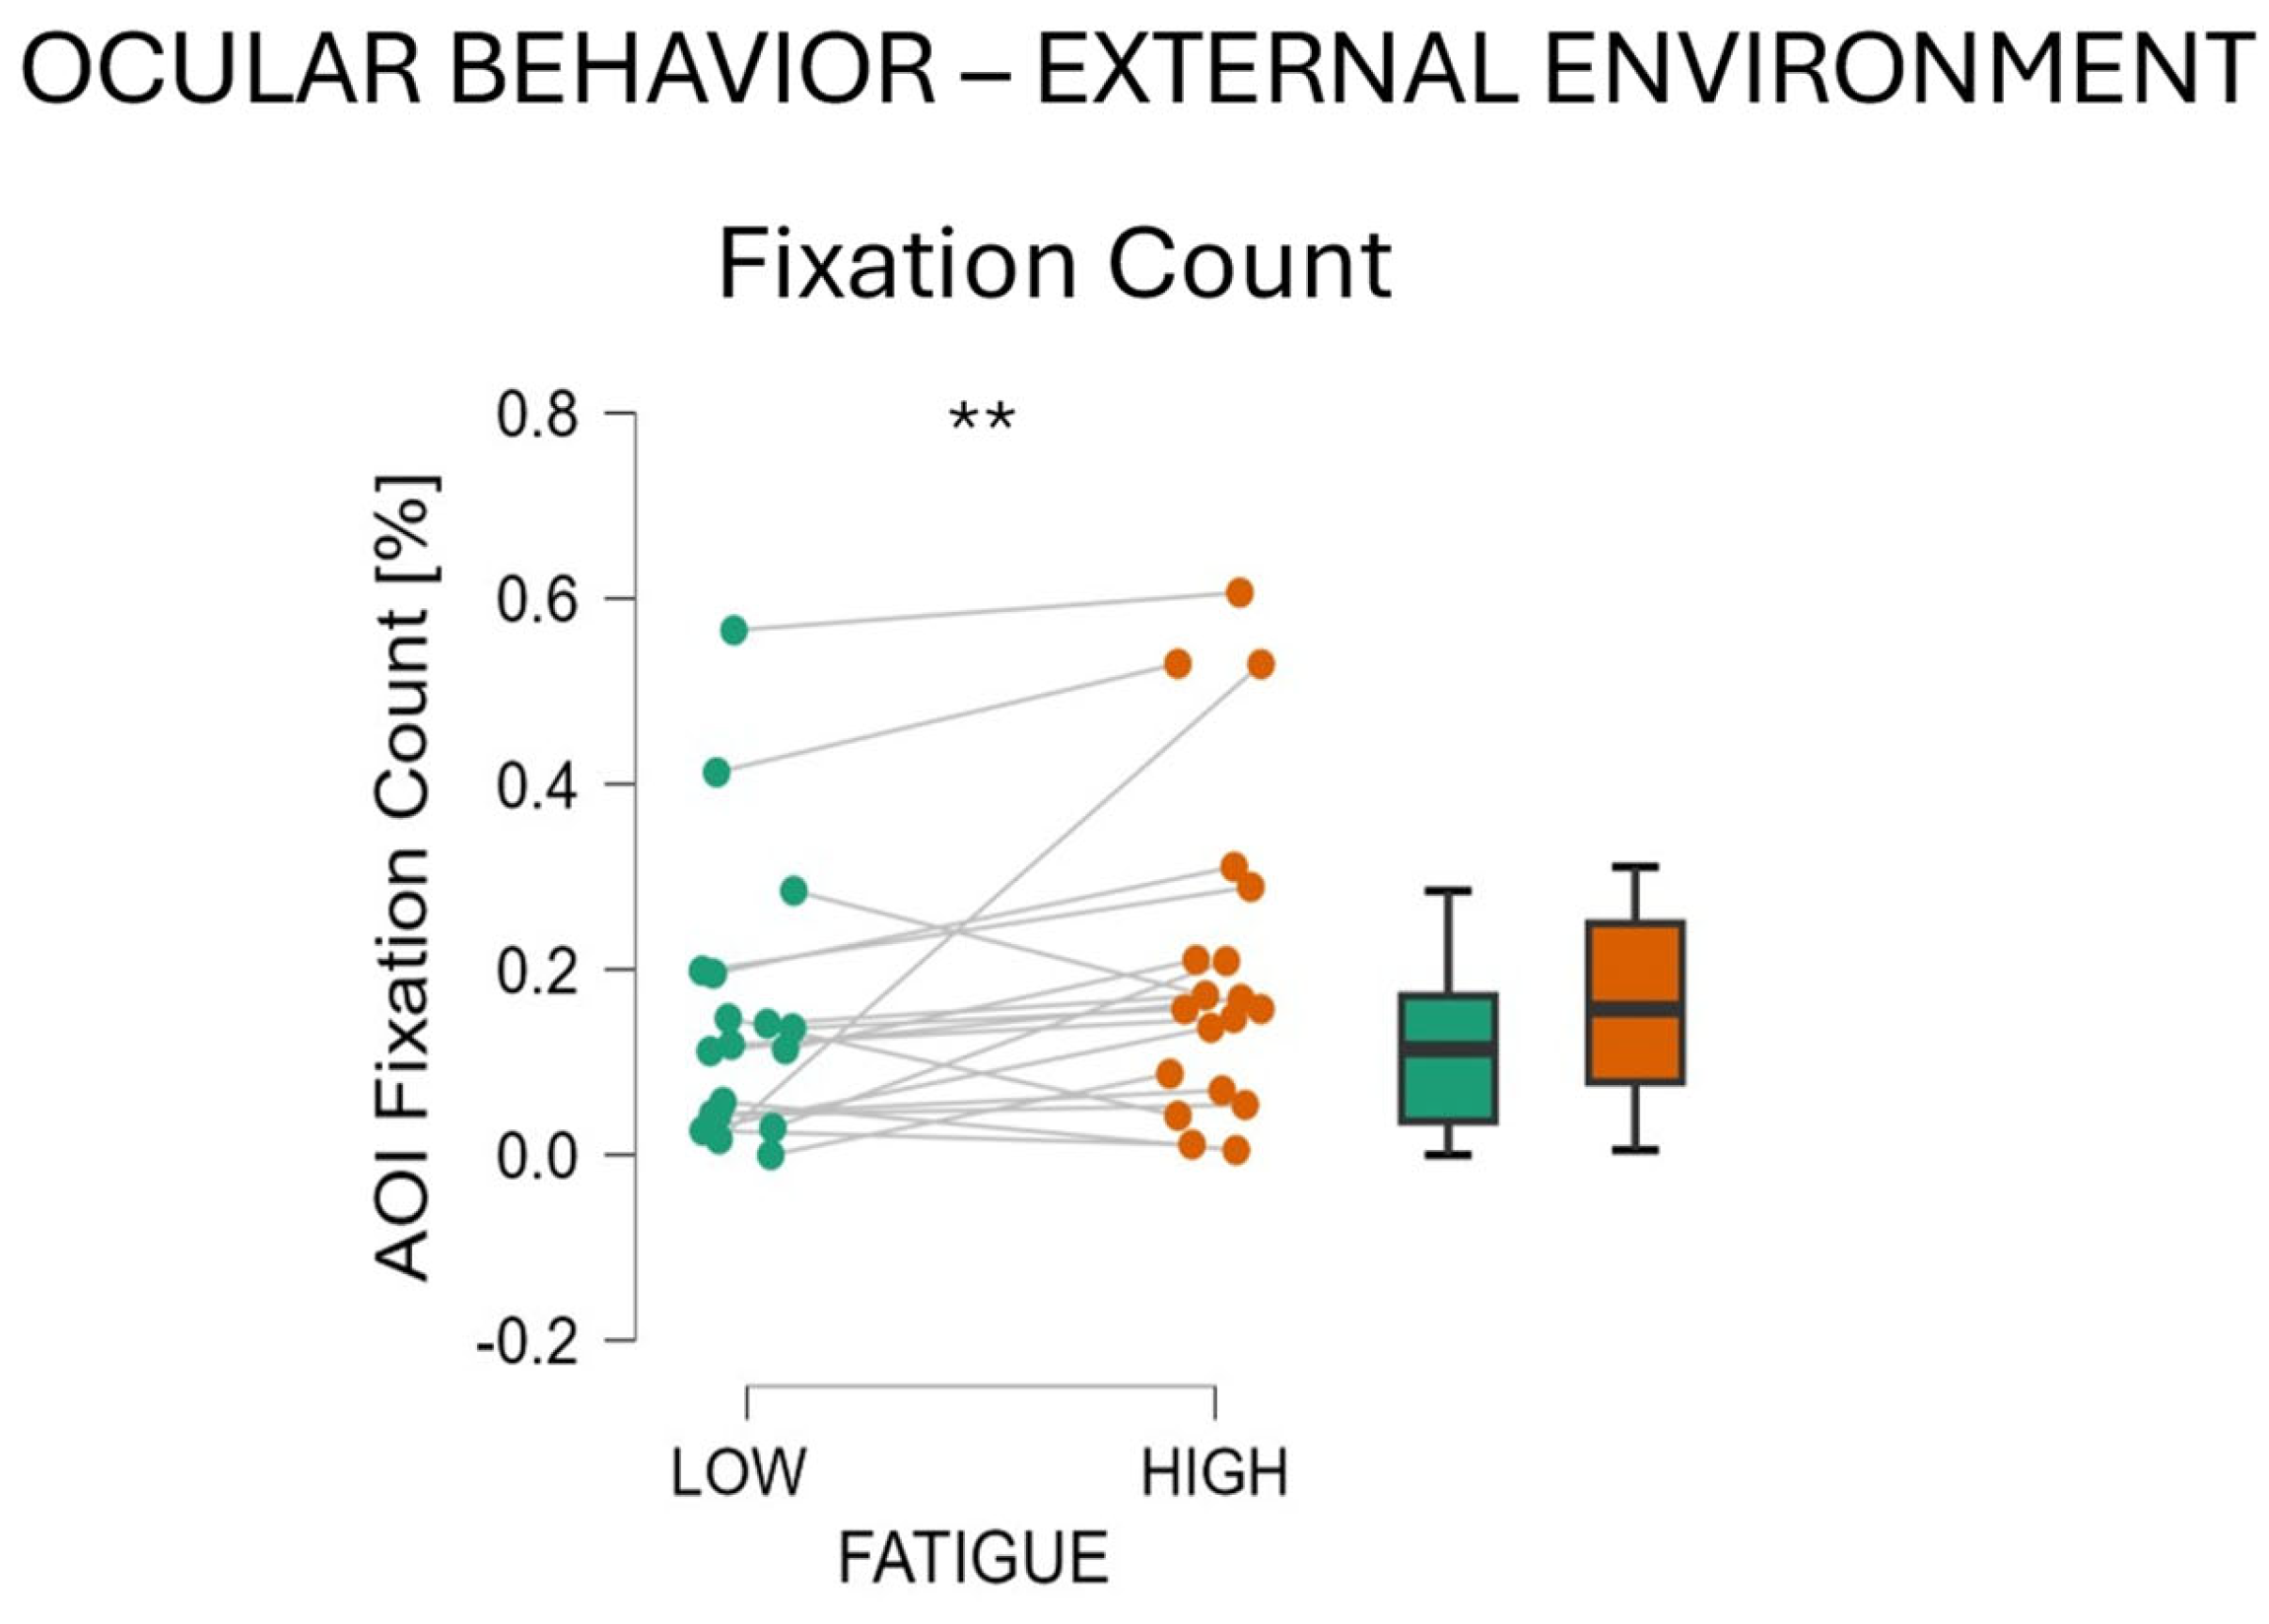
3.3.3. External Environment AoI
3.4. Difference Between Van and Truck Drivers
4. Discussion
5. Conclusions
Author Contributions
Funding
Institutional Review Board Statement
Informed Consent Statement
Data Availability Statement
Conflicts of Interest
References
- Directorate-General for Mobility and Transport (European Commission); Armoogum, J.; Garcia, C.; Gopal, Y.; Borgato, S.; Fiorello, D.; Maffii, S.; Mars, K.-J.; Popovska, T.; Schlemmer, L.; et al. Study on New Mobility Patterns in European Cities: Final Report. Task A, EU Wide Passenger Mobility Survey; Publications Office of the European Union: Luxembourg, 2022; Available online: https://data.europa.eu/doi/10.2832/728583 (accessed on 31 May 2024).
- Transportation Statistics Annual Report|Bureau of Transportation Statistics. Available online: https://www.bts.gov/tsar (accessed on 28 April 2023).
- Global Status Report on Road Safety 2023. Available online: https://www.who.int/teams/social-determinants-of-health/safety-and-mobility/global-status-report-on-road-safety-2023 (accessed on 31 May 2024).
- Global Status Report on Road Safety 2018. Available online: https://www.who.int/publications-detail-redirect/9789241565684 (accessed on 31 May 2024).
- Ismail, L.E.; Karwowski, W. Applications of EEG indices for the quantification of human cognitive performance: A systematic review and bibliometric analysis. PLoS ONE 2020, 15, e0242857. [Google Scholar] [CrossRef] [PubMed]
- Pozharliev, R.; De Angelis, M.; Donato, C.; Rossi, D. Do not put the blame on me: Asymmetric responses to service outcome with autonomous vehicles versus human agents. J. Consum. Behav. 2023, 22, 455–467. [Google Scholar] [CrossRef]
- AAA Foundation for Traffic Safety. 2017 Traffic Safety Culture Index. Washington, D.C. 2018. Available online: https://aaafoundation.org/2017-traffic-safety-culture-index/ (accessed on 4 November 2024).
- Doudou, M.; Bouabdallah, A.; Berge-Cherfaoui, V. Driver Drowsiness Measurement Technologies: Current Research, Market Solutions, and Challenges. Int. J. ITS Res. 2020, 18, 297–319. [Google Scholar] [CrossRef]
- Cella, M.; Chalder, T. Measuring fatigue in clinical and community settings. J. Psychosom. Res. 2010, 69, 17–22. [Google Scholar] [CrossRef]
- Wu, X.; Wanyan, X.; Zhuang, D. Pilot’s visual attention allocation modeling under fatigue. Technol. Health Care 2015, 23 (Suppl. 2), S373–S381. [Google Scholar] [CrossRef]
- Borghini, G.; Astolfi, L.; Vecchiato, G.; Mattia, D.; Babiloni, F. Measuring neurophysiological signals in aircraft pilots and car drivers for the assessment of mental workload, fatigue and drowsiness. Neurosci. Biobehav. Rev. 2014, 44, 58. [Google Scholar] [CrossRef]
- Bundele, M.M.; Banerjee, R. Detection of fatigue of vehicular driver using skin conductance and oximetry pulse: A neural network approach. In Proceedings of the 11th International Conference on Information Integration and Web-based Applications & Services, iiWAS ’09, Kuala Lumpur, Malaysia, 14–16 December 2009; Association for Computing Machinery: New York, NY, USA, 2009; pp. 739–744. [Google Scholar] [CrossRef]
- Knapik, M.; Cyganek, B. Driver’s fatigue recognition based on yawn detection in thermal images. Neurocomputing 2019, 338, 274–292. [Google Scholar] [CrossRef]
- Arefnezhad, S.; Hamet, J.; Eichberger, A.; Frühwirth, M.; Ischebeck, A.; Koglbauer, I.V.; Moser, M.; Yousefi, A. Driver drowsiness estimation using EEG signals with a dynamical encoder–decoder modeling framework. Sci. Rep. 2022, 12, 2650. [Google Scholar] [CrossRef]
- Di Flumeri, G.; Ronca, V.; Giorgi, A.; Vozzi, A.; Aricò, P.; Sciaraffa, N.; Zeng, H.; Dai, G.; Kong, W.; Babiloni, F.; et al. EEG-Based Index for Timely Detecting User’s Drowsiness Occurrence in Automotive Applications. Front. Hum. Neurosci. 2022, 16, 866118. [Google Scholar] [CrossRef]
- Guo, Z.; Pan, Y.; Zhao, G.; Cao, S.; Zhang, J. Detection of Driver Vigilance Level Using EEG Signals and Driving Contexts. IEEE Trans. Reliab. 2018, 67, 370–380. [Google Scholar] [CrossRef]
- Stancin, I.; Cifrek, M.; Jovic, A. A Review of EEG Signal Features and Their Application in Driver Drowsiness Detection Systems. Sensors 2021, 21, 3786. [Google Scholar] [CrossRef] [PubMed]
- Vicente, J.; Laguna, P.; Bartra, A.; Bailón, R. Drowsiness detection using heart rate variability. Med. Biol. Eng. Comput. 2016, 54, 927–937. [Google Scholar] [CrossRef] [PubMed]
- Fujiwara, K.; Abe, E.; Kamata, K.; Nakayama, C.; Suzuki, Y.; Yamakawa, T.; Hiraoka, T.; Kano, M.; Sumi, Y.; Masuda, F.; et al. Heart Rate Variability-Based Driver Drowsiness Detection and Its Validation with EEG. IEEE Trans. Biomed. Eng. 2019, 66, 1769–1778. [Google Scholar] [CrossRef] [PubMed]
- Danisman, T.; Bilasco, I.M.; Djeraba, C.; Ihaddadene, N. Drowsy driver detection system using eye blink patterns. In Proceedings of the 2010 International Conference on Machine and Web Intelligence, Algiers, Algeria, 3–5 October 2010; pp. 230–233. [Google Scholar] [CrossRef]
- Barea, R.; Boquete, L.; Mazo, M.; Lopez, E. System for assisted mobility using eye movements based on electrooculography. IEEE Trans. Neural Syst. Rehabil. Eng. 2002, 10, 209–218. [Google Scholar] [CrossRef]
- Chen, Z.; Wu, C.; Zhong, M.; Lyu, N.; Huang, Z. Identification of common features of vehicle motion under drowsy/distracted driving: A case study in Wuhan, China. Accid. Anal. Prev. 2015, 81, 251–259. [Google Scholar] [CrossRef]
- Fairclough, S.H.; Graham, R. Impairment of Driving Performance Caused by Sleep Deprivation or Alcohol: A Comparative Study. Hum. Factors 1999, 41, 118–128. [Google Scholar] [CrossRef]
- Li, Z.; Yang, Q.; Chen, S.; Zhou, W.; Chen, L.; Song, L. A fuzzy recurrent neural network for driver fatigue detection based on steering-wheel angle sensor data. Int. J. Distrib. Sens. Netw. 2019, 15, 1550147719872452. [Google Scholar] [CrossRef]
- Oron-Gilad, T.; Ronen, A. Road Characteristics and Driver Fatigue: A Simulator Study. Traffic Inj. Prev. 2007, 8, 281–289. [Google Scholar] [CrossRef]
- Thiffault, P.; Bergeron, J. Monotony of road environment and driver fatigue: A simulator study. Accid. Anal. Prev. 2003, 35, 381–391. [Google Scholar] [CrossRef]
- Farahmand, B.; Boroujerdian, A.M. Effect of road geometry on driver fatigue in monotonous environments: A simulator study. Transp. Res. Part F Traffic Psychol. Behav. 2018, 58, 640–651. [Google Scholar] [CrossRef]
- Khan, M.Q.; Lee, S. Gaze and Eye Tracking: Techniques and Applications in ADAS. Sensors 2019, 19, 5540. [Google Scholar] [CrossRef] [PubMed]
- Holmqvist, K.; Nystr, M.; Andersson, R.; Dewhurst, R.; Jarodzka, H.; van de Weijer, J. Eye Tracking: A Comprehensive Guide to Methods and Measures; OUP: Oxford, UK, 2011. [Google Scholar]
- Joshi, A.; Kyal, S.; Banerjee, S.; Mishra, T. In-the-wild Drowsiness Detection from Facial Expressions. In Proceedings of the 2020 IEEE Intelligent Vehicles Symposium (IV), Las Vegas, NV, USA, 19 October–13 November 2020; pp. 207–212. [Google Scholar] [CrossRef]
- Fu, R.; Wang, H.; Zhao, W. Dynamic driver fatigue detection using hidden Markov model in real driving condition. Expert Syst. Appl. 2016, 63, 397–411. [Google Scholar] [CrossRef]
- Wang, H.; Wu, C.; Li, T.; He, Y.; Chen, P.; Bezerianos, A. Driving Fatigue Classification Based on Fusion Entropy Analysis Combining EOG and EEG. IEEE Access 2019, 7, 61975–61986. [Google Scholar] [CrossRef]
- Giorgi, A.; Ronca, V.; Vozzi, A.; Aricò, P.; Borghini, G.; Capotorto, R.; Tamborra, L.; Simonettim, I.; Sportiello, S.; Petrelli, M.; et al. Neurophysiological mental fatigue assessment for developing user-centered Artificial Intelligence as a solution for autonomous driving. Front. Neurorobot. 2023, 17, 1240933. [Google Scholar] [CrossRef]
- Zhang, H.; Ni, D.; Ding, N.; Sun, Y.; Zhang, Q.; Li, X. Structural analysis of driver fatigue behavior: A systematic review. Transp. Res. Interdiscip. Perspect. 2023, 21, 100865. [Google Scholar] [CrossRef]
- García, I.; Bronte, S.; Bergasa, L.M.; Hernandez, N.; Delgado, B.; Sevillano, M. Vision-based drowsiness detector for a realistic driving simulator. In Proceedings of the 13th International IEEE Conference on Intelligent Transportation Systems, Funchal, Portugal, 19–22 September 2010; pp. 887–894. [Google Scholar] [CrossRef]
- Kaida, K.; Takahashi, M.; Åkerstedt, T.; Nakata, A.; Otsuka, Y.; Haratani, T.; Fukasawa, K. Validation of the Karolinska sleepiness scale against performance and EEG variables. Clin. Neurophysiol. 2006, 117, 1574–1581. [Google Scholar] [CrossRef]
- Kamran, M.A.; Mannan, M.M.N.; Jeong, M.Y. Drowsiness, Fatigue and Poor Sleep’s Causes and Detection: A Comprehensive Study. IEEE Access 2019, 7, 167172–167186. [Google Scholar] [CrossRef]
- Sciaraffa, N.; Di Flumeri, G.; Germano, D.; Giorgi, A.; Di Florio, A.; Borghini, G.; Vozzi, A.; Ronca, V.; Varga, R.; van Gasteren, M.; et al. Validation of a Light EEG-Based Measure for Real-Time Stress Monitoring during Realistic Driving. Brain Sci. 2022, 12, 304. [Google Scholar] [CrossRef]
- Sciaraffa, N.; Di Flumeri, G.; Germano, D.; Giorgi, A.; Di Florio, A.; Borghini, G.; Vozzi, A.; Ronca, V. Evaluation of a New Lightweight EEG Technology for Translational Applications of Passive Brain-Computer Interfaces. Front. Hum. Neurosci. 2022, 16, 901387. [Google Scholar] [CrossRef]
- Acharya, J.N.; Hani, A.; Cheek, J.; Thirumala, P.; Tsuchida, T.N. American Clinical Neurophysiology Society Guideline 2: Guidelines for Standard Electrode Position Nomenclature. J. Clin. Neurophysiol. 2016, 33, 308. [Google Scholar] [CrossRef]
- Di Flumeri, G.; Arico, P.; Borghini, G.; Colosimo, A.; Babiloni, F. A new regression-based method for the eye blinks artifacts correction in the EEG signal, without using any EOG channel. Annu. Int. Conf. IEEE Eng. Med. Biol. Soc. 2016, 2016, 3187–3190. [Google Scholar] [CrossRef] [PubMed]
- Brunner, C.; Delorme, A.; Makeig, S. Eeglab—An Open Source Matlab Toolbox for Electrophysiological Research. Biomed. Eng./Biomed. Tech. 2013, 58, 000010151520134182. [Google Scholar] [CrossRef] [PubMed]
- Skrandies, W. Global field power and topographic similarity. Brain Topogr. 1990, 3, 137–141. [Google Scholar] [CrossRef] [PubMed]
- Klimesch, W. EEG alpha and theta oscillations reflect cognitive and memory performance: A review and analysis. Brain Res. Rev. 1999, 29, 169–195. [Google Scholar] [CrossRef]
- Klimesch, W. Alpha-band oscillations, attention, and controlled access to stored information. Trends Cogn. Sci. 2012, 16, 606–617. [Google Scholar] [CrossRef]
- New report from the European Road Safety Observatory: Focus on distraction—European Commission. Available online: https://road-safety.transport.ec.europa.eu/news-events/news/new-report-european-road-safety-observatory-focus-distraction-2024-01-11_en (accessed on 31 May 2024).
- Scott, A.; Davis-Sramek, B. Driving in a man’s world: Examining gender disparity in the trucking industry. Int. J. Phys. Distrib. Logist. Manag. 2023, 53, 330–353. [Google Scholar] [CrossRef]
- Blanco, M.; Biever, W.J.; Gallagher, J.P.; Dingus, T.A. The impact of secondary task cognitive processing demand on driving performance. Accid. Anal. Prev. 2006, 38, 895–906. [Google Scholar] [CrossRef]
- Collet, C.; Clarion, A.; Morel, M.; Chapon, A.; Petit, C. Physiological and behavioural changes associated to the management of secondary tasks while driving. Appl. Ergon. 2009, 40, 1041–1046. [Google Scholar] [CrossRef]
- Lorist, M.M.; Boksem, M.A.S.; Ridderinkhof, K.R. Impaired cognitive control and reduced cingulate activity during mental fatigue. Cogn. Brain Res. 2005, 24, 199–205. [Google Scholar] [CrossRef]
- Naeeri, S.; Kang, Z.; Mandal, S.; Kim, K. Multimodal Analysis of Eye Movements and Fatigue in a Simulated Glass Cockpit Environment. Aerospace 2021, 8, 283. [Google Scholar] [CrossRef]


| Metrics | Definition |
|---|---|
| Fixation Count | Number of fixations on the AoI |
| Average Fixation Duration | Average fixation duration on the AoI |
| Total Fixation Duration | Sum of all fixation duration on the AoI |
| Visit Count | Number of visits on the AoI |
| Average Visits Duration | Average visit duration on the AoI |
| Total Visits Duration | Sum of all visit duration on the AoI |
Disclaimer/Publisher’s Note: The statements, opinions and data contained in all publications are solely those of the individual author(s) and contributor(s) and not of MDPI and/or the editor(s). MDPI and/or the editor(s) disclaim responsibility for any injury to people or property resulting from any ideas, methods, instructions or products referred to in the content. |
© 2024 by the authors. Licensee MDPI, Basel, Switzerland. This article is an open access article distributed under the terms and conditions of the Creative Commons Attribution (CC BY) license (https://creativecommons.org/licenses/by/4.0/).
Share and Cite
Giorgi, A.; Borghini, G.; Colaiuda, F.; Menicocci, S.; Ronca, V.; Vozzi, A.; Rossi, D.; Aricò, P.; Capotorto, R.; Sportiello, S.; et al. Driving Fatigue Onset and Visual Attention: An Electroencephalography-Driven Analysis of Ocular Behavior in a Driving Simulation Task. Behav. Sci. 2024, 14, 1090. https://doi.org/10.3390/bs14111090
Giorgi A, Borghini G, Colaiuda F, Menicocci S, Ronca V, Vozzi A, Rossi D, Aricò P, Capotorto R, Sportiello S, et al. Driving Fatigue Onset and Visual Attention: An Electroencephalography-Driven Analysis of Ocular Behavior in a Driving Simulation Task. Behavioral Sciences. 2024; 14(11):1090. https://doi.org/10.3390/bs14111090
Chicago/Turabian StyleGiorgi, Andrea, Gianluca Borghini, Francesca Colaiuda, Stefano Menicocci, Vincenzo Ronca, Alessia Vozzi, Dario Rossi, Pietro Aricò, Rossella Capotorto, Simone Sportiello, and et al. 2024. "Driving Fatigue Onset and Visual Attention: An Electroencephalography-Driven Analysis of Ocular Behavior in a Driving Simulation Task" Behavioral Sciences 14, no. 11: 1090. https://doi.org/10.3390/bs14111090
APA StyleGiorgi, A., Borghini, G., Colaiuda, F., Menicocci, S., Ronca, V., Vozzi, A., Rossi, D., Aricò, P., Capotorto, R., Sportiello, S., Petrelli, M., Polidori, C., Varga, R., Van Gasteren, M., Babiloni, F., & Di Flumeri, G. (2024). Driving Fatigue Onset and Visual Attention: An Electroencephalography-Driven Analysis of Ocular Behavior in a Driving Simulation Task. Behavioral Sciences, 14(11), 1090. https://doi.org/10.3390/bs14111090