
Effects of Perceived Accessibility to Living Infrastructure on Positive Feelings Among Older Adults

Abstract
1. Introduction
1.1. Perceived Accessibility to Living Infrastructure
1.1.1. Perceived Accessibility to Transportation Systems
1.1.2. Perceived Accessibility to Public Service Facilities
1.1.3. Perceived Accessibility to Digital Services
1.2. Life Satisfaction and Happiness
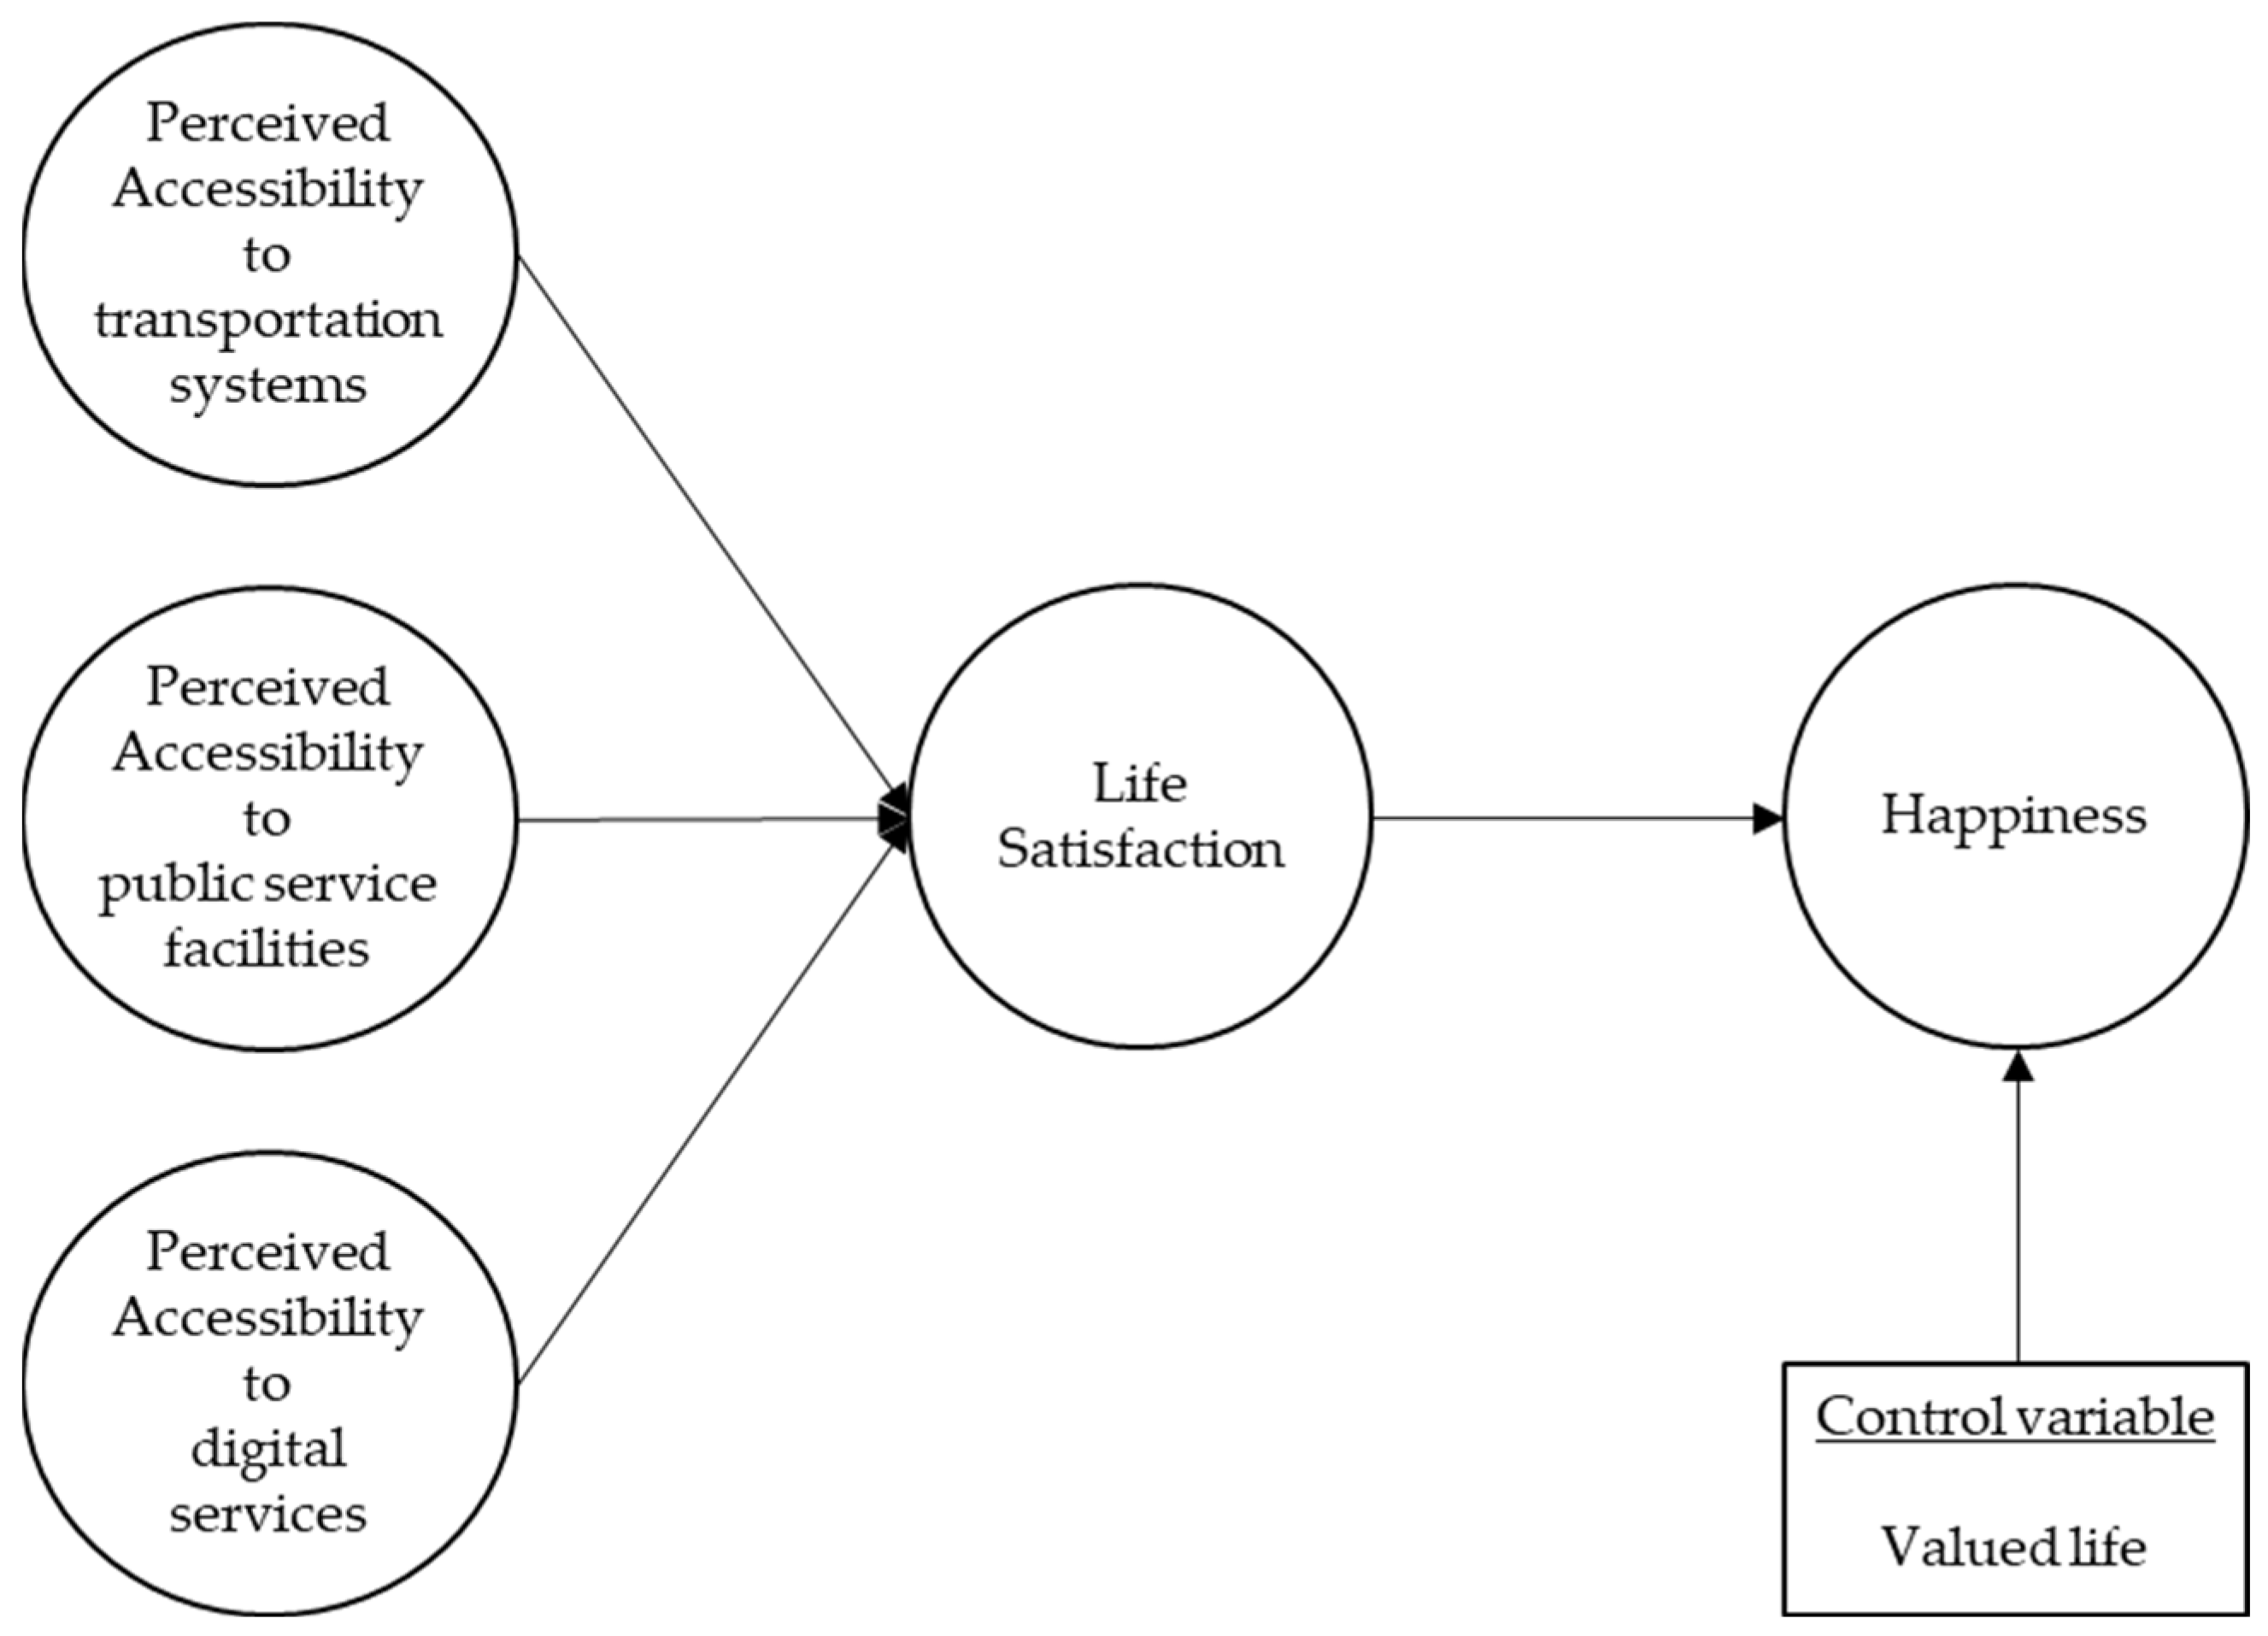
2. Materials and Methods
2.1. Participants and Procedure
2.2. Instruments
3. Results
3.1. Measurement Model Assessment
3.2. Structural Model Assessment
4. Discussion
5. Conclusions
Funding
Institutional Review Board Statement
Informed Consent Statement
Data Availability Statement
Conflicts of Interest
Appendix A

| Constructs | Items | Items | Sources |
|---|---|---|---|
| Perceived Accessibility to transportation systems | Q48 | It is possible to do daily activities with the subway. | [43,72] |
| Q49 | It is possible to do daily activities with the bus. | ||
| Q50 | It is possible to do daily activities with the taxi. | ||
| Perceived Accessibility to public service facilities | Q52 | Public administrative services are easily accessible. | [73,74] |
| Q53 | Health services are easily accessible. | ||
| Q54 | Cultural welfare centers are easily accessible. | ||
| Q55 | Essential facilities (including grocery stores, financial institutions, etc.) are easily accessible. | ||
| Q56 | Educational facilities are easily accessible. | ||
| Perceived Accessibility to digital services | Q57 | It is easy for me to use public transit systems through digital resources. | [43,72] |
| Q58 | It is easy for me to access traffic-related information through digital resources. | ||
| Q59 | It is easy for me to use public agency services through digital resources. | ||
| Q60 | It is easy for me to access health-related information and services through digital resources. | ||
| Q61 | It is easy for me to access culture-related information and services through digital resources. | ||
| Q62 | It is easy for me to conduct banking transactions through digital resources. | ||
| Q63 | It is easy for me to access educational information and services through digital resources. | ||
| Satisfaction | Q15 | In most ways my life is close to my ideal. | [75] |
| Q16 | The conditions of my life are excellent. | ||
| Q17 | I am satisfied with my life. | ||
| Q18 | So far I have gotten the important things I want in life. | ||
| Q19 | If I could live my life over, I would change almost nothing. | ||
| Happiness | Q20 | In general, I consider myself: 1 (not a very happy person) to 5 (a very happy person) | [76] |
| Q21 | Compared to most of my peers, I consider myself: 1 (less happy) to 5 (more happy) | ||
| Valued life | Q22 | My life is worthwhile. | [70] |
| Q23 | My life is significant. | ||
| Q24 | I really value my life. | ||
| Q25 | I hold my own life in high regard. |
Appendix B
| Construct | ATS | APS | ADS | SAT | HAP | VAL |
|---|---|---|---|---|---|---|
| Perceived Accessibility to transportation systems | 1.114 | |||||
| Perceived Accessibility to public service facilities | 1.125 | |||||
| Perceived Accessibility to digital services | 1.052 | |||||
| Satisfaction | 2.220 | |||||
| Happiness | ||||||
| Valued life | 2.220 |
Appendix C
| Construct | Item | ATS | APS | ADS | SAT | HAP | VAL |
|---|---|---|---|---|---|---|---|
| Perceived accessibility to transportation systems | Q48 | 0.734 | 0.209 | 0.155 | 0.194 | 0.084 | 0.132 |
| Q49 | 0.837 | 0.189 | 0.137 | 0.220 | 0.045 | 0.122 | |
| Q50 | 0.799 | 0.304 | 0.104 | 0.253 | 0.138 | 0.097 | |
| Perceived accessibility to public service facilities | Q52 | 0.313 | 0.725 | 0.208 | 0.296 | 0.149 | 0.154 |
| Q53 | 0.313 | 0.827 | 0.180 | 0.324 | 0.200 | 0.196 | |
| Q54 | 0.206 | 0.881 | 0.151 | 0.449 | 0.211 | 0.252 | |
| Q55 | 0.403 | 0.826 | 0.170 | 0.373 | 0.235 | 0.276 | |
| Q56 | 0.198 | 0.840 | 0.097 | 0.352 | 0.173 | 0.216 | |
| Perceived accessibility to digital services | Q57 | 0.055 | 0.169 | 0.746 | 0.288 | 0.177 | 0.122 |
| Q58 | 0.221 | 0.139 | 0.772 | 0.259 | 0.167 | 0.131 | |
| Q59 | 0.198 | 0.126 | 0.803 | 0.320 | 0.262 | 0.217 | |
| Q60 | 0.054 | 0.120 | 0.779 | 0.370 | 0.262 | 0.229 | |
| Q61 | 0.092 | 0.130 | 0.811 | 0.246 | 0.154 | 0.081 | |
| Q62 | 0.098 | 0.202 | 0.827 | 0.307 | 0.203 | 0.175 | |
| Q63 | 0.174 | 0.180 | 0.783 | 0.297 | 0.205 | 0.183 | |
| Satisfaction | Q15 | 0.270 | 0.409 | 0.320 | 0.833 | 0.517 | 0.560 |
| Q16 | 0.241 | 0.385 | 0.394 | 0.869 | 0.642 | 0.639 | |
| Q17 | 0.218 | 0.343 | 0.380 | 0.885 | 0.666 | 0.672 | |
| Q18 | 0.307 | 0.412 | 0.292 | 0.845 | 0.559 | 0.652 | |
| Q19 | 0.170 | 0.313 | 0.208 | 0.763 | 0.609 | 0.585 | |
| Happiness | Q20 | 0.103 | 0.242 | 0.227 | 0.687 | 0.930 | 0.724 |
| Q21 | 0.080 | 0.197 | 0.265 | 0.633 | 0.922 | 0.705 | |
| Valued life | Q22 | 0.087 | 0.276 | 0.218 | 0.685 | 0.789 | 0.867 |
| Q23 | 0.086 | 0.238 | 0.077 | 0.595 | 0.528 | 0.809 | |
| Q24 | 0.107 | 0.160 | 0.196 | 0.550 | 0.585 | 0.843 | |
| Q25 | 0.226 | 0.224 | 0.204 | 0.646 | 0.644 | 0.846 |
Appendix D
| Construct | ATS | APS | ADS | SAT | HAP | VAL |
|---|---|---|---|---|---|---|
| Perceived Accessibility to transportation systems | ||||||
| Perceived Accessibility to public service facilities | 0.385 | |||||
| Perceived Accessibility to digital services | 0.210 | 0.221 | ||||
| Satisfaction | 0.353 | 0.493 | 0.416 | |||
| Happiness | 0.147 | 0.275 | 0.299 | 0.825 | ||
| Valued life | 0.190 | 0.301 | 0.229 | 0.836 | 0.841 |
References
- EQUINET. Webinar—A Living Conditions Affair: Accessibility, Infrastructure & Habitat. 2024. Available online: https://equineteurope.org/workshop-a-living-conditions-affair-accessibility-infrastructure-habitat/ (accessed on 16 August 2024).
- Orimo, H.; Ito, H.; Suzuki, T.; Araki, A.; Hosoi, T.; Sawabe, M. Reviewing the definition of “elderly”. Geriatr. Gerontol. Int. 2006, 6, 149–158. [Google Scholar] [CrossRef]
- Townsend, B.G.; Chen, J.T.; Wuthrich, V.M. Barriers and Facilitators to Social Participation in Older Adults: A Systematic Literature Review. Clin. Gerontol. 2021, 44, 359–380. [Google Scholar] [CrossRef] [PubMed]
- Douglas, H.; Georgiou, A.; Westbrook, J. Social participation as an indicator of successful aging: An overview of concepts and their associations with health. Aust. Health Rev. A Publ. Aust. Hosp. Assoc. 2017, 41, 455–462. [Google Scholar] [CrossRef] [PubMed]
- Jalali, M.T.; Sarikhani, Y.; Askarian, F.; Marzaleh, M.A.; Najibi, S.M.; Delavari, S. Factors facilitating and inhibiting the social participation of the elderly in health-oriented activities in Shiraz, Southern Iran. BMC Geriatr. 2023, 23, 175. [Google Scholar] [CrossRef] [PubMed]
- Kang, M. Silver Hues: Building Age-Ready Cities-Korea Background Paper; International Bank for Reconstruction and Development: Washington, DC, USA; The World Bank: Washington, DC, USA, 2022. [Google Scholar]
- UNSD (United Nations Statistics Division). “Republic of Korea”. UNData. 2020. Available online: https://data.un.org/en/iso/kr.html (accessed on 12 October 2024).
- Seoul Metropolitan Government. 2018 Seoul Aging Survey; Seoul Metropolitan Government: Seoul, Republic of Korea, 2018.
- Lewis, C.; Buffel, T. Aging in place and the places of aging: A longitudinal study. J. Aging Stud. 2020, 54, 100870. [Google Scholar] [CrossRef]
- Srinivasan, S.; O’Fallon, L.R.; Dearry, A. Creating healthy communities, healthy homes, healthy people: Initiating a research agenda on the built environment and public health. Am. J. Public Health 2003, 93, 1446–1450. [Google Scholar] [CrossRef]
- Pinazo-Hernandis, S.; Blanco-Molina, M.; Ortega-Moreno, R. Aging in Place: Connections, Relationships, Social Participation and Social Support in the Face of Crisis Situations. Int. J. Environ. Res. Public Health 2022, 19, 16623. [Google Scholar] [CrossRef]
- Levasseur, M.; Richard, L.; Gauvin, L.; Raymond, É. Inventory and analysis of definitions of social participation found in the aging literature: Proposed taxonomy of social activities. Soc. Sci. Med. 2010, 71, 2141–2149. [Google Scholar] [CrossRef]
- Duppen, D.; Lambotte, D.; Dury, S.; Smetcoren, A.-S.; Pan, H.; De Donder, L.; Consortium, D.S. Social Participation in the Daily Lives of Frail Older Adults: Types of Participation and Influencing Factors. J. Gerontol. Ser. B 2020, 75, 2062–2071. [Google Scholar] [CrossRef]
- Latham-Mintus, K.; Manierre, M.; Miller, K. Staying Connected: Alternative Transportation Use, Neighborhoods, and Social Participation Among Older Americans. Gerontologist 2022, 62, 75–88. [Google Scholar] [CrossRef]
- Kim, J.; Kim, M.; Malonebeach, E.E.; Han, A. A Study of Health Perception, Disability Acceptance, and Life Satisfaction Based on Types of Leisure Activity Among Koreans with a Physical Disability. Appl. Res. Qual. Life 2015, 11, 791–804. [Google Scholar] [CrossRef]
- Tomioka, K.; Kurumatani, N.; Hosoi, H. Association between social participation and instrumental activities of daily living among community-dwelling older adults. J. Epidemiol. 2016, 26, 553–561. [Google Scholar] [CrossRef] [PubMed]
- Levasseur, M.; Desrosiers, J.; St-Cyr Tribble, D. Do quality of life, participation and environment of older adults differ according to level of activity? Health Qual Life Outcomes 2008, 6, 30. [Google Scholar] [CrossRef] [PubMed]
- Tomioka, K.; Kurumatani, N.; Hosoi, H. Social Participation and Cognitive Decline Among Community-dwelling Older Adults: A Community-based Longitudinal Study. J. Gerontol. Ser. B Psychol. Sci. Soc. Sci. 2018, 73, 799–806. [Google Scholar] [CrossRef]
- Qing, Z.; Wu, C.; Gao, T. The impact of social participation on Subjective Wellbeing in the older adult: The mediating role of anxiety and the moderating role of education. Front. Public Health 2024, 12, 1362268. [Google Scholar] [CrossRef]
- Jones, C.A.; Jhangri, G.S.; Yamamoto, S.S.; Hogan, D.B.; Hanson, H.; Levasseur, M.; Morales, E.; Légaré, F. Social participation of older people in urban and rural areas: Canadian Longitudinal Study on Aging. BMC Geriatr. 2023, 23, 439. [Google Scholar] [CrossRef]
- World Health Organization. National Programmes for Age-Friendly Cities and Communities: A Guide; World Health Organization: Geneva, Switzerland, 2023.
- Renalds, A.; Smith, T.H.; Hale, P.J. A systematic review of built environment and health. Fam. Community Health 2010, 33, 68–78. [Google Scholar] [CrossRef]
- Levasseur, M.; Lefebvre, H.; Levert, M.-J.; Lacasse-Bédard, J.; Lacerte, J.; Carbonneau, H.; Therriault, P.-Y. Feasibility of Increasing Social Participation for Older Adults with Disabilities. Act. Adapt. Aging 2023, 48, 305–335. [Google Scholar] [CrossRef]
- Jaiswal, A.; Fraser, S.; Wittich, W. Barriers and Facilitators That Influence Social Participation in Older Adults with Dual Sensory Impairment. Front. Educ. 2020, 5, 127. [Google Scholar] [CrossRef]
- Guo, C.; Zhou, W.; Jing, C.; Zhaxi, D. Mapping and measuring urban-rural inequalities in accessibility to social infrastructures. Geogr. Sustain. 2024, 5, 41–51. [Google Scholar] [CrossRef]
- Levasseur, M.; Routhier, S.; Clapperton, I.; Doré, C.; Gallagher, F. Social participation needs of older adults living in a rural regional county municipality: Toward reducing situations of isolation and vulnerability. BMC Geriatr. 2020, 20, 456. [Google Scholar] [CrossRef] [PubMed]
- Zhang, N.; Yang, Q. Public transport inclusion and active aging: A systematic review on elderly mobility. J. Traffic Transp. Eng. 2024, 11, 312–347. [Google Scholar] [CrossRef]
- Jahangir, S.; Bailey, A.; Hasan, M.U.; Hossain, S. “We do not go outside, though We want to”: Unequal Access to Public Transport and Transport-Related Social Exclusion of Older Adults in Dhaka, Bangladesh. J. Appl. Gerontol. 2024, 43, 1165–1176. [Google Scholar] [CrossRef] [PubMed]
- Luz, G.; Barboza, M.H.C.; Portugal, L.; Giannotti, M.; van Wee, B. Does better accessibility help to reduce social exclusion? Evidence from the city of São Paulo, Brazil. Transp. Res. Part A Policy Pract. 2022, 166, 186–217. [Google Scholar] [CrossRef]
- Jo, H.-E.; Nam, J.-H. A Study on the Scope of Life SOC and Characteristics of Facilities by Type and Region—Focusing on the Facilities Status of Life SOC in Gyeonggi-do and its Improvement Plan. J. Urban Des. Inst. Korea Urban Des. 2019, 20, 33–52. [Google Scholar] [CrossRef]
- Klinenberg, E. Palaces for the People: How Social Infrastructure Can Help Fight Inequality, Polarization, and the Decline of Civic Life; Crown: New York, NY, USA, 2018. [Google Scholar]
- Reimers, K.; Johnston, R.B. Living Infrastructure. In Collaboration in the Digital Age: How Technology Enables Individuals, Teams and Businesses; Riemer, K., Schellhammer, S., Meinert, M., Eds.; Springer International Publishing: Cham, Switzerland, 2019; pp. 249–267. [Google Scholar]
- Kim, M.; Im, H.N. The Relationship between Social Infrastructure and Happiness. J. Korea Plan. Assoc. 2020, 55, 5–18. [Google Scholar] [CrossRef]
- Jiang, N.; Lou, V.W.Q.; Lu, N. Does social capital influence preferences for aging in place? Evidence from urban China. Aging Ment. Health 2018, 22, 405–411. [Google Scholar] [CrossRef]
- Putnam, R.; Leonardi, R.; Nanetti, R. Making Democracy Work: Civic Traditions in Modern Italy; Princeton University Press: Princeton, NJ, USA, 1993. [Google Scholar]
- Lu, N.; Xu, S.; Zhou, Q. Social Capital and Preferences for Aging in Place Among Older Adults Living in Rural Northeast China. Int. J. Environ. Res. Public Health 2020, 17, 5085. [Google Scholar] [CrossRef]
- Kim, C.S.; Yoo, S.H. The Investigation of the Level of Satisfaction towards Life of the Elderly: Focusing on the Difference according to One’s Personal Backgrounds. Soc. Sci. Res. Rev. 2009, 25, 51–73. [Google Scholar]
- Zahnow, R. Social infrastructure, social cohesion and subjective wellbeing. Wellbeing Space Soc. 2024, 7, 100210. [Google Scholar] [CrossRef]
- Kaufmann, V.; Bergman, M.M.; Joye, D. Motility: Mobility as capital. Int. J. Urban Reg. Res. 2004, 28, 745–756. [Google Scholar] [CrossRef]
- Shliselberg, R.; Givoni, M.; Kaplan, S. A behavioral framework for measuring motility: Linking past mobility experiences, motility and eudemonic well-being. Transp. Res. Part A Policy Pract. 2020, 141, 69–85. [Google Scholar] [CrossRef]
- Yun, S.H.; Noh, S.H. An analysis of major factors composing the mobilities concept and measurement variables of the factors. Geogr. J. Korea 2016, 50, 503–511. [Google Scholar]
- Vitman-Schorr, A.; Ayalon, L.; Khalaila, R. Perceived Accessibility to Services and Sites Among Israeli Older Adults. J. Appl. Gerontol. 2019, 38, 112–136. [Google Scholar] [CrossRef]
- Lättman, K.; Olsson, L.E.; Friman, M. Development and test of the Perceived Accessibility Scale (PAC) in public transport. J. Transp. Geogr. 2016, 54, 257–263. [Google Scholar] [CrossRef]
- Diener, E.; Suh, E. Subjective Well-Being and Age: An International Analysis. Annu. Rev. Gerontol. Geriatr. 1998, 17, 304–324. [Google Scholar]
- Siu, B.W.Y. Assessment of physical environment factors for mobility of older adults: A case study in Hong Kong. Res. Transp. Bus. Manag. 2019, 30, 100370. [Google Scholar] [CrossRef]
- Nordbakke, S.; Schwanen, T. Well-being and Mobility: A Theoretical Framework and Literature Review Focusing on Older People. Mobilities 2014, 9, 104–129. [Google Scholar] [CrossRef]
- Rossi, F.; Mariotti, I.; Pantelaki, E. Local public transport and neighbourhood satisfaction: The effect on older adults’ subjective wellbeing. Res. Transp. Bus. Manag. 2023, 51, 101058. [Google Scholar] [CrossRef]
- Morris, J.M.; Dumble, P.L.; Wigan, M.R. Accessibility indicators for transport planning. Transp. Res. Part A Gen. 1979, 13, 91–109. [Google Scholar] [CrossRef]
- Farrington, J.; Farrington, C. Rural accessibility, social inclusion and social justice: Towards conceptualisation. J. Transp. Geogr. 2005, 13, 1–12. [Google Scholar] [CrossRef]
- Ettema, D.; Gärling, T.; Olsson, L.E.; Friman, M. Out-of-home activities, daily travel, and subjective well-being. Transp. Res. Part A Policy Pract. 2010, 44, 723–732. [Google Scholar] [CrossRef]
- Zhang, N.; Zhang, J.; Yang, Q.; Skitmore, M.; Yang, N.; Shi, B.; Zhang, X.; Qin, X. The impact of transport inclusion on active Aging: A perceived value analysis. Transp. Res. Part D Transp. Environ. 2024, 127, 104029. [Google Scholar] [CrossRef]
- Channer, N.S.; Hartt, M.; Biglieri, S. Aging-in-place and the spatial distribution of older adult vulnerability in Canada. Appl. Geogr. 2020, 125, 102357. [Google Scholar] [CrossRef]
- Gregory, D.; Johnston, R.J.; Pratt, G.; Watts, M.; Whatmore, S. The Dictionary of Human Geography, 5th ed.; Wiley-Blackwell: Oxford, UK, 2009. [Google Scholar]
- Sugiyama, T.; Thompson, C.W. Outdoor Environments, Activity and the Well-Being of Older People: Conceptualising Environmental Support. Environ. Plan. A Econ. Space 2007, 39, 1943–1960. [Google Scholar] [CrossRef]
- Richard, L.; Gauvin, L.; Gosselin, C.; Laforest, S. Staying connected: Neighbourhood correlates of social participation among older adults living in an urban environment in Montréal, Québec. Health Promot. Int. 2008, 24, 46–57. [Google Scholar] [CrossRef]
- Burke, J.; O’Campo, P.; Salmon, C.; Walker, R. Pathways connecting neighborhood influences and mental well-being: Socioeconomic position and gender differences. Soc. Sci. Med. 2009, 68, 1294–1304. [Google Scholar] [CrossRef]
- Chen, Y.; Liu, B.; Shen, Y.; Li, L. Assessing accessibility to service facilities for older people in age-restricted communities from the perspective of equity. J. Transp. Health 2022, 27, 101515. [Google Scholar] [CrossRef]
- Choi, M.S.; Lee, H. The age-friendly community environment factors contributing to life satisfaction of older adults living alone. Innov. Aging 2022, 6, 619. [Google Scholar] [CrossRef]
- Venkatesh, V.; Morris, M.G.; Davis, G.B.; Davis, F.D. User Acceptance of Information Technology: Toward a Unified View. MIS Q. 2003, 27, 425–478. [Google Scholar] [CrossRef]
- American Library Association. Digital Literacy. 2023. Available online: https://literacy.ala.org/digital-literacy/ (accessed on 9 October 2024).
- Rasi-Heikkinen, P.; Doh, M. Older adults and digital inclusion. Educ. Gerontol. 2023, 49, 345–347. [Google Scholar] [CrossRef]
- Finkelstein, R.; Wu, Y.; Brennan-Ing, M. Older adults’ experiences with using information and communication technology and tech support services in New York City: Findings and recommendations for post-pandemic digital pedagogy for older adults. Front. Psychol. 2023, 14, 1129512. [Google Scholar] [CrossRef] [PubMed]
- Park, Y.; Chang, S.J. The impact of ageism experiences on social participation among community-dwelling older adults: Exploring the moderating role of digital literacy. Geriatr. Nurs. 2024, 59, 372–378. [Google Scholar] [CrossRef] [PubMed]
- Lee, H.; Nam, E.W. Analysis of the Impact of Digital Information Level on Life Satisfaction (2019–2022) for Older Adults in South Korea: A National Community-Based Panel Study. Sci. Rep. 2024, 14, 20399. [Google Scholar]
- Veenhoven, S.K.J.S.R. Life-satisfaction is more a matter of feeling well than having what you want. Tests of Veenhoven’s theory. Int. J. Happiness Dev. 2018, 4, 209–235. [Google Scholar]
- Keyes, C.L.M. Happiness, Flourishing, and Life Satisfaction. In The Wiley Blackwell Encyclopedia of Health, Illness, Behavior, and Society; Wiley: Hoboken, NJ, USA, 2014; pp. 747–751. [Google Scholar]
- Kim, J.-H. The Impact of Elderly Religious Participation on Happiness: Focusing on the Mediating Effect of Life Satisfaction. J. Korea Contents Assoc. 2023, 23, 599–609. [Google Scholar] [CrossRef]
- Jaisri, M. Happiness and satisfaction with life among adults. Indian J. Posit. Psychol. Hisar 2016, 7, 84–87. [Google Scholar]
- Kolosnitsyna, M.; Khorkina, N.; Dorzhiev, K. What Happens to Happiness When People Get Older? Socio-Economic Determinants of Life Satisfaction in Later Life; Higher School of Economics: Moscow, Russia, 2014. [Google Scholar]
- Morgan, J.; Farsides, T. Psychometric Evaluation of the Meaningful Life Measure. J. Happiness Stud. 2009, 10, 351–366. [Google Scholar] [CrossRef]
- Steger, M.F.; Frazier, P.; Oishi, S.; Kaler, M. The meaning in life questionnaire: Assessing the presence of and search for meaning in life. J. Couns. Psychol. 2006, 53, 80–93. [Google Scholar] [CrossRef]
- Yun, S.H. Verification of Major Factors Composing the Concept of Mobilities. J. Korean Geogr. Soc. 2018, 53, 209–228. [Google Scholar]
- Kim, Y.; Oh, J.; Kim, S. The Transition from Traditional Infrastructure to Living SOC and Its Effectiveness for Community Sustainability: The Case of South Korea. Sustainability 2020, 12, 10227. [Google Scholar] [CrossRef]
- Watthanaklang, D.; Jomnonkwao, S.; Champahom, T.; Wisutwattanasak, P. Exploring accessibility and service quality perceptions on local public transportation in Thailand. Case Stud. Transp. Policy 2024, 15, 101144. [Google Scholar] [CrossRef]
- Diener, E.; Emmons, R.A.; Larsen, R.J.; Griffin, S. The Satisfaction with Life Scale. J. Personal. Assess. 1985, 49, 71–75. [Google Scholar] [CrossRef] [PubMed]
- Lyubomirsky, S.; Lepper, H.S. A measure of subjective happiness: Preliminary reliability and construct validation. Soc. Indic. Res. 1999, 46, 137–155. [Google Scholar] [CrossRef]
- Podsakoff, P.M.; MacKenzie, S.B.; Lee, J.-Y.; Podsakoff, N.P. Common method biases in behavioral research: A critical review of the literature and recommended remedies. J. Appl. Psychol. 2003, 88, 879–903. [Google Scholar] [CrossRef]
- Kock, N. Common method bias in PLS-SEM: A full collinearity assessment approach. Int. J. E-Collab. 2015, 11, 10. [Google Scholar] [CrossRef]
- Ringle, C.M.; Sarstedt, M.; Straub, D.W. A Critical Look at the Use of PLS-SEM in MIS Quarterly. MIS Q. 2012, 36, iii–xiv. [Google Scholar] [CrossRef]
- Hair, J.F.; Ringle, C.M.; Sarstedt, M. PLS-SEM: Indeed a Silver Bullet. J. Mark. Theory Pract. 2011, 19, 139–152. [Google Scholar] [CrossRef]
- Hair, J.F.; Anderson, R.E.; Tatham, R.L.; Black, W.C. Multivariate Data Analysis; Prentice Hall: Hoboken, NJ, USA, 1998. [Google Scholar]
- Gefen, D.; Straub, D.W. A practical guide to factorial validity using PLS-graph: Tutorial and annotated example. Commun. AIS 2005, 16, 19–109. [Google Scholar] [CrossRef]
- Fornell, C.; Larcker, D.F. Evaluating structural equation models with unobservable variables and measurement error. J. Mark. Res. 1981, 18, 39–50. [Google Scholar] [CrossRef]
- Henseler, J.; Ringle, C.M.; Sarstedt, M. A new criterion for assessing discriminant validity in variance-based structural equation modeling. J. Acad. Mark. Sci. 2015, 43, 115–135. [Google Scholar] [CrossRef]
- Chin, W.W.; Marcolin, B.L.; Newsted, P.R. A partial least squares latent variable modeling approach for measuring interaction effects: Results from a Monte Carlo simulation study and an electronic-mail emotion/adoption study. Inf. Syst. Res. 2003, 14, 189–217. [Google Scholar] [CrossRef]
- Levasseur, M.; Généreux, M.; Bruneau, J.F.; Vanasse, A.; Chabot, É.; Beaulac, C.; Bédard, M.M. Importance of proximity to resources, social support, transportation and neighborhood security for mobility and social participation in older adults: Results from a scoping study. BMC Public Health 2015, 15, 503. [Google Scholar] [CrossRef] [PubMed]
| Items | Category | Frequency | Ratio (%) |
|---|---|---|---|
| Gender | Female | 105 | 52.5 |
| Male | 95 | 47.5 | |
| Age | 65~69 | 55 | 27.5 |
| 70~74 | 95 | 47.5 | |
| Above 75 | 50 | 25.0 | |
| Education level | High school or below | 90 | 45.0 |
| Bachelor’s degree | 94 | 47.0 | |
| Graduate school or above | 16 | 8.0 | |
| Average monthly income (KRW) | Below 2,000,000 | 11 | 5.5 |
| 2,000,000–2,999,999 | 53 | 26.5 | |
| 3,000,000–3,999,999 | 101 | 50.5 | |
| 4,000,000–4,999,999 | 31 | 15.5 | |
| Above 5,000,000 | 4 | 2.0 | |
| Residential area | Seoul City | 59 | 29.5 |
| Seoul Metropolitan Area | 78 | 39.0 | |
| Other Metropolitan City | 33 | 16.5 | |
| Other areas | 30 | 15.0 |
| Constructs | Mean (SD) | Cronbach’s Alpha | Composite Reliability | Average Variance Extracted (AVE) |
|---|---|---|---|---|
| Perceived accessibility to transportation systems | 3.257 (0.898) | 0.702 | 0.834 | 0.626 |
| Perceived accessibility to public service facilities | 3.250 (0.833) | 0.879 | 0.912 | 0.675 |
| Perceived accessibility to digital services | 3.731 (0.849) | 0.899 | 0.920 | 0.623 |
| Satisfaction | 3.035 (0.768) | 0.895 | 0.923 | 0.706 |
| Happiness | 3.448 (0.776) | 0.834 | 0.923 | 0.858 |
| Valued life | 3.185 (0.758) | 0.863 | 0.906 | 0.708 |
| Constructs | ATS | APS | ADS | SAT | HAP | VAL |
|---|---|---|---|---|---|---|
| Perceived accessibility to transportation systems | 0.791 | |||||
| Perceived accessibility to public service facilities | 0.301 | 0.821 | ||||
| Perceived accessibility to digital services | 0.163 | 0.192 | 0.789 | |||
| Satisfaction | 0.284 | 0.443 | 0.384 | 0.840 | ||
| Happiness | 0.116 | 0.238 | 0.265 | 0.714 | 0.926 | |
| Valued life | 0.146 | 0.271 | 0.213 | 0.741 | 0.741 | 0.841 |
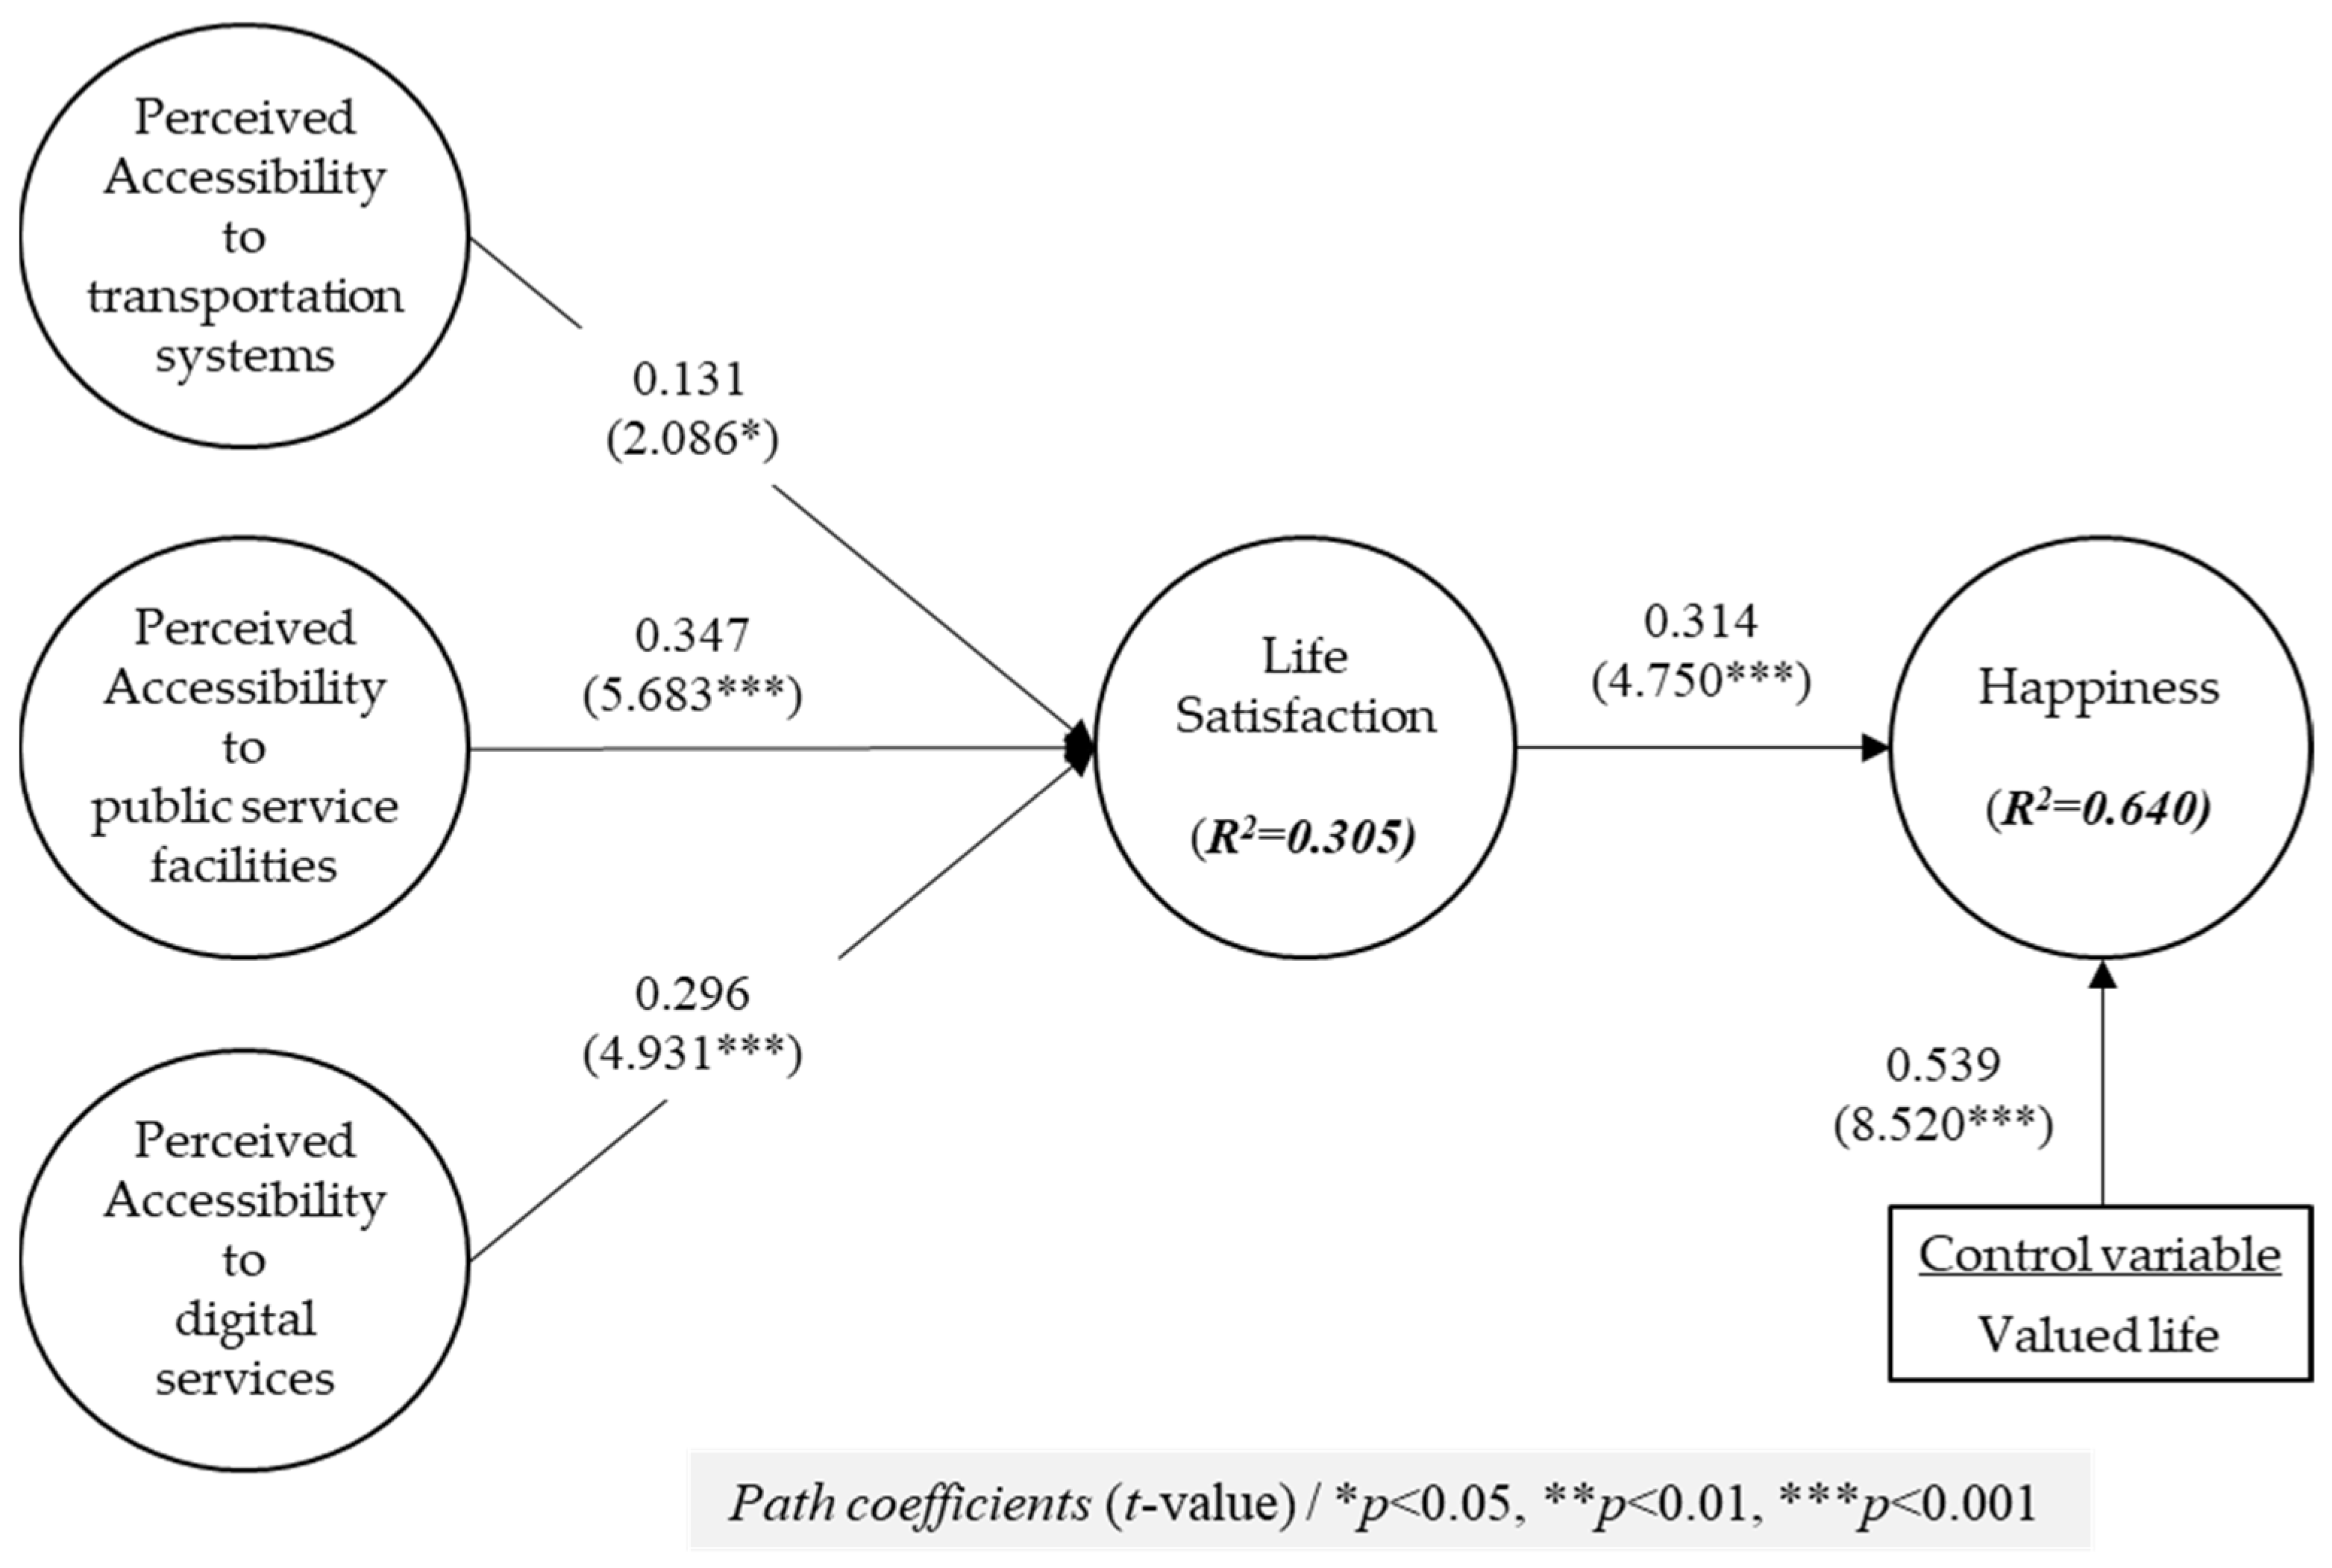
| Hypothesis | Path Coefficient | t-Value | p-Value | Results |
|---|---|---|---|---|
| Perceived Accessibility to transportation systems → Satisfaction | 0.131 | 2.086 | 0.019 | Supported |
| Perceived Accessibility to public service facilities → Satisfaction | 0.347 | 5.683 | 0.000 | Supported |
| Perceived Accessibility to digital services → Satisfaction | 0.296 | 4.931 | 0.000 | Supported |
| Satisfaction → Happiness | 0.314 | 4.750 | 0.000 | Supported |
| Valued life → Happiness | 0.539 | 8.520 | 0.000 | Supported |
Disclaimer/Publisher’s Note: The statements, opinions and data contained in all publications are solely those of the individual author(s) and contributor(s) and not of MDPI and/or the editor(s). MDPI and/or the editor(s) disclaim responsibility for any injury to people or property resulting from any ideas, methods, instructions or products referred to in the content. |
© 2024 by the author. Licensee MDPI, Basel, Switzerland. This article is an open access article distributed under the terms and conditions of the Creative Commons Attribution (CC BY) license (https://creativecommons.org/licenses/by/4.0/).
Share and Cite
Kim, S. Effects of Perceived Accessibility to Living Infrastructure on Positive Feelings Among Older Adults. Behav. Sci. 2024, 14, 1025. https://doi.org/10.3390/bs14111025
Kim S. Effects of Perceived Accessibility to Living Infrastructure on Positive Feelings Among Older Adults. Behavioral Sciences. 2024; 14(11):1025. https://doi.org/10.3390/bs14111025
Chicago/Turabian StyleKim, Sohee. 2024. "Effects of Perceived Accessibility to Living Infrastructure on Positive Feelings Among Older Adults" Behavioral Sciences 14, no. 11: 1025. https://doi.org/10.3390/bs14111025
APA StyleKim, S. (2024). Effects of Perceived Accessibility to Living Infrastructure on Positive Feelings Among Older Adults. Behavioral Sciences, 14(11), 1025. https://doi.org/10.3390/bs14111025