Assessing the Validity and Reliability of a French Version of the Child Feeding Questionnaire among Black Mothers Living in Ottawa (Canada)


Abstract
1. Introduction
2. Materials and Methods
2.1. Participants
2.2. Measures
2.2.1. Sociodemographic Characteristics
2.2.2. Racial and Ethnic Identity
2.2.3. Weight Status
2.2.4. Maternal Feeding Practices, Perceptions, and Concerns about Child’s Weight
2.3. Translation of the Child Feeding Questionnaire
2.4. Statistics
2.4.1. Software and Packages
2.4.2. Item Measures
2.4.3. Validity
2.4.4. Reliability
3. Results
3.1. Sample Characteristics
3.2. Item Measures
3.3. Validity
3.4. Reliability
4. Discussion
Author Contributions
Funding
Institutional Review Board Statement
Informed Consent Statement
Data Availability Statement
Acknowledgments
Conflicts of Interest
References
- Rao, D.P.; Kropac, E.; Do, M.T.; Roberts, K.C.; Jayaraman, G.C. Childhood Overweight and Obesity Trends in Canada. Health Promot. Chronic Dis. Prev. Can. 2016, 36, 194–198. [Google Scholar] [CrossRef] [PubMed]
- World Health Organization. Why Does Childhood Overweight and Obesity Matter? Available online: https://www.who.int/news-room/fact-sheets/detail/obesity-and-overweight (accessed on 14 May 2019).
- Valera, B.; Sohani, Z.; Rana, A.; Poirier, P.; Anand, S.S. The Ethnoepidemiology of Obesity. Can. J. Cardiol. 2015, 31, 131–141. [Google Scholar] [CrossRef] [PubMed]
- Arroyo-Johnson, C.; Mincey, K.D. Obesity Epidemiology Worldwide. Gastroenterol. Clin. N. Am. 2016, 45, 571–579. [Google Scholar] [CrossRef] [PubMed]
- Tremblay, M.; Pérez, C.; Ardern, C.; Bryan, S.; Katzmarzyk, P. Obesity, Overweight and Ethnicity. Health Rep. 2005, 16, 23–34. [Google Scholar] [PubMed]
- Shields, M. Overweight and Obesity among Children and Youth. Health Rep. 2006, 17, 27–42. [Google Scholar]
- Kumar, S.; Kelly, A.S. Review of Childhood Obesity: From Epidemiology, Etiology, and Comorbidities to Clinical Assessment and Treatment. Mayo Clin. Proc. 2017, 92, 251–265. [Google Scholar] [CrossRef]
- Rodd, C.; Sharma, A.K. Prevalence of Overweight and Obesity in Canadian Children, 2004 to 2013: Impact of Socioeconomic Determinants. Paediatr. Child. Health 2017, 22, 153–158. [Google Scholar] [CrossRef]
- Anderson, C.B.; Hughes, S.O.; Fisher, J.O.; Nicklas, T.A. Cross-Cultural Equivalence of Feeding Beliefs and Practices: The Psychometric Properties of the Child Feeding Questionnaire among Blacks and Hispanics. Prev. Med. 2005, 41, 521–531. [Google Scholar] [CrossRef]
- Birch, L.; Fisher, J. Development of Eating Behaviors among Children and Adolescents. Pediatrics 1998, 101, S539–S549. [Google Scholar] [CrossRef]
- Rosenkranz, R.R.; Dzewaltowski, D.A. Model of the Home Food Environment Pertaining to Childhood Obesity. Nutr. Rev. 2008, 66, 123–140. [Google Scholar] [CrossRef]
- Birch, L.L.; Fisher, J.O. Mothers’ Child-Feeding Practices Influence Daughters’ Eating and Weight. Am. J. Clin. Nutr. 2000, 71, 1054–1061. [Google Scholar] [CrossRef] [PubMed]
- Spruijt-Metz, D.; Lindquist, C.H.; Birch, L.L.; Fisher, J.O.; Goran, M.I. Relation between Mothers’ Child-Feeding Practices and Children’s Adiposity. Am. J. Clin. Nutr. 2002, 75, 581–586. [Google Scholar] [CrossRef] [PubMed]
- Tschann, J.M.; Martinez, S.M.; Penilla, C.; Gregorich, S.E.; Pasch, L.A.; de Groat, C.L.; Flores, E.; Deardorff, J.; Greenspan, L.C.; Butte, N.F. Parental Feeding Practices and Child Weight Status in Mexican American Families: A Longitudinal Analysis. Int. J. Behav. Nutr. Phys. Act. 2015, 12, 66. [Google Scholar] [CrossRef] [PubMed]
- Papaioannou, M.A.; Power, T.G.; O’Connor, T.M.; Fisher, J.O.; Micheli, N.E.; Hughes, S.O. Child Weight Status: The Role of Feeding Styles and Highly Motivated Eating in Children. Children 2023, 10, 507. [Google Scholar] [CrossRef] [PubMed]
- Faith, M.S.; Scanlon, K.S.; Birch, L.L.; Francis, L.A.; Sherry, B. Parent-Child Feeding Strategies and Their Relationships to Child Eating and Weight Status. Obes. Res. 2004, 12, 1711–1722. [Google Scholar] [CrossRef]
- Shloim, N.; Edelson, L.R.; Martin, N.; Hetherington, M.M. Parenting Styles, Feeding Styles, Feeding Practices, and Weight Status in 4–12 Year-Old Children: A Systematic Review of the Literature. Front. Psychol. 2015, 6, 1849. [Google Scholar] [CrossRef]
- Kengneson, C.C.; Blanchet, R.; Sanou, D.; Batal, M.; Giroux, I. Factors Associated with Feeding Practices of Black Immigrant Mothers of African and Caribbean Origin Living in Ottawa, Canada. Appetite 2021, 167, 105641. [Google Scholar] [CrossRef]
- Gerards, S.M.P.L.; Gubbels, J.S.; Dagnelie, P.C.; Kremers, S.P.J.; Stafleu, A.; De Vries, N.K.; Thijs, C. Parental Perception of Child’s Weight Status and Subsequent BMIz Change: The KOALA Birth Cohort Study. BMC Public Health 2014, 14, 291. [Google Scholar] [CrossRef]
- Robinson, E.; Sutin, A.R. Parental Perception of Weight Status and Weight Gain across Childhood. Pediatrics 2016, 137, e20153957. [Google Scholar] [CrossRef]
- Robinson, E.; Sutin, A.R. Parents’ Perceptions of Their Children as Overweight and Children’s Weight Concerns and Weight Gain. Psychol. Sci. 2017, 28, 320–329. [Google Scholar] [CrossRef]
- de Lauzon-Guillain, B.; Oliveira, A.; Charles, M.A.; Grammatikaki, E.; Jones, L.; Rigal, N.; Lopes, C.; Manios, Y.; Moreira, P.; Emmett, P.; et al. A Review of Methods to Assess Parental Feeding Practices and Preschool Children’s Eating Behavior: The Need for Further Development of Tools. J. Acad. Nutr. Diet. 2012, 112, 1578–1602.e8. [Google Scholar] [CrossRef] [PubMed]
- Musher-Eizenman, D.R.; Kiefner, A. Food Parenting: A Selective Review of Current Measurement and an Empirical Examination to Inform Future Measurement. Child. Obes. 2013, 9, S32–S39. [Google Scholar] [CrossRef] [PubMed]
- Vaughn, A.E.; Tabak, R.G.; Bryant, M.J.; Ward, D.S. Measuring Parent Food Practices: A Systematic Review of Existing Measures and Examination of Instruments. Int. J. Behav. Nutr. Phys. Act. 2013, 10, 61. [Google Scholar] [CrossRef] [PubMed]
- Birch, L.; Fisher, J.; Grimm-Thomas, K.; Markey, C.; Sawyer, R.; Johnson, S. Confirmatory Factor Analysis of the Child Feeding Questionnaire: A Measure of Parental Attitudes, Beliefs and Practices about Child Feeding and Obesity Proneness. Appetite 2001, 36, 201–210. [Google Scholar] [CrossRef] [PubMed]
- Kong, A.; Vijayasiri, G.; Fitzgibbon, M.L.; Schiffer, L.A.; Campbell, R.T. Confirmatory Factor Analysis and Measurement Invariance of the Child Feeding Questionnaire in Low-Income Hispanic and African-American Mothers with Preschool-Age Children. Appetite 2015, 90, 16–22. [Google Scholar] [CrossRef]
- Boles, R.E.; Nelson, T.D.; Chamberlin, L.A.; Valenzuela, J.M.; Sherman, S.N.; Johnson, S.L.; Powers, S.W. Confirmatory Factor Analysis of the Child Feeding Questionnaire among Low-Income African American Families of Preschool Children. Appetite 2010, 54, 402–405. [Google Scholar] [CrossRef]
- Corsini, N.; Danthiir, V.; Kettler, L.; Wilson, C. Factor Structure and Psychometric Properties of the Child Feeding Questionnaire in Australian Preschool Children. Appetite 2008, 51, 474–481. [Google Scholar] [CrossRef]
- Geng, G.; Zhu, Z.; Suzuki, K.; Tanaka, T.; Ando, D.; Sato, M.; Yamagata, Z. Confirmatory Factor Analysis of the Child Feeding Questionnaire (CFQ) in Japanese Elementary School Children. Appetite 2009, 52, 8–14. [Google Scholar] [CrossRef]
- Camcı, N.; Bas, M.; Buyukkaragoz, A.H. The Psychometric Properties of the Child Feeding Questionnaire (CFQ) in Turkey. Appetite 2014, 78, 49–54. [Google Scholar] [CrossRef]
- Nowicka, P.; Sorjonen, K.; Pietrobelli, A.; Flodmark, C.-E.; Faith, M.S. Parental Feeding Practices and Associations with Child Weight Status. Swedish Validation of the Child Feeding Questionnaire Finds Parents of 4-Year-Olds Less Restrictive. Appetite 2014, 81, 232–241. [Google Scholar] [CrossRef]
- Liu, W.-H.; Mallan, K.M.; Mihrshahi, S.; Daniels, L.A. Feeding Beliefs and Practices of Chinese Immigrant Mothers. Validation of a Modified Version of the Child Feeding Questionnaire. Appetite 2014, 80, 55–60. [Google Scholar] [CrossRef] [PubMed]
- Canals-Sans, J.; Blanco-Gómez, A.; Luque, V.; Ferré, N.; Ferrando, P.J.; Gispert-Llauradó, M.; Escribano, J.; Closa-Monasterolo, R. Validation of the Child Feeding Questionnaire in Spanish Parents of Schoolchildren. J. Nutr. Educ. Behav. 2016, 48, 383–391.e1. [Google Scholar] [CrossRef] [PubMed]
- Schmidt, R.; Richter, R.; Brauhardt, A.; Hiemisch, A.; Kiess, W.; Hilbert, A. Parental Feeding Practices in Families with Children Aged 2–13 Years: Psychometric Properties and Child Age-Specific Norms of the German Version of the Child Feeding Questionnaire (CFQ). Appetite 2017, 109, 154–164. [Google Scholar] [CrossRef]
- Mosli, R.H. Validation of the Child Feeding Questionnaire among Saudi Pre-Schoolers in Jeddah City. Public Health Nutr. 2020, 23, 599–608. [Google Scholar] [CrossRef]
- Kaur, H.; Li, C.; Nazir, N.; Choi, W.S.; Resnicow, K.; Birch, L.L.; Ahluwalia, J.S. Confirmatory Factor Analysis of the Child-Feeding Questionnaire among Parents of Adolescents. Appetite 2006, 47, 36–45. [Google Scholar] [CrossRef] [PubMed]
- Baranowski, T.; O’Connor, T.; Hughes, S.; Sleddens, E.; Beltran, A.; Frankel, L.; Mendoza, J.A.; Baranowski, J. Houston … We Have a Problem! Measurement of Parenting. Child. Obes. 2013, 9, S1–S4. [Google Scholar] [CrossRef]
- Shea, C.; Dwyer, J.; Heeney, E.; Goy, R.; Simpson, J. The Effect of Parental Feeding Behaviours and Participation of Children in Organized Sports/Activities on Child Body Mass Index. Can. J. Diet. Pract. Res. 2010, 71, e87–e93. [Google Scholar] [CrossRef]
- Tremblay, L.; Rinaldi, C.M.; Lovsin, T.; Zecevic, C. Parents’ Perceptions of Children’s Weight: The Accuracy of Ratings and Associations to Strategies for Feeding. Early Child. Dev. Care 2012, 182, 1027–1040. [Google Scholar] [CrossRef]
- Walton, K.; Filion, A.J.; Gross, D.; Morrongiello, B.; Darlington, G.; Simpson, J.R.; Hou, S.; Haines, J. Parents and Tots Together: Pilot Randomized Controlled Trial of a Family-Based Obesity Prevention Intervention in Canada. Can. J. Public Health 2015, 106, e555–e562. [Google Scholar] [CrossRef]
- Blanchet, R.; Sanou, D.; Nana, C.P.; Pauzé, E.; Batal, M.; Giroux, I. Strategies and Challenges in Recruiting Black Immigrant Mothers for a Community-Based Study on Child Nutritional Health in Ottawa, Canada. J. Immigr. Minor. Health 2017, 19, 367–372. [Google Scholar] [CrossRef]
- Blanchet, R.; Sanou, D.; Batal, M.; Nana, C.P.; Giroux, I. Draw and Tell: Dietary Acculturation as Lived by Black Immigrant Children of African and Caribbean Descent Residing in Canada. J. Nutr. Educ. Behav. 2017, 49, 838–846.e1. [Google Scholar] [CrossRef] [PubMed]
- Blanchet, R.; Nana, C.P.; Sanou, D.; Batal, M.; Giroux, I. Dietary Acculturation among Black Immigrant Families Living in Ottawa—A Qualitative Study. Ecol. Food Nutr. 2018, 57, 223–245. [Google Scholar] [CrossRef] [PubMed]
- Tarraf, D.; Sanou, D.; Blanchet, R.; Nana, C.P.; Batal, M.; Giroux, I. Prevalence and Determinants of Food Insecurity in Migrant Sub-Saharan African and Caribbean Households in Ottawa, Canada. Int. J. Migr. Health Soc. Care 2018, 14, 160–173. [Google Scholar] [CrossRef]
- Kengneson, C.C.; Blanchet, R.; Sanou, D.; Batal, M.; Phillips, K.P.; Giroux, I. Maternal Perceptions and Concerns about Children’s Weight Status and Diet Quality: A Study among Black Immigrant Families. Public Health Nutr. 2022, 25, 2232–2245. [Google Scholar] [CrossRef]
- Statistics Canada Ethnic Origin of Person. Available online: http://www23.statcan.gc.ca/imdb/p3Var.pl?Function=DEC&Id=103475 (accessed on 9 June 2019).
- United Nations’ Department of Economic and Social Affairs—Statistics Division. Principles and Recommendations for Population and Housing Censuses—Revision 3, 3rd ed.; United Nations: New York, NY, USA, 2017; ISBN 9789211615975. [Google Scholar]
- World Health Organization. Physical Status: The Use and Interpretation of Anthropometry; WHO: Geneva, Switzerland, 1995. [Google Scholar]
- Cole, T.J.; Lobstein, T. Extended International (IOTF) Body Mass Index Cut-Offs for Thinness, Overweight and Obesity. Pediatr. Obes. 2012, 7, 284–294. [Google Scholar] [CrossRef]
- Maneesriwongul, W.; Dixon, J.K. Instrument Translation Process: A Methods Review. J. Adv. Nurs. 2004, 48, 175–186. [Google Scholar] [CrossRef]
- R Core Team. A Language and Environment for Statistical Computing. 2020. Available online: https://www.r-project.org/ (accessed on 9 June 2019).
- van Buuren, S.; Groothuis-Oudshoorn, K. Mice: Multivariate Imputation by Chained Equations in R. J. Stat. Softw. 2011, 45, 1–67. [Google Scholar] [CrossRef]
- Revelle, W. Package “Psych”: Procedures for Psychological, Psychometric, and Personality Research. 2019. Available online: https://personality-project.org/r/psych-manual.pdf (accessed on 9 June 2019).
- Rosseel, Y. Lavaan: An R Package for Structural Equation Modeling. J. Stat. Softw. 2012, 48, 1–36. [Google Scholar] [CrossRef]
- Aylward, G.; Stancin, T. Screening and Assessment Tools. In Developmental-Behavioral Pediatrics; Mosby: Philadelphia, PA, USA, 2008; pp. 123–201. ISBN 978-0-323-04025-9. [Google Scholar]
- Field, A. Exploratory Factor Analysis. In Discovering Statistics Using. SPSS; SAGE Publications Inc.: Chennai, India, 2009; pp. 673–685. ISBN 978-1-84787-906-6. [Google Scholar]
- Heck, R.H.; Thomas, S.L. An Introduction to Multilevel Modeling Techniques: MLM and SEM Approaches, 4th ed.; Routledge: New York, NY, USA, 2020; ISBN 9780429060274. [Google Scholar]
- Hu, L.; Bentler, P.M. Cutoff Criteria for Fit Indexes in Covariance Structure Analysis: Conventional Criteria versus New Alternatives. Struct. Equ. Model. 1999, 6, 1–55. [Google Scholar] [CrossRef]
- Akaike, H. Factor Analysis and AIC. Psychometrika 1987, 52, 317–332. [Google Scholar] [CrossRef]
- Vrieze, S.I. Model Selection and Psychological Theory: A Discussion of the Differences between the Akaike Information Criterion (AIC) and the Bayesian Information Criterion (BIC). Psychol. Methods 2012, 17, 228–243. [Google Scholar] [CrossRef]
- Bentler, P.M. Comparative Fit Indexes in Structural Models. Psychol. Bull. 1990, 107, 238–246. [Google Scholar] [CrossRef] [PubMed]
- Cronbach, L.J. Coefficient Alpha and the Internal Structure of Tests. Psychometrika 1951, 16, 297–334. [Google Scholar] [CrossRef]
- Dunn, T.J.; Baguley, T.; Brunsden, V. From Alpha to Omega: A Practical Solution to the Pervasive Problem of Internal Consistency Estimation. Br. J. Psychol. 2014, 105, 399–412. [Google Scholar] [CrossRef] [PubMed]
- Trizano-Hermosilla, I.; Alvarado, J.M. Best Alternatives to Cronbach’s Alpha Reliability in Realistic Conditions: Congeneric and Asymmetrical Measurements. Front. Psychol. 2016, 7, 769. [Google Scholar] [CrossRef]
- Varni, J.W.; Limbers, C.A.; Burwinkle, T.M. Parent Proxy-Report of Their Children’s Health-Related Quality of Life: An Analysis of 13,878 Parents’ Reliability and Validity across Age Subgroups Using the PedsQLTM 4.0 Generic Core Scales. Health Qual. Life Outcomes 2007, 5, 2. [Google Scholar] [CrossRef]


| Authors (Year) | Population | Language | Characteristics of the Best FITTING Model (s) | |||||||
|---|---|---|---|---|---|---|---|---|---|---|
| Factors | Items | Restriction Scale | Other | Fit Indices | ||||||
| Birch et al. (2001) [25] | Sample 1: Non-Hispanic White (mostly) parents of 5–9-year-old girls living in the US (n = 394) | English | 7 | 24 | RST1a,b,c (avg) RST2 RST3a,b (avg) RST4a,b (avg) | PPW1 ~~ PPW2 PCW1 ~~ PCW2 | χ2 = 419 * | AIC = nr BIC = nr | CFI = 0.95 TLI = 0.94 | RMSEA = 0.04 SRMR = nr |
| Sample 2: Non-Hispanic White (mostly) parents of 8–11-year-old children living in the US (n = 148) | RSTa,b ~~ PE PPW1 ~~ PPW3 | χ2 = 309 | CFI = 0.92 TLI = 0.91 | RMSEA = 0.05 SRMR = nr | ||||||
| Sample 3: Hispanic (mostly) parents of 7–11-year-old children living in the US (n = 126) | 21 | Items dropped or omitted: PE1, PE2, RST3a,b | χ2 = 232 | CFI = 0.91 TLI = 0.89 | RMSEA = 0.05 SRMR = nr | |||||
| Anderson et al. (2005) [9] | Parents of 3-year-old Black and Hispanic children living in the US (n = 231) | English | 5 | 16 | RST1a RST1b RST4a | Scales dropped or omitted: PPW, PCW Items dropped or omitted: RST1c, RST2, RST3a,b, RST4b | χ2 = 129 ** | AIC = nr BIC = nr | CFI = 0.96 TLI = 0.95 | RMSEA = 0.04 SRMR = 0.06 |
| Parents of 3-year-old Black children living in the US (n = 101) | χ2 = 71 | CFI = 0.93 TLI = 0.92 | RMSEA = 0.05 SRMR = 0.09 | |||||||
| Parents of 3-year-old Hispanic children living in the US (n = 130) | χ2 = 167 | CFI = 1.00 TLI = 1.04 | RMSEA = 0.00 SRMR = 0.06 | |||||||
| Kaur et al. (2006) [36] | Parents of 10–19-year-old ethnically diverse adolescents living in the US (n = 260) | English | 7 | 24 | RST1a,b,c (avg) RST2 RST4a,b (avg) | PPW1 ~~ PPW2 PCW1 ~~ PCW2 | χ2 = 357 | AIC = nr BIC = nr | CFI = 0.95 TLI = 0.93 | RMSEA = 0.05 SRMR = nr |
| Corsini et al. (2008) [28] | Mothers of 4- to 5-year-old children living in Australia (n = 203) | English | 7 | 24 | RST1a,b,c (avg) RST2 RST3a,b (avg) RST4a,b (avg) | Items dropped or omitted: PCW4, PCW5, PCW6 | χ2 = 399 ** | AIC = 537 BIC = 766 | CFI = 0.93 TLI = 0.92 | RMSEA = 0.06 SRMR = nr |
| Geng et al. (2009) [29] | Parents of 9- to 12-year-old children living in Japan (n = 920) | Japanese | 7 | 24 | RST1a,b,c (avg) RST2 RST3a,b (avg) RST4 removed | PPW1 ~~ PPW2 PPW2 ~~ PPW3 PPW3 ~~ PPW4 Items dropped or omitted: PCW1, PCW6 | χ2 = 1115 ** | AIC = nr BIC = nr | CFI = 0.93 TLI = 0.92 | RMSEA = 0.06 SRMR = 0.05 |
| Liu et al. (2014) [32] | Chinese-Australian mothers of 1- to 4-year-old children (n = 254) | Chinese | 8 | 27 | RST1a,b,c RST2 RST4a,b | Items dropped or omitted: PCW3, PCW4, PCW5, PPW3 RW scale: RST3a, RST3b | χ2 = nr | AIC = 763 BIC = nr | CFI = 0.90 TLI = 0.88 | RMSEA = 0.06 SRMR = nr |
| Nowicka et al. (2014) [31] | Mothers of 4-year-old children living in Sweden (n = 564) | Swedish | 7 | 23 | RST1a,b,c (avg) RST2 RST4a,b (avg) | Items dropped or omitted: PCW4, PCW5, RST3a, RST3b PPW1 ~~ PPW2 PCW1 ~~ PCW2 PE3 ~~ PE4 | χ2 = 345 | AIC = nr BIC = nr | CFI = 0.96 TLI = 0.94 | RMSEA = 0.04 SRMR = 0.05 |
| Kong et al. (2014) [26] | Low-income Hispanic and African American mothers of 2- to 5-year-old children (n = 962) | English | 6 | 20 | RST1a,b,c RST2 RST4a,b | Scales dropped or omitted: PCW, PPW Items dropped or omitted: PR1, PR4 RW scale: RST3a, RST3b | χ2 = 686 ** | AIC = nr BIC = nr | CFI = 0.95 TLI = 0.94 | RMSEA = 0.06 SRMR = nr |
| Canals-Sans et al. (2016) [33] | Parents of 6- to 10-year-old children living in Spain (n = 960) | Spanish | 7 | 29 | 8 items | Items dropped or omitted: PCW5, PCW6 RST1a ~~ RST1b PCW2 ~~ PCW3 PCW1 ~~ RST3a PCW1 ~~ RST3b | χ2 = 766 ** | AIC = nr BIC = nr | CFI = 0.94 TLI = 0.94 | RMSEA = 0.04 SRMR = 0.05 |
| Schmidt et al. (2017) [34] | Mothers of 2- to 13-year-old children living in Germany (n = 982) | German | 8 | 26 | RST1a,b,c RST2 RST4a,b | Items dropped or omitted: PCW4, PCW5 RW scale: RST3a, RST3b PPW1 ~~ PPW2 PPW2 ~~ PPW3 PPW3 ~~ PPW4 PCW1 ~~ PCW2 PCW2 ~~ PCW3 | χ2 = 729 * | AIC = 945 BIC = nr | CFI = 0.96 TLI = 0.94 | RMSEA = 0.05 SRMR = na |
| Mosli (2020) [35] | Mothers of pre-school children living in Saudi Arabia (n = 209) | Arabic | 7 | 29 | 8 items | - | χ2 = 257 ** | AIC = nr BIC = nr | CFI = 0.97 TLI = 0.96 | RMSEA = 0.02 SRMR = 0.07 |
| Present paper | Black mothers of 6- to 12-year-old children living in Canada (n = 136) | French | 7 | 21 | RST1a,b,c RST2 RST4a,b | Items omitted: PCW4, PCW5, PPW1–3 Items dropped: RST3a, RST3b | χ2 = 170 (151) | AIC = 7754 BIC = 7734 | CFI = 0.96 TLI = 0.96 | RMSEA = 0.03 SRMR = 0.06 |
| Items—English Version | Items—French Translation | Answer Choices | |
|---|---|---|---|
| 1. Perceived responsibility (PR) | 1. Responsabilité perçue | ||
| PR1: When your child is at home, how often are you responsible for preparing his/her meals? PR2: How often are you responsible for deciding what your child’s portion sizes are? PR3: How often are you responsible for deciding if your child has eaten the type/right kind of food? | PR1: Lorsque votre enfant est à la maison, à quelle fréquence êtes-vous responsable de le/la nourrir ? PR2: À quelle fréquence êtes-vous responsable de décider la grosseur des portions de votre enfant ? PR3: À quelle fréquence êtes-vous responsable de décider si votre enfant a mangé les bons types d’aliments ? | 1 = Never 2 = Rarely 3 = Half of the time 4 = Most of the time 5 = Always | 1 = Jamais 2 = Rarement 3 = La moitié du temps 4 = La plupart du temps 5 = Toujours |
| 2. Perceived parent weight (PPW) | 2. Poids perçu du parent | ||
| How would you rate your weight? PPW1: During childhood (5 to 10 y) PPW2: During adolescence PPW3: In your 20′s PPW4: Now | Comment classifieriez-vous votre poids ? PPW1: Pendant l’enfance (5 à 10 ans) PPW2: Pendant l’adolescence PPW3: Pendant la vingtaine PPW4: Présentement | 1 = Very underweight 2 = Underweight 3 = Normal 4 = Overweight 5 = Very overweight | 1 = Très maigre (sous-poids) 2 = Maigre (sous-poids) 3 = Normal 4 = En surpoids 5 = Très en surpoids |
| 3. Perceived child’s weight (PCW) | 3. Poids perçu de l’enfant | ||
| How would you rate your child’s weight at these stages? PCW1: First year of life PCW2: Toddler (1 to 2 y) PCW3: Kindergarten (3 to 5 y) PCW4: Kindergarten–2nd grade PCW5: 3rd–5th grade PCW6: 6th–8th grade | Comment classifierez-vous les poids de votre enfant lors de ces périodes ? PCW1: Première année de vie PCW2: Lorsqu’il avait 1–2 ans (bambin) PCW3: Lorsqu’il avait 4–5 ans (pendant la maternelle et le jardin d’enfant) PCW4: Entre la maternelle et la 2e année PCW5: Entre la 3e et la 5e année PCW6: Entre la 6e et la 8e année | 1 = Very underweight 2 = Underweight 3 = Normal 4 = Overweight 5 = Very overweight | 1 = Très maigre (sous-poids) 2 = Maigre (sous-poids) 3 = Normal 4 = En surpoids 5 = Très en surpoids |
| 4. Concern about child’s weight (CCW) | 4. Préoccupation au sujet du poids de l’enfant | ||
| CCW1: How concerned are you about your child eating too much when you are not around? CCW2: How concerned are you that your child will have to diet to maintain a desirable weight? CCW3: How concerned are you about your child being overweight in the future? | CCW1: À quel point êtes-vous préoccupée par le fait que votre enfant mange trop lorsque vous n’êtes pas là ? CCW2: À quel point êtes-vous préoccupée par l’idée que votre enfant devra suivre un régime ou une diète pour maintenir un poids désirable ? CCW3: À quel point êtes-vous préoccupée par l’idée que votre enfant soit en surpoids dans le futur ? | 1 = Not concerned 2 = A little concerned 3 = Concerned 4 = Fairly concerned 5 = Very concerned | 1 = Pas préoccupée 2 = Un peu préoccupée 3 = Préoccupée 4 = Assez préoccupée 5 = Très préoccupée |
| 5. Restriction (RST) | 5. Restriction | ||
| RST1a: I have to make sure that my child does not eat too many sweets (candy, ice-cream, cake, or pastries). RST1b: I have to make sure that my child does not eat too many high-fat foods. RST1c: I have to make sure that my child does not eat too many of his/her favorite foods. RST2: I intentionally keep some foods out of my child’s reach. RST3a: I offer sweets (candy, ice-cream, cake, or pastries) to my child as a reward for good behavior. RST3b: I offer my child his/her favorite foods as a reward for good behavior. RST4a: If I did not guide or regulate my child’s eating, he/she would eat too many junk food (pizza, fries, poutine, hot-dogs). RST4b: If I did not guide or regulate my child’s eating, he/she would eat too many of his favorite foods. | RST1a: Je dois m’assurer que mon enfant ne mange pas trop de sucreries (bonbons, crème glacée, gâteau ou pâtisserie). RST1b: Je dois m’assurer que mon enfant ne mange pas trop d’aliment à haute teneur en gras. RST1c: Je dois m’assurer que mon enfant ne mange pas trop de ses aliments préférés. RST2: Je garde intentionnellement certains aliments hors de portée de mon enfant. RST3a: J’offre des sucreries (bonbons, crème glacée, gâteau, pâtisserie) à mon enfant pour le récompenser d’un bon comportement. RST3b: J’offre à mon enfant ses aliments préférés en échange d’un bon comportement. RST4a: Si je ne guidais pas ou que je ne contrôlais pas l’alimentation de mon enfant, il/elle mangerait trop de malbouffe (pizza, frites, poutines, hot dog). RST4b: Si je ne guidais pas ou que je ne contrôlais pas l’alimentation de mon enfant, il/elle mangerait trop de ses aliments préférés. | 1 = Disagree 2 = Slightly disagree 3 = Neutral 4 = Slightly disagree 5 = Agree | 1 = En désaccord 2 = Un peu en désaccord 3 = Neutre 4 = Un peu en accord 5 = En accord |
| 6. Pressure to eat (PE) | 6. Pression pour manger | ||
| PE1: My child should always eat all the food in his/her plate. PE2: I have to be especially careful to make sure my child eats enough. PE3: If my child says “I am not hungry”, I try to get him/her to eat anyway. PE4: If I did not guide or regulate my child’s eating, he/she would eat much less than he/she should. | PE1: Mon enfant devrait toujours manger tout ce qu’il y a dans son assiette. PE2: Je dois porter une attention particulière pour m’assurer que mon enfant mange assez. PE3: Si mon enfant dit “Je n’ai pas faim”, j’essaie de le/la faire manger quand même. PE4: Si je ne guidais pas ou que je n’encadrais pas l’alimentation de mon enfant, il/elle mangerait beaucoup moins qu’il/elle le devrait. | 1 = Disagree 2 = Slightly disagree 3 = Neutral 4 = Slightly disagree 5 = Agree | 1 = En désaccord 2 = Un peu en désaccord 3 = Neutre 4 = Un peu en accord 5 = En accord |
| 7. Monitoring (MN) | 7. Surveillance | ||
| MN1: How much do you keep track of the sweets (candy, ice cream, cake, pastries) your child eats? MN2: How much do you keep track of the snack food (potato chips, Doritos, or cheese puffs) your child eats? MN3: How much do you keep track of the high-fat foods your child eats? | MN1: À quelle fréquence surveillez-vous les sucreries (bonbons, crème glacée, gâteau, pâtisserie) que votre mange ? MN2: À quelle fréquence surveillez-vous les grignotines (chips, Doritos, crottes de fromage) que votre enfant mange ? MN3: À quelle fréquence surveillez-vous les aliments à haute teneur en gras que votre enfant mange ? | 1 = Never 2 = Rarely 3 = Sometimes 4 = Mostly 5 = Always | 1 = Jamais 2 = Rarement 3 = Parfois 4 = Souvent 5 = Toujours |
| M | Description | χ2 | df | AIC 1 | BIC 1 | CFI2 | TLI 2 | RMSEA 3 | SRMR 4 |
|---|---|---|---|---|---|---|---|---|---|
| 1 | 7-factor, 25-item model | 456.5 *** | 257 | 10,278 | 10,549 | 0.731 | 0.686 | 0.077 | 0.098 |
| 2 | 7-factor, 21-item (3 composite items) model | 232.4 ** | 171 | 8263 | 8242 | 0.889 | 0.864 | 0.052 | 0.070 |
| 3 | 7-factor, 21-item (3 composite items) model 1 error covariance | 198.7 ns | 170 | 8229 | 8209 | 0.948 | 0.936 | 0.035 | 0.065 |
| 4 | 7-factor, 23-item (RST3a and RST3b removed) model | 377.1 *** | 212 | 9197 | 9175 | 0.764 | 0.718 | 0.078 | 0.096 |
| 5 | 7-factor, 20-item (2 composite items; RST3a and RST3b removed) model | 204.0 ** | 152 | 7782 | 7762 | 0.903 | 0.878 | 0.051 | 0.069 |
| 6 | 7-factor, 20-item (2 composite items; RST3a and RST3b removed) model 1 error covariance | 170.7 ns | 151 | 7748 | 7729 | 0.963 | 0.954 | 0.031 | 0.063 |
| 7 | 8-factor, 25-item model | 432.5 *** | 251 | 10,266 | 10,242 | 0.754 | 0.706 | 0.075 | 0.094 |
| 8 | 8-factor, 22-item (2 composite items) model | 247.0 ** | 185 | 8848 | 8825 | 0.891 | 0.864 | 0.050 | 0.070 |
| 9 | 8-factor, 22-item (2 composite items) model 1 error covariance | 212.6 ns | 184 | 8814 | 8791 | 0.950 | 0.937 | 0.034 | 0.066 |
| Mothers’ Characteristics (n = 136) | |
|---|---|
| Age (years) * | 39.1 ± 5.7 |
| Immigration status (%, yes) | 94.1 |
| Time since immigration (years) *Ɨ | 8.8 ± 8.1 |
| Region of birth (%) | |
| Sub-Saharan Africa | 61.0 |
| The Caribbean | 33.1 |
| Canada | 5.9 |
| Education level (%) | |
| Less than high school diploma | 2.9 |
| High school diploma or equivalent | 8.1 |
| College certificate or diploma | 41.9 |
| Undergraduate university certificate or bachelor’s degree | 33.8 |
| Graduate university certificate or degree | 13.2 |
| Matrimonial status (%) | |
| With partner | 66.2 |
| Single | 33.8 |
| BMI (kg/m2) *ǂ | 30.0 ± 5.3 |
| Weight status (%) ǂ | |
| Underweight 1 and normal weight | 17.7 |
| Overweight | 35.4 |
| Obesity | 46.9 |
| Children’s Characteristics (n = 136) | |
| Age (years) * | 8.8 ± 2.0 |
| Sex (%, girls) | 48.5 |
| BMI z-score *¥ | 0.84 ± 1.1 |
| Weight status (%) ¥ | |
| Underweight and normal weight | 64.9 |
| Overweight | 17.9 |
| Obesity | 17.2 |
| Item | Mean | Median (IQR) | Kurtosis | Skewness | Cronbach α | Macdonald’s ω |
|---|---|---|---|---|---|---|
| PR1 | 4.58 | 5.00 (4.00–5.00) | 2.25 | −1.78 | 0.57 | 0.60 |
| PR2 | 3.68 | 4.00 (3.00–5.00) | −0.89 | −0.71 | ||
| PR3 | 4.50 | 5.00 (4.00–5.00) | 4.84 | −2.22 | ||
| PPW4 | 3.54 | 3.00 (3.00–4.00) | −0.35 | 0.39 | - | - |
| PCW1 | 3.02 | 3.00 (3.00–3.00) | −0.55 | 3.62 | 0.68 | 0.78 |
| PCW2 | 3.03 | 3.00 (3.00–3.00) | −0.41 | 5.54 | ||
| PCW3 | 2.94 | 3.00 (3.00–3.00) | −1.41 | 7.23 | ||
| CCW1 | 1.96 | 1.00 (1.00–3.00) | 1.18 | 0.07 | 0.79 | 0.79 |
| CCW2 | 2.15 | 1.00 (1.00–3.00) | 0.95 | −0.64 | ||
| CCW3 | 2.45 | 2.00 (1.00–4.00) | 0.57 | −1.32 | ||
| RST1A | 4.50 | 5.00 (5.00–5.00) | −2.35 | 4.00 | 0.66 | 0.79 |
| RST1B | 4.15 | 5.00 (5.00–5.00) | −2.29 | 4.07 | ||
| RST1C | 4.02 | 5.00 (3.75–5.00) | −1.23 | 0.19 | ||
| RST1.AV | 4.34 | 4.67 (4.00–5.00) | −1.70 | 2.49 | ||
| RST2 | 3.65 | 5.00 (1.00–5.00) | −0.68 | −1.45 | ||
| RST3A | 2.16 | 1.00 (1.00–4.00) | 0.82 | −1.17 | ||
| RST3B | 2.84 | 3.00 (1.00–5.00) | 0.07 | −1.85 | ||
| RST3.AV | 2.50 | 2.50 (1.00–3.00) | 0.40 | −1.14 | ||
| RST4A | 4.10 | 5.00 (4.00–5.00) | −1.32 | −0.14 | ||
| RST4B | 4.24 | 5.00 (4.00–5.00) | −1.57 | 0.77 | ||
| RST4.AV | 4.17 | 5.00 (3.88–5.00) | −1.45 | 0.66 | ||
| PE1 | 3.63 | 4.00 (2.00–5.00) | −0.72 | −1.24 | 0.64 | 0.70 |
| PE2 | 4.46 | 5.00 (5.00–5.00) | −2.18 | 3.05 | ||
| PE3 | 3.34 | 4.00 (1.00–5.00) | −0.40 | −1.66 | ||
| PE4 | 3.63 | 5.00 (1.00–5.00) | −0.67 | −1.43 | ||
| MN1 | 3.99 | 4.00 (3.00–5.00) | −1.00 | −0.06 | 0.80 | 0.82 |
| MN2 | 3.88 | 4.00 (3.00–5.00) | −0.93 | −0.13 | ||
| MN3 | 4.03 | 4.00 (3.00–5.00) | −1.14 | 0.26 |
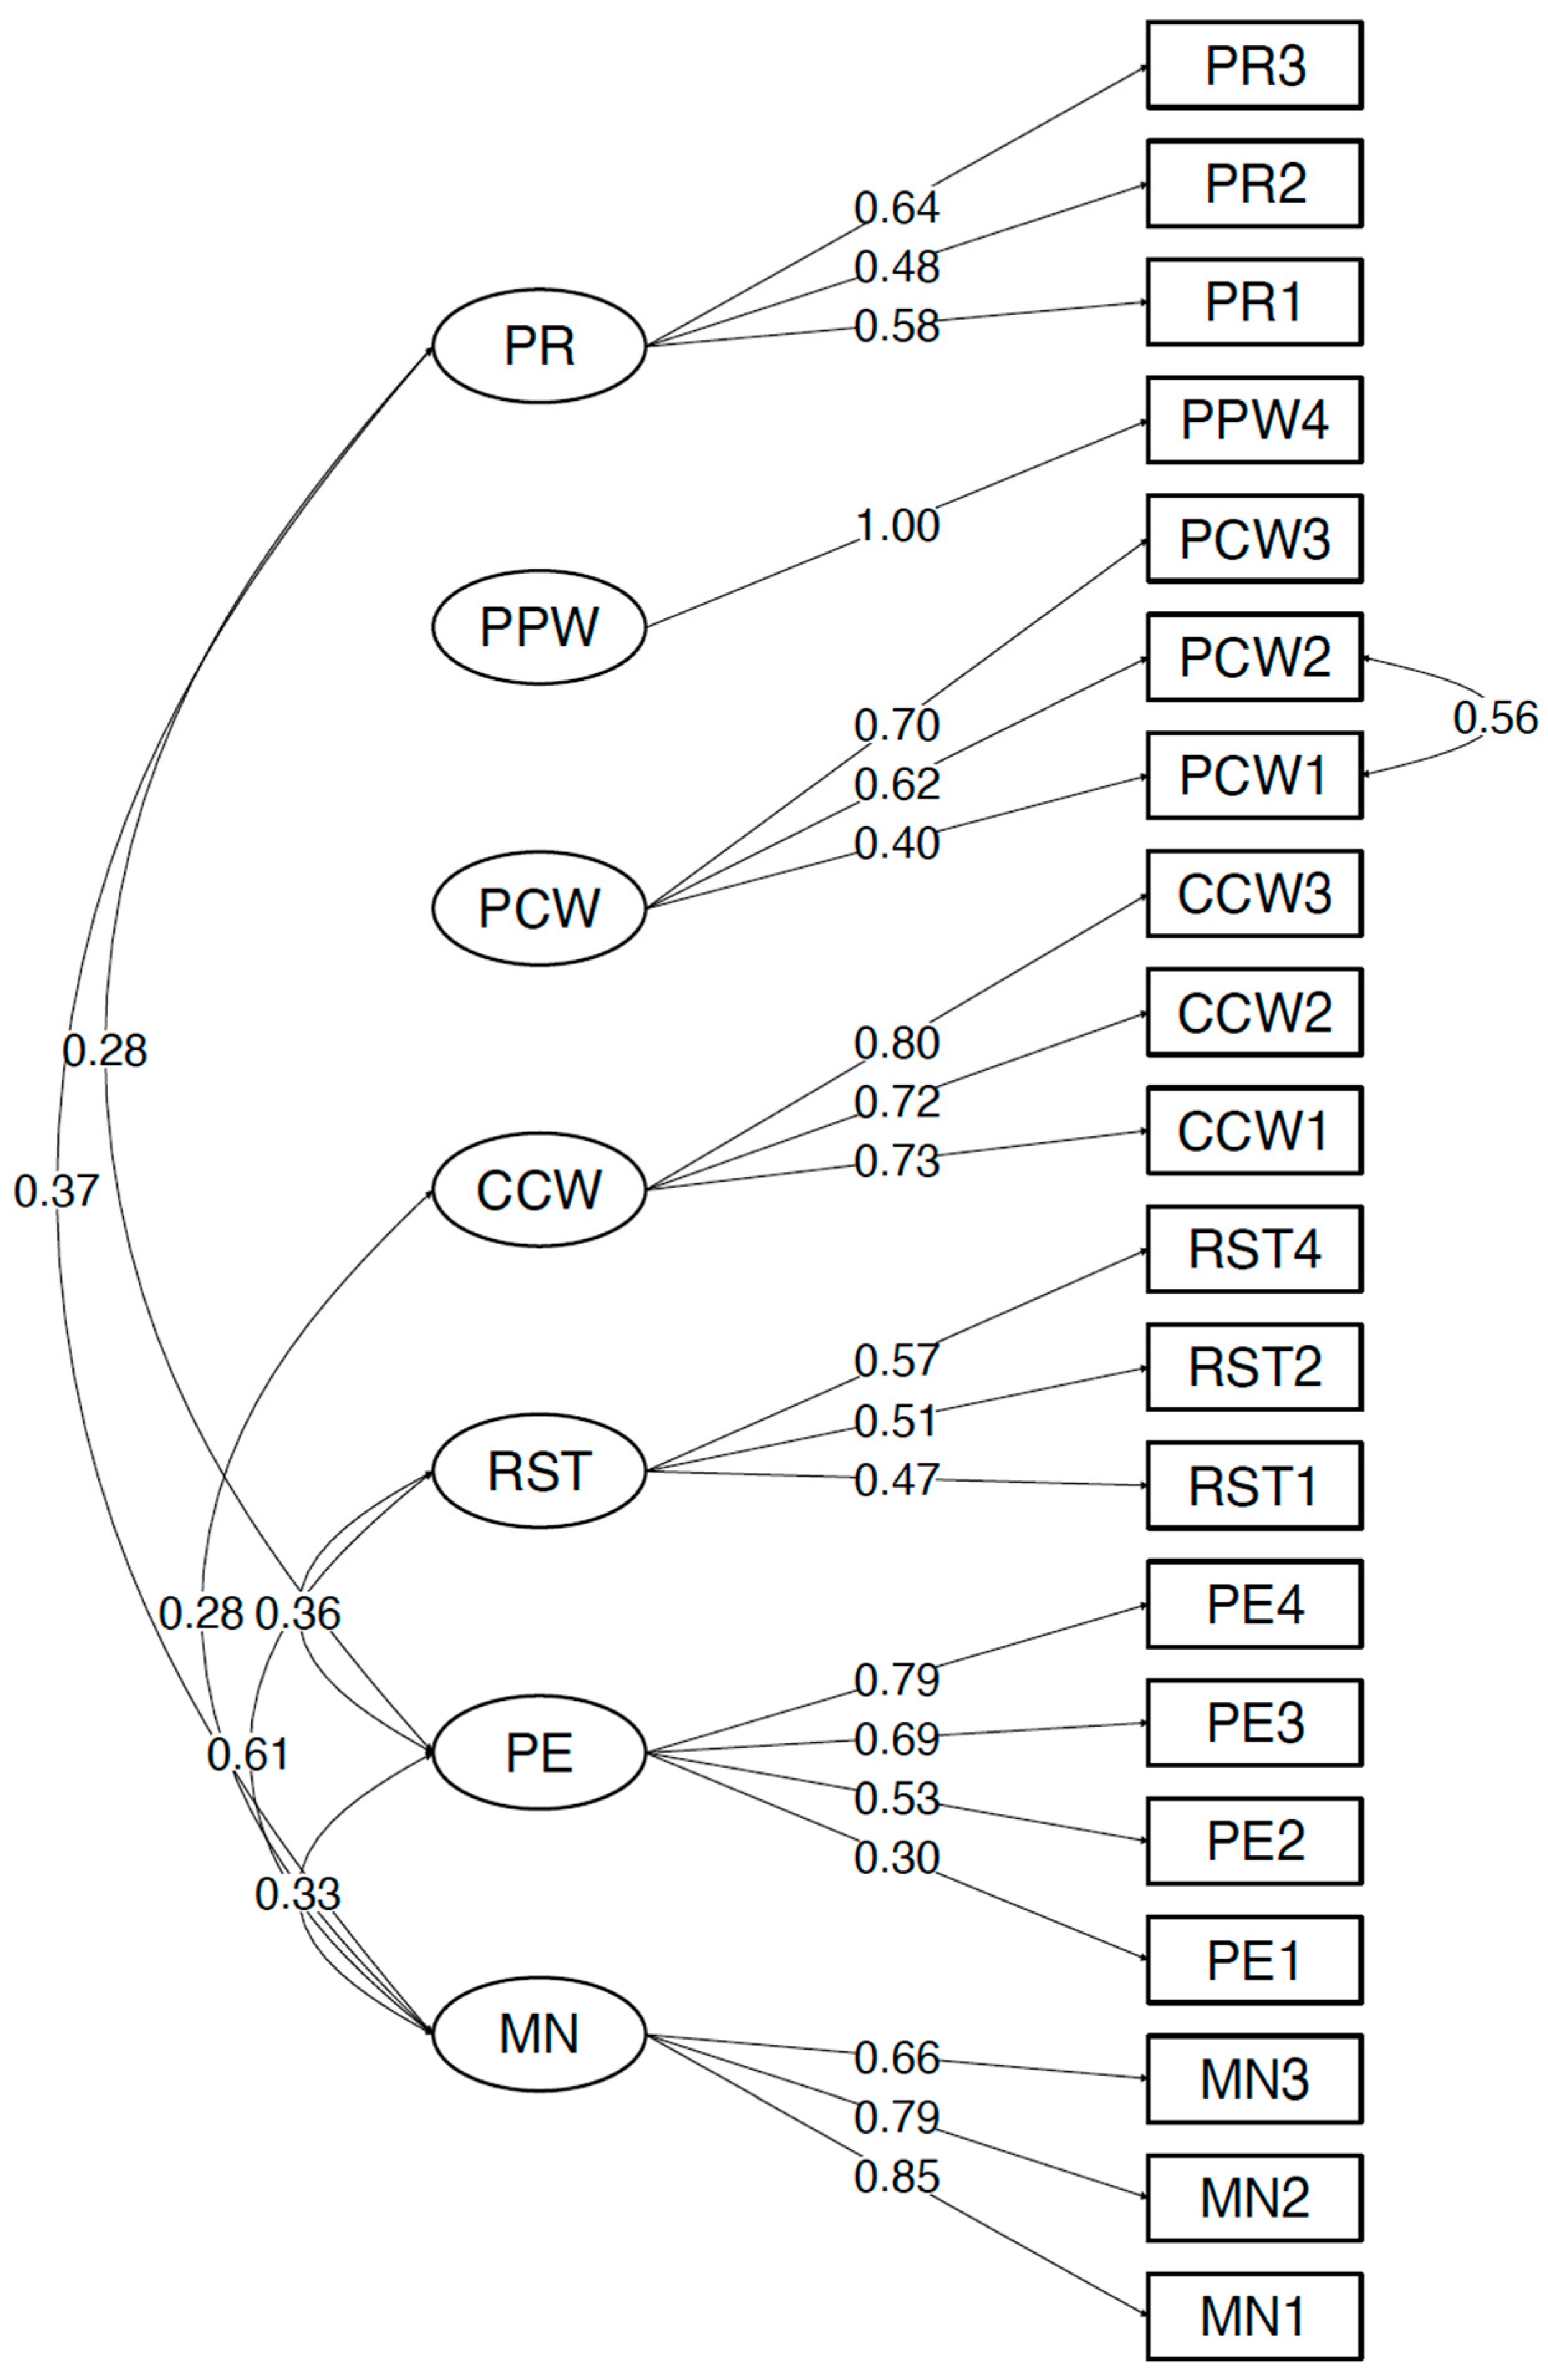
| CFQ Subscales and Items | PR | PPW | PCW | CCW | RST | PE | MN |
|---|---|---|---|---|---|---|---|
| PR | 1.000 | 0.006 | −0.187 | 0.015 | 0.236 | 0.283 * | 0.374 * |
| PR1 | 0.58 ** | ||||||
| PR2 | 0.48 ** | ||||||
| PR3 | 0.64 ** | ||||||
| PPW | 1.000 | −0.147 | 0.028 | 0.079 | −0.260 * | −0.001 | |
| PCW | 1.000 | 0.179 | −0.023 | −0.072 | 0.015 | ||
| PCW1 | 0.40 ** | ||||||
| PCW2 | 0.62 ** | ||||||
| PCW3 | 0.70 ** | ||||||
| CCW | 1.000 | 0.237 | 0.044 | 0.283 ** | |||
| CCW1 | 0.73 *** | ||||||
| CCW2 | 0.72 *** | ||||||
| CCW3 | 0.80 *** | ||||||
| RST | 1.000 | 0.361 ** | 0.613 ** | ||||
| RST1 | 0.47 ** | ||||||
| RST2 | 0.51 ** | ||||||
| RST4 | 0.57 ** | ||||||
| PE | 1.000 | 0.330 ** | |||||
| PE1 | 0.30 ** | ||||||
| PE2 | 0.53 ** | ||||||
| PE3 | 0.69 ** | ||||||
| PE4 | 0.79 ** | ||||||
| MN | 1.000 | ||||||
| MN1 | 0.85 *** | ||||||
| MN2 | 0.79 *** | ||||||
| MN3 | 0.66 *** |
Disclaimer/Publisher’s Note: The statements, opinions and data contained in all publications are solely those of the individual author(s) and contributor(s) and not of MDPI and/or the editor(s). MDPI and/or the editor(s) disclaim responsibility for any injury to people or property resulting from any ideas, methods, instructions or products referred to in the content. |
© 2023 by the authors. Licensee MDPI, Basel, Switzerland. This article is an open access article distributed under the terms and conditions of the Creative Commons Attribution (CC BY) license (https://creativecommons.org/licenses/by/4.0/).
Share and Cite
Bodnaruc, A.M.; Kengneson, C.-C.; Blanchet, R.; Giroux, I. Assessing the Validity and Reliability of a French Version of the Child Feeding Questionnaire among Black Mothers Living in Ottawa (Canada). Behav. Sci. 2023, 13, 487. https://doi.org/10.3390/bs13060487
Bodnaruc AM, Kengneson C-C, Blanchet R, Giroux I. Assessing the Validity and Reliability of a French Version of the Child Feeding Questionnaire among Black Mothers Living in Ottawa (Canada). Behavioral Sciences. 2023; 13(6):487. https://doi.org/10.3390/bs13060487
Chicago/Turabian StyleBodnaruc, Alexandra M., Cris-Carelle Kengneson, Rosanne Blanchet, and Isabelle Giroux. 2023. "Assessing the Validity and Reliability of a French Version of the Child Feeding Questionnaire among Black Mothers Living in Ottawa (Canada)" Behavioral Sciences 13, no. 6: 487. https://doi.org/10.3390/bs13060487
APA StyleBodnaruc, A. M., Kengneson, C.-C., Blanchet, R., & Giroux, I. (2023). Assessing the Validity and Reliability of a French Version of the Child Feeding Questionnaire among Black Mothers Living in Ottawa (Canada). Behavioral Sciences, 13(6), 487. https://doi.org/10.3390/bs13060487