
Research on the Factors Affecting the Adoption of Smart Aged-Care Products by the Aged in China: Extension Based on UTAUT Model


Abstract
1. Introduction
1.1. Research Background
1.2. Research Purpose
2. Literature Research
2.1. Smart Aged-Care Products
2.2. Research Status of Smart Aged-Care Products
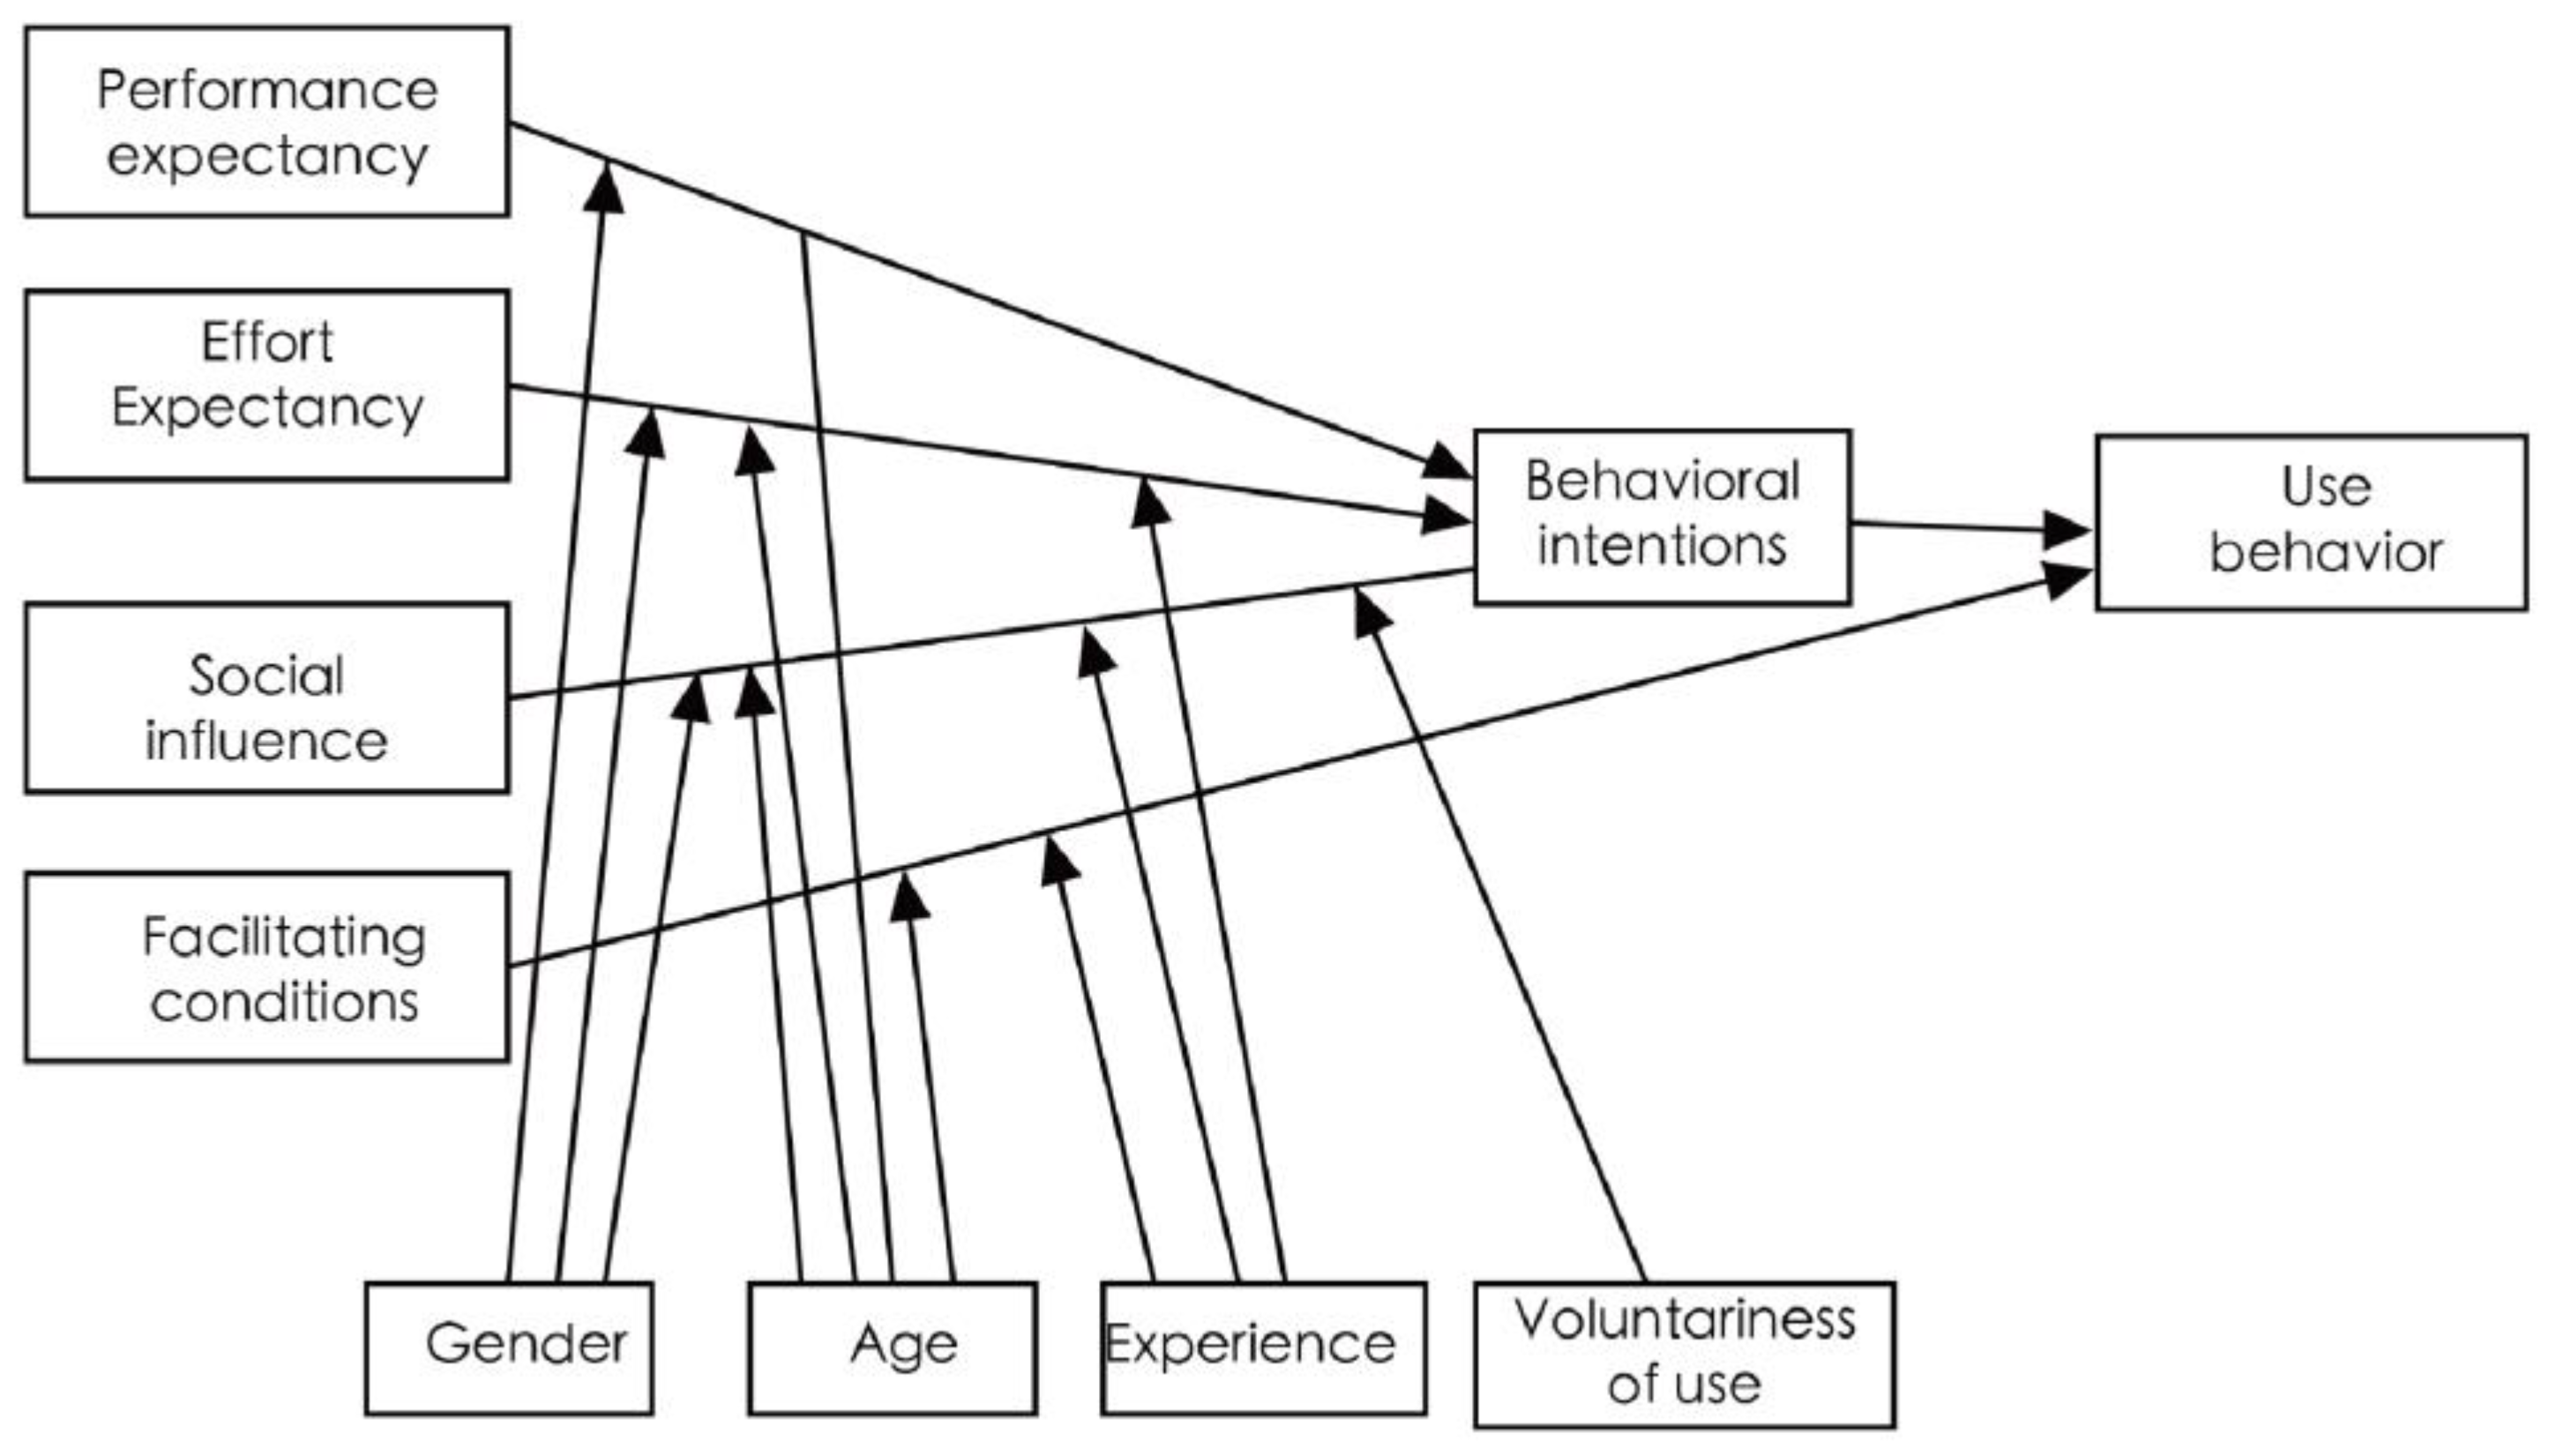
2.3. UTAUT Model
2.4. Perceived Cost
2.5. Perceived Risk
3. Research Hypothesis and Methodology
3.1. Research Hypothesis
3.1.1. Relationship between Performance Expectations and Behavioral Intentions
3.1.2. Relationship between Effort Expectation and Behavioral Intention
3.1.3. Relationship between Social Influence and Behavioral Intention
3.1.4. Relationship between Facilitating Conditions and Use Behavior
3.1.5. Relationship between Behavioral Intention and Use Behavior
3.1.6. Relationship between Perceived Cost and Behavioral Intention
3.1.7. Relationship between Perceived Risk and Behavioral Intention and Use Behavior
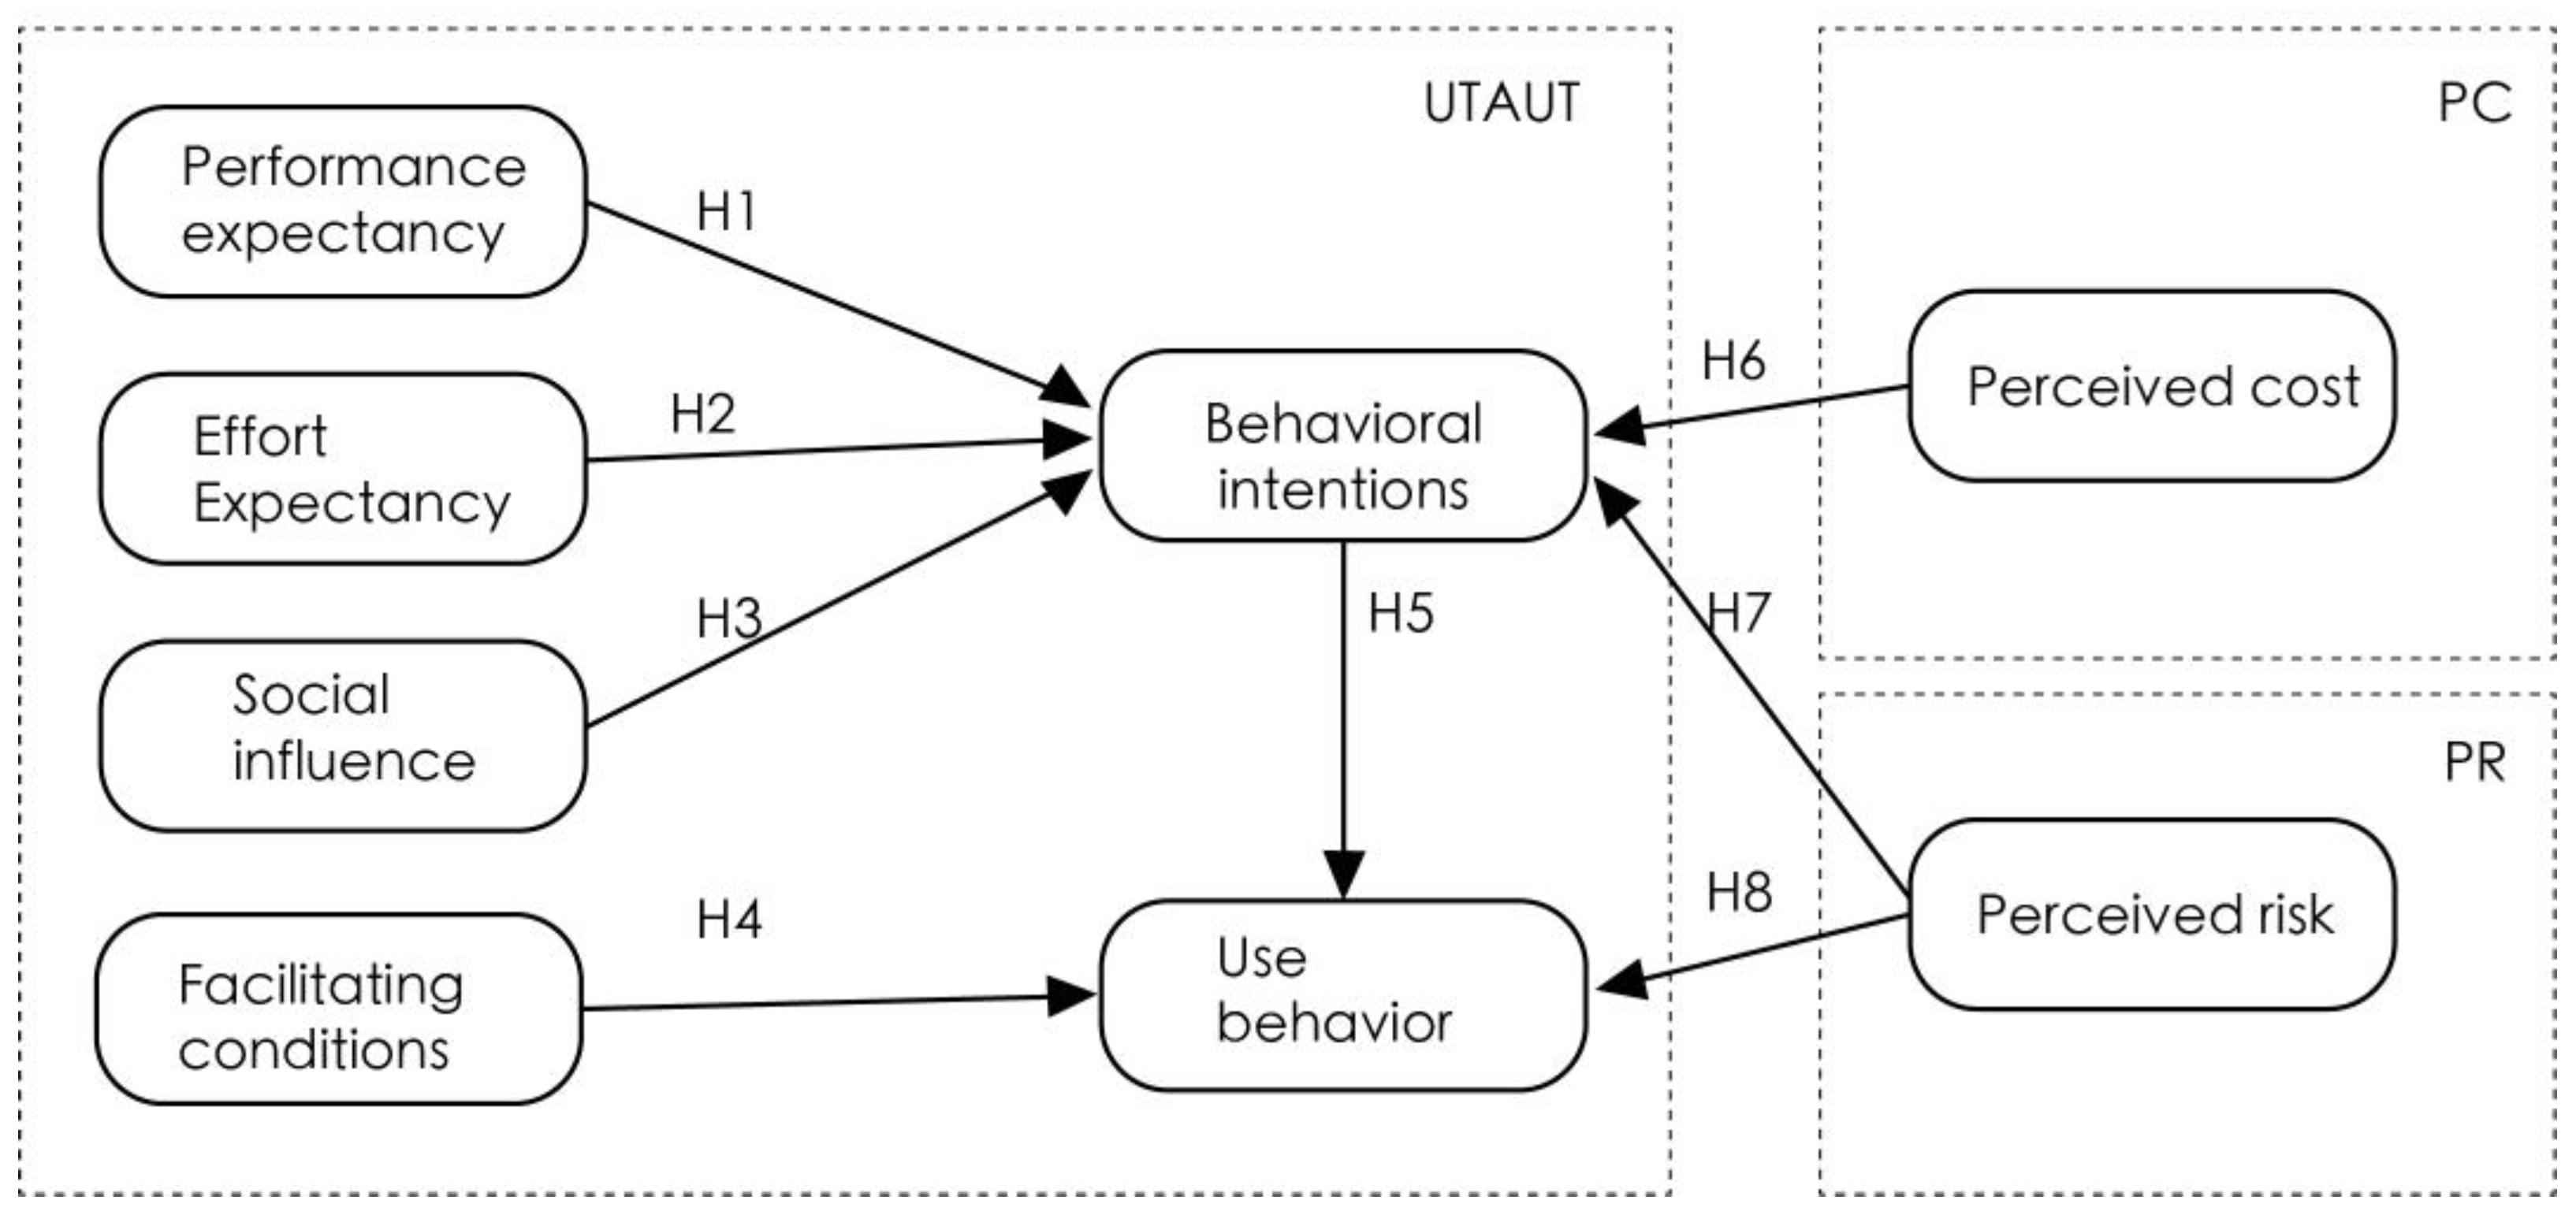
3.2. Research Structure
3.3. Definition and Measurement of Variables
4. Data and Methods
4.1. Questionnaire Survey
4.2. Sample and Data Collection
4.3. Validity Analysis
4.3.1. KMO and Bartlett Tests
4.3.2. Exploratory Factor Analysis
4.4. Measurement Model
4.4.1. Convergent Validity
4.4.2. Discriminant Validity
4.5. Structural Model Analysis
4.5.1. Model Fit Criteria
4.5.2. Path Analysis
4.6. Hypothesis Explanation
4.7. Results and Discussion
- (1)
- Performance expectations have a positive effect on behavioral intentions, which result is consistent with previous findings [32,33,34,35,36]. The performance expectation factor has the largest effect other than behavioral intention, and Sun et al. [74] showed that the higher the performance expectation, the stronger the willingness to use, which verifies the UTAUT model. This indicates that seniors will be willing to adopt smart aged-care products when they think they can improve the services available to them. Therefore, considering seniors’ demands, the service providers should introduce personalized services in addition to the basic functions, targeted to improve the use expectations of the aged [39].
- (2)
- Effort expectancy has a positive effect on behavioral intention, which finding is consistent with those of previous studies [23,27,47,48], indicating that the aged are more willing to adopt smart aged-care products when they are perceived as easy to use. It can be seen that the ease of use of smart aged-care products is a key concern for service providers, who should provide services that are as convenient and easy-to-use as possible. In view of the problem that the aged do not have sufficient skills to use smart aged-care products and that they are not easy to use, it is necessary to increase the diversification of smart aged-care products and services, and thus develop smart aged-care products that are more suitable for use.
- (3)
- Social influence has a positive impact on behavioral intention, which result is consistent with previous findings [12,21,50,51], suggesting that when the aged individual perceives a higher level of acceptance of smart aged-care products among those around them, their intention to adopt will rise. At present, the aged generally have a low level of understanding of smart aged-care products, and few have actually used and experienced them [75]. Chen et al. [76] argued that there are few channels for smart aged-care product use, leading to a relatively low degree of willingness to use and a lower frequency of use behavior amongst the aged. Society has not yet developed sufficient motivation to encourage aged groups to accept and use advanced technology. This means that service providers should pay more attention to their own approaches to publicity, as an increase in social recognition can enhance the trust of users and thus improve their willingness to use.
- (4)
- There is no significant effect of facilitating conditions on the use behavior of smart aged-care products among the elderly. This result is inconsistent with those of previous studies [23,52,53,77], and indicates that China has not yet developed the necessary resources to support the use of smart aged-care products amongst the elderly. (1) The current Chinese government and other concerned organizations seek to assist the aged mainly via economic benefits and donations, which do not contribute to their use of smart aged-care products; (2) instead of individually targeted services, the care-related actions of family members, communities and volunteers are more focused on short-period companionship and care, and thus fail to develop the necessary recourses that will support the systematic use of smart aged-care products; (3) instead of developing follow-up support services, such enterprises prefer to focus on sales in relation to short-term interests. As they age, people undergo physiological and psychological changes, which cause their learning ability and attention to gradually decline [78]. At the same time, the aged perceive internet technologies as high-tech products that require a whole new body of knowledge to navigate. Therefore, technophobia is common [79]. This requires the government, market, community, and family members to develop better resources, enhance technical support and usage knowledge, and develop more inclusive products. This will help in offering the timely assistance required when aged people use smart aged-care products. In relation to this, the government could encourage family members to bear more responsibilities in relation to the smart education of the aged. Both communities and public service organization should provide the aged with more targeted services related to education on the use of smart aged-care products; the service organizations concerned may even prepare some accessible literature instructing on the use of smart aged-care products, thus making information resources and assistance accessible when necessary. Furthermore, enterprises must establish complete service systems for smart aged-care products, and provide the aged users with training, maintenance, and product-upgrading services, thus enhancing the healthcare services that use smart aged-care products.
- (5)
- Behavioral intention has the greatest positive influence on use behavior, which is consistent with previous findings [32,44]. It has been indicated that positive behavioral intention can promote use behavior among the aged. Gamma et al. [80] concluded that behavioral intention and use behavior are highly correlated. Behavioral intention is constructed from the senior user’s own experience, cognitive abilities, and needs to be met by the care services. Therefore, in order to improve the use behavior of seniors, it is necessary to improve their behavioral intention, increase their relevant experience, improve their cognitive abilities in relation to the use of smart aged-care products, and meet their care needs in a targeted manner in order to help develop a positive attitude toward smart aged-care products.
- (6)
- Perceived cost has a negative impact on behavioral intention, which result is consistent with previous findings [31,34,55,56]. It has been indicated that factors such as excessive monetary, learning and time costs significantly reduce the behavioral intention of the aged to use smart aged-care products. Smart aged-care products, as information technology-based products, are more expensive than typical products, and policy and financial support from the government is required in order to reduce the associated costs. At the same time, service providers are required to improve the user-friendliness of their smart aged-care products in order to reduce the associated learning and time costs.
- (7)
- Perceived risk is negatively related to the behavioral intention of the aged to adopt smart aged-care products, which result is consistent with previous findings [36,39]. However, perceived risk is not significantly related to use behavior, which is inconsistent with previous findings [40,57]. It has been indicated that the risks perceived by the aged have a negative impact on their behavioral intention to adopt smart aged-care products, and also indirectly influence use behavior. This can be explained with reference to the dimension of use behavior and the measurement items selected in this study. Related to the rapid growth and application of internet technology, the use of smart aged-care products is emerging as a trend that is making later life much safer, more convenient, and more comfortable. However, the aged tend to be concerned about risks such as the security of use and privacy breaches when using smart aged-care products, and these risks influence their related behavioral intentions. The strengthening of security assurances related to smart aged-care products will help to establish a sense of trust and safety amongst the aged in relation to smart aged-care products, thus enhancing their use behavior. The government is duty-bound to set up security systems concerning at smart aged-care products, form security supervision mechanisms in collaboration with judicial and public safety departments for the joint consideration of network information security issues and ensure both the personal and financial security of the aged during their use of smart aged-care products.
5. Conclusions
5.1. Theoretical Contribution
5.2. Practical Contribution
6. Limitations and Future Prospects
Author Contributions
Funding
Institutional Review Board Statement
Informed Consent Statement
Data Availability Statement
Conflicts of Interest
References
- Ge, Y.F.; Wang, L.J.; Feng, W.M.; Zhang, B.Z.; Liu, S.L.; Ke, Y.H. Challenges and strategic choices of healthy aging in China. J. Manag. World 2020, 36, 86–96. [Google Scholar]
- Devlin, A.S. Wayfinding in Healthcare Facilities: Contributions from Environmental Psychology. Behav. Sci. 2014, 4, 423–436. [Google Scholar] [CrossRef] [PubMed]
- Yang, Q.H.; Feng, Y. Study on seniors’ willingness to use smart eldercare devices: Based on the UTAUT model. Sci. Res. Aging 2020, 8, 18–31. [Google Scholar]
- Liu, H.L. Trends of Population Aging in China and the World as a Whole. Sci. Res. Aging 2021, 9, 1–16. [Google Scholar]
- Liu, J.H. Environmental analysis and path thinking on the development of regional elderly care industry: A case study of Nantong. China J. Commer. 2018, 1, 134–138. [Google Scholar]
- Wu, X. The development trend, practical difficulties and optimization path of smart elderly care industry. East. China Econ. Manag. 2021, 35, 1–9. [Google Scholar]
- Jeng, M.-Y.; Pai, F.-Y.; Yeh, T.-M. Antecedents for Older Adults’ Intention to Use Smart Health Wearable Devices-Technology Anxiety as a Moderator. Behav. Sci. 2022, 12, 114. [Google Scholar] [CrossRef]
- China Internet Network Information Center. China Statistical Report on Internet Development. Available online: http://www.gov.cn/xinwen/2021-02/03/content_5584518.htm (accessed on 13 October 2022).
- Pilotto, A.; D’Onofrio, G.; Benelli, E.; Zanesco, A.; Cabello, A.; Margelí, M.C.; Wanche-Politis, S.; Seferis, K.; Sancarlo, D.; Kilias, D. Information and communication technology systems to improve quality of life and safety of Alzheimer’s disease patients: A multicenter international survey. J. Alzheimer’s Dis. 2011, 23, 131–141. [Google Scholar] [CrossRef]
- Chan, M.; Campo, E.; Estève, D.; Fourniols, J.Y. Smart homes—Current features and future perspectives. Maturitas 2009, 64, 90–97. [Google Scholar] [CrossRef]
- Faucounau, V.; Wu, Y.H.; Boulay, M.; Maestrutti, M.; Rigaud, A.S. Caregivers’ requirements for in-home robotic agent for supporting community-living elderly subjects with cognitive impairment. Technol. Health Care 2009, 17, 33–40. [Google Scholar] [CrossRef]
- Hoque, R.; Sorwar, G. Understanding factors influencing the adoption of mHealth by the elderly: An extension of the UTAUT model. Int. J. Med. Inf. 2017, 101, 75–84. [Google Scholar] [CrossRef]
- Wei, M. The positioning, shortcomings and development countermeasures of the smart elderly care industry of China. Theory J. 2021, 3, 143–149. [Google Scholar] [CrossRef]
- Meyer, G.G.; Främling, K.; Holmström, J. Intelligent products: A survey. Comput. Ind. 2009, 60, 137–148. [Google Scholar] [CrossRef]
- Zhang, Q.; Li, M.; Wu, Y. Smart home for elderly care: Development and challenges in China. BMC Geriatr. 2020, 20, 318. [Google Scholar] [CrossRef]
- Yu, M.; Rhuma, A.; Naqvi, S.M.; Wang, L.; Chambers, J. A posture recognition-based fall detection system for monitoring an elderly person in a smart home environment. IEEE Trans. Inf. Technol. Biomed. 2012, 16, 1274–1286. [Google Scholar]
- Ghosh, A.; Nag, S.; Gomes, A.; Gosavi, A.; Ghule, G.; Kundu, A.; Purohit, B.; Srivastava, R. Applications of Smart Material Sensors and Soft Electronics in Healthcare Wearables for Better User Compliance. Micromachines 2023, 14, 121. [Google Scholar] [CrossRef]
- Zak, M.; Sikorski, T.; Krupnik, S.; Wasik, M.; Grzanka, K.; Courteix, D.; Dutheil, F.; Brola, W. Physiotherapy Programmes Aided by VR Solutions Applied to the Seniors Affected by Functional Capacity Impairment: Randomised Controlled Trial. Int. J. Environ. Res. Public. Health 2022, 19, 6018. [Google Scholar] [CrossRef]
- Jia, M.X. Study on Improvement Countermeasures of HJ Company in Digital Health Service Platform Based on Smart Senior Care. Master’s Thesis, Zhejiang Sci-Tech University, Hangzhou, China, 2022. [Google Scholar] [CrossRef]
- Wang, S.J.; Li, H.; Wang, S.J. Study on Construction of Smart Pension Cloud Platform Based on Big Data Technology. Co-Oper. Econ. Sci. 2020, 636, 188–190. [Google Scholar] [CrossRef]
- Venkatesh, V.; Morris, M.G.; Davis, G.B.; Davis, F.D. User acceptance of information technology: Toward a unified view. MIS Q. 2003, 27, 425–478. [Google Scholar] [CrossRef]
- Davis, F.D. Perceived usefulness, perceived ease of use, and user acceptance of information technology. MIS Q. 1989, 13, 319–340. [Google Scholar] [CrossRef]
- Cimperman, M.; Brenčič, M.M.; Trkman, P. Analyzing older users’ home telehealth services acceptance behavior—Applying an Extended UTAUT model. Int. J. Med. Inform. 2016, 90, 22–31. [Google Scholar] [CrossRef] [PubMed]
- Tian, X.-F.; Wu, R.-Z. Determinants of the Mobile Health Continuance Intention of Elders with Chronic Diseases: An Integrated Framework of ECM-ISC and UTAUT. Int. J. Environ. Res. Public. Health 2022, 19, 9980. [Google Scholar] [CrossRef] [PubMed]
- Boontarig, W.; Chutimaskul, W.; Chongsuphajaisiddhi, V.; Papasratorn, B. Factors influencing the Thai elderly intention to use smartphone for e-Health services. In Proceedings of the 2012 IEEE Symposium on Humanities, Science and Engineering Research, Kuala Lumpur, Malaysia, 24–27 June 2012; pp. 479–483. [Google Scholar] [CrossRef]
- Chen, Y. Research on the Influencing Factors of Health Education Behavior of the Elderly Receiving Mobile Intelligent Terminals. Master’s Thesis, Hangzhou Normal University, Hangzhou, China, 2018. [Google Scholar]
- Mao, Y.; Li, D.L. A study on the influencing factors of smart elderly care users’ use behavior based on UTAUT model: A case study on “E-Touch” of Wuhan. E-Gov. 2015, 11, 99–106. [Google Scholar] [CrossRef]
- Lu, H.P.; Lin, K.Y. Factors influencing online auction sellers’intention to pay: An empirical study integrating network externalities with perceived value. J. Electron. Commer. Res. 2012, 13, 238. [Google Scholar]
- Pal, D.; Funilkul, S.; Charoenkitkarn, N.; Kanthamanon, P. Internet-of-things and smart homes for elderly healthcare: An end user perspective. IEEE Access 2018, 6, 10483–10496. [Google Scholar] [CrossRef]
- Pal, D.; Papasratorn, B.; Chutimaskul, W.; Funilkul, S. Embracing the smart-home revolution in Asia by the elderly: An end-user negative perception modeling. IEEE Access 2019, 7, 38535–38549. [Google Scholar] [CrossRef]
- Zhang, N.; Gao, B. Research on the formation and influencing factors of the negative use of online health information services for the elderly under the CAC paradigm. Libr. Inf. Work. 2021, 65, 96–104. [Google Scholar] [CrossRef]
- Kim, S.H. Moderating effects of job relevance and experience on mobile wireless technology acceptance: Adoption of a smartphone by individuals. Inf. Manag. 2008, 45, 387–393. [Google Scholar] [CrossRef]
- Kim, D.; Ammeter, T. Predicting personal information system adoption using an integrated diffusion model. Inf. Manag. 2014, 51, 451–464. [Google Scholar] [CrossRef]
- Chen, J.; Wang, T.; Fang, Z.; Wang, H. Research on elderly users’ intentions to accept wearable devices based on the improved UTAUT model. Front. Public Health 2022, 10, 1035398. [Google Scholar] [CrossRef]
- Bauer, R.A. Consumer behavior as risk taking. In Dynamic Marketing for a Changing World; Hancock, R.S., Ed.; American Marketing Association: Chicago, IL, USA, 1960; pp. 389–398. [Google Scholar]
- Taylor, J.W. The role of risk in consumer behavior: A comprehensive and operational theory of risk taking in consumer behavior. J. Mark. 1974, 38, 54–60. [Google Scholar] [CrossRef]
- Klaver, N.S.; Van de Klundert, J.; Askari, M. Relationship between perceived risks of using mHealth applications and the intention to use them among older adults in the Netherlands: Cross-sectional study. JMIR Mhealth Uhealth 2021, 9, e26845. [Google Scholar] [CrossRef]
- Huang, F. Research on the Influence Mechanism of Wearable Medical Device Adoption Behavior of the Elderly in China. Master’s Thesis, Zhejiang University of Technology and Industry, Hangzhou, China, 2017. [Google Scholar]
- Wang, H.J. A Study on the User’s Continuance Intention and Optimization of Smart Elderly Care Services in China. Master’s Thesis, Harbin Normal University, Harbin, China, 2021. [Google Scholar]
- Ku, W.T.; Hsieh, P.J. Acceptance of cloud-based healthcare services by elderly Taiwanese people. In Human Aspects of IT for the Aged Population. In Proceedings of the Design for Aging: Second International Conference, ITAP 2016, Toronto, ON, Canada, 17–22 July 2016; Proceedings, Part I 2; Springer International Publishing: Berlin/Heidelberg, Germany, 2016; pp. 186–195. [Google Scholar]
- Prasetyo, Y.T.; Roque, R.A.C.; Chuenyindee, T.; Young, M.N.; Diaz, J.F.T.; Persada, S.F.; Miraja, B.A.; Perwira Redi, A.A.N. Determining Factors Affecting the Acceptance of Medical Education eLearning Platforms during the COVID-19 Pandemic in the Philippines: UTAUT2 Approach. Healthcare 2021, 9, 780. [Google Scholar] [CrossRef]
- Sivathanu, B. Adoption of Digital Payment Systems in the Era of Demonetization in India. J. Sci. Technol. Policy Manag. 2019, 10, 143–171. [Google Scholar] [CrossRef]
- Oliveira, T.; Faria, M.; Thomas, M.A.; Popovič, A. Extending the understanding of mobile banking adoption: When UTAUT meets TTF and ITM. Int. J. Inf. Manag. 2014, 34, 689–703. [Google Scholar] [CrossRef]
- Tan, C.; Zhang, J.; Zeng, Y. Research on influencing factors of consumer online shopping based on UTAUT model. Manag. Mod. 2014, 34, 28–30. [Google Scholar]
- Zhou, T.; Lu, Y.; Wang, B. Integrating TTF and UTAUT to Explain Mobile Banking User Adoption. Comput. Hum. Behav. 2010, 26, 760–767. [Google Scholar] [CrossRef]
- Yeoh, S.Y.; Chin, P.N. Exploring home health-care robots adoption in Malaysia: Extending the UTAUT model. Int. J. Pharm. Healthc. Mark. 2022, 16, 392–411. [Google Scholar] [CrossRef]
- Koksal, M.H. The Intentions of Lebanese Consumers to Adopt Mobile Banking. Int. J. Bank. Mark. 2016, 34, 327–346. [Google Scholar] [CrossRef]
- De Sena Abrahão, R.; Moriguchi, S.N.; Andrade, D.F. Intention of Adoption of Mobile Payment: An Analysis in the Light of the Unified Theory of Acceptance and Use of Technology (UTAUT). RAI Rev. Adm. Inovação 2016, 13, 221–230. [Google Scholar] [CrossRef]
- Hsu, C.W.; Peng, C.C. What drives older adults’ use of mobile registration apps in Taiwan? An investigation using the extended UTAUT model. Inform. Health Soc. Care 2022, 47, 258–273. [Google Scholar] [CrossRef] [PubMed]
- Mabkhot, H.; Isa, N.M.; Mabkhot, A. The Influence of the Credibility of Social Media Influencers SMIs on the Consumers’ Purchase Intentions: Evidence from Saudi Arabia. Sustainability 2022, 14, 12323. [Google Scholar] [CrossRef]
- Nysveen, H.; Pedersen, P.E.; Thorbjørnsen, H.; Berthon, P. Mobilizing the brand: The effects of mobile services on brand relationships and main channel use. J. Serv. Res. 2005, 7, 257–276. [Google Scholar] [CrossRef]
- Yang, C.-C.; Li, C.-L.; Yeh, T.-F.; Chang, Y.-C. Assessing Older Adults’ Intentions to Use a Smartphone: Using the Meta–Unified Theory of the Acceptance and Use of Technology. Int. J. Environ. Res. Public. Health 2022, 19, 5403. [Google Scholar] [CrossRef]
- Wang, H.; Tao, D.; Yu, N.; Qu, X. Understanding consumer acceptance of healthcare wearable devices: An integrated model of UTAUT and TTF. Int. J. Med. Inform. 2020, 139, 104156. [Google Scholar] [CrossRef]
- Zhang, M.; Hassan, H.; Migin, M.W. Exploring the Consumers’ Purchase Intention on Online Community Group Buying Platform during Pandemic. Sustainability 2023, 15, 2433. [Google Scholar] [CrossRef]
- Zainab, B.; Awais Bhatti, M.; Alshagawi, M. Factors affecting e-training adoption: An examination of perceived cost, computer self-efficacy and the technology acceptance model. Behav. Inf. Technol. 2017, 36, 1261–1273. [Google Scholar] [CrossRef]
- Gupta, B.; Joshi, S.; Agarwal, M. The effect of expected benefit and perceived cost on employees’ knowledge sharing behavior: A study of IT employees in India. Organ. Mark. Emerg. Econ. 2012, 3, 8–19. [Google Scholar] [CrossRef]
- Khan, D.; Fujiwara, A.; Shiftan, Y.; Chikaraishi, M.; Tenenboim, E.; Nguyen, T.A.H. Risk Perceptions and Public Acceptance of Autonomous Vehicles: A Comparative Study in Japan and Israel. Sustainability 2022, 14, 10508. [Google Scholar] [CrossRef]
- Walczuch, R.; Lemmink, J.; Streukens, S. The effect of service employees’ technology readiness on technology acceptance. Inf. Manag. 2007, 44, 206–215. [Google Scholar] [CrossRef]
- Kim, H.W.; Chan, H.C.; Gupta, S. Value-based adoption of mobile internet: An empirical investigation. Decis. Support Syst. 2007, 43, 111–126. [Google Scholar] [CrossRef]
- Zeithaml, V.A. Consumer perceptions of price, quality, and value: A means-end model and synthesis of evidence. J. Mark. 1988, 52, 2–22. [Google Scholar] [CrossRef]
- Stone, R.N.; Gr Nhaug, K. Perceived risk: Further considerations for the marketing discipline. Eur. J. Mark. 2013, 27, 39–50. [Google Scholar] [CrossRef]
- Wu, J.H.; Wang, S.C. What drives mobile commerce? An empirical evaluation of the revised technology acceptance model. Inf. Manag. 2005, 42, 719–729. [Google Scholar] [CrossRef]
- Zhao, Y.; Ni, Q.; Zhou, R. What factors influence the mobile health service adoption? A meta-analysis and the moderating role of age. Int. J. Inf. Manag. 2018, 43, 342–350. [Google Scholar] [CrossRef]
- Anderson, J.C.; Gerbing, D.W. Structural equation modeling in practice: A review and recommended two-step approach. Psychol. Bull. 1988, 103, 411–423. [Google Scholar] [CrossRef]
- Hair, J.F.; Black, W.C.; Babin, B.J.; Anderson, R.E.; Tatham, R.L. Multivariate Data Analysis; Prentice Hall: Upper Saddle River, NJ, USA, 1998. [Google Scholar]
- Nunnally, J.C. Psychometric Theory; Tata McGraw-Hill Education: New York, NY, USA, 1994. [Google Scholar]
- Fornell, C.; Larcker, D.F. Evaluating structural equation models with unobservable variables and measurement error. J. Mark. Res. 1981, 18, 39–50. [Google Scholar] [CrossRef]
- Chin, W.W. Commentary: Issues and opinion on structural equation modeling. MIS Q. 1998, 22, vii–xvi. [Google Scholar]
- Hooper, D.; Coughlan, J.; Mullen, M.R. Structural equation modelling: Guidelines for determining model fit. Electron. J. Bus. Res. Methods 2008, 6, 53–60. [Google Scholar]
- Jackson, D.L.; Gillaspy, J.A.; Purc-Stephenson, R. Reporting practices in confirmatory factor analysis: An overview and some recommendations. Psychol. Methods 2009, 14, 6–23. [Google Scholar] [CrossRef]
- Kline, R.B. Principles and Practice of Structural Equation Modeling; Guilford Publications: New York, NY, USA, 2015. [Google Scholar]
- Whittaker, T.A. A Beginner’s Guide to Structural Equation Modeling; Taylor & Francis: Abingdon, UK, 2011. [Google Scholar]
- Hu, L.T.; Bentler, P.M. Cutoff criteria for fit indexes in covariance structure analysis: Conventional criteria versus new alternatives. Struct. Equ. Model. 1999, 6, 1–55. [Google Scholar] [CrossRef]
- Sun, Y.; Wang, N.; Guo, X.; Peng, Z. Understanding the acceptance of mobile health services: A comparison and integration of alternative models. J. Electron. Commer. Res. 2013, 14, 183. [Google Scholar]
- Wang, L.J.; Jin, L. Willingness or intention: A study on the attitude of disabled elderly to use smart care products. J. Northwest Univ. 2021, 51, 89–97. [Google Scholar] [CrossRef]
- Chen, W.Z.; Qi, Y.; Wu, X.Y. Chronic disease-related science and technology for endowment: Latest development, assessment, and prospect. Chin. J. Public. Heal. 2018, 34, 1055–1060. [Google Scholar]
- Kang, H.-J.; Han, J.; Kwon, G.H. The Acceptance Behavior of Smart Home Health Care Services in South Korea: An Integrated Model of UTAUT and TTF. Int. J. Environ. Res. Public. Health 2022, 19, 13279. [Google Scholar] [CrossRef]
- Chou, W.H.; Lai, Y.T.; Liu, K.H. User requirements of social media for the elderly: A case study in Taiwan. Behav. Inf. Technol. 2013, 32, 920–937. [Google Scholar] [CrossRef]
- Sayago, S.; Blat, J. Telling the story of older people e-mailing: An ethnographical study. Int. J. Hum. Comput. Stud. 2010, 68, 105–120. [Google Scholar] [CrossRef]
- Gamma, A.E.; Slekiene, J.; von Medeazza, G.; Asplund, F.; Cardoso, P.; Mosler, H.J. Contextual and psychosocial factors predicting Ebola prevention behaviours using the RANAS approach to behaviour change in Guinea-Bissau. BMC Public. Health 2017, 17, 446. [Google Scholar] [CrossRef]


| Category | Research Variables | Definition of Operability | Code | Measurement Item | Sources |
|---|---|---|---|---|---|
| UTAUT model | Performance expectations | The elderly believe that the use of smart aged-care products can help them acquire better services | PE1 | I think smart aged-care products are easy to use and can promote the effect of elderly care | [21,58] |
| PE2 | The use of smart aged-care products can help me better enjoy elderly care service | ||||
| PE3 | I think the use of smart aged-care products can save time, and is convenient and fast | ||||
| PE4 | I think the use of innovative smart aged-care products and technology can promote the effect of elderly care | ||||
| PE5 | I think the use of smart aged-care products can promote the convenience of elderly care services | ||||
| Effort expectancy | The ease of use of smart aged-care products considered by the elderly | EE1 | I can easily learn to use smart aged-care products without spending too much time | [21,58] | |
| EE2 | For me, the operation process of smart aged-care products is simple and easy | ||||
| EE3 | I fully understand and understand how to use smart aged-care products | ||||
| EE4 | The innovative application of smart aged-care products is not a challenge to me | ||||
| Social influence | The extent to which the elderly are aware of whether others think they should use smart aged-care products | SI1 | People around me influence my decision to use smart aged-care products | [21,58] | |
| SI2 | People who use smart aged-care products look more capable than those who do not | ||||
| SI3 | The use of smart aged-care products is a trend. I want to keep up with the pace of the times, and I will use them | ||||
| SI4 | The use of smart aged-care products can improve personal image in society | ||||
| Facilitating conditions | The extent to which the elderly believe that the existing supporting resources can support the use of smart aged-care products | FC1 | I have the resources needed to use smart aged-care products | [21,58] | |
| FC2 | I think smart aged-care products can match other technologies used | ||||
| FC3 | I have the necessary skills required to use smart aged-care products | ||||
| FC4 | When I encounter difficulties in using smart aged-care products, I can ask friends for help | ||||
| Behavioral intention | The behavioral tendency of the elderly to use smart products | BI1 | It’s a good idea to use smart aged-care products | [21,58] | |
| BI2 | I think using smart aged-care products can promote my health | ||||
| BI3 | I think smart aged-care products are very valuable | ||||
| BI4 | I will use smart aged-care products in the future | ||||
| Use behavior | The elderly use smart aged-care products | UB1 | I am very willing to use smart aged-care products for health management | [21,58] | |
| UB2 | I learn how to use smart aged-care products | ||||
| UB3 | Compared with other health care products, I prefer smart aged-care products | ||||
| UB4 | I will continue to use smart aged-care products | ||||
| Perceived cost theory | Perceived cost | The elderly think that using smart aged-care products involves more costs | PC1 | Smart aged-care products are much more expensive than non-intelligent pension products | [31,59,60] |
| PC2 | I need to spend more time and energy on learning to use smart aged-care products | ||||
| PC3 | It takes more energy to use smart aged-care products | ||||
| Perceived risk theory | Perceived risk | The elderly think it is risky to use smart aged-care products | PR1 | The use of smart aged-care products may cause financial losses | [61,62,63] |
| PR2 | The use of smart aged-care products may not meet my original expectations | ||||
| PR3 | The use of smart aged-care products makes me nervous or anxious | ||||
| PR4 | Use of smart aged-care products may cause harm to the body | ||||
| PR5 | The use of smart aged-care products may cause my information to be leaked |
| Variables | Item | Corrected Item–Total Correlation (CITC) | Cronbach’s α If Item Deleted | Cronbach’s α |
|---|---|---|---|---|
| Performance expectation | PE1 | 0.813 | 0.926 | 0.916 |
| PE2 | 0.848 | 0.92 | ||
| PE3 | 0.833 | 0.923 | ||
| PE4 | 0.835 | 0.922 | ||
| PE5 | 0.83 | 0.923 | ||
| Effort expectation | EE1 | 0.822 | 0.916 | 0.909 |
| EE2 | 0.856 | 0.905 | ||
| EE3 | 0.83 | 0.913 | ||
| EE4 | 0.848 | 0.908 | ||
| Social influence | SI1 | 0.712 | 0.872 | 0.907 |
| SI2 | 0.751 | 0.857 | ||
| SI3 | 0.758 | 0.855 | ||
| SI4 | 0.797 | 0.839 | ||
| Facilitating conditions | FC1 | 0.78 | 0.851 | 0.906 |
| FC2 | 0.774 | 0.853 | ||
| FC3 | 0.761 | 0.859 | ||
| FC4 | 0.722 | 0.873 | ||
| Behavioral intention | BI1 | 0.857 | 0.908 | 0.898 |
| BI2 | 0.836 | 0.915 | ||
| BI3 | 0.847 | 0.911 | ||
| BI4 | 0.83 | 0.917 | ||
| Use behavior | UB1 | 0.756 | 0.859 | 0.895 |
| UB2 | 0.802 | 0.842 | ||
| UB3 | 0.807 | 0.84 | ||
| UB4 | 0.673 | 0.891 | ||
| Perceived cost | PC1 | 0.751 | 0.829 | 0.874 |
| PC2 | 0.768 | 0.814 | ||
| PC3 | 0.756 | 0.825 | ||
| Perceived risk | PR1 | 0.885 | 0.952 | 0.935 |
| PR2 | 0.897 | 0.95 | ||
| PR3 | 0.884 | 0.952 | ||
| PR4 | 0.882 | 0.953 | ||
| PR5 | 0.898 | 0.95 |
| Item | Option | Frequency | Percentage (%) | Cumulative Percentage (%) |
|---|---|---|---|---|
| Gender | Male | 187 | 48.45 | 48.45 |
| Female | 199 | 51.55 | 100 | |
| Age | 60–65 years old | 65 | 16.84 | 16.84 |
| 66–70 years old | 97 | 25.13 | 41.97 | |
| 71–75 years old | 108 | 27.98 | 69.95 | |
| 76–80 years old | 88 | 22.80 | 92.75 | |
| Over 80 years old | 28 | 7.25 | 100 | |
| Education background | Senior high school and under | 292 | 75.65 | 75.65 |
| Junior college | 25 | 6.48 | 82.12 | |
| Undergraduate | 50 | 12.95 | 95.08 | |
| Master’s and above | 19 | 4.92 | 100 | |
| Disposable monthly income | Below CNY 2000 | 32 | 8.29 | 8.29 |
| CNY 2001–3500 | 78 | 20.21 | 28.50 | |
| CNY 3501–5000 | 125 | 32.38 | 60.88 | |
| Over CNY 5000 | 151 | 39.12 | 100 | |
| Total | 386 | 100 | 100 | |
| KMO Value | 0.931 | |
|---|---|---|
| Bartlett test of sphericity | Chi-square approximation☐ | 9339.6 |
| df | 528 | |
| p-value | 0 | |
| Name | Factor Loading | Commonality (Common Factor Variance) | |||||||
|---|---|---|---|---|---|---|---|---|---|
| Factor 1 | Factor 2 | Factor 3 | Factor 4 | Factor 5 | Factor 6 | Factor 7 | Factor 8 | ||
| PE1 | −0.105 | 0.822 | 0.129 | 0.135 | 0.083 | 0.127 | 0.12 | −0.101 | 0.769 |
| PE2 | −0.071 | 0.800 | 0.157 | 0.125 | 0.119 | 0.146 | 0.146 | −0.102 | 0.753 |
| PE3 | −0.099 | 0.802 | 0.095 | 0.111 | 0.136 | 0.180 | 0.128 | −0.129 | 0.757 |
| PE4 | −0.100 | 0.790 | 0.162 | 0.173 | 0.106 | 0.078 | 0.162 | −0.089 | 0.742 |
| PE5 | −0.092 | 0.811 | 0.097 | 0.077 | 0.122 | 0.18 | 0.107 | −0.064 | 0.745 |
| EE1 | −0.114 | 0.147 | 0.177 | 0.179 | 0.794 | 0.191 | 0.126 | −0.093 | 0.789 |
| EE2 | −0.107 | 0.136 | 0.102 | 0.153 | 0.800 | 0.204 | 0.126 | −0.07 | 0.767 |
| EE3 | −0.155 | 0.155 | 0.121 | 0.121 | 0.828 | 0.100 | 0.131 | −0.089 | 0.799 |
| EE4 | −0.112 | 0.111 | 0.189 | 0.176 | 0.802 | 0.203 | 0.15 | −0.054 | 0.801 |
| SI1 | −0.127 | 0.173 | 0.096 | 0.822 | 0.143 | 0.135 | 0.197 | −0.047 | 0.811 |
| SI2 | −0.057 | 0.115 | 0.122 | 0.824 | 0.144 | 0.145 | 0.102 | −0.091 | 0.77 |
| SI3 | −0.069 | 0.152 | 0.098 | 0.825 | 0.154 | 0.111 | 0.097 | −0.123 | 0.779 |
| SI4 | −0.135 | 0.137 | 0.138 | 0.815 | 0.147 | 0.136 | 0.113 | −0.078 | 0.78 |
| FC1 | −0.050 | 0.131 | 0.853 | 0.109 | 0.123 | 0.049 | 0.109 | −0.041 | 0.791 |
| FC2 | −0.025 | 0.140 | 0.860 | 0.100 | 0.112 | 0.097 | 0.103 | −0.032 | 0.804 |
| FC3 | −0.004 | 0.148 | 0.842 | 0.093 | 0.087 | 0.04 | 0.074 | −0.052 | 0.757 |
| FC4 | −0.006 | 0.119 | 0.842 | 0.111 | 0.172 | 0.06 | 0.085 | −0.052 | 0.778 |
| BI1 | −0.215 | 0.154 | 0.137 | 0.135 | 0.159 | 0.237 | 0.776 | −0.046 | 0.793 |
| BI2 | −0.186 | 0.181 | 0.077 | 0.117 | 0.202 | 0.192 | 0.766 | −0.133 | 0.769 |
| BI3 | −0.241 | 0.216 | 0.150 | 0.183 | 0.115 | 0.198 | 0.710 | −0.162 | 0.744 |
| BI4 | −0.211 | 0.201 | 0.140 | 0.177 | 0.126 | 0.229 | 0.752 | −0.089 | 0.778 |
| UB1 | −0.088 | 0.15 | 0.094 | 0.125 | 0.163 | 0.766 | 0.25 | −0.158 | 0.755 |
| UB2 | −0.093 | 0.215 | 0.083 | 0.145 | 0.177 | 0.808 | 0.118 | −0.161 | 0.807 |
| UB3 | −0.086 | 0.199 | 0.031 | 0.164 | 0.259 | 0.717 | 0.279 | −0.135 | 0.753 |
| UB4 | −0.085 | 0.225 | 0.088 | 0.194 | 0.19 | 0.740 | 0.211 | −0.152 | 0.755 |
| PC1 | 0.192 | −0.107 | −0.059 | −0.075 | −0.106 | −0.138 | −0.155 | 0.831 | 0.803 |
| PC2 | 0.191 | −0.147 | −0.064 | −0.139 | −0.058 | −0.187 | −0.088 | 0.825 | 0.809 |
| PC3 | 0.210 | −0.166 | −0.055 | −0.104 | −0.102 | −0.16 | −0.079 | 0.816 | 0.793 |
| PR1 | 0.846 | −0.106 | 0.021 | −0.066 | −0.107 | −0.059 | −0.198 | 0.088 | 0.793 |
| PR2 | 0.875 | −0.069 | −0.015 | −0.064 | −0.086 | −0.071 | −0.12 | 0.125 | 0.818 |
| PR3 | 0.852 | −0.117 | −0.014 | −0.094 | −0.092 | −0.068 | −0.102 | 0.144 | 0.793 |
| PR4 | 0.851 | −0.091 | −0.072 | −0.116 | −0.118 | −0.025 | −0.135 | 0.110 | 0.795 |
| PR5 | 0.853 | −0.059 | −0.021 | −0.052 | −0.067 | −0.101 | −0.13 | 0.147 | 0.788 |
| Cumulative percentage of variance explained % | 77.993 | ||||||||
| Item | Estimate | S.E. | C.R. | p | Std | CR | AVE | ||
|---|---|---|---|---|---|---|---|---|---|
| PE1 | <--- | PE | 1 | 0.839 | 0.916 | 0.686 | |||
| PE2 | <--- | PE | 1.022 | 0.052 | 19.818 | *** | 0.835 | ||
| PE3 | <--- | PE | 1.029 | 0.052 | 19.685 | *** | 0.837 | ||
| PE4 | <--- | PE | 1.003 | 0.052 | 19.19 | *** | 0.819 | ||
| PE5 | <--- | PE | 1.005 | 0.052 | 19.195 | *** | 0.812 | ||
| EE1 | <--- | EE | 1 | 0.855 | 0.909 | 0.713 | |||
| EE2 | <--- | EE | 0.953 | 0.048 | 19.686 | *** | 0.821 | ||
| EE3 | <--- | EE | 0.973 | 0.047 | 20.519 | *** | 0.84 | ||
| EE4 | <--- | EE | 1.028 | 0.049 | 20.934 | *** | 0.862 | ||
| SI1 | <--- | SI | 1 | 0.867 | 0.907 | 0.708 | |||
| SI2 | <--- | SI | 0.944 | 0.047 | 20.058 | *** | 0.822 | ||
| SI3 | <--- | SI | 0.939 | 0.046 | 20.36 | *** | 0.834 | ||
| SI4 | <--- | SI | 0.986 | 0.048 | 20.719 | *** | 0.843 | ||
| FC1 | <--- | FC | 1 | 0.851 | 0.907 | 0.708 | |||
| FC2 | <--- | FC | 1.097 | 0.052 | 20.918 | *** | 0.866 | ||
| FC3 | <--- | FC | 0.966 | 0.051 | 19.062 | *** | 0.807 | ||
| FC4 | <--- | FC | 1.052 | 0.052 | 20.092 | *** | 0.842 | ||
| BI1 | <--- | BI | 0.999 | 0.05 | 19.941 | *** | 0.845 | 0.898 | 0.688 |
| BI2 | <--- | BI | 0.966 | 0.051 | 18.921 | *** | 0.816 | ||
| BI3 | <--- | BI | 0.955 | 0.051 | 18.869 | *** | 0.817 | ||
| BI4 | <--- | BI | 1 | 0.84 | |||||
| UB1 | <--- | UB | 0.98 | 0.054 | 18.093 | *** | 0.808 | 0.874 | 0.699 |
| UB2 | <--- | UB | 1.063 | 0.055 | 19.284 | *** | 0.832 | ||
| UB3 | <--- | UB | 1.036 | 0.055 | 18.862 | *** | 0.831 | ||
| UB4 | <--- | UB | 1 | 0.831 | |||||
| PC1 | <--- | PC | 1.003 | 0.056 | 17.887 | *** | 0.823 | 0.895 | 0.681 |
| PC2 | <--- | PC | 1.069 | 0.058 | 18.418 | *** | 0.85 | ||
| PC3 | <--- | PC | 1 | 0.835 | |||||
| PR1 | <--- | PR | 1 | 0.857 | 0.935 | 0.742 | |||
| PR2 | <--- | PR | 1.021 | 0.045 | 22.831 | *** | 0.879 | ||
| PR3 | <--- | PR | 0.998 | 0.045 | 21.947 | *** | 0.859 | ||
| PR4 | <--- | PR | 1.013 | 0.046 | 22.098 | *** | 0.858 | ||
| PR5 | <--- | PR | 0.972 | 0.045 | 21.752 | *** | 0.853 | ||
| AVE | PE | EE | SI | FC | PR | BI | UB | PC | |
|---|---|---|---|---|---|---|---|---|---|
| PE | 0.686 | 0.828 | |||||||
| EE | 0.713 | 0.430 *** | 0.845 | ||||||
| SI | 0.708 | 0.436 *** | 0.483 *** | 0.842 | |||||
| FC | 0.708 | 0.388 *** | 0.409 *** | 0.345 *** | 0.842 | ||||
| PR | 0.742 | −0.299 *** | −0.338 *** | −0.296 *** | −0.124 * | 0.861 | |||
| BI | 0.681 | 0.541 *** | 0.582 *** | 0.496 *** | 0.297 *** | −0.312 *** | 0.825 | ||
| UB | 0.688 | 0.527 *** | 0.516 *** | 0.495 *** | 0.373 *** | −0.498 *** | 0.667 *** | 0.830 | |
| PC | 0.699 | −0.405 *** | −0.346 *** | −0.357 *** | −0.215 *** | 0.451 *** | −0.513 *** | −0.440 *** | 0.836 |
| Model Fit | Criteria | Model Fit of Research Model | Judgment |
|---|---|---|---|
| ML chi-square (χ2) | The smaller the better | 519.53 | |
| Degrees of Freedom (df) | The larger the better | 472 | |
| Normed Chi-square (χ2/df) | <3 | 1.101 | Yes |
| Root Mean Square Error Approximation (RMSEA) | <0.08 | 0.037 | Yes |
| Standardized Root Mean Square Residual (SRMR) | <0.08 | 0.0461 | Yes |
| Tucker–Lewis Index (TLI) | >0.9 | 0.946 | Yes |
| Comparative Fit Index (CFI) | >0.9 | 0.951 | Yes |
| Goodness of Fit Index (GFI) | >0.9 | 0.918 | Yes |
| Incremental Fit Index (IFI) | >0.9 | 0.954 | Yes |
| Hypothesis | Route | Estimate | S.E. | C.R. | p | STD | Results | ||
|---|---|---|---|---|---|---|---|---|---|
| H1 | BI | <--- | PE | 0.274 | 0.051 | 5.416 | *** | 0.277 | Support |
| H2 | BI | <--- | EE | 0.27 | 0.056 | 4.805 | *** | 0.272 | Support |
| H3 | BI | <--- | SI | 0.188 | 0.049 | 3.845 | *** | 0.199 | Support |
| H4 | UB | <--- | FC | 0.017 | 0.055 | 0.304 | 0.761 | 0.018 | Nonsupport |
| H5 | UB | <--- | BI | 0.823 | 0.099 | 8.29 | *** | 0.860 | Support |
| H6 | BI | <--- | PC | −0.254 | 0.054 | −4.69 | *** | −0.251 | Support |
| H7 | BI | <--- | PR | −0.135 | 0.058 | −2.334 | 0.02 | −0.152 | Support |
| H8 | UB | <--- | PR | 0.082 | 0.067 | 1.221 | 0.222 | 0.096 | Nonsupport |
Disclaimer/Publisher’s Note: The statements, opinions and data contained in all publications are solely those of the individual author(s) and contributor(s) and not of MDPI and/or the editor(s). MDPI and/or the editor(s) disclaim responsibility for any injury to people or property resulting from any ideas, methods, instructions or products referred to in the content. |
© 2023 by the authors. Licensee MDPI, Basel, Switzerland. This article is an open access article distributed under the terms and conditions of the Creative Commons Attribution (CC BY) license (https://creativecommons.org/licenses/by/4.0/).
Share and Cite
Wang, X.; Lee, C.-F.; Jiang, J.; Zhang, G.; Wei, Z. Research on the Factors Affecting the Adoption of Smart Aged-Care Products by the Aged in China: Extension Based on UTAUT Model. Behav. Sci. 2023, 13, 277. https://doi.org/10.3390/bs13030277
Wang X, Lee C-F, Jiang J, Zhang G, Wei Z. Research on the Factors Affecting the Adoption of Smart Aged-Care Products by the Aged in China: Extension Based on UTAUT Model. Behavioral Sciences. 2023; 13(3):277. https://doi.org/10.3390/bs13030277
Chicago/Turabian StyleWang, Xiang, Chang-Franw Lee, Jiabei Jiang, Genlei Zhang, and Zhong Wei. 2023. "Research on the Factors Affecting the Adoption of Smart Aged-Care Products by the Aged in China: Extension Based on UTAUT Model" Behavioral Sciences 13, no. 3: 277. https://doi.org/10.3390/bs13030277
APA StyleWang, X., Lee, C.-F., Jiang, J., Zhang, G., & Wei, Z. (2023). Research on the Factors Affecting the Adoption of Smart Aged-Care Products by the Aged in China: Extension Based on UTAUT Model. Behavioral Sciences, 13(3), 277. https://doi.org/10.3390/bs13030277