
A New Explanation for the Frog-in-the-Pan Phenomenon Based on the Cognitive-Evolutionary Model of Surprise

Abstract
1. Introduction
2. Literature Review
2.1. Previous Explanations for the FIP Phenomenon
2.2. Surprise Emotion
2.3. The Reinforcement Learning Model (the RL Model)
3. Hypothesis
4. Materials and Methods
4.1. Experiment Overview
4.2. Participants
4.3. Material and Procedure
4.4. Model and Measured Variables
4.4.1. Model and Measured Variables in the Estimation Task
4.4.2. Measure Variables in the RT Task
4.5. Apparatus
5. Results
6. Discussion
Author Contributions
Funding
Institutional Review Board Statement
Informed Consent Statement
Data Availability Statement
Conflicts of Interest
References
- Fama, E.F. Efficient capital markets: A review of theory and empirical work. J. Financ. 1970, 25, 383–417. [Google Scholar] [CrossRef]
- Konstantinidis, A.; Katarachia, A.; Borovas, G.; Voutsa, M.E. From efficient market hypothesis to behavioural finance: Can behavioural finance be the new dominant model for investing. Sci. Bull. Econ. Sci. 2012, 11, 16–26. [Google Scholar]
- Kumar, S.; Goyal, N. Evidence on rationality and behavioural biases in investment decision making. Qual. Res. Financ. Mark. 2016, 8, 270–287. [Google Scholar] [CrossRef]
- Sadi, R.; Asl, H.G.; Rostami, M.R.; Gholipour, A.; Gholipour, F. Behavioral finance: The explanation of investors’ per-sonality and perceptual biases effects on financial decisions. Int. J. Econ. Financ. 2011, 3, 234–241. [Google Scholar] [CrossRef]
- Muhammad, N.M.N. Study on behavioral finance: Is the individual investors rational. Adv. Manag. 2009. [Google Scholar]
- Bloomfield, R.; O’Hara, M.; Saar, G. How Noise Trading Affects Markets: An Experimental Analysis. Rev. Financ. Stud. 2009, 22, 2275–2302. [Google Scholar] [CrossRef]
- Poteshman, A.M.; Serbin, V. Clearly Irrational Financial Market Behavior: Evidence from the Early Exercise of Exchange Traded Stock Options. J. Financ. 2003, 58, 37–70. [Google Scholar] [CrossRef]
- Karlsson, A.; Nordén, L. Home sweet home: Home bias and international diversification among individual investors. J. Bank. Financ. 2007, 31, 317–333. [Google Scholar] [CrossRef]
- Uchida, H.; Nakagawa, R. Herd behavior in the Japanese loan market: Evidence from bank panel data. J. Financ. Intermediation 2007, 16, 555–583. [Google Scholar] [CrossRef]
- Chau, F.; Deesomsak, R.; Koutmos, D. Does investor sentiment really matter? Int. Rev. Financ. Anal. 2016, 48, 221–232. [Google Scholar] [CrossRef]
- Kumari, J.; Mahakud, J. Does investor sentiment predict the asset volatility? Evidence from emerging stock market India. J. Behav. Exp. Financ. 2015, 8, 25–39. [Google Scholar] [CrossRef]
- Liang, L. Post-Earnings Announcement Drift and Market Participants’ Information Processing Biases. Rev. Account. Stud. 2003, 8, 321–345. [Google Scholar] [CrossRef]
- Gino, F.; Bazerman, M.H. When misconduct goes unnoticed: The acceptability of gradual erosion in others’ unethical behavior. J. Exp. Soc. Psychol. 2009, 45, 708–719. [Google Scholar] [CrossRef]
- Da, Z.; Gurun, U.G.; Warachka, M. Frog in the Pan: Continuous Information and Momentum. Rev. Financ. Stud. 2014, 27, 2171–2218. [Google Scholar] [CrossRef]
- Offerman, T.; van der Veen, A. How to subsidize contributions to public goods: Does the frog jump out of the boiling water? Eur. Econ. Rev. 2015, 74, 96–108. [Google Scholar] [CrossRef][Green Version]
- Meyer, W.-U.; Reisenzein, R.; Schützwohl, A. Toward a Process Analysis of Emotions: The Case of Surprise. Motiv. Emot. 1997, 21, 251–274. [Google Scholar] [CrossRef]
- Nassar, M.; Wilson, R.C.; Heasly, B.; Gold, J.I. An Approximately Bayesian Delta-Rule Model Explains the Dynamics of Belief Updating in a Changing Environment. J. Neurosci. 2010, 30, 12366–12378. [Google Scholar] [CrossRef]
- Huang, S.; Lee, C.M.; Song, Y.; Xiang, H. A frog in every pan: Information discreteness and the lead-lag returns puzzle. J. Financ. Econ. 2022, 145, 83–102. [Google Scholar] [CrossRef]
- Yang, W.T. The Influence of Information Presenting on Individual’s Investment Decision-Making: Emotional and Neuroscience Approach; Zhejiang University: Zhejiang, China, 2019. [Google Scholar]
- Piccoli, P.; Chaudhury, M.; Souza, A.; da Silva, W.V. Stock overreaction to extreme market events. North Am. J. Econ. Financ. 2017, 41, 97–111. [Google Scholar] [CrossRef]
- Griffin, D.; Tversky, A. The weighing of evidence and the determinants of confidence. Cogn. Psychol. 1992, 24, 411–435. [Google Scholar] [CrossRef]
- Ekman, P.; Friesen, W.V. Constants across cultures in the face and emotion. J. Pers. Soc. Psychol. 1971, 17, 124–129. [Google Scholar] [CrossRef]
- Reisenzein, R.; Horstmann, G.; Schützwohl, A. The Cognitive-Evolutionary Model of Surprise: A Review of the Evidence. Top. Cogn. Sci. 2017, 11, 50–74. [Google Scholar] [CrossRef]
- Schützwohl, A. Approach and Avoidance During Routine Behavior and During Surprise in a Non-evaluative Task: Surprise Matters and So Does the Valence of the Surprising Event. Front. Psychol. 2018, 9, 826. [Google Scholar] [CrossRef]
- Schützwohl, A. Surprise and schema strength. J. Exp. Psychol. Learn. Mem. Cogn. 1998, 24, 1182. [Google Scholar] [CrossRef][Green Version]
- Reisenzein, R. Exploring the Strength of Association between the Components of Emotion Syndromes: The Case of Surprise. Cogn. Emot. 2000, 14, 1–38. [Google Scholar] [CrossRef]
- Niepel, M.; Rudolph, U.; Schützwohl, A.; Meyer, W.-U. Temporal characteristics of the surprise reaction induced by schema-discrepant visual and auditory events. Cogn. Emot. 1994, 8, 433–452. [Google Scholar] [CrossRef]
- Smedslund, J. A critique of Tversky and Kahneman’s distinction between fallacy and misunderstanding. Scand. J. Psychol. 1990, 31, 110–120. [Google Scholar] [CrossRef]
- Ekman, P. Emotions Revealed. In Understanding Faces and Feelings; Weidenfeld & Nicolson: London, UK, 2003. [Google Scholar]
- Teigen, K.H.; Keren, G. Surprises: Low probabilities or high contrasts? Cognition 2003, 87, 55–71. [Google Scholar] [CrossRef]
- Plutchik, R. Emotion: A Psychoevolutionary Synthesis; Harper & Row: New York, NY, USA, 1980. [Google Scholar]
- Meyer, W.U.; Niepel, M.; Rudolph, U.; Schützwohl, A. An experimental analysis of surprise. Cogn. Emot. 1991, 5, 295–311. [Google Scholar] [CrossRef]
- McGuire, J.T.; Nassar, M.R.; Gold, J.I.; Kable, J.W. Functionally Dissociable Influences on Learning Rate in a Dynamic Environment. Neuron 2014, 84, 870–881. [Google Scholar] [CrossRef]
- Ofir, C.; Mazursky, D. Does a Surprising Outcome Reinforce or Reverse the Hindsight Bias? Organ. Behav. Hum. Decis. Process. 1997, 69, 51–57. [Google Scholar] [CrossRef]
- Sutton, R.S.; Barto, A.G. Reinforcement Learning: An Introduction, 2nd ed.; The MIT Press: Cambridge, MA, USA, 2017. [Google Scholar]
- Behrens, T.E.J.; Woolrich, M.W.; E Walton, M.; Rushworth, M. Learning the value of information in an uncertain world. Nat. Neurosci. 2007, 10, 1214–1221. [Google Scholar] [CrossRef] [PubMed]
- Bossaerts, P. Formalizing the Function of Anterior Insula in Rapid Adaptation. Front. Integr. Neurosci. 2018, 12, 61. [Google Scholar] [CrossRef]
- Reisenzein, R.; Bördgen, S.; Holtbernd, T.; Matz, D. Evidence for strong dissociation between emotion and facial displays: The case of surprise. J. Pers. Soc. Psychol. 2006, 91, 295–315. [Google Scholar] [CrossRef]
- Horstmann, G. Attentional Capture by an Unannounced Color Singleton Depends on Expectation Discrepancy. J. Exp. Psychol. Hum. Percept. Perform. 2005, 31, 1039–1060. [Google Scholar] [CrossRef]
- Kvålseth, T.O. Stimulus probability, surprise, and reaction time. In Proceedings of the Human Factors Society Annual Meeting; SAGE Publications: Los Angeles, CA, USA, 1987. [Google Scholar]
- Mars, R.B.; Debener, S.; Gladwin, T.E.; Harrison, L.M.; Haggard, P.; Rothwell, J.C.; Bestmann, S. Trial-by-trial fluctuations in the event-related electroencephalogram reflect dynamic changes in the degree of surprise. J. Neurosci. 2008, 28, 12539–12545. [Google Scholar] [CrossRef]
- Schützwohl, A.; Borgstedt, K. The processing of affectively valenced stimuli: The role of surprise. Cogn. Emot. 2005, 19, 583–600. [Google Scholar] [CrossRef]
- Horstmann, G.; Becker, S.I. Evidence for goal-independent attentional capture from validity effects with unexpected novel color cues—A response to Burnham (2007). Psychon. Bull. Rev. 2011, 18, 512–517. [Google Scholar] [CrossRef]
- Horstmann, G.; Herwig, A. Surprise attracts the eyes and binds the gaze. Psychon. Bull. Rev. 2014, 22, 743–749. [Google Scholar] [CrossRef]
- Rescorla, R.A. A theory of Pavlovian conditioning: Variations in the effectiveness of reinforcement and nonreinforcement. Curr. Res. Theory 1972, 64–99. [Google Scholar]
- Bai, Y.; Katahira, K.; Ohira, H. Dual learning processes underlying human decision-making in reversal learning tasks: Functional significance and evidence from the model fit to human behavior. Front. Psychol. 2014, 5, 871. [Google Scholar] [CrossRef]
- Wu, X.; Wang, T.; Liu, C.; Wu, T.; Jiang, J.; Zhou, D.; Zhou, J. Functions of Learning Rate in Adaptive Reward Learning. Front. Hum. Neurosci. 2017, 11, 592. [Google Scholar] [CrossRef]
- Bayer, H.M.; Glimcher, P.W. Midbrain Dopamine Neurons Encode a Quantitative Reward Prediction Error Signal. Neuron 2005, 47, 129–141. [Google Scholar] [CrossRef]
- Glimcher, P.W. Understanding dopamine and reinforcement learning: The dopamine reward prediction error hypothesis. Proc. Natl. Acad. Sci. USA 2011, 108, 15647–15654. [Google Scholar] [CrossRef]
- Schultz, W. Dopamine reward prediction error coding. Dialog- Clin. Neurosci. 2016, 18, 23–32. [Google Scholar] [CrossRef]
- Eshel, N.; Tian, J.; Bukwich, M.; Uchida, N. Dopamine neurons share common response function for reward prediction error. Nat. Neurosci. 2016, 19, 479–486. [Google Scholar] [CrossRef]
- Brainard, D.H.; Vision, S. The psychophysics toolbox. Spat. Vis. 1997, 10, 433–436. [Google Scholar] [CrossRef]
- Kleiner, M.; Brainard, D.; Pelli, D. What’s New in Psychtoolbox-3? 2007. Available online: https://pure.mpg.de/rest/items/item_1790332/component/file_3136265/content (accessed on 14 December 2022).
- Ren, D.; Stavrova, O.; Loh, W.W. Nonlinear effect of social interaction quantity on psychological well-being: Diminishing returns or inverted U? J. Pers. Soc. Psychol. 2022, 122, 1056–1074. [Google Scholar] [CrossRef]
- Muggeo, M.R. Segmented Mixed Models with Random Changepoints in R. 2016. Available online: https://www.researchgate.net/publication/292629179_Segmented_mixed_mo-dels_with_random_changepoints_in_R (accessed on 1 February 2016).
- Topolinski, S.; Strack, F. Corrugator activity confirms immediate negative affect in surprise. Front. Psychol. 2015, 6, 134. [Google Scholar] [CrossRef]
- Choi, D.; Hui, S.K. The role of surprise: Understanding overreaction and underreaction to unanticipated events using in-play soccer betting market. J. Econ. Behav. Organ. 2014, 107, 614–629. [Google Scholar] [CrossRef]
- Stöttinger, E.; Aichhorn, M.; Anderson, B.; Danckert, J. The neural systems for perceptual updating. Neuropsychologia 2018, 112, 86–94. [Google Scholar] [CrossRef] [PubMed]
- Domenech, P.; Koechlin, E. Executive control and decision-making in the prefrontal cortex. Curr. Opin. Behav. Sci. 2015, 1, 101–106. [Google Scholar] [CrossRef]
- McGuire, J.T.; Kable, J.W. Medial prefrontal cortical activity reflects dynamic re-evaluation during voluntary persistence. Nat. Neurosci. 2015, 18, 760–766. [Google Scholar] [CrossRef] [PubMed]
- O’Reilly, J.X.; Schüffelgen, U.; Cuell, S.F.; Behrens, T.E.J.; Mars, R.B.; Rushworth, M.F.S. Dissociable effects of surprise and model update in parietal and anterior cingulate cortex. Proc. Natl. Acad. Sci. USA 2013, 110, E3660–E3669. [Google Scholar] [CrossRef]
- Nour, M.M.; Dahoun, T.; Schwartenbeck, P.; Adams, R.A.; FitzGerald, T.H.B.; Coello, C.; Wall, M.B.; Dolan, R.J.; Howes, O.D. Dopaminergic basis for signaling belief updates, but not surprise, and the link to paranoia. Proc. Natl. Acad. Sci. USA 2018, 115, E10167–E10176. [Google Scholar] [CrossRef]
- Foster, M.I.; Keane, M.T. Why some surprises are more surprising than others: Surprise as a metacognitive sense of explanatory difficulty. Cogn. Psychol. 2015, 81, 74–116. [Google Scholar] [CrossRef]
- Maguire, R.; Maguire, P.; Keane, M.T. Making sense of surprise: An investigation of the factors influencing surprise judgments. J. Exp. Psychol. Learn. Mem. Cogn. 2011, 37, 176–186. [Google Scholar] [CrossRef]


| Gradually Changed Block (Including Gradually Increase/Decrease Trials) | Abruptly Changed Block (Including Abruptly Increase/Decrease Trials) | ||||
|---|---|---|---|---|---|
| Trials | Distribution | Trend | Trials | Distribution | Trend |
| 1–20 | N (25,1.7) | randomly fluctuate | 1–29 | N (25,1.7) | randomly fluctuate |
| 21–30 | N (30,1.7) | gradually increase | 30 | N (35,1.7) | abruptly increase |
| 31–40 | N (35,1.7) | randomly fluctuate | 31–49 | randomly fluctuate | |
| 41–50 | N (30,1.7) | gradually decrease | 50 | N (25,1.7) | abruptly decrease |
| 51–60 | N (25,1.7) | randomly fluctuate | 51–69 | randomly fluctuate | |
| 61–70 | N (20,1.7) | gradually decrease | 70 | N (15,1.7) | abruptly decrease |
| 71–80 | N (15,1.7) | randomly fluctuate | 71–89 | randomly fluctuate | |
| 81–90 | N (20,1.7) | gradually increase | 90 | N (25,1.7) | abruptly increase |
| 91–100 | N (25,1.7) | randomly fluctuate | 91–100 | randomly fluctuate | |
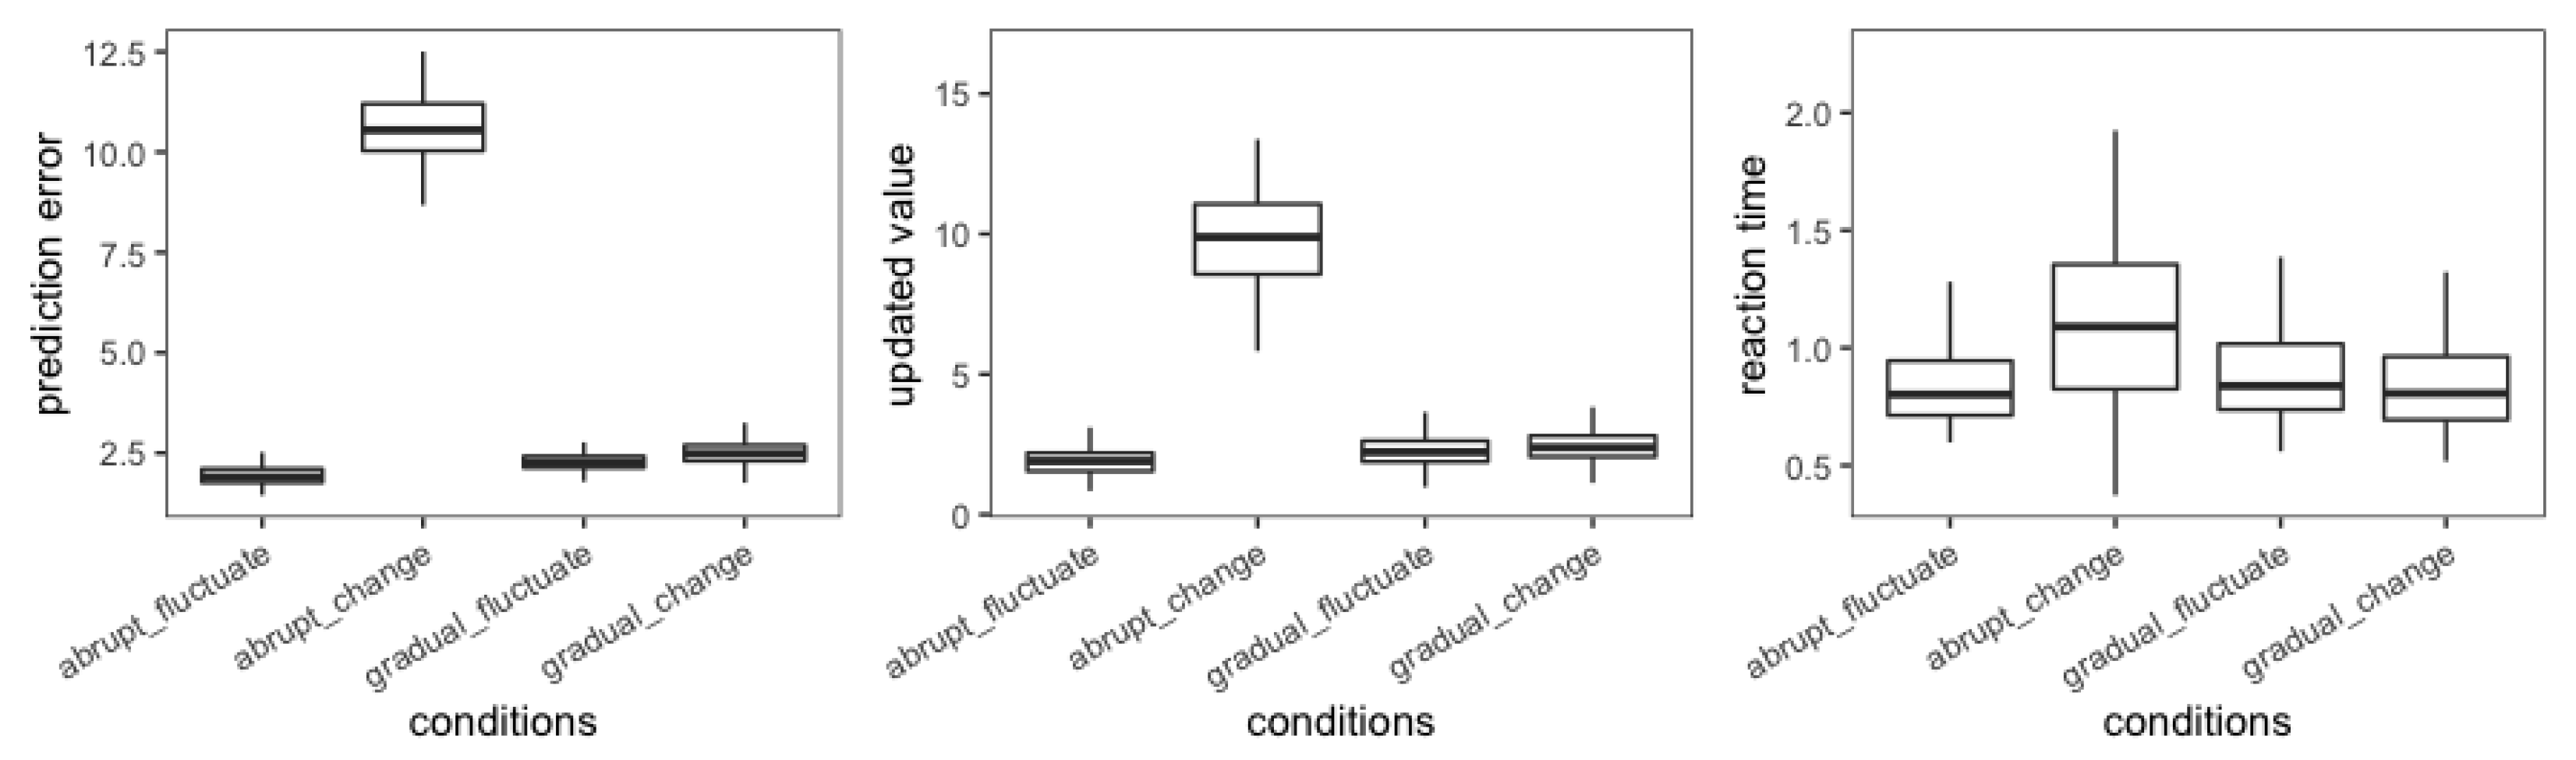
| Prediction Error (sd) | Updated Value (sd) | RTs (sd) | |
|---|---|---|---|
| randomly fluctuate in the gradual block | 2.316 (1.636) | 2.238 (1.709) | 0.883 (0.403) |
| gradually change | 2.558 (1.825) | 2.400 (1.772) | 0.85 (0.384) |
| randomly fluctuate in the abrupt block | 1.985 (1.570) | 1.935 (1.554) | 0.855 (0.355) |
| abruptly change | 10.521 (1.933) | 9.827 (2.419) | 1.105 (0.471) |
| β | SE | df | t Value | Pr (>|t|) | |
|---|---|---|---|---|---|
| (Intercept) | 1.017 | 0.047 | 250.1 | 21.742 | <0.001 *** |
| prediction error | 0.528 | 0.01 | 21,113.526 | 51.731 | <0.001 *** |
| gradually change | 0.022 | 0.045 | 21,089.861 | 0.48 | 0.631 |
| randomly fluctuate in the abrupt block | −0.261 | 0.036 | 21,096.218 | −7.311 | <0.001 *** |
| abruptly change | 1.531 | 0.361 | 21,090.713 | 4.246 | <0.001 *** |
| prediction error × gradually change | 0.005 | 0.015 | 21,093.512 | 0.322 | 0.748 |
| prediction error × randomly fluctuates in the abrupt block | 0.067 | 0.013 | 21,102.968 | 5.06 | <0.001 *** |
| prediction error × abruptly change | 0.165 | 0.035 | 21,094.483 | 4.71 | <0.001 *** |
| β | SE | df | t Value | Pr (>|t|) | |
|---|---|---|---|---|---|
| (Intercept) | 1.009 | 0.041 | 152.078 | 24.63 | <0.001 *** |
| prediction error | 0.405 | 0.011 | 21,112.450 | 38.38 | <0.001 *** |
| prediction error2 | 0.032 | 0.001 | 21,102.695 | 29.39 | <0.001 *** |
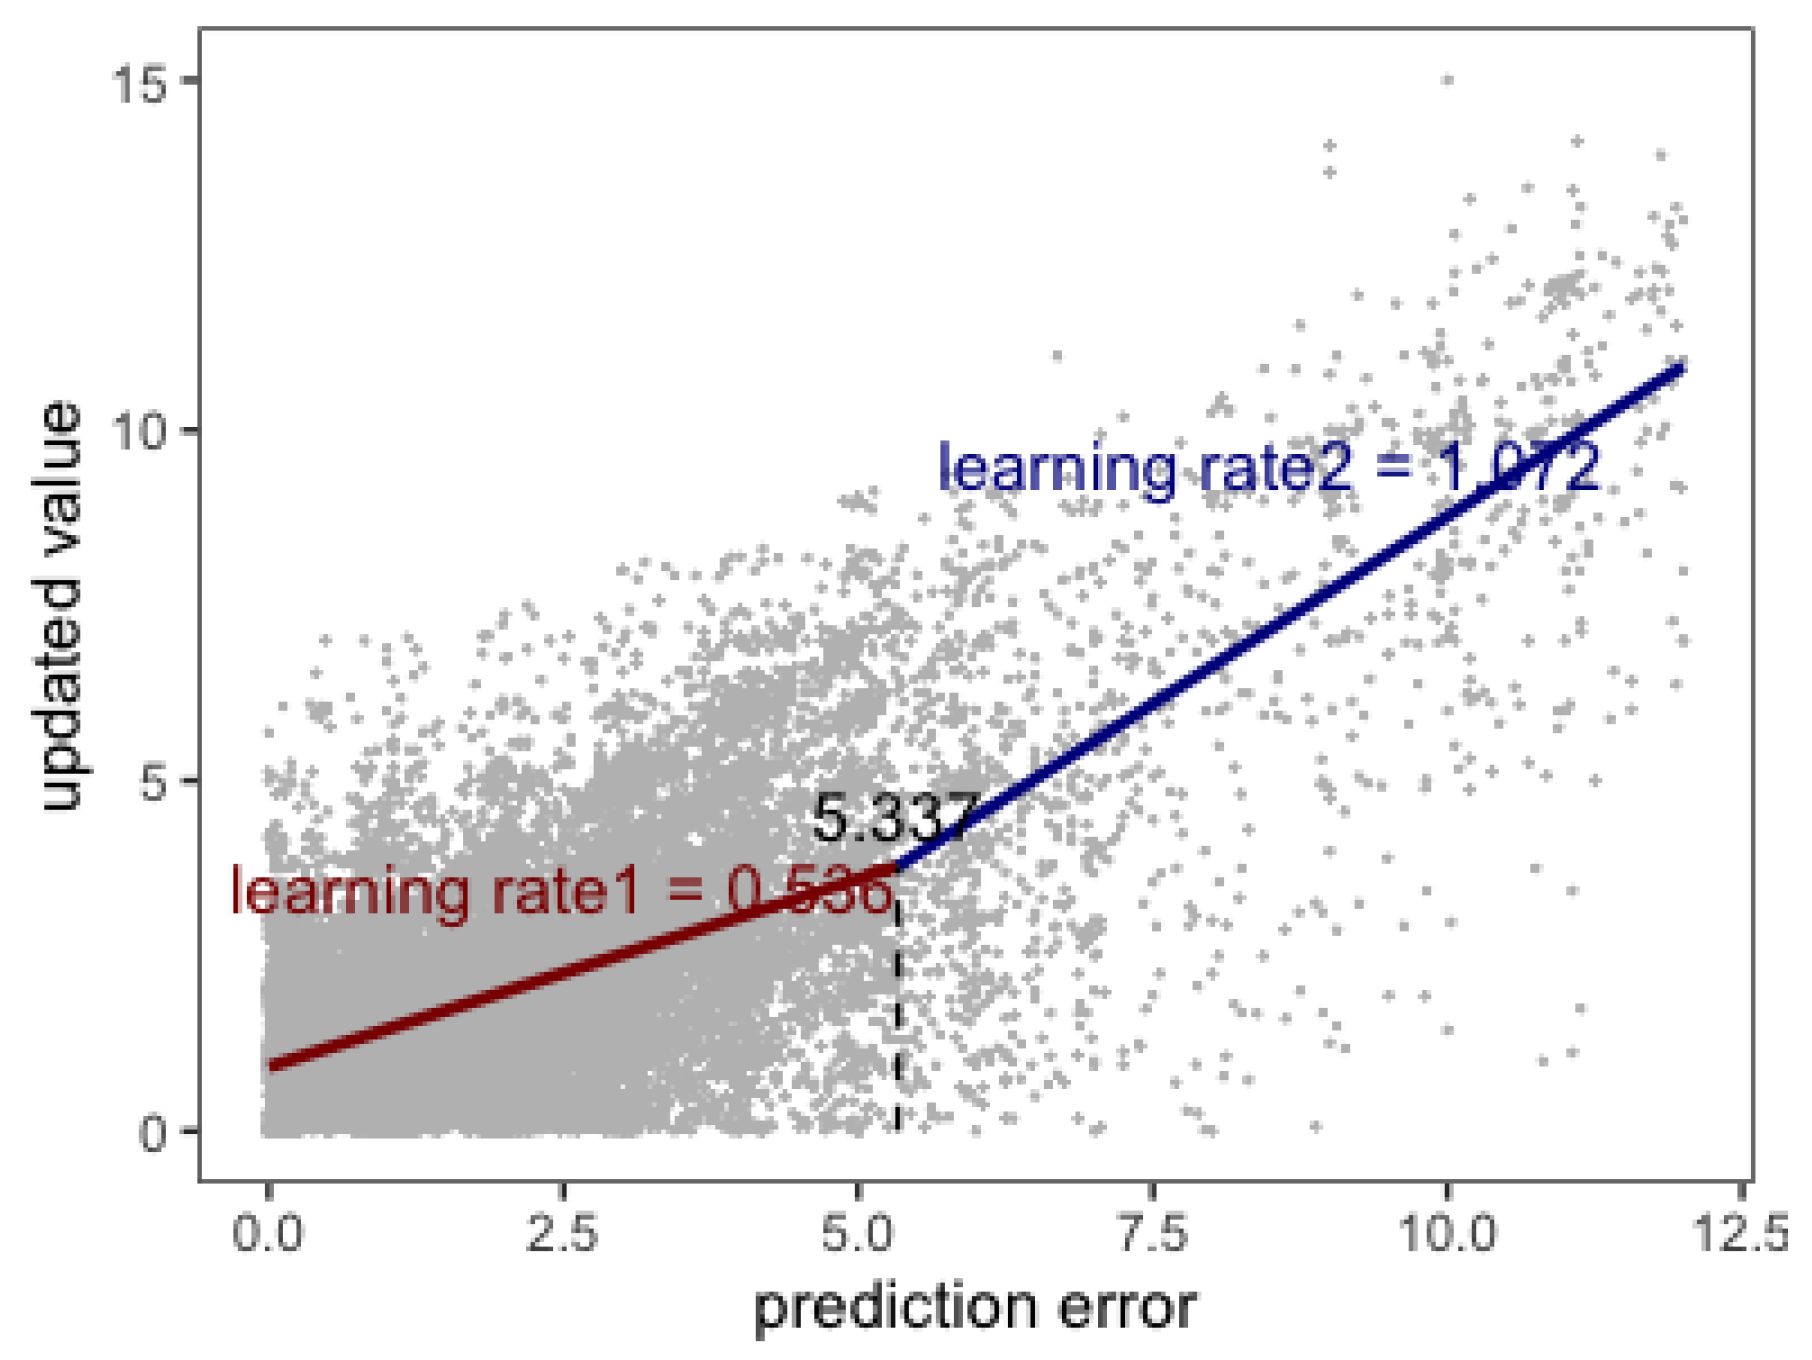
| β0 | β1 | δ | Breakpoint |
|---|---|---|---|
| 0.916 | 0.536 | 0.536 | 5.337 |
| β | SE | z Value | Pr (>|z|) | Exp (β) | |
|---|---|---|---|---|---|
| (Intercept) | −3.459 | 0.104 | −33.134 | <0.001 *** | 0.031 |
| gradually change | 0.575 | 0.088 | 6.524 | <0.001 *** | 1.777 |
| randomly fluctuate in the abrupt block | −0.361 | 0.087 | −4.158 | <0.001 *** | 0.697 |
| abruptly change | 7.999 | 0.434 | 18.417 | <0.001 *** | 2976.766 |
| β | SE | df | t Value | Pr ( > |t|) | |
|---|---|---|---|---|---|
| (Intercept) | 0.885 | 0.018 | 116.939 | 49.601 | <0.001 *** |
| gradually change | −0.034 | 0.007 | 20,900.043 | −5.182 | <0.001 *** |
| randomly fluctuate in the abrupt block | −0.028 | 0.005 | 20,900.093 | −5.261 | <0.001 *** |
| abruptly change | 0.221 | 0.017 | 20,900.295 | 13.041 | <0.001 *** |
Disclaimer/Publisher’s Note: The statements, opinions and data contained in all publications are solely those of the individual author(s) and contributor(s) and not of MDPI and/or the editor(s). MDPI and/or the editor(s) disclaim responsibility for any injury to people or property resulting from any ideas, methods, instructions or products referred to in the content. |
© 2022 by the authors. Licensee MDPI, Basel, Switzerland. This article is an open access article distributed under the terms and conditions of the Creative Commons Attribution (CC BY) license (https://creativecommons.org/licenses/by/4.0/).
Share and Cite
Liang, D.; Liu, M.; Fu, Y.; Sun, J.; Wang, H. A New Explanation for the Frog-in-the-Pan Phenomenon Based on the Cognitive-Evolutionary Model of Surprise. Behav. Sci. 2023, 13, 7. https://doi.org/10.3390/bs13010007
Liang D, Liu M, Fu Y, Sun J, Wang H. A New Explanation for the Frog-in-the-Pan Phenomenon Based on the Cognitive-Evolutionary Model of Surprise. Behavioral Sciences. 2023; 13(1):7. https://doi.org/10.3390/bs13010007
Chicago/Turabian StyleLiang, Dapeng, Mengting Liu, Yang Fu, Jiayin Sun, and Hongyan Wang. 2023. "A New Explanation for the Frog-in-the-Pan Phenomenon Based on the Cognitive-Evolutionary Model of Surprise" Behavioral Sciences 13, no. 1: 7. https://doi.org/10.3390/bs13010007
APA StyleLiang, D., Liu, M., Fu, Y., Sun, J., & Wang, H. (2023). A New Explanation for the Frog-in-the-Pan Phenomenon Based on the Cognitive-Evolutionary Model of Surprise. Behavioral Sciences, 13(1), 7. https://doi.org/10.3390/bs13010007