
Developing an Open Innovation Attitude Assessment Framework for Organizations: Focusing on Open Innovation Role Perspective and Locus of Activity


Abstract
:1. Introduction
2. Materials and Methods
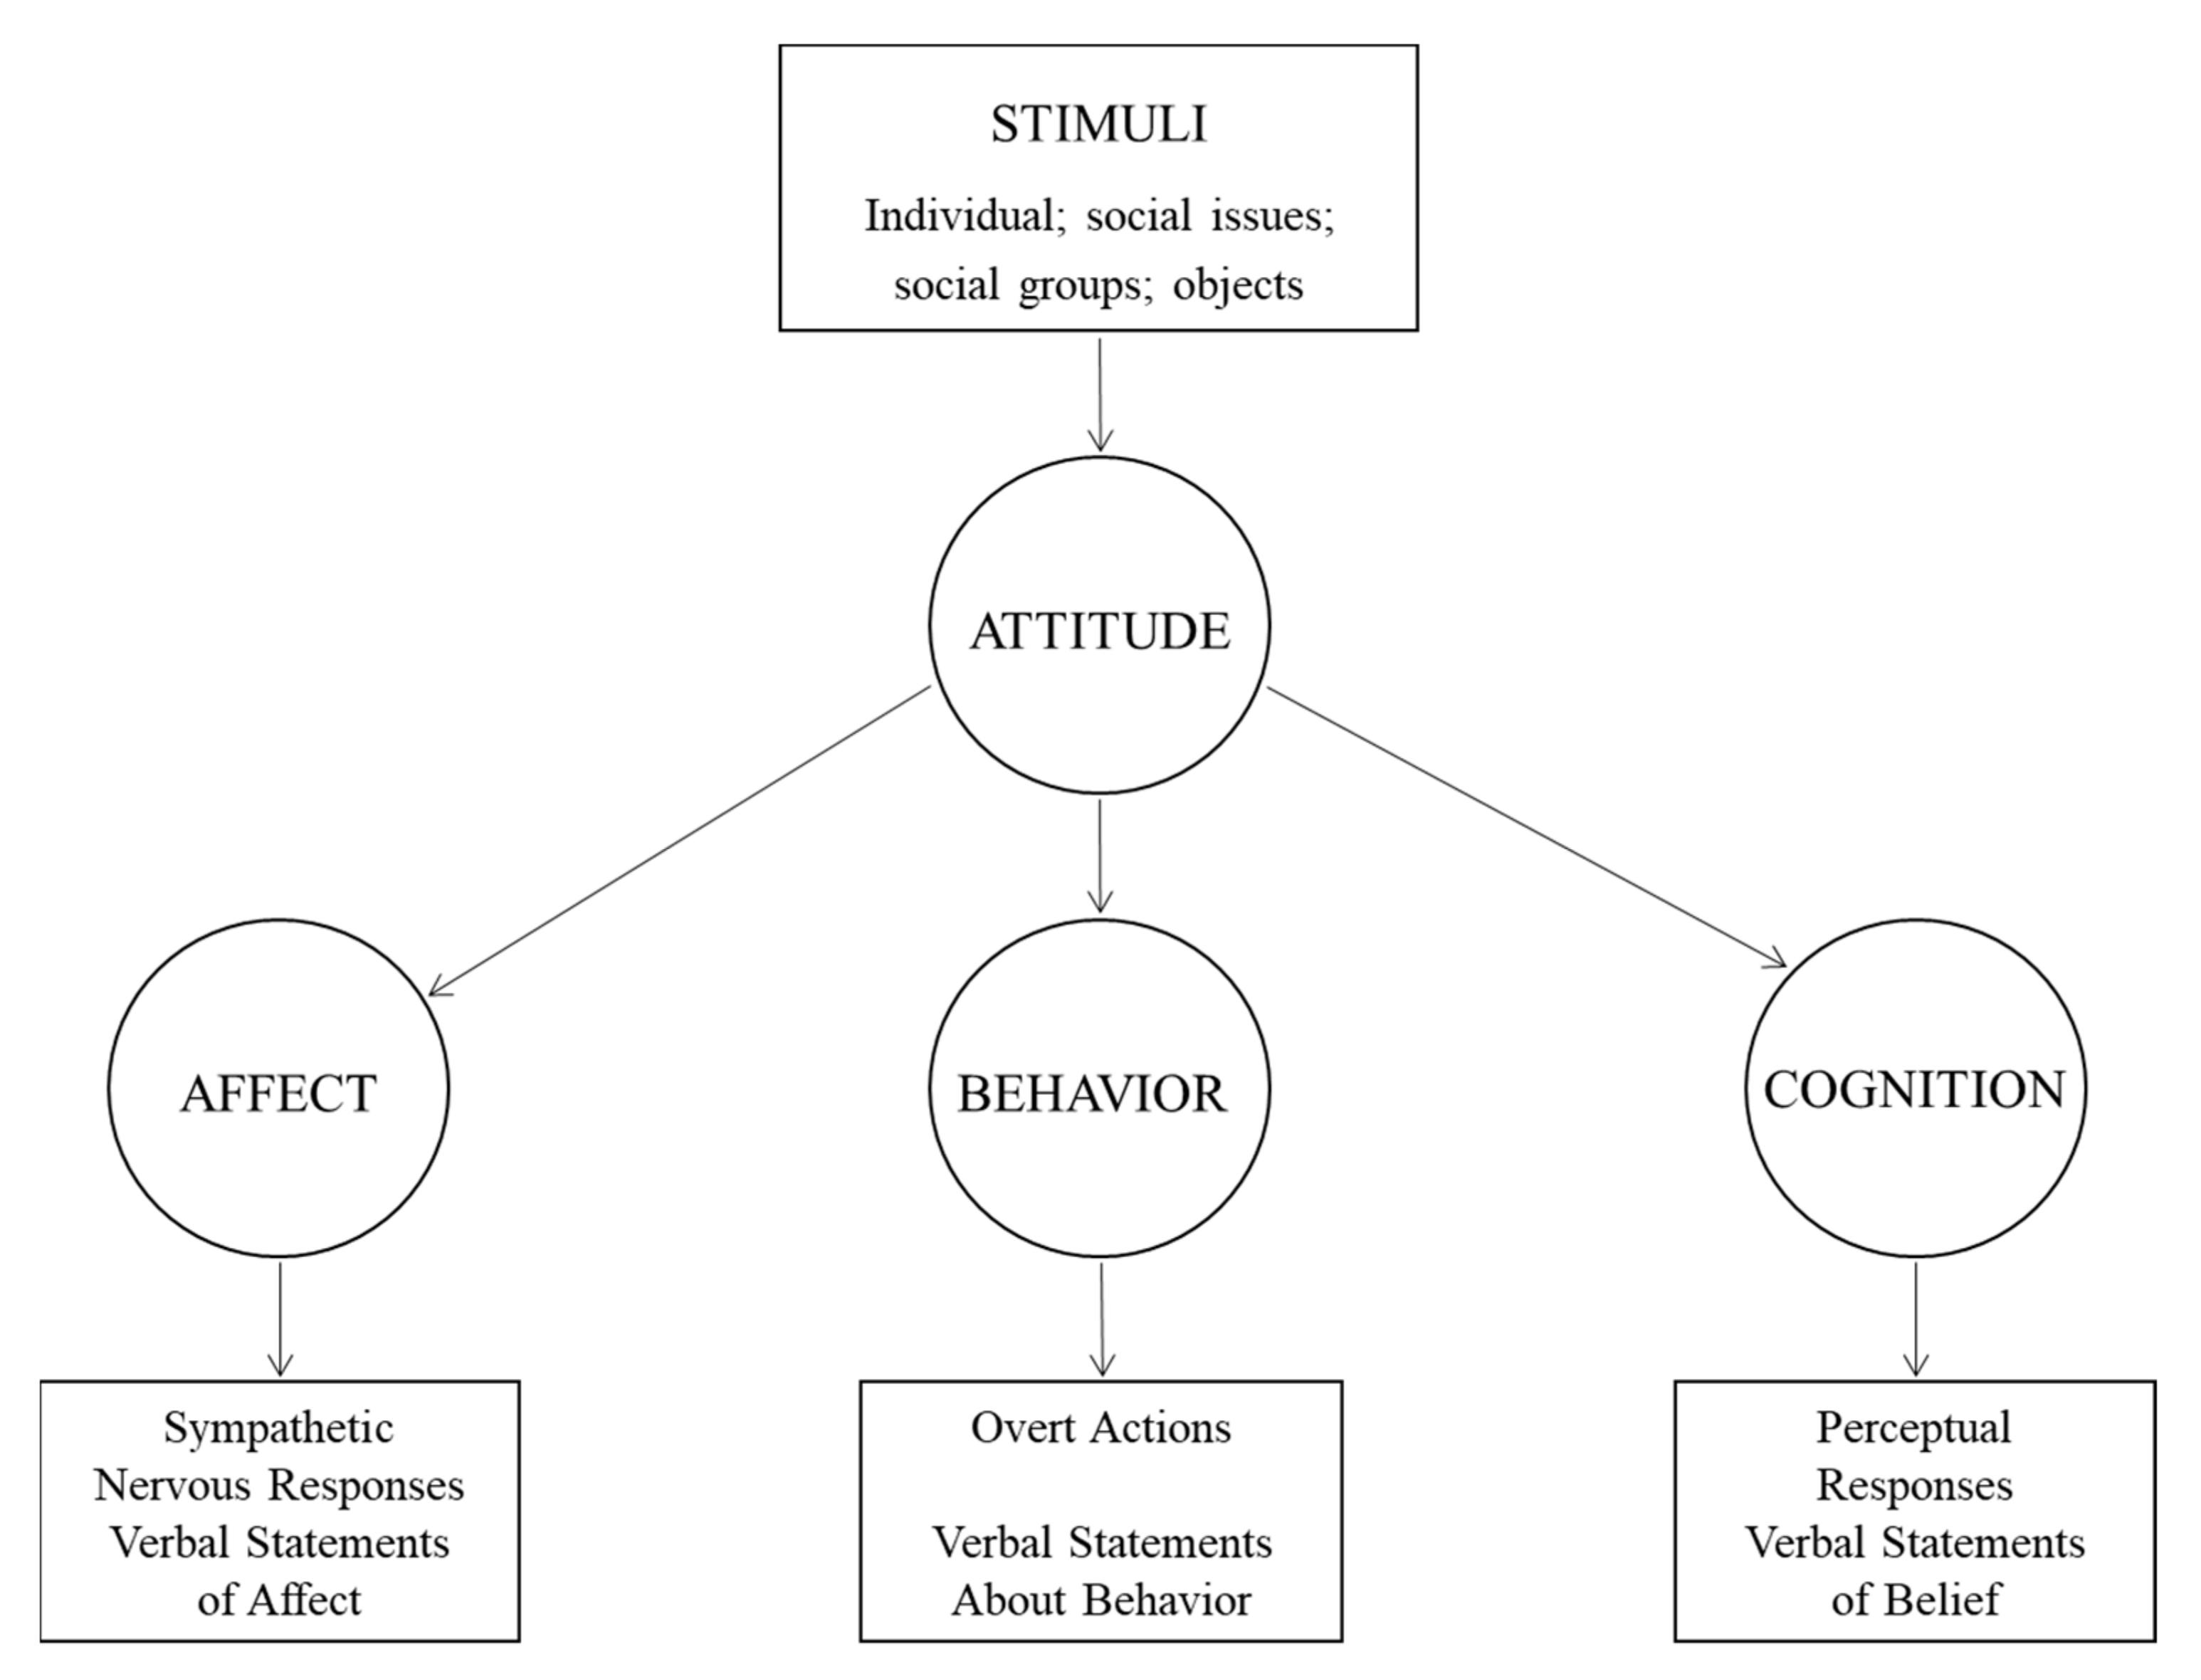
2.1. Literature Review
2.2. Research Framework and Scale Development
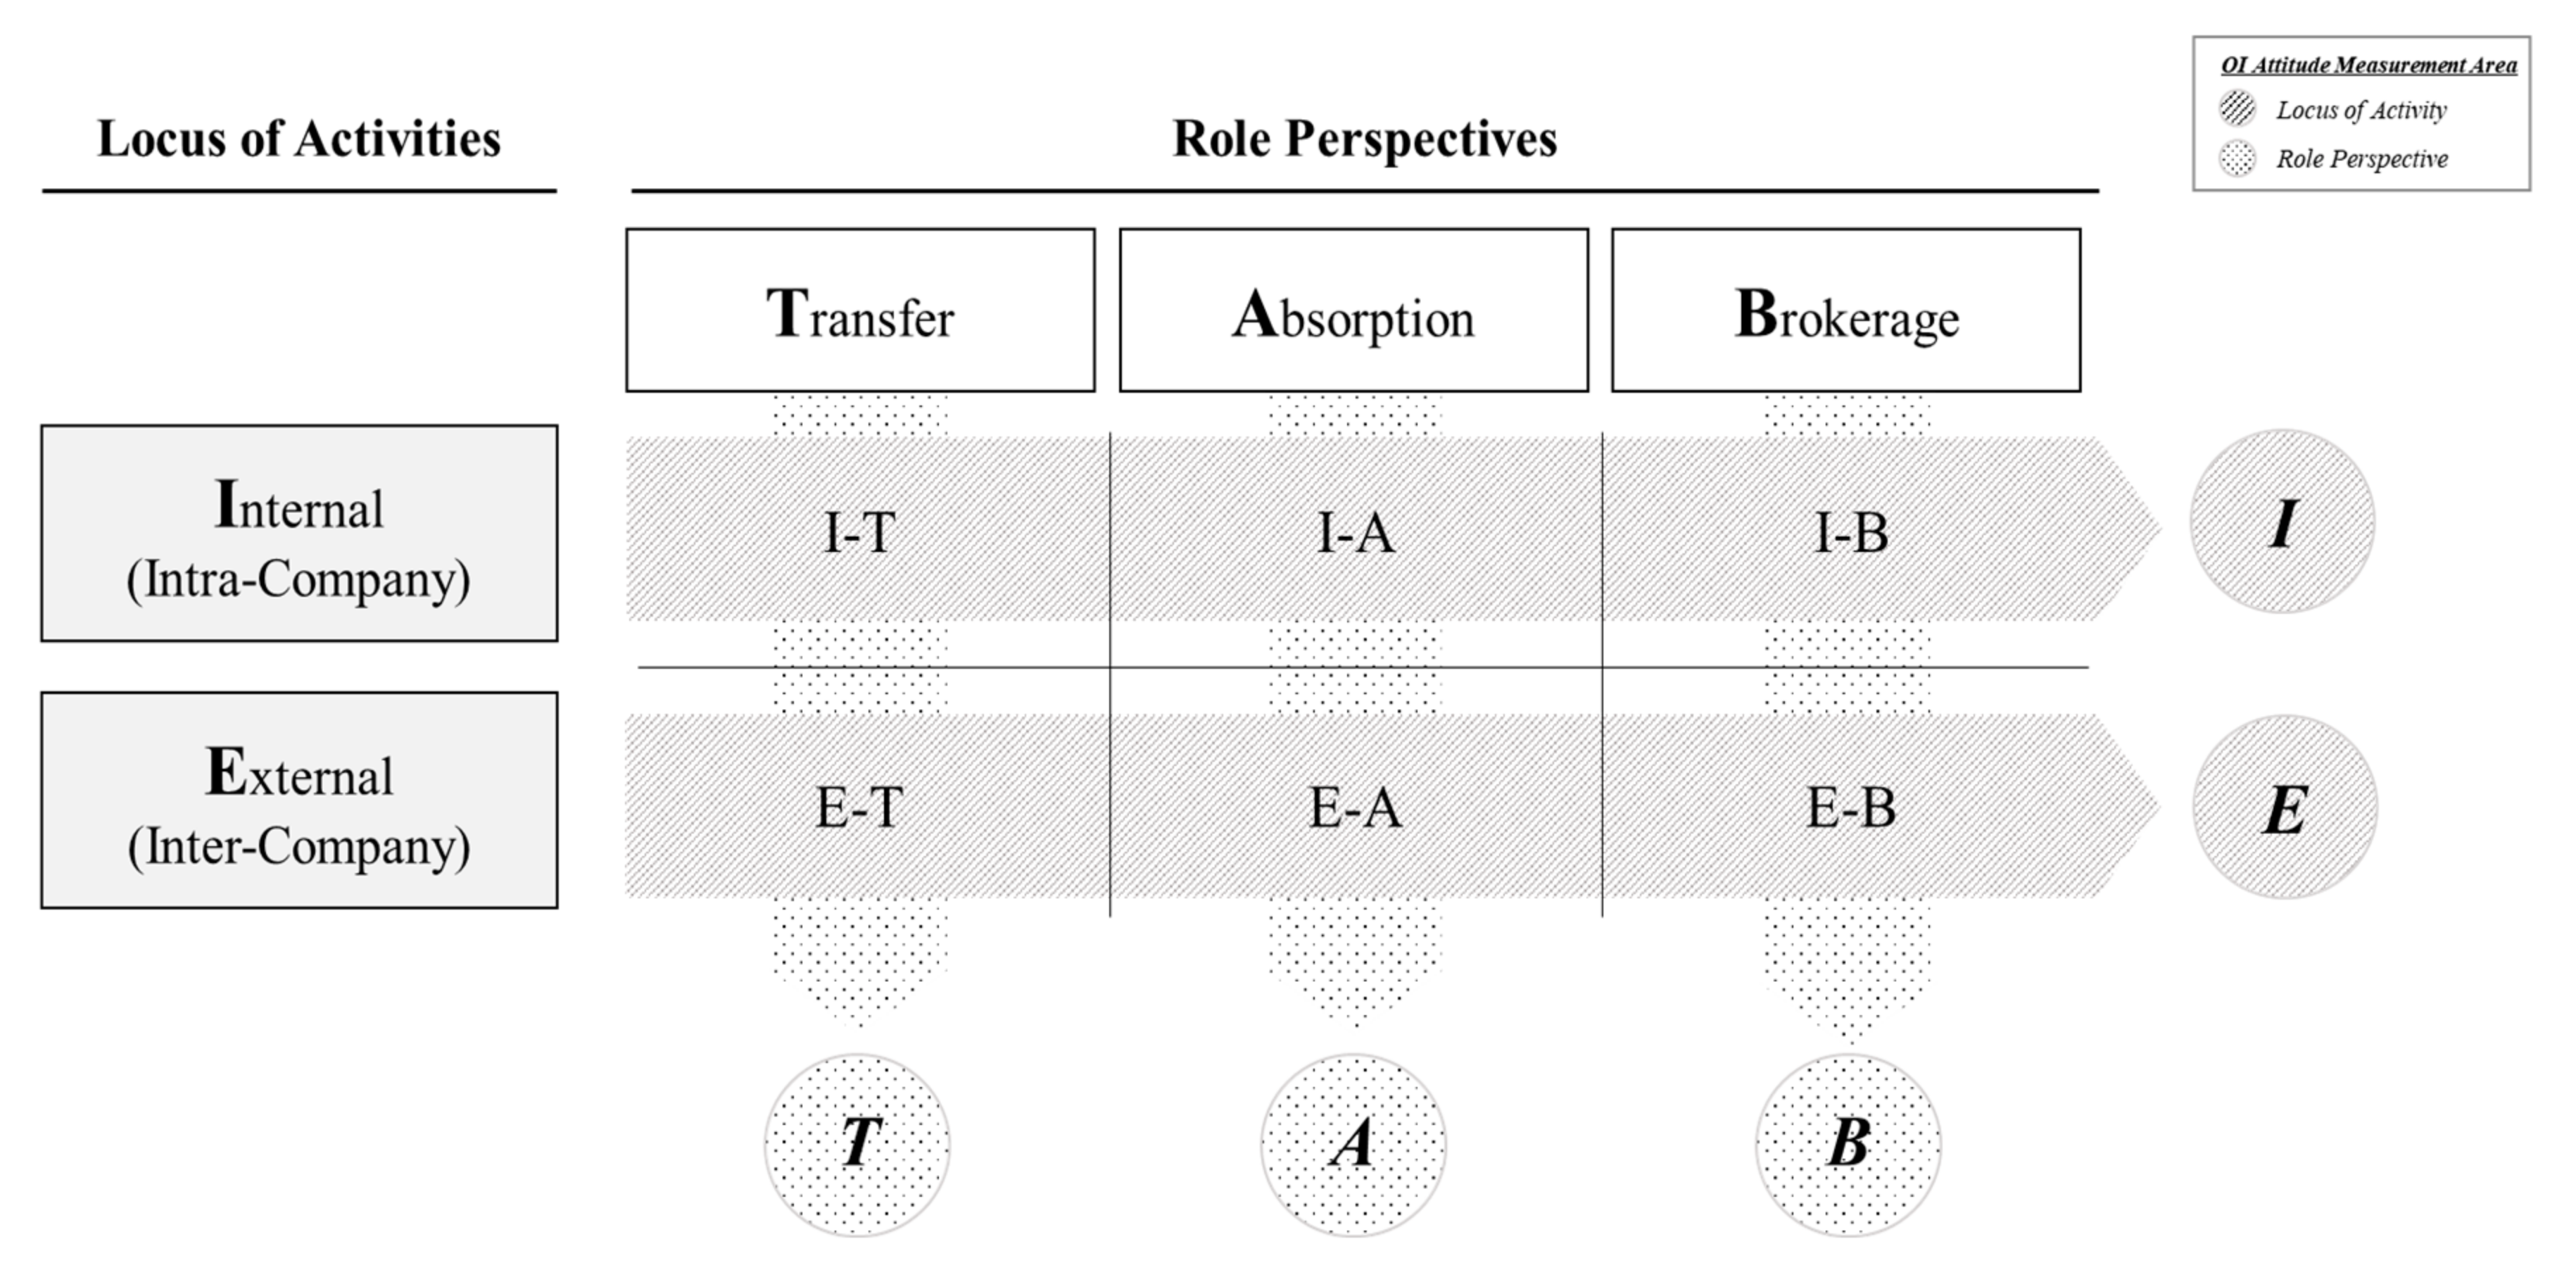
2.2.1. Conceptual Research Model for Organizational OI Attitude Assessment Framework
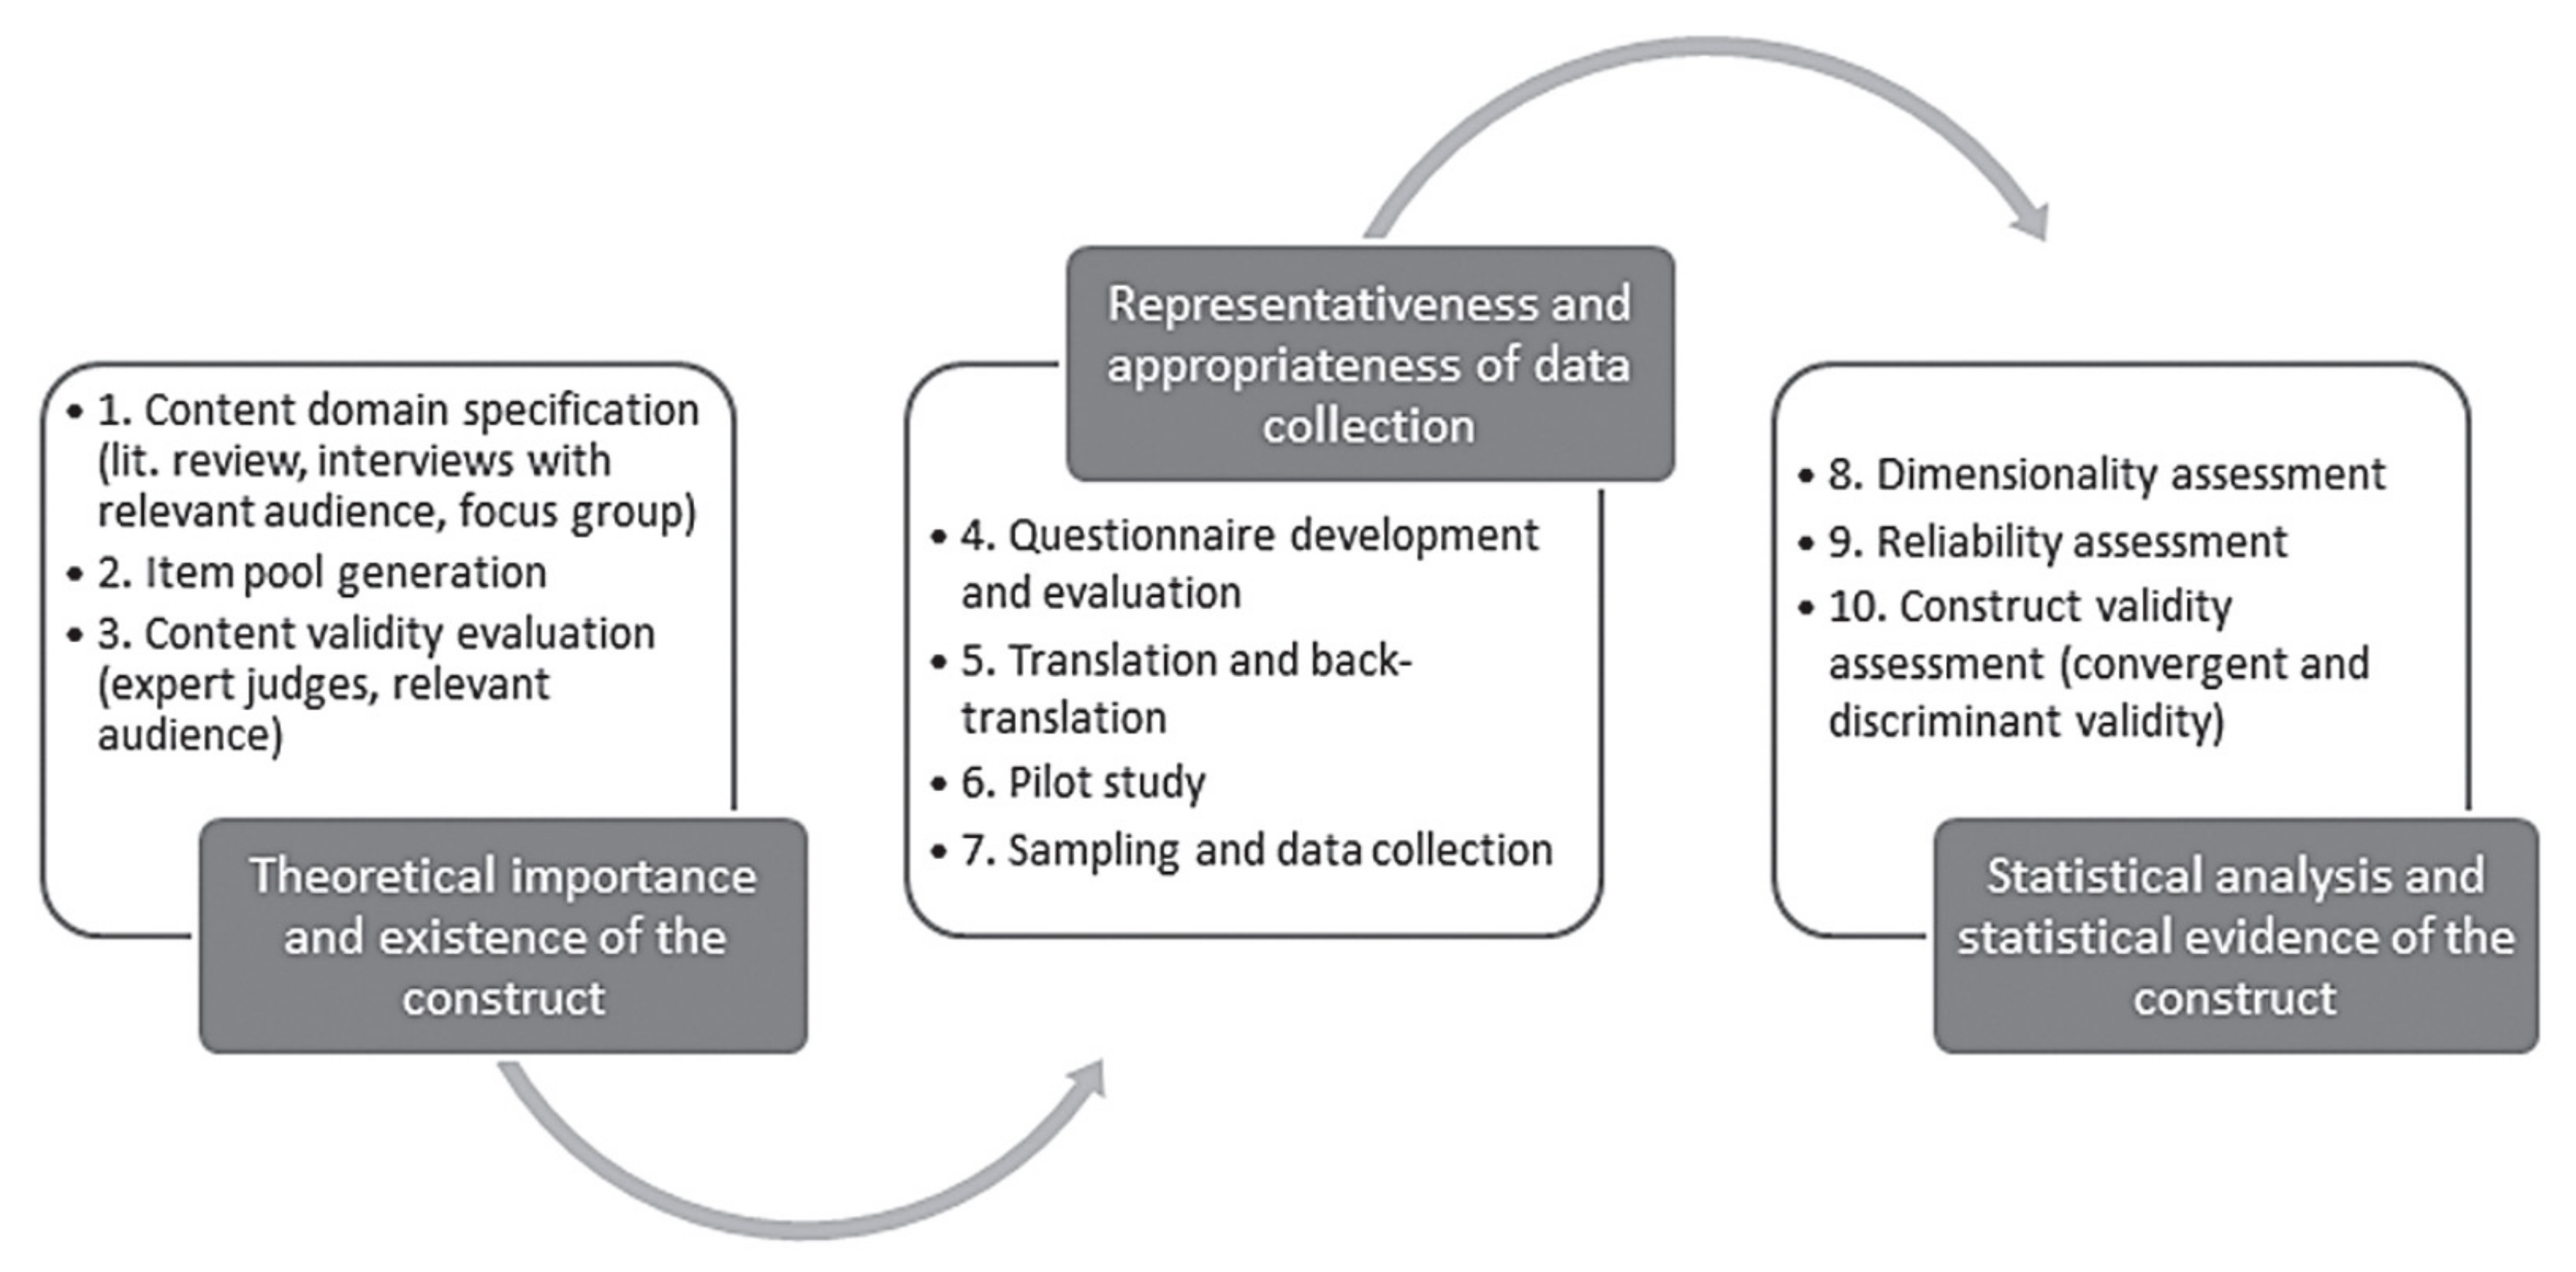
2.2.2. OI Attitude Assessment Questionnaire Development and Validation
2.2.3. Exploration of the Concepts of Content Validity and Item Generation
2.2.4. Hollis Reliability Test for Delphi Survey (1)
- (1)
- OI Locus of Activities.Expert A: B = 0.5000; Expert A: C = 0.5000; Expert B: C = 0.5000.
- (2)
- OI Role Perspectives.Expert A: B = 0.3333; Expert A: C = 0.3333; Expert B: C = 0.6667.
- (3)
- COIAA.Expert A: B = 0.4000; Expert A: C = 0.4000; Expert B: C = 0.6000.
2.2.5. Hollis Reliability Test for Delphi Survey (2)
- (1)
- OI Locus of Activities.Expert A: B = 0.5000; Expert A: C = 0.5000; Expert B: C = 0.5000.
- (2)
- OI Role Perspectives.Expert A: B = 0.3333; Expert A: C = 0.3333; Expert B: C = 0.6667.
- (3)
- COIAA.Expert A: B = 0.4000; Expert A: C = 0.4000; Expert B: C = 0.6000.
2.2.6. Results of the Pilot Study
2.2.7. Item Analysis for COIAA Main Survey
2.2.8. Qualitative Research and the Generation of Initial Questionnaire Items
3. Data Analysis Results and Discussion
3.1. Data Collection and Analysis
Data Collection Process and Sample Description
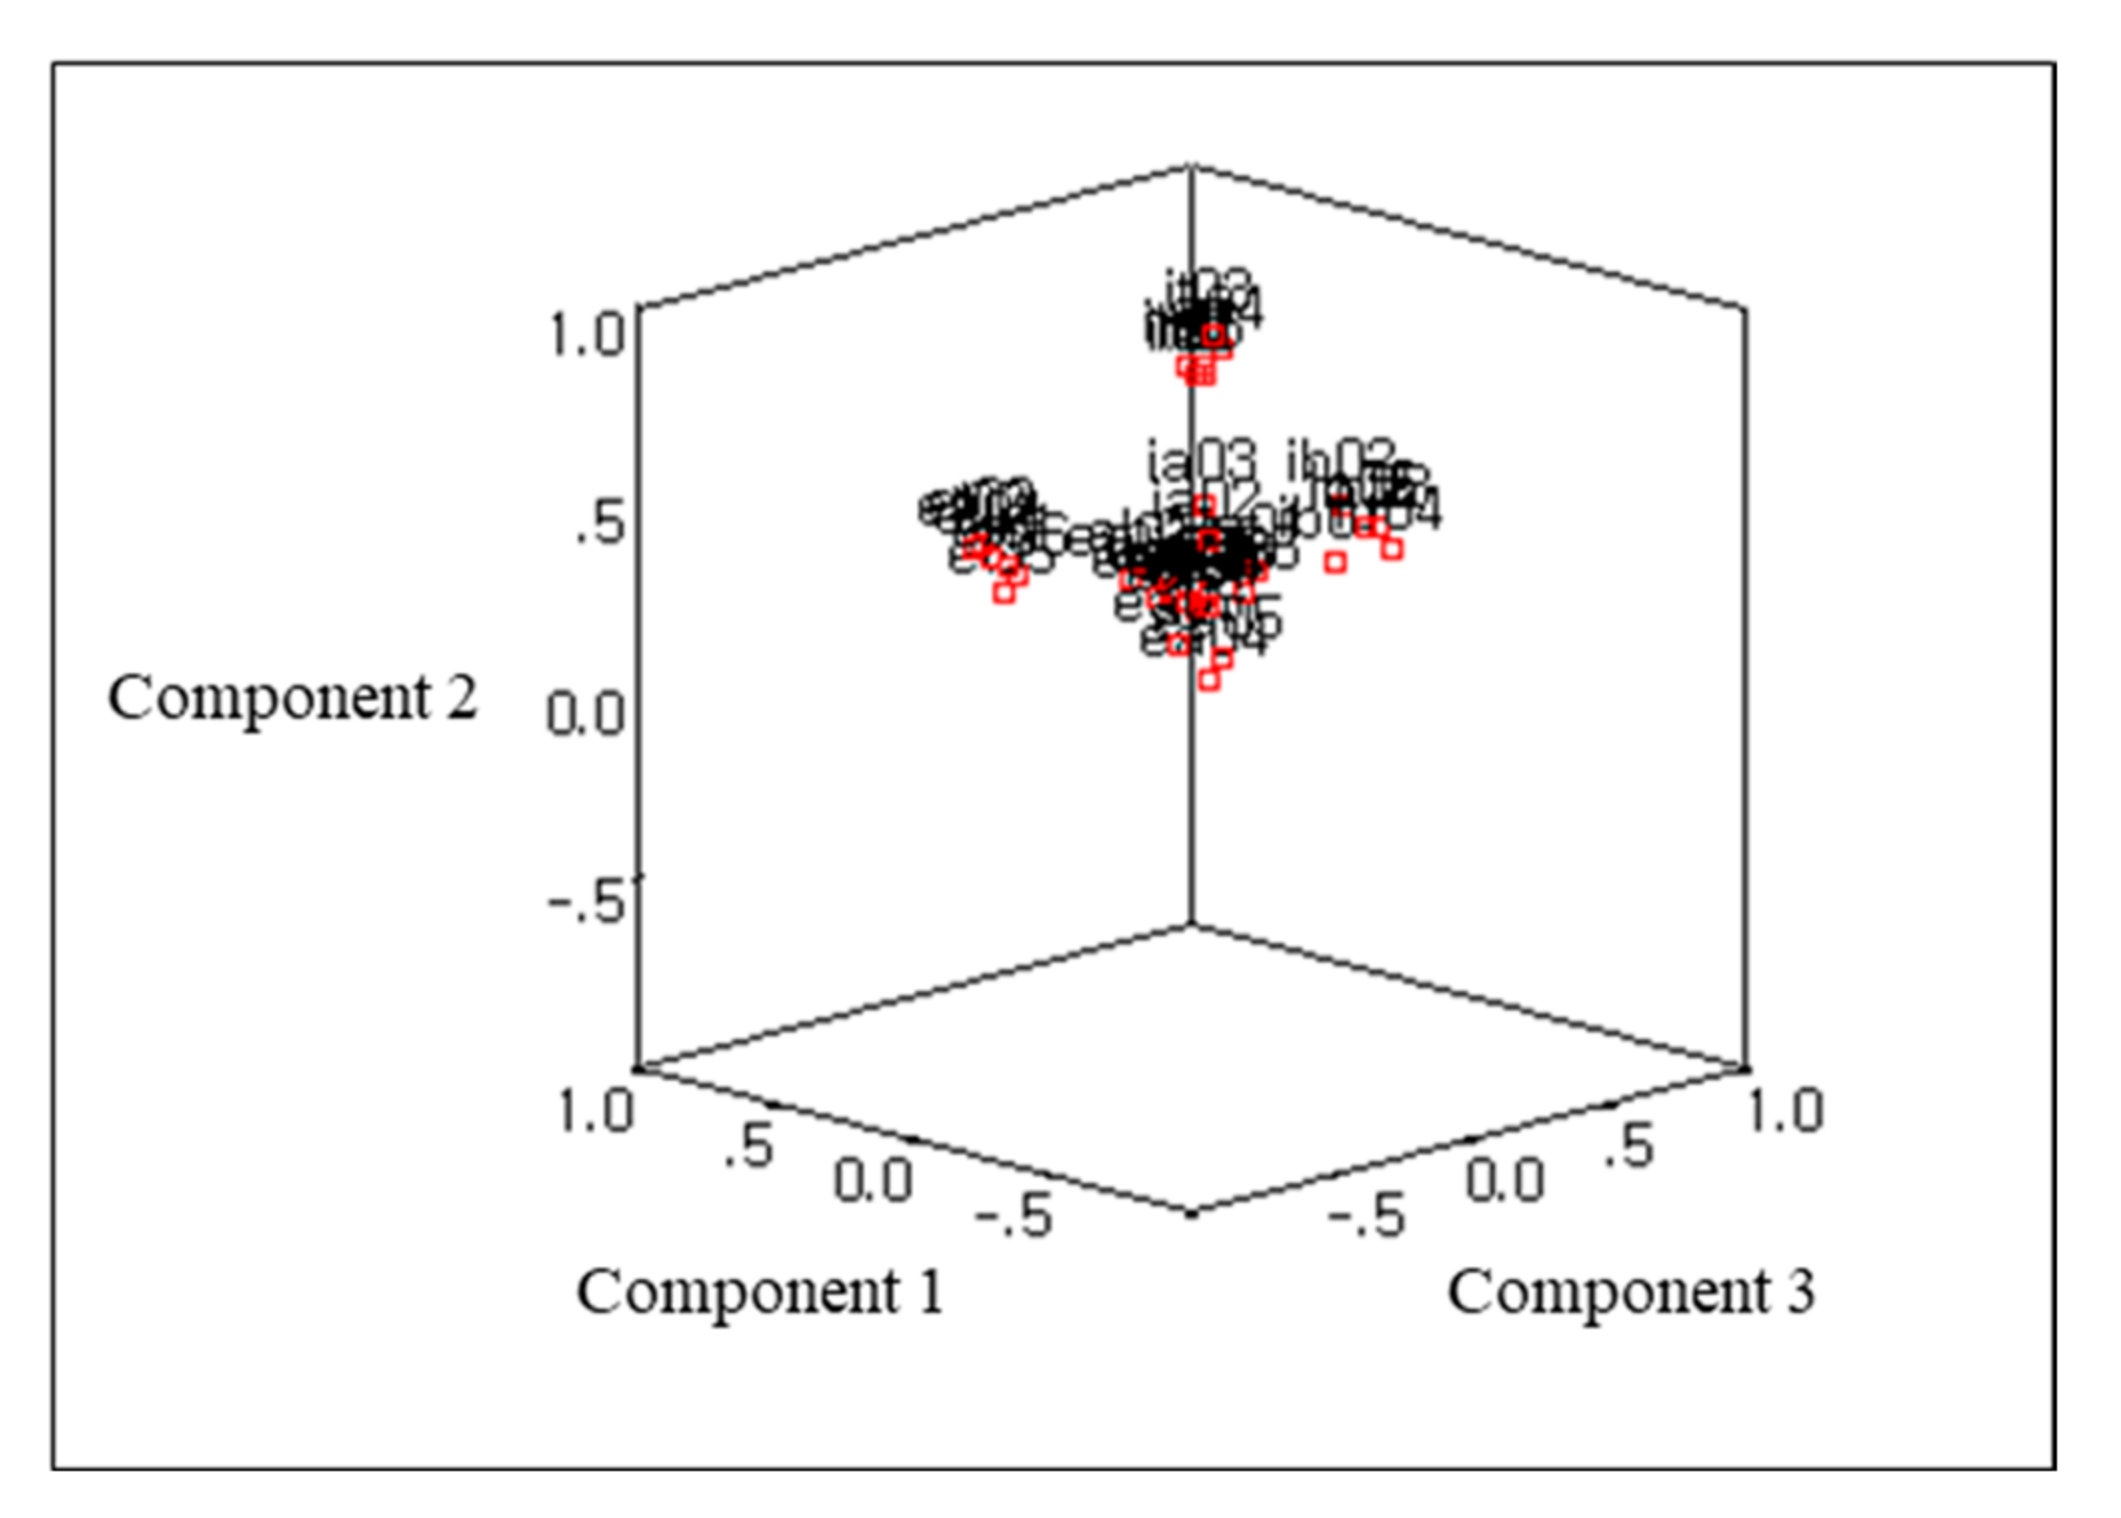
3.2. Assessment of Factor Structure and Reliability
3.3. Assessment of Validity
4. Conclusions and Future Research Direction
4.1. Theoretical Contributions
4.2. Practical Implications
4.3. Limitations and Future Research Directions
Author Contributions
Funding
Institutional Review Board Statement
Informed Consent Statement
Data Availability Statement
Conflicts of Interest
Appendix A

| Internal (Intra-Company) OI Attitude | S. Disagree S. Agree |
|---|---|
| I-1. Perceived Transfer-out Attitude | |
| Members of my team (a) ______ work-related skills or knowledge possessed by my team (b)______ | |
| (1) (a) are interested in providing / (b) to other teams. | ① ② ③ ④ ⑤ ⑥ ⑦ |
| (2) (a) naturally provide / (b) to other teams. | ① ② ③ ④ ⑤ ⑥ ⑦ |
| (3) (a) feel that we should provide / (b) to other teams. | ① ② ③ ④ ⑤ ⑥ ⑦ |
| (4) (a) think providing / (b) to other teams will help my team. | ① ② ③ ④ ⑤ ⑥ ⑦ |
| (5) (a) think providing / (b) to other teams will improve my team’s performance. | ① ② ③ ④ ⑤ ⑥ ⑦ |
| (6) (a) think providing / (b) to other teams will strengthen my team’s capabilities. | ① ② ③ ④ ⑤ ⑥ ⑦ |
| I-2. Perceived Absorptive Attitude | |
| Members of my team (a)______ work-related skills or knowledge possessed by other teams (b)______ | |
| (1) (a) are interested in taking in / (b) n/a | ① ② ③ ④ ⑤ ⑥ ⑦ |
| (2) (a) naturally accept taking in / (b) n/a | ① ② ③ ④ ⑤ ⑥ ⑦ |
| (3) (a) feel that we should be taking in / (b) n/a | ① ② ③ ④ ⑤ ⑥ ⑦ |
| (4) (a) think taking in / (b) will help my team. | ① ② ③ ④ ⑤ ⑥ ⑦ |
| (5) (a) think taking in / (b) will improve my team’s performance. | ① ② ③ ④ ⑤ ⑥ ⑦ |
| (6) (a) think taking in / (b) will strengthen my team’s capabilities. | ① ② ③ ④ ⑤ ⑥ ⑦ |
| I-3. Perceived Brokerage Attitude | |
| Members of my team (a)_____ work-related skills or knowledge possessed by other teams (b)______ | |
| (1) (a) are interested in connecting / (b) in between them. | ① ② ③ ④ ⑤ ⑥ ⑦ |
| (2) (a) naturally accept connecting / (b) in between them. | ① ② ③ ④ ⑤ ⑥ ⑦ |
| (3) (a) feel that we should connect / (b) in between them. | ① ② ③ ④ ⑤ ⑥ ⑦ |
| (4) (a) think connecting / (b) in between them will help my team. | ① ② ③ ④ ⑤ ⑥ ⑦ |
| (5) (a) think connecting / (b) in between them will improve my team’s performance. | ① ② ③ ④ ⑤ ⑥ ⑦ |
| (6) (a) think connecting / (b) in between them will strengthen my team’s capabilities. | ① ② ③ ④ ⑤ ⑥ ⑦ |
| External (Inter-Company) OI Attitude | S. Disagree S. Agree |
| E-1. Perceived Transfer-out Attitude | |
| Members of my company (a)____ work-related skills or knowledge possessed by my company (b)_____ | |
| (1) (a) are interested in providing / (b) to business partners. | ① ② ③ ④ ⑤ ⑥ ⑦ |
| (2) (a) naturally provide / (b) to business partners. | ① ② ③ ④ ⑤ ⑥ ⑦ |
| (3) (a) feel that we should provide / (b) to business partners. | ① ② ③ ④ ⑤ ⑥ ⑦ |
| (4) (a) think providing / (b) to business partners will help my company. | ① ② ③ ④ ⑤ ⑥ ⑦ |
| (5) (a) think providing / (b) to business partners will improve my company’s performance. | ① ② ③ ④ ⑤ ⑥ ⑦ |
| (6) (a) think providing / (b) to business partners will strengthen my company’s capabilities. | ① ② ③ ④ ⑤ ⑥ ⑦ |
| E-2. Perceived Absorptive Attitude | |
| Members of my company (a)___ work-related skills or knowledge possessed by business partners (b)___ | |
| (1) (a) are interested in taking in / (b) n/a | ① ② ③ ④ ⑤ ⑥ ⑦ |
| (2) (a) naturally accept taking in / (b) n/a | ① ② ③ ④ ⑤ ⑥ ⑦ |
| (3) (a) feel that we should be taking in / (b) n/a | ① ② ③ ④ ⑤ ⑥ ⑦ |
| (4) (a) think taking in / (b) will help my company. | ① ② ③ ④ ⑤ ⑥ ⑦ |
| (5) (a) think taking in / (b) will improve my company’s performance. | ① ② ③ ④ ⑤ ⑥ ⑦ |
| (6) (a) think taking in / (b) will strengthen my company’s capabilities. | ① ② ③ ④ ⑤ ⑥ ⑦ |
| E-3. Perceived Brokerage Attitude | |
| Members of my company (a)___ work-related skills or knowledge possessed by business partners (b)___ | |
| (1) (a) are interested in connecting / (b) in between them. | ① ② ③ ④ ⑤ ⑥ ⑦ |
| (2) (a) naturally accept connecting / (b) in between them. | ① ② ③ ④ ⑤ ⑥ ⑦ |
| (3) (a) feel that we should connect / (b) in between them. | ① ② ③ ④ ⑤ ⑥ ⑦ |
| (4) (a) think connecting / (b) in between them will help my company. | ① ② ③ ④ ⑤ ⑥ ⑦ |
| (5) (a) think connecting / (b) in between them will improve my company’s performance. | ① ② ③ ④ ⑤ ⑥ ⑦ |
| (6) (a) think connecting / (b) in between them will strengthen my company’s capabilities. | ① ② ③ ④ ⑤ ⑥ ⑦ |
| Locus of OI Activity | Role Perspectives | Variable | Component | ||||||
|---|---|---|---|---|---|---|---|---|---|
| 1 | 2 | 3 | 4 | 5 | 6 | ||||
| Internal | Transfer | I-T. Perceived Transfer-out Attitude Members of my team (a)______ work-related skills or knowledge possessed by my team (b)_____ | |||||||
| I-T-1 | (a) are interested in providing/(b) to other teams. | 0.77 | - | - | - | - | - | ||
| I-T-2 | (a) naturally provide/(b) to other teams. | 0.77 | - | - | - | - | - | ||
| I-T-3 | (a) feel that we should provide/(b) to other teams. | 0.88 | - | - | - | - | - | ||
| I-T-4 | (a) think providing/(b) to other teams will help my team. | 0.82 | - | - | - | - | - | ||
| I-T-5 | (a) think providing/(b) to other teams will improve my team’s performance. | 0.79 | - | - | - | - | - | ||
| I-T-6 | (a) think providing/(b) to other teams will strengthen my team’s capabilities. | 0.76 | - | - | - | - | - | ||
| Absorption | I-A. Perceived Absorptive Attitude Members of my team (a)_____ work-related skills or knowledge possessed by other teams (b)____ | ||||||||
| I-A-1 | (a) are interested in taking in/(b) n/a | - | 0.67 | 0.32 | - | - | - | ||
| I-A-2 | (a) naturally accept taking in/(b) n/a | 0.34 | 0.77 | - | - | - | - | ||
| I-A-3 | (a) feel that we should be taking in/(b) n/a | 0.42 | 0.64 | - | - | - | - | ||
| I-A-4 | (a) think taking in/(b) will help my team. | - | 0.88 | - | - | - | - | ||
| I-A-5 | (a) think taking in/(b) will improve my team’s performance. | - | 0.83 | - | - | - | - | ||
| I-A-6 | (a) think taking in/(b) will strengthen my team’s capabilities. | - | 0.83 | - | - | - | - | ||
| Brokerage | I-B. Perceived Brokerage Attitude Members of my team (a)_____ work-related skills or knowledge possessed by other teams (b)____ | ||||||||
| I-B-1 | (a) are interested in connecting/(b) in between them. | - | - | 0.76 | - | - | - | ||
| I-B-2 | (a) naturally accept connecting/(b) in between them. | - | - | 0.78 | - | - | - | ||
| I-B-3 | (a) feel that we should connect/(b) in between them. | - | - | 0.83 | - | - | - | ||
| I-B-4 | (a) think connecting/(b) in between them will help my team. | - | - | 0.83 | - | - | - | ||
| I-B-5 | (a) think connecting/(b) in between them will improve my team’s performance. | - | - | 0.76 | - | - | 0.36 | ||
| I-B-6 | (a) think connecting/(b) in between them will strengthen my team’s capabilities. | - | - | 0.76 | - | - | 0.31 | ||
| External | Transfer | E-T. Perceived Transfer-out Attitude Members of my company (a)___ work-related skills or knowledge possessed by my company (b)____ | |||||||
| E-T-1 | (a) are interested in providing/(b) to business partners. | - | - | - | 0.79 | - | - | ||
| E-T-2 | (a) naturally provide/(b) to business partners. | - | - | - | 0.87 | - | - | ||
| E-T-3 | (a) feel that we should provide/(b) to business partners. | - | - | - | 0.89 | - | - | ||
| E-T-4 | (a) think providing/(b) to business partners will help my company. | - | - | - | 0.86 | - | - | ||
| E-T-5 | (a) think providing/(b) to business partners will improve my company’s performance. | - | - | - | 0.84 | - | - | ||
| E-T-6 | (a) think providing/(b) to business partners will strengthen my company’s capabilities. | - | - | - | 0.83 | - | - | ||
| Absorption | E-A. Perceived Absorptive Attitude Members of my company (a)____ work-related skills or knowledge possessed by business partners (b)____ | ||||||||
| E-A-1 | (a) are interested in taking in/(b) n/a | - | - | - | - | 0.79 | - | ||
| E-A-2 | (a) naturally accept taking in/(b) n/a | - | - | - | 0.31 | 0.68 | - | ||
| E-A-3 | (a) feel that we should be taking in/(b) n/a | - | - | - | 0.31 | 0.77 | - | ||
| E-A-4 | (a) think taking in/(b) will help my company. | - | 0.34 | - | - | 0.85 | - | ||
| E-A-5 | (a) think taking in/(b) will improve my company’s performance. | - | 0.32 | - | - | 0.81 | - | ||
| E-A-6 | (a) think taking in/(b) will strengthen my company’s capabilities. | - | 0.34 | - | - | 0.74 | - | ||
| Brokerage | E-B. Perceived Brokerage Attitude Members of my company (a)____ work-related skills or knowledge possessed by business partners (b)____ | ||||||||
| E-B-1 | (a) are interested in connecting/(b) in between them. | - | - | - | 0.40 | - | 0.73 | ||
| E-B-2 | (a) naturally accept connecting/(b) in between them. | - | - | - | 0.42 | - | 0.74 | ||
| E-B-3 | (a) feel that we should connect/(b) in between them. | - | - | 0.31 | 0.37 | - | 0.75 | ||
| E-B-4 | (a) think connecting/(b) in between them will help my company. | - | - | - | - | - | 0.84 | ||
| E-B-5 | (a) think connecting/(b) in between them will improve my company’s performance. | - | - | - | - | - | 0.82 | ||
| E-B-6 | (a) think connecting/(b) in between them will strengthen my company’s capabilities. | - | - | 0.30 | - | - | 0.83 | ||
| Eigen-value | 5.66 | 5.01 | 5.00 | 4.93 | 4.71 | 4.58 | |||
| % of Variance | 15.73 | 13.92 | 13.90 | 13.71 | 13.08 | 12.72 | |||
| Cumulative % | 15.73 | 29.65 | 43,55 | 57.26 | 70.34 | 83.06 | |||
| Cronbach’s Alpha | 0.942 | 0.912 | 0.961 | 0.964 | 0.934 | 0.978 | |||
References
- Hossain, M.; Islam, K.Z.; Abu Sayeed, M.; Kauranen, I. A comprehensive review of open innovation literature. J. Sci. Technol. Policy Manag. 2016, 7, 2–25. [Google Scholar] [CrossRef]
- Huizingh, E.K. Open innovation: State of the art and future perspectives. Technovation 2011, 31, 2–9. [Google Scholar] [CrossRef]
- Chesbrough, H. Open Innovation: The New Imperative for Creating and Profiting from Technology; Harvard Business School Press: Boston, MA, USA, 2003. [Google Scholar]
- Sivam, A.; Dieguez, T.; Ferreira, L.P.; Silva, F. Key settings for successful Open Innovation Arena. J. Comput. Des. Eng. 2019, 6, 507–515. [Google Scholar] [CrossRef]
- Podmetina, D.; Soderquist, K.E.; Petraite, M.; Teplov, R. Developing a competency model for open innovation. Manag. Decis. 2018, 56, 1306–1335. [Google Scholar] [CrossRef]
- Stouten, J.; Rousseau, D.M.; De Cremer, D. Successful Organizational Change: Integrating the Management Practice and Scholarly Literatures. Acad. Manag. Ann. 2018, 12, 752–788. [Google Scholar] [CrossRef]
- Slavec, A.; Drnovesek, M. A perspective on scale development in entrepreneurship research. Econ. Bus. Rev. 2012, 14, 39–62. [Google Scholar] [CrossRef]
- Schiffman, L.; Kanuk, L. Consumer Behavior, 9th ed.; Pearson: CUNY-Baruch College, NY, USA, 2007. [Google Scholar]
- Allport, G.W. Attitudes. In Handbook of Social Psychology; Murchison, C., Ed.; Clark University Press: Worcester, MA, USA, 1935; pp. 798–844. [Google Scholar]
- Bagozzi, R. Advanced Methods of Marketing Research; Blackwell Business: Cambridge, MA, USA, 1994. [Google Scholar]
- Gentry, J.W.; Bagozzi, R.P. Principles of Marketing Research. J. Mark. Res. 1995, 32, 375. [Google Scholar] [CrossRef]
- Davis, F.; Bagozzi, R.; Warshaw, P. User acceptance of computer technology: A comparison of two theoretical models. Manag. Sci. 1989, 35, 982–1003. [Google Scholar] [CrossRef] [Green Version]
- Ajzen, I.; Fishbein, M. Understanding Attitudes and Predicting Social Behavior; Prentice Hall: Englewood Cliffs, NJ, USA, 1980. [Google Scholar]
- Fishbein, M.; Ajzen, I. Belief, Attitude, Intention, and Behavior: An Introduction to Theory and Research. Philos. Rhetor. 1997, 6, 244–245. [Google Scholar] [CrossRef]
- Ajzen, I. The theory of planned behavior. Organ. Behav. Human Decis. Processes 1991, 50, 179–211. [Google Scholar] [CrossRef]
- Breckler, S. Empirical validation of affect, behavior, and cognition as distinct components of attitude. J. Personal. Soc. Psychol. 1984, 47, 1191–1205. [Google Scholar] [CrossRef]
- Fishbein, M. An investigation of the relationships between beliefs about an object and the attitude toward that object. Hum. Relat. 1963, 16, 233–239. [Google Scholar] [CrossRef]
- Fishbein, M.; Ajzen, I. On construct validity: A critique of Miniard and Cohen’s paper. J. Exp. Soc. Psychol. 1981, 17, 340–350. [Google Scholar] [CrossRef]
- Godin, G.; Valois, P.; Shephard, R.J.; Desharnais, R. Prediction of leisure-time exercise behavior: A path analysis (LISREL V) model. J. Behav. Med. 1987, 10, 145–158. [Google Scholar] [CrossRef] [PubMed]
- Jaccard, J.; Davidson, A. Toward an understanding of family planning behaviors: An initial investigation. J. Appl. Soc. Psychol. 1972, 2, 228–235. [Google Scholar] [CrossRef]
- Rosenberg, M.J. Cognitive structure and attitudinal affect. J. Abnorm. Soc. Psychol. 1956, 53, 367–372. [Google Scholar] [CrossRef]
- Dahlander, L.; Gann, D. How open is innovation? Res. Policy 2010, 39, 699–709. [Google Scholar] [CrossRef]
- Herzog, P. Open and Closed Innovation: Different Cultures for Different Strategies; Springer: Berlin/Heidelberg, Germany, 2008. [Google Scholar]
- Chesbrough, H.; Bogers, M. Explicating open innovation: Clarifying an emerging paradigm for understanding innovation. In New Frontiers in Open Innovation; Chesbrough, H., Vanhaverbeke, W., West, J., Eds.; Oxford University Press: Oxford, UK, 2014; pp. 3–28. [Google Scholar]
- Gassmann, O.; Enkel, E. Towards a theory of open innovation: Three core process archetypes. In Proceedings of the R&D Management Conference (RADMA), Lisbon, Portugal, 6 July 2004. [Google Scholar]
- Yun, J.H.J.; Zhao, X.; Jung, K.H.; Yigitcanlar, T. The Culture for Open Innovation Dynamics. Sustainability 2020, 12, 5076. [Google Scholar] [CrossRef]
- Lee, S.; Park, G.; Yoon, B. Open innovation in SMEs—An intermediated network model. Res. Policy 2010, 39, 290–300. [Google Scholar] [CrossRef]
- Van de Vrande, V.; Lemmens, C.; Vanhaverbeke, W. Choosing governance modes for external technology sourcing. R&D Manag. 2006, 36, 347–363. [Google Scholar]
- Leimeister, J.; Huber, M.; Bretschneider, U. Leveraging crowdsourcing: Activation-supporting components for IT-based ideas competition. J. Manag. Inf. Syst. 2009, 26, 197–224. [Google Scholar] [CrossRef]
- Van de Vrande, V.; De Jong, J.P.; Vanhaverbeke, W.; De Rochemont, M. Open innovation in SMEs: Trends, motives and management challenges. Technovation 2009, 29, 423–437. [Google Scholar] [CrossRef] [Green Version]
- Barham, H.; Dabic, M.; Daim, T.; Shifrer, D. The role of management support for the implementation of open innovation practices in firms. Technol. Soc. 2020, 63, 101282. [Google Scholar] [CrossRef]
- Slowinski, G.; Hummel, E.; Gupta, A.; Gilmont, E.R. Effective Practices for Sourcing Innovation. Res. Manag. 2009, 52, 27–34. [Google Scholar] [CrossRef]
- Chesbrough, H.; Crowther, A.K. Beyond high tech: Early adopters of open innovation in other industries. R&D Manag. 2006, 36, 229–236. [Google Scholar] [CrossRef]
- Carayannis, E.; Campbell, D. Open innovation diplomacy and a 21st century fractal research, education and innovation (FREIE) ecosystem: Building on the quadruple and quintuple helix innovation concepts and the “Mode 3” knowledge production system. J. Knowl. Econ. 2011, 2, 327–372. [Google Scholar] [CrossRef]
- Chesbrough, H. The Logic of Open Innovation: Managing Intellectual Property. Calif. Manag. Rev. 2003, 45, 33–58. [Google Scholar] [CrossRef]
- Enkel, E.; Gassmann, O.; Chesbrough, H. Open R&D and open innovation: Exploring the phenomenon. R&D Manag. 2009, 39, 311–316. [Google Scholar] [CrossRef]
- West, J.; Bogers, M. Leveraging external sources of innovation: A review of research on open innovation. J. Prod. Innov. Manag. 2013, 31, 814–831. [Google Scholar] [CrossRef]
- Brunswicker, S.; Hutschek, U.; Wagner, L. ’Exploration’ in the open innovation front-end: The role of technologies. Int. J. Technol. Intell. Plan. 2012, 8, 1–15. [Google Scholar] [CrossRef]
- Gibson, C.B.; Birkinshaw, J. The Antecedents, Consequences and Mediating Role of Organizational Ambidexterity. Acad. Manag. Rev. 2004, 47, 209–226. [Google Scholar]
- Lichtenthaler, U.; Lichtenthaler, E. A capability-based framework for open innovation: Complementing absorptive capacity. J. Manag. Stud. 2009, 46, 1315–1338. [Google Scholar] [CrossRef]
- Moore, G. To succeed in the long term, focus on the middle term. Harv. Bus. Rev. 2007, 85, 84–90. [Google Scholar] [PubMed]
- Howells, J. Intermediation and the role of intermediaries in innovation. Res. Policy 2006, 35, 715–728. [Google Scholar] [CrossRef]
- Stewart, J.; Sampsa, H. Intermediaries, users and social learning in technological innovation. Int. J. Innov. Manag. 2008, 12, 295–325. [Google Scholar] [CrossRef]
- Burt, R.S. The Network Structure Of Social Capital. Res. Organ. Behav. 2000, 22, 345–423. [Google Scholar] [CrossRef]
- Gould, R.; Fernandez, R. Structures of mediation: A formal approach to brokerage in transaction networks. Sociol. Methodol. 1989, 19, 89–126. [Google Scholar] [CrossRef]
- Klerkx, L.; Leeuwis, C. Matching demand and supply in the agricultural knowledge infrastructure: Experiences with innovation intermediaries. Food Policy 2008, 33, 260–276. [Google Scholar] [CrossRef]
- Jang, S. Cultural Brokerage and Creative Performance in Multicultural Teams. Organ. Sci. 2017, 28, 993–1009. [Google Scholar] [CrossRef]
- Agogué, M.; Yström, A.; Le Masson, P. Rethinking the role of intermediaries as an architect of collective exploration and creation of knowledge in open innovation. Int. J. Innov. Manag. 2013, 17, 1–24. [Google Scholar]
- Bogers, M.; Zobel, A.K.; Afuah, A.; Almirall, E.; Brunswicker, S.; Dahlander, L.; Frederiksen, L.; Gawer, A.; Gruber, M.; Haefliger, S.; et al. The open innovation research landscape: Established perspectives and emerging themes across different levels of analysis. Ind. Innov. 2017, 24, 8–40. [Google Scholar] [CrossRef]
- Huggins, R.; Prokop, D. Network structure and regional innovation: A study of university–industry ties. Urban Stud. 2016, 54, 931–952. [Google Scholar] [CrossRef]
- Benassi, M.; Di Minin, A. Playing in between: Patent brokers in markets for technology. R&D Manag. 2009, 39, 68–86. [Google Scholar]
- Chesbrough, H.; West, J.; Vanhaverbeke, W. Open Innovation: Researching a New Paradigm; Oxford University Press: Oxford, UK, 2008. [Google Scholar]
- Huston, L.; Sakkab, N. Connect and develop: Inside Procter & Gamble’s new model for innovation. Harv. Bus. Rev. 2006, 84, 58–66. [Google Scholar]
- Hu, Y.; McNamara, P.; McLoughlin, D. Outbound open innovation in bio-pharmaceutical out-licensing. Technovation 2015, 35, 46–58. [Google Scholar] [CrossRef]
- Lichtenthaler, U. The evolution of technology licensing management: Identifying five strategic approaches. R&D Manag. 2011, 41, 173–189. [Google Scholar]
- Kutvonen, A. Strategic application of outbound open innovation. Eur. J. Innov. Manag. 2011, 14, 460–474. [Google Scholar] [CrossRef]
- Lichtenthaler, U.; Bogeres, H. External technology commercialization in large firms: Results of a quantitative benchmarking study. R&D Manag. 2007, 37, 383–397. [Google Scholar]
- Lichtenthaler, U. External commercialization of knowledge: Review and research agenda. Int. J. Manag. Rev. 2005, 7, 231–255. [Google Scholar] [CrossRef]
- Kollmer, H.; Dowling, M. Licensing as a commercialisation strategy for new technology-based firms. Res. Policy 2004, 33, 1141–1151. [Google Scholar] [CrossRef]
- Chesbrough, H.; Rosenbloom, R. The role of the business model in capturing value from innovation: Evidence from Xerox Corporation’s technology spin-off companies. Ind. Corp. Change 2002, 11, 529–555. [Google Scholar] [CrossRef] [Green Version]
- Schilling, M. Toward a general modular systems theory and its application to interfirm product modularity. Acad. Manag. Rev. 2000, 25, 312–334. [Google Scholar] [CrossRef]
- Salavisa, I.; Sousa, C.; Fontes, M. Topologies of innovation networks in knowledge-intensive sectors: Sectoral differences in the access to knowledge and complementary assets through formal and informal ties. Technovation 2012, 32, 380–399. [Google Scholar] [CrossRef]
- Mention, A.-L.; Asikainen, A.-L. Innovation & productivity: Investigating effects of openness in services. Int. J. Innov. Manag. 2012, 16, 1–27. [Google Scholar] [CrossRef]
- Trigo, A.; Vence, X. Scope and patterns of innovation cooperation in Spanish service enterprises. Res. Policy 2012, 41, 602–613. [Google Scholar] [CrossRef]
- Mention, A.-L. Co-operation and co-opetition as open innovation practices in the service sector: Which influence on innovation novelty? Technovation 2011, 31, 44–53. [Google Scholar] [CrossRef]
- Tether, B. Who co-operates for innovation, and why: An empirical analysis. Res. Policy 2002, 31, 947–967. [Google Scholar] [CrossRef]
- Aschhoff, B.; Schmidt, T. Empirical Evidence on the Success of R&D Cooperation—Happy Together? Rev. Ind. Organ. 2008, 33, 41–62. [Google Scholar] [CrossRef] [Green Version]
- Belderbos, R.; Lokshin, B.; Carree, M. Complementarity in R&D cooperation strategies. Rev. Ind. Organ. 2006, 28, 401–426. [Google Scholar]
- Chiaroni, D.; Chiesa, V.; Frattini, F. Unravelling the process from Closed to Open Innovation: Evidence from mature, asset-intensive industries. R&D Manag. 2010, 40, 222–245. [Google Scholar] [CrossRef]
- Tsai, K.; Wang, J. External technology sourcing and innovation performance in LMT sectors: An analysis based on the Taiwanese Technological Innovation Survey. Res. Policy 2009, 38, 518–526. [Google Scholar] [CrossRef]
- Lichtenthaler, U. Absorptive capacity, environmental turbulence, and the complementarity of organizational learning processes. Acad. Manag. J. 2009, 52, 822–846. [Google Scholar] [CrossRef]
- Gassmann, O. Opening up the innovation process: Towards an agenda. R&D Manag. 2006, 36, 223–228. [Google Scholar] [CrossRef]
- Laursen, K.; Salter, A. Open for innovation: The role of openness in explaining innovation performance among U.K. manufacturing firms. Strateg. Manag. J. 2006, 27, 131–150. [Google Scholar] [CrossRef]
- Vanhaverbeke, W.; Duysters, G.; Noorderhaven, N. External Technology Sourcing Through Alliances or Acquisitions: An Analysis of the Application-Specific Integrated Circuits Industry. Organ. Sci. 2002, 13, 714–733. [Google Scholar] [CrossRef] [Green Version]
- Moellers, T.; Visini, C.; Haldimann, M. Complementing open innovation in multi-business firms: Practices for promoting knowledge flows across internal units. R&D Manag. 2020, 50, 96–115. [Google Scholar]
- Chesbrough, H. From Open Science to Open Innovation; Science Business Publishing, Institute for Innovation and Knowledge Management: UC Berkeley, CA, USA, 2015. [Google Scholar]
- Santos, A.B. Open Innovation research: Trends and influences—A bibliometric analysis. J. Innov. Manag. 2015, 3, 131–165. [Google Scholar] [CrossRef]
- Piller, F.; West, J. Firms, Users, and Innovation: An Interactive Model of Coupled Open Innovation; Oxford University Press: Oxford, UK, 2014. [Google Scholar]
- Lopez-Berzosa, D.; Gawer, A. Innovation policy within private collectives: Evidence on 3GPP’s regulation mechanisms to facilitate collective innovation. Technovation 2014, 34, 734–745. [Google Scholar] [CrossRef]
- Bogers, M.; Afuah, A.; Bastian, B. Users as innovators: A review, critique, and future research directions. J. Manag. 2010, 36, 857–875. [Google Scholar] [CrossRef] [Green Version]
- Dittrich, K.; Duysters, G. Networking as a Means to Strategy Change: The Case of Open Innovation in Mobile Telephony. J. Prod. Innov. Manag. 2007, 24, 510–521. [Google Scholar] [CrossRef]
- Fleming, L.; Waguespack, D. Brokerage, boundary spanning, and leadership in open innovation communities. Organ. Sci. 2007, 18, 165–180. [Google Scholar] [CrossRef] [Green Version]
- Lane, P.; Lubatkin, M. Relative absorptive capacity and interorganizational learning. Strateg. Manag. J. 1998, 19, 461–477. [Google Scholar] [CrossRef]
- Smith, K.G.; Collins, C.J.; Clark, K.D. Existing Knowledge, Knowledge Creation Capability, and the Rate of New Product Introduction in High-Technology Firms. Acad. Manag. J. 2005, 48, 346–357. [Google Scholar] [CrossRef]
- Zollo, M.; Winter, S.G. Deliberate Learning and the Evolution of Dynamic Capabilities. Organ. Sci. 2002, 13, 339–351. [Google Scholar] [CrossRef] [Green Version]
- Chesbrough, H. Open Business Models: How to Thrive in the New Innovation Landscape; Harvard Business School Press: Boston, MA, USA, 2006. [Google Scholar]
- Hansen, M.; Brikinshaw, J. The innovation value chain. Harv. Bus. Rev. 2007. Available online: https://hbr.org/2007/06/the-innovation-value-chain (accessed on 6 June 2020).
- Lassen, A.H.; Laugen, B.T. Open innovation: On the influence of internal and external collaboration on degree of newness. Bus. Process Manag. J. 2017, 23, 1129–1143. [Google Scholar] [CrossRef]
- Clauss, T.; Spieth, P. Governance of open innovation networks with national vs international scope. J. Strat. Manag. 2017, 10, 66–85. [Google Scholar] [CrossRef]
- Bogers, M.; Lhuillery, S. External knowledge sourcing. In World Scientific Reference on Innovation (Vol. 3): Open Innovation, Ecosystems and Entrepreneurship: Issues and Perspective; Nambisan, S., Ed.; World Scientific Publishing Co. Ltd.: Singapore, 2018. [Google Scholar]
- Teece, D.J. Explicating dynamic capabilities: The nature and microfoundations of (sustainable) enterprise performance. Strat. Manag. J. 2007, 28, 1319–1350. [Google Scholar] [CrossRef] [Green Version]
- Rothaermel, F.T.; Hess, A.M. Building Dynamic Capabilities: Innovation Driven by Individual-, Firm-, and Network-Level Effects. Organ. Sci. 2007, 18, 898–921. [Google Scholar] [CrossRef] [Green Version]
- Piller, F.; Walcher, D. Toolkits for idea competitions: A novel method to integrate users in new product development. R&D Manag. 2006, 36, 307–318. [Google Scholar]
- West, J.; Gallagher, S. Challenges of open innovation: The paradox of firm investment in open-source software. R&D Manag. 2006, 36, 319–331. [Google Scholar] [CrossRef] [Green Version]
- Colyvas, J.; Crow, M.; Gelijns, A.; Mazzoleni, R.; Nelson, R.; Rosenberg, N.; Sampat, B. How do university inventions get into practice? Manag. Sci. 2002, 48, 61–72. [Google Scholar] [CrossRef]
- Biemans, W.G. Managing Innovation Within Networks; Routledge: London, UK, 2018. [Google Scholar]
- Martinez-Conesa, I.; Soto-Acosta, P.; Carayannis, E. On the path towards open innovation: Assessing the role of knowledge management capability and environmental dynamism in SMEs. J. Knowl. Manag. 2017, 21, 553–570. [Google Scholar] [CrossRef]
- Dodgson, M.; Gann, D.; Salter, A. The role of technology in the shift towards open innovation: The case of Procter & Gamble. R&D Manag. 2006, 36, 333–346. [Google Scholar] [CrossRef]
- De Jong, J.; Hulsink, W. Sources of success: Small firms’ use of networks to support the development of innovations. Front. Entrep. Res. 2005, 351. [Google Scholar]
- Huggins, R.; Johnston, A. Knowledge flow and inter-firm networks: The influence of network resources, spatial proximity and firm size. Entrep. Reg. Dev. 2010, 22, 457–484. [Google Scholar] [CrossRef]
- Herstad, S.J. Innovation strategy choices in the urban economy. Urban Stud. 2017, 55, 1185–1202. [Google Scholar] [CrossRef] [Green Version]
- Mohr, A.T.; Puck, J.F. Managing Functional Diversity to Improve the Performance of International Joint Ventures. Long Range Plan. 2005, 38, 163–182. [Google Scholar] [CrossRef]
- De Meyer, A. Management of an international network of industrial R&D laboratories. R&D Manag. 1993, 23, 109–120. [Google Scholar] [CrossRef]
- Bock, G.; Zmud, R.; Kim, Y.; Lee, J. Behavioral intention formation in knowledge sharing: Examining the roles of extrinsic motivators, social-psychological forces, and organizational climate. MIS Q. 2005, 29, 87–111. [Google Scholar] [CrossRef]
- Nunnally, J. Psychometric Theory; McGraw-Hill: New York, NY, USA, 1978. [Google Scholar]
- Bohrnstedt, G. Reliability and validity assessment in attitude measurement. Attitude Meas. 1970, 4, 80–99. [Google Scholar]
- Anastasi, A. Evolving Concepts of Test Validation. Annu. Rev. Psychol. 1986, 37, 1–16. [Google Scholar] [CrossRef]
- Dabholkar, P. Consumer evaluations of new technology-based self-service options: An investigation of alternative models of service quality. Int. J. Res. Mark. 1994, 13, 29–51. [Google Scholar] [CrossRef]
- Conboy, K.; Morgan, L. Combining open innovation and agile approaches: Implications for IS project managers. In Proceedings of the 18th European Conference on Information Systems, ECIS, St. Louis, MO, USA, 12 December 2010. [Google Scholar]
- Herstad, S.; Bloch, C.; Ebersberger, B. Open innovation and globalisation: Theory, evidence and implications. Vision EraNet 2008, 19, 1–96. [Google Scholar]
- Bryant, P. Self-Regulation and Entrepreneurial Ambidexterity: Exploration and Exploitation in Early Stage Ventures and SMEs. Technology, Innovation, Entrepreneurship and Competitive Strategy; Emerald Group Publishing Limited: Bingley, UK, 2014. [Google Scholar]
- Davis, F. Perceived usefulness, perceived ease of use and user acceptance of information technology. MIS Q. 1989, 13, 319–340. [Google Scholar] [CrossRef] [Green Version]
- Hogg, M.; Vaughan, G. Introduction to Social Psychology, 4th ed.; Pearson Education: London, UK, 2005. [Google Scholar]
- Eagly, A.; Chaiken, S. The Psychology of Attitudes; Harcourt Brace Jovanovich College Publishers: New York, NY, USA, 1993. [Google Scholar]
- Parasuraman, A.; Colby, C. An updated and streamlined technology readiness index: TRI 2.0. J. Serv. Res. 2015, 18, 59–74. [Google Scholar] [CrossRef]
- Parasuraman, A. Technology readiness index (TRI): A multiple item scale to measure readiness to embrace new technologies. J. Serv. Res. 2000, 2, 307–320. [Google Scholar] [CrossRef]
- Velicer, W.; Fava, J. Effects of variable and subject sampling on factor pattern recovery. Psychol. Methods 1998, 3, 231–251. [Google Scholar] [CrossRef]
- Guadagnoli, E.; Velicer, W. The relationship of sample size to the stability of component patterns. Psychol. Bull. 1988, 103, 265–275. [Google Scholar] [CrossRef]
- MacCallum, R.; Widaman, K.; Zhang, S.; Hong, S. Sample size in factor analysis. Psychol. Methods 1999, 4, 84–99. [Google Scholar] [CrossRef]
- Worthington, R.; Whittaker, T. Scale development research: A content analysis and recommendations for best practices. Couns. Psychol. 2006, 34, 806–838. [Google Scholar] [CrossRef]
- Churchill, G.A., Jr. A Paradigm for Developing Better Measures of Marketing Constructs. J. Mark. Res. 1979, 16, 64–73. [Google Scholar] [CrossRef]
- Tabachnick, B.; Fidell, L. Using Multivariate Statistics; Allyn and Bacon: Boston, MA, USA, 2001. [Google Scholar]
- Delshab, V.; Winand, M.; Boroujerdi, S.; Hoeber, L.; Mohmoudian, A. The impact of knowledge management on performance in nonprofit sports clubs: The mediating role of attitude toward innovation, open innovation, and innovativeness. Eur. Sport Manag. Q. 2020, 1–22. [Google Scholar] [CrossRef]
- Kothandapani, V. Validation of feeling, belief, and intention to act as three components of attitude and their contribution to prediction of contraceptive behavior. J. Pers. Soc. Psychol. 1971, 19, 321–333. [Google Scholar] [CrossRef] [PubMed]
- Peter, P. Construct validity: A review of basic issues and marketing practices. J. Mark. Res. 1981, 18, 133–145. [Google Scholar] [CrossRef]
- Byrne, B. Structural equation modeling with AMOS, EQS, and LISREL: Comparative approaches to testing for the factorial validity of a measuring instrument. Int. J. Testing 2001, 1, 55–86. [Google Scholar] [CrossRef]
- Steiger, J.H. Structural Model Evaluation and Modification: An Interval Estimation Approach. Multivar. Behav. Res. 1990, 25, 173–180. [Google Scholar] [CrossRef] [Green Version]
- Bagozzi, R.; Yi, Y. On the evaluation of structural equation models. J. Acad. Mark. Sci. 1988, 16, 74–94. [Google Scholar] [CrossRef]
- Fornell, C.; Larcker, D. Structural equation models with unobservable variables and measurement error: Algebra and statistics. J. Mark. Res. 1981, 18, 382–388. [Google Scholar] [CrossRef]
- Bagozzi, R.; Baumgartner, H. The evaluation of structural equation models and hypothesis testing. In Principles of Marketing Research; Bagozzi, R., Baumgartner, H., Eds.; Blackwell Publishers: Hoboken, NJ, USA, 1994; pp. 386–422. [Google Scholar]
- Robbins, P.; O’gorman, C.; Huff, A.; Moeslein, K. Multidexterity—A New Metaphor for Open Innovation. J. Open Innov. Technol. Mark. Complex. 2021, 7, 99. [Google Scholar] [CrossRef]
- Bigliardi, B.; Ferraro, G.; Filippelli, S.; Galati, F. The past, present and future of open innovation. Eur. J. Innov. Manag. 2021, 24, 1130–1161. [Google Scholar] [CrossRef]


| Organizational Capability | Description of Capabilities | Author(s) (Year) |
|---|---|---|
| Market Sensing | Leverage the discoveries of others. Explore many external sources of innovation. | Dahlander and Gann [22] |
| Create a synergy between own processes and externally available ideas. | Herzog [23] | |
| Network and Process | Improve and develop systematic processes to enable inter-departmental cooperation. Create well-defined routines to build and define the OI tasks. | Sivam et al. [4] |
| Prioritize innovation process based on purposively managed knowledge flows across boundaries of organization, using (non) pecuniary mechanisms aligned with the business model. | Chesbrough and Bogers [24] | |
| Emulate the company’s innovation paradigm. Transform solid boundaries into a more semi-permeable layer to enable innovation to move more easily between the company’s external environment and internal innovation process. | Gassmann and Enkel [25] | |
| Corporate Culture | Explain trait or characteristic. Support product/process innovation. | Yun et al. [26] Lee et al. [27] |
| Balance innovation and daily tasks, communication problems, aligning partners, organization of innovation. | Van de Vrande et al. [28] | |
| Demonstrate organizer’s appreciation. Demonstrate peers’ appreciation. | Leimeister et al. [29] | |
| Reward Policy | Demonstrate organizer’s appreciation. Demonstrate peers’ appreciation. | Leimeister et al. [29] |
| Follow organizational principles, convey management’s conviction that employee involvement is desirable. | Van de Vrande et al. [30] | |
| Involve employees in the innovation process to increase their motivation and commitment. | ||
| Organizational Leadership | Provide extrinsic incentives, such as financial rewards, in addition to intrinsic incentives, such as appreciation to people who push, modify, or drop the innovation. | Herzog [23] |
| Offer employees’ education or training. Create awareness among employees about how open innovation can further advance their creativity and innovativeness. Offer incentives, monetary and non-monetary, to employees to encourage them to embrace open innovation. | Barham et al. [31] | |
| Encourage management to bring in cultural change, new thinking, and clear mandates to access external innovation. | Slowinski et al. [32] | |
| Provide top-down direction and encouragement for OI practices. | Chesbrough and Crowther [33] |
| Role Perspective | Examples of OI Activities | Author (Year) |
|---|---|---|
| Transfer (Outbound, Inside-out, Boundary-spanning) | Support venturing, licensing IP to other firms, participation in other firms. | Van de Vrande et al. [28] |
| Allow sharing of the knowledge, costs, and risks of uncertain innovative projects. | Bogers et al. [49] | |
| Recognize that licensing positively affects a company’s entrepreneurial learning and contextual status. | Hu et al. [54] | |
| Enhance technological knowledge transfer. | Gassmann and Enkel [25]; Lichtenthaler [55]; | |
| Commercialize external technology. | Kutvonen [56]; Lichtenthaler and Ernst [57]; Lichtenthaler [58] | |
| Encourage out-licensing. | Lichtenthaler and Ernst [57] | |
| Consider selling and out-licensing an effective strategy in commercialization. | Kollmer and Dowling [59] | |
| Encourage spin-off. | Chesbrough [35]; Chesbrough and Rosenbloom [60] | |
| Allow the use of different sources for innovation projects through division of labor. | Schilling [61] | |
| Absorption (Inbound, Outside-in, Spin-in) | Encourage customer involvement, outsourcing R&D. | Van de Vrande et al. [28] |
| Encourage networking. | Van de Vrande et al. [28]; Salavisa et al. [62] | |
| Emphasize cooperation. | Mention and Asikainen [63]; Trigo and Vence [64]; Mention [65]; Tether [66] | |
| Support coopetition. | Mention [65] | |
| Encourage institutional collaboration. | Aschhoff and Schmidt [67]; Belderbos et al. [68] | |
| Purchase scientific services. | Chiaroni et al. [69] | |
| Facilitate in-licensing from external technology source. | Tsai and Wang [70] | |
| Facilitate a capability-based framework for open innovation, supplementing absorptive capacity. | Lichtenthaler and Lichtenthaler [40]; Lichtenthaler [71] | |
| Emphasize spin-in or outside-in knowledge across organizational boundaries as a core process. | Gassmann (2006) [72] | |
| Use open, wide, and deep innovation strategy to improve company’s external search for knowledge. | Laursen and Salter [73] | |
| Focus on acquisition. | Vanhaverbeke et al. [74] | |
| Brokerage (Intermediation, Mediation) | Enhance inter-organizational innovation collaboration. | Enkel et al. [36]; Huston and Sakkab [53] |
| Integrate a diverse set of innovation actors in the OI ecosystem. | West and Bogers [37] | |
| Represent a large knowledge source for firms’ OI. | Agogué et al. [48]; Laursen and Salter [73] | |
| Reduce internal fear of experimentation. Motivate external stakeholders’ contributions. Support connectivity between diverse actors. Facilitate entry and collaboration of various new actors. | Bogers et al. [49]; Moellers et al. [75] | |
| Provide external knowledge for OI strategies. | Huggins and Prokop [50] | |
| Broker technology patents in the market. | Benassi and Di Minin [51] | |
| Manage the knowledge path between public and private parties of the innovation system. | Chesbrough [76] | |
| Support clusters to enhance OI in particular industries. | Santos [77] | |
| Represent a large knowledge source for firms’ OI. | Piller and West [78] | |
| Enhance the performance of ecosystem members in competitive markets. | Lopez-Berzosa and Gawer [79] | |
| Participate in firms’ OI processes by communicating their needs and preferences. | Bogers et al. [80] | |
| Support collaboration and joint research programs. | Dittrich and Duysters [81] | |
| Create network brokerage of collaborative relationships. | Fleming and Waguespack [82] | |
| Exploration | Search firm’s technological competency and problem boundaries. Invent and absorb knowledge in internal and external firm settings. Acquire knowledge from external sources. Generate new knowledge inside the firm. | Brunswicker et al. [38] Lichtenthaler and Lichtenthaler [40] Lane et al. [83] Smith et al. [84] |
| Exploitation | Transform and connect knowledge in internal and external firm settings. Convert knowledge from internal and external sources into new products. Replicate new approaches in diverse context. | Lichtenthaler and Lichtenthaler [40] Moore [41] Zollo and Winter [85] |
| Ambidexterity | Align internal and external knowledge management processes. Achieve alignment and adaptability simultaneously at a business-unit level. | Gibson and Birkinshaw [39] Lichtenthaler and Lichtenthaler [40] |
| Locus of OI Activity | Examples of OI Activities | Author (Year) |
|---|---|---|
| Outbound licensing of intellectual property. | Chesbrough and Crowther [33] | |
| Manage intellectual property. | Chesbrough [35] | |
| Rethink managerial and governance structures that motivate participants. Utilize external knowledge in the firm’s organizational innovation outputs. | Bogers et al. [49] | |
| Stimulate corporate entrepreneurship. | Chesbrough et al. [52] | |
| Align incentives for better external use of ideas. | Chesbrough [86] | |
| Transform ideas into commercial outputs. Facilitate collaboration by building internal cross-unit networks. Shape high-quality links within and across units and individuals. Transform market needs into technology briefs. | Hansen and Brikinshaw [87] | |
| Increase the firm’s absorptive capacity. | Bogers and Lhuillery [90] | |
| Help firm obtain unique dynamic capabilities. | Teece [91] | |
| Build firm’s strategic alliances with new technology supporters. | Rothaermel and Hess [92] | |
| Provide individuals and groups with toolkits for user innovation. | Piller and Walcher [93] | |
| Maximize internal innovation returns. | West and Gallagher [94] | |
| Help firm to gain benefit from external research projects. | Colyvas et al. [95] | |
| External Scope of Activities (Inter-organizational) | Enhance inter-organizational innovation collaboration. | Enkel et al. [36] |
| Facilitate the establishment of boundary-spanning innovation activities. | Chesbrough et al. [52] | |
| Help firm obtain external paths. | Biemans [96] | |
| Relate R&D unit activities to innovation industry. Acquire new business partners to commercialize new products and ideas. | Martinez-Conesa et al. [97] | |
| Exploit technology externally. | Dodgson et al. [98] | |
| Maintain connections among OI external sources and relevant network partners. | De Jong and Hulsink [99] | |
| National Scope of Activities | Provide a proper breeding ground for the development and effectiveness of relational governance mechanisms. Collaborate resources among firms in the same region. | Clauss and Spieth [89] Huggins and Johnston [100] |
| International Scope of Activities | Cooperate with innovation partners in international network scope.Internalize corporate enterprises and innovation schemes. Establish international joint ventures to ensure survival, increase competitiveness, and enter new markets. Collaborate OI networks across international borders. | Clauss and Spieth [89] Herstad [101] Mohr and Puck [102] De Meyer [103] |
| Categories | Expert A–Expert B | Expert A–Expert C | Expert B–Expert C | |
|---|---|---|---|---|
| OI Locus of Activities | Items consistency | 1 | 1 | 1 |
| Items inconsistency | 1 | 1 | 1 | |
| Total | 2 | 2 | 2 | |
| Coefficient | 0.5000 | 0.5000 | 0.5000 | |
| OI Role Perspectives | Items consistency | 1 | 1 | 2 |
| Items inconsistency | 2 | 2 | 1 | |
| Total | 3 | 3 | 3 | |
| Coefficient | 0.3333 | 0.3333 | 0.3333 | |
| Total | Items consistency | 2 | 2 | 3 |
| Items inconsistency | 3 | 3 | 2 | |
| Total | 5 | 5 | 5 | |
| Coefficient | 0.4000 | 0.4000 | 0.6000 | |
| Categories | Expert A–Expert B | Expert A–Expert C | Expert B–Expert C | |
|---|---|---|---|---|
| OI Locus of Activities | Items consistency | 2 | 1 | 1 |
| Items inconsistency | 0 | 1 | 1 | |
| Total | 2 | 2 | 2 | |
| Coefficient | 1.0000 | 0.5000 | 0.5000 | |
| OI Role Perspectives | Items consistency | 2 | 2 | 3 |
| Items inconsistency | 1 | 1 | 0 | |
| Total | 3 | 3 | 3 | |
| Coefficient | 0.6667 | 0.6667 | 1.0000 | |
| Total | Items consistency | 4 | 3 | 4 |
| Items inconsistency | 1 | 2 | 1 | |
| Total | 5 | 5 | 5 | |
| Coefficient | 0.8000 | 0.6000 | 0.8000 | |
| Items | M ± SD | Skewness | Kurtosis | Corrected Item- Total Correlation | Cronbach’s α if Item is Deleted |
|---|---|---|---|---|---|
| IT01 | 5.00 ± 1.51 | −0.55 | −0.58 | 0.48 | 0.97 |
| IT02 | 4.88 ± 1.51 | −0.72 | −0.14 | 0.48 | 0.97 |
| IT03 | 5.12 ± 1.15 | −0.81 | −0.05 | 0.52 | 0.97 |
| IT04 | 5.08 ± 1.65 | −0.64 | −0.60 | 0.59 | 0.97 |
| IT05 | 4.94 ± 1.61 | −0.72 | −0.25 | 0.64 | 0.97 |
| IT06 | 5.04 ± 1.63 | −0.65 | −0.45 | 0.62 | 0.97 |
| IT07 | 4.86 ± 1.23 | −0.56 | 0.35 | 0.53 | 0.97 |
| IT08 | 4.48 ± 1.45 | −0.50 | −0.41 | 0.52 | 0.97 |
| IT09 | 4.13 ± 1.48 | −0.44 | −0.80 | 0.64 | 0.97 |
| IT10 | 4.06 ± 1.53 | −0.22 | −0.72 | 0.57 | 0.97 |
| IA01 | 5.53 ± 1.30 | −0.87 | 0.49 | 0.54 | 0.97 |
| IA02 | 5.58 ± 1.06 | −0.63 | 0.30 | 0.51 | 0.97 |
| IA03 | 5.42 ± 1.35 | −0.73 | −0.05 | 0.49 | 0.97 |
| IA04 | 5.79 ± 1.15 | −0.87 | 0.27 | 0.40 | 0.97 |
| IA05 | 5.70 ± 1.13 | −0.91 | 1.16 | 0.47 | 0.97 |
| IA06 | 5.67 ± 1.12 | −0.96 | 1.36 | 0.51 | 0.97 |
| IA07 | 4.08 ± 1.65 | −0.17 | −0.80 | 0.55 | 0.97 |
| IA08 | 3.79 ± 1.66 | −0.14 | −1.05 | 0.59 | 0.97 |
| IA09 | 3.67 ± 1.57 | −0.10 | −0.94 | 0.62 | 0.97 |
| IA10 | 3.79 ± 1.53 | −0.22 | −0.73 | 0.44 | 0.97 |
| IB01 | 4.87 ± 1.52 | −0.33 | −0.51 | 0.64 | 0.97 |
| IB02 | 4.75 ± 1.47 | −0.45 | −0.16 | 0.69 | 0.97 |
| IB03 | 4.75 ± 1.70 | −0.45 | −0.49 | 0.64 | 0.97 |
| IB04 | 4.85 ± 1.59 | −0.48 | −0.38 | 0.66 | 0.97 |
| IB05 | 4.83 ± 1.63 | −0.50 | −0.48 | 0.70 | 0.97 |
| IB06 | 4.93 ± 1.59 | −0.56 | −0.27 | 0.68 | 0.97 |
| IB07 | 4.88 ± 1.30 | −0.85 | 0.68 | 0.35 | 0.97 |
| IB08 | 4.40 ± 1.50 | −0.45 | −0.46 | 0.51 | 0.97 |
| IB09 | 4.29 ± 1.48 | −0.40 | −0.55 | 0.53 | 0.97 |
| IB10 | 3.79 ± 1.49 | −0.21 | −0.77 | 0.56 | 0.97 |
| Items | M ± SD | Skewness | Kurtosis | Corrected Item- Total Correlation | Cronbach’s α if Item is Deleted |
|---|---|---|---|---|---|
| ET01 | 3.70 ± 1.46 | 0.49 | −0.60 | 0.59 | 0.97 |
| ET02 | 3.57 ± 1.58 | 0.12 | −0.70 | 0.58 | 0.97 |
| ET03 | 3.64 ± 1.46 | 0.15 | −0.59 | 0.60 | 0.97 |
| ET04 | 3.93 ± 1.54 | −0.23 | −0.51 | 0.62 | 0.97 |
| ET05 | 3.98 ± 1.54 | −0.21 | −0.48 | 0.61 | 0.97 |
| ET06 | 4.07 ± 1.51 | −0.22 | −0.48 | 0.65 | 0.97 |
| ET07 | 4.54 ± 1.47 | −0.67 | 0.08 | 0.63 | 0.97 |
| ET08 | 4.50 ± 1.57 | −0.34 | −0.53 | 0.61 | 0.97 |
| ET09 | 3.90 ± 1.56 | −0.18 | −0.80 | 0.69 | 0.97 |
| ET10 | 3.66 ± 1.53 | −0.36 | −0.76 | 0.55 | 0.97 |
| EA01 | 5.29 ± 1.20 | −0.78 | 1.13 | 0.49 | 0.97 |
| EA02 | 4.87 ± 1.29 | −0.45 | −0.02 | 0.54 | 0.97 |
| EA03 | 5.01 ± 1.35 | −0.69 | 0.56 | 0.54 | 0.97 |
| EA04 | 5.32 ± 1.26 | −0.89 | 1.40 | 0.39 | 0.97 |
| EA05 | 5.35 ± 1.21 | −0.62 | 0.63 | 0.43 | 0.97 |
| EA06 | 5.32 ± 1.26 | −0.78 | 0.72 | 0.44 | 0.97 |
| EA07 | 3.61 ± 1.72 | 0.18 | −1.03 | 0.57 | 0.97 |
| EA08 | 3.65 ± 1.70 | −0.04 | −1.17 | 0.58 | 0.97 |
| EA09 | 3.55 ± 1.69 | −0.01 | −1.07 | 0.66 | 0.97 |
| EA10 | 3.66 ± 1.64 | −0.13 | −1.03 | 0.60 | 0.97 |
| EB01 | 4.29 ± 1.63 | −0.31 | −0.65 | 0.71 | 0.97 |
| EB02 | 4.14 ± 1.63 | −0.22 | −0.68 | 0.74 | 0.97 |
| EB03 | 4.18 ± 1.76 | −0.18 | −0.90 | 0.76 | 0.97 |
| EB04 | 4.31 ± 1.72 | −0.38 | −0.73 | 0.73 | 0.97 |
| EB05 | 4.41 ± 1.71 | −0.49 | −0.54 | 0.71 | 0.97 |
| EB06 | 4.40 ± 1.73 | −0.50 | −0.56 | 0.73 | 0.97 |
| EB07 | 4.14 ± 1.72 | −0.42 | −0.95 | 0.65 | 0.97 |
| EB08 | 4.05 ± 1.68 | −0.36 | −0.82 | 0.61 | 0.97 |
| EB09 | 3.90 ± 1.70 | −0.23 | −0.89 | 0.67 | 0.97 |
| EB10 | 3.58 ± 1.66 | −0.09 | −1.11 | 0.61 | 0.97 |
| Items | M ± SD | Skewness | Kurtosis | Corrected Item- Total Correlation | Cronbach’s α if Item is Deleted |
|---|---|---|---|---|---|
| IT01 | 5.00 ± 1.51 | −0.55 | −0.58 | 0.54 | 0.74 |
| IT02 | 4.88 ± 1.51 | −0.72 | −0.14 | 0.50 | 0.75 |
| IT03 | 5.12 ± 1.53 | −0.81 | −0.05 | 0.56 | 0.86 |
| IT04 | 5.08 ± 1.65 | −0.68 | −0.60 | 0.66 | 0.89 |
| IT05 | 4.94 ± 1.61 | −0.72 | −0.25 | 0.70 | 0.88 |
| IT06 | 5.04 ± 1.63 | −0.65 | −0.45 | 0.67 | 0.82 |
| IA01 | 5.53 ± 1.30 | −0.87 | 0.49 | 0.64 | 0.74 |
| IA02 | 5.58 ± 1.06 | −0.63 | 0.30 | 0.59 | 0.82 |
| IA03 | 5.42 ± 1.35 | −0.73 | −0.05 | 0.59 | 0.74 |
| IA04 | 5.79 ± 1.15 | −0.87 | 0.27 | 0.53 | 0.88 |
| IA05 | 5.70 ± 1.13 | −0.91 | 1.16 | 0.60 | 0.86 |
| IA06 | 5.67 ± 1.12 | −0.96 | 1.36 | 0.60 | 0.87 |
| IB01 | 4.87 ± 1.52 | −0.33 | −0.51 | 0.71 | 0.80 |
| IB02 | 4.75 ± 1.47 | −0.45 | −0.16 | 0.70 | 0.86 |
| IB03 | 4.75 ± 1.70 | −0.45 | −0.49 | 0.69 | 0.87 |
| IB04 | 4.85 ± 1.59 | −0.48 | −0.38 | 0.75 | 0.92 |
| IB05 | 4.83 ± 1.63 | −0.50 | −0.48 | 0.76 | 0.92 |
| IB06 | 4.93 ± 1.59 | −0.56 | −0.27 | 0.75 | 0.93 |
| ET01 | 3.70 ± 1.46 | 0.04 | −0.60 | 0.61 | 0.82 |
| ET02 | 3.57 ± 1.58 | 0.12 | −0.70 | 0.59 | 0.89 |
| ET03 | 3.64 ± 1.46 | 0.15 | −0.59 | 0.62 | 0.88 |
| ET04 | 3.93 ± 1.54 | −0.23 | −0.51 | 0.64 | 0.89 |
| ET05 | 3.98 ± 1.47 | −0.21 | −0.48 | 0.67 | 0.90 |
| ET06 | 4.07 ± 1.51 | −0.22 | −0.48 | 0.69 | 0.89 |
| EA01 | 5.29 ± 1.20 | −0.78 | 1.13 | 0.61 | 0.78 |
| EA02 | 4.87 ± 1.29 | −0.45 | −0.02 | 0.59 | 0.75 |
| EA03 | 5.01 ± 1.35 | −0.69 | 0.56 | 0.66 | 0.84 |
| EA04 | 5.32 ± 1.26 | −0.89 | 1.40 | 0.56 | 0.91 |
| EA05 | 5.35 ± 1.21 | −0.62 | 0.63 | 0.59 | 0.88 |
| EA06 | 5.32 ± 1.26 | −0.78 | 0.72 | 0.58 | 0.87 |
| EB01 | 4.29 ± 1.63 | −0.31 | −0.65 | 0.76 | 0.89 |
| EB02 | 4.14 ± 1.63 | −0.22 | −0.68 | 0.77 | 0.92 |
| EB03 | 4.18 ± 1.76 | −0.18 | −0.90 | 0.79 | 0.90 |
| EB04 | 4.31 ± 1.72 | −0.38 | −0.73 | 0.77 | 0.95 |
| EB05 | 4.41 ± 1.71 | −0.49 | −0.54 | 0.78 | 0.94 |
| EB06 | 4.40 ± 1.73 | −0.50 | −0.56 | 0.77 | 0.94 |
| Characteristics | Respondents | Sample Size (n) | Proportion (%) |
|---|---|---|---|
| Gender | Male | 106 | 79.1% |
| Female | 28 | 20.9% | |
| Age | 20 s | 3 | 2.2% |
| 30 s | 68 | 50.7% | |
| 40 s | 59 | 44.0% | |
| Over 50 | 4 | 3.0% | |
| Business Activity Area | IT/Software | 16 | 11.9% |
| Sales/Marketing | 37 | 27.6% | |
| HR/Education | 9 | 6.7% | |
| Strategy/Planning | 49 | 36.6% | |
| Finance/Accounting | 10 | 7.5% | |
| Others | 13 | 9.7% |
| Kaiser–Meyer–Olkin Measure of Sampling Adequacy | 0.916 | |
|---|---|---|
| Bartlett’s Test of Sphericity | Approx. Chi-Square | 6308.071 |
| Df | 630 | |
| Sig. | 0.000 |
| Items | Communality | Components | |||||
|---|---|---|---|---|---|---|---|
| 1 | 2 | 3 | 4 | 5 | 6 | ||
| IT01 | 0.71 | 0.12 | 0.77 | 0.16 | 0.07 | 0.25 | 0.03 |
| IT02 | 0.66 | 0.13 | 0.77 | 0.14 | 0.02 | 0.14 | 0.08 |
| IT03 | 0.86 | 0.09 | 0.88 | 0.17 | 0.05 | 0.19 | 0.05 |
| IT04 | 0.84 | 0.11 | 0.82 | 0.23 | 0.13 | 0.24 | 0.13 |
| IT05 | 0.83 | 0.18 | 0.79 | 0.16 | 0.26 | 0.23 | 0.13 |
| IT06 | 0.78 | 0.19 | 0.76 | 0.24 | 0.16 | 0.24 | 0.09 |
| IA01 | 0.69 | 0.09 | 0.23 | 0.32 | 0.16 | 0.67 | 0.21 |
| IA02 | 0.78 | 0.08 | 0.34 | 0.15 | 0.07 | 0.77 | 0.17 |
| IA03 | 0.69 | 0.15 | 0.42 | 0.20 | -0.01 | 0.64 | 0.18 |
| IA04 | 0.89 | 0.07 | 0.20 | 0.07 | 0.11 | 0.88 | 0.23 |
| IA05 | 0.85 | 0.08 | 0.21 | 0.14 | 0.10 | 0.83 | 0.26 |
| IA06 | 0.85 | 0.01 | 0.21 | 0.20 | 0.13 | 0.83 | 0.23 |
| IB01 | 0.79 | 0.24 | 0.14 | 0.76 | 0.25 | 0.20 | 0.12 |
| IB02 | 0.81 | 0.23 | 0.29 | 0.78 | 0.17 | 0.12 | 0.11 |
| IB03 | 0.85 | 0.16 | 0.23 | 0.83 | 0.19 | 0.12 | 0.16 |
| IB04 | 0.91 | 0.11 | 0.18 | 0.83 | 0.29 | 0.21 | 0.21 |
| IB05 | 0.86 | 0.14 | 0.24 | 0.76 | 0.36 | 0.21 | 0.12 |
| IB06 | 0.84 | 0.13 | 0.25 | 0.76 | 0.31 | 0.21 | 0.16 |
| ET01 | 0.77 | 0.79 | 0.14 | 0.13 | 0.27 | 0.14 | 0.12 |
| ET02 | 0.86 | 0.87 | 0.18 | 0.09 | 0.19 | -0.03 | 0.13 |
| ET03 | 0.89 | 0.89 | 0.18 | 0.13 | 0.12 | 0.01 | 0.15 |
| ET04 | 0.86 | 0.86 | 0.15 | 0.14 | 0.22 | 0.08 | 0.11 |
| ET05 | 0.86 | 0.84 | 0.06 | 0.16 | 0.25 | 0.17 | 0.17 |
| ET06 | 0.86 | 0.83 | 0.09 | 0.20 | 0.27 | 0.14 | 0.12 |
| EA01 | 0.77 | 0.14 | 0.14 | 0.15 | 0.18 | 0.22 | 0.79 |
| EA02 | 0.68 | 0.31 | 0.21 | 0.09 | 0.24 | -0.08 | 0.68 |
| EA03 | 0.80 | 0.31 | 0.15 | 0.23 | 0.12 | 0.12 | 0.77 |
| EA04 | 0.89 | 0.08 | -0.14 | 0.14 | 0.13 | 0.34 | 0.85 |
| EA05 | 0.84 | 0.05 | 0.03 | 0.15 | 0.20 | 0.32 | 0.81 |
| EA06 | 0.76 | 0.09 | 0.08 | 0.05 | 0.24 | 0.34 | 0.74 |
| EB01 | 0.86 | 0.40 | 0.10 | 0.28 | 0.73 | 0.10 | 0.22 |
| EB02 | 0.88 | 0.42 | 0.17 | 0.28 | 0.74 | 0.02 | 0.21 |
| EB03 | 0.89 | 0.37 | 0.13 | 0.31 | 0.75 | 0.11 | 0.23 |
| EB04 | 0.95 | 0.26 | 0.l1 | 0.28 | 0.84 | 0.13 | 0.23 |
| EB05 | 0.93 | 0.28 | 0.12 | 0.27 | 0.82 | 0.17 | 0.23 |
| EB06 | 0.93 | 0.23 | 0.14 | 0.30 | 0.83 | 0.14 | 0.22 |
| Eigenvalue | 5.66 | 5.01 | 5.00 | 4.93 | 4.71 | 4.58 | |
| Explained variance (%) | 15.73 | 13.92 | 13.90 | 13.71 | 13.08 | 12.72 | |
| Cumulative explained variance (%) | 15.73 | 29.65 | 43,55 | 57.26 | 70.34 | 83.06 | |
| Kaiser–Meyer–Olkin test = 0.918; Bartlett’s test of sphericity: χ2 = 6370.374 (p < 0.001) | |||||||
| Locus of OI Activity | Role Perspectives | Component | Estimate | S.E. | t-Value | CR | AVE |
|---|---|---|---|---|---|---|---|
| Internal | Transfer | I-T-1 | 1.000 | 0.931 | 0.695 | ||
| I-T-2 | 0.924 | 0.09 | 10.463 *** | ||||
| I-T-3 | 1.142 | 0.09 | 12.091 *** | ||||
| I-T-4 | 1.441 | 0.14 | 10.416 *** | ||||
| I-T-5 | 1.410 | 0.14 | 10.472 *** | ||||
| I-T-6 | 1.380 | 0.14 | 10.147 *** | ||||
| Absorption | I-A-1 | 1.000 | 0.915 | 0.650 | |||
| I-A-2 | 0.753 | 0.11 | 7.068 *** | ||||
| I-A-3 | 1.075 | 0.12 | 8.971 *** | ||||
| I-A-4 | 1.120 | 0.10 | 11.391 *** | ||||
| I-A-5 | 1.126 | 0.10 | 11.618 *** | ||||
| I-A-6 | 1.102 | 0.10 | 11.452 *** | ||||
| Brokerage | I-B-1 | 1.000 | 0.959 | 0.795 | |||
| I-B-2 | 0.952 | 0.07 | 14.022 *** | ||||
| I-B-3 | 1.185 | 0.09 | 12.696 *** | ||||
| I-B-4 | 1.239 | 0.08 | 14.862 *** | ||||
| I-B-5 | 1.231 | 0.09 | 14.114 *** | ||||
| I-B-6 | 1.196 | 0.09 | 14.005 *** | ||||
| External | Transfer | E-T-1 | 1.000 | 0.960 | 0.802 | ||
| E-T-2 | 1.129 | 0.07 | 16.652 *** | ||||
| E-T-3 | 1.116 | 0.09 | 12.182 *** | ||||
| E-T-4 | 1.237 | 0.09 | 13.189 *** | ||||
| E-T-5 | 1.199 | 0.09 | 13.527 *** | ||||
| E-T-6 | 1.243 | 0.09 | 13.656 *** | ||||
| Absorption | E-A-1 | 1.000 | 0.935 | 0.709 | |||
| E-A-2 | 0.796 | 0.10 | 8.395 *** | ||||
| E-A-3 | 1.090 | 0.11 | 10.424 *** | ||||
| E-A-4 | 1.268 | 0.09 | 13.801 *** | ||||
| E-A-5 | 1.207 | 0.09 | 13.463 *** | ||||
| E-A-6 | 1.209 | 0.09 | 12.63 *** | ||||
| Brokerage | E-B-1 | 1.000 | 0.975 | 0.867 | |||
| E-B-2 | 1.012 | 0.04 | 23.323 *** | ||||
| E-B-3 | 1.127 | 0.05 | 22.194 *** | ||||
| E-B-4 | 1.187 | 0.06 | 19.024 *** | ||||
| E-B-5 | 1.169 | 0.06 | 18.552 *** | ||||
| E-B-6 | 1.181 | 0.06 | 18.741 *** |
| Internal | External | ||||||
|---|---|---|---|---|---|---|---|
| Transfer | Absorption | Brokerage | Transfer | Absorption | Brokerage | ||
| Internal | Transfer | 0.834 | |||||
| Absorption | 0.623 ** | 0.806 | |||||
| Brokerage | 0.549 ** | 0.542 ** | 0.892 | ||||
| External | Transfer | 0.392 ** | 0.289 ** | 0.460 ** | 0.895 | ||
| Absorption | 0.365 ** | 0.553 ** | 0.472 ** | 0.434 ** | 0.842 | ||
| Brokerage | 0.417 ** | 0.407 ** | 0.668 ** | 0.634 ** | 0.563 ** | 0.931 | |
Publisher’s Note: MDPI stays neutral with regard to jurisdictional claims in published maps and institutional affiliations. |
© 2022 by the authors. Licensee MDPI, Basel, Switzerland. This article is an open access article distributed under the terms and conditions of the Creative Commons Attribution (CC BY) license (https://creativecommons.org/licenses/by/4.0/).
Share and Cite
Jun, Y.; Kim, K. Developing an Open Innovation Attitude Assessment Framework for Organizations: Focusing on Open Innovation Role Perspective and Locus of Activity. Behav. Sci. 2022, 12, 46. https://doi.org/10.3390/bs12020046
Jun Y, Kim K. Developing an Open Innovation Attitude Assessment Framework for Organizations: Focusing on Open Innovation Role Perspective and Locus of Activity. Behavioral Sciences. 2022; 12(2):46. https://doi.org/10.3390/bs12020046
Chicago/Turabian StyleJun, YoungPyo, and Kilsun Kim. 2022. "Developing an Open Innovation Attitude Assessment Framework for Organizations: Focusing on Open Innovation Role Perspective and Locus of Activity" Behavioral Sciences 12, no. 2: 46. https://doi.org/10.3390/bs12020046
APA StyleJun, Y., & Kim, K. (2022). Developing an Open Innovation Attitude Assessment Framework for Organizations: Focusing on Open Innovation Role Perspective and Locus of Activity. Behavioral Sciences, 12(2), 46. https://doi.org/10.3390/bs12020046