
Article

Modeling Hemorrhagic Shock in Male SD Rats by Fixed Volume Blood Withdrawal Followed by Partial Resuscitation and Long-Term Outcome Assessment

by
Alina M. Ismailova
1,
Victor A. Palikov
1,2,
Maria S. Severyukhina
1,
Elena A. Tukhovskaya
1,*,
Arina V. Kholina
1,
Svetlana G. Semushina
1,
Gulsara A. Slashcheva
1,
Elvira R. Shaykhutdiniva
1,
Irina N. Kravchenko
1,
Vitaly A. Kazakov
1,2,
Ekaterina N. Kazakova
1,
Marina S. Kazakova
1,2,
Alena B. Timakina
1,2,
Maksim V. Shinelev
1,2,
Vladimir A. Rykov
1,
Olga I. Patsap
3,
Igor A. Dyachenko
1,2 and
Arkady N. Murashev
1
1
Branch of Shemyakin and Ovchinnicov Institute of Bioorganic Chemistry, Russian Academy of Sciences, Prospekt Nauki, 6, Pushchino 142290, Russia
2
Pushchino Branch of the Federal State Budgetary Educational Institution of Higher Education, Russian Biotechnological University (BIOTECH University), Pushchino 142290, Russia
3
Research and Educational Resource Center for Immunophenotyping, Digital Spatial Profiling and Ultrastructural Analysis Innovative Technologies (Molecular Morphology Center), Peoples’ Friendship University of Russia Named After Patrice Lumumba, Miklukho-Maklaya Street, 6, Moscow 117198, Russia
*
Author to whom correspondence should be addressed.
Med. Sci. 2026, 14(5), 587; https://doi.org/10.3390/medsci14050587 (registering DOI)
Submission received: 24 August 2026 / Revised: 15 September 2026 / Accepted: 16 September 2026 / Published: 18 September 2026

Abstract

Background/Objectives: Hemorrhagic shock (HS) is one of the leading causes of disability and mortality in intensive care units. Animal modeling of HS is important for preclinical research to elucidate mechanisms and develop treatments. Methods: Adult male SD rats were divided into three groups, half of which were euthanized on day 8 and the other half on day 29 after HS. HS was simulated in awake animals by withdrawing blood from the carotid artery at a volume of 40% of circulating blood volume (CBV). One hour after HS, volume resuscitation therapy (VRT) was made by administering albumin-containing saline (AS) or autologous blood (AB) at 20% of CBV. Arterial pressure (AP), heart rate (HR), body temperature, blood gases, and blood metabolites, body weight gain, hemostasis, and blood cellular composition were analyzed. On days 8 and 29, bone marrow composition, organ weight, and histology were analyzed. Results: During blood withdrawal, AP dropped, HR increased, and hypothermia developed. After HS and subsequent VRT, 30% of animals receiving SA died, while all animals receiving AB survived. Following HS, a negative weight gain trend, anemia, pronounced inflammatory reaction, and coagulopathy developed. After HS, animals experienced an increase in partial oxygen pressure, a decrease in partial carbon dioxide pressure, total arterial oxygen content in arterial blood, stress-induced glycemia, and metabolic lactatemia. In bone marrow, the number of erythroid cells increased, while leukocyte and lymphocyte numbers decreased. HS resulted in increased spleen weight with increased extramedullary hematopoiesis. Ischemic kidney tissue damage with a decrease in kidney weight was observed, as well as post-ischemic accidental thymus involution with a catastrophic decrease in its weight. In addition, ischemic brain damage was observed in some animals. Animals showed a compensatory increase in hematopoiesis. All changes were less pronounced in AB-treated animals. Conclusions: We have developed a suitable model of HS, comparable to a similar condition in humans. This model can be easily reproduced and applied in most laboratories conducting preclinical studies.

1. Introduction

Massive blood loss accompanied by HS remains one of the leading causes of mortality in intensive care, acting as a key pathogenetic link in the outcome of a wide range of emergency conditions [1]. Thus, HS is the leading cause of death in trauma patients worldwide [2,3], and the highest probability of a fatal outcome is observed in the first hours after injury at the prehospital stage [4,5]. In patients with injuries of various origins, HS is the cause of death—in 30% of cases in patients with complications of gastrointestinal diseases, in 60% of cases—in patients with abdominal aortic aneurysm—in 100% of cases, and in obstetric and gynecological complications—in 23% of cases [6].
The pathophysiological mechanisms of HS development are associated with acute hypovolemia and, consequently, impaired peripheral perfusion and a critical reduction in oxygen delivery. Acute hypovolemia results in a compensatory release of vasopressin, vasoconstriction to maintain blood pressure and cardiac output, and an increase in heart rate. Compensatory centralization of blood circulation occurs, meaning that the bulk of the blood is redirected to the organs most sensitive to hypoxia—the brain and heart—due to increased venous outflow due to venous spasm and the emptying of hematopoietic depots (spleen, liver, skin, adipose, and muscle capillaries). Physiological compensation for blood loss also includes autohemodilution (fluid entering the bloodstream from the interstitial space), activation of hematopoiesis, and hypercoagulation.
A decrease in oxygen supply leads to a transition from an aerobic to an anaerobic metabolic pathway, which causes the accumulation of oxygen radicals, lactate, and the development of acidosis [7], as well as a decrease in body temperature [8]. Anaerobic metabolism leads to massive mitochondrial dysfunction, ATP depletion, and cell death [5,9]. With prolonged uncompensated HS, persistent hypoperfusion, hypotension, hypoxia, disseminated intravascular coagulation, and multiple organ failure develop [10,11,12]. In addition, the immune system responds to acute blood loss by activating innate immune genes responsible for pro- and anti-inflammatory processes [13,14]. In patients with severe uncompensated bleeding, inflammation persists, leading to systemic inflammatory response syndrome, multiple organ failure, and death [15]. Moreover, if the hyperinflammatory response is activated early in the blood loss process, immunosuppression subsequently develops, which can lead to long-term complications and death [16]. Although severe bleeding is life-threatening, it can be treated in a hospital setting if properly diagnosed and treated promptly [4,17,18,19]. Time is a key factor in the effectiveness of therapy in acute severe blood loss; that is, the sooner therapy is started, the higher the chances of its success [5,20,21], and it is important to minimize the duration of the pre-hospital stage of emergency care [22]. The primary goal of HS therapy is to stop bleeding and maintain organ and tissue perfusion and oxygenation, i.e., volume resuscitation therapy (VRT). However, proper VRT presents a significant therapeutic challenge, as aggressive intravenous fluid administration can lead to dilution of coagulation factors. Therefore, VRT aims to maintain “acceptable” hypotension and tissue perfusion. However, this strategy should be used with caution in patients with concomitant hypertension (elderly patients) and in patients with traumatic brain injury (it is necessary to maintain normal perfusion pressure to ensure adequate oxygenation) [23,24,25]. The use of 0.9% saline may increase acidosis and kidney injury in critically ill patients, in contrast to isotonic balanced crystalloid solutions containing physiological concentrations of electrolytes, although the advisability of their use in general is questionable [26,27,28].
Currently, emergency care includes transfusion of equal volumes of fresh frozen plasma, platelets, and red blood cells in a ratio of 1:1:1 or 1:1:2 [25,29]. Whole blood transfusion is considered in some studies as a more effective strategy for maintaining homeostasis [30,31]. Assessing the overall condition and the specific phase of HS is crucial for choosing a treatment strategy and predicting outcome, as certain therapeutic actions during one phase may be harmful during another. The interaction between inflammation, hypoxia, and coagulation during the development of HS constantly alters the pathophysiological balance, requiring thoughtful and precise interventions based on clinical and laboratory diagnostic results [32]. Important evaluation and prognostic parameters are AP and HR, measurement of blood gases and metabolites, measurement of lactate levels, hemostasis parameters, and hematological analysis of whole blood [33,34,35,36,37]. Animal models of HS are used to study the pathophysiology of HS and research new therapeutic strategies for its correction. HS is most often modeled in anesthetized animals, with blood drawn until blood pressure drops to a certain level (35–45 mmHg) [38,39]. However, when HS is modeled by fixed blood pressure, the amount of blood removed is not uniform, as compensatory mechanisms may be activated at different times and to different degrees in different animals. Furthermore, anesthesia eliminates the neurogenic factor and activates the parasympathetic nervous system, masking the body’s sympathetic responses. In our opinion, modeling HS based on the volume of blood loss relative to the CBV is more relevant [40,41]. It should be noted that the vast majority of studies using HS modeling consider short-term modeling effects over periods of 3 to 72 h [42,43,44,45].
The aim of our study was to develop an optimal blood loss model of HS in awake male SD rats that would be reproducible in most preclinical laboratories. We also planned to examine the long-term effects of HS using multiple time points to record parameters, starting from baseline (BL) and up to day 29 post-HS.

2. Materials and Methods

2.1. Animals

The study used sexually mature male SD rats, specific pathogen-free (SPF), aged 12–14 weeks with an average body weight of 327 ± 17 g. The animals were obtained from the Pushchino Laboratory Animal Breeding Center in Pushchino, Russia. Upon receipt, the animals were quarantined for 14 days. Clinically healthy animals were included in the study. The animals’ clinical health was confirmed by examining them for any abnormalities in appearance and behavior. Animals were randomly assigned to groups using body weight as a criterion. It was ensured that the average body weight did not differ between groups, and that the variation in body weight within groups did not exceed 20%. During the study, the animals were kept under controlled environmental conditions in a barrier zone with a “clean” and “dirty” corridor system with controlled environmental conditions (temperature 20–24 °C, relative humidity 30–55%, 12 h light cycle; 08:00–20:00—“day”, 20:00–08:00—“night”; 10-fold change in air volume in the room per hour). The animals received ad libitum food: laboratory mice and rats received Velaz FORTI 1324 Maintenance Diet (Altromin Spezialfutter GmbH & Co KG, Lage, Germany). All procedures and manipulations with animals were approved by the Committee for Control over Care and Use of Laboratory Animals of BIBCh RAS (IACUC) (protocol number 1053/25 from 17 October 2025) and were carried out in accordance with the EU Directive 2010/63/EU. The actual start date for work with animals is 3 November 2025. The animal study was supported by the Scientific Infrastructure Project 075-15-2025-514/MSHE RF.

2.2. Design Description

The study involved 30 animals divided into three groups of 10 animals each, half of which were euthanized on day 8 and the other half on day 29 (Table 1). Animals from groups 1 and 2 had catheters implanted in the jugular vein to perform VRT and in the carotid artery to record AP and HR. HS was modeled by withdrawing blood in a volume of 40% of the CBV. One hour after HS modeling, partial VRT was performed by administering SA (Saline + Albumin (7:1)) or AB through a venous catheter in a volume equal to 50% of the withdrawn volume (i.e., 20% of the CBV). The CBV was calculated as 64 mL/kg [46,47]. Forty-eight hours after the HS modeling, the animals were again anesthetized with inhalation anesthesia to remove the catheters from the carotid artery and jugular vein. Animals from group 3 were intact, that is, they had not undergone any procedures during their lives.
Animals’ blood pressure and heart rate were recorded throughout the blood loss period and at 1 h, 3 h, 24 h, and 48 h after the simulated HS. Body temperature was measured before the start of HS, before VRT (60 min after the start of HS), 1 h, 3 h, 24 h, and 48 h after VRT. Oximetry parameters were measured in arterial blood samples taken from animals before HS modeling, 1 h after HS before the start of VRT, and 3, 24, and 48 h after HS modeling. Hematological parameters were measured in whole blood samples collected from animals before HS, 1 h after HS before the start of VRT, 3 h, 24 h, 48 h, and on days 8 and 29 after HS. Hemostasis parameters were measured in blood samples collected before HS, 24 h, 48 h, and on days 8 and 29 after HS.
During the intravital phase of the study, the condition of the animals was monitored, and body weight gain was recorded. At the end of the intravital phase of the study (8 days or 29 days), the animals were euthanized under anesthesia and total blood sampling was performed from the inferior vena cava; organs were weighed, and bone marrow smears were prepared for myelogram analysis.
Table 1 provides a description of animal groups, procedures performed, and drugs used, and Figure 1 shows experimental design.

2.3. Drugs in the Study

The study used 0.9% sodium chloride infusion solution (Solopharm, Saint Petersburg, Russia) and 20% human albumin infusion solution (Microgen, Moscow, Russia). Isoflurane inhalation anesthesia solution (Laboratories Karizoo, Barcelona, Spain) was used for anesthesia for HS modeling and subsequent catheter removal. For anesthesia for euthanasia, Vezotil® (Moscow Endocrine Plant, Federal State Unitary Enterprise, Moscow, Russia) and Xyla® injection solution (Interchemie, Venray, The Netherlands) were used. To prepare a preservative/anticoagulant for autologous blood, we used sodium citrate dihydrate (Servisbio, Wuhan, China), citric acid anhydrous extrapure (Sisco Research Laboratories PTV. LTD, Mumbai, India), dextrose monohydrate extrapure AR, ACS, ExiPlus, Multi-Compendial (Sisco Research Laboratories PTV. LTD, Mumbai, India), and water for injection (Solopharm, Saint Petersburg, Russia). Enroflon® 2.5% antibiotic for injection (VIC-Animal Health, Vitebsk, Belarus) was used to prevent infection.

2.4. HS Modeling and VRT

To simulate HS, animals underwent catheterization of the external carotid artery (for blood sampling, AP, and HR measurements) and the jugular vein (for VRT). Animals were anesthetized with isoflurane (2.5% at a flow rate of 1.5 L/min), and the surgical field in the ventral and dorsal regions of the neck was prepared: hair was removed, and the skin was treated with a disinfectant solution. Animals were immobilized by tying forepaws and upper incisors to the operating table with soft ropes. During surgery, animals lay on a thermostatically controlled surface at a temperature of 37 °C. The surgery was performed using sterile instruments and materials, observing aseptic technique.
To implant a catheter into the carotid artery, a longitudinal skin incision 1.5–2.0 cm long was made along the midline of the neck. The salivary glands and muscles were carefully retracted. A section of the common trunk of the carotid artery approximately 0.7 cm long was carefully isolated. Ligatures were placed under the isolated section of the artery. A longitudinal incision 0.5 mm long was made in the vessel between the ligatures using vascular scissors. The tip of the catheter was inserted into the resulting opening. After releasing the distal ligature, the catheter was pushed further along the vessel to the shock-absorbing ring (by 2–3 cm). The ligatures were tightened and tied. Implantation of the catheter into the jugular vein was performed similarly to insertion of a catheter into the carotid artery. To expose the ends of the catheters to the withers, a longitudinal skin incision no longer than 5 mm was made on the back of the neck. Using a metal atraumatic tube, the catheter ends were subcutaneously advanced to the withers. The skin incision on the midline of the neck and the withers was closed with sterile absorbable suture material (Caproag 4/0, Repromed, Moscow, Russia). Following catheterization, animals were allowed to recover from anesthesia for 30 min (during this period, the animal’s vegetative status is completely restored), after which AP and HR were recorded for 5 min. Blood was then withdrawn from the arterial catheter in a bolus for oximetry (75 μL), hematology (200 μL), and hemostasis (0.5 mL), for a total volume of 775 μL. To simulate HS, the remaining blood was gradually withdrawn (so that the final volume of blood collected was 40% of the CBV), with equal volumes being withdrawn every 30 s for 15 min. CBV was calculated for each animal based on its body weight. During blood withdrawal for HS, external manifestations of stress in behavior and HR were monitored. Upon completion of blood collection, animals were left in a holding cage for 1 h, after which VRT in a volume of 20% of CBV was performed. To prevent infection, animals were administered the antibiotic Enroflon intramuscularly at a dose of 5 mg/kg and a volume of 2 mL/kg for 5 days after HS. To prevent blood clots, the catheters were filled with sterile saline and flushed with 100–150 μL of saline every 12 h for 48 h until the catheters were removed.

2.5. VRT Procedure

Animals in group 1 were given 0.9% sodium chloride solution (saline) followed by 20% albumin (7:1 v/v). The introduction of albumin should improve the maintenance of oncotic pressure [48]. Animals from group 2 were administered AB, which was chosen as TF therapy as the most optimal VRT option in case of blood loss [30,31]. The administration was performed using an infusion pump Aladdin AL-1000 (World Precision Instruments, INC., Sarasota, FL, USA) through a venous catheter connected to a syringe placed in an infusion pump. The infusion volume was 50% of the volume of blood withdrawn. The infusion rate was 30 mL/kg/min.

2.6. VRT Issues Preparation

2.6.1. Preservative/Anticoagulant Preparation

The preservative/anticoagulant was prepared according to the following formula: sodium citrate dihydrate—2.2 g, citric acid anhydrous extrapure—0.73 g, dextrose monohydrate extrapure AR, ACS, ExiPlus, Multi-Compendial—2.45 g, water for injection—up to 100 mL. Preparation was performed under aseptic conditions. After preparation, the solution was filtered through syringe-driven, 0.22 µm EPE204030, BIOFIL, China.

2.6.2. Preparation of Autologous Blood for TF

Autologous blood for transfusion therapy was prepared as follows: during the HS model, blood was collected into a sterile syringe containing a preservative/anticoagulant equal to 10% of the volume of blood being collected. The syringe containing the blood and preservative was placed in an incubator at 37 °C after each blood collection and stored there for one hour after collection until the time of TF.

2.7. AP and HR Registration

AP and HR were recorded 30 min after surgical catheter implantation before blood sampling, immediately after blood sampling (HS start—15 min after the start of blood sampling), 60 min after blood sampling before VRT, 24 h after HS, and 48 h after HS (before catheter removal). AP was measured in 5-min intervals at each time point, with subsequent averaging. AP and HR were recorded through a carotid artery catheter connected to a PowerLab 4/35 computerized system with LabChart 7 Pro software (ADInstrument Inc., Bella Vista, New South Wales, Australia).

2.8. Blood Sample Collection

Blood was collected from animals through an arterial catheter before HS, 1 h after the end of HS before the start of VRT, 24 h after HS, and 48 h after HS before catheter removal. Blood samples were also collected from the inferior vena cava during necropsy on day 8 after HS and on day 29 after HS. In intact animals, blood was collected only during necropsy on days 8 and 29. The blood sampling scheme is shown in Table 2.

2.9. Removal of Catheters 48 h After HS

Forty-eight hours after HS, after a 5-min recording of AP and HR, blood sampling for hematology, hemostasis, and blood gas analysis was performed; animals were anesthetized with isoflurane, and venous and arterial catheters were removed. The vessels were ligated after catheters were removed, and skin at incision sites on the neck and withers was sutured. Following the surgical procedure, animals were placed in their holding cages.

2.10. Blood Gas and Metabolite Analysis

Blood samples collected from the animals’ arterial catheters before HS, before VRT, and 24 and 48 h after HS were analyzed using an ABL90 Flex gas analyzer (Radiometer Medical ApS, Copenhagen, Denmark). A 75-μL safeCLINITUBES capillary (Radiometer Medical ApS, Copenhagen, Denmark) was filled with whole blood collected from the animals’ arterial catheters and connected to the ABL90 Flex gas analyzer. The parameters listed in Table 3 were measured in the blood.

2.11. Body Temperature Registration

Animals’ body temperature was measured using an Omron Eco Temp Basic MS-246 electronic thermometer (Omron Healthcare Co., Ltd., Shanghai, China) before the start of HS, before VRT (60 min after the start of HS), after 1 h, after 3 h, after 24 h, and after 48 h after HS. To record body temperature, the thermometer tip was treated with petroleum jelly and inserted into the rectum.

2.12. Hematology Analysis

Whole blood samples (200 μL) were placed in Microvette® 200 K3E tubes containing K3EDTA (SARSTEDT AG & Co., Nümbrecht, Germany). Blood was analyzed using a Mythic 18 hematology analyzer with a built-in veterinary program (C2 DIAGNOSTICS S.A., Montpellier, France) for the following parameters:
Red blood cell count (RBC)
Hemoglobin level (Hb)
Hematocrit (HCT)
White blood cell count (WBC)
Mean corpuscular hemoglobin content (MCH)
Mean corpuscular hemoglobin concentration (MCHC)
Mean corpuscular volume (MCV)
Red cell distribution width—variation coefficient (RDW)
Red cell distribution width-standard deviation (RDW-SD)
Platelet count (PLT)
Mean platelet volume—variation coefficient (MPV)
Plateletcrit (PCT)
Platelet distribution width—variation coefficient (PDW)
Lymphocytes (LYM)
Monocytes (MON)
Granulocytes (GRA)
The analysis was performed before HS, one hour after the start of HS before VRT, three hours after VRT, 24 h after HS, 48 h after HS, 8 days after HS, and 29 days after HS.

2.13. Hemostasis Analysis

Hemostasis analysis was performed on freshly collected plasma. To obtain plasma, 1 mL of blood was placed in a tube containing 100 μL of EDTA and centrifuged in an Eppendorf 5804 R centrifuge at 24 °C (3000 rpm, 15 min). Plasma was analyzed for activated partial thromboplastin time (APTT), prothrombin time (PT), and fibrinogen (Fg). Analysis was performed at the following time points: before HS, 24 h, 48 h, 8 days, and 29 days after HS.

2.14. Registration of Mortality and Assessment of Animal Welfare

Throughout the intravital phase of the study, animals were examined daily, assessing their general condition and recording signs of deviations in health and mortality.

2.15. Registration of Body Weight Gain

During the intravital phase, body weight of the animals was recorded weekly, and the increase in body weight was calculated as a % change in body weight on the day of measurement from the initial weight measured on the first day of the study (before HS).

2.16. Euthanasia

Animals were euthanized by anesthesia with a Vesotil®/Xyla® mixture (30 mg/kg + 10 mg/kg, intramuscularly) followed by terminal blood sampling from the caudal vena cava. Half of the animals were euthanized on day 8 of the study, and half on day 29 of the study (Table 1).

2.17. Necropsy and Organ Weighing

During euthanasia, the animals’ body cavities and internal organs were examined, weighed, and then preserved in formalin for histological analysis. The following organs were collected: spleen, adrenal glands, kidneys, submandibular lymph nodes, thymus, heart, lungs, and brain. Relative organ weight was calculated as a percentage of body weight at necropsy.

2.18. Bone Marrow Smear and Myelogram Analysis

During necropsy on days 8 and 29 of the study, bone marrow was isolated from all surviving animals by washing it from the femur with a mixture of PBS (pH = 7.4) and fetal bovine serum (1:1) followed by centrifugation for 1 min in a Mini Spin centrifuge (Eppendorf, Hamburg, Germany) at 5000 rpm. Bone marrow smears were prepared from the resulting sediment and stained using the May-Grünwald/Romanovsky/Pappenheim method [52]. Stained smears were analyzed for hematopoietic cells—lymphoid, granulocyte/myeloid, and erythroid—by calculating the M:E (myeloid-to-erythroid ratio). Cells were counted using a 500-cell SFC “MINILAB” formed element counter. Slides were analyzed using a Leica DM LA light microscope (Leica, Wetzlar, Germany) at 40x magnification (in oil immersion).

2.19. Histology

Biomaterial samples were fixed in 10% neutral formalin, rinsed in running tap water, dehydrated in ascending alcohol concentrations, and embedded in paraffin. Paraffin sections (4–5 µm thick), stained with hematoxylin and eosin, were examined using light microscopy on an AxioScope A1 microscope (Carl Zeiss, Oberkochen, Germany). Micrographs of histological preparations were obtained using an Axiocam 305 color high-resolution camera (Carl Zeiss, Oberkochen, Germany) and ZEN 2.6 lite software (Carl Zeiss, Oberkochen, Germany). Table 4 shows the scoring scale used to assess the severity of pathohistological changes.

2.20. Statistics

Data are presented as mean values ± standard deviation (SD) or standard error of the mean (SEM), calculated in Excel. Statistical data processing was performed using Statistica for Windows v.7.0 software. Repeated measures ANOVA followed by a post-hoc Fisher LSD test was used to assess intergroup differences in values measured dynamically (hemodynamics, body temperature, hematology, hemostasis, oximetry, body weight gain). One-way ANOVA followed by a post-hoc Fisher LSD test was used to analyze intergroup differences for values measured at necropsy (organ weight, semiquantitative assessment of histological pathology, myelogram analysis results).

3. Results

3.1. Mortality

Of 10 animals that received SA as VRT, 2 animals died within the first three hours after HS. On day 8, half of the surviving animals in this group, i.e., 4 out of 8, were euthanized. One more animal (1 out of 4) in this group died on day 20 after HS. No deaths were observed among animals that received AB after HS. This fact leads to an important remark that must be taken into account when evaluating all the parameters studied in this study: not all samples were obtained from deceased animals and, therefore, could not be evaluated; only parameters from surviving animals whose condition did not deteriorate to the terminal stage were evaluated.

3.2. Weight Gain

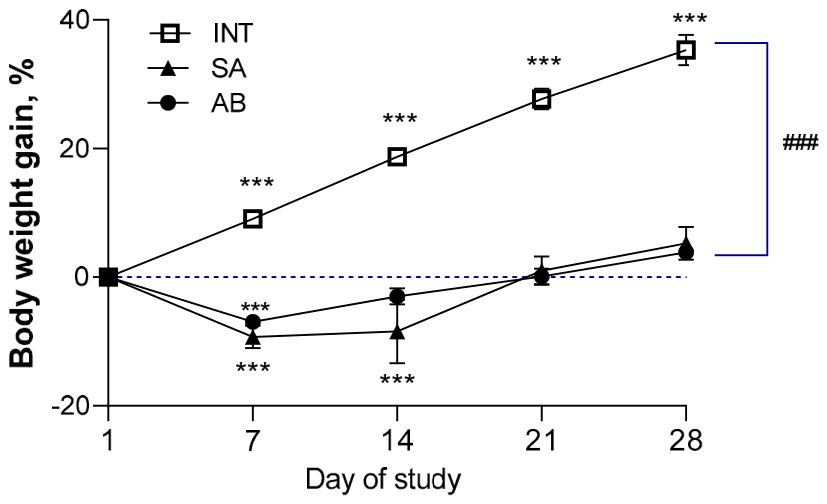
All animals lost weight after HS, and their body weight gain was significantly reduced compared to intact animals throughout the observation period. This did not differ between the groups receiving SA and AB after HS. Data are presented in Figure 2 and Table 5.

3.3. AP and HR

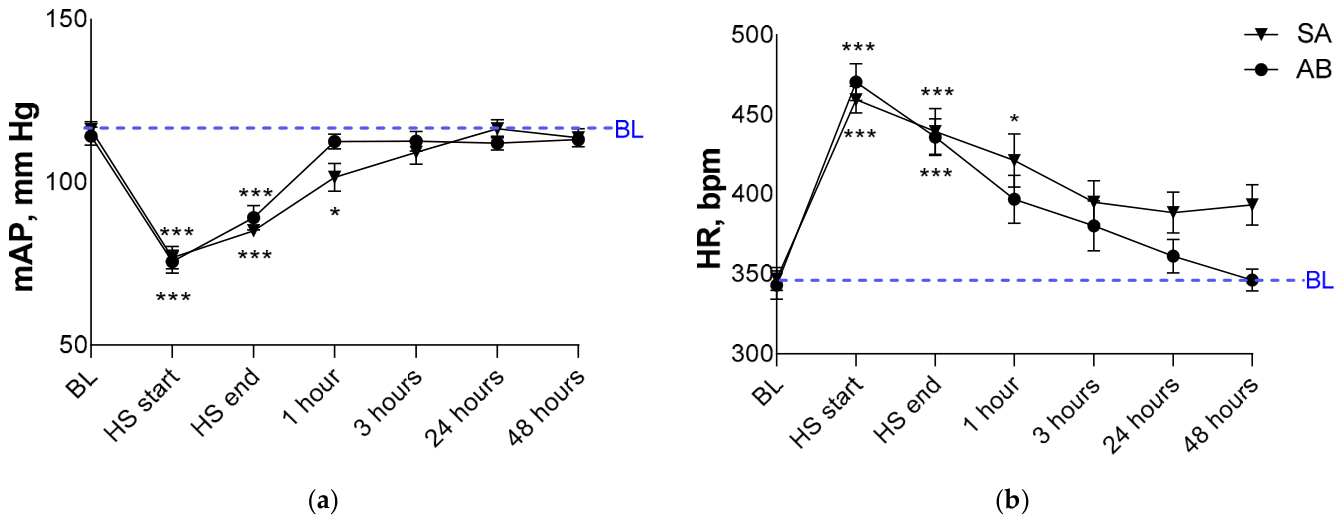
Ten minutes after the start of blood sampling, blood pressure dropped by more than 30% relative to baseline values, while heart rate increased by 30%. The drop in blood pressure, coupled with a compensatory increase in heart rate, continued for three hours in the SA group and for one hour in the AB group. Thus, AB was more effective in restoring hemodynamic parameters after HS (Figure 3).

3.4. Body Temperature

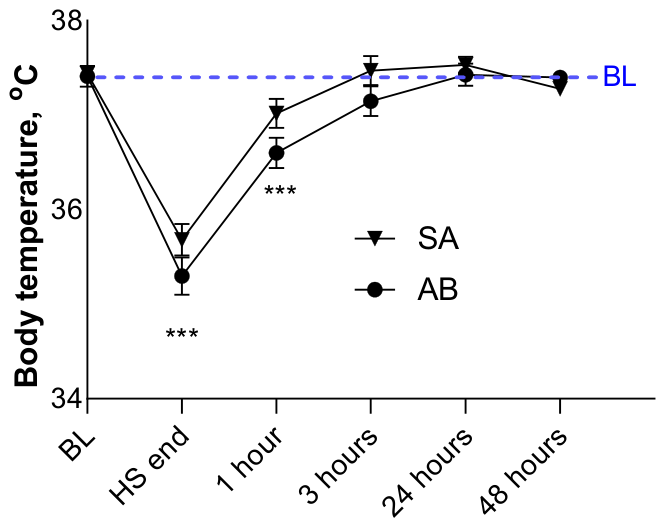
Body temperature significantly decreased from 37.5 °C to 35.5 °C in animals 60 min after the start of HS, followed by recovery to baseline values 3 h after HS (Figure 4).

3.5. Registration of Blood Gases and Metabolites with a Gas Analyzer (Oximetry)

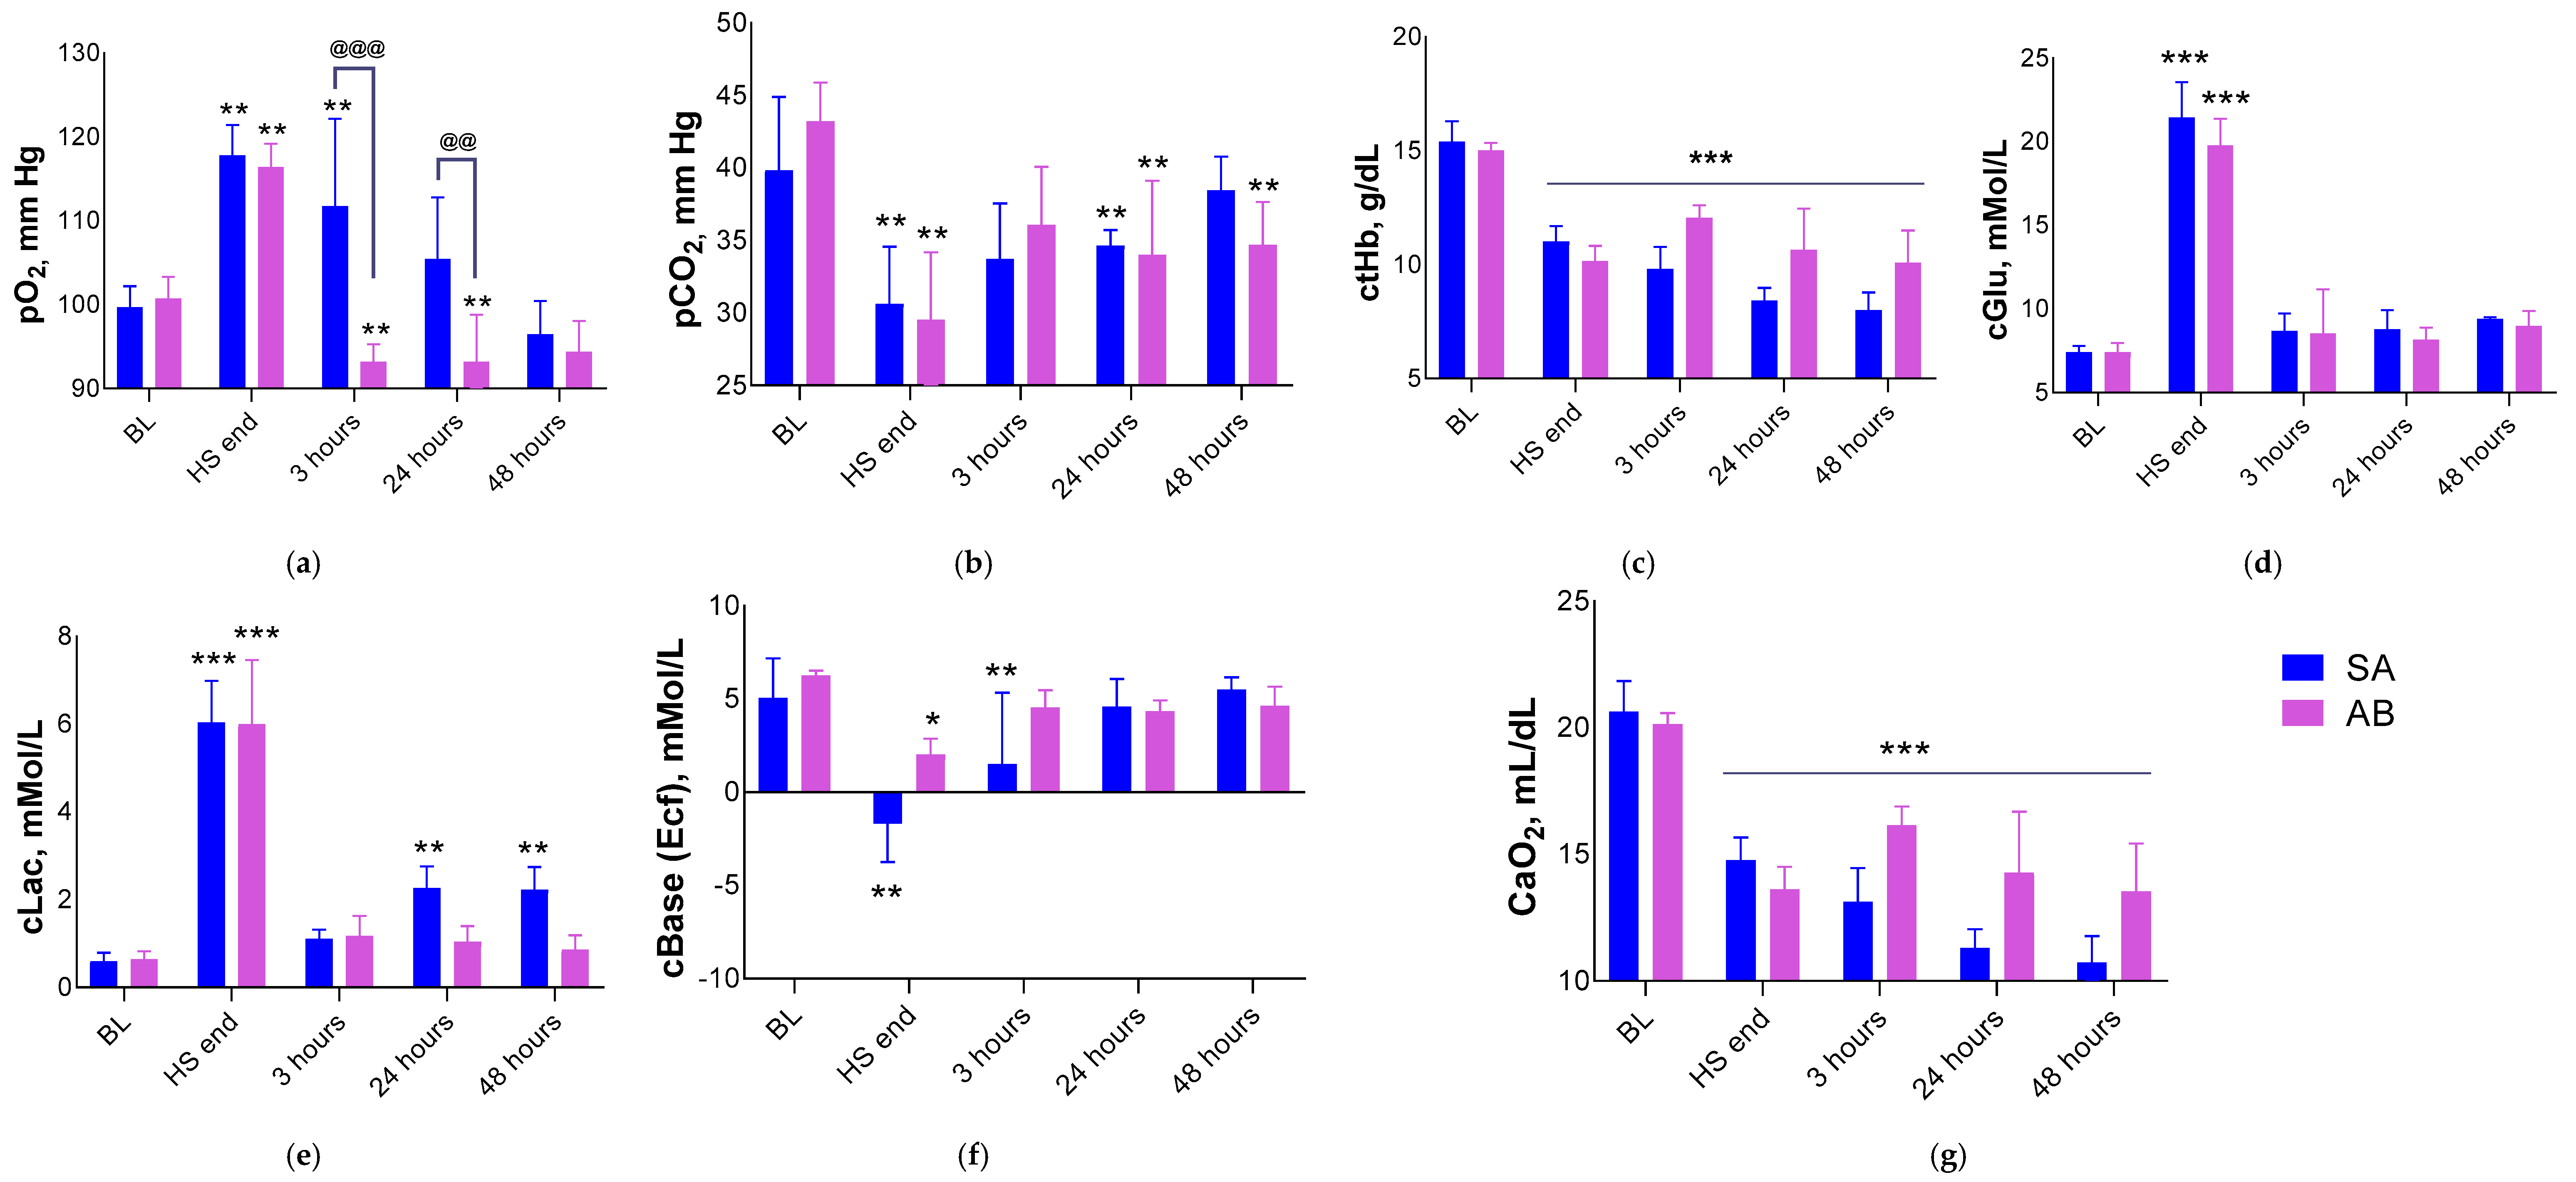
The oximetry parameters that changed during the experiment are shown in Figure 5. Sixty minutes after the initiation of HS, the animals’ pO2 increased, indicating an increase in the amount of oxygen dissolved in blood plasma. After 3 h, pO2 in animals receiving AB decreased below baseline and remained reduced for up to 24 h. In the animals receiving SA, pO2 remained elevated for up to 3 h after VRT, with pO2 values being significantly higher than in animals receiving AB at 3 h and 24 h after HS. pCO2 decreased after HS and remained reduced for up to 48 h after HS. ctHb also decreased after HS and remained reduced for up to 48 h, with no differences observed between SA and AB. cGlu increased sharply fivefold after 60 min of HS, returning to baseline values within 3 h after HS in both model groups. cLac increased eightfold after 60 min of HS, returning to normal by 3 h after HS in the AB-treated group, while in the SA-treated group it decreased but did not return to baseline, remaining twofold elevated for up to 48 h after HS. cBase (Ecf), reflecting the metabolic component of blood buffering capacity, decreased in animals 60 min after HS, which correlates with an increase in blood cLac at the same time. The calculated CaO2 indicator decreased in animals after HS and remained reduced for up to 48 h after HS.

3.6. Hematology

The dynamics of hematological parameter changes are presented in Table 6. After HS, all animals experienced a decrease in RBC count, cHb, and HCT. This decrease persisted throughout the 28 days of the study, although it was less pronounced in animals receiving AB. On days 8 and 29 after HS, animals showed an increase in the red RDW, indicating increased variability in red blood cell size in the bloodstream. Judging by the increase in MCV at these same times, more young, large RBCs, which had matured in the bone marrow, appeared in the blood. Furthermore, animals after HS experienced a gradual increase in WBC count—in the first 24 h due to an increase in GRA, and from 48 h to day 8 of the study, due to ongoing lymphocytosis.
On the 8th day after HS, a twofold increase in PLT count was observed, caused by the release of new cells from the bone marrow after maturation, indirectly confirmed by a decrease in the MPV (typical of young cells). Moreover, both before and after the 8th day, PLT counts did not differ significantly from baseline, indicating that excess PLT were deposited in the spleen. These changes were less pronounced in the group of animals receiving AB.

3.7. Myelogram

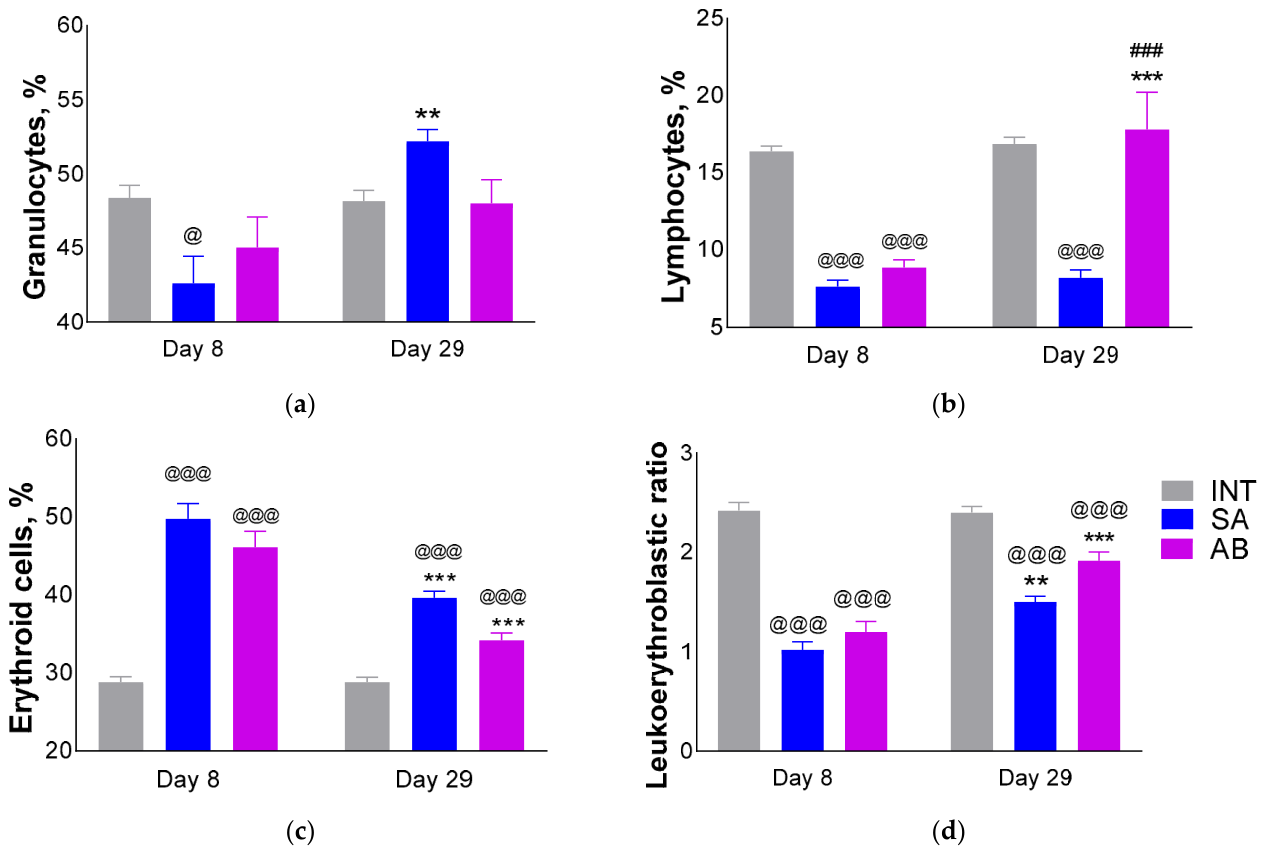
Figure 6 shows the cellular composition of animal bone marrow. The granulocyte count was significantly reduced in animals infused with SA on day 8 post-HS, with recovery by day 29 post-HS. The granulocyte count in animals treated with SA was higher than BL on day 29 post-HS, which may indicate a persistent inflammatory process. A significant, almost threefold, drop in the lymphocyte count was observed on day 8 post-HS, which persisted until day 29 in animals treated with SA but fully recovered in animals treated with AB. A twofold increase in the erythroid count was observed on day 8 post-HS, with a recovery by day 29 post-HS. The calculated leukoerythroblastic ratio was reduced on day 8 post-HS, with a recovery by day 29, although the recovery was not complete.

3.8. Hemostasis

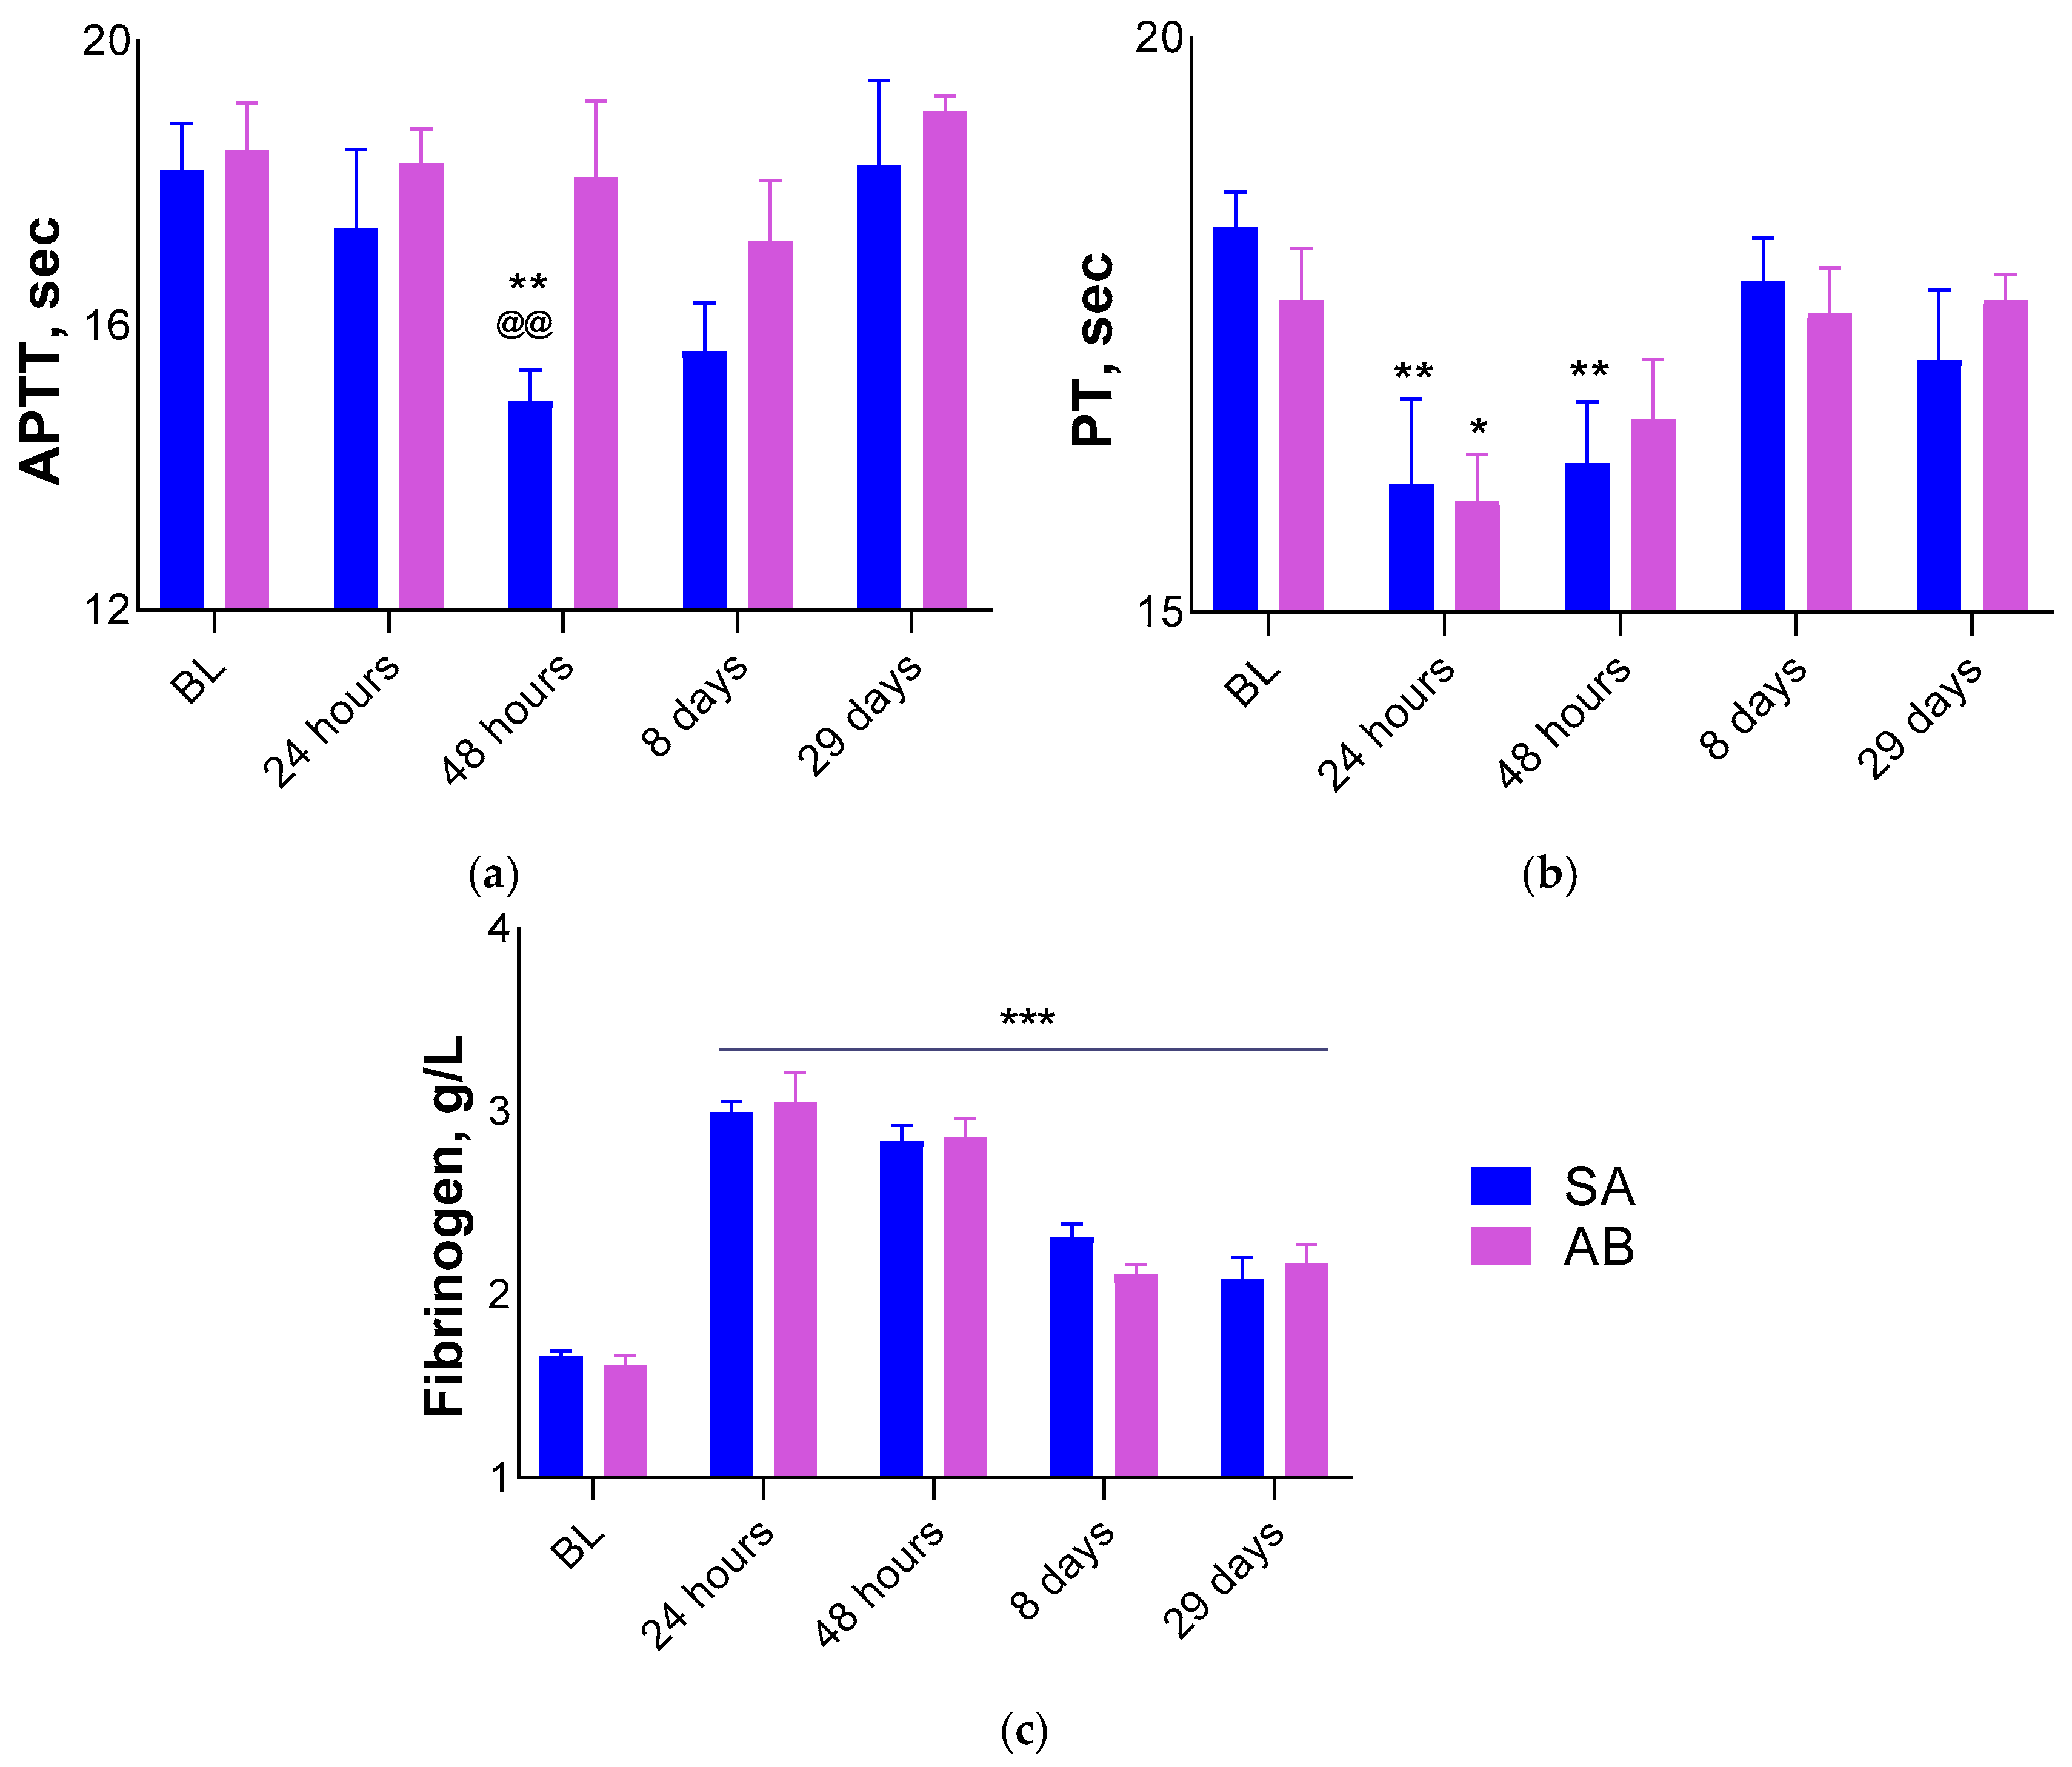
In animals treated with SA (but not AB) after HS, APTT decreased 48 h after HS. PT decreased relative to BL 24 h after HS in the SA and AB groups, remaining decreased after 48 h only in the SA group. On days 8 and 29 after HS, both parameters recovered to baseline levels. Fibrinogen concentration was elevated in both groups at all time points (24 h, 48 h, 8 days, and 29 days after HS). Data are shown in Figure 7.

3.9. Organ Weight

After HS, animals’ organ weights changed relative to those in intact animals. Spleen weight increased on day 8 after HS (more markedly in the SA-treated group), followed by a recovery-like decrease by day 29. Kidney weight decreased on day 8 and remained reduced on day 29 after HS. Liver weight increased on day 8 and then decreased on day 29 after HS. Thymus weight decreased significantly—almost fivefold—on day 8 in animals after HS. Although some recovery-like increase in thymus weight was observed by day 29, the organ weight remained almost twofold lower than in intact animals. Organ weight data are presented in Table 7.

3.10. Histology

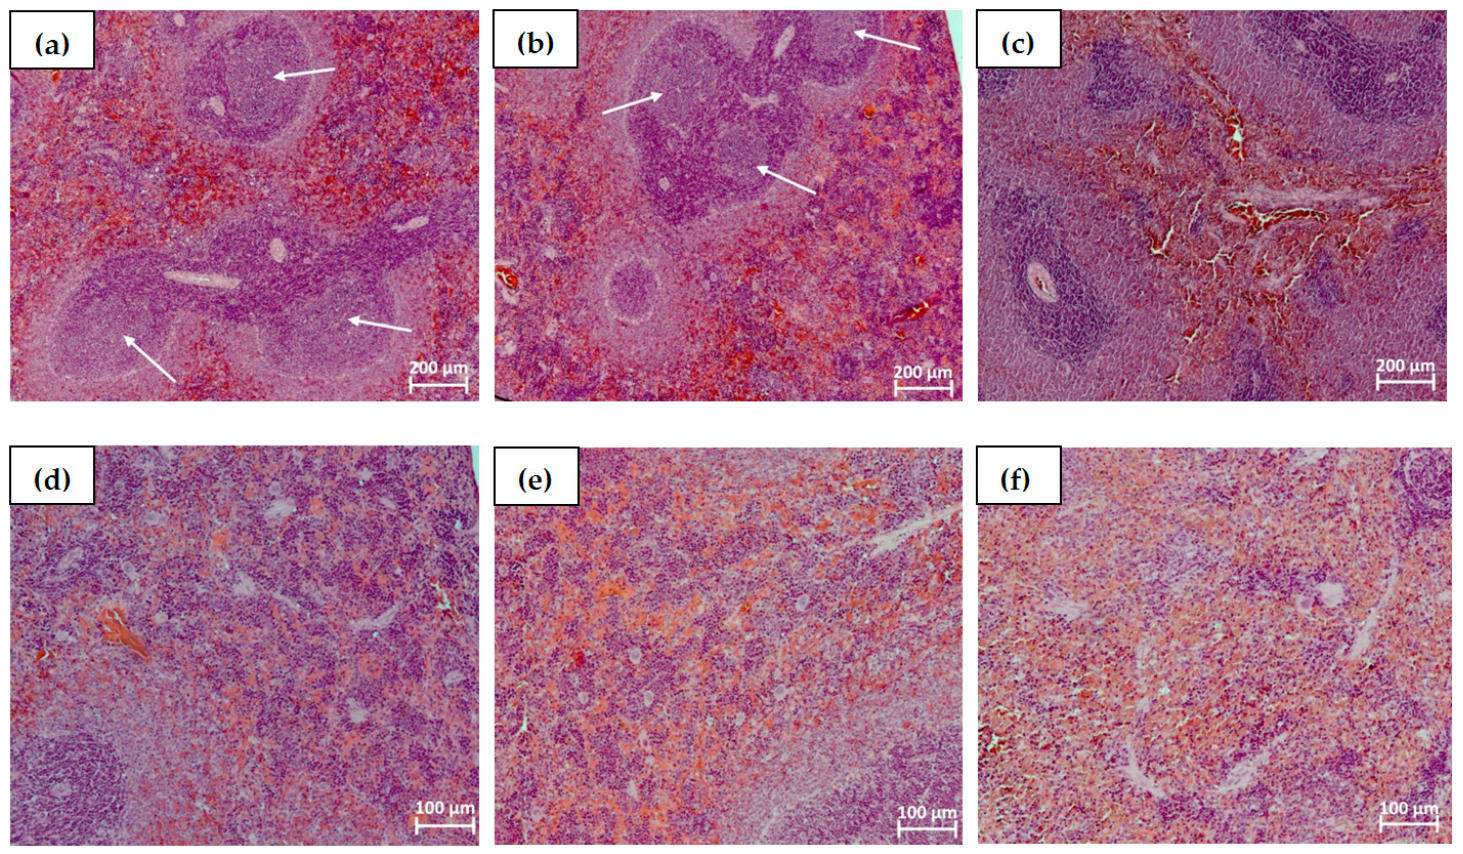
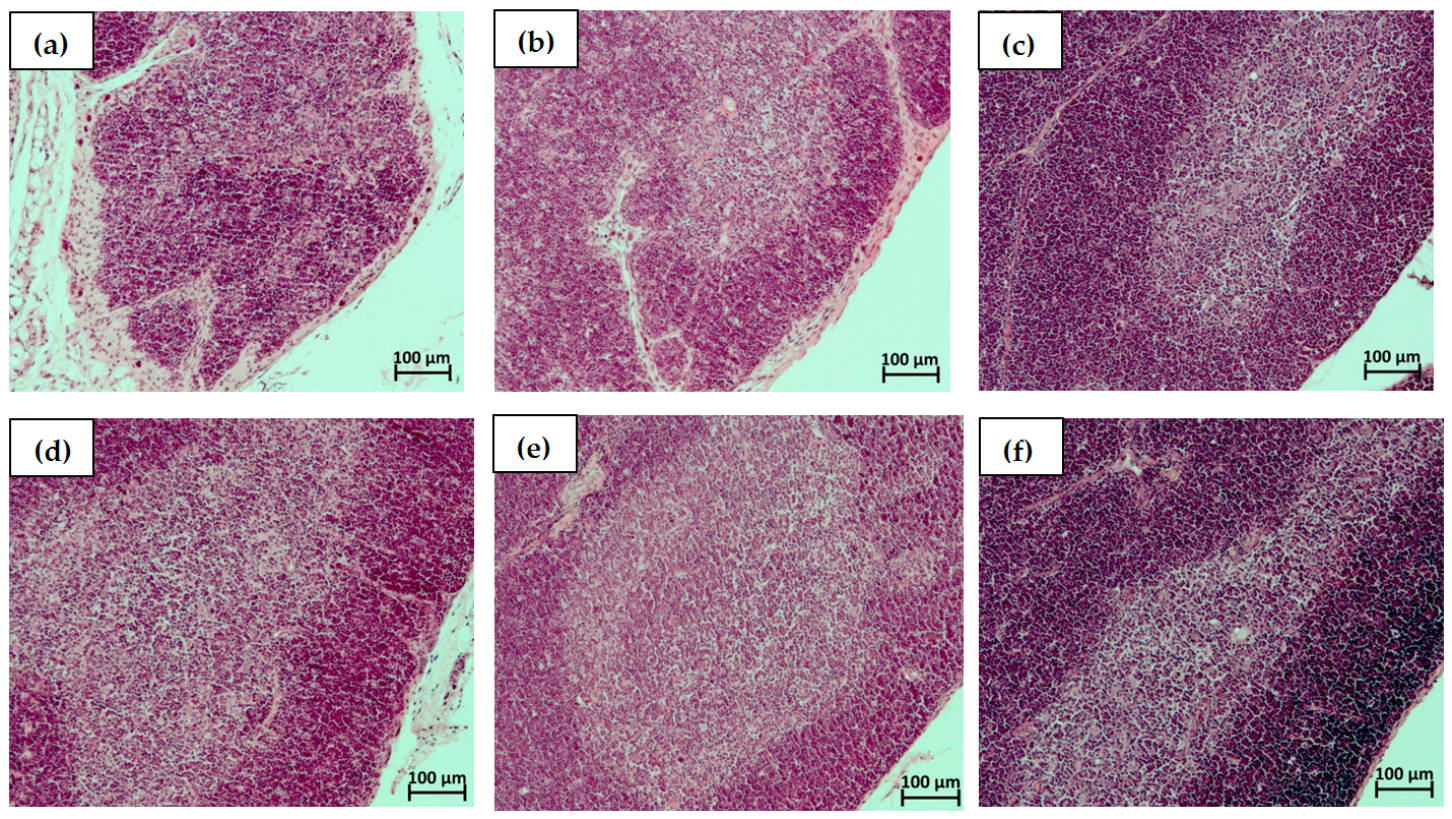
On the 8th day after HS, moderate hyperplasia of white pulp cells with presence of large germinal centers in lymphoid follicles was observed in the spleen of all animals receiving SA (Figure 8a), while an increase in extramedullary hematopoiesis was noted in the red pulp of the organ (Figure 8d). Following the administration of AB, identical histopathological changes of similar severity were observed in the spleen (Figure 8b,e). By the 29th day of the study, animals from groups receiving SA and AB showed a decrease to a moderate degree of hyperplasia of white pulp cells of the spleen, with a decrease in the size of germinal centers in lymphoid follicles, while extramedullary hematopoiesis in the red pulp decreased to normal background values.
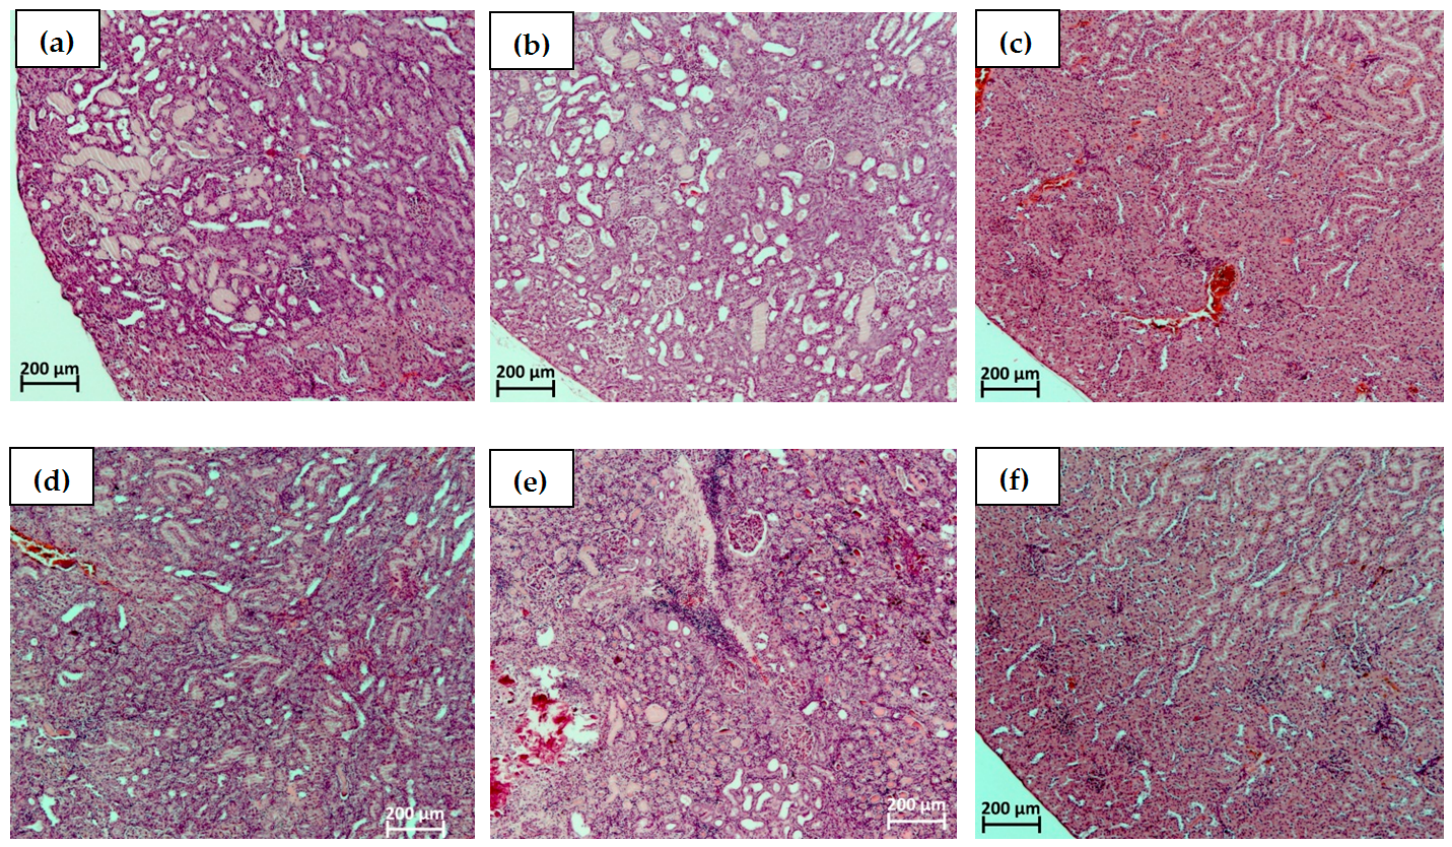
In the kidneys of half of the male rats on the 8th day after HS with SA, signs of acute organ ischemia were observed: a wedge-shaped ischemic focus with the preservation of the glomerular apparatus and necrotic changes in epithelial cells of renal tubules (Figure 9a). Identical changes were observed in the majority of animals with AB TF (Figure 9b). On the 29th day of the study, focal post-ischemic nephrosclerosis was observed in the kidneys of one of three surviving animals receiving SA (Figure 9d), while in the group of animals receiving AB, in which all five animals survived to the 29th day, a similar phenomenon was observed in two animals (Figure 9e).
Pronounced changes were observed in the thymus of animals after HS. On the 8th day, all animals administered SA showed signs of accidental involution and a marked decrease in corticomedullary ratio due to a reduction in the number of lymphoid cells of the lobular cortex. Similar changes were observed after AB administration, but they were significantly less pronounced based on a semiquantitative assessment (Figure 10a,b, Table 8). On the 29th day after HS, a slightly reduced corticomedullary ratio in the thymus of all animals in both model groups was observed (Figure 10d,e, Table 9).
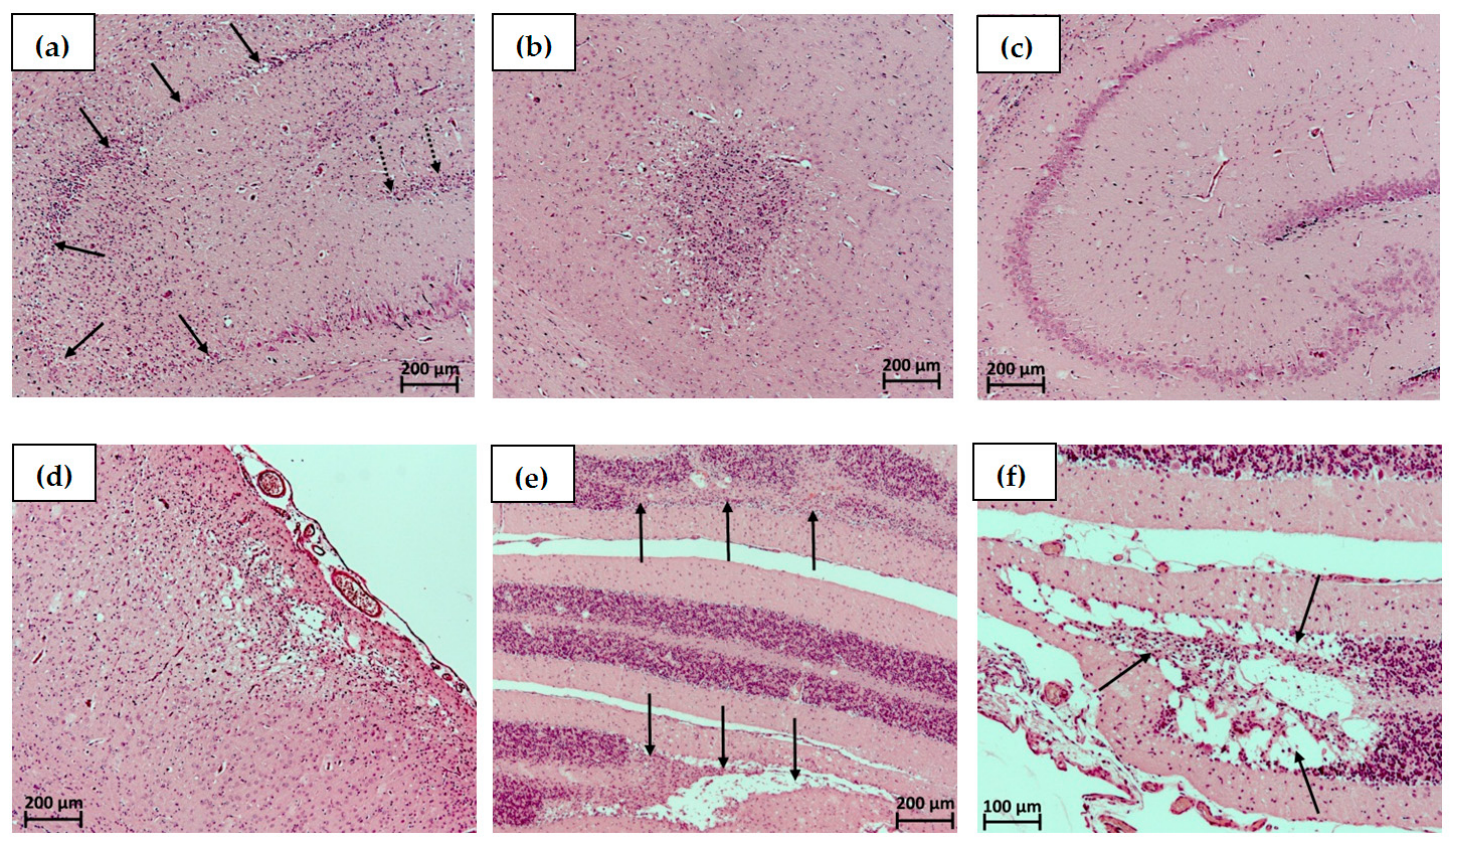
On the 8th day after HS modeling, massive neuronal loss with a glial reaction was observed in the CA1, CA2, CA3, and dentate gyrus projections of the hippocampus in individual animals treated with SA and AB (Figure 11a). In one animal treated with SA, a small focus of necrosis with a glial reaction was found in the projection of the basal ganglia (Figure 11b). On the 29th day, in one animal treated with SA (out of three surviving animals), formed gliomesodermal scars were found in the parietal cortex (Figure 11d) and cerebellar cortex (Figure 11e,f) at sites of previous ischemic necrosis of nervous tissue.
A description of histological changes with their semiquantitative scoring is given in Table 8 and Table 9.

4. Discussion

The severity of blood loss in humans is classified based on the volume of blood lost [1] as follows: hemorrhage class I (blood loss <15% of the CBV), class II (blood loss 15–30%), class III (blood loss 30–40%), class IV (blood loss ≥40%). HS develops with blood loss of classes III–IV and is characterized by critical inclusion of compensatory mechanisms, including sympathetic activation, tachycardia, inflammatory cascades, and tissue hypoperfusion, leading to an increase in lactate anion, base deficiency, persistent shock, accompanied by inflammatory activation and rapid increase in multiple organ failure [53,54,55]. In preclinical practice, HS/blood loss is most often modeled on anesthetized animals by collecting blood until blood pressure drops to a certain level (30–40 mm Hg) [38,39,56,57], which most closely correlates with intraoperative blood loss. In our study, we used a different approach, collecting a strictly defined volume of blood (40% of CBV) from awake animals. This method is, firstly, more relevant to conditions associated with traumatic blood loss and, secondly, more standardized, as a standard volume of blood is collected from the animals. In our study, the drop in pressure occurred at an early stage of the onset of blood loss and was compensated within 1 h after the onset of blood loss, accompanied by a compensatory increase in heart rate, which indicates an increase in venous return [58], baroreflex promotion, and vasoconstriction caused by sympathetic activation [59]. Modeling of HS in anesthetized rats using the fixed-pressure hemorrhage method is characterized by a drop in AP without a compensatory increase in HR [60], and even with a drop in HR [57], which is due to the suppression of the baroreflex and the sympathetic component, which plays one of the key roles in the development of the pathological process in HS [54,55]. In addition, with fixed-pressure HS, the researcher focuses on the blood pressure value, which is quite labile due to the uneven activation of compensatory mechanisms, such as the release of interstitial fluid into the bloodstream, venous return, and the ejection of blood from blood depots. To maintain a stably low AP value for 1–2 h, after reaching the target AP value (usually 40–60 mm Hg), it is necessary to constantly either withdraw or, conversely, administer different volumes of blood [38,39,60], which does not allow for the unification of the impact of blood loss on the body, leading to high variability in the consequences of HS. Thus, our method of modeling HS by collecting a fixed volume of 40% of the CBV in awake animals activates most of the compensatory mechanisms, allowing a more accurate study of the body’s reactions to HS and a better assessment of the effectiveness of therapy.
It should be noted separately that modeling of combined conditions, for example, HS plus injuries of various localizations, is only possible under anesthesia [43,44].
In our study, we showed that animals develop hypothermia in the first hour of HS, which fully correlates with the processes occurring in clinical practice during the development of the so-called death triad—hypothermia, coagulopathy and acidosis [61]. Hypothermia develops as a result of hypoperfusion and metabolic disturbance of heat generation [1]. Since enzymatic reactions occur at normothermia, a decrease in temperature leads to a disruption in the functioning of the enzymes of the coagulation system [62]. In our study, 24 h after HS, the APTT, an indicator characterizing the intrinsic pathway of coagulation activation, decreased in animals receiving SA, indicating a disruption of the intrinsic coagulation pathway. This was not observed in animals receiving AB, confirming the results of whole blood transfusion studies [31]. PT decreases in both AS-treated and AB-treated animals. PT characterizes the extrinsic pathway of coagulation activation, and its decrease indicates pathological hypercoagulation and an increased risk of thrombosis. In humans, trauma associated with massive blood loss results in coagulopathy, manifested by the same changes in coagulation parameters [63]. Post-traumatic coagulopathy is also indicated by elevated levels of Fg—coagulation factor I, which is also an acute-phase reactant. In our study, Fg levels remained elevated for 29 days after HS. The hyperfibrinemia we observed, in addition to post-traumatic coagulopathy, indicates compensatory neurohumoral processes, an enhanced immune response, and post-traumatic procoagulant readiness of the body [64,65].
In our study, we used a strategy of restrictive VRT and maintaining permissible hypotension. We selected the volume of VRT based on the results of retrospective human studies, which showed that the survival rate of patients with traumatic hemorrhage was inversely proportional to the volume of VRT. For example, a retrospective analysis of a German database of 17,200 patients with multiple trauma showed that dilutional coagulopathy developed in patients with increasing infusion volume (from 40% with an infusion volume of 2000 mL to 70% with an infusion volume of 4000 mL) [17]. Another study [23] demonstrated a dependence of survival in patients with polytrauma on volume of infusion: with an increase in the volume of infusion above 1500 mL, survival decreased. These data are confirmed by a prospective clinical study performed on patients with penetrating trauma and HS, in whom the incidence of coagulopathy increased with an increase of infusion volume [66]. Observed lymphocytosis, developing 24–48 h after HS, indicates a massive release of dormant mature lymphocytes from lymphoid depots—mesenchymal lymph nodes and the spleen—due to their activation under the influence of acute hypoxia and stress. However, the inevitable apoptosis of these immunocompetent cells causes the development of systemic inflammatory response syndrome (SIRS) and sepsis [67,68,69,70]. Granulocytosis, which develops within 3 h and persists for up to 24 h after HS, is caused by two factors: the release of GRA from blood reservoirs (liver and spleen) and the release of leukocytes from the bone marrow due to stimulation of the systemic inflammatory response both in response to shock and in response to VRT, leading to reperfusion stress with the release of reactive oxygen species and activation of the immune response [71,72,73]. 48 h after HS, inflammation persists, but is less pronounced after AB transfusion. A study by Spinella et al. showed that warm fresh whole blood transfusion is associated with improved survival for patients with combat-related traumatic injuries [31,74]. In our model, the number of RBCs fell proportionally to the volume of withdrawn blood, that is, by 40%, while in the AB group, after TF, it increased in proportion to the returned volume of whole blood. The same changes occurred with Hb content and HCT. The decline in RBC count, Hb content, and HCT persisted until day 29 after GS, indicating the development of anemia, a characteristic consequence of massive blood loss [75], The observed increase in erythrocyte anisocytosis, namely an increase in the number of large cells, accompanied by an increase in the hemoglobin content in the blood and in erythrocytes on the 8th day after HS, indicates the release of young erythrocytes from the bone marrow after the completion of the hematopoiesis cycle [76]. Although the erythroid lineage in our study was stimulated with a nearly twofold increase in the relative number of erythroid cells in the bone marrow on the 8th day after HS, the decrease of RBC and Hb content in blood persisted until the end of the study (29th day after HS). This demonstrates that anemia that developed in animals after HS persists, similar to what occurs in humans after HS, despite therapy [77,78,79].
More than twofold increase in PLT count observed in our study, with a predominance of small, young cells, on day 8 after HS, indicates the release of new PLT after the detachment of new cells from HS-activated megakaryocytes in the bone marrow and their release into the bloodstream. This phenomenon is explained by the development of SIRS under the influence of HS-activated inflammatory stimuli [80]. Thus, in patients with trauma, an increase in platelet-activating factor (PAF) and IL-8, responsible for activation of thrombopoiesis and granulopoiesis, was shown [81]. Also, budding of new PLT from megakaryocytes is activated by heme-containing molecules [82]. These PLT in turn activate monocytes (macrophage precursors) [83], which was also shown in our study on the 8th day after HS.
In humans, with HS, there is a mobilization of hematopoietic progenitor cells (HPCs) in humans, and in severe HS, the mobilization of HPCs into blood from bone marrow is associated with bone marrow dysfunction [73,84].
Our study confirms the findings of studies conducted on patients with HS. Specifically, we observed a decrease in GRA and LYM levels in the bone marrow on day 8 in animals that underwent VRT with SA. Moreover, administration of AB prevented a decrease in GRA levels, but not LYM, in the bone marrow. On day 29, the GRA count increased in animals receiving SA, and the LYM count in the bone marrow remained significantly low, while in animals receiving AB, the number of bone marrow LYM increased. Furthermore, hyperstimulation of the erythroid lineage in the bone marrow persisted until day 29 after HS in both groups, reducing the leukoerythroblastic ratio. Myelogram examination demonstrates the development of bone marrow dysfunction after HS and the protective effect of AB on the GRA count in the bone marrow. In a study performed on patients with polytrauma and HS, on the 3rd day after HS, inhibition of hematopoietic stem cell growth in the bone marrow was shown [73,85,86,87], supporting relevance of our HS modeling findings to the condition developing in humans.
Increase in pO2 in arterial blood during the first hour of HS is due to increased respiratory rate, as well as decreased RBC and Hb levels. It is known that in venous blood, pO2 decreases during blood loss due to hypoxic redistribution of blood to organs and tissues most sensitive to hypoxia (brain, heart), and increased oxygen utilization by these organs [6,88]. In our study, we demonstrated that administration of AB completely compensates for the increase in arterial pO2 as early as 3 h after HS, unlike SA. We demonstrated that pCO2 decreases during HS, and even the administration of AB does not compensate for this decrease during the first two days after HS. Arterial pCO2 corresponds to that in pulmonary alveoli and depends on oxygen transport, which decreases during development of HS due to decreased cardiac output and tissue hypoperfusion, which causes a drop in pCO2. Furthermore, compensatory hyperventilation during HS contributes to the decrease in pCO2. Similar data were obtained in studies on pigs [89,90].
In our study, an explosive fivefold increase in cGlu during HS serves as an indicator of stress and indicates the body’s response known as “stress hyperglycemia.” Glucose released into the blood due to stress-induced activation of sympathetic glycolysis is intended to provide energy to vital organs (the brain and heart) and also draw interstitial fluid into the bloodstream to compensate for the drop in AP [90,91,92]. Acute lactatemia, which develops immediately after blood loss, indicates tissue hypoperfusion and a switch to an anaerobic metabolic pathway. Lactate levels correlate with the severity of shock and subsequent mortality [93,94]. An increase in cLac is associated with a decrease in the excess of bases (cBase (Ecf)), and in the case of the group of animals receiving SA, a more pronounced decrease in this indicator may be associated with the introduction of albumin, which is a weak acid [95,96,97].
Over the course of 48 h of blood gas recording after HS, we observed a significant drop in CaO2, consistent with a drop in ctHb and RBC count. This complex of changes indicates the development of anemia as a direct consequence of blood loss [98,99,100,101,102].
Due to hypoperfusion, anemia and metabolic disorders developing in HS, changes occur in organs and tissues most sensitive to hypoxia, such as the brain and kidneys, and organs involved in hematopoiesis, such as the spleen [103]. In our study, kidney weight decreased significantly on day 8 after HS and remained unchanged until day 29 after HS. Pathological focal ischemic changes were observed in the kidneys, progressing to necrosis in half of the cases. This correlates with pathological changes seen in humans with hypovolemic shock. The kidneys are extremely susceptible to blood loss and hypoxia, as they require a large amount of energy to maintain acid-base balance [104]. In addition, HS disrupts the filtration function of the kidneys, which directly depends on perfusion pressure [105]. HS leads to hypoperfusion and hypoxia in renal tubules and glomeruli, which leads to a pathological chain of ischemia-inflammation-acute renal failure [106,107]. At the same time, the juxtaglomerular apparatus of the kidneys, under the influence of hypoxia and, as a consequence, activation of the renin-angiotensin-aldosterone system, increases production of erythropoietin, which in turn stimulates erythropoiesis in bone marrow, as well as extramedullary hematopoiesis [108,109,110], which is confirmed by results of our study.
The spleen is a secondary lymphoid organ that plays a key role in blood filtration, as well as in innate and adaptive immune responses, actively responding to blood loss and hypoxia. In our study, we observed white pulp cell hyperplasia and numerous large germinal centers in lymphoid follicles of animals on day 8 after HS, associated with an increase in organ weight and development of an inflammatory response, also confirmed by pronounced leukocytosis. In a study on rats with HS, Warren et al., 2017, a decrease in the rate of oxygen consumption and ATP production in the mitochondria of splenocytes, and the inflammatory response was demonstrated by significantly increased expression of IL-6, IFN-β, Mip-1α, IL-10, and NFκbp65, indicating an inflammatory response of splenocytes to HS [41]. On the 29th day after HS, spleen weight in animals decreased to the level of control animals, while increased extramedullary hematopoiesis was observed in the red pulp; that is, formation of erythrocytes outside the bone marrow, which is a compensatory response of the body to blood loss and subsequent persistent anemia [110,111,112,113].
The thymus is an important lymphatic organ regulating immune function; it is involved in proliferation of hematopoietic stem cells, differentiation into T-lymphocytes, and maintenance of immune function; it is an organ sensitive to hypoxia and stress [114,115,116,117,118].
In our study, thymus weight on day 8 decreased fivefold in the SA group and threefold in the AB group. This weight loss was accompanied by pronounced accidental involution, that is, severe atrophy and massive destruction of immune cells in the cortex. This process is the thymus’s response to HS, a severe stress response that results in accidental organ involution, the release of T-lymphocytes into the blood, and active thymocyte apoptosis [119,120,121]. By day 29 after HS, the organ continues to lose weight, while involutional changes persist. The initial stage of thymus involution (up to day 8 after HS) is accompanied by an increase in the number of LYM in the blood, a marker of inflammatory process development.
The brain, as the organ most sensitive to hypoxia, suffers from HS of various origins [122,123]. In our study, pathological changes affected the hippocampus—the brain structure most sensitive to global ischemia. Massive blood loss due to hypoperfusion leads to depletion of energy resources, mitochondrial dysfunction, and neuronal death [124,125]. Ischemic changes in the hippocampus of animals were isolated and were corrected by the administration of AB.
All the described changes in organs should be considered taking into account the death of 30% of animals in the group receiving SA. It should also be noted that this study was designed to characterize the HS model, and VRT was not the subject of study, but was used as part of the model to confirm its validity. The VRT strategies used demonstrated the aptitude of our model, confirming previously obtained results, including those in humans.
To ensure a more complete presentation and interpretation of the study results, several limitations of our work should be noted. For example, our study used only male animals, which is common in experimental pharmacology, although using animals of both sexes would have improved the generalizability of the model. Also, the sample size was not large, especially considering the mortality in the SA group, thus limiting the number of samples available for analysis. Furthermore, this study did not include a group of sham-operated animals; however, this limitation was somewhat offset by the inclusion of an intact animal group, which served as a standard for assessing the dynamics of changes in animals with HS.
Thus, in our study, we demonstrated that blood withdrawal at a volume of 40% of CBV and an hourly deficit followed by partial VRT represent a successful model of HS. Development of HS is confirmed by results of analysis of hemodynamic, hemostasis, and body temperature, blood gas and metabolite dynamics, clinical blood and bone marrow, and organ mass and morphology. All methods and results are described in detail in our study so that any researcher can reproduce our fixed-volume HS model for their own scientific purposes.

5. Conclusions

We developed a suitable model of HS in male SD rats, mimicking the condition that develops in humans following massive blood loss of various etiologies. This model can be easily reproduced in most preclinical laboratories and used in studies exploring therapeutic approaches to correcting HS.

Author Contributions

Conceptualization, V.A.P., methodology, A.M.I., M.S.S., V.A.P., V.A.K., E.R.S. and O.I.P.; formal analysis, E.A.T., investigation, V.A.P., A.M.I., M.S.S., A.V.K., S.G.S., G.A.S., E.R.S., I.N.K., V.A.K., E.N.K., M.S.K., A.B.T., M.V.S., V.A.R. and O.I.P.; resources, A.N.M. and I.A.D.; writing—original draft preparation, E.A.T.; writing—review and editing, E.A.T., V.A.P., A.M.I., M.S.S., A.V.K., S.G.S., G.A.S., E.R.S., I.N.K., V.A.K., E.N.K., M.S.K., A.B.T., M.V.S., V.A.R., O.I.P., I.A.D. and A.N.M.; visualization, E.A.T., A.M.I. and V.A.K.; supervision, V.A.P. and A.N.M.; project administration, V.A.P. All authors have read and agreed to the published version of the manuscript.

Funding

This research received no external funding.

Institutional Review Board Statement

All procedures and manipulations with animals were approved by the Committee for Control over Care and Use of Laboratory Animals of BIBCh RAS (IACUC) (protocol number 1053/25 from 17 October 2025) and were carried out in accordance with the EU Directive 2010/63/EU. The animal study was supported by the Scientific Infrastructure Project 075-15-2025-514/MSHE RF.

Informed Consent Statement

Not applicable.

Data Availability Statement

The original contributions presented in this study are included in the article. Further inquiries can be directed to the corresponding author.

Conflicts of Interest

The authors declare no conflicts of interest.

Abbreviations

The following abbreviations are used in this manuscript:
HShemorrhagic shock
CBVcirculating blood volume
AParterial pressure
HRheart rate
TFtransfusion
VRTvolume resuscitation therapy
ABautologous blood
ASalbumin-containing saline (NaCl 0.9% + Albumin 20% (7:1))
INTintact
SD ratSprague Dawley rat
SPFspecific pathogen free
cBase (Ecf)calculated Base, Extracellular fluid
pCO2carbon dioxide partial pressure
pO2oxygen partial pressure
ctHbtotal hemoglobin concentration
cGlutotal glucose concentration
cLactotal lactate concentration
CaO2total amount of oxygen transported in arterial blood
APTTactivated partial thromboplastin time
PTprothrombin time
Fgfibrinogen
K3EDTAtripotassium edetate
RBCred blood cell
Hbhemoglobin
HCThematocrit
WBCwhite blood cell
MCHmean corpuscular haemoglobin
MCHCmean cell haemoglobin concentration
MCVmean corpuscular volume
RDWred cell distribution width—variation coefficient
RDW-SDred cell distribution width-standard deviation
PLTplatelets
MPVmean platelet volume—variation coefficient
PCTplateletcrit
PDWplatelet distribution width—variation coefficient
LYMlymphocytes
MONmonocytes
GRAgranulocytes
PBSphosphate-buffer saline
HPCshematopoietic progenitor cells
SIRSsystemic inflammatory response syndrome
ILinterleukin
ATPadenosine triphosphate
IFNinterferon
Mipmacrophage inflammatory protein
NFnuclear factor

References

  1. Meza Monge, K.; Rosa, C.; Sublette, C.; Pratap, A.; Kovacs, E.J.; Idrovo, J.-P. Navigating Hemorrhagic Shock: Biomarkers, Therapies, and Challenges in Clinical Care. Biomedicines 2024, 12, 2864. [Google Scholar] [CrossRef] [Scilit] [PubMed]
  2. Pigneri, D.A.; Beldowicz, B.; Jurkovich, G.J. Trauma systems: Origins, evolution, and current challenges. Surg. Clin. N. Am. 2017, 97, 947–959. [Google Scholar] [PubMed]
  3. GBD 2017 Causes of Death Collaborators. Global, regional, and national age-sex-specific mortality for 282 causes of death in 195 countries and territories, 1980–2017: A systematic analysis for the Global Burden of Disease Study 2017. Lancet 2018, 392, 1736–1788. [CrossRef] [Scilit] [PubMed]
  4. Tisherman, S.A.; Schmicker, R.H.; Brasel, K.J.; Bulger, E.M.; Kerby, J.D.; Minei, J.P.; Powell, J.L.; Reiff, D.A.; Rizoli, S.B.; Schreiber, M.A. Detailed description of all deaths in both the shock and traumatic brain injury hypertonic saline trials of the Resuscitation Outcomes Consortium. Ann. Surg. 2015, 261, 586–590. [Google Scholar] [CrossRef] [Scilit] [PubMed]
  5. Latif, R.K.; Clifford, S.P.; Baker, J.A.; Lenhardt, R.; Haq, M.Z.; Huang, J.; Farah, I.; Businger, J.R. Traumatic hemorrhage and chain of survival. Scand. J. Trauma Resusc. Emerg. Med. 2023, 31, 25. [Google Scholar] [CrossRef] [Scilit] [PubMed]
  6. Cannon, J.W. Hemorrhagic Shock. N. Engl. J. Med. 2018, 378, 370–379. [Google Scholar] [CrossRef] [Scilit] [PubMed]
  7. Chaudry, I.H. Cellular mechanisms in shock and ischemia and their correction. Am. J. Physiol. 1983, 245, R117–R134. [Google Scholar] [CrossRef] [Scilit] [PubMed]
  8. Cosgriff, N.; Moore, E.E.; Sauaia, A.; KennyMoynihan, M.; Burch, J.M.; Galloway, B. Predicting life-threatening coagulopathy in the massively transfused trauma patient: Hypothermia and acidoses revisited. J. Trauma 1997, 42, 857–861. [Google Scholar] [PubMed]
  9. Iwata, S.; Tanaka, A.; Ozawa, K. Alterations in the proton ATPase activity of rat liver mitochondria after hemorrhagic shock. J. Lab. Clin. Med. 1992, 120, 420–427. [Google Scholar] [PubMed]
  10. White, N.J.; Ward, K.R.; Pati, S.; Strandenes, G.; Cap, A.P. Hemorrhagic blood failure: Oxygen debt, coagulopathy, and endothelial damage. J. Trauma Acute Care Surg. 2017, 82, S41–S49. [Google Scholar] [PubMed]
  11. Moore, H.B.; Moore, E.E.; Liras, I.N.; Gonzalez, E.; Harvin, J.A.; Holcomb, J.B.; Sauaia, A.; Cotton, B.A. Acute fibrinolysis shutdown after injury occurs frequently and increases mortality: A multicenter evaluation of 2,540 severely injured patients. J. Am. Coll. Surg. 2016, 222, 347–355. [Google Scholar] [CrossRef] [Scilit] [PubMed]
  12. Lier, H.; Krep, H.; Schroeder, S.; Stuber, F. Preconditions of hemostasis in trauma: A review. The influence of acidosis, hypocalcemia, anemia, and hypothermia on functional hemostasis in trauma. J. Trauma 2008, 65, 951–960. [Google Scholar] [CrossRef] [Scilit] [PubMed]
  13. Tompkins, R.G. Genomics of injury: The Glue Grant experience. J. Trauma Acute Care Surg. 2015, 78, 671–686. [Google Scholar] [CrossRef] [Scilit] [PubMed]
  14. Xiao, W.; Mindrinos, M.N.; Seok, J.; Cuschieri, J.; Cuenca, A.G.; Gao, H.; Hayden, D.L.; Hennessy, L.; Moore, E.E.; Minei, J.P.; et al. Inflammation, Host Response to Injury Large-Scale Collaborative Research P. A genomic storm in critically injured humans. J. Exp. Med. 2011, 208, 2581–2590. [Google Scholar] [CrossRef] [Scilit] [PubMed]
  15. Nathan, C.; Ding, A. Nonresolving inflammation. Cell 2010, 140, 871–882. [Google Scholar] [CrossRef] [Scilit] [PubMed]
  16. Hierholzer, C.; Billiar, T.R. Molecular mechanisms in the early phase of hemorrhagic shock. Langenbecks Arch. Surg. 2001, 386, 302–308. [Google Scholar] [CrossRef] [Scilit] [PubMed]
  17. Maegele, M.; Lefering, R.; Yucel, N.; Tjardes, T.; Rixen, D.; Paffrath, T.; Simanski, C.; Neugebauer, E.; Bouillon, B.; AG Polytrauma of the German Trauma Society. Early coagulopathy in multiple injury: An analysis from the German Trauma Registry on 8724 patients. Injury 2007, 38, 298–304. [Google Scholar] [CrossRef] [Scilit] [PubMed]
  18. Balvers, K.; Van der Horst, M.; Graumans, M.; Boer, C.; Binnekade, J.M.; Goslings, J.C.; Juffermans, N.P. Hypothermia as a predictor for mortality in trauma patients at admittance to the Intensive Care Unit. J. Emerg. Trauma Shock. 2016, 9, 97–102. [Google Scholar] [CrossRef] [Scilit] [PubMed]
  19. Gale, S.C.; Kocik, J.F.; Creath, R.; Crystal, J.S.; Dombrovskiy, V.Y. A comparison of initial lactate and initial base deficit as predictors of mortality after severe blunt trauma. J. Surg. Res. 2016, 205, 446–455. [Google Scholar] [CrossRef] [Scilit] [PubMed]
  20. Martin, M.; Oh, J.; Currier, H.; Tai, N.; Beekley, A.; Eckert, M.; Holcomb, J. An analysis of in-hospital deaths at a modern combat support hospital. J. Trauma. 2009, 66, S51–S60; discussion S60–S61. [Google Scholar] [CrossRef] [Scilit] [PubMed]
  21. Smith, W.; Williams, A.; Agudelo, J.; Shannon, M.; Morgan, S.; Stahel, P.; Moore, E. Early predictors of mortality in hemodynamically unstable pelvis fractures. J. Orthop. Trauma. 2007, 21, 31–37. [Google Scholar] [CrossRef] [Scilit] [PubMed]
  22. National Academies of Sciences, Engineering, and Medicine. A National Trauma Care System: Integrating Military and Civilian Trauma Systems to Achieve Zero Preventable Deaths After Injury; National Academies Press: Washington, DC, USA, 2016. [Google Scholar]
  23. Hussmann, B.; Lefering, R.; Waydhas, C.; Touma, A.; Kauther, M.D.; Ruchholtz, S.; Lendemans, S. Does increased prehospital replacement volume lead to a poor clinical course and an increased mortality? A matched-pair analysis of 1896 patients of the Trauma Registry of the German Society for Trauma Surgery who were managed by an emergency doctor at the accident site. Injury 2013, 44, 611–617. [Google Scholar] [CrossRef] [Scilit] [PubMed]
  24. Haut, E.R.; Kalish, B.T.; Cotton, B.A.; Efron, D.T.; Haider, A.H.; Stevens, K.A.; Kieninger, A.N.; Cornwell, E.E.; Chang, D.C. Prehospital intravenous fluid administration is associated with higher mortality in trauma patients: A National Trauma Data Bank analysis. Ann. Surg. 2011, 253, 371–377. [Google Scholar] [PubMed]
  25. Cannon, J.W.; Khan, M.A.; Raja, A.S.; Cohen, M.J.; Como, J.J.; Cotton, B.A.; Dubose, J.J.; Fox, E.E.; Inaba, K.; Rodriguez, C.J.; et al. Damage control resuscitation in patients with severe traumatic hemorrhage: A practice management guideline from the Eastern Association for the Surgery of Trauma. J. Trauma Acute Care Surg. 2017, 82, 605–617. [Google Scholar] [CrossRef] [Scilit] [PubMed]
  26. Yunos, N.M.; Bellomo, R.; Hegarty, C.; Story, D.; Ho, L.; Bailey, M. Association between a chloride-liberal vs chloride-restrictive intravenous fluid administration strategy and kidney injury in critically ill adults. JAMA 2012, 308, 1566–1572. [Google Scholar] [CrossRef] [Scilit] [PubMed]
  27. Chowdhury, A.H.; Cox, E.F.; Francis, S.T.; Lobo, D.N. A randomized, controlled, double-blind crossover study on the effects of 2-L infusions of 0.9% saline and plasma-lyte(R) 148 on renal blood flow velocity and renal cortical tissue perfusion in healthy volunteers. Ann. Surg. 2012, 256, 18–24, Erratum in Ann Surg. 2013, 258, 1118. [Google Scholar] [CrossRef] [Scilit] [PubMed]
  28. Young, J.B.; Utter, G.H.; Schermer, C.R.; Galante, J.M.; Phan, H.H.; Yang, Y.; Anderson, B.A.; Scherer, L.A. Saline versus Plasma-Lyte A in initial resuscitation of trauma patients: A randomized trial. Ann. Surg. 2014, 259, 255–262. [Google Scholar] [CrossRef] [Scilit] [PubMed]
  29. Holcomb, J.B.; Tilley, B.C.; Baraniuk, S.; Fox, E.E.; Wade, C.E.; Podbielski, J.M.; del Junco, D.J.; Brasel, K.J.; Bulger, E.M.; Callcut, R.A.; et al. Transfusion of plasma, platelets, and red blood cells in a 1:1:1 vs a 1:1:2 ratio and mortality in patients with severe trauma: The PROPPR randomized clinical trial. JAMA 2015, 313, 471–482. [Google Scholar] [CrossRef] [Scilit] [PubMed]
  30. Kornblith, L.Z.; Howard, B.M.; Cheung, C.K.; Dayter, Y.; Pandey, S.; Busch, M.P.; Pati, S.; Callcut, R.A.; Vilardi, R.F.; Redick, B.J.; et al. The whole is greater than the sum of its parts: Hemostatic profles of whole blood variants. J. Trauma Acute Care Surg. 2014, 77, 818–827. [Google Scholar] [CrossRef] [Scilit] [PubMed]
  31. Shea, S.M.; Staudt, A.M.; Thomas, K.A.; Schuerer, D.; Mielke, J.E.; Folkerts, D.; Lowder, E.; Martin, C.; Bochicchio, G.V.; Spinella, P.C. The use of low-titer group O whole blood is independently associated with improved survival compared to component therapy in adults with severe traumatic hemorrhage. Transfusion 2020, 60, S2–S9. [Google Scholar] [CrossRef] [Scilit] [PubMed]
  32. Costantini, T.W.; Kornblith, L.Z.; Pritts, T.; Coimbra, R. The intersection of coagulation activation and inflammation after injury What you need to know. J. Trauma Acute Care Surg. 2024, 96, 347–356. [Google Scholar] [CrossRef] [Scilit] [PubMed]
  33. Tyburski, J.G.; Collinge, J.D.; Wilson, R.F.; Carlin, A.M.; Albaran, R.G.; Stefes, C.P. End-tidal CO 2-derived values during emergency trauma surgery correlated with outcome: A prospective study. J. Trauma 2002, 53, 738–743. [Google Scholar] [CrossRef] [Scilit] [PubMed]
  34. Caputo, N.; Fraser, R.; Paliga, A.; Kanter, M.; Hosford, K.; Madlinger, R. Triage vital signs do not correlate with serum lactate or base deficit, and are less predictive of operative intervention in penetrating trauma patients: A prospective cohort study. Emerg. Med. J. 2013, 30, 546–550. [Google Scholar] [CrossRef] [Scilit] [PubMed]
  35. Herbert, H.K.; Dechert, T.A.; Wolfe, L.; Aboutanos, M.B.; Malhotra, A.K.; Ivatury, R.R.; Duane, T.M. Lactate in trauma: A poor predictor of mortality in the setting of alcohol ingestion. Am. Surg. 2011, 77, 1576–1579. [Google Scholar] [CrossRef] [Scilit]
  36. Mutschler, M.; Nienaber, U.; Brockamp, T.; Wafaisade, A.; Fabian, T.; Paffrath, T.; Bouillon, B.; Maegele, M. Renaissance of base deficit for the initial assessment of trauma patients: A base deficitbased classification for hypovolemic shock developed on data from 16,305 patients derived from the TraumaRegister DGU(R). Crit. Care 2013, 17, R42. [Google Scholar] [CrossRef] [Scilit] [PubMed]
  37. Johansson, P.I.; Stensballe, J. Effect of haemostatic control resuscitation on mortality in massively bleeding patients: A before and after study. Vox Sang. 2009, 96, 111–118. [Google Scholar] [CrossRef] [Scilit] [PubMed]
  38. Luo, X.; Chen, G.; You, G.; Wang, B.; Lu, M.; Zhao, J.; Wang, Y.; Yin, Y.; Zhao, L.; Zhou, H. Gradually increased oxygen administration promoted survival after hemorrhagic shock. Exp. Biol. Med. 2016, 241, 1603–1610. [Google Scholar] [CrossRef] [Scilit] [PubMed]
  39. Hof, S.; Krüll, L.; Stepanyan, L.; Jeikowski, D.; Marcus, C.; Kuebart, A.; Relja, B.; Herminghaus, A.; Vollmer, C.; Bauer, I.; et al. Remote ischemic preconditioning improves ileal microvascular oxygenation during rodent hemorrhagic shock without improving variables of microcirculation and mitochondrial respiration. Sci. Rep. 2025, 15, 43230. [Google Scholar] [CrossRef] [Scilit] [PubMed]
  40. Bonanno, F.G. Management of hemorrhagic shock: Physiology approach, timing and strategies. J. Clin. Med. 2022, 12, 260. [Google Scholar] [CrossRef] [Scilit] [PubMed]
  41. Warren, M.; Subramani, K.; Schwartz, R.; Raju, R. Mitochondrial dysfunction in rat splenocytes following hemorrhagic shock. Biochim. Biophys. Acta Mol. Basis Dis. 2017, 1863, 2526–2533. [Google Scholar] [CrossRef] [Scilit] [PubMed]
  42. Denk, S.; Weckbach, S.; Eisele, P.; Braun, C.K.; Wiegner, R.; Ohmann, J.J.; Wrba, L.; Hoenes, F.M.; Kellermann, P.; Radermacher, P.; et al. Role of hemorrhagic shock in experimental polytrauma. Shock 2018, 49, 154–163. [Google Scholar] [CrossRef] [Scilit] [PubMed]
  43. Wu, X.; Dubick, M.A.; Schwacha, M.G.; Cap, A.P.; Darlington, D.N. Tranexamic acid attenuates the loss of lung barrier function in a rat model of polytrauma and hemorrhage with resuscitation. Shock 2017, 47, 500–505. [Google Scholar] [CrossRef] [Scilit] [PubMed]
  44. Chen, J.; Wu, X.; Keesee, J.; Liu, B.; Darlington, D.N.; Cap, A.P. Limited resuscitation with fresh or stored whole blood corrects cardio-vascular and metabolic function in a rat model of polytrauma and hemorrhage. Shock 2017, 47, 208–216. [Google Scholar] [CrossRef] [Scilit] [PubMed]
  45. Wichmann, M.W.; Ayala, A.; Chaudry, I.H. Severe depression of host immune functions following closed- bone fracture, soft-tissue trauma, and hemorrhagic shock. Crit. Care Med. 1998, 26, 1372–1378. [Google Scholar] [CrossRef] [Scilit] [PubMed]
  46. GV-SOLAS, Committee for Animal Welfare Officers, and TVT, Blood Sampling in Laboratory Animals, July 2017. Available online: https://www.gv-solas.de/wp-content/uploads/2017/03/tie_blutentnahme17_e.pdf (accessed on 4 May 2026).
  47. Guidelines for Survival Bleeding of Mice and Rats. NIH-ARAC Guidelines [Online]. 12 January 2005. Available online: http://oacu.od.nih.gov/ARAC/Bleeding.pdf (accessed on 4 May 2026).
  48. Roberts, I.; Blackhall, K.; Alderson, P.; Bunn, F.; Schierhout, G.; Cochrane Injuries Group. Human albumin solution for resuscitation and volume expansion in critically ill patients. Cochrane Database Syst. Rev. 2000, 2, CD001208. [Google Scholar]
  49. Wettstein, R.; Wilkins, R. Interpretation of blood gases. In Clinical Assessment in Respiratory Care, 6th ed.; Mosby: St. Louis, MO, USA, 2010. [Google Scholar]
  50. Gutierrez, G.; Reines, H.D.; Wulf-Gutierrez, M.E. Clinical review: Hemorrhagic shock. Crit. Care 2004, 8, 373–381. [Google Scholar] [CrossRef] [Scilit] [PubMed]
  51. Mallat, J.; Vallet, B. Ratio of venous-to-arterial PCO2 to arteriovenous oxygen content difference during regional ischemic or hypoxic hypoxia. Sci. Rep. 2021, 11, 10172. [Google Scholar] [CrossRef] [Scilit] [PubMed]
  52. Piaton, E.; Fabre, M.; Goubin-Versini, I.; Bretz-Grenier, M.-F.; Courtade-Saïdi, M.; Vincent, S.; Belleannée, G.; Thivolet, F.; Boutonnat, J.; Debaque, H.; et al. Guidelines for May-Grünwald–Giemsa staining in haematology and non-gynaecological cytopathology: Recommendations of the French Society of Clinical Cytology (SFCC) and of the French Association for Quality Assurance in Anatomic and Cytologic Pathology (AFAQAP). Cytopathology 2016, 27, 359–368. [Google Scholar] [CrossRef] [Scilit] [PubMed]
  53. Gallimore, E. Clinical features and management of haemorrhagic shock. Nurs. Stand. 2015, 30, 51–60. [Google Scholar] [CrossRef] [Scilit] [PubMed]
  54. Copotoiu, R.; Cinca, E.; Collange, O.; Levy, F.; Mertes, P.-M. Pathophysiology of hemorragic shock. Transfus. Clin. Biol. 2016, 23, 222–228. [Google Scholar] [PubMed]
  55. Gann, D.S.; Drucker, W.R. Hemorrhagic shock. J. Trauma Acute Care Surg. 2013, 75, 888–895. [Google Scholar] [CrossRef] [Scilit] [PubMed]
  56. Li, T.; Zhu, Y.; Tian, K.; Xue, M.; Peng, X.; Lan, D.; Liu, L. Ideal resuscitation pressure for uncontrolled hemorrhagic shock in different ages and sexes of rats. Crit. Care 2013, 17, R194. [Google Scholar] [CrossRef] [Scilit] [PubMed]
  57. Wanot, B.; Jasikowska, K.; Niewiadomska, E.; Biskupek-Wanot, A. Cardiovascular effects of H3 histamine receptor inverse agonist/H4 histamine receptor agonist, clobenpropit, in hemorrhage-shocked rats. PLoS ONE 2018, 13, e0201519. [Google Scholar] [CrossRef] [Scilit] [PubMed]
  58. Shen, T.; Baker, K. Venous return and clinical hemodynamics: How the body works during acute hemorrhage. Adv. Physiol. Educ. 2015, 39, 267–271. [Google Scholar] [CrossRef] [Scilit] [PubMed]
  59. Fage, N.; Asfar, P.; Radermacher, P.; Demiselle, J. Norepinephrine and Vasopressin in Hemorrhagic Shock: A Focus on Renal Hemodynamics. Int. J. Mol. Sci. 2023, 24, 4103. [Google Scholar] [CrossRef] [Scilit] [PubMed]
  60. Khazaei, M.; Barmaki, B. Role of exogenous nitric oxide donor in treatment of decompensated hemorrhagic shock in normotensive and hypertensive rats. J. BioMed Biotechnol. 2012, 2012, 365195. [Google Scholar] [CrossRef] [Scilit] [PubMed]
  61. van Veelen, M.J.; Brodmann Maeder, M. Hypothermia in Trauma. Int. J. Environ. Res. Public Health 2021, 18, 8719. [Google Scholar] [CrossRef] [Scilit] [PubMed]
  62. Kutcher, M.E.; Howard, B.M.; Sperry, J.L.; Hubbard, A.E.; Decker, A.L.; Cuschieri, J.; Minei, J.P.; Moore, E.E.; Brownstein, B.H.; Maier, R.V.; et al. Evolving beyond the vicious triad: Differential mediation of traumatic coagulopathy by injury, shock, and resuscitation. J. Trauma Acute Care Surg. 2015, 78, 516–523. [Google Scholar] [PubMed]
  63. Nardi, G.; Agostini, V.; Rondinelli, B.; Russo, E.; Bastianini, B.; Bini, G.; Bulgarelli, S.; Cingolani, E.; Donato, A.; Gambale, G.; et al. Traumainduced coagulopathy: Impact of the early coagulation support protocol on blood product consumption, mortality and costs. Crit. Care 2015, 19, 83. [Google Scholar] [CrossRef] [Scilit] [PubMed]
  64. Paydar, S.; Dalfardi, B.; Shayan, Z.; Shayan, L.; Saem, J.; Bolandparvaz, S. Early Predictive Factors of Hypofibrinogenemia in Acute Trauma Patients. J. Emerg. Trauma Shock 2018, 11, 38–41. [Google Scholar] [CrossRef] [Scilit] [PubMed]
  65. Pierce, A.; Pittet, J.F. Inflammatory response to trauma: Implications for coagulation and resuscitation. Curr. Opin. Anaesthesiol. 2014, 27, 246–252. [Google Scholar] [CrossRef] [Scilit] [PubMed]
  66. Morrison, C.A.; Carrick, M.M.; Norman, M.A.; Scott, B.G.; Welsh, F.J.; Tsai, P.; Liscum, K.R.; Wall, M.J.; Mattox, K.L. Hypotensive resuscitation strategy reduces transfusion requirements and severe postoperative coagulopathy in trauma patients with hemorrhagic shock: Preliminary results of a randomized controlled trial. J. Trauma 2011, 70, 652–663. [Google Scholar] [CrossRef] [Scilit] [PubMed]
  67. Bommhardt, U.; Chang, K.C.; Swanson, P.E.; Wagner, T.H.; Tinsley, K.W.; Karl, I.E.; Hotchkiss, R.S. Akt decreases lymphocyte apoptosis and improves survival in sepsis. J. Immunol. 2004, 172, 583–591. [Google Scholar] [CrossRef] [Scilit] [PubMed]
  68. Giamarellos-Bourboulis, E.; Routsi, C.; Plachouras, D.; Markaki, V.; Raftogiannis, M.; Zervakis, D.; Koussoulas, V.; Orfanos, S.; Kotanidou, A.; Armaganidis, A.; et al. Early apoptosis of blood monocytes in the septic host: Is it a mechanism of protection in the event of septic shock? Crit. Care 2006, 10, 76. [Google Scholar] [CrossRef] [Scilit] [PubMed]
  69. Hotchkiss, R.; Tinsley, K.; Karl, I. Role of apoptotic cell death in sepsis. Scand. J. Infect. Dis. 2003, 35, 585–592. [Google Scholar] [CrossRef] [Scilit] [PubMed]
  70. Papathanassoglou, E.; Moynihan, J.; Ackerman, M. Does programmed cell death (apoptosis) play role in the development of multiple organ dysfunction in critically ill patients? A review and a theoretical framework. Crit. Care Med. 2000, 28, 537–549. [Google Scholar] [CrossRef] [Scilit] [PubMed]
  71. Zhang, Q.; Raoof, M.; Chen, Y.; Sumi, Y.; Sursal, T.; Junger, W.; Brohi, K.; Itagaki, K.; Hauser, C.J. Circulating mitochondrial DAMPs cause inflammatory responses to injury. Nature 2010, 464, 104–107. [Google Scholar] [CrossRef] [Scilit] [PubMed]
  72. Bhoi, S.; Tiwari, S.; Kumar, M. Estrogen: Is it a new therapeutic paradigm for trauma hemorrhagic shock? Int. J. Crit. Illn. Inj. Sci. 2016, 6, 53. [Google Scholar] [CrossRef] [Scilit] [PubMed]
  73. Kumar, M.; Bhoi, S. Impaired hematopoietic progenitor cells in trauma hemorrhagic shock. J. Clin. Orthop. Trauma 2016, 7, 282–285. [Google Scholar] [CrossRef] [Scilit] [PubMed]
  74. Spinella, P.C.; Perkins, J.G.; Grathwohl, K.W.; Beekley, A.C.; Holcomb, J.B. Warm fresh whole blood is independently associated with improved survival for patients with combat-related traumatic injuries. J. Trauma 2009, 66, S69–S76. [Google Scholar] [CrossRef] [Scilit] [PubMed]
  75. Shapiro, M.J.; Gettinger, A.; Corwin, H.L.; Napolitano, L.; Levy, M.; Abraham, E.; Fink, M.P.; MacIntyre, N.; Pearl, R.G.; Shabot, M.M. Anemia and blood transfusion in trauma patients admitted to the intensive care unit. J. Trauma 2003, 55, 269–273; discussion 273–274. [Google Scholar] [CrossRef] [Scilit] [PubMed]
  76. Kelly, L.S.; Munley, J.A.; Pons, E.E.; Kannan, K.B.; Apple, C.G.; Thompson, C.W.; Efron, P.A.; Mohr, A.M. Mechanisms of improved erythroid progenitor growth with removal of chronic stress after trauma. Surgery 2022, 172, 759–765. [Google Scholar] [CrossRef] [Scilit] [PubMed]
  77. Athar, M.K.; Puri, N.; Gerber, D.R. Anemia and blood transfusions in critically ill patients. J. Blood Transfus. 2012, 2012, 629204. [Google Scholar] [CrossRef] [Scilit] [PubMed]
  78. Bateman, A.P.; McArdle, F.; Walsh, T.S. Time course of anemia during six months follow up following intensive care discharge and factors associated with impaired recovery of erythropoiesis. Crit. Care Med. 2009, 37, 1906–1912. [Google Scholar] [CrossRef] [Scilit] [PubMed]
  79. Gillies, G.S.; Munley, J.A.; Kelly, L.S.; Pons, E.E.; Kannan, K.B.; Bible, L.E.; Efron, P.A.; Mohr, A.M. Anemia Recovery After Lung Contusion, Hemorrhagic Shock, and Chronic Stress Is Gender-Specific in a Rat Model. Surg. Infect. 2023, 24, 773–781. [Google Scholar] [CrossRef] [Scilit] [PubMed]
  80. Pillay, J.; Hietbrink, F.; Koenderman, L.; Leenen, L.P.H. The Systemic Inflammatory Response Induced by Trauma is Reflected by Multiple Phenotypes of Blood Neutrophils. Injury 2007, 38, 1365–1372. [Google Scholar] [CrossRef] [Scilit] [PubMed]
  81. Botha, A.J.; Moore, F.A.; Moore, E.E.; Peterson, V.M.; Silliman, C.C.; Goode, A.W. Sequential Systemic Platelet-Activating Factor and Interleukin 8 Primes Neutrophils in Patients With Trauma at Risk of Multiple Organ Failure. Br. J. Surg. 1996, 83, 1407–1412. [Google Scholar] [CrossRef] [Scilit] [PubMed]
  82. Okubo, K.; Kurosawa, M.; Kamiya, M.; Urano, Y.; Suzuki, A.; Yamamoto, K.; Hase, K.; Homma, K.; Sasaki, J.; Miyauchi, H.; et al. Macrophage Extracellular Trap Formation Promoted by Platelet Activation is a Key Mediator of Rhabdomyolysis-Induced Acute Kidney Injury. Nat. Med. 2018, 24, 232–238. [Google Scholar] [CrossRef] [Scilit] [PubMed]
  83. Lee, S.; Huen, S.; Nishio, H.; Nishio, S.; Lee, H.K.; Choi, B.-S.; Ruhrberg, C.; Cantley, L.G. Distinct Macrophage Phenotypes Contribute to Kidney Injury and Repair. J. Am. Soc. Nephrol. 2011, 22, 317–326. [Google Scholar] [CrossRef] [Scilit] [PubMed]
  84. Malone, D.L.; Dunne, J.; Tracy, J.K.; Putnam, A.T.; Scalea, T.M.; Napolitano, L.M. Blood transfusion, independent of shock severity, is associated with worse outcome in trauma. J. Trauma 2003, 54, 898–905. [Google Scholar] [CrossRef] [Scilit] [PubMed]
  85. Kumar, M.; Bhoi, S.; Mohanty, S.; Kamal, V.K.; Rao, D.N.; Mishra, P.; Galwankar, S. Bone marrow hematopoietic stem cells behavior with or without growth factors in trauma hemorrhagic shock. Int. J. Crit. Illn. Inj. Sci. 2016, 6, 119–126. [Google Scholar] [CrossRef] [Scilit] [PubMed]
  86. Francis, W.R.; Ireland, R.E.; Spear, A.M.; Jenner, D.; Watts, S.A.; Kirkman, E.; Pallister, I. Flow Cytometric Analysis of Hematopoietic Populations in Rat Bone Marrow. Impact of Trauma and Hemorrhagic Shock. Cytom. A 2019, 95, 1167–1177. [Google Scholar] [CrossRef] [Scilit] [PubMed]
  87. Darden, D.B.; Mira, J.C.; Lopez, M.C.; Stortz, J.A.; Fenner, B.P.; Kelly, L.S.; Nacionales, D.C.; Budharaju, A.; Loftus, T.J.; Baker, H.V.; et al. Identification of unique microRNA expression patterns in bone marrow hematopoietic stem and progenitor cells after hemorrhagic shock and multiple injuries in young and old adult mice. J. Trauma Acute Care Surg. 2021, 91, 692–699. [Google Scholar] [CrossRef] [Scilit] [PubMed]
  88. Schlichtig, R.; Kramer, D.J.; Pinsky, M.R. Flow distribution during progressive hemorrhage isa determinat of critical O2 delivery. J. Appl. Physiol. 1991, 70, 169–178. [Google Scholar] [PubMed]
  89. Oropello, J.M.; Manasia, A.; Hannon, E.; Leibowitz, A.; Benjamin, E. Continuous Fiberoptic Arterial and Venous Blood Gas Monitoring in Hemorrhagic Shock. Chest 1996, 109, 1049–1055. [Google Scholar] [CrossRef] [Scilit] [PubMed]
  90. Williams, K.B.; Christmas, A.B.; Heniford, B.T.; Sing, R.F.; Messick, J. Arterial vs venous blood gas differences during hemorrhagic shock. World J. Crit. Care Med. 2014, 3, 55–60. [Google Scholar] [CrossRef] [Scilit] [PubMed]
  91. Schadt, J.C.; Ludbrook, J. Hemodynamic and neurohumoral responses to acute hypovolemia in conscious mammals. Am. J. Physiol. Circ. Physiol. 1991, 260, H305–H318. [Google Scholar] [CrossRef] [Scilit] [PubMed]
  92. Treml, B.; Kleinsasser, A.; Knotzer, J.; Breitkopf, R.; Velik-Salchner, C.; Rajsic, S. Hemorrhagic Shock: Blood Marker Sequencing and Pulmonary Gas Exchange. Diagnostics 2023, 13, 639. [Google Scholar] [CrossRef] [Scilit] [PubMed]
  93. Lopes, L.R.; Curi, R.; Lopes, O.U. Blood glucose and lactate levels during hemorrhagic shock reversion by hypertonic NaCl solution. Braz. J. Med. Biol. Res. 1994, 27, 1255–1267. [Google Scholar] [PubMed]
  94. Canton, S.P.; Lutfi, W.; Daley, B.J.; Miller, R.S.; Harbrecht, B.G.; Claridge, J.A.; Phelan, H.A.; Guyette, F.X.; Sperry, J.L.; Brown, J.B. Lactate as a mediator of prehospital plasma mortality reduction in hemorrhagic shock. J. Trauma Acute Care Surg. 2021, 91, 186–191. [Google Scholar] [CrossRef] [Scilit] [PubMed]
  95. Kincaid, E.H.; Miller, P.R.; Meredith, W.J.; Rahman, N.; Chang, M.C. Elevated Arterial Base Deficit in Trauma Patients: A Marker of Impaired Oxygen Utilization. J. Am. Coll. Surg. 1998, 187, 384–392. [Google Scholar] [CrossRef] [Scilit] [PubMed]
  96. Berend, K. Diagnostic use of base excess in acid-base disorders. N. Engl. J. Med. 2018, 378, 1419–1428. [Google Scholar] [CrossRef] [Scilit] [PubMed]
  97. Heldeweg, M.L.A.; Langer, T.; Duška, F. Guiding resuscitation in shock: Base excess or lactate? Crit. Care 2024, 28, 249. [Google Scholar] [CrossRef] [Scilit] [PubMed]
  98. Kietaibl, S.; Ahmed, A.; Afshari, A.; Albaladejo, P.; Aldecoa, C.; Barauskas, G.; De Robertis, E.; Faraoni, D.; Filipescu, D.C.; Fries, D.; et al. Management of severe perioperative bleeding: Guidelines from the European Society of Anaesthesiology and Intensive Care: Second update 2022. Eur. J. Anaesthesiol. 2023, 40, 226–304. [Google Scholar] [CrossRef] [Scilit] [PubMed]
  99. Bisbe, E.; Munoz, M. Management of preoperative anemia: The NATA consensus statements. ISBT Sci. Ser. 2012, 7, 5. [Google Scholar] [CrossRef] [Scilit]
  100. Bruce, W.; Campbell, D.; Daly, D.; Isbister, J. Practical recommendations for patient blood management and the reduction of perioperative transfusion in joint replacement surgery. ANZ J. Surg. 2013, 83, 222–229. [Google Scholar] [CrossRef] [Scilit] [PubMed]
  101. Lin, D.M.; Lin, E.S.; Tran, M.H. Efficacy and safety of erythropoietin and intravenous iron in perioperative blood management: A systematic review. Transfus. Med. Rev. 2013, 27, 221–234. [Google Scholar] [CrossRef] [Scilit] [PubMed]
  102. Chapman, M. Hemorrhagic shock: A review. Crit. Care 2004, 8, 396. [Google Scholar] [CrossRef] [Scilit] [PubMed][Green Version]
  103. Owattanapanich, N.; Chittawatanarat, K.; Benyakorn, T.; Sirikun, J. Risks and benefits of hypotensive resuscitation in patients with traumatic hemorrhagic shock: A meta-analysis. Scand. J. Trauma Resusc. Emerg. Med. 2018, 26, 107. [Google Scholar] [CrossRef] [Scilit] [PubMed]
  104. Freedman, B.S. Physiology assays in human kidney organoids. Am. J. Physiol. Ren. Physiol. 2022, 322, F625–F638. [Google Scholar] [CrossRef] [Scilit] [PubMed]
  105. Maleki, M.; Nematbakhsh, M. Renal blood flow response to angiotensin 1–7 versus hypertonic sodium chloride 7.5% administration after acute hemorrhagic shock in rats. Int. J. Vasc. Med. 2016, 2016, 6562017. [Google Scholar] [CrossRef] [Scilit] [PubMed]
  106. Yang, X.; Li, J.; Liang, F.; Qu, J.; Dong, X.; Liu, J. Mechanism of secondary renal injury in traumatic hemorrhagic shock model under a dry and heat desert environment. Sci. Rep. 2025, 15, 14833. [Google Scholar] [CrossRef] [Scilit] [PubMed]
  107. Dutton, R.P. Current concepts in hemorrhagic shock. Anesthesiol. Clin. 2007, 25, 23–34. [Google Scholar] [CrossRef] [Scilit] [PubMed]
  108. Millot, S.; Andrieu, V.; Letteron, P.; Lyoumi, S.; Hurtado-Nedelec, M.; Karim, Z.; Thibaudeau, O.; Bennada, S.; Charrier, J.L.; Lasocki, S.; et al. Erythropoietin stimulates spleen BMP4-dependent stress erythropoiesis and partially corrects anemia in a mouse model of generalized inflammation. Blood 2010, 116, 6072–6081. [Google Scholar] [CrossRef] [Scilit] [PubMed]
  109. Porayette, P.; Paulson, R.F. BMP4/Smad5 dependent stress erythropoiesis is required for the expansion of erythroid progenitors during fetal development. Dev. Biol. 2008, 317, 24–35. [Google Scholar] [CrossRef] [Scilit] [PubMed]
  110. Alamo, I.G.; Kannan, K.B.; Loftus, T.J.; Ramos, H.; Efron, P.A.; Mohr, A.M. Severe trauma and chronic stress activates extramedullary erythropoiesis. J. Trauma Acute Care Surg. 2017, 83, 144–150. [Google Scholar] [CrossRef] [Scilit] [PubMed]
  111. Bennett, M.; Pinkerton, P.H.; Cudkowicz, G.; Bannerman, R.M. Hemopoietic progenitor cells in marrow and spleen of mice with hereditary iron deficiency anemia. Blood 1968, 32, 908–921. [Google Scholar] [CrossRef] [Scilit]
  112. Paulson, R.F.; Shi, L.; Wu, D.C. Stress erythropoiesis: New signals and new stress progenitor cells. Curr. Opin. Hematol. 2011, 18, 139–145. [Google Scholar] [CrossRef] [Scilit] [PubMed]
  113. Hiraiwa, H.; Yura, Y.; Okumura, T.; Murohara, T. Interplay of the heart, spleen, and bone marrow in heart failure: The role of splenic extramedullary hematopoiesis. Heart Fail. Rev. 2024, 29, 1049–1063. [Google Scholar] [CrossRef] [Scilit] [PubMed]
  114. Yin, Y.; Li, Y.; Mariuzza, R.A. Structural basis for selfrecognition by autoimmune T-cell receptors. Immunol. Rev. 2012, 250, 32–48. [Google Scholar] [CrossRef] [Scilit] [PubMed]
  115. Geenen, V. The appearance of the thymus and the integrated evolution of adaptive immune and neuroendocrine systems. Acta Clin. Belg. 2012, 67, 209–213. [Google Scholar] [PubMed]
  116. Geenen, V. Presentation of neuroendocrine self in the thymus: A necessity for integrated evolution of the immune and neuroendocrine systems. Ann. N. Y. Acad. Sci. 2012, 1261, 42–48. [Google Scholar] [CrossRef] [Scilit] [PubMed]
  117. Angele, M.K.; Xu, Y.X.; Ayala, A.; Schwacha, M.G.; Catania, R.K.; Cioffi, W.G.; Bland, K.I.; Chaudry, I.H. Gender dimorphism in trauma-hemorrhage-induced thymocyte apoptosis. Shock 1999, 12, 316–322. [Google Scholar] [CrossRef] [Scilit] [PubMed]
  118. Liu, H.; Zhao, Z.G.; Xing, L.Q.; Zhang, L.M.; Niu, C.Y. Post-shock Mesenteric Lymph Drainage Ameliorates Cellular Immune Function in Rats Following Hemorrhagic Shock. Inflammation 2014, 38, 584–594. [Google Scholar] [CrossRef] [Scilit] [PubMed]
  119. Kotyolkina, A.A.; Merkulova, L.M.; Kostrova, O.; Struchko, G. The morphology of the accidental involution of the thymus at the experimental cancerogenesis. Morfol. Vedom. Newsl. 2019, 27, 30–35. [Google Scholar] [CrossRef] [Scilit]
  120. Munley, J.A.; Kelly, L.S.; Gillies, G.S.; Pons, E.E.; Kannan, K.B.; Whitley, E.M.; Bible, L.E.; Efron, P.A.; Mohr, A.M. Multicompartmental Trauma Induces Persistent Inflammation and Organ Injury. J. Surg. Res. 2024, 293, 266–273. [Google Scholar] [CrossRef] [Scilit] [PubMed]
  121. Tiesi, G.; Reino, D.; Mason, L.; Palange, D.; Tomaio, J.N.; Deitch, E.A. Early trauma-hemorrhage-induced splenic and thymic apoptosis is gut-mediated and toll-like receptor 4-dependent. Shock 2013, 39, 507–513. [Google Scholar] [CrossRef] [Scilit] [PubMed]
  122. Klacanova, K.; Kovalska, M.; Chomova, M.; Pilchova, I.; Tatarkova, Z.; Kaplan, P.; Racay, P. Global brain ischemia in rats is associated with mitochondrial release and downregulation of Mfn2 in the cerebral cortex, but not the hippocampus. Int. J. Mol. Med. 2019, 43, 2420–2428. [Google Scholar] [CrossRef] [Scilit] [PubMed]
  123. Kovalska, M.; Hnilicova, P.; Kalenska, D.; Tomascova, A.; Adamkov, M.; Lehotsky, J. Effect of Methionine Diet on Time-Related Metabolic and Histopathological Changes of Rat Hippocampus in the Model of Global Brain Ischemia. Biomolecules 2020, 10, 1128. [Google Scholar] [CrossRef] [Scilit] [PubMed]
  124. Kumar, R.; Bukowski, M.J.; Wider, J.M.; Reynolds, C.A.; Calo, L.; Lepore, B.; Tousignant, R.; Jones, M.; Przyklenk, K.; Sanderson, T.H. Mitochondrial dynamics following global cerebral ischemia. Mol. Cell Neurosci. 2016, 76, 68–75. [Google Scholar] [CrossRef] [Scilit] [PubMed]
  125. Niizuma, K.; Yoshioka, H.; Chen, H.; Kim, G.S.; Jung, J.E.; Katsu, M.; Okami, N.; Chan, P.H. Mitochondrial and apoptotic neuronal death signaling pathways in cerebral ischemia. Biochim. Biophys. Acta 2010, 1802, 92–99. [Google Scholar] [CrossRef] [Scilit] [PubMed]
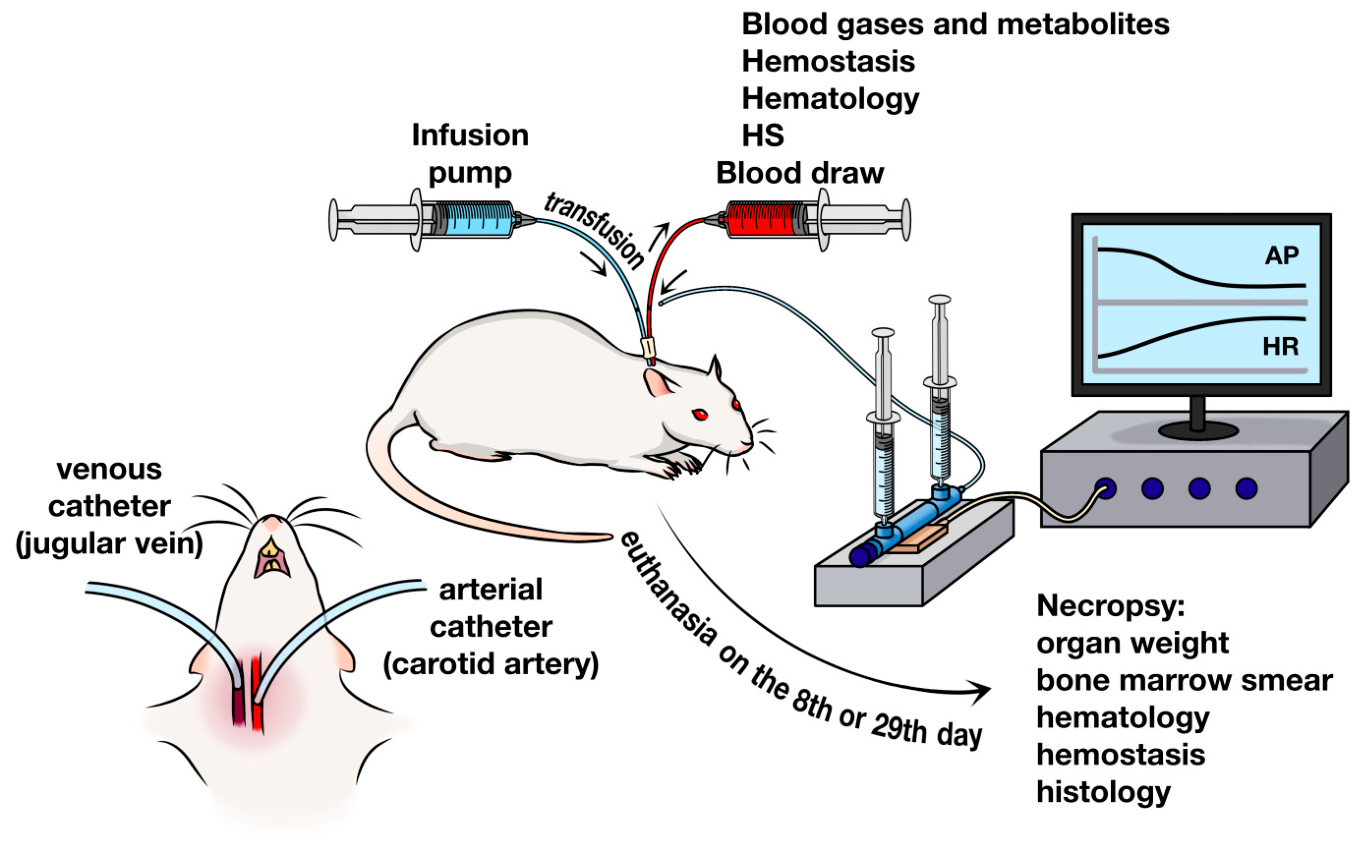
Figure 1. Experimental scheme.
Medsci 14 00587 g001
Figure 2. Body weight gain calculated as % of body weight at necropsy. *** p ≤ 0.001 relative to baseline values on day 1, ### p ≤ 0.001 relative to INT group (in the figure, statistically significant differences are indicated by brackets) according to Repeated measures ANOVA, post hoc Fisher LSD test.
Medsci 14 00587 g002
Figure 3. Hemodynamic parameters in the first 48 h of the experiment. (a) mean arterial pressure (mAP) and (b) heart rate (HR). Measurement points: BL—baseline level before the start of HS, HS start—10 min after the start of HS, HS end—60 min after the start of HS, 1 h—1 h after VRT, 3 h—3 h after VRT, 24 h—24 h after HS, 48 h—48 h after HS. * p ≤ 0.05, *** p ≤ 0.001 relative to BL according to Repeated Measures ANOVA, post-hoc Fisher LSD test.
Medsci 14 00587 g003
Figure 4. Dynamics of animal body temperature during HS modeling. Measurement points: BL—baseline before HS start, HS end—60 min after HS start, 1 h—1 h after VRT, 3 h—3 h after VRT, 24 h—24 h after HS, 48 h—48 h after HS. *** p ≤ 0.001 relative to BL according to Repeated measures ANOVA, post hoc Fisher LSD test.
Medsci 14 00587 g004
Figure 5. Whole blood oximetry parameters during the first 48 h of the experiment. (a) partial pressure of oxygen (pO2), (b) partial pressure of carbon dioxide (pCO2), (c) total hemoglobin concentration (ctHb), (d) glucose concentration (cGlu), (e) lactate anion concentration (cLac), (f) Standard Base Excess of Extracellular Fluid (cBase (Ecf)), (g) arterial oxygen content (CaO2). Data are presented as MEAN + SD. * p ≤ 0.05, ** p ≤ 0.01, *** p ≤ 0.001 relative to BL, @@ p ≤ 0.01, @@@ p ≤ 0.001 relative to the SA group according to Repeated measures ANOVA with post-hoc Fisher LSD test.
Medsci 14 00587 g005
Figure 6. Myelogram on days 8 and 29 after HS. (a) Granulocytes,%; (b) Lymphocytes, %; (c) Erythroud cells, %; (d) Leucoerythroblastic ratio. ** p ≤ 0.01, *** p ≤ 0.001 relative to BL, @ p ≤ 0.05, @@@ p ≤ 0.001 relative to the intact group, ### p ≤ 0.001 relative to the SA group according to Repeated measures ANOVA with post-hoc Fisher LSD test. Data are presented as arithmetic mean + standard error of the mean.
Medsci 14 00587 g006
Figure 7. Changes in hemostasis parameters. (a)—partial activated thromboplastin time (APTT), (b)—prothrombin time (PT), (c)—fibrinogen concentration. * p ≤ 0.05, ** p ≤ 0.01, *** p ≤ 0.001 relative to BL, @@ p ≤ 0.01 relative to the SA group according to Repeated measures ANOVA with post-hoc Fisher LSD test. Data are presented as mean + standard error of the mean.
Medsci 14 00587 g007
Figure 8. Spleen fragments from male SD rats on day 8. Hyperplasia of white pulp cells and numerous large germinal centers in lymphoid follicles (white arrows) in animals received SA (a) and AB (b), white pulp of an intact animal (c). Enhanced extramedullary hematopoiesis in red pulp in the SA group (d) and in the AB group (e). Normal background extramedullary hematopoiesis in the red pulp of the spleen of an intact animal (f). Stained with hematoxylin and eosin (ac). Magnification 50× (df). magnification 100×.
Medsci 14 00587 g008
Figure 9. Kidney fragments of male SD rats. On the 8th day, signs of acute focal wedge-shaped ischemia of the medulla with preservation of the glomerular apparatus and necrotic changes in epithelial cells of renal tubules were observed in animals with SA (a) and AB (b), a fragment of a kidney of an intact animal on the 8th day (c). On the 29th day, focal post-ischemic nephrosclerosis was observed in the SA group (d) and in the AB group (e). Kidney fragment of an intact animal on the 29th day—(f). Stained with hematoxylin and eosin, magnification 50×.
Medsci 14 00587 g009
Figure 10. Thymus fragments from male SD rats. On the 8th day after HS, pronounced accidental involution with erasure of the features of the histological structure of the organ was observed in the SA group (a), in the AB group, a moderate decrease in corticomedullary ratio was observed due to a reduction in the number of lymphoid cells in the cortex of lobules, with a weak manifestation of accidental involution (b); thymus of intact animal (c). On the 29th day after HS, a slightly reduced corticomedullary ratio was observed in lobules of the organ in the SA group (d), in the AB group (e); thymus of the intact animal (f). Stained with hematoxylin and eosin. Magnification 100×.
Medsci 14 00587 g010
Figure 11. Brain fragments of male SD rats. On day 8 after HS, one animal from the SA group showed massive neuronal loss with a glial reaction in the CA2-CA3 projection (solid arrows) and dentate gyrus (dashed arrows) of the hippocampus (a). Also on day 8, one animal from the AB group showed a small focus of necrosis with a glial reaction in the projection of the basal ganglia (in the center of the micrograph)—(b). Normal histological structure of the hippocampus of an intact animal (c). On day 29 after HS, pathological changes were observed in one animal from the SA group; the next three micropreparations are from this animal. (d)—small gliomesodermal scar in the projection of the parietal cortex, (e,f)—small gliomesodermal scars in cerebellar cortex at sites of previous ischemic necrosis (arrows). Stained with hematoxylin and eosin. Magnification 50× (ae) and 100× (f).
Medsci 14 00587 g011
Table 1. Description of groups and procedures.
Group NumberDrug/Code Name in StudyAdministration SchemeAnimal Numbers
Euthanasia on 8th Day After HSEuthanasia on 29th Day After HS
1Saline (NaCl 0.9%) + Albumin 20% (7:1)/SAHS (blood withdrawal 40% of CBV) + VRT 50% of withdrawn volume1–56–10
2Autologous blood/AB11–1516–20
3Intact/INTNo impact21–2526–30
Table 2. Blood sample collection scheme.
Time PointVolume, µL
HematologyHemostasisGas Analyzer
Before HS200 500 75
Before VRT (60 min after HS start)200 -75
3 h after VRT200 -75
24 h after HS200 500 75
48 h after HS200 500 75
8 days after HS200 500 -
29 days after HS200 500 -
Table 3. Parameters measured in blood using ABL90 Flex gas analyzer.
ParameterDescription
pCO2 (mmHg)Partial pressure of carbon dioxide (the respiratory component of acid-base balance, reflecting the adequacy of pulmonary ventilation)
pO2 (mmHg)Partial pressure of oxygen (reflects only a small fraction (1–2%) of the total oxygen in the blood dissolved in the blood plasma). The remaining 98–99% of the oxygen present in the blood is bound to hemoglobin in red blood cells. pO2 primarily reflects the absorption of oxygen by the lungs [49].
ctHb (g/dL)Total hemoglobin concentration is concentration of all forms of hemoglobin in the blood.
cGlu (mmol/L)Blood glucose concentration (glucose is the most abundant carbohydrate in mammalian metabolism and serves as a major source of intracellular energy)
cLac (mmol/L)Blood lactate anion concentration (lactate anion is the result of lactic acid dissociation).
cBase (Ecf) (mmol/L)An indicator of standard excess (or deficit) of bases in all extracellular fluids of the body. It reflects the metabolic component of acid-base imbalances. Positive values indicate an excess of bases (metabolic alkalosis), while negative values indicate a deficit (metabolic acidosis).
CaO2 (mL)Total amount of oxygen transported in arterial blood, combining oxygen bound to hemoglobin and oxygen dissolved in plasma. Arterial oxygen content was calculated as CaO2 (mL)  =  1.34  ×  Hb (g/dL)  ×  SO2  +  0.0031  ×  PO2 (mmHg) [50,51].
Table 4. A scoring scale for assessing severity of pathohistological changes.
ScoreSeverityDescription
0Within normal rangeThe organ tissue appears normal, consistent with the conditions of the study, age, sex, and strain of the animal. Minor deviations may be present, which are considered normal variations.
1MinimalObserved change in tissue barely deviates from the normal state.
2Slight Tissue damage is easily identified, but the severity is minor.
3 Moderate Moderate tissue change.
4Marked Tissue change is noticeable, but there is potential for increased severity.
5Severe The degree of change is maximum (and/or occupies most of the organ).
PPresentIt is set when it is impossible to express a feature on a point scale (only its presence is recorded).
Table 5. Body weight gain, %.
Group 1
SA
Group 2
AB
Group 3
INT
Day of the StudyMean ± SDNMean ± SDNMean ± SDN
Day 7−9.3 ± 5.0
*** ###
8−6.9 ± 2.9
*** ###
109.1 ± 1.710
Day 14−1.0 ± 5.1
*** ###
4−3.0 ± 2.8
###
518.7 ± 2.0
***
5
Day 211.0 ± 3.8
*** ###
30.1 ± 2.7
###
527.7 ± 3.6
***
5
Day 285.3 ± 4.4
###
33.9 ± 2.0
###
535.3 ± 5.3
***
5
*** p ≤ 0.001 relative to baseline values on day 1, ### p ≤ 0.001 relative to intact group (in the figure, statistically significant differences are indicated by brackets) according to Repeated measures ANOVA, post-hoc Fisher LSD test.
Table 6. Dynamics of changes in hematological parameters.
BLHS Before VRT3 h After HS24 h After HS48 h After HS8 Days After HS29 Days After HS
SAABSAABSAABSAABSAABSAABSAAB
N = 10N = 10N = 10N = 10N = 8N = 10N = 8N = 10N = 8N = 10N = 4N = 5N = 3N = 5
WBC, 109/L5.7 ± 1.45.2 ± 0.56.4 ± 0.86.9 ± 0.89.0 ± 1.6** ↑
9.5 ± 1.2
*** ↑
11.6 ± 3.3
* ↑ @ ↓
10.7 ± 3.2
*** ↑
15.3 ± 5.4
@ ↓
8.7 ± 2.9
*** ↑
15.3 ± 5.5
** ↑ @ ↓
9.4 ± 2.3
6.9 ± 0.87.4 ± 1.2
LYM, 109/L4.1 ± 1.13.8 ± 0.54.7 ± 0.65.0 ± 0.8* ↓
2.3 ± 0.4
* ↓
2.4 ± 0.8
5.9 ± 1.86.2 ± 2.4*** ↑
10.4 ± 3.3
@ ↓
5.9 ± 1.9
*** ↑
10.8 ± 3.6
** ↑
6.4 ± 1.6
5.0 ± 0.7* ↑ @ ↑
5.7 ± 1.2
MON, 109/L0.5 ± 0.20.4 ± 0.20.8 ± 0.40.9 ± 0.5* ↑
1.3 ± 0.7
@ ↓
0.9 ± 0.5
** ↑
1.5 ± 0.8
@@ ↓
1.3 ± 1.0
1.1 ± 0.6@ ↓
0.7 ± 0.6
*** ↑
2.3 ± 2.0
@@@ ↓
0.8 ± 0.2
0.5 ± 0.20.4 ± 0.1
GRA, 109/L1.0 ± 0.41.0 ± 0.41.0 ± 0.51.1 ± 0.6** ↑
5.3 ± 1.3
*** ↑
6.2 ± 1.1
*** ↑
4.2 ± 1.8
** ↑
3.2 ± 1.7↑
*** ↑
3.8 ± 2.5
@ ↓
2.1 ± 0.7
2.3 ± 1.12.3 ± 1.21.3 ± 0.21.3 ± 0.3
LYM, %73.8 ± 4.273.7 ± 5.873.7 ± 4.071.2 ± 5.5*** ↓
26.5 ± 4.3
*** ↓
25.5 ± 6.8
*** ↓
52.1 ± 11.6
*** ↓
57.4 ± 16.2
70.1 ± 12.770.6 ± 5.071.8 ± 11.370.8 ± 5.972.8 ± 1.876.4 ± 6.2
MON, %9.4 ± 3.47.5 ± 3.011.4 ± 5.612.2 ± 6.3*** ↑
14.7 ± 7.4
@ ↓
9.6 ± 5.4
11.8 ± 4.711.3 ± 5.77.0 ± 2.17.1 ± 3.7*** ↑
13.0 ± 8.5
@ ↓
8.0 ± 0.9
7.7 ± 1.46.0 ± 0.8
GRA, %16.8 ± 4.818.7 ± 7.415.0 ± 7.716.6 ± 10.5*** ↑
58.8 ± 7.4
*** ↑
64.9 ± 11.0
*** ↑
36.2 ± 11.0
*** ↑
31.2 ± 16.8
22.9 ± 11.322.4 ± 4.515.3 ± 4.521.2 ± 5.919.6 ± 2.817.6 ± 6.0
RBC, 1012/L8.4 ± 0.38.0 ± 0.2*** ↓
5.3 ± 0.6
*** ↓
5.3 ± 0.3
*** ↓
4.6 ± 0.7
*** ↓ @@ ↑
6.1 ± 0.4
*** ↓
4.5 ± 0.2
*** ↓ @@ ↑
6.2 ± 0.5
*** ↓
4.2 ± 0.4
*** ↓ @@ ↑
5.7 ± 0.8
*** ↓
5.6 ± 0.2
*** ↓ @ ↑
6.4 ± 0.2
*** ↓
7.1 ± 0.5
* ↓
7.6 ± 0.3
HGB, g/L147 ± 4143 ± 4*** ↓
95 ± 8
*** ↓
93 ± 5
*** ↓
81 ± 12
*** ↓ @@ ↑
107 ± 7
*** ↓
80 ± 4
*** ↓ @@ ↑
111 ± 10
*** ↓
78 ± 8
*** ↓ @@ ↑
104 ± 14
*** ↓
121 ± 6
*** ↓
128 ± 1
*** ↓
141 ± 6
147 ± 5
HCT, L/L0.51 ± 0.020.49 ± 0.04*** ↓
0.33 ± 0.03
*** ↓
0.33 ± 0.02
*** ↓
0.28 ± 0.04
*** ↓ @@@ ↑
0.37 ± 0.03
*** ↓
0.28 ± 0.01
*** ↓ @@@ ↑
0.38 ± 0.03
*** ↓
0.27 ± 0.02
*** ↓ @@@ ↑
0.35 ± 0.04
*** ↓
0.44 ± 0.02
*** ↓
0.43 ± 0.01
0.47 ± 0.020.49 ± 0.02
MCV, fL60.2 ± 1.761.0 ± 0.960.8 ± 1.961.6 ± 1.260.6 ± 1.661.4 ± 1.061.1 ± 1.161.5 ± 1.2** ↑
64.2 ± 1.5
62.5 ± 1.6*** ↑
77.2 ± 4.4
*** ↑ @@
66.5 ± 2.8
*** ↑
66.9 ± 2.7
*** ↑
64.3 ± 1.3
MCH, pg17.6 ± 0.517.9 ± 0.417.5 ± 0.717.7 ± 0.317.5 ± 0.717.7 ± 0.317.7 ± 0.417.9 ± 0.3** ↑
17.6 ± 2.2
18.4 ± 0.4*** ↑
21.5 ± 0.3
*** ↑ @ ↓
19.9 ± 0.6
*** ↑
20.0 ± 0.5
*** ↑
19.4 ± 0.1
MCHC, g/L292 ± 8293 ± 7288 ± 10287 ± 6289 ± 8288 ± 7289 ± 5292 ± 10287 ± 9294 ± 8*** ↓
279 ± 16
@@ ↑
299 ± 6
299 ± 6302 ± 5
RDW, %11.9 ± 0.511.7 ± 0.411.6 ± 0.511.8 ± 0.411.6 ± 0.411.9 ± 0.411.6 ± 0.411.8 ± 0.510.9 ± 0.611.5 ± 0.6*** ↑
18.7 ± 1.6
*** ↑ @@@ ↓
14.3 ± 1.1
*** ↑
13.9 ± 0.3
*** ↑
13.0 ± 0.4
RDW-SD, fL30.4 ± 1.530.9 ± 1.530.9 ± 2.031.3 ± 1.530.3 ± 1.530.9 ± 1.033.6 ± 1.832.3 ± 2.033.0 ± 1.932.8 ± 1.7*** ↑
60.9 ± 10.7
*** ↑ @@@
40.8 ± 4.4
*** ↑
39.2 ± 1.2
*** ↑
36.4 ± 2.5
PLT, 109/L779 ± 129765 ± 88823 ± 170807 ± 118640 ± 70* ↓
655 ± 79
786 ± 112* ↓ @ ↓
663 ± 151
834 ± 144* ↓ @@ ↓
634 ± 93
*** ↑
1763 ± 397
* ↑ @@@ ↓
1467 ± 121
786 ± 113* ↑
787 ± 80
MPV, fL6.0 ± 0.25.8 ± 0.45.8 ± 0.35.8 ± 0.45.6 ± 0.25.6 ± 0.25.9 ± 0.25.8 ± 0.25.6 ± 0.15.6 ± 0.25.3 ± 0.3*** ↓
5.1 ± 0.1
5.7 ± 0.45.7 ± 0.2
PCT, cL/L0.5 ± 0.10.5 ± 0.00.5 ± 0.1* ↑
0.7 ± 0.1
0.4 ± 0.00.4 ± 0.00.5 ± 0.10.4 ± 0.10.5 ± 0.1** ↓ @ ↓
0.4 ± 0.1
*** ↑
0.9 ± 0.3
*** ↑ @@@ ↓
0.8 ± 0.1
0.5 ± 0.00.5 ± 0.0
PDW, %16.4 ± 1.715.5 ± 1.4* ↓
14.7 ± 0.7
* ↓
14.0 ± 0.9
** ↓
14.0 ± 1.1
14.1 ± 0.8* ↓
14.5 ± 0.8
14.8 ± 1.1**
13.2 ± 0.3
13.8 ± 0.8*** ↓
12.3 ± 0.8
*** ↓
12.5 ± 0.3
** ↓
14.1 ± 1.5
* ↓
14.0 ± 0.4
P-LCR3.4 ± 1.25.2 ± 0.52.9 ± 1.33.0 ± 1.62.4 ± 0.62.2 ± 0.83.1 ± 0.5** ↓
2.8 ± 0.8
2.6 ± 0.32.7 ± 0.91.7 ± 0.6** ↓
1.1 ± 0.2
2.2 ± 0.82.2 ± 0.6
* p ≤ 0.05, ** p ≤ 0.01,*** p ≤ 0.001 relative to BL, @ p ≤ 0.05, @@ p ≤ 0.01, @@@ p ≤ 0.001 relative to the SA group at the corresponding time point according to Repeated measures ANOVA with post-hoc Fisher LSD test. The arrow next to the significance icon indicates the vector of parameter change (↑ increase, ↓ decrease).
Table 7. Organ weight on days 8 and 29 after HS.
Group 1 SAGroup 2 ABGroup 3 INT
Day 8
N = 4
Day 29
N = 3
Day 8
N = 5
Day 29
N = 5
Day 8
N = 5
Day 29
N = 5
Body weight, g305 ± 18352 ± 7301 ± 31347 ± 15304 ± 18349 ± 19
Absolute organ weight, g
Spleen1.17 ± 0.07
*** ↑
0.97± 0.04
### ↓
1.00 ± 0.16
** ↑ @ ↓
0.92 ± 0.130.79 ± 0.080.80 ± 0.08
Adrenal glands0.049 ± 0.0060.045 ± 0.001
* ↓
0.050 ± 0.0050.048 ± 0.0020.048 ± 0.0060.054 ± 0.006
Kidneys1.76 ± 0.06
*** ↓
1.88 ± 0.09
*** ↓
1.89 ± 0.22
*** ↓
1.91 ± 0.19
*** ↓
2.42 ± 0.222.59 ± 0.18
Liver10.5 ± 0.6
** ↓
12.4 ± 0.3
# ↑
10.5 ± 1.5
** ↓
11.7 ± 0.712.3 ± 1.012.6 ± 1.3
Submandibular lymph nodes0.033 ± 0.0050.037 ± 0.0060.025 ± 0.0060.034 ± 0.0100.037 ± 0.0100.036 ± 0.011
Thymus0.11 ± 0.02
*** ↓
0.25 ± 0.03
*** ↓ ## ↑
0.16 ± 0.04
*** ↓
0.26 ± 0.09
*** ↓
0.58 ± 0.060.60 ± 0.08
Lungs1.7 ± 0.11.8 ± 0.11.7 ± 0.21.7 ± 0.11.9 ± 0.51.8 ± 0.3
Brain1.7 ± 0.1
* ↓
1.8 ± 0.1
** ↓
1.7 ± 0.1
* ↓
1.8 ± 0.11.9 ± 0.11.9 ± 0.07
Relative organ weight (relative to body weight at necropsy), %
Spleen0.38 ± 0.02
*** ↑
0.27 ± 0.01
### ↓
0.33 ± 0.04
** ↑ @ ↑
0.27 ± 0.04
## ↓
0.26 ± 0.030.23 ± 0.03
Adrenal glands0.016 ± 0.0020.013 ± 0.001
# ↓
0.017 ± 0.0010.014 ± 0.001
# ↓
0.016 ± 0.0020.016 ± 0.002
Kidneys0.58 ± 0.04
*** ↓
0.53 ± 0.02
*** ↓
0.63 ± 0.05
*** ↓
0.55 ± 0.04
*** ↓ # ↓
0.80 ± 0.080.74 ± 0.05
Liver3.4 ± 0.06
*** ↓
3.52 ± 0.143.48 ± 0.20
*** ↓
3.37 ± 0.154.05 ± 0.233.61 ± 0.27
Submandibular lymph nodes0.011 ± 0.0020.010 ± 0.0020.008 ± 0.0010.010 ± 0.0030.012 ± 0.0040.010 ± 0.004
Thymus0.036 ± 0.008
*** ↓
0.072 ± 0.009
*** ↓ # ↑
0.054 ± 0.0146
*** ↓
0.074 ± 0.030
*** ↓
0.190 ± 0.0170.172 ± 0.021
Lungs0.558 ± 0.0270.504 ± 0.0120.546 ± 0.0260.494 ± 0.0210.618 ± 0.1480.505 ± 0.110
Brain0.562 ± 0.0200.506 ± 0.0200.564 ± 0.0400.530 ± 0.0490.611 ± 0.0380.551 ± 0.025
* p ≤ 0.05, ** p ≤ 0.01, *** p ≤ 0.001 relative to intact group on the corresponding day of necropsy, # p ≤ 0.05, ## p ≤ 0.01, ### p ≤ 0.001 relative to day 8 within the group, @ p ≤ 0.05 relative to the SA group on the corresponding day of necropsy according to one-way ANOVA, post-hoc Fisher LSD test. The arrow next to the significance icon indicates the vector of parameter change (↑ increase, ↓ decrease). Data are presented as mean ± standard deviation.
Table 8. Histological changes on the 8th day after HS.
Group SAAB
Spleen (number of samples)45
White pulp cell hyperplasia (individual score 0–5 (average score))3/3/3/3 (3.0 ± 0.0)3/3/2/3/3 (2.8 ± 0.4)
Increased extramedullary hematopoiesis in red pulp (individual score 0–5 (average score))3/3/3/3 (3.0 ± 0.0)3/3/3/3/3 (3.0 ± 0.0)
Kidneys (number of samples)45
Acute focal ischemia (present “+”, absent “−” (“+” percentage, %))+/−/+/− (50.0%)+/−/+/+/+ (80.0%)
Thymus (number of samples)45
Accidental involution (individual score 0–5 (average score))4/3/3/3 (3.3 ± 0.5)2/3/0/2/2 (1.8 ± 1.1) *
Decreased corticomedullary ratio (individual score 0–5 (average score))4/4/4/4 (4.0 ± 0.0)3/4/2/3/3 (3.0 ± 0.7) *
Brain (number of samples)45
Neuronal death in projection of CA1, CA2, CA3 and dentate gyrus of hippocampus (number of cases (“+” percentage, %))1 (25.0%)1 (20.0%)
Foci of necrosis in projection of basal ganglia (number of cases (“+” percentage, %))1 (25.0%)0 (0.0%)
* p ≤ 0.05 relative to the SA group according to the Mann-Whitney U-test for pairwise comparison. Average scores are presented as mean values ± standard deviation.
Table 9. Histological changes on the 29th day after HS.
Group SAAB
Spleen (number of samples)35
White pulp cell hyperplasia (individual score 0–5 (average score))2/2/2 (2.0 ± 0.0)2/2/2/2/2 (2.0 ± 0.0)
Kidneys (number of samples)35
Focal post-ischemic nephrosclerosis (present “+”, absent “−” (“+” percentage, %))−/−/+ (33.3%)−/+/+/−/− (40.0%)
Thymus (number of samples)35
Decreased corticomedullary ratio (individual score 0–5 (average score))2/2/2
(2.0 ± 0.0)
2/2/2/2/2
(2.0 ± 0.0)
Brain (number of samples)35
Gliomesodermal scars in projection of parietal cortex (number of cases (“+” percentage, %))1 (33.3%)0 (0.0%)
Gliomesodermal scars in cerebellar cortex (number of cases (“+” percentage, %))1 (33.3%)0 (0.0%)
Disclaimer/Publisher’s Note: The statements, opinions and data contained in all publications are solely those of the individual author(s) and contributor(s) and not of MDPI and/or the editor(s). MDPI and/or the editor(s) disclaim responsibility for any injury to people or property resulting from any ideas, methods, instructions or products referred to in the content.