
Calcineurin Inhibitors and Uric Acid Control in Solid Organ Transplantation: A Systematic Review

 ,
,  ,
, 
Abstract
1. Introduction
2. Materials and Methods
- Participants: Adult patients (≥19 years) who received cyclosporin or tacrolimus as immunosuppressive therapy for a solid organ transplant.
- Outcomes: UA levels or hyperuricemia incidence or prevalence in specific immunosuppressive regimens.
- Study Designs: Observational studies (prospective cohort studies, retrospective studies, and cross-sectional studies) and randomized controlled trials (RCTs).
- Report Characteristics: No language restrictions were imposed, and translations were attempted for non-English published articles. No time restriction was applied.
- -
- The aim of the study: with a score from 0 to 20, where 0 was for a study that incidentally described UA metabolism, 10 was for a study that evaluated UA as a secondary outcome, and 20 was for a study that evaluated UA as a primary outcome.
- -
- Study design and sample size: with a score from 0 to 20, which considered the type of study and the sample size.
- -
- Accuracy of the description of UA or hyperuricemia, with a score from 0 to 20
- -
- Accuracy of the description of kidney function at baseline and during the follow-up, with a score from 0 to 20.
- -
- Accuracy in the potential biases that could have affected UA levels, with a score from 0 to 20. We focused on uricosuric agents, diuretics, antihypertensive treatment, and other immunosuppressive therapies.
3. Results
3.1. Uric Acid Control in the Included Studies
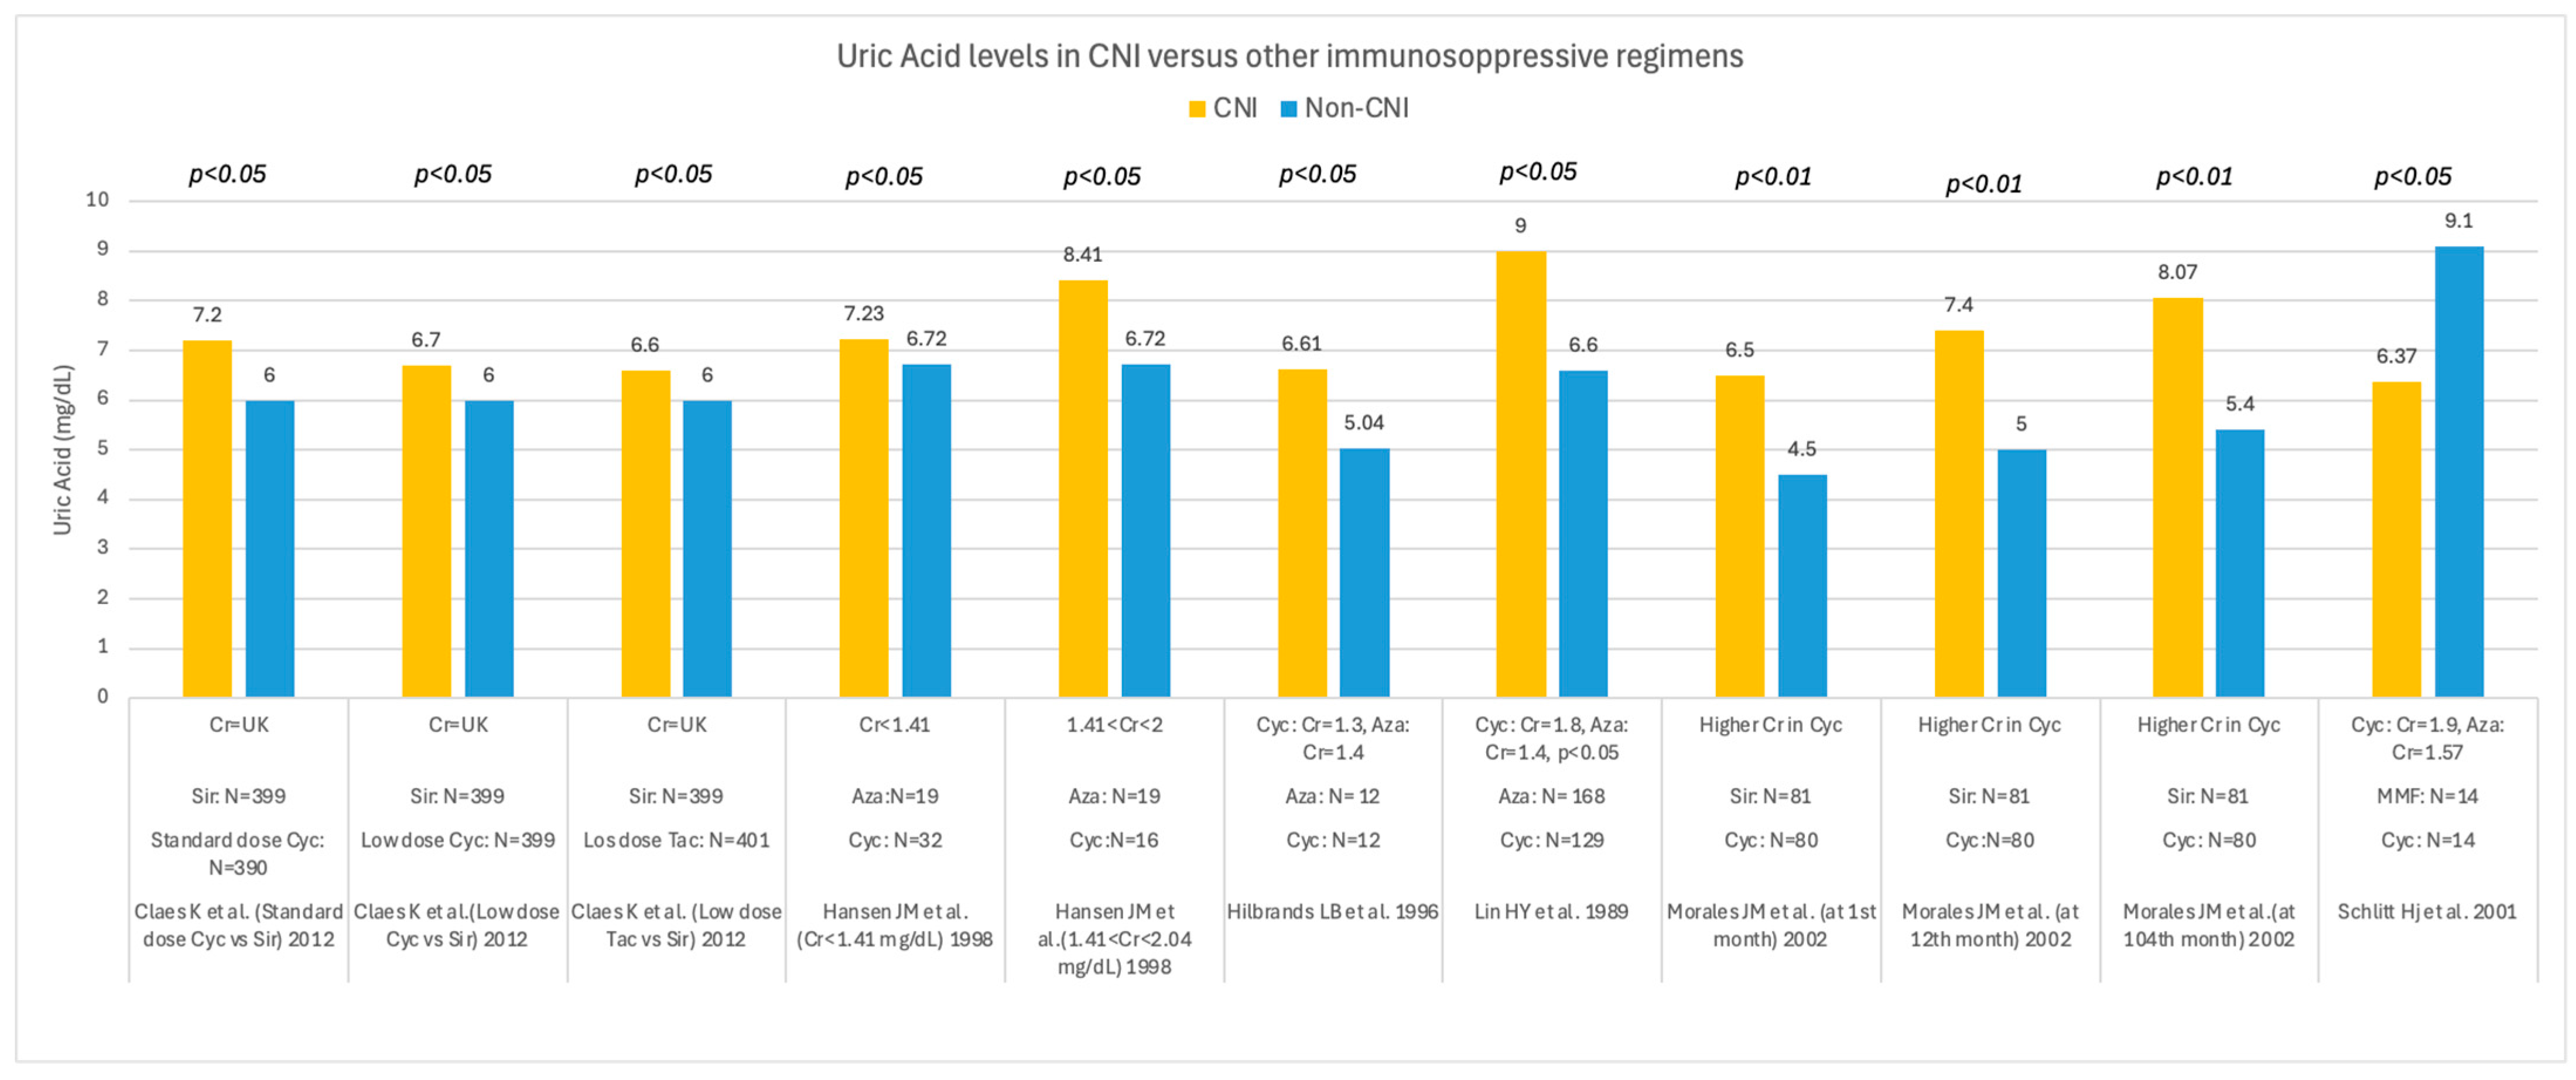
3.1.1. Uric Acid in Cyclosporin or Tacrolimus Treatment Versus Other Immunosuppressives
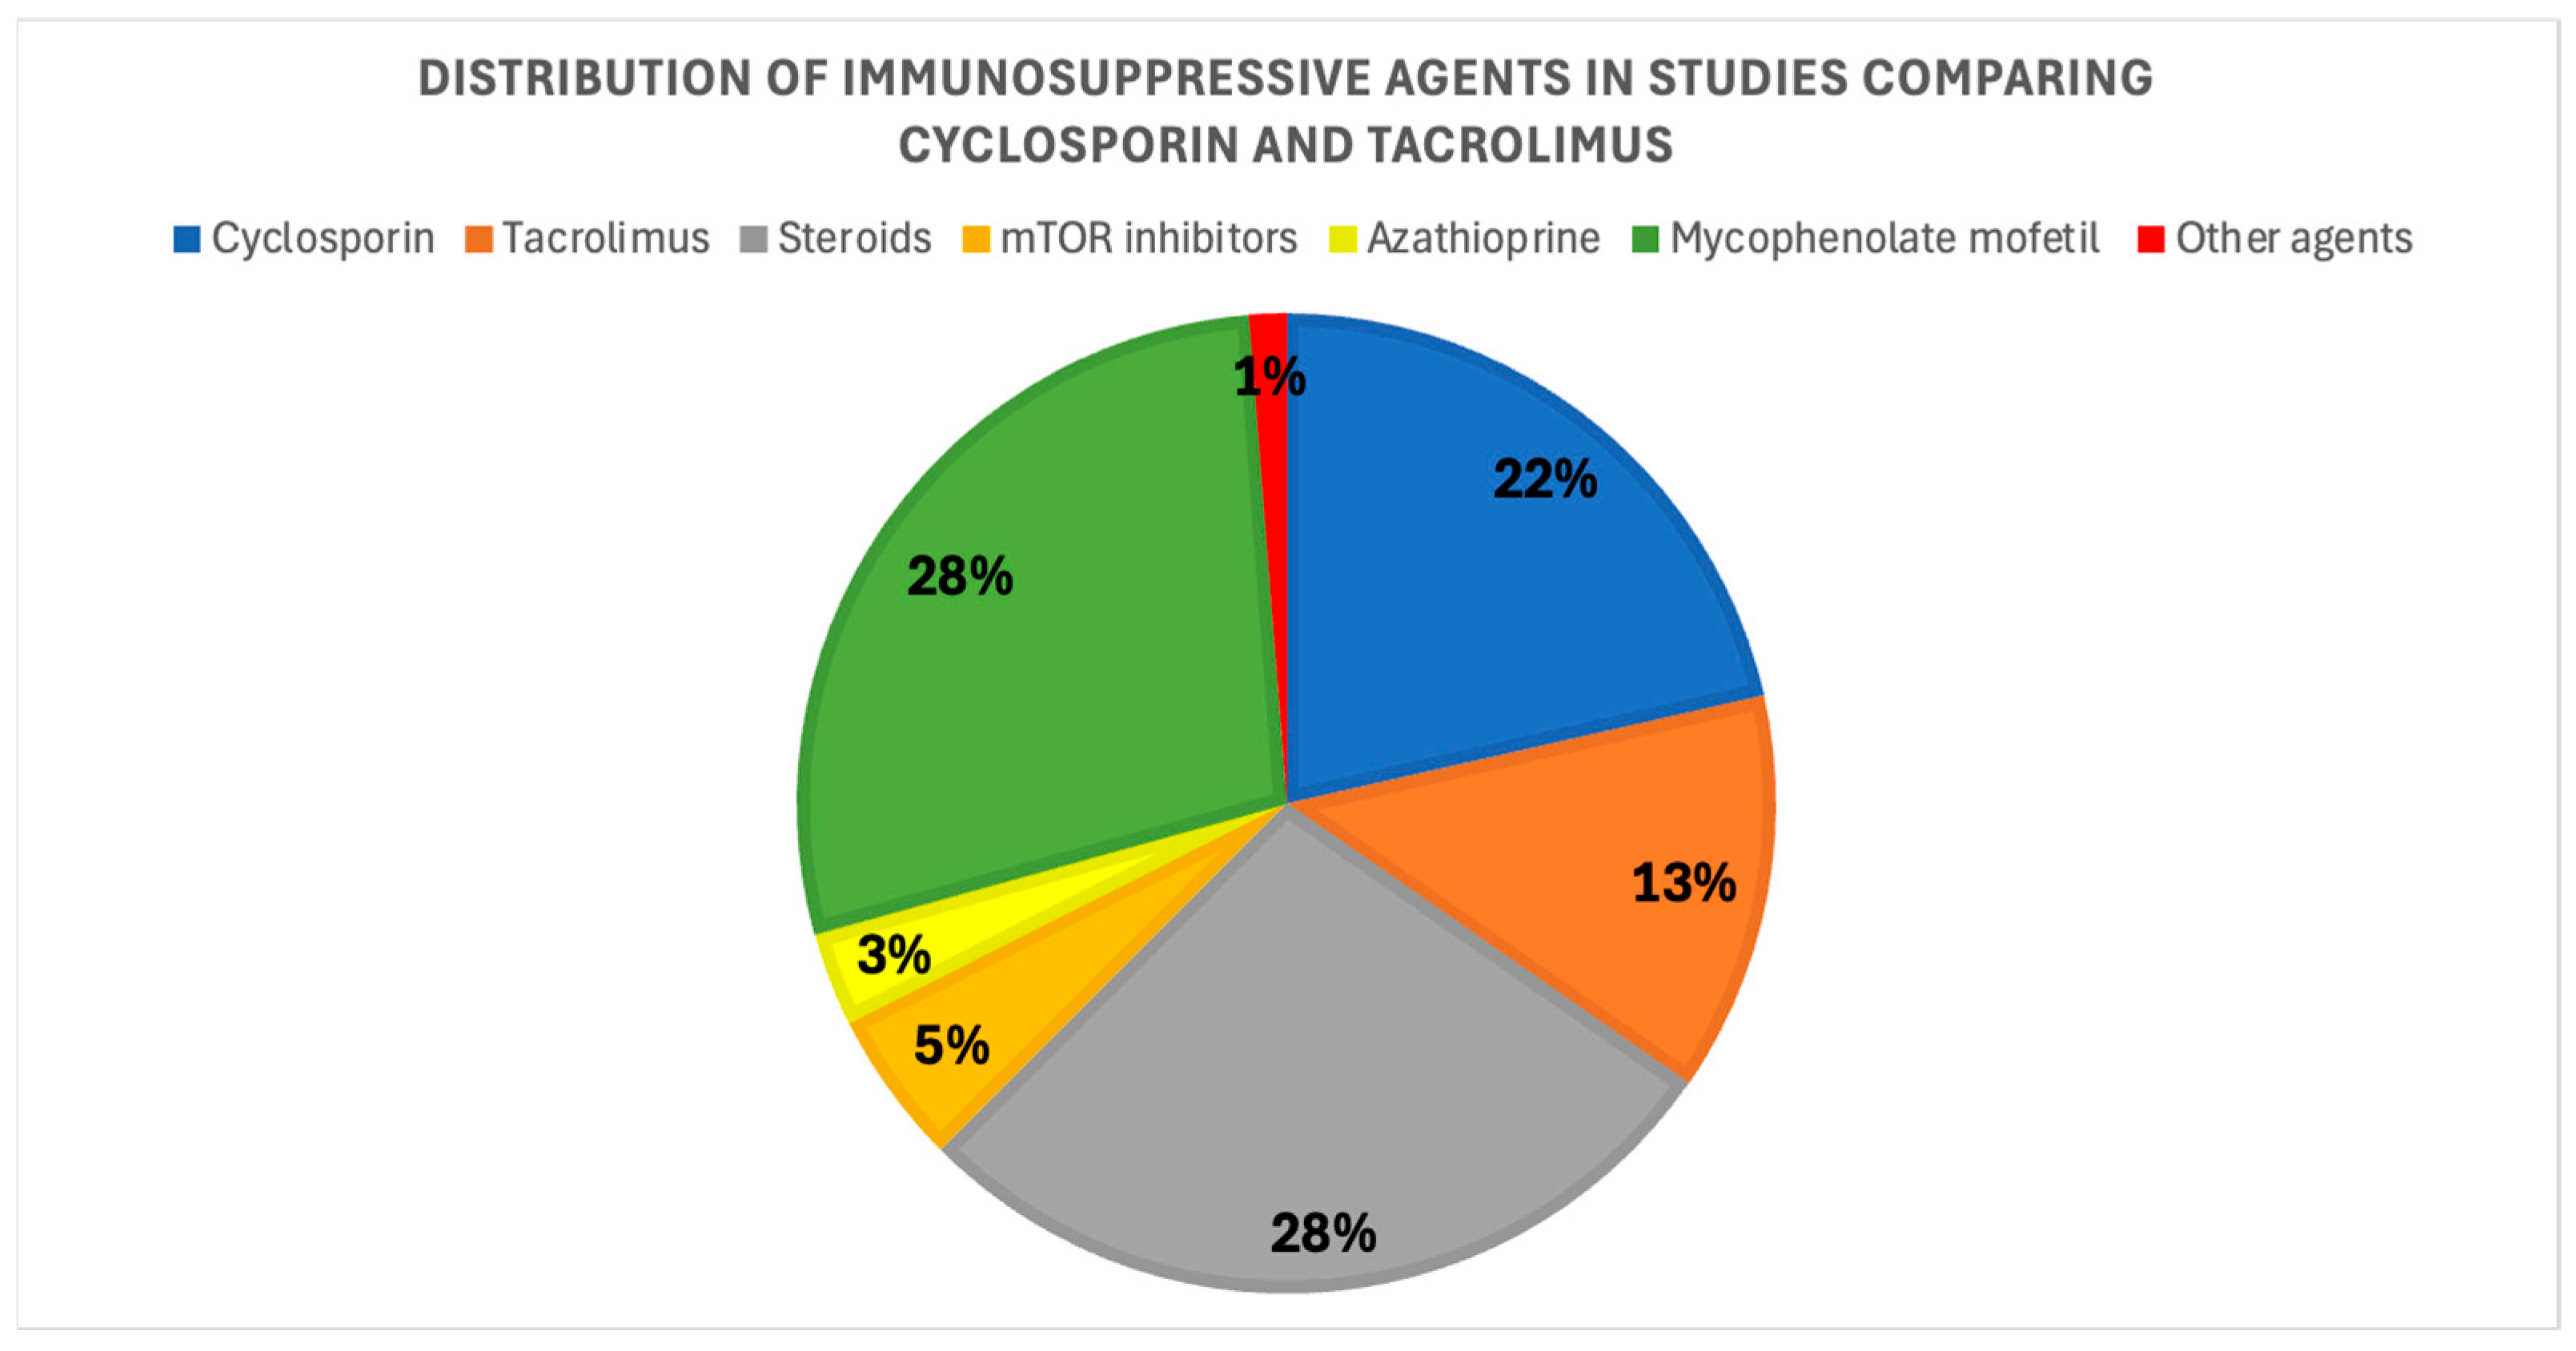
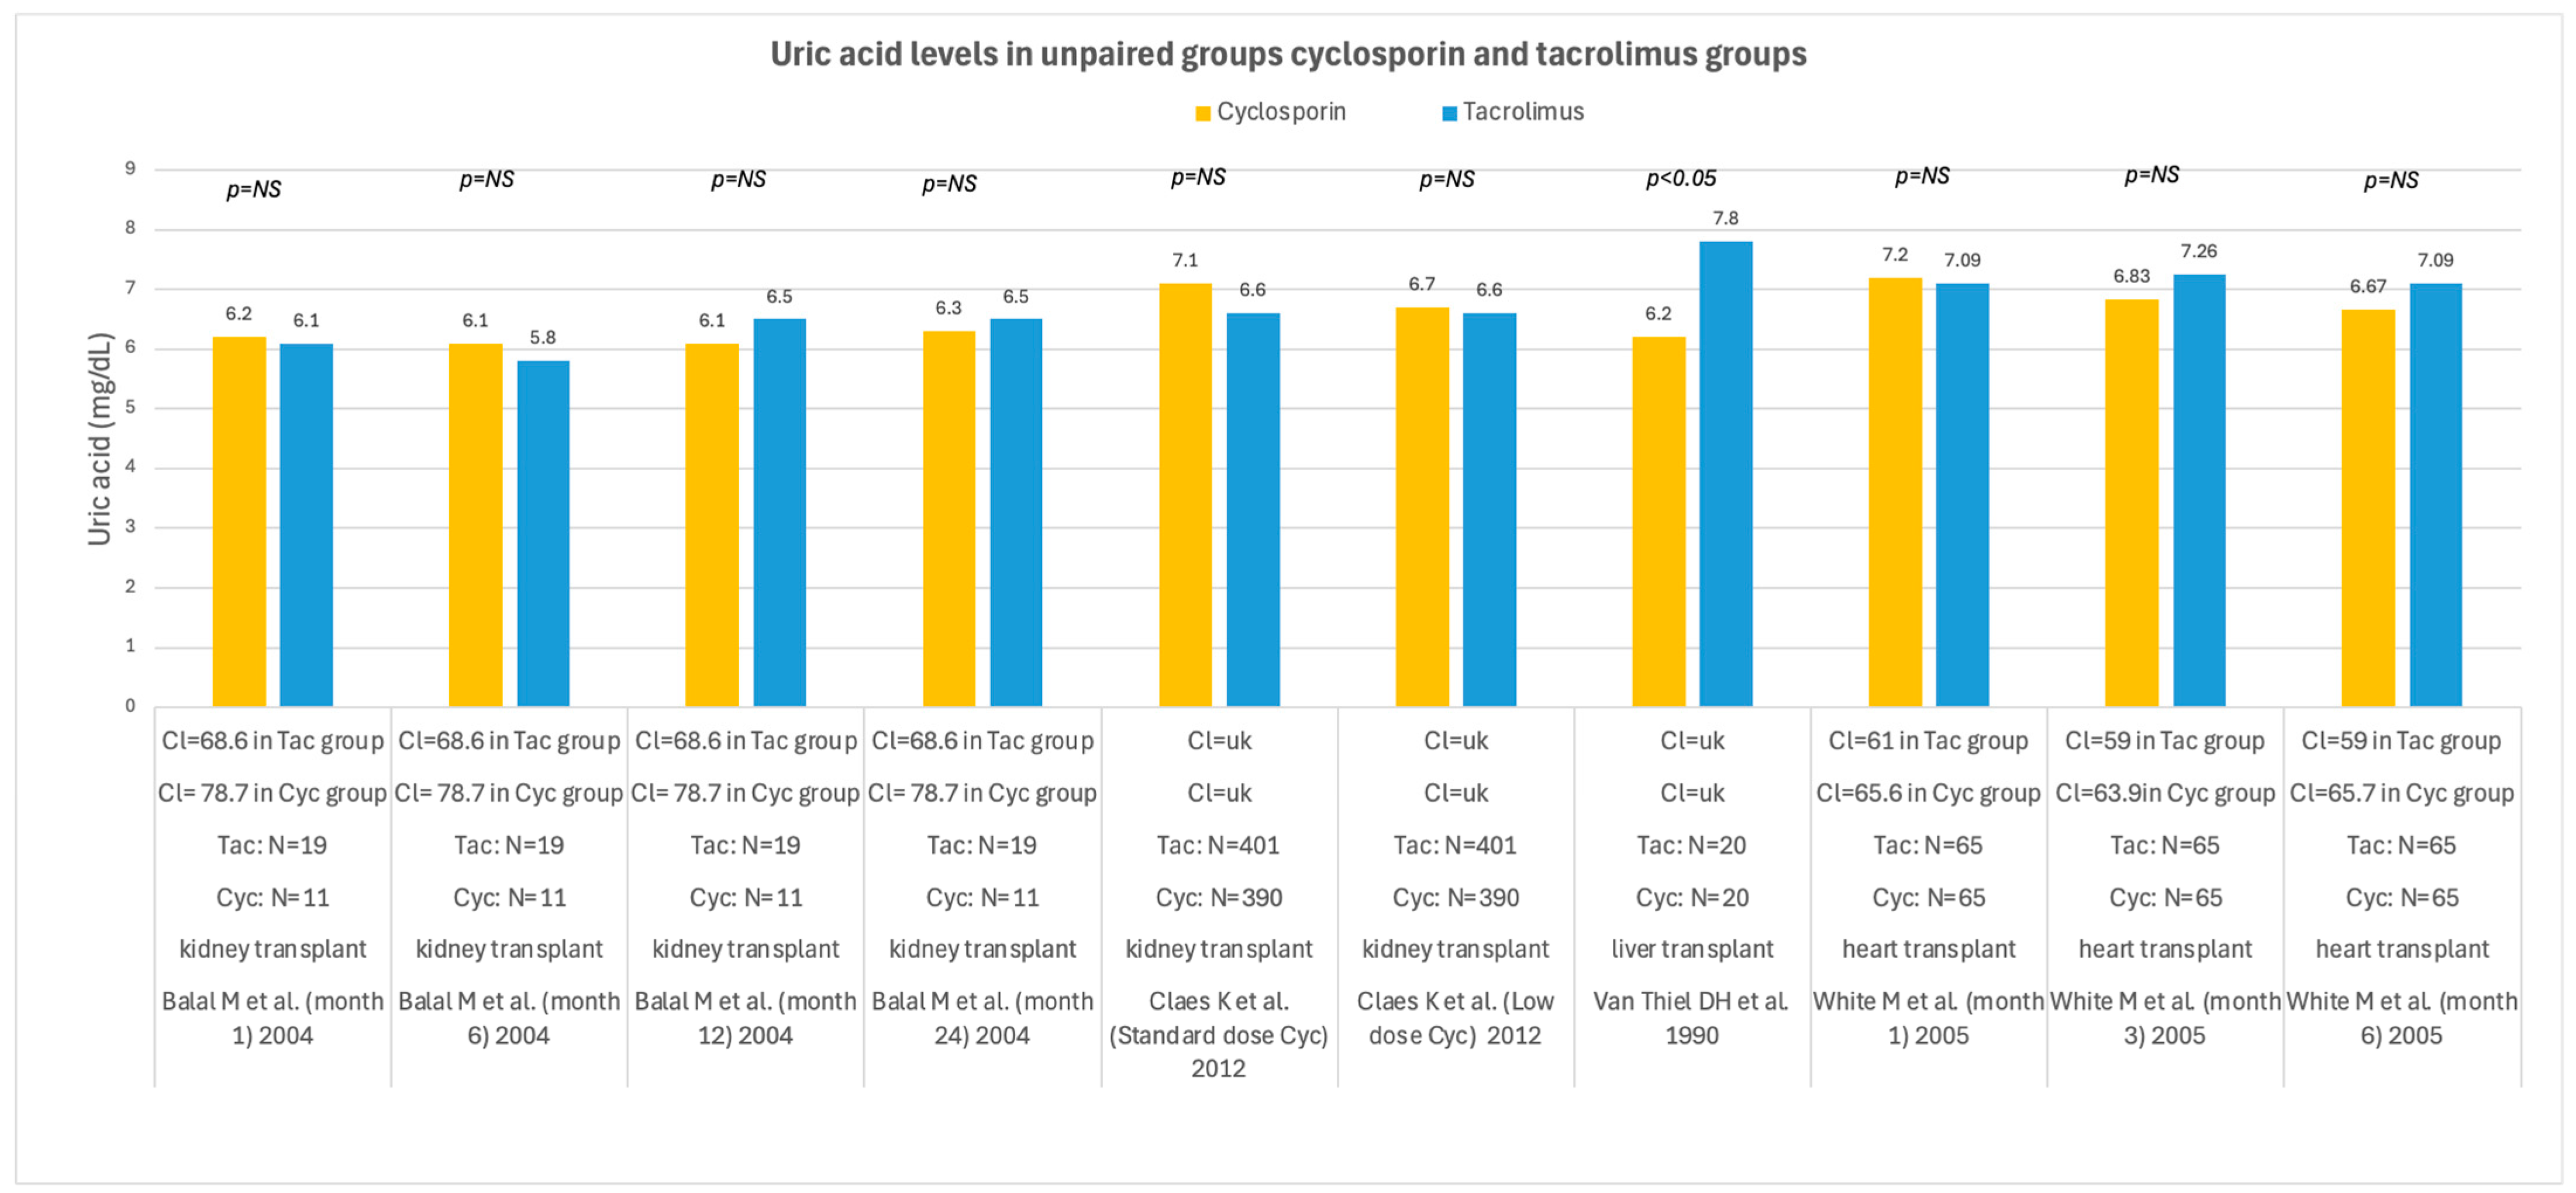
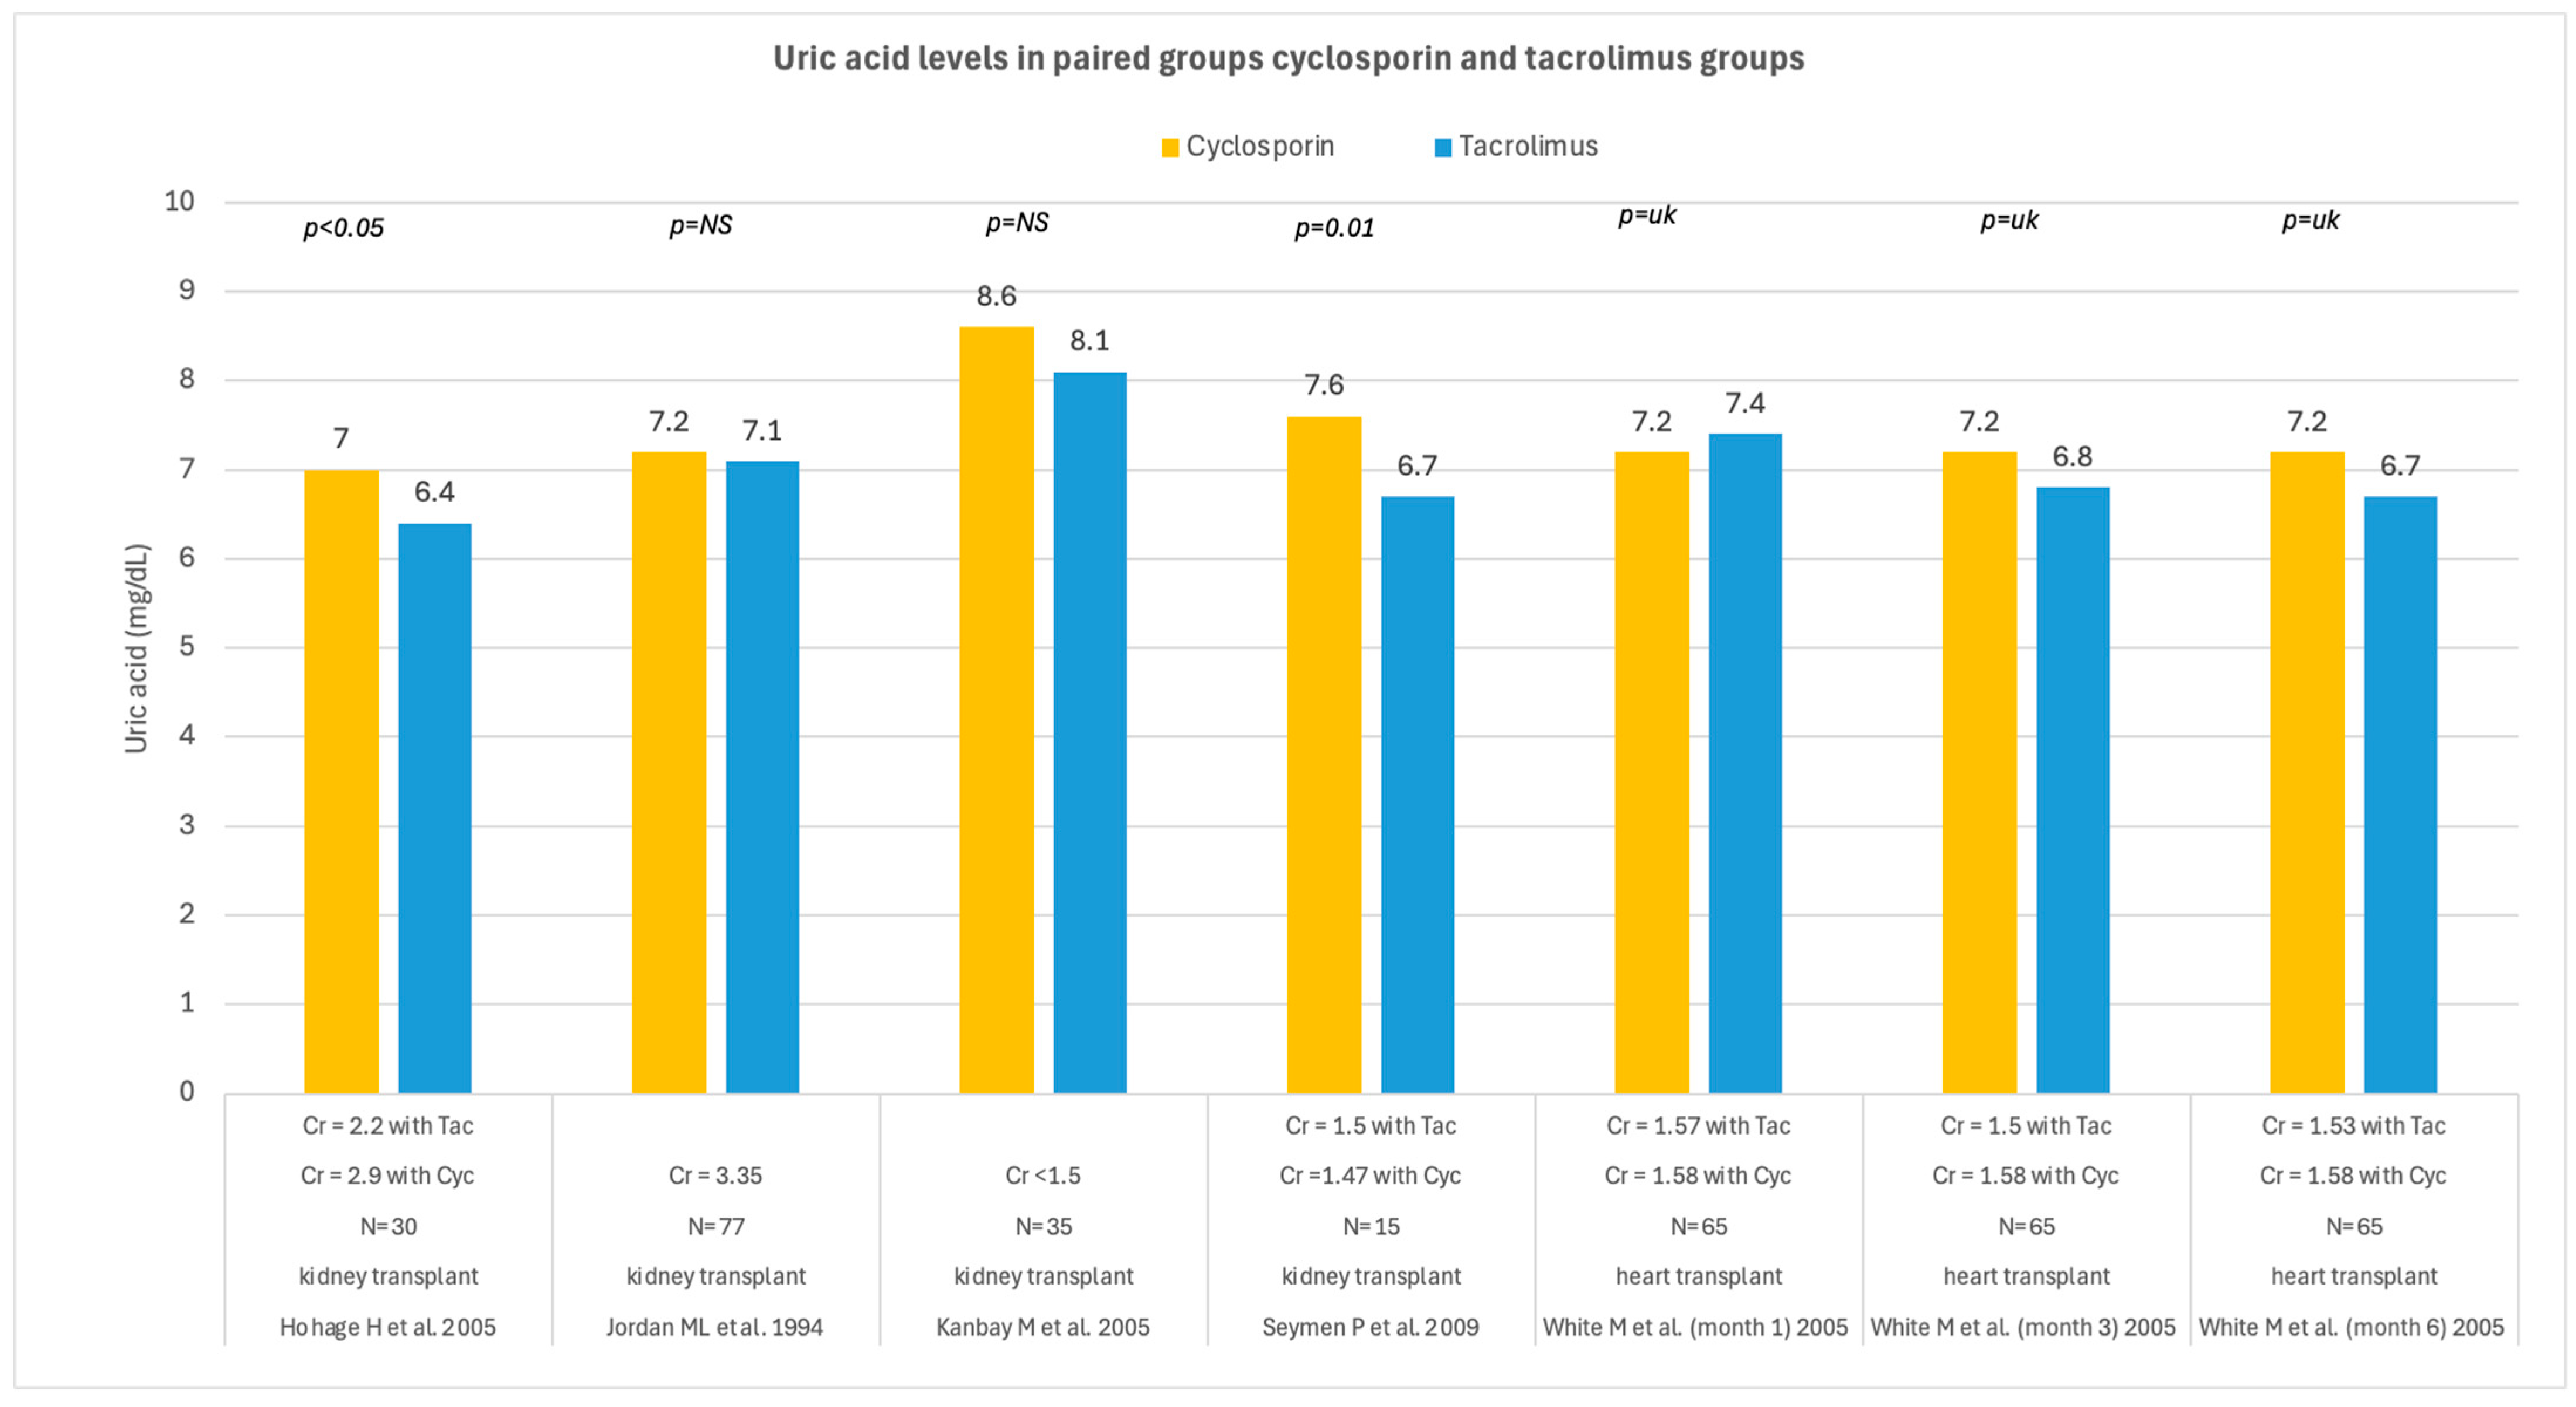
3.1.2. Uric Acid in the Comparison Between Cyclosporin and Tacrolimus
3.2. Quality, Relevance and Heterogeneity Assessment
4. Discussion
4.1. CNI and Hyperuricemia
4.2. CNI and UA Control
4.3. Cyclosporin Versus Tacrolimus in UA Control
4.4. Clinical Implications
4.5. Limitations and Quality Assessment
5. Conclusions
Author Contributions
Funding
Institutional Review Board Statement
Informed Consent Statement
Data Availability Statement
Conflicts of Interest
Abbreviations
| UA | Uric acid |
| CKD | Chronic kidney disease |
| CNI | Calcineurin inhibitor |
| PICO | Population, intervention, comparison, outcome |
| CASP | Critical Appraisal Skills Programme |
| RCT | Randomized controlled trial |
Appendix A

| Section and Topic | Item # | Checklist Item | Location Where Item Is Reported |
|---|---|---|---|
| TITLE | |||
| Title | 1 | Identify the report as a systematic review. | 1st page |
| ABSTRACT | |||
| Abstract | 2 | See the PRISMA 2020 for Abstracts checklist. | 1st page |
| INTRODUCTION | |||
| Rationale | 3 | Describe the rationale for the review in the context of existing knowledge. | 2nd and 3rd pages |
| Objectives | 4 | Provide an explicit statement of the objective(s) or question(s) the review addresses. | 3rd page |
| METHODS | |||
| Eligibility criteria | 5 | Specify the inclusion and exclusion criteria for the review and how studies were grouped for the syntheses. | 3rd page |
| Information sources | 6 | Specify all databases, registers, websites, organisations, reference lists and other sources searched or consulted to identify studies. Specify the date when each source was last searched or consulted. | 3rd page |
| Search strategy | 7 | Present the full search strategies for all databases, registers and websites, including any filters and limits used. | 3rd page |
| Selection process | 8 | Specify the methods used to decide whether a study met the inclusion criteria of the review, including how many reviewers screened each record and each report retrieved, whether they worked independently, and if applicable, details of automation tools used in the process. | 3rd page |
| Data collection process | 9 | Specify the methods used to collect data from reports, including how many reviewers collected data from each report, whether they worked independently, any processes for obtaining or confirming data from study investigators, and if applicable, details of automation tools used in the process. | 4th page |
| Data items | 10a | List and define all outcomes for which data were sought. Specify whether all results that were compatible with each outcome domain in each study were sought (e.g., for all measures, time points, analyses), and if not, the methods used to decide which results to collect. | 4th page |
| 10b | List and define all other variables for which data were sought (e.g., participant and intervention characteristics, funding sources). Describe any assumptions made about any missing or unclear information. | 4th page | |
| Study risk of bias assessment | 11 | Specify the methods used to assess risk of bias in the included studies, including details of the tool(s) used, how many reviewers assessed each study and whether they worked independently, and if applicable, details of automation tools used in the process. | 4th page |
| Effect measures | 12 | Specify for each outcome the effect measure(s) (e.g., risk ratio, mean difference) used in the synthesis or presentation of results. | 4th page |
| Synthesis methods | 13a | Describe the processes used to decide which studies were eligible for each synthesis (e.g., tabulating the study intervention characteristics and comparing against the planned groups for each synthesis (item #5)). | 5th page |
| 13b | Describe any methods required to prepare the data for presentation or synthesis, such as handling of missing summary statistics, or data conversions. | 5th page | |
| 13c | Describe any methods used to tabulate or visually display results of individual studies and syntheses. | 4th page | |
| 13d | Describe any methods used to synthesize results and provide a rationale for the choice(s). If meta-analysis was performed, describe the model(s), method(s) to identify the presence and extent of statistical heterogeneity, and software package(s) used. | 4th page | |
| 13e | Describe any methods used to explore possible causes of heterogeneity among study results (e.g., subgroup analysis, meta-regression). | 4th page | |
| 13f | Describe any sensitivity analyses conducted to assess robustness of the synthesized results. | NA | |
| Reporting bias assessment | 14 | Describe any methods used to assess risk of bias due to missing results in a synthesis (arising from reporting biases). | 4th page |
| Certainty assessment | 15 | Describe any methods used to assess certainty (or confidence) in the body of evidence for an outcome. | 5th page |
| RESULTS | |||
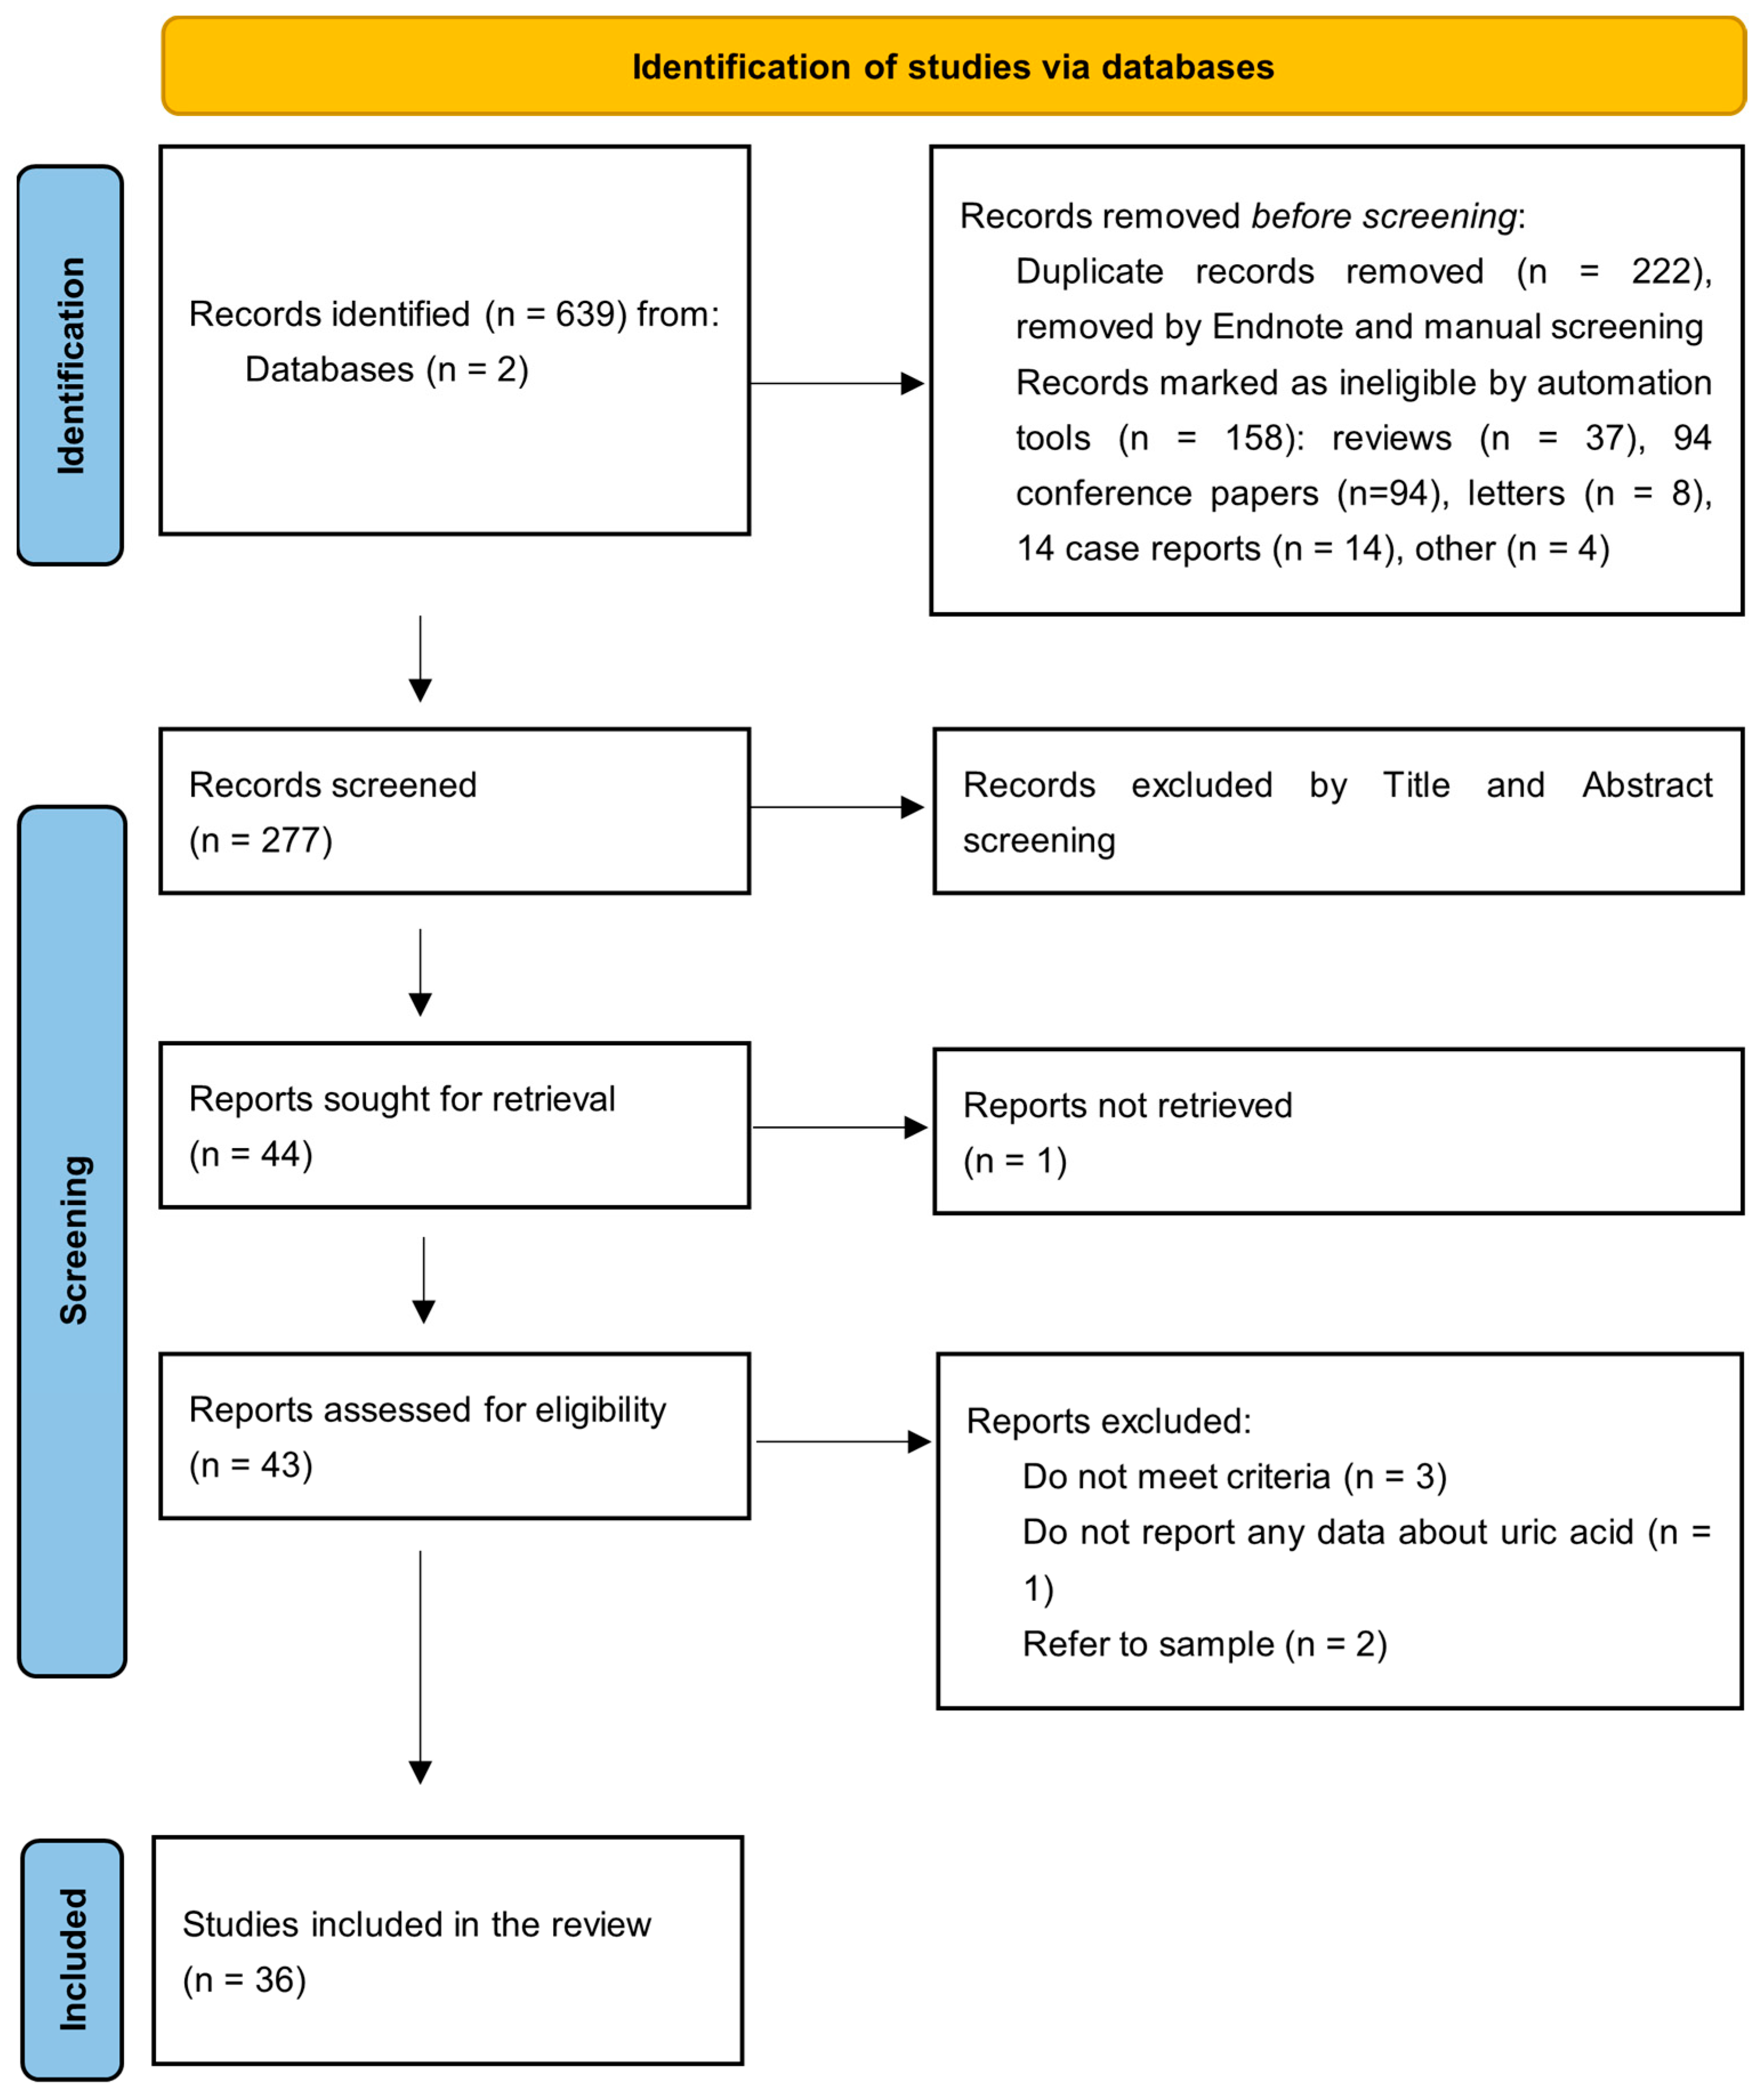
| Study selection | 16a | Describe the results of the search and selection process, from the number of records identified in the search to the number of studies included in the review, ideally using a flow diagram. | 5th page |
| 16b | Cite studies that might appear to meet the inclusion criteria, but which were excluded, and explain why they were excluded. | Figure 1 | |
| Study characteristics | 17 | Cite each included study and present its characteristics. | Table 1 |
| Risk of bias in studies | 18 | Present assessments of risk of bias for each included study. | Table 5 |
| Results of individual studies | 19 | For all outcomes, present, for each study: (a) summary statistics for each group (where appropriate) and (b) an effect estimate and its precision (e.g., confidence/credible interval), ideally using structured tables or plots. | Table 2 and Table 3 |
| Results of syntheses | 20a | For each synthesis, briefly summarise the characteristics and risk of bias among contributing studies. | 7th–10th pages 16th–19th pages |
| 20b | Present results of all statistical syntheses conducted. If meta-analysis was done, present for each the summary estimate and its precision (e.g., confidence/credible interval) and measures of statistical heterogeneity. If comparing groups, describe the direction of the effect. | NA | |
| 20c | Present results of all investigations of possible causes of heterogeneity among study results. | Table 7 | |
| 20d | Present results of all sensitivity analyses conducted to assess the robustness of the synthesized results. | 9th and 17th pages | |
| Reporting biases | 21 | Present assessments of risk of bias due to missing results (arising from reporting biases) for each synthesis assessed. | Figure 1 |
| Certainty of evidence | 22 | Present assessments of certainty (or confidence) in the body of evidence for each outcome assessed. | Table 8 |
| DISCUSSION | |||
| Discussion | 23a | Provide a general interpretation of the results in the context of other evidence. | 34th–36th pages |
| 23b | Discuss any limitations of the evidence included in the review. | 37th page | |
| 23c | Discuss any limitations of the review processes used. | 37th page | |
| 23d | Discuss implications of the results for practice, policy, and future research. | 36th page | |
| OTHER INFORMATION | |||
| Registration and protocol | 24a | Provide registration information for the review, including register name and registration number, or state that the review was not registered. | 3rd page |
| 24b | Indicate where the review protocol can be accessed, or state that a protocol was not prepared. | 3rd page | |
| 24c | Describe and explain any amendments to information provided at registration or in the protocol. | 3rd page | |
| Support | 25 | Describe sources of financial or non-financial support for the review, and the role of the funders or sponsors in the review. | 38th page |
| Competing interests | 26 | Declare any competing interests of review authors. | 38th page |
| Availability of data, code and other materials | 27 | Report which of the following are publicly available and where they can be found: template data collection forms; data extracted from included studies; data used for all analyses; analytic code; any other materials used in the review. | 3rd–5th page |
References
- Schlesinger, N.; Pillinger, M.H.; Lipsky, P.E. Knowledge of and Stated Adherence to the 2020 American College of Rheumatology Guideline for Gout Management: Results of a Survey of US Rheumatologists. J. Rheumatol. 2025, 52, 77–86. [Google Scholar] [CrossRef]
- FitzGerald, J.D. Gout. Ann. Intern. Med. 2025, 178, ITC33–ITC48. [Google Scholar] [CrossRef] [PubMed]
- So, A.K.; Martinon, F. Inflammation in gout: Mechanisms and therapeutic targets. Nat. Rev. Rheumatol. 2017, 13, 639–647. [Google Scholar] [CrossRef] [PubMed]
- Dalbeth, N.; Gosling, A.L.; Gaffo, A.; Abhishek, A. Gout. Lancet 2021, 397, 1843–1855. [Google Scholar] [CrossRef] [PubMed]
- Chen-Xu, M.; Yokose, C.; Rai, S.K.; Pillinger, M.H.; Choi, H.K. Contemporary Prevalence of Gout and Hyperuricemia in the United States and Decadal Trends: The National Health and Nutrition Examination Survey, 2007-2016. Arthritis Rheumatol. 2019, 71, 991–999. [Google Scholar] [CrossRef]
- Singh, J.A.; Gaffo, A. Gout epidemiology and comorbidities. Semin. Arthritis Rheum. 2020, 50, S11–S16. [Google Scholar] [CrossRef]
- Asghari, K.M.; Zahmatyar, M.; Seyedi, F.; Motamedi, A.; Zolfi, M.; Alamdary, S.J.; Fazlollahi, A.; Shamekh, A.; Mousavi, S.E.; Nejadghaderi, S.A.; et al. Gout: Global epidemiology, risk factors, comorbidities and complications: A narrative review. BMC Musculoskelet. Disord. 2024, 25, 1047. [Google Scholar] [CrossRef]
- Kuo, C.F.; Grainge, M.J.; Zhang, W.; Doherty, M. Global epidemiology of gout: Prevalence, incidence and risk factors. Nat. Rev. Rheumatol. 2015, 11, 649–662. [Google Scholar] [CrossRef]
- Dalbeth, N.; Phipps-Green, A.; Frampton, C.; Neogi, T.; Taylor, W.J.; Merriman, T.R. Relationship between serum urate concentration and clinically evident incident gout: An individual participant data analysis. Ann. Rheum. Dis. 2018, 77, 1048–1052. [Google Scholar] [CrossRef]
- Feig, D.I.; Kang, D.H.; Johnson, R.J. Uric acid and cardiovascular risk. N. Engl. J. Med. 2008, 359, 1811–1821. [Google Scholar] [CrossRef]
- Mdivnishvili, M.; Kharebashvili, M.; Chumburidze, V.; Nadaraia, K.; Gujejiani, L.; Virkovi, K. The Impact of Hyperuricemia on the Progression of Atherosclerotic Cardiovascular Disease. Cureus 2025, 17, e94371. [Google Scholar] [CrossRef]
- Piani, F.; Annesi, L.; Borghi, C. New Insights into Uric Acid Metabolism in the Pathophysiology of Ischaemic Heart Disease. Eur. Cardiol. 2025, 20, e18. [Google Scholar] [CrossRef] [PubMed]
- Chrysant, S.G. Association of hyperuricemia with cardiovascular diseases: Current evidence. Hosp. Pract. 2023, 51, 54–63. [Google Scholar] [CrossRef] [PubMed]
- Ali, N. Serum Uric Acid as a Mediator of Insulin Resistance: Molecular Mechanisms and Metabolic Pathways. Endocrinol. Diabetes Metab. 2026, 9, e70163. [Google Scholar] [CrossRef] [PubMed]
- Copur, S.; Demiray, A.; Kanbay, M. Uric acid in metabolic syndrome: Does uric acid have a definitive role? Eur. J. Intern. Med. 2022, 103, 4–12. [Google Scholar] [CrossRef]
- Fan, J.; Bian, C.; Wang, J.; Wang, X.; Cheng, Y.; Lei, J. Correlation Between Metabolic Syndrome and Hyperuricemia: A Systematic Review and Meta-analysis. Am. J. Hypertens. 2025, 38, 485–497. [Google Scholar] [CrossRef]
- Calvo-Aranda, E.; Barrio Nogal, L.; Blanco Caceres, B.A.; Peiteado, D.; Novella-Navarro, M.; De Miguel, E.; Arroyo Palomo, J.; Alcázar Arroyo, R.; Martín Navarro, J.A.; Fernandez Lucas, M.; et al. Preclinical gout is common in the patient with stage 3-5 chronic kidney disease. Relevance of musculoskeletal ultrasound. Nefrol. (Engl. Ed.) 2024, 44, 877–884. [Google Scholar] [CrossRef]
- Moszczuk, B.; Życińska, K.; Mucha, K. Asymptomatic Hyperuricemia: A Nephro-Rheumatological Perspective. Arch. Immunol. Ther. Exp. 2024, 72. [Google Scholar] [CrossRef]
- Barnini, C.; Russo, E.; Leoncini, G.; Ghinatti, M.C.; Macciò, L.; Piaggio, M.; Viazzi, F.; Pontremoli, R. Asymptomatic Hyperuricemia and the Kidney: Lessons from the URRAH Study. Metabolites 2025, 15, 11. [Google Scholar] [CrossRef]
- Lee, T.H.; Chen, J.J.; Wu, C.Y.; Yang, C.W.; Yang, H.Y. Hyperuricemia and Progression of Chronic Kidney Disease: A Review from Physiology and Pathogenesis to the Role of Urate-Lowering Therapy. Diagnostics 2021, 11, 1674. [Google Scholar] [CrossRef]
- Corradi, V.; Gastaldon, F.; Caprara, C.; Giuliani, A.; Martino, F.; Ferrari, F.; Ronco, C. Predictors of rapid disease progression in autosomal dominant polycystic kidney disease. Minerva Med. 2017, 108, 43–56. [Google Scholar] [CrossRef]
- Arias-Sánchez, C.; Pérez-Olmos, A.; Reverte, V.; Hernández, I.; Cuevas, S.; Llinás, M.T. Uric Acid and Preeclampsia: Pathophysiological Interactions and the Emerging Role of Inflammasome Activation. Antioxidants 2025, 14, 928. [Google Scholar] [CrossRef] [PubMed]
- Colmenares-Mejia, C.C.; Quintero-Lesmes, D.C.; Bautista-Niño, P.K.; Guío, E.; Paez, M.C.; Beltrán, M.; Williams, D.; Gray, K.J.; Casas, J.P.; Serrano, N.C. Uric acid and risk of pre-eclampsia: Results from a large case-control study and meta-analysis of prospective studies. Sci. Rep. 2023, 13, 3018. [Google Scholar] [CrossRef] [PubMed]
- Piccoli, G.B.; Cabiddu, G.; Attini, R.; Gerbino, M.; Todeschini, P.; Perrino, M.L.; Manzione, A.M.; Piredda, G.B.; Gnappi, E.; Caputo, F.; et al. Pregnancy outcomes after kidney graft in Italy: Are the changes over time the result of different therapies or of different policies? A nationwide survey (1978–2013). Nephrol. Dial. Transplant. 2016, 31, 1957–1965. [Google Scholar] [CrossRef] [PubMed]
- Kang, D.H.; Ha, S.K. Uric Acid Puzzle: Dual Role as Anti-oxidantand Pro-oxidant. Electrolyte Blood Press. 2014, 12, 1–6. [Google Scholar] [CrossRef]
- Deng, Y.; Liu, F.; Yang, X.; Xia, Y. The Key Role of Uric Acid in Oxidative Stress, Inflammation, Fibrosis, Apoptosis, and Immunity in the Pathogenesis of Atrial Fibrillation. Front. Cardiovasc. Med. 2021, 8, 641136. [Google Scholar] [CrossRef]
- Harlacher, E.; Wollenhaupt, J.; Baaten, C.; Noels, H. Impact of Uremic Toxins on Endothelial Dysfunction in Chronic Kidney Disease: A Systematic Review. Int. J. Mol. Sci. 2022, 23, 531. [Google Scholar] [CrossRef]
- Maruhashi, T.; Hisatome, I.; Kihara, Y.; Higashi, Y. Hyperuricemia and endothelial function: From molecular background to clinical perspectives. Atherosclerosis 2018, 278, 226–231. [Google Scholar] [CrossRef]
- Zou, M.; Tang, D.; Liu, F.; Guan, F. Research Progress on the Relationship Between Serum Uric Acid Levels and Coagulation Dysfunction in Preeclampsia. Int. J. Womens Health 2025, 17, 5007–5015. [Google Scholar] [CrossRef]
- Hyndman, D.; Liu, S.; Miner, J.N. Urate Handling in the Human Body. Curr. Rheumatol. Rep. 2016, 18, 34. [Google Scholar] [CrossRef]
- Singh, A.K.; Durairajan, S.S.K.; Iyaswamy, A.; Williams, L.L. Elucidating the role of gut microbiota dysbiosis in hyperuricemia and gout: Insights and therapeutic strategies. World J. Gastroenterol. 2024, 30, 4404–4410. [Google Scholar] [CrossRef]
- Baharuddin, B. The Impact of Fructose Consumption on Human Health: Effects on Obesity, Hyperglycemia, Diabetes, Uric Acid, and Oxidative Stress With a Focus on the Liver. Cureus 2024, 16, e70095. [Google Scholar] [CrossRef] [PubMed]
- Faienza, M.F.; Cognetti, E.; Farella, I.; Antonioli, A.; Tini, S.; Antoniotti, V.; Prodam, F. Dietary fructose: From uric acid to a metabolic switch in pediatric metabolic dysfunction-associated steatotic liver disease. Crit. Rev. Food Sci. Nutr. 2025, 65, 4583–4598. [Google Scholar] [CrossRef] [PubMed]
- Ben Salem, C.; Slim, R.; Fathallah, N.; Hmouda, H. Drug-induced hyperuricaemia and gout. Rheumatology 2017, 56, 679–688. [Google Scholar] [CrossRef] [PubMed]
- Li, Y.; Sato, M.; Yanagisawa, Y.; Mamada, H.; Fukushi, A.; Mikami, K.; Shirasaka, Y.; Tamai, I. Effects of angiotensin II receptor blockers on renal handling of uric acid in rats. Drug Metab. Pharmacokinet. 2008, 23, 263–270. [Google Scholar] [CrossRef]
- Liu, C.; Zhen, Y.; Zhao, Q.; Zhai, J.L.; Liu, K.; Zhang, J.X. Prednisone lowers serum uric acid levels in patients with decompensated heart failure by increasing renal uric acid clearance. Can. J. Physiol. Pharmacol. 2016, 94, 797–800. [Google Scholar] [CrossRef]
- Louthrenoo, W.; Hongsongkiat, S.; Kasitanon, N.; Wangkaew, S.; Jatuworapruk, K. Effect of Antituberculous Drugs on Serum Uric Acid and Urine Uric Acid Excretion. J. Clin. Rheumatol. 2015, 21, 346–348. [Google Scholar] [CrossRef]
- Novikov, A.; Fu, Y.; Huang, W.; Freeman, B.; Patel, R.; van Ginkel, C.; Koepsell, H.; Busslinger, M.; Onishi, A.; Nespoux, J.; et al. SGLT2 inhibition and renal urate excretion: Role of luminal glucose, GLUT9, and URAT1. Am. J. Physiol. Renal Physiol. 2019, 316, F173–F185. [Google Scholar] [CrossRef]
- Pak, C.Y.; Tolentino, R.; Stewart, A.; Galosy, R.A. Enhancement of renal excretion of uric acid during long-term thiazide therapy. Investig. Urol. 1978, 16, 191–193. [Google Scholar]
- Morales, J.M.; Hernández Poblete, G.; Andrés, A.; Prieto, C.; Hernández, E.; Rodicio, J.L. Uric acid handling, pregnancy and cyclosporin in renal transplant women. Nephron 1990, 56, 97–98. [Google Scholar] [CrossRef]
- Stamp, L.; Searle, M.; O’Donnell, J.; Chapman, P. Gout in solid organ transplantation: A challenging clinical problem. Drugs 2005, 65, 2593–2611. [Google Scholar] [CrossRef] [PubMed]
- Chui, B.; Day, R.; Umashankar, E.; Abdel Shaheed, C.; Keogh, A.; Girgis, L.; Penglase, R. Meta-analysis and systematic review of gout prevalence in the heart/lung transplantation population. Front. Transplant. 2024, 3, 1356058. [Google Scholar] [CrossRef] [PubMed]
- Malheiro, J.; Almeida, M.; Fonseca, I.; Martins, L.S.; Pedroso, S.; Dias, L.; Henriques, A.C.; Cabrita, A. Hyperuricemia in adult renal allograft recipients: Prevalence and predictors. Transplant. Proc. 2012, 44, 2369–2372. [Google Scholar] [CrossRef] [PubMed]
- Page, M.J.; McKenzie, J.E.; Bossuyt, P.M.; Boutron, I.; Hoffmann, T.C.; Mulrow, C.D.; Shamseer, L.; Tetzlaff, J.M.; Akl, E.A.; Brennan, S.E.; et al. The PRISMA 2020 statement: An updated guideline for reporting systematic reviews. BMJ 2021, 372, n71. [Google Scholar] [CrossRef]
- Critical Appraisal Skills Programme. CASP Checklists. 2023. Available online: https://casp-uk.net/casp-tools-checklists/ (accessed on 15 September 2025).
- Alper, B.S.; Oettgen, P.; Kunnamo, I.; Iorio, A.; Ansari, M.T.; Murad, M.H.; Meerpohl, J.J.; Qaseem, A.; Hultcrantz, M.; Schünemann, H.J.; et al. Defining certainty of net benefit: A GRADE concept paper. BMJ Open 2019, 9, e027445. [Google Scholar] [CrossRef]
- Najarian, J.S.; Fryd, D.S.; Strand, M.; Canafax, D.M.; Ascher, N.L.; Payne, W.D.; Simmons, R.L.; Sutherland, D.E. A single institution, randomized, prospective trial of cyclosporin versus azathioprine-antilymphocyte globulin for immunosuppression in renal allograft recipients. Ann. Surg. 1985, 201, 142–157. [Google Scholar] [CrossRef]
- West, C.; Carpenter, B.J.; Hakala, T.R. The incidence of gout in renal transplant recipients. Am. J. Kidney Dis. 1987, 10, 369–372. [Google Scholar] [CrossRef]
- Gores, P.F.; Fryd, D.S.; Sutherland, D.E.; Najarian, J.S.; Simmons, R.L. Hyperuricemia after renal transplantation. Am. J. Surg. 1988, 156, 397–400. [Google Scholar] [CrossRef]
- Lin, H.Y.; Rocher, L.L.; McQuillan, M.A.; Schmaltz, S.; Palella, T.D.; Fox, I.H. Cyclosporine-induced hyperuricemia and gout. N. Engl. J. Med. 1989, 321, 287–292. [Google Scholar] [CrossRef]
- Van Thiel, D.H.; Iqbal, M.; Jain, A.; Fung, J.; Todo, S.; Starzl, T.E. Gastrointestinal and metabolic problems associated with immunosuppression with either CyA or FK 506 in liver transplantation. Transplant. Proc. 1990, 22, 37–40. [Google Scholar]
- Burack, D.A.; Griffith, B.P.; Thompson, M.E.; Kahl, L.E. Hyperuricemia and gout among heart transplant recipients receiving cyclosporine. Am. J. Med. 1992, 92, 141–146. [Google Scholar] [CrossRef] [PubMed]
- Jordan, M.L.; Shapiro, R.; Vivas, C.A.; Scantlebury, V.P.; Rhandhawa, P.; Carrieri, G.; McCauley, J.; Demetris, A.J.; Tzakis, A.; Fung, J.J.; et al. FK506 “rescue” for resistant rejection of renal allografts under primary cyclosporine immunosuppression. Transplantation 1994, 57, 860–865. [Google Scholar] [CrossRef] [PubMed]
- Islam, S.I.; Ezeamuzie, C.I.; Shaheen, F.A.; Sheikh, I.A.; Masuda, Q.N.; Khaleel, M.H. The impact of long-term cyclosporin-A therapy on hematological and biochemical profile in renal transplant patients. Int. J. Clin. Pharmacol. Ther. 1995, 33, 315–321. [Google Scholar] [PubMed]
- Hilbrands, L.B.; Hoitsma, A.G.; Wetzels, J.F.; Koene, R.A. Detailed study of changes in renal function after conversion from cyclosporine to azathioprine. Clin. Nephrol. 1996, 45, 230–235. [Google Scholar]
- Hansen, J.M.; Fogh-Andersen, N.; Leyssac, P.P.; Strandgaard, S. Glomerular and tubular function in renal transplant patients treated with and without ciclosporin A. Nephron 1998, 80, 450–457. [Google Scholar] [CrossRef]
- Boots, J.M.; van Duijnhoven, E.M.; Christiaans, M.H.; Nieman, F.H.; van Suylen, R.J.; van Hooff, J.P. Single-center experience with tacrolimus versus cyclosporine-Neoral in renal transplant recipients. Transpl. Int. 2001, 14, 370–383. [Google Scholar] [CrossRef]
- Neal, D.A.; Tom, B.D.; Gimson, A.E.; Gibbs, P.; Alexander, G.J. Hyperuricemia, gout, and renal function after liver transplantation. Transplantation 2001, 72, 1689–1691. [Google Scholar] [CrossRef]
- Schlitt, H.J.; Barkmann, A.; Böker, K.H.; Schmidt, H.H.; Emmanouilidis, N.; Rosenau, J.; Bahr, M.J.; Tusch, G.; Manns, M.P.; Nashan, B.; et al. Replacement of calcineurin inhibitors with mycophenolate mofetil in liver-transplant patients with renal dysfunction: A randomised controlled study. Lancet 2001, 357, 587–591. [Google Scholar] [CrossRef]
- Abdelrahman, M.; Rafi, A.; Ghacha, R.; Youmbissi, J.T.; Qayyum, T.; Karkar, A. Hyperuricemia and gout in renal transplant recipients. Ren. Fail. 2002, 24, 361–367. [Google Scholar] [CrossRef]
- Morales, J.M.; Wramner, L.; Kreis, H.; Durand, D.; Campistol, J.M.; Andres, A.; Arenas, J.; Nègre, E.; Burke, J.T.; Groth, C.G. Sirolimus does not exhibit nephrotoxicity compared to cyclosporine in renal transplant recipients. Am. J. Transplant. 2002, 2, 436–442. [Google Scholar] [CrossRef]
- Pascual, M.; Curtis, J.; Delmonico, F.L.; Farrell, M.L.; Williams, W.W., Jr.; Kalil, R.; Jones, P.; Cosimi, A.B.; Tolkoff-Rubin, N. A prospective, randomized clinical trial of cyclosporine reduction in stable patients greater than 12 months after renal transplantation. Transplantation 2003, 75, 1501–1505. [Google Scholar] [CrossRef] [PubMed]
- Urbizu, J.M.; Zárraga, S.; Gómez-Ullate, P.; Amenábar, J.J.; Gaínza, F.I.; Lampreabe, I.; Virto, J.; Orbe, J. Safety and efficacy of tacrolimus rescue therapy in 55 kidney transplant patients treated with cyclosporine. Transplant. Proc. 2003, 35, 1704–1705. [Google Scholar] [CrossRef]
- Balal, M.; Paydas, S.; Sertdemir, Y.; Karayaylali, I.; Seyrek, N. Effects of cyclosporine and tacrolimus on maintenance therapy after renal transplantation. Adv. Ther. 2004, 21, 186–194. [Google Scholar] [CrossRef] [PubMed]
- Shibolet, O.; Elinav, E.; Ilan, Y.; Safadi, R.; Ashur, Y.; Eid, A.; Zamir, G.; Fridlander, M.; Bdolah-Abram, T.; Shouval, D.; et al. Reduced incidence of hyperuricemia, gout, and renal failure following liver transplantation in comparison to heart transplantation: A long-term follow-up study. Transplantation 2004, 77, 1576–1580. [Google Scholar] [CrossRef] [PubMed]
- Wong, W.; Tolkoff-Rubin, N.; Delmonico, F.L.; Cardarelli, F.; Saidman, S.L.; Farrell, M.L.; Shih, V.; Winkelmayer, W.C.; Cosimi, A.B.; Pascual, M. Analysis of the cardiovascular risk profile in stable kidney transplant recipients after 50% cyclosporine reduction. Clin. Transplant. 2004, 18, 341–348. [Google Scholar] [CrossRef]
- Bumbea, V.; Kamar, N.; Ribes, D.; Esposito, L.; Modesto, A.; Guitard, J.; Nasou, G.; Durand, D.; Rostaing, L. Long-term results in renal transplant patients with allograft dysfunction after switching from calcineurin inhibitors to sirolimus. Nephrol. Dial. Transplant. 2005, 20, 2517–2523. [Google Scholar] [CrossRef]
- Hohage, H.; Welling, U.; Heck, M.; Zeh, M.; Gerhardt, U.; Suwelack, B.M. Conversion from cyclosporine to tacrolimus after renal transplantation improves cardiovascular risk factors. Int. Immunopharmacol. 2005, 5, 117–123. [Google Scholar] [CrossRef]
- Kanbay, M.; Akcay, A.; Huddam, B.; Usluogullari, C.A.; Arat, Z.; Ozdemir, F.N.; Haberal, M. Influence of cyclosporine and tacrolimus on serum uric acid levels in stable kidney transplant recipients. Transplant. Proc. 2005, 37, 3119–3120. [Google Scholar] [CrossRef]
- Paydaş, S.; Balal, M.; Sertdemir, Y.; Seyrek, N.; Karayaylali, I. Long-term comparative results of C0 and C2 monitoring of CyA in renal transplanted patients. Ren. Fail. 2005, 27, 409–413. [Google Scholar] [CrossRef]
- White, M.; Haddad, H.; Leblanc, M.H.; Giannetti, N.; Pflugfelder, P.; Davies, R.; Isaac, D.; Burton, J.; Chan, M.; Azevedo, E.; et al. Conversion from cyclosporine microemulsion to tacrolimus-based immunoprophylaxis improves cholesterol profile in heart transplant recipients with treated but persistent dyslipidemia: The Canadian multicentre randomized trial of tacrolimus vs cyclosporine microemulsion. J. Heart Lung Transplant. 2005, 24, 798–809. [Google Scholar] [CrossRef]
- Chen, J.; Li, L.; Wen, J.; Tang, Z.; Ji, S.; Sha, G.; Cheng, Z.; Sun, Q.; Cheng, D.; Liu, Z. Observation of efficacy and safety of converting the calcineurin inhibitor to sirolimus in renal transplant recipients with chronic allograft nephropathy. Transplant. Proc. 2008, 40, 1411–1415. [Google Scholar] [CrossRef]
- Pons, J.A.; Ramírez, P.; Revilla-Nuin, B.; Pascual, D.; Baroja-Mazo, A.; Robles, R.; Sanchez-Bueno, F.; Martinez, L.; Parrilla, P. Immunosuppression withdrawal improves long-term metabolic parameters, cardiovascular risk factors and renal function in liver transplant patients. Clin. Transplant. 2009, 23, 329–336. [Google Scholar] [CrossRef]
- Sessa, A.; Esposito, A.; Giliberti, A.; Iavicoli, G.; Costa, C.; Bergallo, M.; Lettieri, E.; Rossano, R.; Capuano, M. Immunosuppressive agents and metabolic factors of cardiovascular risk in renal transplant recipients. Transplant. Proc. 2009, 41, 1178–1182. [Google Scholar] [CrossRef] [PubMed]
- Seymen, P.; Yildiz, M.; Türkmen, M.F.; Titiz, M.I.; Seymen, H.O. Effects of cyclosporine-tacrolimus switching in posttransplantation hyperlipidemia on high-density lipoprotein 2/3, lipoprotein a1/b, and other lipid parameters. Transplant. Proc. 2009, 41, 4181–4183. [Google Scholar] [CrossRef] [PubMed]
- Claes, K.; Meier-Kriesche, H.U.; Schold, J.D.; Vanrenterghem, Y.; Halloran, P.F.; Ekberg, H. Effect of different immunosuppressive regimens on the evolution of distinct metabolic parameters: Evidence from the Symphony study. Nephrol. Dial. Transplant. 2012, 27, 850–857. [Google Scholar] [CrossRef] [PubMed]
- Einollahi, B.; Einollahi, H.; Nafar, M.; Rostami, Z. Prevalence and risk factors of hyperuricemia among kidney transplant recipients. Indian J. Nephrol. 2013, 23, 201–205. [Google Scholar] [CrossRef]
- Faulhaber, M.; Mäding, I.; Malehsa, D.; Raggi, M.C.; Haverich, A.; Bara, C.L. Steroid withdrawal and reduction of cyclosporine A under mycophenolate mofetil after heart transplantation. Int. Immunopharmacol. 2013, 15, 712–717. [Google Scholar] [CrossRef]
- Harada, S.; Nakamura, T.; Ushigome, H.; Akutsu, N.; Akioka, K.; Nakatani, T.; Yoshimura, N. Beneficial Effects of High-Dose Mizoribine on ABO-Incompatible Living-Related Kidney Transplantation: Two-Year Results by a Japanese Multicenter Study. Transplant. Proc. 2017, 49, 967–970. [Google Scholar] [CrossRef]
- Azizzadeh, L.; Fazeli, S.A.; Hashemian, F.; Dehghani, S.; Ahmadi, S.S.; Pourmand, G. Early Conversion to Tacrolimus Vs Cyclosporine Continuation in Normally Functioning Kidney Allograft: A Single-Center Study. Iran. J. Pharm. Res. 2020, 19, 556–571. [Google Scholar] [CrossRef]
- Atbee, M.Y.N.A.; Tuama, H.S. Correlating Levels Of Cyclosporine Drug And Clinical Presentations In Renal Transplant Patients: An Approach To Understand Drug Induced Adverse Effects. J. Pharm. Negat. Results 2022, 13, 1165–1171. Available online: https://www.pnrjournal.com/index.php/home/article/view/2848 (accessed on 15 September 2025).
- White, M.; Ross, H.; Haddad, H.; LeBlanc, M.H.; Racine, N.; Pflugfelder, P.; Giannetti, N.; Davies, R.; Azevedo, E.; Isaac, D.; et al. Subclinical inflammation and prothrombotic state in heart transplant recipients: Impact of cyclosporin microemulsion vs. tacrolimus. Transplantation 2006, 82, 763–770. [Google Scholar] [CrossRef]
- Perico, N.; Codreanu, I.; Caruso, M.; Remuzzi, G. Hyperuricemia in kidney transplantation. Contrib. Nephrol. 2005, 147, 124–131. [Google Scholar] [CrossRef] [PubMed]
- Ahn, K.J.; Kim, Y.S.; Lee, H.C.; Park, K.; Huh, K.B. Cyclosporine-induced hyperuricemia after renal transplant: Clinical characteristics and mechanisms. Transplant. Proc. 1992, 24, 1391–1392. [Google Scholar] [PubMed]
- Hoyer, P.F.; Lee, I.J.; Oemar, B.S.; Krohn, H.P.; Offner, G.; Brodehl, J. Renal handling of uric acid under cyclosporin A treatment. Pediatr. Nephrol. 1988, 2, 18–21. [Google Scholar] [CrossRef] [PubMed]
- Marcén, R.; Gallego, N.; Orofino, L.; Gámez, C.; Estepa, M.R.; Sabater, J.; Teruel, J.L.; Ortuño, J. Impairment of tubular secretion of urate in renal transplant patients on cyclosporine. Nephron 1995, 70, 307–313. [Google Scholar] [CrossRef]
- Zürcher, R.M.; Bock, H.A.; Thiel, G. Hyperuricaemia in cyclosporin-treated patients: GFR-related effect. Nephrol. Dial. Transplant. 1996, 11, 153–158. [Google Scholar] [CrossRef]
- Johnson, R.J.; Nakagawa, T.; Jalal, D.; Sánchez-Lozada, L.G.; Kang, D.H.; Ritz, E. Uric acid and chronic kidney disease: Which is chasing which? Nephrol. Dial. Transplant. 2013, 28, 2221–2228. [Google Scholar] [CrossRef]
- Anzai, N.; Enomoto, A.; Endou, H. Renal urate handling: Clinical relevance of recent advances. Curr. Rheumatol. Rep. 2005, 7, 227–234. [Google Scholar] [CrossRef]
- Bobulescu, I.A.; Moe, O.W. Renal transport of uric acid: Evolving concepts and uncertainties. Adv. Chronic Kidney Dis. 2012, 19, 358–371. [Google Scholar] [CrossRef]
- Lipkowitz, M.S. Regulation of uric acid excretion by the kidney. Curr. Rheumatol. Rep. 2012, 14, 179–188. [Google Scholar] [CrossRef]
- Ghanem, O.M.; Pita, A.; Nazzal, M.; Johnson, S.; Diwan, T.; Obeid, N.R.; Croome, K.P.; Lim, R.; Quintini, C.; Whitson, B.A.; et al. Obesity, organ failure, and transplantation: A review of the role of metabolic and bariatric surgery in transplant candidates and recipients. Surg. Endosc. 2024, 38, 4138–4151. [Google Scholar] [CrossRef] [PubMed]
- Hinze, C.; Berliner, D.; Görler, A.; Taubert, R.; Gottlieb, J. Medical follow-up after solid organs transplantation. Inn. Med. 2025, 66, 885–895. [Google Scholar] [CrossRef]
- Ortoleva, J.; Dalia, A.; Convissar, D.; Pisano, D.V.; Bittner, E.; Berra, L. Vasoplegia in Heart, Lung, or Liver Transplantation: A Narrative Review. J. Cardiothorac. Vasc. Anesth. 2025, 39, 988–1003. [Google Scholar] [CrossRef] [PubMed]
- Leung, N.; Heybeli, C. Kidney Transplantation in Multiple Myeloma and Monoclonal Gammopathy of Renal Significance. Semin. Nephrol. 2024, 44, 151497. [Google Scholar] [CrossRef]
- Milan Manani, S.; Virzì, G.M.; Giuliani, A.; Clementi, A.; Brocca, A.; Dissegna, D.; Martino, F.; d’’Amore, E.S.G.; Ronco, C. Hemolytic Uremic Syndrome and Kidney Transplantation: A Case Series and Review of the Literature. Nephron 2017, 136, 245–253. [Google Scholar] [CrossRef]
- Yu, K.; Peng, B.; Zhao, D.; Wang, Y. Danon disease: Two case reports and literature review. Medicine 2026, 105, e46993. [Google Scholar] [CrossRef]
- Desai, J.; Okeke, R.I.; Desai, R.; Zhang, Z.; Engelhardt, A.; Schnitzler, M.; Barron, J.; Varma, C.R.; Randall, H.B.; Lentine, K.L.; et al. Pre-transplant Loco-Regional Therapy for Hepatocellular Carcinoma and Post-transplant Outcomes: A National Study. Cureus 2024, 16, e67960. [Google Scholar] [CrossRef]
- Corradi, V.; Martino, F.; Gastaldon, F.; Scalzotto, E.; Caprara, C.; Fortunato, A.; Pinaffo, G.; Marchetti, C.; Fabbi, F.; Giavarina, D.; et al. Copeptin levels and kidney function in ADPKD: Case-control study. Clin. Nephrol. 2016, 86, 147–153. [Google Scholar] [CrossRef]
- Gueta, I.; Markovits, N.; Yarden-Bilavsky, H.; Raichlin, E.; Freimark, D.; Lavee, J.; Loebstein, R.; Peled, Y. Intrapatient variability in tacrolimus trough levels after solid organ transplantation varies at different postoperative time periods. Am. J. Transplant. 2019, 19, 611. [Google Scholar] [CrossRef]
- Ibáñez-García, S.; Zataraín-Nicolás, E.; García-González, X.; Rodríguez-Ferrero, M.L.; Fernández-Yáñez, J.; Fernández-Avilés Díaz, F.J.; Sanjurjo Sáez, M. Levels of tacrolimus after treatment for chronic hepatitis C with direct antiviral agents in solid organ transplant recipients. Int. J. Clin. Pharm. 2021, 43, 731–736. [Google Scholar] [CrossRef]
- Kim, O.H.; Shim, T.S.; Jo, K.W. Drug-level change and optimal dose adjustment of tacrolimus with the use of rifabutin for treating mycobacterial disease in solid organ transplant recipients. Transpl. Infect. Dis. 2022, 24, e13893. [Google Scholar] [CrossRef] [PubMed]
- Thölking, G.; Gerth, H.U.; Schuette-Nuetgen, K.; Reuter, S. Influence of tacrolimus metabolism rate on renal function after solid organ transplantation. World J. Transplant. 2017, 7, 26–33. [Google Scholar] [CrossRef] [PubMed]
- Chanard, J.; Toupance, O.; Lavaud, S.; Hurault de Ligny, B.; Bernaud, C.; Moulin, B. Amlodipine reduces cyclosporin-induced hyperuricaemia in hypertensive renal transplant recipients. Nephrol. Dial. Transplant. 2003, 18, 2147–2153. [Google Scholar] [CrossRef] [PubMed]
- Chewcharat, A.; Chang, Y.T.; Thongprayoon, C.; Crisafio, A.; Bathini, T.; Mao, M.A.; Cheungpasitporn, W. Efficacy and safety of febuxostat for treatment of asymptomatic hyperuricemia among kidney transplant patients: A meta-analysis of observational studies. Clin. Transplant. 2020, 34, e13820. [Google Scholar] [CrossRef]
- del Castillo, D.; Campistol, J.M.; Guirado, L.; Capdevilla, L.; Martínez, J.G.; Pereira, P.; Bravo, J.; Pérez, R. Efficacy and safety of losartan in the treatment of hypertension in renal transplant recipients. Kidney Int. 1998, 68, S135–S139. [Google Scholar] [CrossRef]
- Lusco, M.A.; Fogo, A.B.; Najafian, B.; Alpers, C.E. AJKD Atlas of Renal Pathology: Calcineurin Inhibitor Nephrotoxicity. Am. J. Kidney Dis. 2017, 69, e21–e22. [Google Scholar] [CrossRef]
- Demirci, H.; Popovic, S.; Dittmayer, C.; Yilmaz, D.E.; El-Shimy, I.A.; Mülleder, M.; Hinze, C.; Su, M.; Mertins, P.; Kirchner, M.; et al. Immunosuppression with cyclosporine versus tacrolimus shows distinctive nephrotoxicity profiles within renal compartments. Acta Physiol. 2024, 240, e14190. [Google Scholar] [CrossRef]
- Zhuang, Y.; Ding, G.; Zhao, M.; Bai, M.; Yang, L.; Ni, J.; Wang, R.; Jia, Z.; Huang, S.; Zhang, A. NLRP3 inflammasome mediates albumin-induced renal tubular injury through impaired mitochondrial function. J. Biol. Chem. 2014, 289, 25101–25111. [Google Scholar] [CrossRef]
- Cheng, C.H.; Shu, K.H.; Chang, H.R.; Chou, M.C. Cyclosporine-induced tubular vacuolization: The role of Bip/Grp78. Nephron Exp. Nephrol. 2012, 122, 1–12. [Google Scholar] [CrossRef]
- Sugimoto, K.; Miyazawa, T.; Enya, T.; Miyazaki, K.; Okada, M.; Takemura, T. Cyclosporine A induced histological changes of Cathepsin L and CD2AP expression in renal glomeruli and tubules. Clin. Exp. Nephrol. 2017, 21, 83–91. [Google Scholar] [CrossRef]
- Nankivell, B.J.; P’Ng, C.H.; O’Connell, P.J.; Chapman, J.R. Calcineurin Inhibitor Nephrotoxicity Through the Lens of Longitudinal Histology: Comparison of Cyclosporine and Tacrolimus Eras. Transplantation 2016, 100, 1723–1731. [Google Scholar] [CrossRef]
- Borghi, C.; Agabiti-Rosei, E.; Johnson, R.J.; Kielstein, J.T.; Lurbe, E.; Mancia, G.; Redon, J.; Stack, A.G.; Tsioufis, K.P. Hyperuricaemia and gout in cardiovascular, metabolic and kidney disease. Eur. J. Intern. Med. 2020, 80, 1–11. [Google Scholar] [CrossRef]
- Salari, M.; Yaghoubi, M.A.; Miri, M.; Mehrad-Majd, H.; Hami, M. Association of Metabolic Syndrome and Hyperuricemia in the Recipients of Kidney Transplants: A Single-Center Study. Iran. J. Kidney Dis. 2023, 17, 100–107. [Google Scholar]
- Greco, T.; Zangrillo, A.; Biondi-Zoccai, G.; Landoni, G. Meta-analysis: Pitfalls and hints. Heart Lung Vessel. 2013, 5, 219–225. [Google Scholar]
- Higgins, J.P.; Thompson, S.G.; Deeks, J.J.; Altman, D.G. Measuring inconsistency in meta-analyses. BMJ 2003, 327, 557–560. [Google Scholar] [CrossRef]




| Authors | Year | Study Design | Control Type | Study Timing | Sample Size (n) |
|---|---|---|---|---|---|
| Najarian JS et al. [47] | 1985 | RCT | Parallel control group | Prospective | 230 |
| West C et al. [48] | 1987 | Cohort | Controlled | Retrospective | 243 |
| Gores FP et al. [49] | 1988 | RCT | Parallel control group | Prospective | 246 |
| Lin HY et al. [50] | 1989 | Cross-sectional | Controlled | Cross-sectional | 297 |
| Van Thiel DH et al. [51] | 1990 | Cohort | Historical control | Prospective | 40 |
| Burack DA et al. [52] | 1992 | Cross-sectional | No control group | Cross-sectional | 196 |
| Jordan ML et al. [53] | 1994 | Cohort | Controlled | Retrospective | 77 |
| Islam IS et al. [54] | 1995 | Cohort | Controlled | Retrospective | 26 |
| Hilbrands LB et al. [55] | 1996 | RCT | Parallel control group | Prospective | 21 |
| Hansen JM et al. [56] | 1998 | Cross-sectional | Controlled | Cross-sectional | 111 |
| Boots JMM et al. [57] | 2001 | Cohort | Controlled | Not clearly reported | 128 |
| Neal DA et al. [58] | 2001 | Cohort | Controlled | Retrospective | 134 |
| Schlitt HJ et al. [59] | 2001 | RCT | Parallel control group | Prospective | 28 |
| Abdelrahman M et al. [60] | 2002 | Cohort | No control group | Retrospective | 45 |
| Morales JM et al. [61] | 2002 | RCT | Parallel control group | Prospective | 161 |
| Pascual M et al. [62] | 2003 | RCT | Parallel control group | Prospective | 64 |
| Urbizu JM et al. [63] | 2003 | Cohort | Controlled | Retrospective | 55 |
| Balal M et al. [64] | 2004 | Cohort | Controlled | Prospective | 30 |
| Shibolet O et al. [65] | 2004 | Cohort | Controlled | Retrospective | 122 |
| Wong V et al. [66] | 2004 | RCT | Parallel control group | Prospective | 31 |
| Bumbea V et al. [67] | 2005 | Cohort | Controlled | Prospective | 43 |
| Hohage H et al. [68] | 2005 | Cohort | Controlled | Retrospective | 30 |
| Kanbay M et al. [69] | 2005 | Cohort | Controlled | Retrospective | 155 |
| Paydas S et al. [70] | 2005 | Cohort | Controlled | Prospective | 54 |
| White M et al. [71] | 2005 | RCT | Parallel control group | Prospective | 129 |
| Chen J et al. [72] | 2008 | Cohort | Controlled | Not clearly reported | 16 |
| Pons JA et al. [73] | 2009 | Cohort | Controlled | Prospective | 20 |
| Sessa A et al. [74] | 2009 | Cross-sectional | Controlled | Cross-sectional | 103 |
| Seymen P et al. [75] | 2009 | Cohort | Controlled | Prospective | 15 |
| Claes K et al. * [76] | 2012 | RCT | Parallel control group | Prospective | 1645 |
| Malheiro J et al. [43] | 2012 | Cross-sectional | Controlled | Cross-sectional | 302 |
| Einollahi B et al. [77] | 2013 | Cohort | No control group | Retrospective | 4217 |
| Faulhaber M et al. [78] | 2013 | Cohort | Controlled | Prospective | 23 |
| Harada S et al. [79] | 2017 | Cohort | Controlled | Not clearly reported | 37 |
| Azizzadeh L et al. [80] | 2020 | Cohort | Controlled | Retrospective | 166 |
| Atbee MYNA et al. [81] | 2022 | Cohort | No control group | Prospective | 50 |
| Study ID | Aim and Population | Follow-Up (Months) | Study Groups | Kidney Function | Results |
|---|---|---|---|---|---|
| Within-patient comparisons | |||||
| Hilbrands 1996 [55] | Renal function in first month after KTx | 1 | A: Cyc -> Cyc (N = 9) B: Cyc -> Aza (N = 12) | Cr = A: 1.31 ± 0.28, B: 1.41 ± 0.46 | UA = A: 6.56 ± 1.51 -> 7.06 ± 1.01, p = NS B: 6.56 ± 1.51 -> 5.04 ± 1.01, p = 0.002, A 7.06 ± 1.01, B 5.04 ± 1.01, p < 0.05 |
| Pascual 2003 [62] | Safety after 50% Cyc reduction in KTx | ≥6 | A: Cyc full dose -> 50% Cyc reduction + CS + MMF (N = 32) B: Cyc full dose -> Cyc full dose (levels 100–300 ng/mL) + CS + MMF (N = 32) | Cr < 2 mg/dL | UA = A: 6.9 ± 1.7 -> 6.3 ±1.5, p = 0.04 B: 6.8 ± 1.5 -> 6.9 ±1.6, p = NS |
| Wong 2004 [66] | CV risk after 50% Cyc reduction in KTx | 6 | A: Cyc full dose -> Cyc full dose (N = 15) B: Cyc full dose -> 50% Cyc reduction (N = 16) | Cr = A: 1.33 ± 0.2, B: 1.53 ± 0.23, p = 0.01 | UA = A: 6.7 ± 1.6 -> 7.2 ± 1.5, p = 0.018 B: 6.9 ± 1.7 -> 6.4 ± 1.6, p = 0.013 |
| Bumbea 2005 [67] | Efficacy and safety after conversion from CNI to Sir: in chronic allograft dysfunction KTx | 24 | A: CNI (Cyc, 65%; Tac 35%) -> B: Sir (N = 43) | Cl = 49.4 ± 14.9 | UA = 1 month: A: 7.3 ± 2, B: 6.5 ± 1.8, 1 year: A: 7.3 ± 2, B: 6.4 ± 1.7 2 years: A: 7.3 ± 2, B: 6.7 ± 1.8, p = 0.004 |
| Paydas 2005 (^) [70] | Effects of C0 vs. C2 Cyc monitoring in KTx | 36 | Ac: C0 -> Bc: C2 (N = 12) | Cl = A: 72.31 ± 23.1, B: 78.73 ± 22.42, p = 0.621 | UA = 12 months: Ac: 8.9 ± 0.7 -> Bc: 6.9 ± 0.4, p = 0.015 36 months: Ac: 8.9 ± 0.7 -> Bc: 7.1 ± 0.5, p = 0.011 |
| Chen 2008 [72] | Effect of Conversion from CNI to Sir in KTx with chronic allograft nephropathy | 12 | A: CNI -> B: Sir (N = 16) | Median Cr = 3.2 | UA = A: 7 ± 2.25 B: after 3 months: 6.8 ± 2.3, after 6 months: 6.3 ± 0.9, after 12 months: 6.5 ± 1.36, p = NS |
| Faulhaber 2013 [78] | CS withdrawal and Cyc reduction in HTx | 24 | A: Cyc + CS -> B: Cyc reduction (level of 50–90 ng/mL) + MMF (N = 23) | Cr < 3.5 mg/dL | UA = A: 7.6 ± 1.7 -> B: 5.9 ± 1, p < 0.001 |
| Between-group comparisons | |||||
| Najarian 1985 [47] | Side effects of immunosuppressor in KTx | 3–36 | A: Cyc + CS (N = 121) B: Aza + CS + Anti-Ly (N = 109) | Cr = A:1.9 ± 06, B: 1.5 ± 0.4, p < 0.001 | HU = A: 52%, B: 11%, p < 0.001 |
| West 1987 [48] | Prevalence of gout and HU in KTx | ≥12 | A: Cyc + CS (N = 211) B: Aza + CS (N = 32) | Cr = A: 2.4 ± 1.07, B: 2.5 ± 1.25, p = NS | HU = 55.5% of A vs. 25% of B, p < 0.01 |
| Lin 1989 [50] | Prevalence and mechanism of HU in KTx | Not applicable | A: Cyc (N = 129) B: Aza(N = 168) | Cr = A: 1.8 ± 0.1, B: 1.4 ± 0.1, p = 0.0001 |
UA = A: 9.0 ± 0.2 B: 6.6 ± 0.1, p = 0.001
HU: A: 79.8%, B: 30.2%, p < 0.001 Diuretics increase HU prevalence in both groups |
| Burack 1992 [52] | Prevalence of HU and gout in HTx | 5–29 | A: Gout (N = 14) B: Probable gout (N = 7) C: No gout (N = 157) | Cr > 1.4 mg/dL in 34% of patients | HU = ♀: 81%, ♂: 72%, A: 100% were in Cyc, and diuretics B: 100% were in Cyc, and diuretics C: 99% were in Cyc, and 95% in diuretics |
| Islam 1995 [54] | Long-term Cyc biochemical effects in KTx | ≥48 | A: Cyc + Aza + CS (N = 13) B: Aza + CS (N = 13) | Not reported | UA = A: 6.56 ± 1.88, B: 5.5 ± 1.48, p < 0.05 |
| Hilbrands 1996 [55] | Renal function in first month after KTx | 1 | A: Cyc (N = 9) B: Cyc -> Aza (N = 12) | Cr = A: 1.31 ± 0.28, B: 1.41 ± 0.46 | UA = A 7.06 ± 1.01, B 5.04 ± 1.01, p < 0.05 |
| Gores 1988 [49] | HU after KTx | 48 | A: Cyc + CS (N = 131) B: Aza + CS + Anti-Ly (N = 115) | Cr < 2 | HU = A: 96 (73%), B: 87 (54%), p < 0.05. Severe HU: A: 13 (10%), B: 0 (0%), p < 0.002. |
| Hansen 1998 [56] | Effect of low-dose Cyc on tubular function in KTx | Not applicable | A: Cyc (levels < 125 umol/L) (N = 32) B: Cyc with (levels 125–180 umol/L) (N = 16) C: Aza (N = 19) D: Control (N = 34) | Cr < 2 | UA = A: 7.23 ± 1.5, B: 8.41 ± 2, p < 0.05 A: 7.23 ± 1.5, D: 4.9 ± 0.5, p < 0.05 B: 8.41 ± 2, C: 6.7 ± 1.2, p < 0.05 B: 8.41 ± 2, D: 4.9 ± 0.5, p < 0.05 C: 6.7 ± 1.2, D: 4.9 ± 0.5, p < 0.05 Cl related to UA-Cl with rho = 0.79, p < 0.001 |
| Schlitt 2001 [59] | Effect of CNI withdrawal and MMF replacement in Stable LTx with CNI toxicity | 6 | A: CNI -> MMF (N = 14) B: CNI -> CNI (N = 14) | Cr = A: 1.57 ± 0.18, B: 1.9 ± 0.58 | ΔUA = A: −1.34 (−0.56 to −2.15), B: −0.04 (−0.9 to 1), p < 0.05 |
| Abdelrahman 2002 [60] | Prevalence of HU and associated factors in KTx after at least 12 months | ≥106 | Cyc (N = 43), No Cyc (N = 2) A:HU (N = 25), B: Non-HU (N = 20) | Cr = 1.3 ± 0.3 | HU = 55% UA = A: 9.6 ± 1.4 with Cyc = 212 ± 45 ng/mL, B: 6.5 ± 0.9 with Cyc = 203 ± 41 ng/mL p = NS UA vs. Cyc dose: rho 0.1 p = NS UA vs. time after KTx: rho 0.01 p = NS |
| Morales 2002 [61] | Impact on GFR of Cyc vs. Sir in KTx | 104 | A: Cyc + Aza or MMF (N = 80) B: Sir + Aza or MMF (N = 81) | Cr significantly lower in B | UA = 1 month: A: 6.05 ±0.01, B: 4.54 ± 0.01, p < 0.01 12 months A: 7.4 ± 0.34, B: 5.04 ± 0.34, p < 0.01 104 months: A: 8.1 ± 0.34, B: 5.4 ± 0.34, p < 0.01 HU in the first 3 months: A 65%, B 48.1%, p < 0.05 after 3 months: A 52.4%, B 18.9%, p < 0.04 |
| Paydas 2005 (^) [70] | Effects of C0 vs. C2 Cyc monitoring in KTx | 36 | A: C0 (N = 25) B: C2 (N = 12) | Cl = A: 72.31 ± 23.1, B: 78.73 ± 22.42, p = 0.621 | UA = 1 month: A: 7.94 ± 2.02, B: 6.14 ± 0.66, p = 0.008 6 months: A: 8 ± 2.2, B: 6.26 ± 0.93, p = 0.007 12 months: A: 7.88 ± 1.86, B: 6.1 ± 1.14, p = 0.005 24 months: A: 8.01 ± 1.73, B: 6.31 ± 0.99, p = 0.004 36 months: A: 8.66 ± 1.99, B: 6.82 ± 2.31, p = 0.065 |
| Pons 2009 [73] | Safety of Cyc withdrawal in LTx | 10–132 | A: Tolerant IS withdrawal (N = 8), B: Non-Tolerant IS withdrawal (N = 12) | 35% with Cr > 1.3 | UA = in 8 patients without rejection: 7.2 ± 1.8 -> 5.1 ± 1.1, p < 0.0001 in 12 patients with rejection:7.4 ± 1.6 -> 6.9 ± 1.5, p = 0.108 |
| Claes 2012 [76] | Metabolic parameters after KTx | 12 | A: Standard dose Cyc + MMF (N = 390), B: Low dose Cyc + MMF + CS (N = 399), C: Low dose Tac + MMF + CS (N = 401), D: Low dose Sir + MMF + CS (N = 399) | Not reported | UA = A: 7.2, D: 6, p < 0.05 B: 6.7, D: 6, p < 0.0001 C: 6.6, D: 6, p < 0.0001 |
| Einollahi 2013 [77] | Prevalence and risk factors of HU in KTx | 36 | HU group (N = 1340) No HU group (N = 2877) | Cr = 1.6 ± 0.9 | HU = 31.8% (25%♂ and in 34%♀, p < 0.001) Cyc at C0: OR 1.0, 95%CI 1.002–1.006, p = 0.001 Cyc at C2: OR 0.99, 95%CI 0.998–1.001, p = 0.3 |
| Atbee 2022 [81] | Relationship between Cyc levels and toxicity | 18 | A: Cyc levels: C0 100 to 200 ng/mL (N = 34) B: Cyc levels: C0 > 200 ng/mL (N = 16) | Not reported | HU: A: 6%, B: 28%, p = 0.0001 |
| Study ID | Aim and Population | Follow-Up | Study Groups | Baseline Cr or Cl | Results |
|---|---|---|---|---|---|
| Within-patient comparisons | |||||
| Van Thiel 1990 [51] | Gastrointestinal and metabolic effect of Cyc and Tac after LTx | <1 | Before -> after LTx A: No IS -> Cyc (N = 20) B: No IS -> Tac (N = 20) | Not declared | UA = A: 4.2 ± 0.5 -> 6.2 ± 0.9, p = 0.063 B: 4.5 ± 0.5 -> 7.8 ± 1.0, p = 0.007 A: before LTx 4.2 ± 0.5 vs. B: Before LTx 4.5 ± 0.5, p = NS A: after LTx 6.2 ± 0.9 vs. B: after LTx 7.8 ± 1.0, p = NS |
| Jordan 1994 [53] | Impact of the switch from Cyc to Tac in resistant KTx rejection | 0.5–36 | A: Cyc -> B:Tac (N = 77) | Cr = 2.35 ± 0.97 mg/dL | UA = A: 7.3 ± 2.3, B: 7.1 ± 1.5, p = 0.53 |
| Urbizu 2003 [63] | Efficacy and safety of conversion from Cyc to Tac in KTx | 6–12 | A: Cyc-> B:Tac (N = 55) | Cr stable. Values not reported | UA decreased in B, p = 0.005. Values not reported |
| Hohage 2005 [68] | Effect of a conversion to Tac from Cyc in severely damaged KTx | 36 | A: Cyc (N = 30) B: Tac (N = 30) | Cr = A: 2.9, B: 2.2 | UA = A:7.0 ± 0.1, B:6.4 ± 0.1, p < 0.05 |
| Kanbay 2005 (^) [69] | Effects of Cyc and Tac on UA in KTx | 24 | Cyc -> Tac (N = 35) | Not reported | UA = 8.6 ± 2.8 -> 8.1 ± 1.9, p > 0.05 |
| White 2004 (^) [82] | The impact of the switch from Cyc to Tac in Stable HTx with LDL > 2.5 mmol/L | 6 months | Cyc -> Tac (N = 65) | Cl = A: 65.9 ± 23.8 B: 61.3 ± 9.9, p = NS | Δ = UA at follow-up − UA baseline 1 month: Δ 0.12 ± 0.94 -> 3 month: B: Δ −0.35 ± 1.06-> 6 months: B: Δ −0.5 ± 1.2, not reported |
| Seymen 2009 [75] | Effect of conversion from Cyc to Tac on Hyperlipidemia in KTx | 12 | A: Cyc -> B: Tac (N = 15) | Cr= A: 1.47 ± 0.38, B: 1.5 ± 0.45, p = NS | UA mg/dL: A: 7.61 ± 1.84 B: 6.69 ± 1.35, p = 0.01 |
| Between-group comparisons | |||||
| Boots 2001 [57] | The impact of Tac vs. Cyc on graft function and on CV risk in KTx | 12 | A: Cyc + Pred (N = 74) B: Tac + Pred (N = 54) | Average Cl 47 mL/min A vs. B, p = NS | Fractional UA clearance no significant difference p > 0.25 |
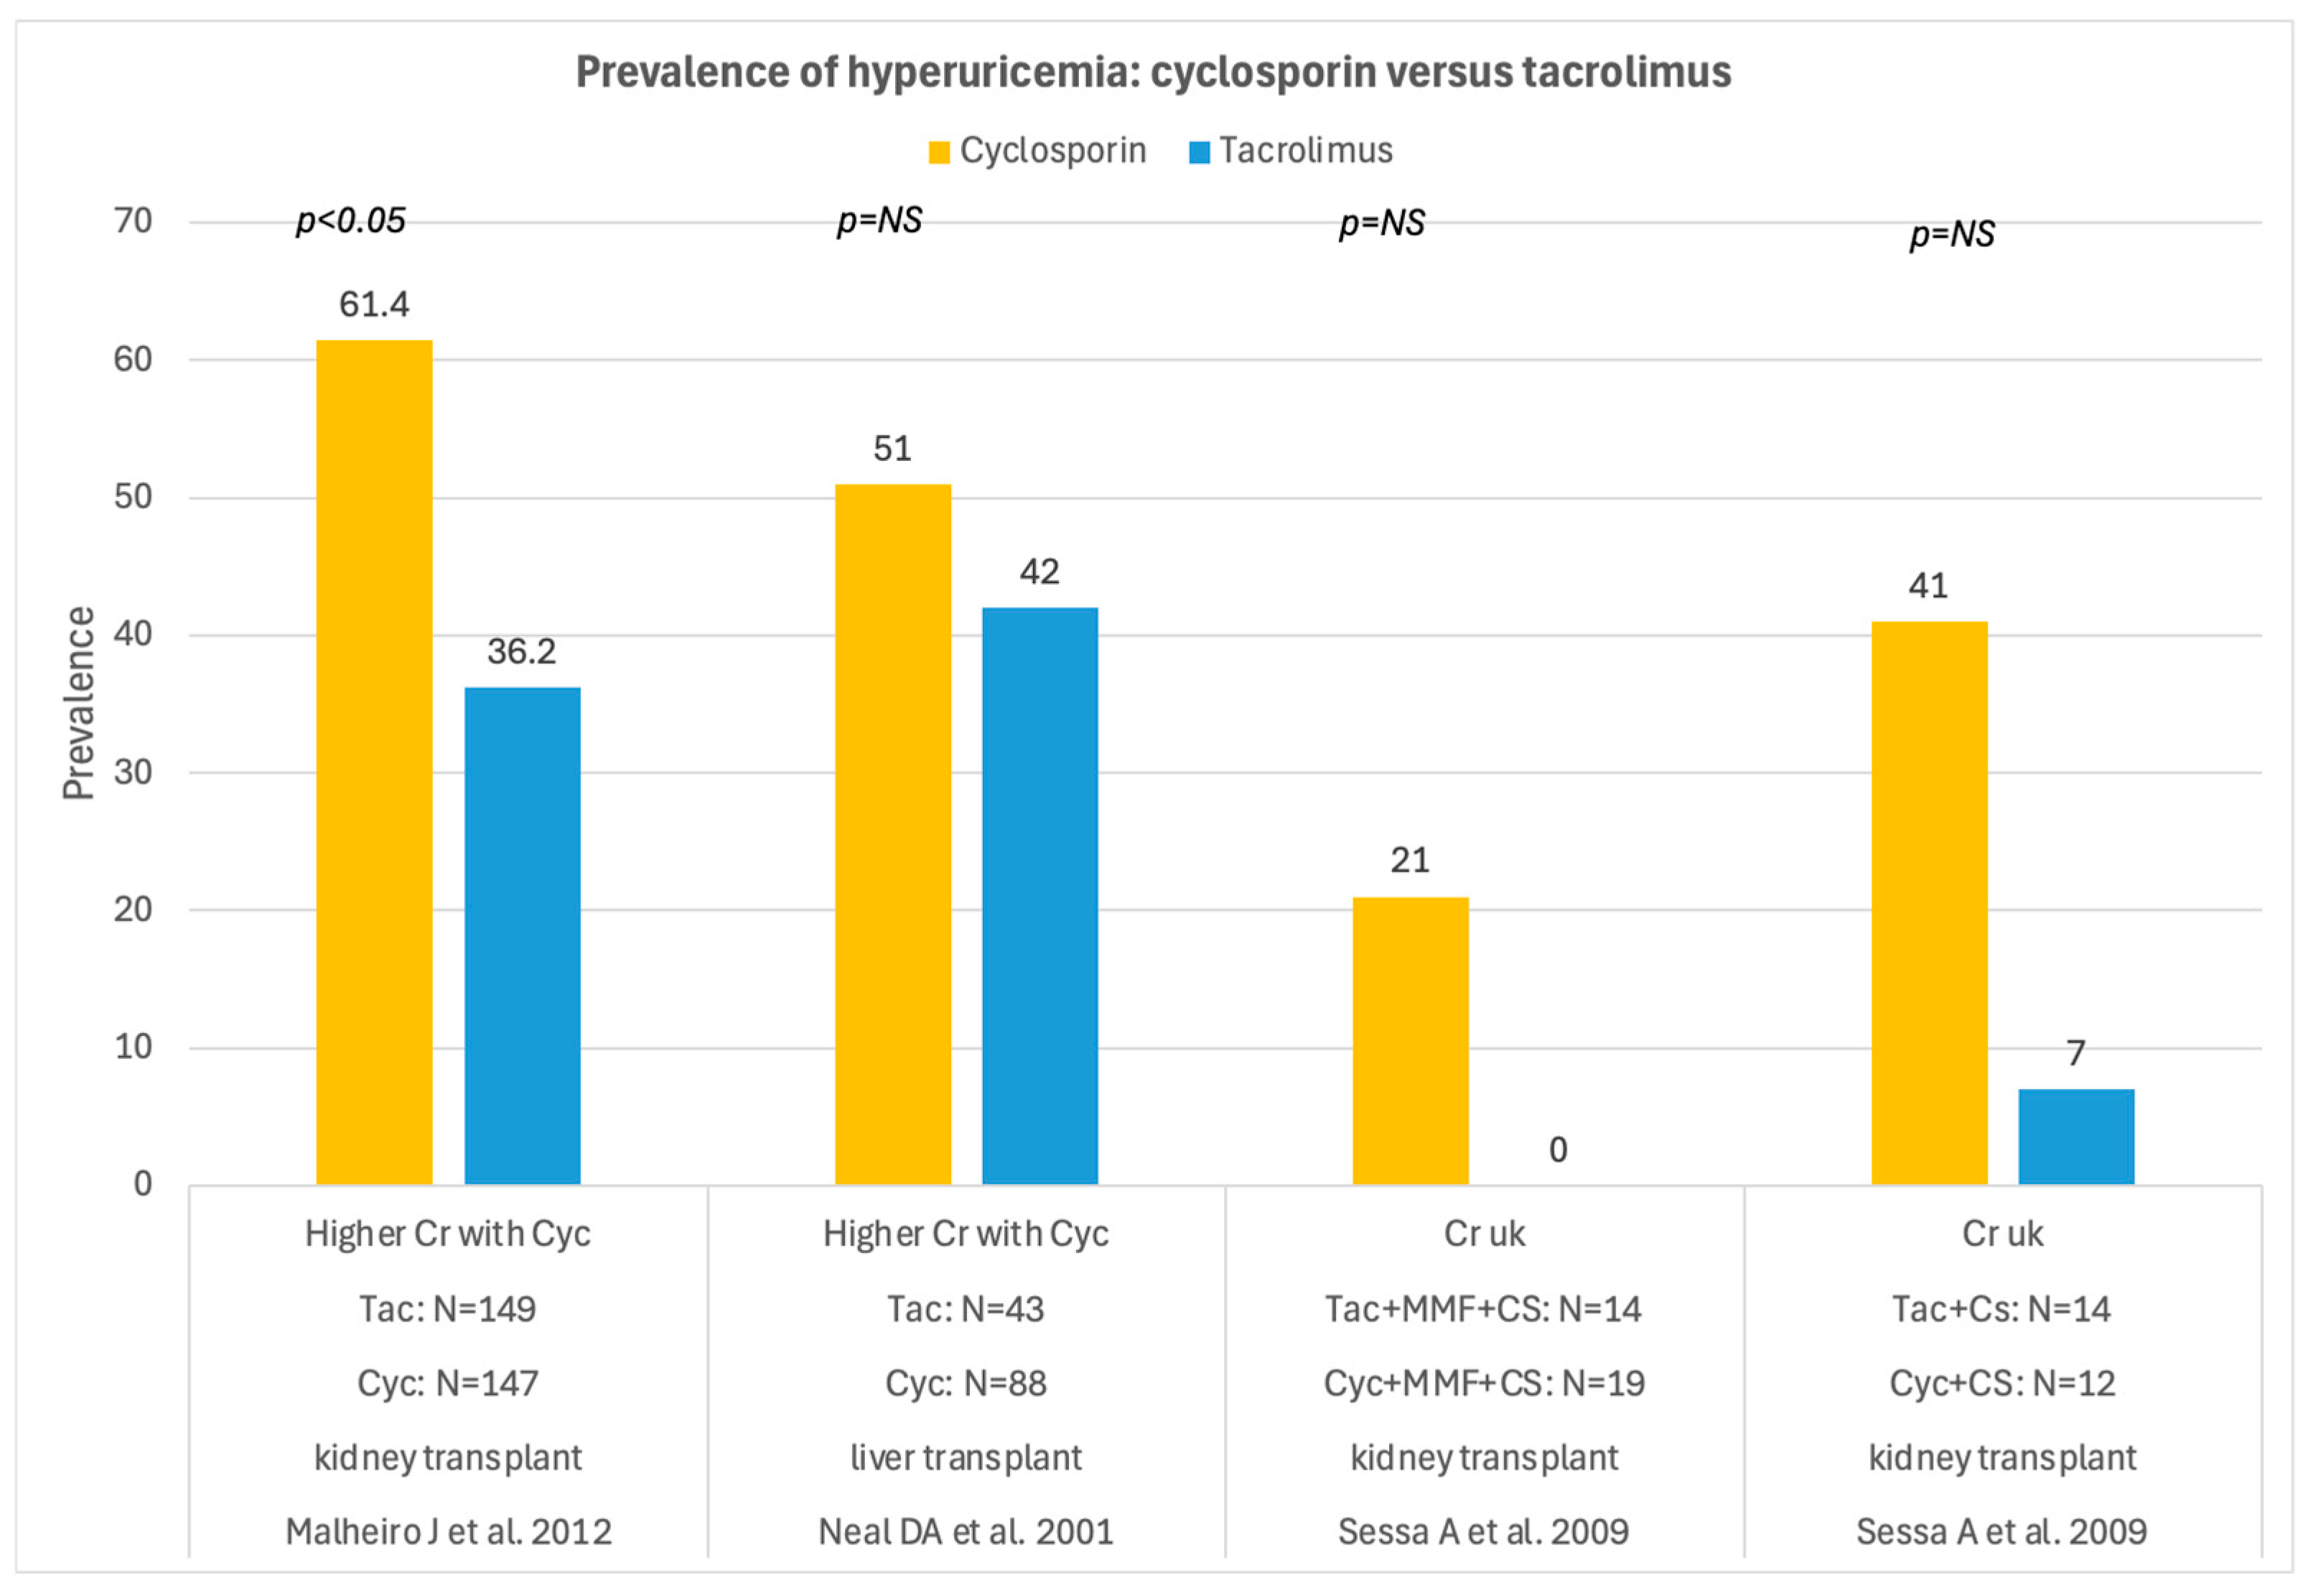
| Neal 2001 [58] | Prevalence of HU in LTx | presumably 48 | A: Cyc (N = 88) B: Tac (N = 43) | In HU: Cr= A: 1.9 ± 0.2, B: 1.54 ± 0.05, p = 0.039 | HU: A: 51%, B: 42%, p = NS |
| Balal 2004 [64] | Comparison of the effects of Tac and Cyc in KTx | 24 | A: Cyc + Pred + MMF or Aza (N = 11) B: Tac + Pred + MMF or Aza (N = 19) | Cl = A: 78.7 ± 22.4, B: 68.6 ± 27.1, p = NS | UA = 1 month: A: 6.1 ± 0.6 B: 5.8 ± 1.6, p = NS 6 months: A: 6.2 ± 0.9, B: 6.1 ± 1.3, p = NS 12 months: A: 6.1 ± 1.1, B: 6.5 ± 1.4, p = NS 24 months: A: 6.3 ± 0.9, B: 6.5 ± 0.8, p = NS |
| Shibolet 2004 [65] | Incidence of HU and gout in HTx and LTx | 36 | A: LTx (N = 75) B: HTx (N = 47) | Cl = A: 61.9 ± 3.9, B: 83.9 ± 4 | HU: A: 85.7%, B: 100%, p = 0.007 Average UA = A: 6.8 ± 0.14, B: 7.6 ± 0.23 p = 0.003 |
| Kanbay 2005 (^) [69] | Effects of Cyc and Tac on UA in KTx | 24 | A: Cyc (N = 73) B: Tac (N = 47) | Not reported | UA = A: 1 month 6.3± 1.6 -> 2 years 7.9 ± 1.98, p < 0.001 B:1 month 6.5 ± 1.8 -> 2 years 8.0 ± 1.8, p < 0.001 |
| Sessa 2009 [74] | Effect of immunosuppressive regimens on cardiovascular risk factors in KTx | Not applicable | A: Tac + MMF + CS (N = 16) B: Tac + MMF (N = 12) C: Tac + CS (N = 14) D: Cyc + MMF + CS (N = 19) E: Cyc + MMF (N = 12) F: Cyc + CS (N = 12) G: Cyc + Eve + CS (N = 10) H: Sir + MMF + CS (N = 8) | Not declared | HU = D: 21%, A: 0%, p = NS E: 33%, H: 8%, p = NS F: 41%, C: 7%, p = NS G: 10%, F: 41%, p = NS G: 10%, D: 21%, p = NS G:10%, H: 62%, p < 0.05 D:21%, H: 62%, p = NS |
| Claes 2012 [76] | Assessment of metabolic syndrome in the first year after KTx | 12 | A: Standard-dose Cyc (N = 390), B: Low-dose Cyc + MMF (N = 399), C: Low dose Tac + MMF (N = 401), | Not reported | Average UA = A: 7.2, B: 6.7, p = NS A: 7.2, C: 6.6, p < 0.05 |
| Malheiro 2012 [43] | Prevalence of HU and associated risk factors in KTx | 91 (27–170) | A: No HU B: HU in Cyc + CS and/or MMF (N = 147, 48.7%) in Tac + CS and/or MMF (N = 149, 49.3%) | Cl= No HU: 57.2 ± 18.8 HU: 44.7 ± 15.4 | In Cyc: A: 39.4%, B: 61.4%, p < 0.001 In Tac: A: 58.9%, B: 36.2%, p < 0.001 Cyc use vs. Tac OR 2.44 (95% CI 1.05–5.7) |
| Harada 2016 [79] | The effects of high-dose MZ with a CNI in ABO incompatible KTx | 24 | A: Cyc (C0 levels < 200 ng/mL) (N = 22) B: Tac (N = 15) | Cr = A: 1.38 ± 0.41 B: 1.26 ± 0.35 p = NS | UA: A: 5.5 ±1.3, B: 6.4 ± 1.2, p = NS |
| Azizzadeh 2020 [80] | Effect of early pre-emptive conversion from Cyc to Tac in KTx | 12 | A: Cyc + MMF + CS (N = 125) B: Conversion to Tac + MMF + CS (N = 41) | Cl = A: 66.15 ± 26.22, B: 67.82 ± 20.93, p = NS | Higher UA in B, p = 0.016 |
| White 2004 (^) [82] | The impact of the switch from Cyc to Tac in Stable HTx with LDL > 2.5 mmol/L | 6 | A: Cyc -> Cyc (N = 64) B: Cyc -> Tac (N = 65) | Cl = A: 65.9 ± 23.8 B: 61.3 ± 9.9, p = NS | UA = Baseline: A: 7.1 ± 1.4, B: 7.2 ± 0.4, p = 0.688 Δ = UA at follow-up − UA baseline 1 month: A: Δ 0.1 ± 0.9, B: Δ 0.12 ± 0.94, p = 0.547 3 month: A: Δ 0.2 ± 0.9, B: Δ −0.35 ± 1.06 p = 0.006 6 months: A: Δ 0.01 ± 1, B: Δ −0.5 ± 1.2 p = 0.017 |
| Study Type | Number of Studies | Average Quality Assessment | Sample Size Range | UA Relevance Score IQR |
|---|---|---|---|---|
| Cross-sectional | 5 | Moderate | 103–302 | 56–60 |
| Retrospective Cohort | 13 | Low-Moderate | 16–4217 | 33–68 |
| Prospective Cohort | 9 | Moderate | 15–50 | 37–58 |
| RCT | 9 | High | 21–1645 | 57–73 |
| ID Study | CASP Quality Assessment | Strengths | Limits | Uric Acid as a Primary Outcome | UA Relevance Score |
|---|---|---|---|---|---|
| Najarian 1985 [47] | High quality | Consistent sample size | Reporting reflects standards of the time, no analysis of uricosuric drugs Not blinded | No | 68 |
| West 1987 [48] | Low quality | Precursor study | Small control group, risk of bias | Yes | 48 |
| Gores 1988 [49] | Moderate quality | RCT | UA levels were not reported; only the prevalence of HU was provided. No data on kidney function | Yes | 62 |
| Lin 1989 [50] | Moderate quality | Early descriptive evidence | Unable to establish temporality or causality. Baseline kidney function differed between groups | Yes | 67 |
| Van Thiel 1990 [51] | Low quality | Small sample size Use of a historical comparison group High risk of bias | No | 37 | |
| Burack 1992 [52] | Moderate quality | Clear objective | Retrospective nature limits control over bias; all patients received Cyc | Yes | 64 |
| Jordan 1994 [53] | Low quality | Conversion strategy clearly described | No randomization; high risk of bias | No | 47 |
| Islam 1995 [54] | Moderate quality | Long-term exposure assessment | Limited methodological details | No | 41 |
| Hilbrands 1996 [55] | Moderate quality | Conversion strategy clearly described | Randomization is questionable given the unequal number of recruited patients (12 vs. 9) and the presence of possible confounding factors | No | 55 |
| Hansen 1998 [56] | Moderate quality | Detailed renal function assessment | Differences between the Cyc and Aza groups were not reported; temporality and causality could not be established | No | 60 |
| Boots 2001 [57] | Low quality | Detailed clinical assessment | Limited description of secondary outcome, especially for UA | No | 37 |
| Neal 2001 [58] | Low quality | Considered uricosuric agents | Retrospective, risk of bias Not designed for the differences in CNI therapy | Yes | 57 |
| Pons 2001 [73] | Moderate quality | Long-term follow-up | Possible confounding factors, such as kidney function changes | No | 52 |
| Schlitt 2001 [59] | Moderate to high quality | Clear study design | Not blinded Limited sample size | No | 57 |
| Seymen 2001 [75] | Low quality | Observational Discrepancy in the conclusion about UA and the results | No | 41 | |
| Abdelrahman 2002 [60] | Low quality | Long follow-up period | No clear definition of IS therapy, limited methodological details | Yes | 40 |
| Morales 2002 [61] | High quality | Clear kidney outcome | Kidney function was different, no analysis of uricosuric drugs Not blinded | No | 75 |
| Pascual 2003 [62] | High quality | Sample size evaluation | Not blinded UA not reported as secondary outcome | No | 62 |
| Urbizu 2003 [63] | Low quality | High risk of bias. Methods and results poorly reported | No | 33 | |
| Balal 2004 [64] | Moderate quality | Adequate follow-up and outcome reporting | No randomization and possible confounding factors. Some inconsistencies in follow-up and results reporting | No | 52 |
| Shibolet 2004 [65] | Low quality | Results inconclusive, only speculative | Yes | 35 | |
| Wong 2004 [66] | Moderate quality | Well-defined intervention and outcomes | Small sample size Short follow-up Not blinded | No | 62 |
| Bumbea 2005 [67] | Moderate quality | Detailed clinical assessment Clear conversion protocol | Retrospective nature limits control over bias | No | 51 |
| Hohage 2005 [68] | Moderate quality | Adequate follow-up | No randomization and possible confounding factors | No | 57 |
| Kanbay 2005 [69] | Moderate quality | Clear outcome measurement | Basal kidney function not reported. Possible confounding factors | Yes | 66 |
| Paydaş 2005 [70] | Moderate quality | Detailed description of UA levels during follow-up | Absence of randomization increases risk of bias | No | 58 |
| White 2005 [71] | High quality | Randomization and multicenter design. Outcomes clearly defined | Not blinded | No | 68 |
| Chen 2008 [72] | Low quality | Detailed clinical assessment | Case series; small sample size High risk of bias | No | 16 |
| Sessa 2009 [74] | Low quality | Detailed immunosuppressive therapy | Small sample size Results poorly described | No | 43 |
| Claes 2012 [76] | High quality | Robust randomization and a large sample size | Metabolic outcomes were secondary endpoints (sub-analysis), UA results poorly described, basal kidney function not reported Not blinded | No | 55 |
| Malheiro 2012 [43] | Moderate quality | Focus on UA Long follow-up Good sample size | Retrospective analysis Lack of covariates (diuretics, Losartan) in the analysis | Yes | 62 |
| Einollahi 2013 [77] | High quality | Large sample size | No comparison group. No details about blood examination schedule | Yes | 78 |
| Faulhaber 2013 [78] | Moderate quality | Clear outcome Adequate follow-up | No control group, potential treatment-selection bias, two interventions—Cyc reduction and CS withdrawal | No | 44 |
| Harada 2016 [79] | Moderate quality | Multicenter design strengthens external validity | Increased risk of selection bias and confounding. Small sample size | No | 46 |
| Azizzadeh 2020 [80] | Low quality | Clear objective and defined outcomes | High risk of selection bias and confounding factors, limited evaluation of UA | No | 41 |
| Atbee 2022 [81] | Low quality | No definition of IS therapy, limited methodological details | No | 32 |
| ID Study | Kidney Function | Diuretics | Other IS | Drugs Affecting UA | Diet |
|---|---|---|---|---|---|
| Najarian JS et al. [47] | |||||
| West C et al. [48] | |||||
| Gores FP et al. [49] | |||||
| Lin HY et al. [50] | |||||
| Van Thiel DH et al. [51] | |||||
| Burack DA et al. [52] | |||||
| Jordan ML et al. [53] | |||||
| Islam IS et al. [54] | |||||
| Hilbrands LB et al. [55] | |||||
| Hansen JM et al. [56] | |||||
| Boots JMM et al. [57] | |||||
| Neal DA et al. [58] | |||||
| Schlitt HJ et al. [59] | |||||
| Abdelrahman M et al. [60] | |||||
| Morales JM et al. [61] | |||||
| Pascual M et al. [62] | |||||
| Urbizu JM et al. [63] | |||||
| Balal M et al. [64] | |||||
| Shibolet O et al. [65] | |||||
| Wong V et al. [66] | |||||
| Bumbea V et al. [67] | |||||
| Hohage H et al. [68] | |||||
| Kanbay M et al. [69] | |||||
| Paydas S et al. [70] | |||||
| White M et al. [71] | |||||
| Chen J et al. [72] | |||||
| Pons JA et al. [73] | |||||
| Sessa A et al. [74] | |||||
| Seymen P et al. [75] | |||||
| Claes K et al. [76] | |||||
| Malheiro J et al. [43] | |||||
| Einollahi B et al. [77] | |||||
| Faulhaber M et al. [78] | |||||
| Harada S et al. [79] | |||||
| Azizzadeh L et al. [80] | |||||
| Atbee MYNA et al. [81] |
| Study ID | Population | Immunosuppression Therapy | Time from Transplantation (Months) | Follow-Up (Months) | Baseline Cr or Cl | Definition of Hyperuricemia |
|---|---|---|---|---|---|---|
| Najarian 1985 [47] | KTx | A: Cyc + CS vs. B: Aza + CS + Antily | Not reported | 3–36 | A: Cr = 1.9 ± 0.6 B: Cr = 1.5 ± 0.4 (mg/dL) | UA > 7.6 mg/dL in ♂ and >6.0 mg/dL in ♀ |
| West 1987 [48] | KTx | A: Cyc + CS B: Aza + CS | Not reported | At least 12 months | Cr (mg/dL): A: 2.4 ± 1.07 B: 2.5 ± 1.25, p = NS | UA > 8.5 mg/dL in ♂ and >7.0 mg/dL in ♀ |
| Gores 1988 [49] | KTx | A: Cyc + CS vs. B: Aza + CS + Antily | Not reported | 4 years | Cr < 2 mg/dL | UA > 8 mg/dL Severe HU: UA > 14 mg/dL |
| Lin 1989 [50] | KTx | A: Cyc + CS vs. B: Aza + CS | A: 96 ± 1 B: 74 ± 5 | Not applicable |
Cr (mg/dL): A: 1.8 ± 0.1 B: 1.4 ± 0.1, p = 0.0001 | UA > 7.9 mg/dL in ♂ and >6.7 mg/dL in ♀ |
| Van Thiel 1990 [51] | LTx | Cyc vs. Tac Other immunosuppression drugs not declared | Not reported | <1 month | Not reported | |
| Burack 1992 [52] | HTx | Cyc, CS, Aza | 1 | 5–29 | 34% of cases had Cr > 1.4 mg/dL | UA level of >7.5 mg/dL in ♀ and >8.5 mg/dL in ♂ |
| Jordan 1994 [53] | KTx in rejection | A: Cyc + CS +/−Aza vs. B: Tac + CS +/−Aza | 4.3 ± 6.3 | From 2 weeks to 36 months, mean 14 months | Cr = 3.2 ± 1.6 mg/dL | |
| Islam 1995 [54] | KTx | A: Cyc + Aza + CS vs. B: Aza + CS | Not reported | 4–15 years | Not declared | |
| Hilbrands 1996 [55] | KTx | A: Cyc + CS vs. B: Aza + CS | 3 | 4 weeks | Cr (mg/dL) A: 1.3 ± 0.3 B: 1.4 ± 0.46 | |
| Hansen 1998 [56] | KTx | A: Cyc + CS + Aza vs. B: Aza + CS | 9–178 | Not applicable | Cr < 2.04 mg/dL | |
| Boots 2001 [57] | KTx | A: Tac + CS vs. B: Cyc + CS | Not reported | 12 | Average Cl 47 mL/min | |
| Neal 2001 [58] | LTx | A: Cyc vs. B: Tac Aza (only in the first year after LTx) +/−CS | 6 | Presumed to be 48 months | In HU: Cr (mg/dL) A: 2 ± 0.2 B: 1.5 ± 0.05, p = 0.039 | UA > 7.6 mg/dL in ♂ and >6 mg/dL in ♀ |
| Schlitt 2001 [59] | LTx with CNI toxicity | A: CNI B: replacement by MMF | at least 6 | 6 | Cr (mg/dL): A: 1.6 ± 0.2 B: 1.9 ± 0.6 | |
| Seymen 2001 [75] | KTx | Not reported | 78 ±43 | 12 months | Cr (mg/dL): A: 1.47 ± 0.38 B: 1.5 ± 0.45, p = 0.54 | |
| Abdelrahman 2002 [60] | KTx | A: Cyc + CS + Aza B: Cyc + CS C: Cyc + Aza D: Cyc + MMF | at least 12 | 107 | Cr (mg/dL): 1.3 ± 0.3 | UA level of >6 mg/dL in ♀ and >8 mg/dL in ♂ |
| Morales 2002 [61] | KTx | A: Cyc + Aza or MMF vs. B: Sir + Aza or MMF | Not reported | 104 | Two years from KTx: Cr (mg/dL) A: 1.58–1.7 B: 1.36–1.47, p < 0.05 | According to laboratory reference values |
| Pascual 2003 [62] | KTx with Cr <2 mg/dL and proteinuria <1 g/day | A: Cyc + Pred + MMF vs. B: Cyc reduction + Pred + MMF | Mean 21–22 | 6 | Cr (mg/dL): 1.35 ± 0.24 | |
| Urbizu 2003 [63] | KTx | Cyc vs. Tac +MMF, CS use not declared | Time to conversion was 36.5 ± 34 | 6–12 months | Cr was reported as stable in the cohort, but values were not reported | |
| Balal 2004 [64] | KTx | A: Tac + CS + MMF or Aza vs. B: Cyc + CS + MMF or Aza | Not reported | 24 | Cl (mL/min) A: 78.7 ± 22.4 B: 68.6 ±27.1, p = NS | |
| Shibolet 2004 [65] | HTx and LTx | HTx: Cyc 95.6%, Tac 4.1%, Aza 66%, CS 100%, MMF 4.3% LTx: Cyc 35.1%, Tac 64.9%, Aza 5.2%, CS 59.2%, MMF 11.7% | Not reported | At least 36 months | Cr (mg/dL): HTx 1.72 vs. LTx 1.3, p < 0.001 | |
| Wong 2004 [66] | KTx with stable renal allograft function | A: 50% reduction in Cyc dosage + MMF + Pred vs. B: standard Cyc dose + MMF + Pred | at least 12 | 6 months | Cl (mL/min): A: 72.7 ± 17.9 B: 66.9 ± 19.6 | |
| Bumbea 2005 [67] | KTx with chronic allograft dysfunction | Switch from Tac or Cyc to Sir +CS +/−Aza +/−MMF | Median 54 (6–192) | 24 | Cl (mL/min): 49.4 ± 14.9 | |
| Hohage 2005 [68] | KTx | A: Cyc vs. B: Tac + CS + MMF (not described in the results) | at least 36 | 72 months (36 months before and 36 months after Tx) | Cr (mg/dL): A: Cr 2.9 B: Cr 2.2 | |
| Kanbay 2005 [69] | Stable KTx | A: Cyc B: Tac C: from Cyc to Tac Other IS treatment not reported | 1, 6, 12, 18, 24 | From 1 to 24 months | Cr (mg/dL): <1.5 | |
| Paydas 2005 [70] | KTx | A: C0 monitoring vs. B: C2 monitoring +Aza or MMF + CS | 1 | 36 | Cl (mL/min): A: 72.31 ± 23.1 B: 78.73 ± 22.2 | |
| White 2005 [71] | Stable HTx | A: A: Cyc; 47% received Aza, 27% MMF, and 52% CS vs. B: Tac: 51% received AZA, 28% MMF, 52% CS | at least 12 | 6 months | Cl (mL/min): A: 65.9 ± 23.8 B: 61.3 ± 9.9, p = 0.333 | |
| Chen 2008 [72] | KTx with chronic allograft nephropathy | Tac or Cyc switch to Sir +MMF + CS | At least 6 | 12 | Cr (mg/dL): 3.2 | |
| Pons 2009 [73] | LTx | Cyc was gradually withdrawn and followed later by CS and/or Aza (over two months) In patients with rejection, reintroduction of IS | 24 | 10–132 | Cr (mg/dL): Without Rejection: 1.54 ± 0.3 With rejection: 1.31 ± 0.27 | |
| Sessa 2009 [74] | KTx | A: Tac + MMF + CS (N = 16) B: Tac + MMF (N = 12) C: Tac + CS (N = 14) D: Cyc + MMF + CS (N = 19) E: Cyc + MMF (N = 12) F: Cyc + CS (N = 12) G: Cyc + Eve + CS (N = 10) H: Sir + MMF + CS (N = 8) | Mean A: 54 B:57 C:62 D: 82 E:32 F:128 G: 66 H: 118 | Not applicable | Not reported | As abnormal value |
| Claes 2012 [76] | KTx | A: Cyc high dose, B: Cyc low dose + MMF C: Tac low dose + MMF D: Sir low dose + MMF | Not reported | 12 | Not reported | |
| Malheiro 2012 [43] | KTx | 77.8% in CS 74.8% in MMF 48.7% in Cyc 49.3% in Tac | 91 (27–170) | Not applicable | Cl (mL/min) No HU: 57.2 ± 18.8 HU: 44.7 ± 15.4 | UA > 7 mg/dL in ♂ and >6.5 mg/dL in ♀ |
| Einollahi 2013 [77] | KTx | A: Cyc + MMF vs. B: Aza + CS | Mean 60 ± 48 | Around 36 | Cr (mg/dL): 1.6 ± 0.9 | UA ≥7.0 mg/dL in ♂ and ≥6 mg/dL in ♀ that persisted for at least two consecutive tests. |
| Faulhaber 2013 [78] | HTx | CS withdrawn, MMF introduction, Cyc dose reduction (target level 50–90 ng/mL) | 36 | 24 | Cr (mg/dL): < 3.5 | |
| Harada 2016 [79] | KTx ABO incompatible | A: Cyc B: Tac, +High-dose Mizoribine, basiliximab, rituximab, CS | Not reported | 2 years | Cr (mg/dL) at 6 months from KTx A: 1.38 ± 0.41 B:1.26 ± 0.35, p = NS | |
| Azizzadeh 2020 [80] | KTx | A: Cyc + MMF vs. B: Tac + MMF | Not reported | 12 | Cl (mL/min): A: 66.15 ± 26.22 B: 67.82 ± 20.93, p = 0.757 | |
| Atbee 2022 [81] | KTx | Cyc, other IS agents not reported | 3 | 18 | Not reported | Not defined |
| Outcome | Evidence Base (Studies, Participants) | Summary of Findings | Certainty (GRADE) | Reasons for Rating |
|---|---|---|---|---|
| CNI vs. non-CNI | ||||
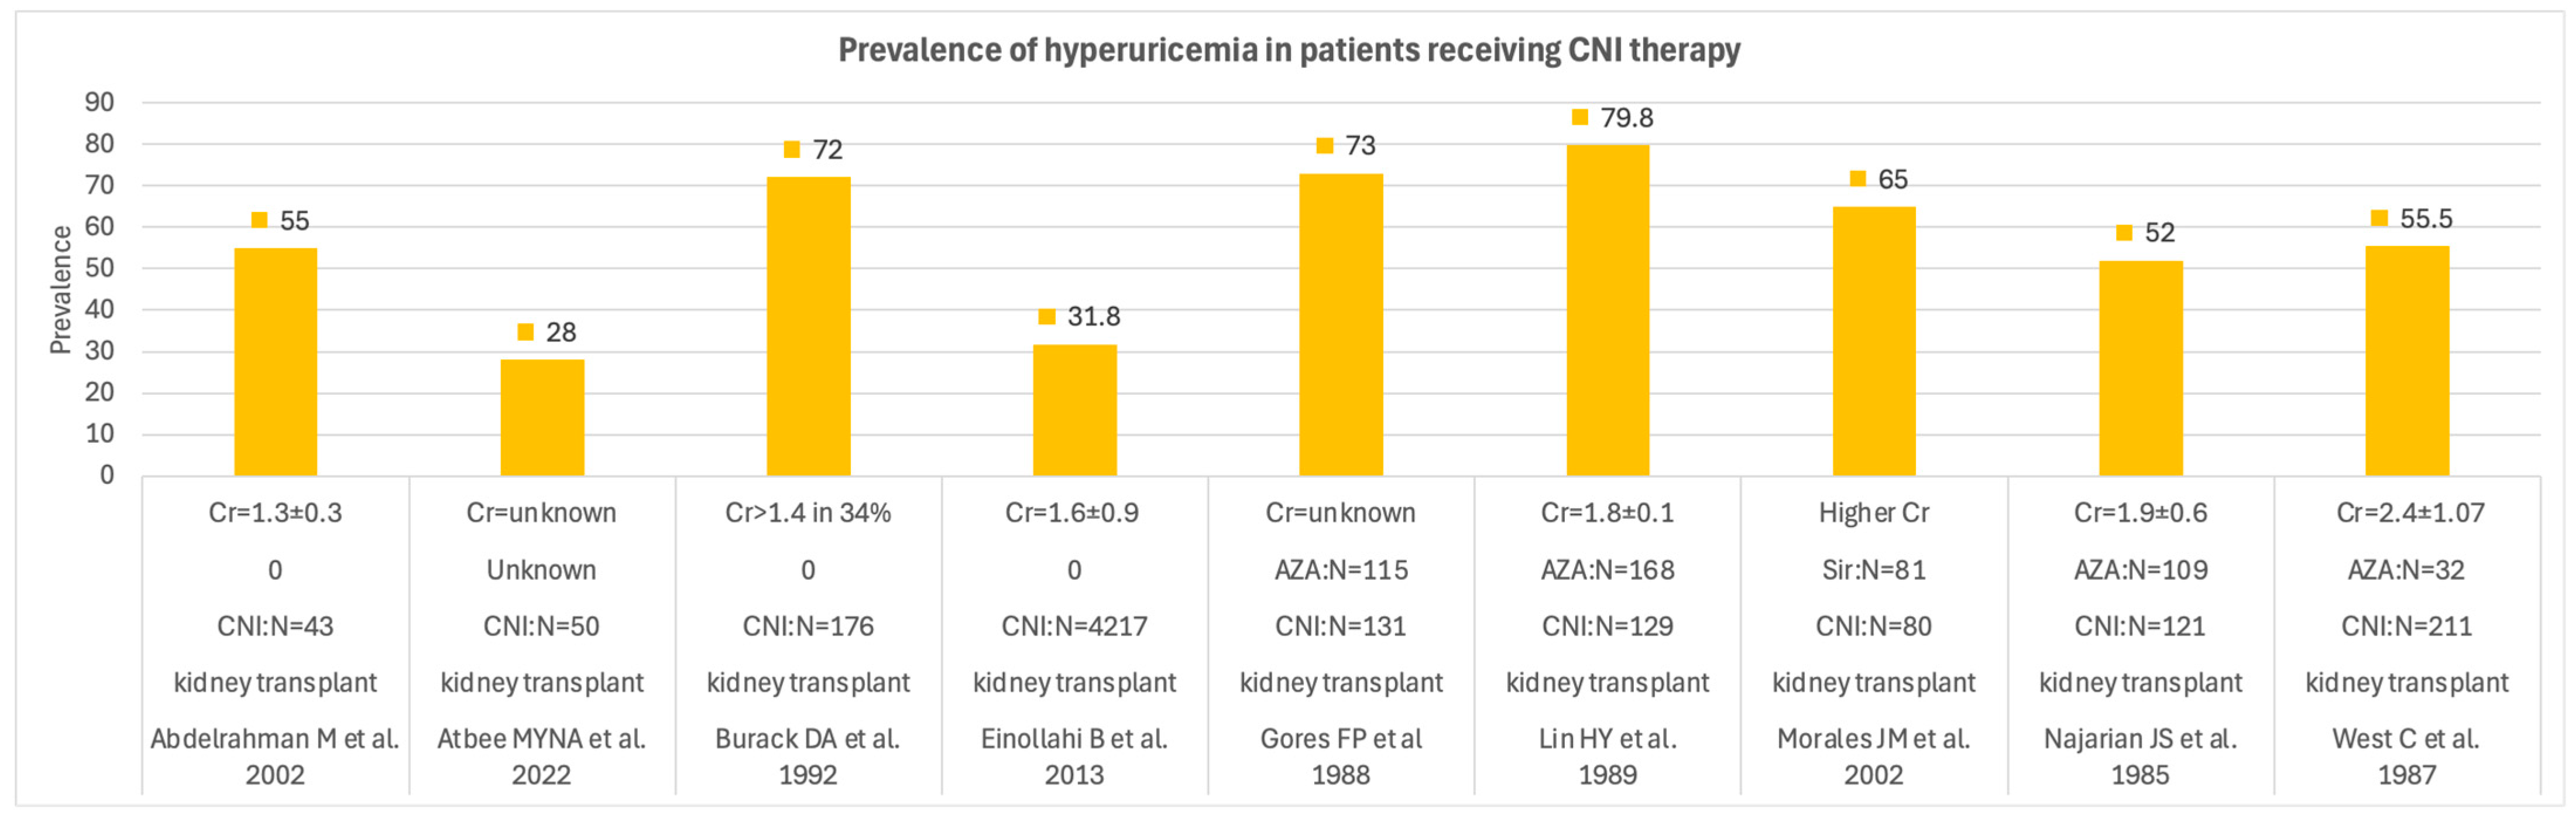
| HU (prevalence/incidence) | 9 studies; 5158 participants | HU was common in patients with CNI therapy; across studies, prevalence ranged broadly (≈30–80%), and switching/withdrawal or use of non-CNI regimens was generally associated with lower hyperuricemia burden. | Very low | Risk of bias: predominantly observational/retrospective + confounding risk factors (kidney function and diuretics) incompletely addressed Inconsistency: clinical heterogeneity; varying definitions of UA Indirectness: variable follow-up and IS treatment Imprecision: several small samples Suspected selective outcome/reporting: UA often secondary outcome |
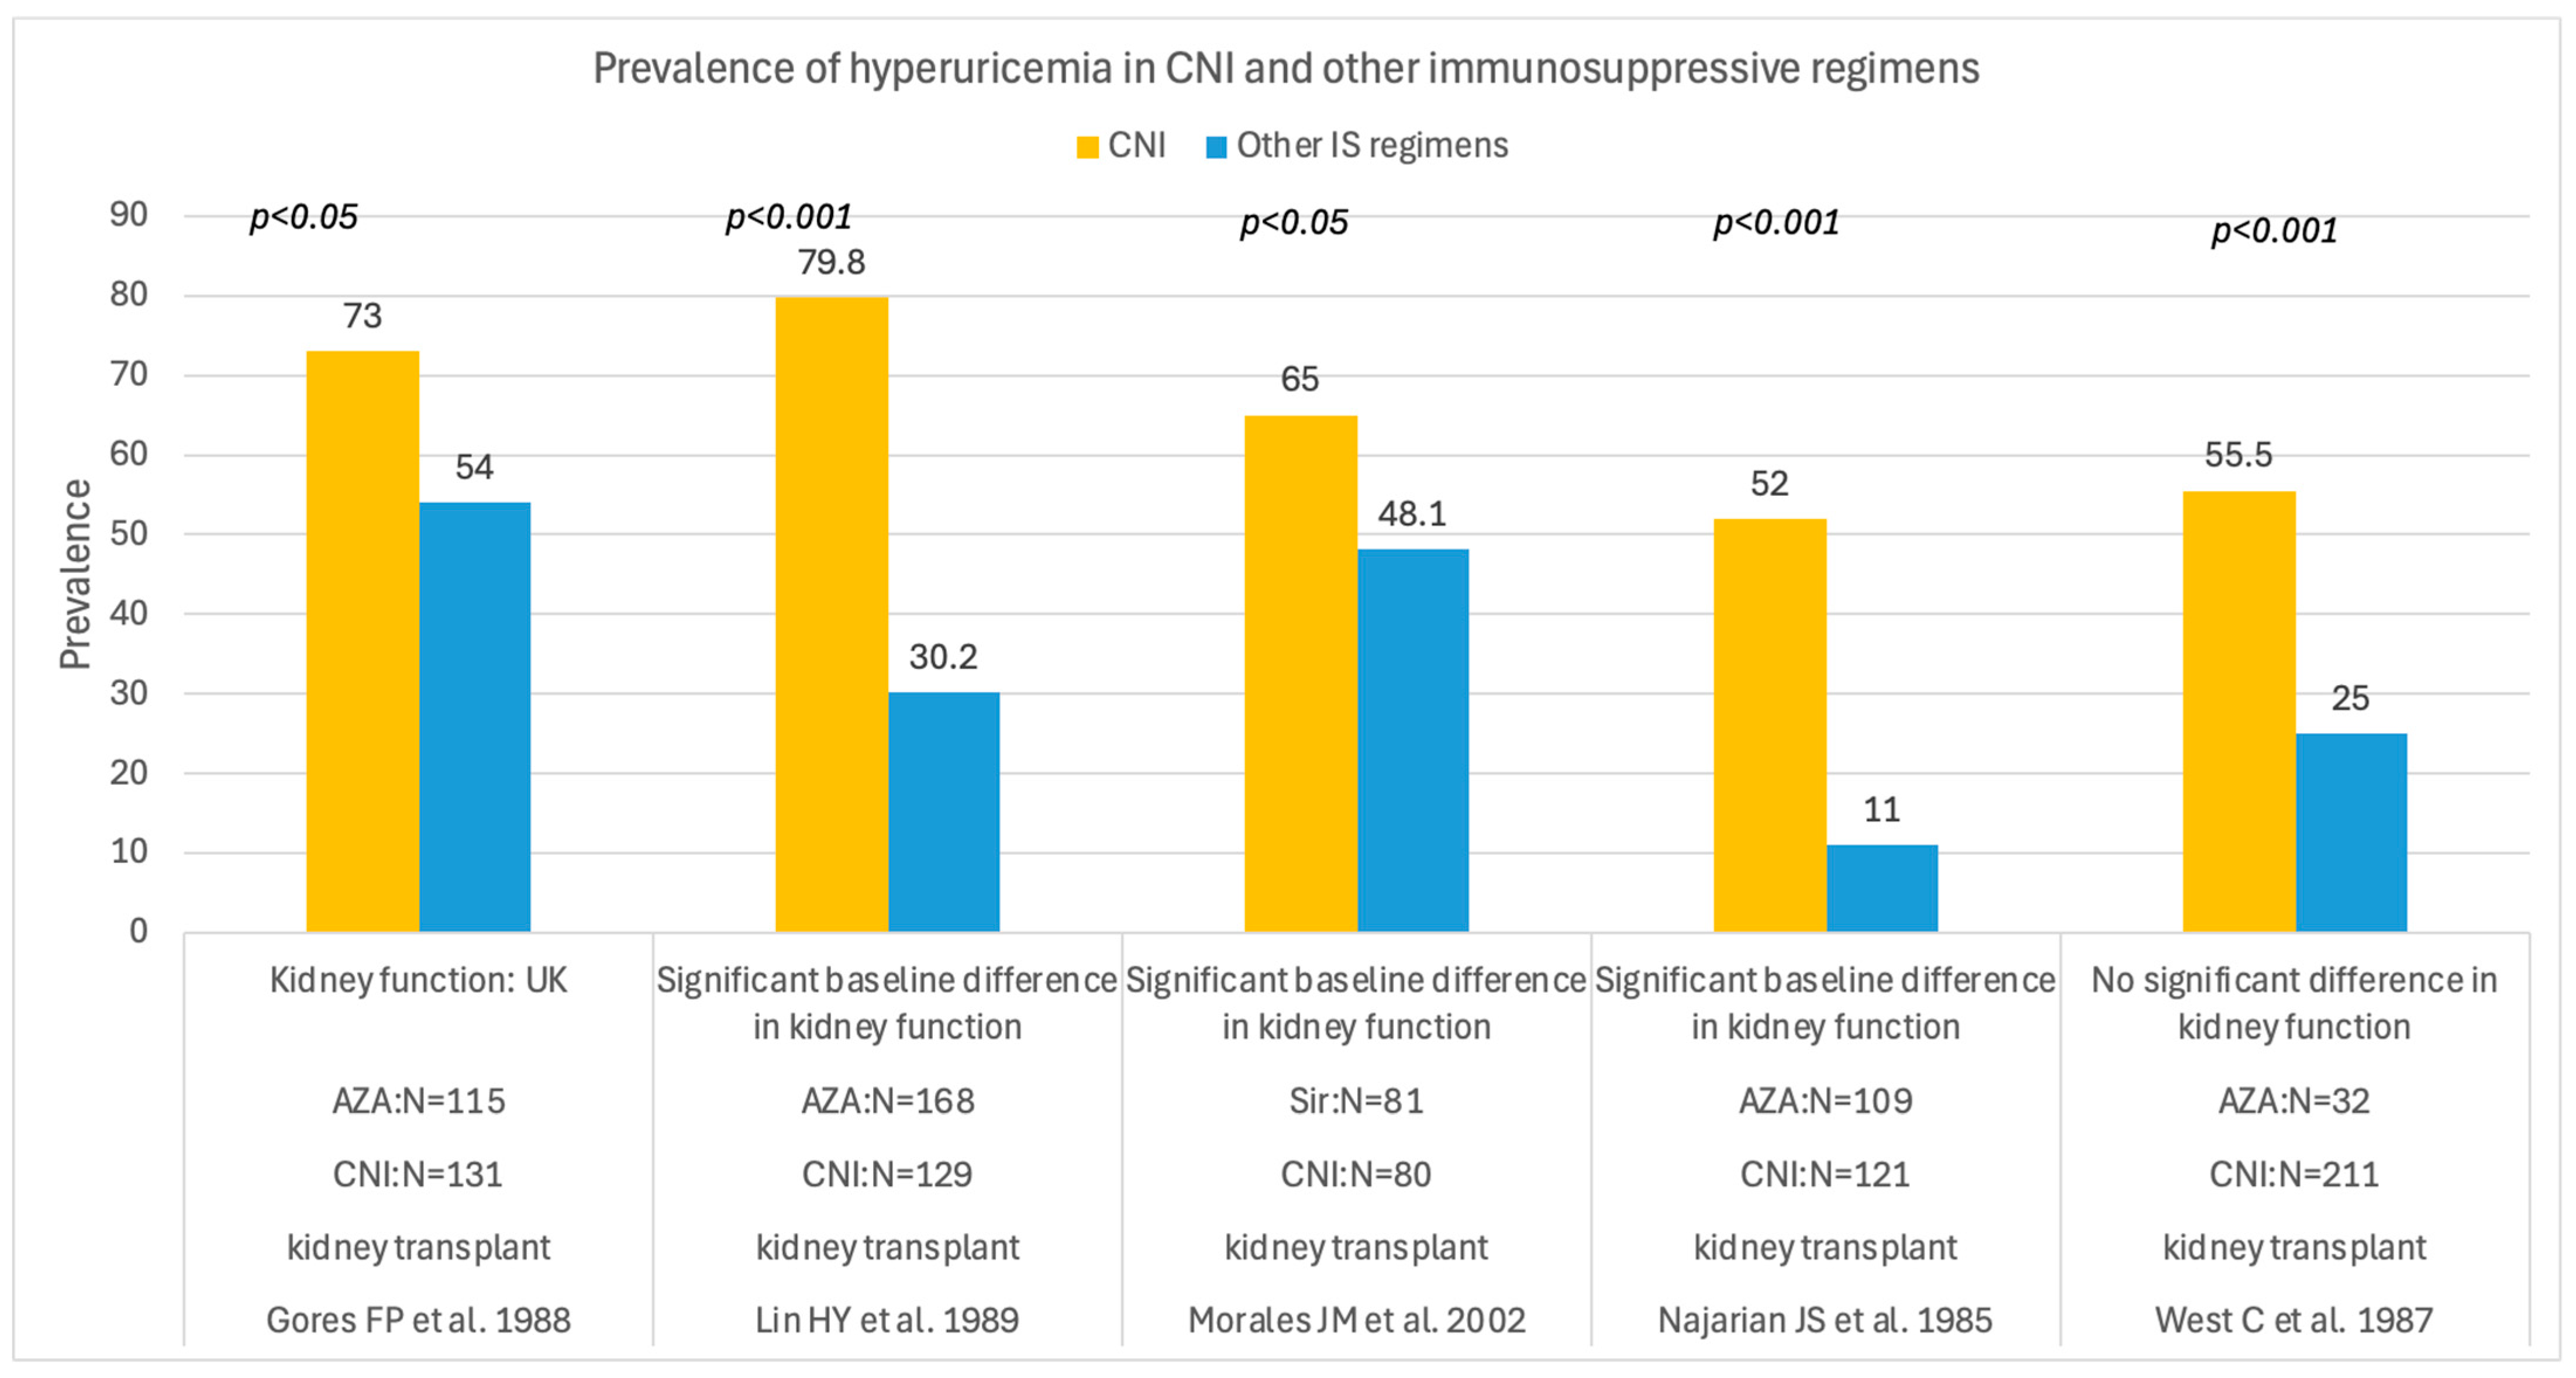
| UA level (continuous) | 6 comparative studies; 2066 participants; 10 cohort studies (reduction or stopping CNI); 306 participants | Treatment with CNI was often linked to higher UA levels. Reducing, stopping, or switching to non-CNI regimens usually improved UA during follow-up. However, these results varied depending on the study design and clinical setting. | Very low | Risk of bias: confounding risk factors (kidney function and diuretics) not systematically adjusted Inconsistency: mixed directions/contexts Indirectness: variable baselines and transplant vintage Imprecision: limited power in multiple cohorts Potential selective reporting: UA not consistently a primary endpoint |
| Cyclosporin vs. tacrolimus | ||||
| HU (prevalence/incidence) | 4 comparative studies; 661 participants | Overall, there was no clear difference in HU prevalence. Some studies found higher rates with Cyc than with Tac, while others found no difference. | Very low | Risk of bias: nonrandomized comparisons; residual confounding) Inconsistency: contradictory findings Indirectness: mixed organ types/therapies; variable definitions Imprecision: small sample sizes in several studies Selective reporting likely: UA frequently secondary |
| UA level (continuous) | 12 comparative studies; 2052 participants | Several studies found that cyclosporin was more often associated with higher UA levels than tacrolimus, whereas a similar number found no significant difference. Conversion from Cyc to Tac generally showed stable or reduced UA, with exceptions. | Very low | Risk of bias: confounding and baseline imbalance Inconsistency: heterogeneous and discordant direction Indirectness: variable follow-up and co-therapies Imprecision: few events and limited precision Suspected reporting bias: UA not uniformly/fully reported |
Disclaimer/Publisher’s Note: The statements, opinions and data contained in all publications are solely those of the individual author(s) and contributor(s) and not of MDPI and/or the editor(s). MDPI and/or the editor(s) disclaim responsibility for any injury to people or property resulting from any ideas, methods, instructions or products referred to in the content. |
© 2026 by the authors. Licensee MDPI, Basel, Switzerland. This article is an open access article distributed under the terms and conditions of the Creative Commons Attribution (CC BY) license.
Share and Cite
Martino, F.K.; Bogo, M.; Brunetta, L.; Fioretti, F.; Cattarin, L.; Stefanelli, L.F.; Nalesso, F. Calcineurin Inhibitors and Uric Acid Control in Solid Organ Transplantation: A Systematic Review. Med. Sci. 2026, 14, 191. https://doi.org/10.3390/medsci14020191
Martino FK, Bogo M, Brunetta L, Fioretti F, Cattarin L, Stefanelli LF, Nalesso F. Calcineurin Inhibitors and Uric Acid Control in Solid Organ Transplantation: A Systematic Review. Medical Sciences. 2026; 14(2):191. https://doi.org/10.3390/medsci14020191
Chicago/Turabian StyleMartino, Francesca K., Marco Bogo, Ludovica Brunetta, Francesca Fioretti, Leda Cattarin, Lucia F Stefanelli, and Federico Nalesso. 2026. "Calcineurin Inhibitors and Uric Acid Control in Solid Organ Transplantation: A Systematic Review" Medical Sciences 14, no. 2: 191. https://doi.org/10.3390/medsci14020191
APA StyleMartino, F. K., Bogo, M., Brunetta, L., Fioretti, F., Cattarin, L., Stefanelli, L. F., & Nalesso, F. (2026). Calcineurin Inhibitors and Uric Acid Control in Solid Organ Transplantation: A Systematic Review. Medical Sciences, 14(2), 191. https://doi.org/10.3390/medsci14020191