1. Introduction
Hepatocellular carcinoma (HCC) is a major global health burden and the leading cause of primary liver cancer, accounting for more than 800,000 deaths annually [
1]. Early detection and improved risk stratification remain pressing unmet needs, as most HCC cases are diagnosed at advanced stages when therapeutic options are limited and prognosis is poor [
2,
3]. Despite progress in surveillance and molecular therapy, the heterogeneity of HCC driven by diverse etiologies such as viral hepatitis, alcohol, and metabolic dysfunction–associated steatotic liver disease (MASLD) continues to complicate biomarker discovery and clinical management [
4].
The cytochrome P450 (CYP) enzyme family consists of 57 functional genes in humans and catalyzes the oxidative metabolism of numerous endogenous and exogenous substrates, including drugs, toxins, fatty acids, steroids, and vitamins [
5]. Highly expressed in the liver, CYPs are central to xenobiotic detoxification, metabolic homeostasis, and the biosynthesis of bile acids and cholesterol [
6,
7]. The CYP2, CYP3, and CYP4 clusters account for the majority of phase I metabolic reactions [
5,
8].
Altered CYP expression significantly affects liver disease progression, carcinogen metabolism, and drug response [
6,
9]. Transcriptomic studies show that major hepatic CYPs, including
CYP1A2,
CYP2C8,
CYP2C9,
CYP2E1, and
CYP3A4, are downregulated in HCC and have been suggested as potential biomarkers or predictors of therapeutic response, although findings remain inconsistent [
10]. Other CYP members involved in lipid and bile acid metabolism, such as
CYP4A11,
CYP8B1,
CYP7A1, and
CYP26B1, are closely linked to hepatocarcinogenesis, but their roles in HCC remain poorly understood [
5,
11].
Despite the increasing availability of large-scale datasets such as TCGA and GepLiver, prior analyses have typically focused on isolated CYP genes rather than the entire family, leaving the comprehensive landscape of CYP dysregulation in HCC largely undefined. An integrative, multi-cohort approach that spans transcriptomic, proteomic, and clinical layers is thus essential to delineate the roles of CYPs in liver tumor biology and to identify novel molecular determinants of disease behavior.
Among the CYP family,
CYP2R1 has recently attracted attention as a key vitamin D 25-hydroxylase involved in systemic vitamin D activation [
12], and its crystal structure in complex with vitamin D3 has been resolved, providing mechanistic insight into substrate recognition and catalysis [
13]. Given the emerging evidence linking vitamin D signaling to cancer metabolism, immune regulation, and genomic stability [
14,
15], aberrant
CYP2R1 expression may represent a crucial metabolic alteration in HCC. However, its role in liver cancer has not been systematically characterized.
In this study, we performed a comprehensive multi-omics investigation of all 57 CYP genes in HCC, integrating analyses from GepLiver, TCGA-LIHC, and HCCDB2.0 cohorts. Through rigorous screening and cross-validation, we identified CYP2R1 as a consistently upregulated and clinically relevant biomarker. We further evaluated its diagnostic and prognostic significance, characterized its associated biological pathways, including DNA repair activation and immune modulation, and validated its expression using independent clinical and spatial transcriptomic datasets. Collectively, our findings establish CYP2R1 as a novel metabolic and immunogenomic biomarker in HCC, providing new insight into the intersection between hepatic metabolism, genomic maintenance, and tumor immune microenvironment.
2. Materials and Methods
2.1. Data Collection and Preprocessing
Publicly available transcriptomic and clinical datasets were retrieved from The Cancer Genome Atlas Liver Hepatocellular Carcinoma (TCGA-LIHC;
https://portal.gdc.cancer.gov/ (accessed on 19 February 2026)), GepLiver (
http://www.gepliver.org (accessed on 19 February 2026)), and HCCDB2.0 (
http://lifeome.net/database/hccdb/home.html (accessed on 19 February 2026)). Gene-level normalized expression matrices (log
2(TPM + 1)) were used for all analyses. Sample metadata were harmonized by disease category, and only primary HCC and matched non-tumor liver tissues were included. Batch correction and normalization were performed using the R package limma (v3.58.0). For protein-level evaluation, immunohistochemistry (IHC) images and expression scores were obtained from the Human Protein Atlas (HPA;
https://www.proteinatlas.org/ (accessed on 19 February 2026)).
2.2. Oncoprint and Mutation Landscape Analysis
Mutation status, copy number variation, and mRNA expression alterations of all 57 CYP genes were analyzed using the cBioPortal for Cancer Genomics (
https://www.cbioportal.org/ (accessed on 19 February 2026)). Data from the TCGA-LIHC cohort (n = 348) were used to construct Oncoprints and frequency plots. Integrated mutation types and alteration frequencies were visualized to assess genomic variation patterns and their relative prevalence among HCC patients.
2.3. Differential Expression and Correlation Analysis
All statistical analyses were performed using R (version 4.5.1; R Foundation for Statistical Computing, Vienna, Austria). Differential expression between HCC and non-tumor tissues was computed using the limma package (version 3.64.3), applying an adjusted p < 0.05 (Benjamini–Hochberg correction) and |log2FC| > 1 as the threshold for significance. Volcano plots and hierarchical heatmaps were generated using ggplot2 (version 3.5.2) and ComplexHeatmap (version 2.24.1) packages. Pairwise correlations among CYP genes were calculated using Pearson’s correlation coefficient with multiple-testing correction (false discovery rate < 0.05).
2.4. Diagnostic and Prognostic Evaluation
Diagnostic performance was assessed via receiver operating characteristic (ROC) curve analysis using the GraphPad Prism (v10.6.1; GraphPad Software, San Diego, CA, USA). Area under the curve (AUC) values with 95% confidence intervals were calculated, and the DeLong test was used for statistical comparison. For diagnostic screening, receiver operating characteristic (ROC) curves were first generated in the TCGA-LIHC cohort to assess the ability of each candidate CYP gene to discriminate HCC (n = 371) from non-tumor liver tissues (n = 50). TCGA-LIHC served as the discovery cohort to prioritize the most discriminatory CYP markers, including CYP2R1, based on univariable discrimination. The diagnostic performance of CYP2R1 was subsequently evaluated in two independent cohorts (GepLiver and the Ajou University surgical cohort) using the same ROC framework. In the GepLiver cohort, two clinically relevant diagnostic comparisons were performed: (i) HCC versus all non-tumor liver tissues (including normal liver and chronic liver diseases) and (ii) HCC versus chronic liver disease tissues only, excluding normal controls. Prognostic analysis was performed using univariate and multivariate Cox proportional hazards regression models with the survival package. For overall survival analysis in TCGA-LIHC, 343 patients with complete data and 119 death events were included. Variables that reached p < 0.05 in univariate analysis were entered into the multivariable Cox regression model. In total, 21 variables were evaluated in the multivariable analysis, corresponding to an events-per-variable ratio of approximately 5.7, which is considered acceptable for exploratory prognostic analyses aimed at identifying candidate biomarkers rather than constructing a fully optimized prediction model. Variables with p < 0.05 in univariate analysis were included in the multivariate model. Kaplan–Meier survival curves were generated and compared using the log-rank test.
2.5. Clinical Samples and Ethical Approval
Paired tumor and adjacent non-tumor liver tissues were obtained from 110 patients who underwent surgical resection for HCC at Ajou University Hospital (Suwon, Republic of Korea). Clinical characteristics and sample information were retrieved from medical records and the Ajou Human Source Bank.
Demographic and clinical variables collected for the cohort included age, sex, disease etiology (e.g., hepatitis B virus, hepatitis C virus, alcohol-related liver disease, or metabolic-associated liver disease), body mass index (BMI), alcohol consumption history, smoking status, cirrhosis status, and tumor stage according to both the Barcelona Clinic Liver Cancer (BCLC) classification and the pathological UICC staging system. These clinical characteristics of the validation cohort are summarized in
Supplementary Table S6.
All tumor and adjacent non-tumor liver tissues were collected from the same patients at the time of surgical resection and processed under a standardized institutional protocol. The paired design enables intra-individual comparison and reduces potential confounding related to demographic factors, medication exposure, metabolic conditions, and alcohol use.
In a subset of patients, longitudinal paired samples consisting of primary tumor (PT) and recurrent tumor (RT) tissues were available. For exploratory analysis, CYP2R1 expression was quantified in these paired PT–RT samples using qRT-PCR, allowing within-patient comparison of expression changes during tumor recurrence.
In addition, plasma samples were obtained from individuals with normal liver (n = 15), chronic hepatitis (n = 10), metabolic-associated steatohepatitis (MASH, n = 8), liver cirrhosis (n = 21), and hepatocellular carcinoma (HCC, n = 88) through the Ajou Human Source Bank under the same institutional review board approvals. These samples were used for exploratory ELISA-based measurement of circulating CYP2R1. All experiments were performed in accordance with the Declaration of Helsinki, and the study was approved by the Institutional Review Board of Ajou University Hospital (AJOUIRB-EX-2022-389 and AJOUIRB-EX-2024-332, date of approval: 4 October 2022), each corresponding to distinct sample and data collection periods. Anonymous samples and clinical data were provided by the Ajou Human Source Bank, and the requirement for informed consent was waived.
2.6. RNA Extraction and Quantitative Reverse Transcription PCR
Total RNA was isolated from liver tissues using TRIzol reagent (Invitrogen, Carlsbad, CA, USA) or the RNeasy Mini Kit (Qiagen, Hilden, Germany). cDNA was synthesized using the PrimeScript™ RT Master Mix (TaKaRa Bio, Otsu, Japan). qRT-PCR was carried out using AmfiSure qGreen Q-PCR Master Mix (GenDEPOT, Barker, TX, USA) on either the Applied Biosystems 7300 Real-Time PCR System (Applied Biosystems, Foster City, CA, USA) or the Bio-Rad CFX Connect Real-Time PCR Detection System (Bio-Rad Laboratories, Hercules, CA, USA). Expression levels were normalized to HMBS as an internal reference gene. The primer (Integrated DNA Technologies, Coralville, IA, USA) sequences used were as follows: HMBS (NM_000190.3), forward 5′-ACG GCT CAG ATA GCA TAC AAG AG-3′ and reverse 5′-GTT ACG AGC AGT GAT GCC TAC C-3′; and CYP2R1 (NM_001004065.1), forward 5′-GAG GCA TAT CAA CTG TGG TTC T-3′ and reverse 5′-TGG AAT TGA GTA AGC CTC CCA TT-3′. qRT-PCR experiments were performed with at least three technical replicates for each sample, and relative expression levels were calculated using the 2−ΔΔCt method after normalization to the housekeeping gene.
2.7. Enzyme-Linked Immunosorbent Assay (ELISA)
Plasma CYP2R1 concentrations were measured using a commercially available ELISA kit (Cusabio, Wuhan, China) according to the manufacturer’s instructions. Diagnostic performance for distinguishing HCC from non-tumor liver disease controls was evaluated using receiver operating characteristic (ROC) analysis.
2.8. Functional Enrichment and Gene Set Enrichment Analysis
Genes significantly correlated with
CYP2R1 expression (|r| ≥ 0.2, adjusted
p < 0.05) were subjected to pathway enrichment using EnrichR (
https://maayanlab.cloud/Enrichr/ (accessed on 19 February 2026)) across the Reactome Pathways 2024, KEGG 2021 Human, MSigDB Hallmark 2020, and WikiPathways 2024 Human databases. Gene Set Enrichment Analysis (GSEA) was performed using the clusterProfiler package (v4.8.3) with the Hallmark gene sets (h.all.v2025.1.Hs.symbols.gmt). Ranked gene lists based on log
2FC from
CYP2R1-high (Q1) vs.
CYP2R1-low (Q4) tumors were used as input. Normalized enrichment scores (NES) and adjusted
p-values were computed based on 1000 permutations, and results with FDR < 0.25 were considered significant.
2.9. Immune Infiltration Analysis
Immune cell infiltration analysis was conducted using the TIMER2.0 platform (
http://timer.cistrome.org/ (accessed on 10 June 2025)). TCGA-LIHC RNA-seq data were analyzed using the TIMER deconvolution algorithm implemented in TIMER2.0 to estimate immune cell abundance from bulk transcriptomic profiles. Correlations between
CYP2R1 expression and immune infiltration levels were evaluated using Spearman’s correlation with tumor purity adjustment as implemented in the TIMER2.0 platform.
2.10. Statistical Analysis
All statistical analyses were performed using R software (v4.3.2) and GraphPad Prism. Group comparisons were performed using Welch’s t-test (two groups) or one-way ANOVA followed by Tukey’s post hoc test (multiple groups). Correlation coefficients were calculated using Pearson’s or Spearman’s method as appropriate, with p-values adjusted using the Benjamini–Hochberg procedure. Data are presented as mean ± standard deviation (SD) or mean ± standard error of the mean (SEM), as indicated in the figure legends. All statistical tests were two-sided, and differences were considered statistically significant at p < 0.05 or adjusted p < 0.05 unless otherwise stated.
3. Results
3.1. Heterogeneous Expression of CYP Genes in HCC
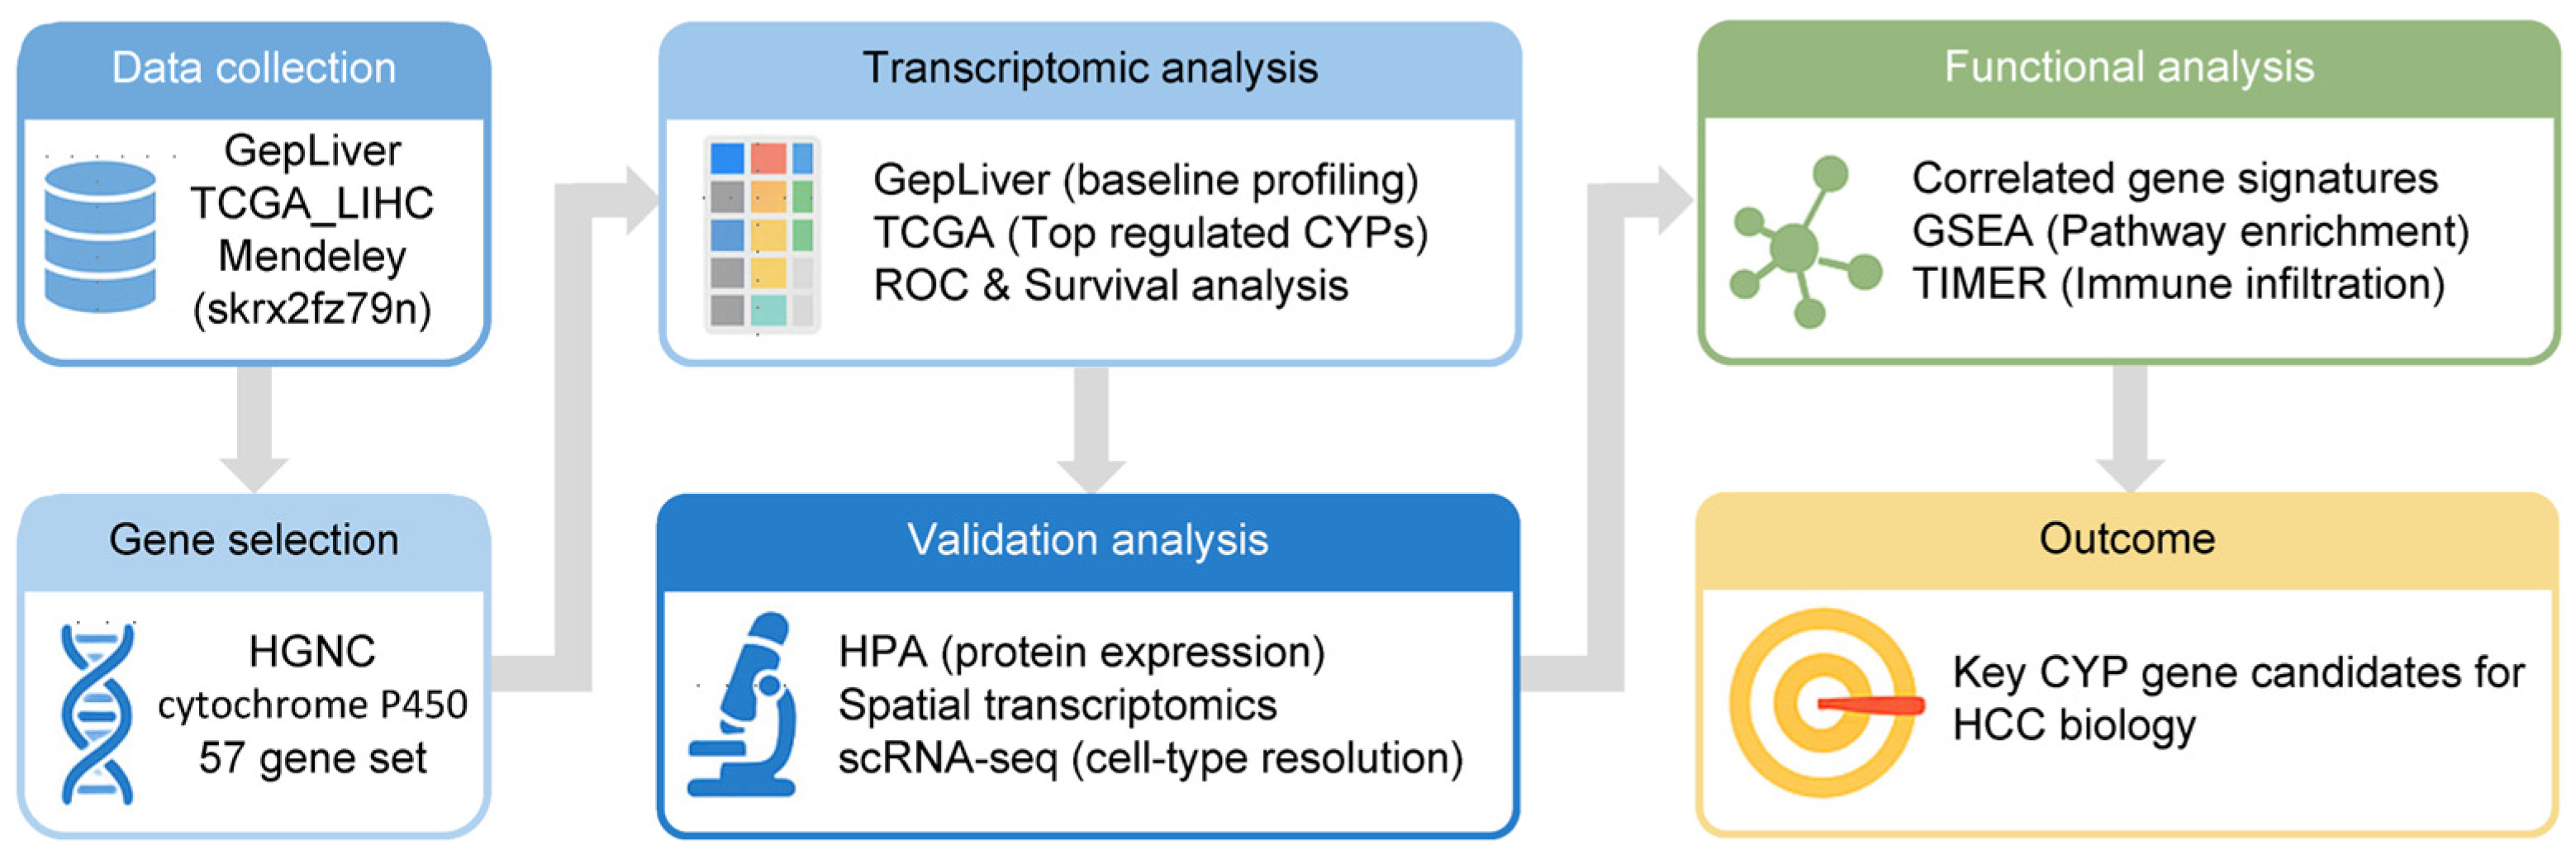
To systematically investigate the cytochrome P450 (CYP) gene family in hepatocellular carcinoma (HCC), we established an integrative multi-step analytic workflow encompassing large-scale data collection, rigorous gene set selection, transcriptomic profiling, external cohort validation, and downstream functional assessments (
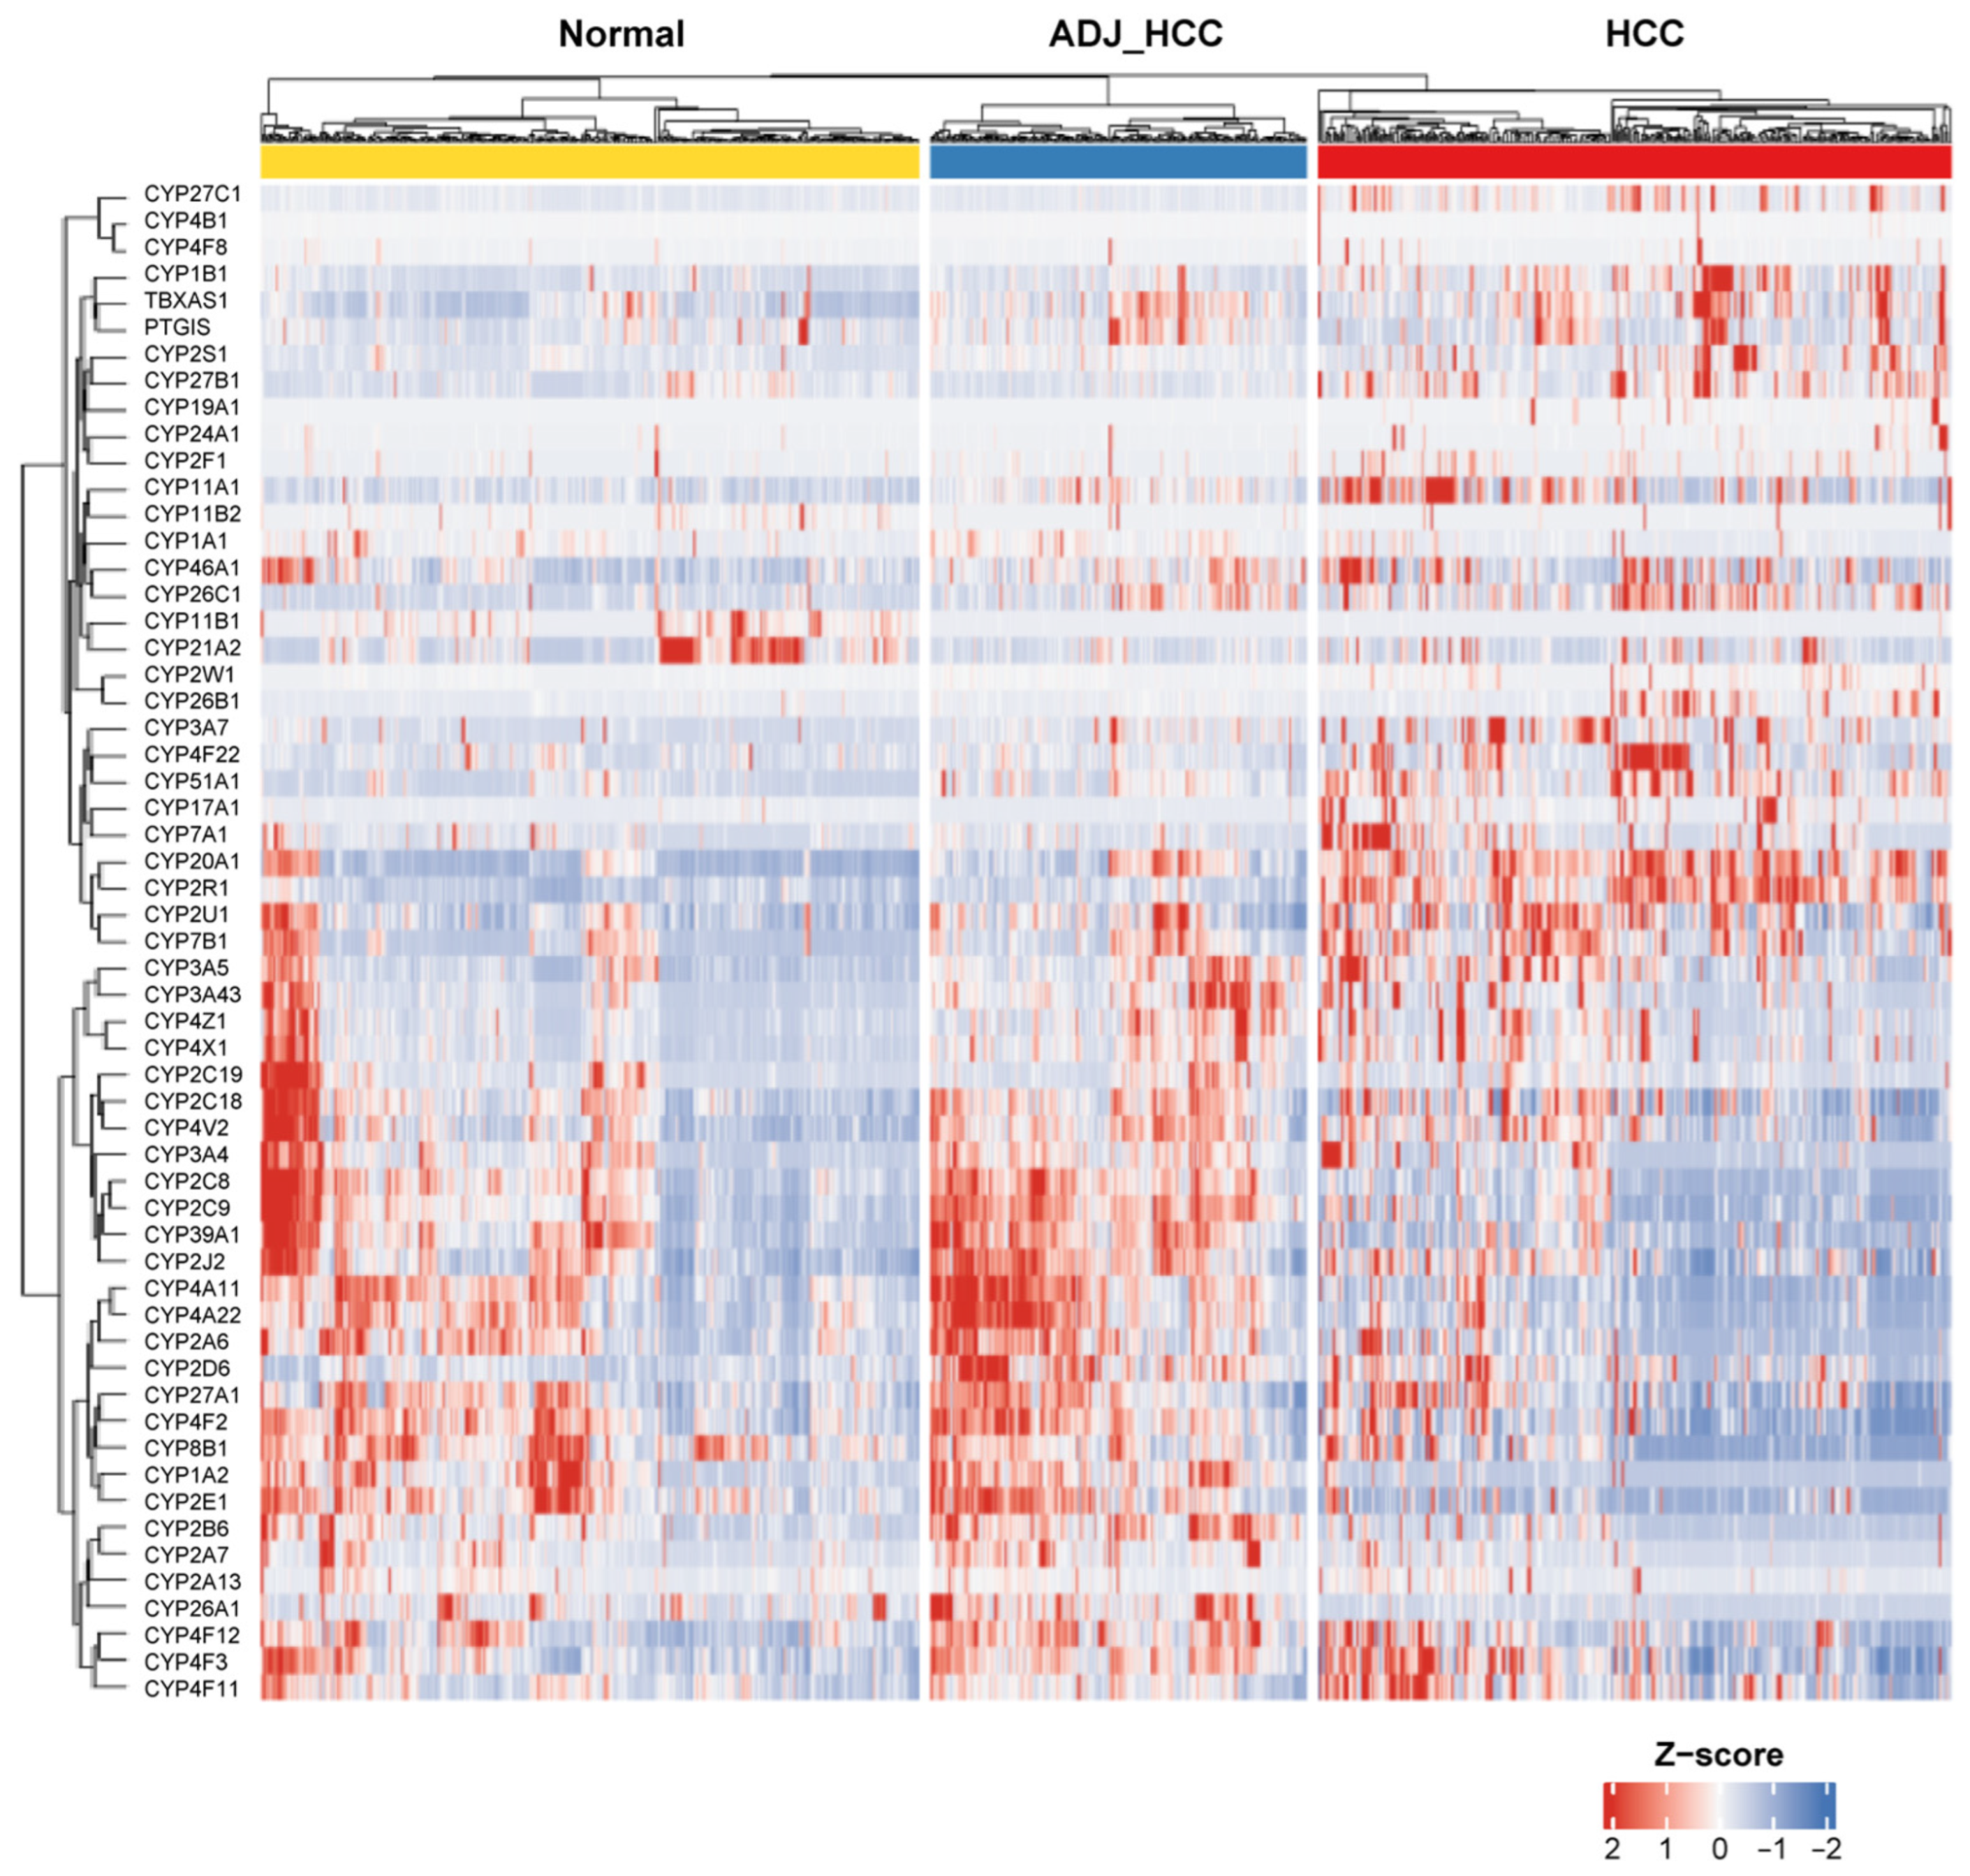
Figure 1). A total of 57 CYP genes were curated from the HGNC database and examined using the GepLiver cohort, providing a comprehensive survey of expression patterns across normal, adjacent non-tumor, and HCC tissues.
Unsupervised hierarchical clustering and heatmap visualization highlighted marked heterogeneity in CYP gene expression, with striking subgrouping according to tissue type and sample characteristics (
Figure 2). Key hepatic CYP members, including
CYP3A4,
CYP2E1, and
CYP2C9, were consistently down-regulated in HCC relative to control samples. By contrast, several genes, such as
CYP26B1,
CYP1B1, and
CYP7A1, and especially
CYP2R1, displayed robust up-regulation specific to tumor tissues. Deregulation thus manifested as gene-specific rather than family-wide shifts.
Complementing transcriptomic findings, we assessed genomic alterations using cBioPortal data from the TCGA-LIHC cohort (n = 348). Most CYP genes lacked recurrent mutations or structural variants, indicating that somatic genomic changes are rare across this family. Notably, copy-number amplifications were seen for
CYP11B1 and
CYP11B2 in a single subject, while
CYP2R1 exhibited a high frequency of mRNA overexpression events. Consistently, most CYP genes exhibited frequent mRNA low cases, mirroring transcriptomic down-regulation (
Supplementary Figure S1).
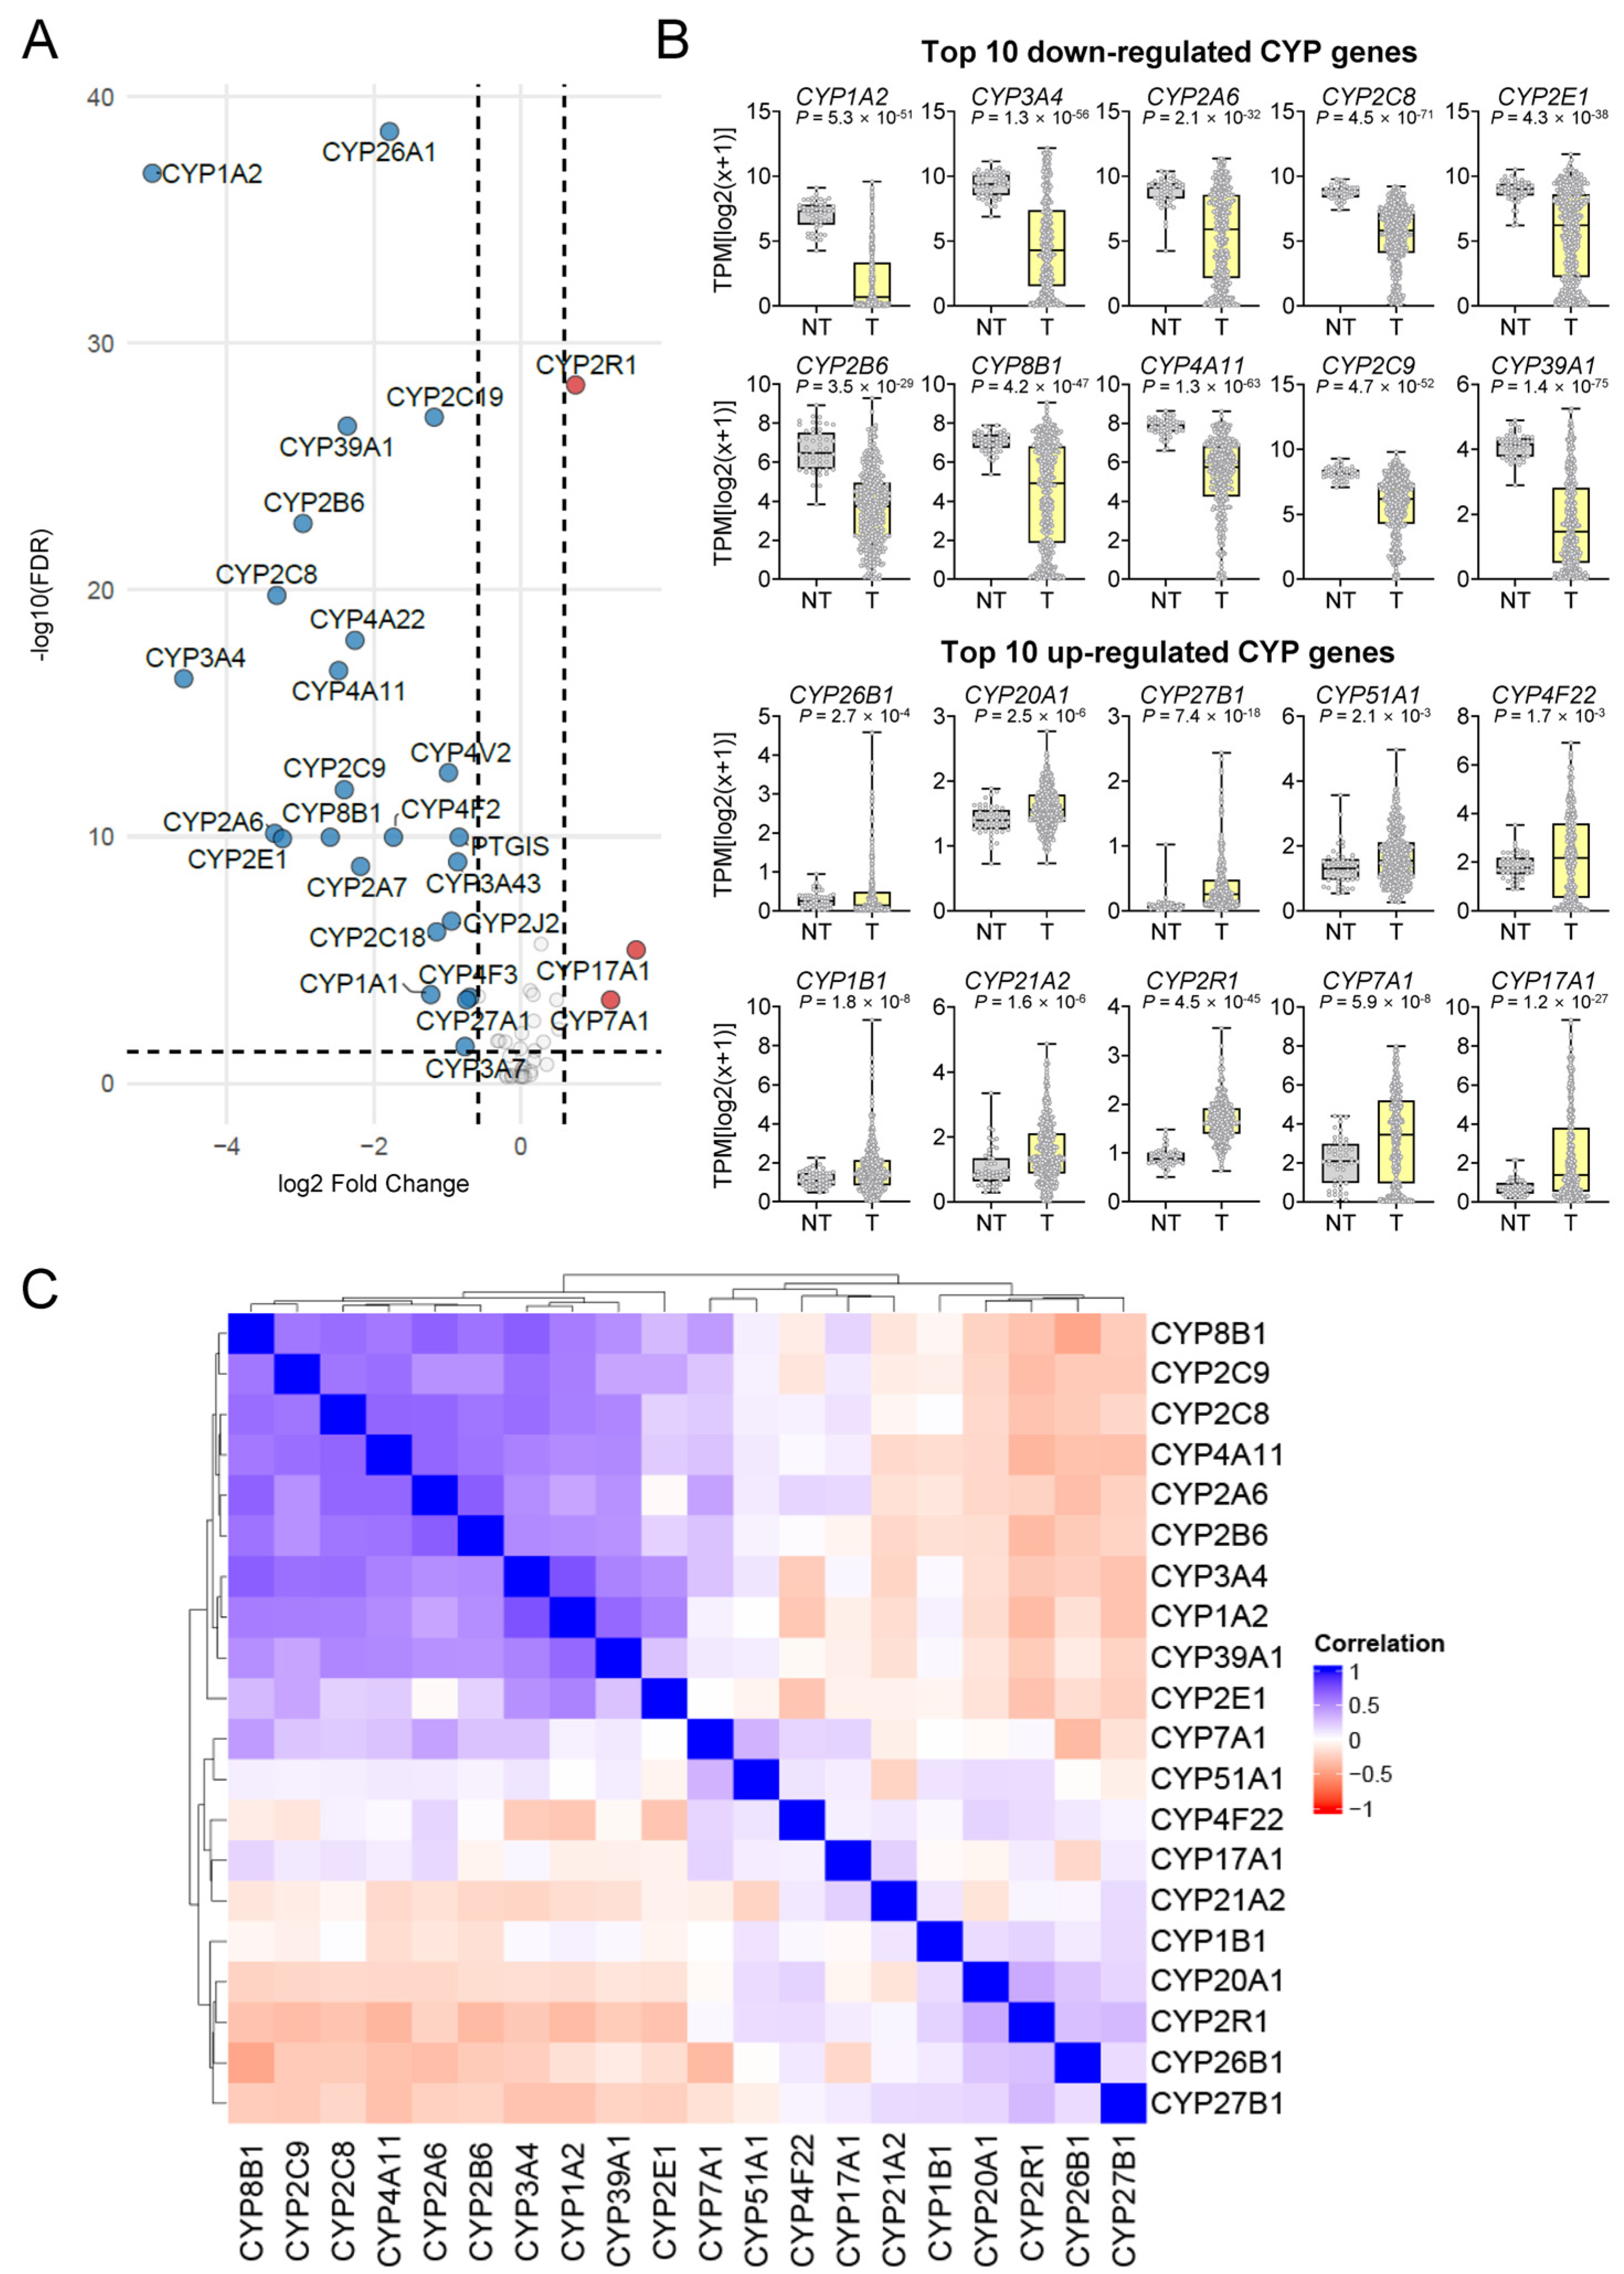
To robustly validate differential expression, we performed volcano plot and boxplot analyses using TCGA data. Among these,
CYP2R1,
CYP7A1, and
CYP17A1 were markedly up-regulated, whereas
CYP1A2,
CYP3A4, and
CYP2C8 were strongly down-regulated (
Figure 3A). Based on differential expression analysis in the TCGA-LIHC cohort, CYP genes were ranked according to statistical significance (
p < 0.05) and magnitude of change, and the 20 most dysregulated genes with the largest absolute fold-change were selected for subsequent ROC screening. The top 10 up-regulated CYP genes (
CYP17A1,
CYP7A1,
CYP2R1,
CYP21A2,
CYP1B1,
CYP4F22,
CYP51A1,
CYP27B1,
CYP20A1, and
CYP26B1) and the top 10 down-regulated CYP genes (
CYP1A2,
CYP3A4,
CYP2A6,
CYP2C8,
CYP2E1,
CYP2B6,
CYP8B1,
CYP4A11,
CYP2C9, and
CYP39A1) were selected as candidates for further evaluation. Boxplot analyses confirmed robust and significant differences in expression between tumor and non-tumor tissues for each of these genes (
Figure 3B).
Correlation analysis of the top 20 candidate CYP genes revealed subgroup-specific clustering patterns. Within the down-regulated CYP subset, the strongest positive correlations were observed for
CYP1A2–
CYP3A4 (r = 0.75,
p = 6.2 × 10
−77),
CYP2A6–
CYP2B6 (r = 0.70,
p = 3.1 × 10
−63), and
CYP3A4–
CYP8B1 (r = 0.70,
p = 3.5 × 10
−62). Among the up-regulated CYPs, the most notable positive associations were
CYP20A1–
CYP2R1 (r = 0.37,
p = 9.2 × 10
−15),
CYP51A1–
CYP7A1 (r = 0.33,
p = 4.5 × 10
−12), and
CYP27B1–
CYP2R1 (r = 0.30,
p = 4.0 × 10
−10). By contrast, cross-group correlations were generally weak or negative, with the strongest inverse relationships identified between
CYP8B1 (down) and
CYP26B1 (up) (r = –0.46,
p = 2.4 × 10
−23),
CYP4A11 (down) and
CYP2R1 (up) (r = –0.38,
p = 5.8 × 10
−16), and
CYP2B6 (down) and
CYP2R1 (up) (r = –0.36,
p = 2.2 × 10
−14). These findings highlight tightly coordinated expression within up- and down-regulated CYP subsets, while underscoring divergent regulatory mechanisms between the two groups (
Figure 3C,
Supplementary Table S1).
Collectively, these analyses underscore the context-dependent and gene-specific deregulation of CYP family members in HCC, highlighting CYP2R1 and a select group of genes as the most prominent candidates for further functional and clinical investigation.
3.2. Diagnostic Performance of Candidate CYP Genes in HCC
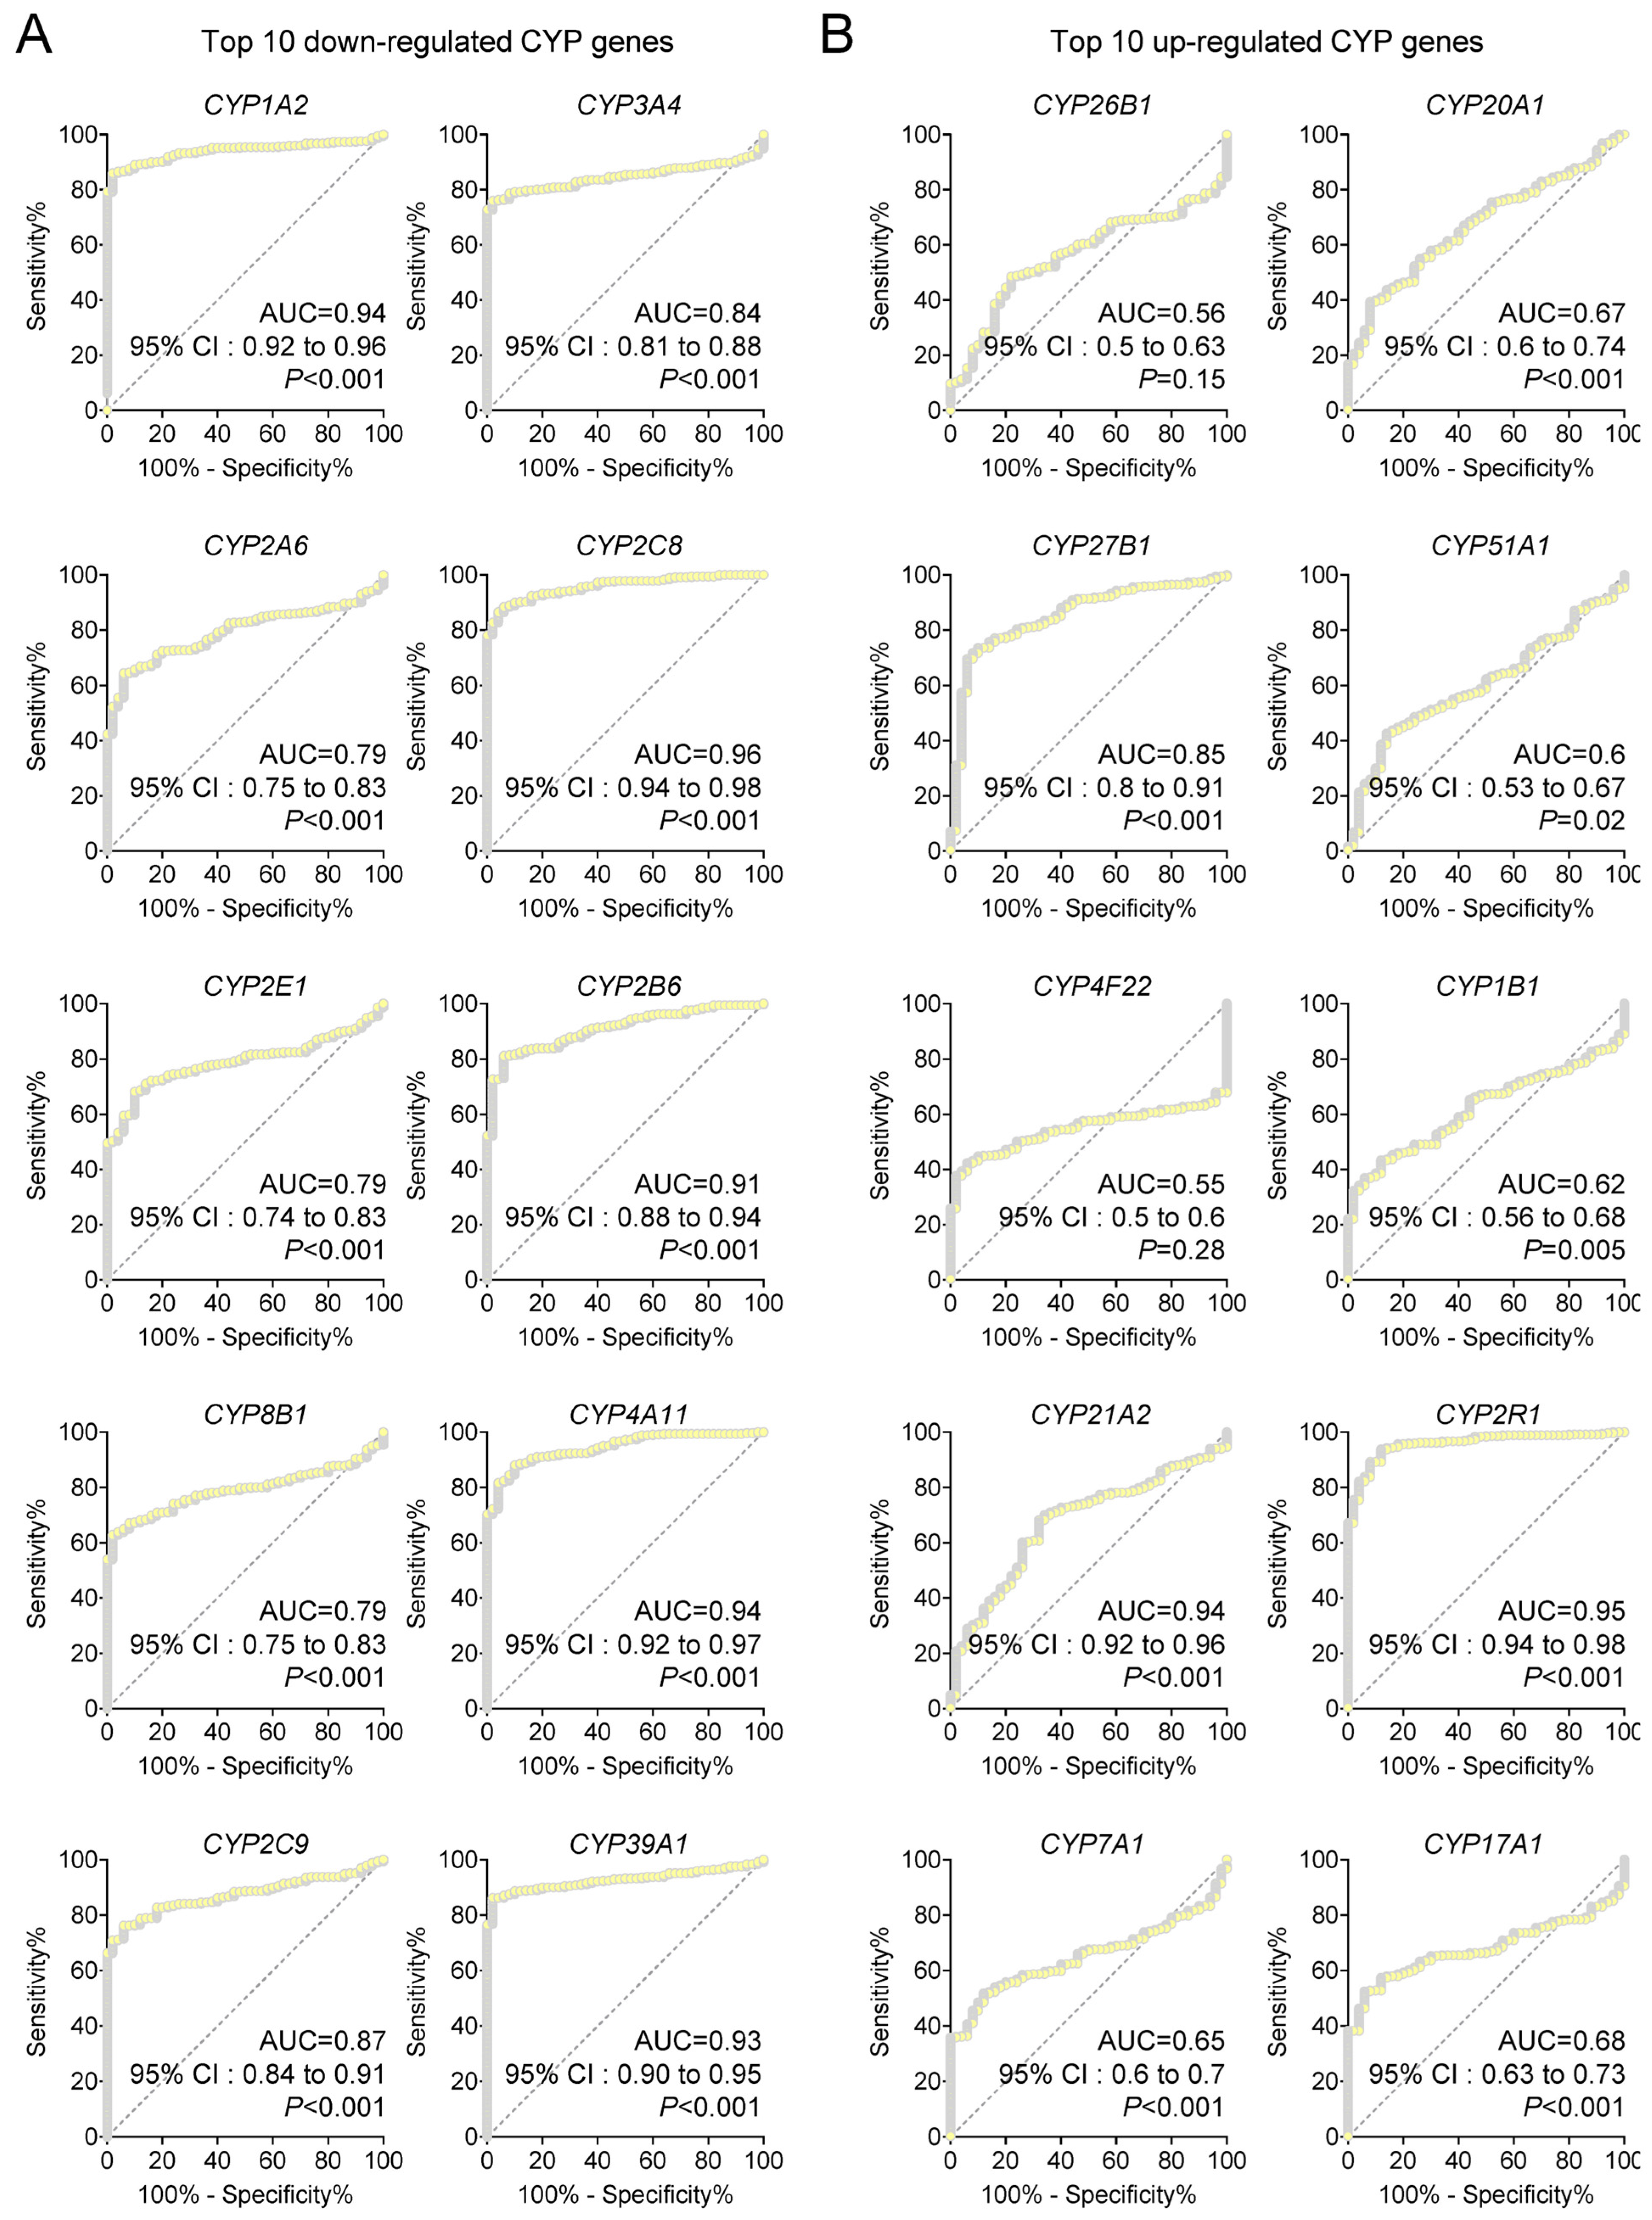
To determine the diagnostic value of the most dysregulated CYP family members, we conducted receiver-operating characteristic (ROC) curve analyses for the top 20 differentially expressed CYP genes using the TCGA-LIHC cohort, consisting of 371 tumor and 50 non-tumor samples (
Figure 4).
Within the down-regulated subset, five genes exhibited excellent discriminatory power with AUC values greater than 0.90, including CYP1A2 (AUC = 0.94, 95% CI = 0.92–0.96, p < 0.001), CYP2C8 (AUC = 0.96, 95% CI = 0.94–0.98, p < 0.001), CYP2B6 (AUC = 0.91, 95% CI = 0.88–0.94, p < 0.001), CYP4A11 (AUC = 0.94, 95% CI = 0.92–0.97, p < 0.001), and CYP39A1 (AUC = 0.93, 95% CI = 0.90–0.95, p < 0.001). CYP2C8 demonstrated the strongest performance, with an AUC of 0.96 and a narrow 95% confidence interval (0.94–0.98), highlighting its powerful ability to differentiate HCC from non-tumor tissues.
Among the up-regulated genes,
CYP21A2 (AUC = 0.94, 95% CI = 0.92–0.96,
p < 0.001) and
CYP2R1 (AUC = 0.95, 95% CI = 0.94–0.98,
p < 0.001) also showed high diagnostic accuracy. In particular,
CYP2R1 emerged as the top up-regulated diagnostic marker, matching down-regulated
CYP2C8 in performance. Other CYPs demonstrated moderate to good diagnostic capacity, with AUCs and statistical metrics summarized in
Supplementary Table S2 for all 20 candidate genes.
These findings firmly establish CYP2C8 (down-regulated) and CYP2R1 (up-regulated) as the most robust diagnostic biomarkers in the CYP family for HCC, offering high accuracy, reproducibility, and clinical applicability across independent patient datasets.
3.3. Prognostic Significance of CYP Gene Expression in HCC
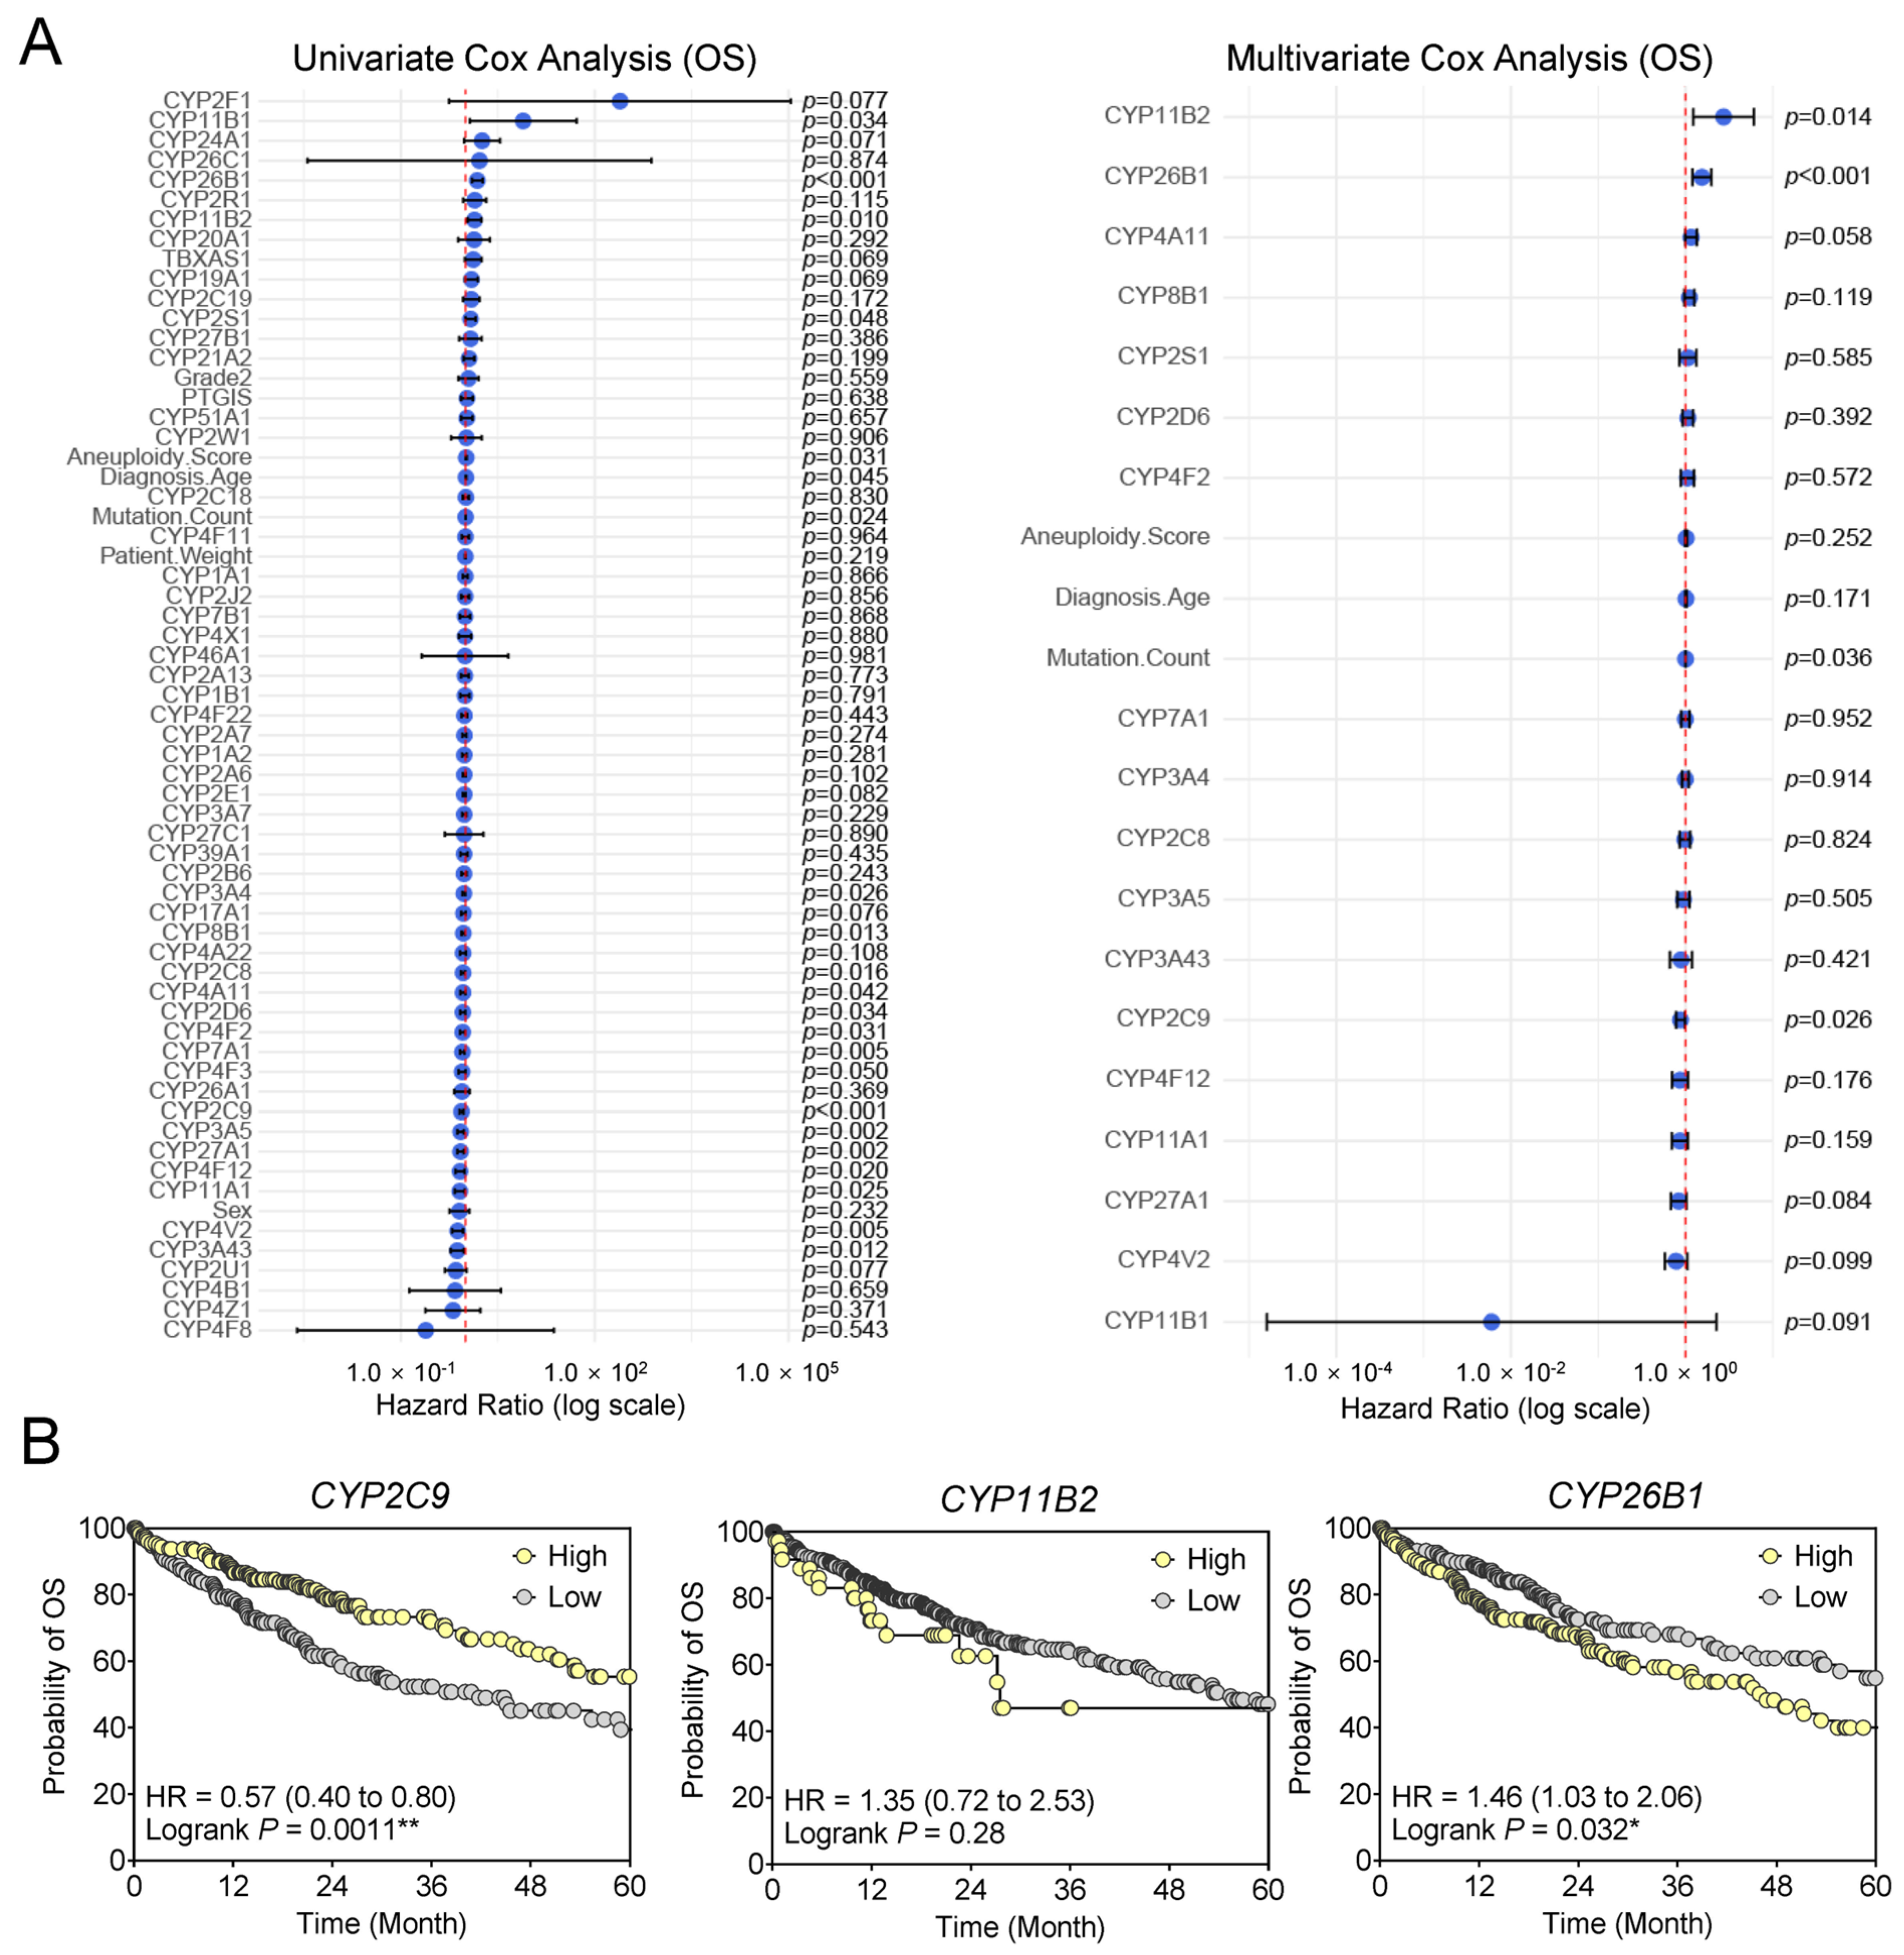
To determine the prognostic significance of CYP family members in HCC, Cox proportional hazards regression analyses were performed on TCGA cohort data. Univariate Cox analysis included six clinical variables (Diagnosis Age, Sex, Patient Weight, Aneuploidy Score, Mutation Count, and Histologic Grade [G1–2 vs. G3–4]) and 57 CYP genes (
Figure 5A,
Supplementary Table S3). A total of 19 factors demonstrated prognostic significance (
p < 0.05). Among the clinical variables, only Diagnosis Age, Aneuploidy Score, and Mutation Count were identified, although their hazard ratios (HRs) were close to 1, suggesting limited prognostic impact.
In the univariate analysis of CYP genes, CYP11B1, CYP11B2, and CYP2S1 exhibited HRs greater than 1, consistent with poor overall survival (OS). In contrast, multiple CYPs correlated with favorable prognosis (HR < 1), including CYP3A4, CYP2C8, CYP8B1, CYP4A11, CYP4F2, CYP4V2, CYP3A43, CYP27A1, CYP4F12, CYP3A5, CYP2D6, CYP11A1, and CYP7A1.
The multivariate Cox model, incorporating the 19 significant univariate factors, identified four independent predictors for OS: Mutation Count (HR = 1.00, 95% CI: 1.00–1.00,
p = 0.036),
CYP2C9 (HR = 0.88, 95% CI: 0.78–0.98,
p = 0.026),
CYP26B1 (HR = 1.54, 95% CI: 1.20–1.98,
p = 0.001), and
CYP11B2 (HR = 2.73, 95% CI: 1.22–6.07,
p = 0.014). These findings highlight that both clinical genomic burden (Mutation Count) and specific CYP family members contribute to survival outcomes in HCC (
Supplementary Table S4). The final multivariable model achieved a concordance index of 0.669, indicating moderate concordance between predicted and observed survival.
Kaplan–Meier survival analyses further illustrated the clinical relevance of these CYPs. Patients with high
CYP2C9 expression exhibited significantly improved OS compared with the low-expression group (HR = 0.57, 95% CI: 0.40–0.80, log-rank
p = 0.0011). In contrast, high
CYP26B1 expression was associated with significantly poorer OS (HR = 1.46, 95% CI: 1.03–2.06, log-rank
p = 0.032). For
CYP11B2, dichotomized analysis (zero vs. non-zero expression) suggested a modest prognostic trend (HR = 1.35, 95% CI: 0.72–2.53, log-rank
p = 0.28), though expression was nearly absent in the majority of cases (n = 330) (
Figure 5B).
Collectively, these findings establish CYP2C9 (favorable) and CYP26B1 (unfavorable) as independent prognostic biomarkers for HCC, whereas the prognostic significance of CYP11B2 is limited by sparse hepatic expression and skewed distribution.
3.4. Comprehensive Validation of CYP2R1 Overexpression and Diagnostic Efficacy in HCC
To assess protein expression of candidate CYP biomarkers, we performed immunohistochemical analysis using the Human Protein Atlas and tissue microarrays for five genes:
CYP2C8,
CYP2C9,
CYP2R1,
CYP26B1, and
CYP11B2 (
Supplementary Figure S2).
CYP2C8 and
CYP2C9 showed marked reduction in HCC, matching their previously reported diagnostic and prognostic significance in liver cancer. However, as both are already well-established markers in hepatocellular carcinoma [
10,
16], they were not selected for further novelty-based validation. CYP11B2 and CYP26B1 did not show a significant difference between tumor and non-tumor tissue at the protein level, so they were excluded as practical tissue biomarkers. In contrast, CYP2R1 demonstrated robust and significant overexpression in HCC at both the transcript and protein levels (
p < 0.001), consistently validated across platforms, and was prioritized as the novel candidate for detailed analysis.
Given the unique and consistent upregulation of
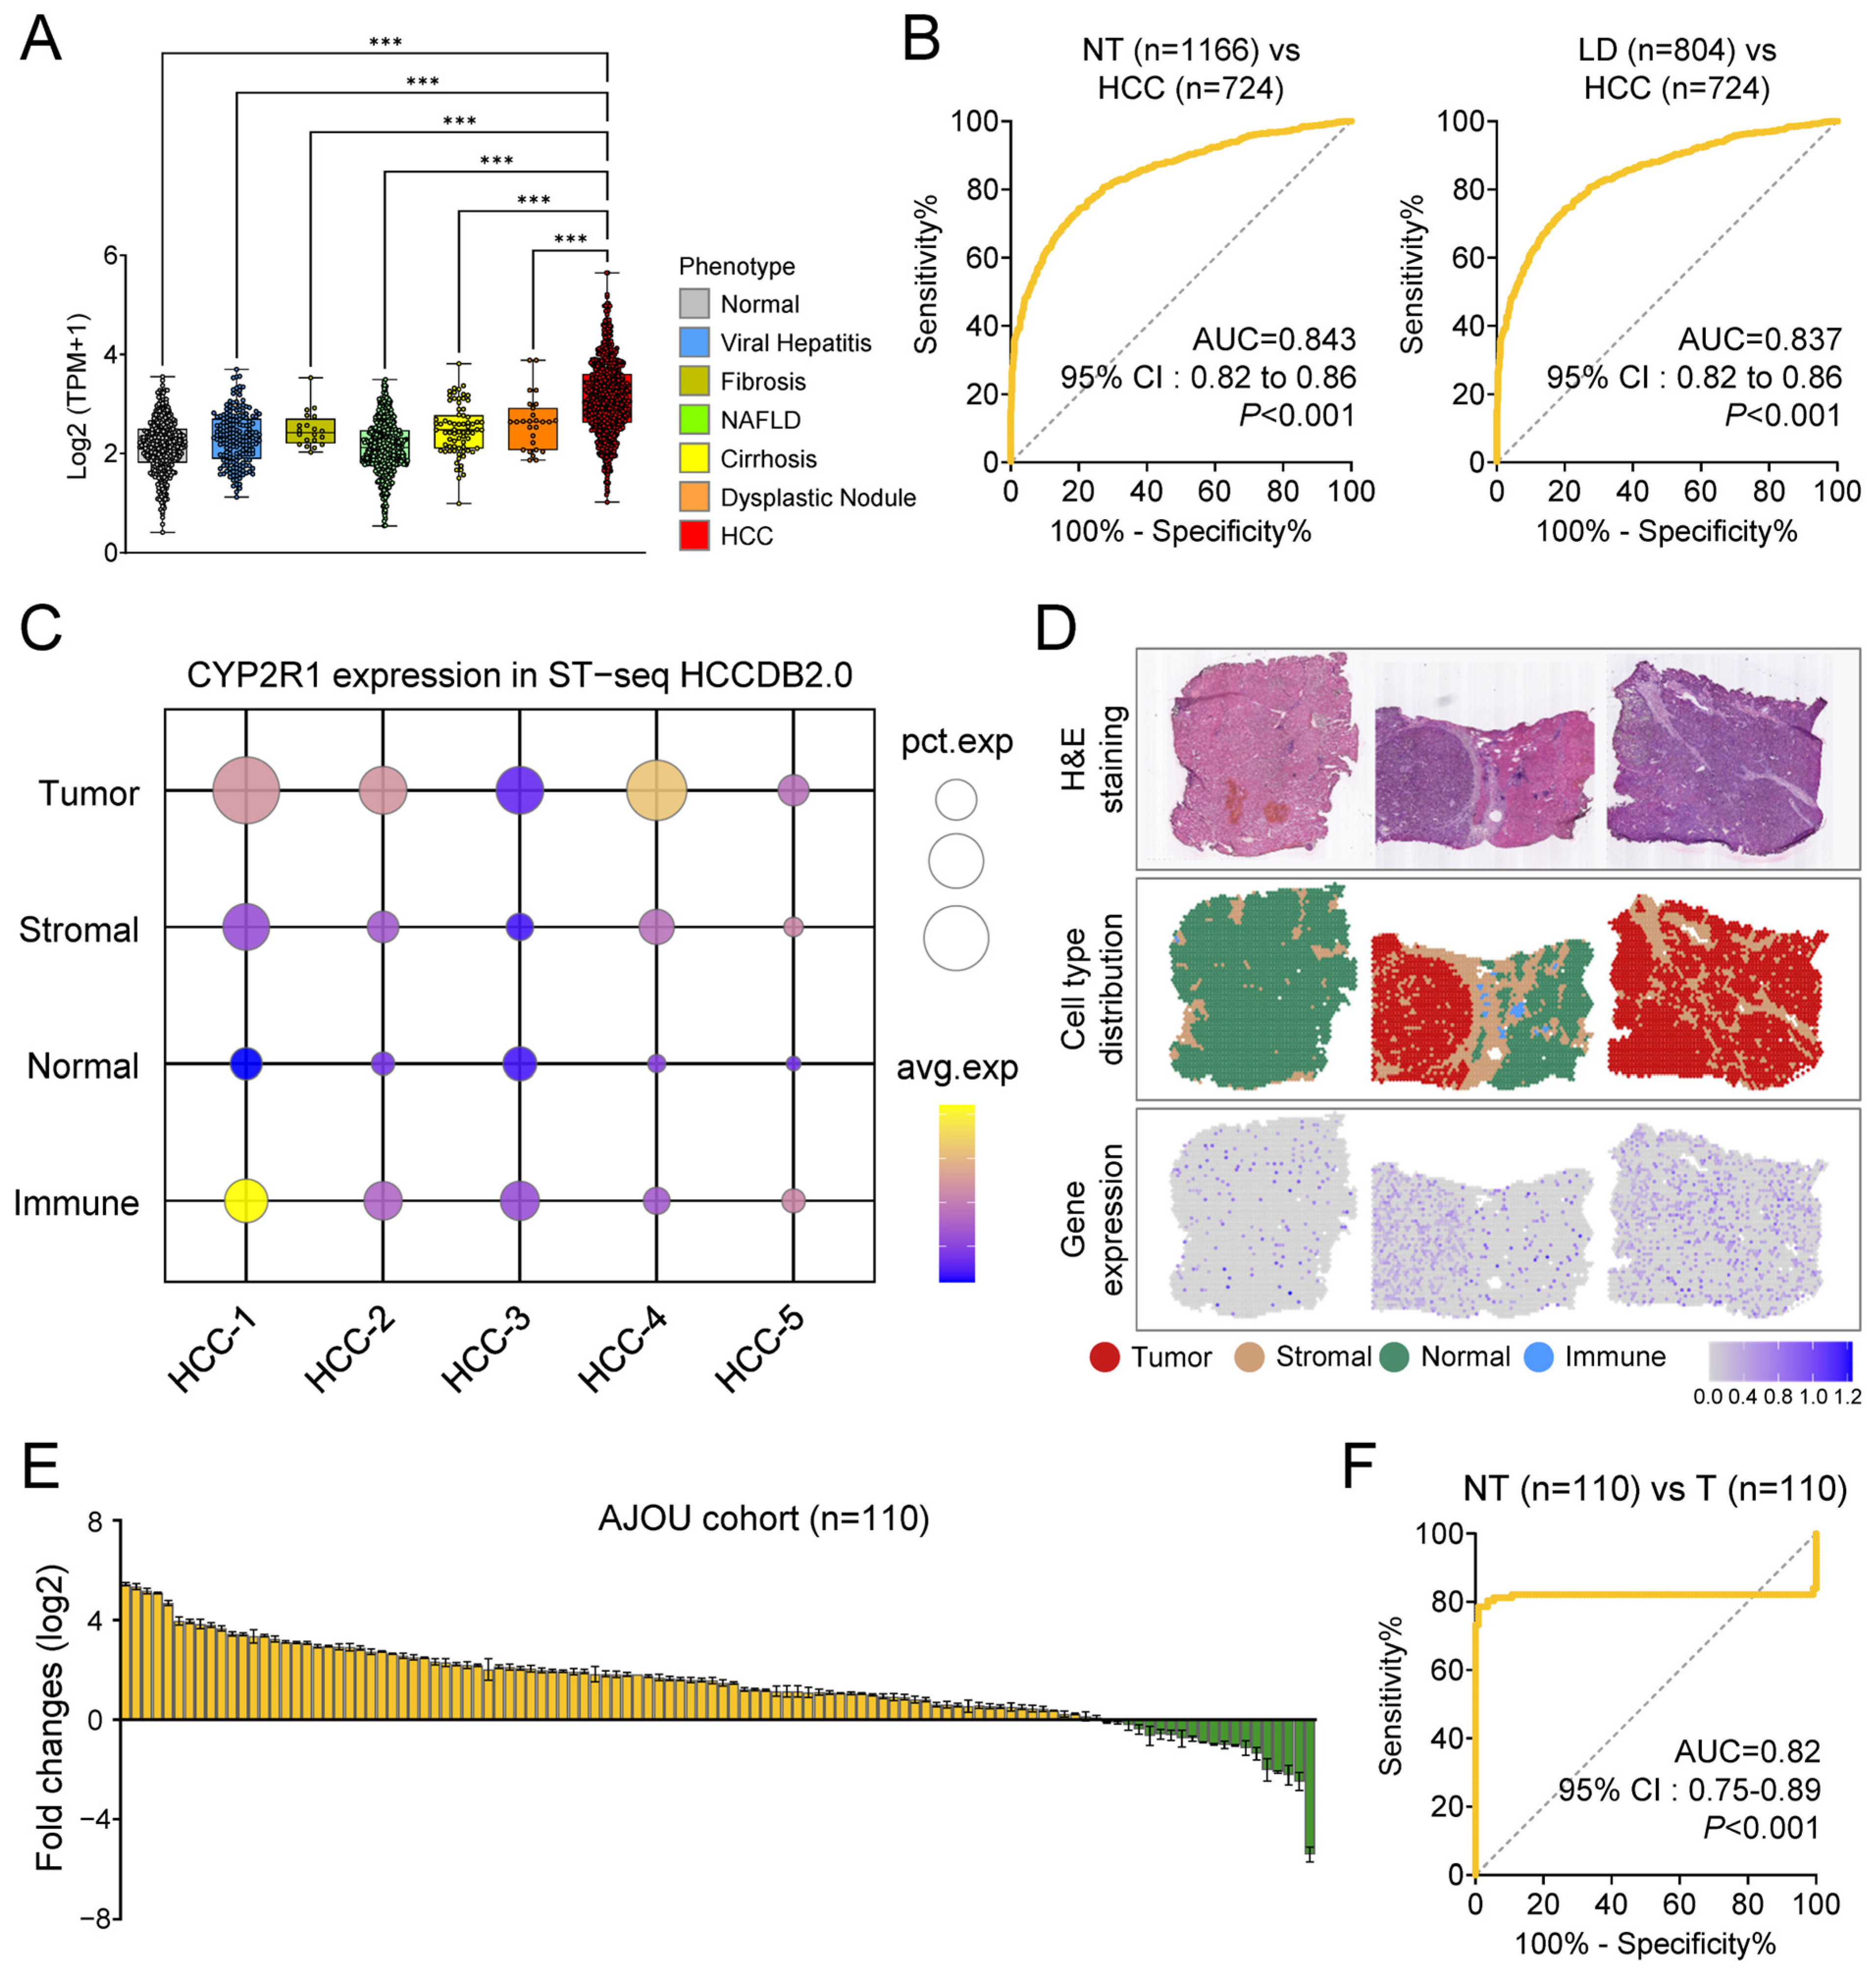
CYP2R1 in HCC, we further validated its clinical utility across diverse patient cohorts and biological contexts. In the GepLiver cohort,
CYP2R1 expression was markedly elevated in HCC compared to all other groups, including normal liver, viral hepatitis, NAFLD, fibrosis, cirrhosis, and dysplastic nodules (
Figure 6A).
CYP2R1 demonstrated strong diagnostic accuracy, with AUC = 0.843 (95% CI: 0.82–0.86,
p < 0.001) for distinguishing HCC from non-tumor tissues, and similar performance after excluding normal controls (AUC = 0.837, 95% CI = 0.82–0.86,
p < 0.001) (
Figure 6B).
Spatial transcriptomics using the HCCDB2.0 resource localized
CYP2R1 overexpression specifically to malignant hepatocyte (tumor) regions, with minimal signal in the surrounding stromal, immune, or normal compartments (
Figure 6C,D). Furthermore, matched tumor and adjacent tissue samples from an independent Ajou University Hospital cohort (n = 110) showed significant overexpression of
CYP2R1 in HCC by qRT-PCR (
Figure 6E), with ROC analysis yielding an AUC of 0.82 (95% CI = 0.75–0.89,
p < 0.001), confirming the biomarker’s reproducibility across populations (
Figure 6F). To assess potential confounding by tumor burden,
CYP2R1 expression was evaluated across BCLC and pathological UICC stages in the Ajou validation cohort and showed no significant stage-dependent differences (
Supplementary Figure S3A). Cohort characteristics are summarized in
Supplementary Table S6, and the paired tumor–adjacent design enabled intra-individual comparison under a standardized institutional protocol, minimizing patient-level confounding. In an exploratory subset with paired primary and recurrent tumors (n = 6),
CYP2R1 expression showed heterogeneous changes at recurrence (
Supplementary Figure S3B). In addition, tumors with vascular invasion exhibited higher
CYP2R1 expression than those without vascular invasion (
Supplementary Figure S3C). An exploratory ELISA analysis of plasma samples showed modest discrimination between hepatocellular carcinoma and non-tumor liver disease controls (AUC = 0.71), suggesting that circulating
CYP2R1 may be detectable but requires further validation for clinical application (
Supplementary Figure S3D). Taken together, these findings provide cross-platform, multi-cohort evidence that
CYP2R1 is consistently and specifically upregulated in HCC, supporting its potential utility as a novel diagnostic biomarker across independent cohorts.
3.5. Functional Characterization of CYP2R1-Associated Pathways in HCC
To elucidate the biological programs linked to
CYP2R1 expression, we analyzed co-expression networks using cBioPortal. A total of 594 genes significantly correlated with
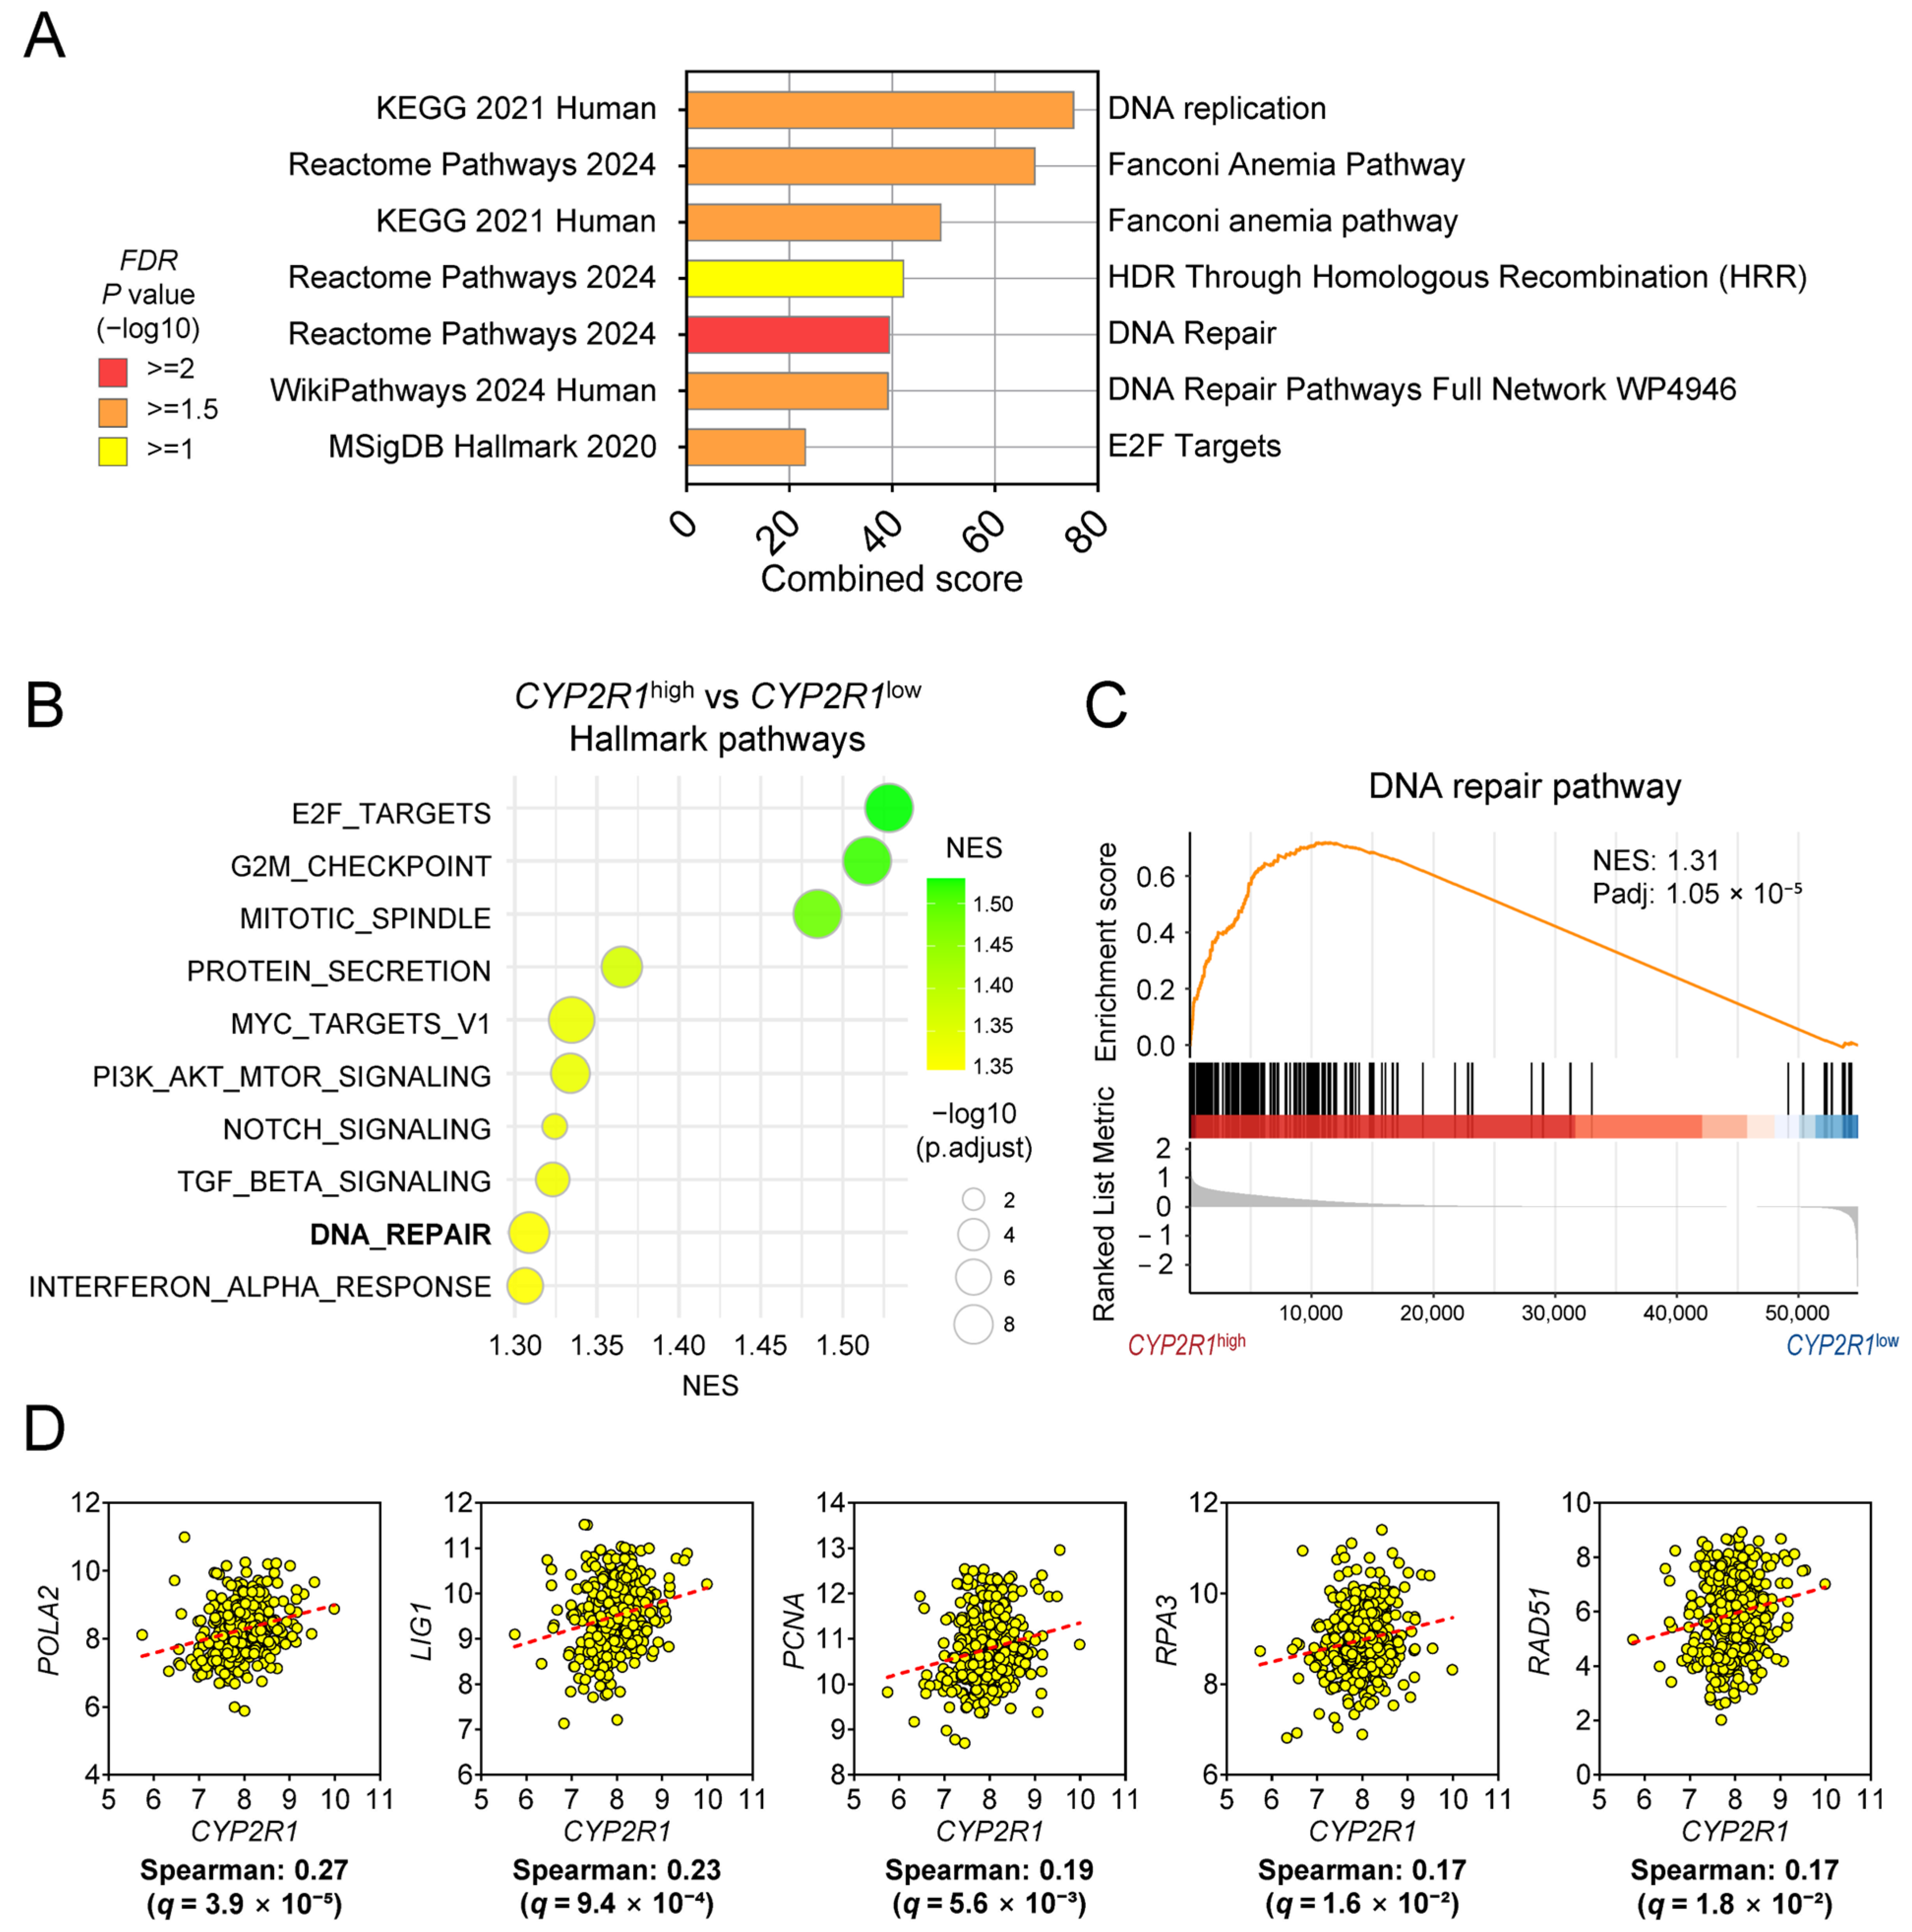
CYP2R1 (r ≥ |0.2|, q < 0.05) were subjected to enrichment analysis with EnrichR. Across the four enrichment databases, several pathways remained statistically significant after multiple-testing correction (FDR-adjusted
p < 0.05). Among these, DNA replication was among the top-enriched biological processes associated with the
CYP2R1 co-expression network. In particular, pathways related to DNA replication, base excision repair, homologous recombination, and general DNA repair processes showed strong enrichment signals. In addition, the E2F Targets signature from the MSigDB Hallmark collection was also identified as a significantly enriched pathway. These findings collectively indicate that
CYP2R1-associated transcriptional programs are closely linked to cell-cycle regulation and DNA repair–related biological processes (
Figure 7A,
Supplementary Figure S4).
To validate these enrichment findings, gene set enrichment analysis (GSEA) was performed on TCGA-LIHC data stratified by
CYP2R1 expression quartiles. Differential expression analysis between
CYP2R1-high (Q1) and
CYP2R1-low (Q4) tumors was used to generate a ranked gene list for Hallmark gene set enrichment. Among the top 10 enriched pathways, DNA Repair was again identified as significantly upregulated in the
CYP2R1-high group (
Figure 7B). The enrichment curve confirmed robust activation of DNA repair programs in the
CYP2R1-high group (NES = 1.31, adjusted
p = 1.05 × 10
−5) (
Figure 7C).
Correlation analysis supported these results, showing that
CYP2R1 expression positively correlated with key DNA replication and repair factors:
POLA2 (r = 0.27, q = 3.9 × 10
−5),
LIG1 (r = 0.23, q = 9.4 × 10
−4),
PCNA (r = 0.19, q = 5.6 × 10
−3),
RPA3 (r = 0.17, q = 1.6 × 10
−2), and
RAD51 (r = 0.17, q = 1.8 × 10
−2) (
Figure 7D).
POLA2 and
LIG1 are essential for the initiation of DNA replication and repair [
17,
18], while
PCNA and
RPA3 play central roles in replication fork stability and repair fidelity [
19,
20].
RAD51 is a key mediator of homologous recombination repair [
21]. The consistent co-expression of
CYP2R1 with these core DNA repair genes suggests that high
CYP2R1 expression is closely linked to enhanced activation of DNA replication and repair machinery in HCC, potentially contributing to the maintenance of genomic stability in tumor cells.
3.6. CYP2R1 Expression Is Closely Associated with MDSC Infiltration and Marker Gene Signature in HCC
To investigate the immunological context of
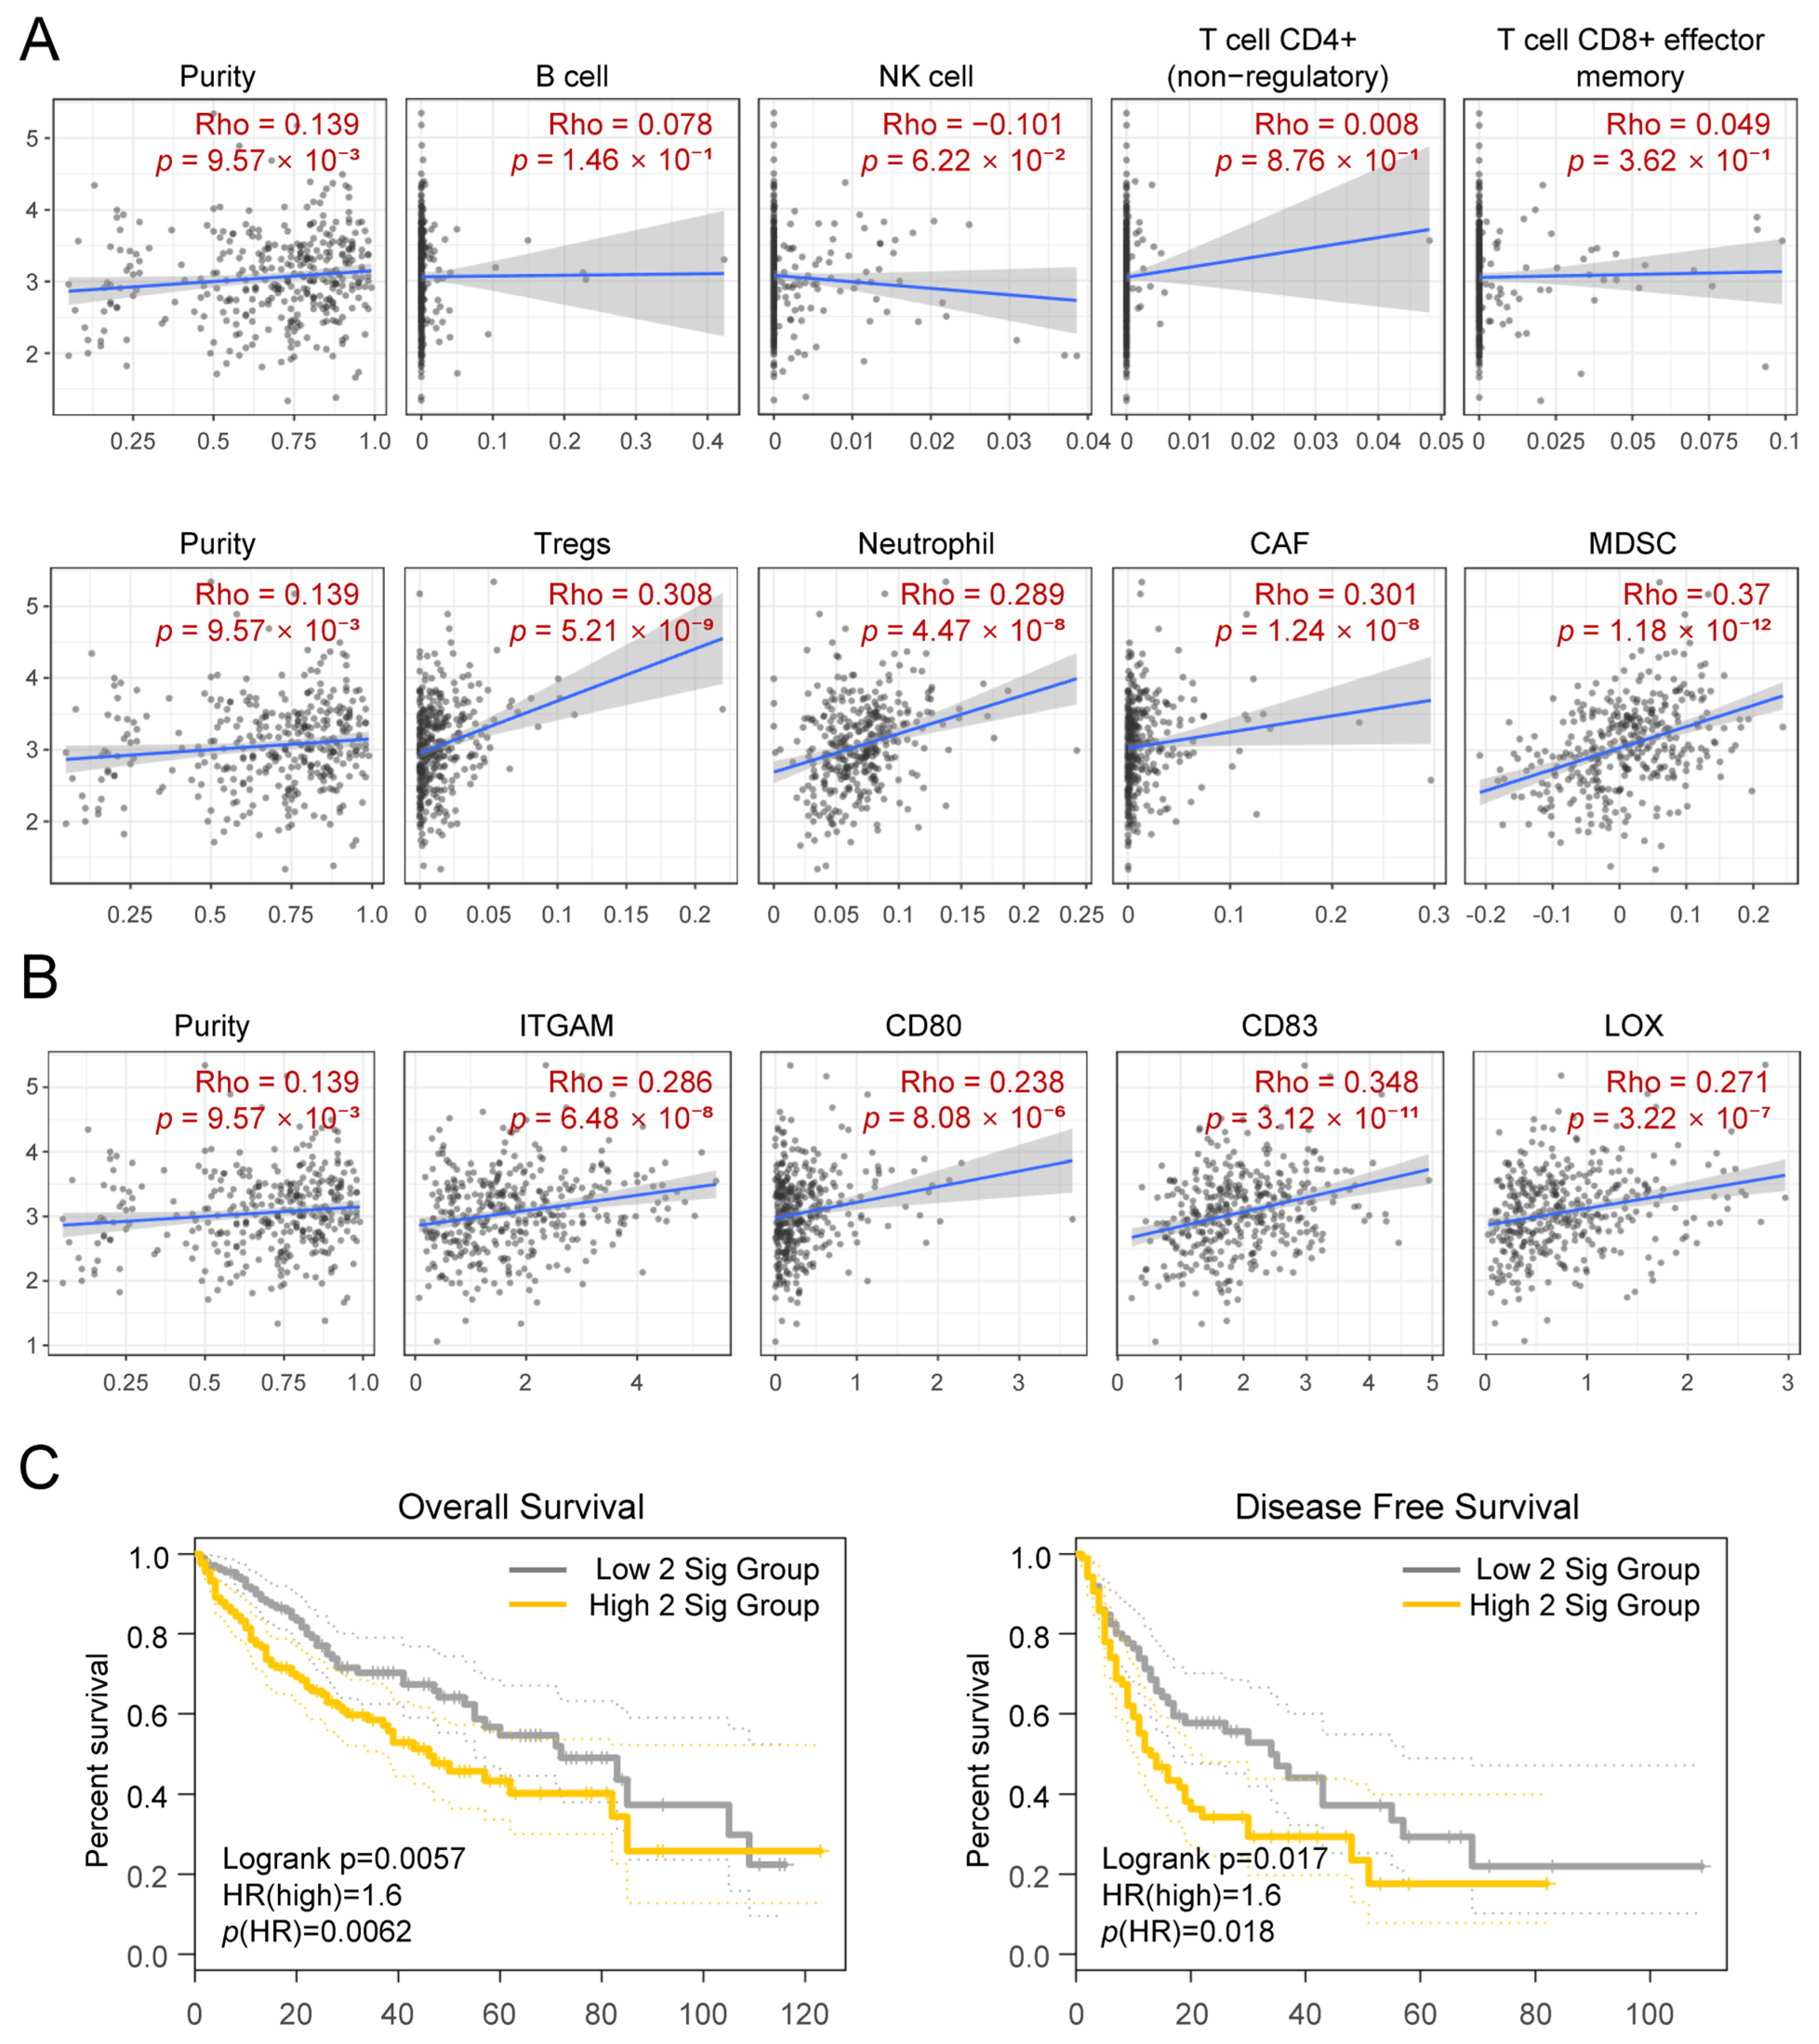
CYP2R1 expression in HCC, we utilized the TIMER2.0 platform to perform correlation analyses between
CYP2R1 and various tumor-infiltrating immune cell populations (
Figure 8A). Among lymphoid and myeloid subtypes, the strongest positive association was observed between
CYP2R1 expression and myeloid-derived suppressor cell (MDSC) infiltration (r = 0.37,
p = 1.18 × 10
−12). Correlations with other major immune cell populations, including B cells, NK cells, CD4+ and CD8+ T cells, were weak or non-significant.
To further dissect the relationship between
CYP2R1 and the immunosuppressive microenvironment, we analyzed the expression of established MDSC marker genes. Among eleven evaluated markers, several exhibited statistically significant positive correlations with
CYP2R1. Notably,
CD83 showed the highest correlation (r = 0.348,
p = 3.12 × 10
−11), followed by
LOX (r = 0.271,
p = 3.22 × 10
−7),
ITGAM (r = 0.286,
p = 6.48 × 10
−8) (
Figure 8B). Full correlation results for all eleven markers are provided in
Supplementary Table S5.
To further evaluate the prognostic implications of the
CYP2R1–
CD83 axis, we performed Kaplan–Meier survival analyses using the GEPIA platform. While
CYP2R1 or
CD83 expression alone did not significantly affect overall or disease-free survival, their combined high expression was significantly associated with poorer patient outcomes. Specifically, in the OS analysis, the
CYP2R1–
CD83 high co-expression group exhibited significantly shorter survival compared with other groups (log-rank
p = 0.0057; HR (high) = 1.6;
p (HR) = 0.0062). Similarly, disease-free survival (DFS) analysis revealed a consistent trend, with the high co-expression group showing reduced recurrence-free survival (log-rank
p = 0.017; HR (high) = 1.6;
p (HR) = 0.018) (
Figure 8C).
These findings suggest that high CYP2R1 expression in HCC is linked to increased infiltration and molecular signatures of MDSCs, emphasizing a potential immunosuppressive niche associated with CYP2R1 upregulation. The observed CYP2R1–CD83 co-expression-dependent reduction in both overall and disease-free survival further supports the clinical relevance of this metabolic–immune interaction axis in HCC.
Given the established role of MDSCs in tumor immune evasion and resistance to immunotherapy, this CYP2R1–MDSC axis highlights a biologically and clinically meaningful connection warranting further mechanistic and translational investigation.
4. Discussion
Cytochrome P450 enzymes are central regulators of hepatic metabolism, yet their collective contribution to hepatocarcinogenesis remains incompletely understood. By integrating multi-cohort transcriptomic datasets, survival analyses, and functional inference, this study delineates global dysregulation of CYP family genes in HCC and identifies distinct diagnostic and prognostic signatures. Among these, CYP2R1 emerged as a novel tumor-associated CYP with both diagnostic and potential mechanistic relevance, while CYP2C9 and CYP26B1 demonstrated opposing prognostic implications. These findings suggest that CYP reprogramming in HCC is gene-specific and reflects the interplay between metabolic, genomic, and signaling alterations during liver tumor development.
Among the CYP genes analyzed,
CYP2R1 showed the strongest diagnostic potential. It was the most significantly up-regulated gene in HCC and demonstrated the highest diagnostic accuracy (AUC = 0.95).
CYP2R1 encodes a microsomal vitamin D 25-hydroxylase that converts vitamin D to 25-hydroxyvitamin D, the major circulating biomarker of vitamin D status [
22]. Although its physiological hepatic role is well established, its involvement in liver tumorigenesis has not previously been characterized. The upregulation of
CYP2R1 may extend beyond vitamin D metabolism. The vitamin D–VDR signaling axis has been reported to exert antiproliferative, anti-inflammatory, and DNA-protective effects in the liver [
23], and
CYP2R1 functions as a key enzyme in this pathway. Dysregulated
CYP2R1 expression may therefore reflect metabolic adaptation to oncogenic stress, linking hepatic metabolism to genomic maintenance and immune regulation in HCC.
CYP2C9 emerged as a reliable prognostic marker. In both univariate and multivariate Cox regression analyses, higher
CYP2C9 expression was consistently associated with favorable overall survival. Previous studies have reported reduced
CYP2C9 expression in HCC tissues compared with adjacent non-tumor liver, suggesting that its loss of hepatic metabolic capacity may contribute to disease progression and poorer clinical outcomes [
24]. Our findings reinforce
CYP2C9 as a prognostically relevant CYP gene in HCC.
In contrast,
CYP26B1 expression correlated with poorer survival.
CYP26B1 catalyzes the degradation of retinoic acid, a signaling molecule essential for cellular differentiation and growth. Dysregulation of retinoic acid metabolism has been implicated in hepatocarcinogenesis [
25,
26], and increased
CYP26B1 expression may promote tumor progression by suppressing retinoid signaling. Although studies examining
CYP26B1 in HCC remain limited, our results suggest that it may represent a candidate prognostic biomarker. It should also be noted, however, that the Cox regression analyses in this study were designed as exploratory modeling within the TCGA-LIHC cohort to identify candidate prognostic CYP genes rather than to construct a fully optimized clinical prediction model.
Other CYP genes provided additional context.
CYP2C8 showed excellent diagnostic performance but was markedly downregulated in HCC, limiting its translational potential as a practical biomarker. Conversely, the apparent prognostic signal for
CYP11B2 is likely artifactual.
CYP11B2 encodes aldosterone synthase and is primarily expressed in the adrenal cortex [
27]. The near-absent expression in most HCC samples suggests that the observed survival association likely reflects technical variability rather than biological relevance.
Importantly, CYP2R1 upregulation did not appear to depend on tumor stage. In the validation cohort, CYP2R1 expression did not significantly differ across BCLC or modified UICC stages, indicating that its induction represents a stage-independent molecular feature of HCC rather than a secondary consequence of tumor progression. In a small exploratory subset with paired primary and recurrent tumors, CYP2R1 expression showed heterogeneous changes at recurrence, suggesting that its regulation during tumor evolution may vary between patients.
Our integrative analysis also revealed an association between
CYP2R1 expression and transcriptional programs related to DNA replication and repair.
CYP2R1 expression correlated positively with key replication and repair genes, including
POLA2,
LIG1, and
PCNA.
POLA2 participates in replication initiation through DNA polymerase α complexes [
28].
LIG1 is essential for Okazaki fragments ligation and base excision repair [
29], and PCNA functions as a central processivity factor coordinating DNA replication and repair fidelity [
30]. These observations suggest that CYP2R1-high tumors may exhibit enhanced transcriptional activity in DNA maintenance pathways.
Because
CYP2R1 participates in microsomal oxidation reactions capable of generating reactive oxygen species (ROS), it is possible that increased
CYP2R1 expression may be associated with compensatory activation of DNA repair pathways. However, the present transcriptomic analyses reveal correlations rather than causal relationships, and experimental studies will be required to determine whether
CYP2R1 directly influences DNA repair processes. Vitamin D–VDR signaling has also been reported to regulate DNA repair genes such as
RAD51 and
LIG1 via p53-dependent mechanisms [
31], raising the possibility that CYP2R1-associated vitamin D metabolism may influence genomic maintenance pathways. These observations should therefore be considered hypothesis-generating and require functional validation.
In addition to genomic maintenance, our analyses suggest a potential immunological dimension to
CYP2R1 activity. TIMER-based immune infiltration analysis revealed a positive correlation between
CYP2R1 expression and myeloid-derived suppressor cell (MDSC) abundance, along with co-expression of MDSC-associated genes, including
CD83,
LOX,
ITGAM, and CD80. Because MDSCs suppress antitumor immunity and contribute to immune checkpoint resistance [
32], these findings raise the possibility that CYP2R1-associated metabolic changes may contribute to an immunosuppressive tumor microenvironment. However, these immune infiltration estimates were derived from transcriptomic deconvolution methods and should therefore be interpreted cautiously. Computational approaches such as TIMER2.0 infer immune cell abundance indirectly from bulk RNA-seq data and cannot capture spatial immune architecture. Future studies using spatial transcriptomics or immunohistochemical validation will be required to confirm the relationship between
CYP2R1 expression and MDSC infiltration.
Several limitations should be considered when interpreting the present findings. Public transcriptomic datasets such as TCGA-LIHC and GepLiver lack detailed information on certain potential confounding variables, including medication exposure, alcohol consumption, metabolic comorbidities, and tissue procurement conditions. Because CYP enzymes are inducible by environmental and pharmacological factors, complete matching across disease groups was not feasible. Nevertheless, our findings were consistently reproduced across independent cohorts and further supported by a paired validation cohort from Ajou University Hospital, which minimized inter-individual variability. Future studies incorporating proteomic or antibody-based validation will further clarify the biological role of CYP2R1 in HCC.
In summary, this study identifies CYP2R1 as a promising metabolic and immunogenomic biomarker candidate and highlights CYP2C9 and CYP26B1 as prognostically relevant CYP genes in HCC. These findings provide insight into the heterogeneous roles of CYP family members in liver cancer and suggest that metabolic enzymes may contribute to tumor-associated genomic and immune adaptations. CYP2R1 may represent a complementary tissue-based biomarker reflecting metabolic alterations in HCC. However, direct head-to-head comparisons with established serum biomarkers such as AFP and PIVKA-II were not available in the current retrospective cohorts, and future studies integrating tissue and circulating biomarkers will be required to determine their combined clinical utility.



 ,
,