Abstract
Background: Diffuse large B-cell lymphoma (DLBCL) is a biologically heterogeneous malignancy, with various outcomes despite significant advances in therapeutic options. Current conventional prognostic tools, e.g., the International Prognostic Index (IPI), lack sufficient precision at an individual patient level. However, artificial intelligence (AI), including machine learning (ML) and deep learning (DL), can enable specialists to navigate complex datasets, with the final aim of improving prognostic models for DLBCL. Objectives: This scoping review aims to systematically map the current literature regarding the use of AI/ML techniques in DLBCL outcome prediction and risk stratification. We categorized studies by data modality and computational approach to identify key trends, knowledge gaps, and opportunities for their translation into current practice. Methods: We conducted a structured search of the PubMed/MEDLINE, Scopus, and Cochrane Library databases through July 2025 using terms related to DLBCL, prognosis, and AI/ML. Eligible studies included original papers applying AI/ML to predict survival outcomes, classify risk groups, or identify prognostic subtypes. Studies were categorized based on input modality: clinical, positron emission tomography/computed tomography (PET/CT) imaging, histopathology, transcriptomics, genomics, circulating tumor DNA (ctDNA), and multi-omics data. Narrative synthesis was performed in line with PRISMA-ScR guidelines. Results: From the 215 records screened, 91 studies met the inclusion criteria. Group-wise we report the following categories: clinical risk features (n = 8), PET/CT imaging (n = 30), CT (n = 1), digital pathology (n = 3), conventional histopathology (n = 2), gene expression profiling (n = 19), specific mutational signatures (n = 18), ctDNA (n = 3), microRNA (n = 2), and multi-omics integration (n = 5). The most common techniques reported amongst the papers included ensemble learning, convolutional neural networks (CNNs), and LASSO-based Cox models. Several AI techniques demonstrated superior predictive performance over IPI, with area under the curve (AUC) values frequently exceeding 0.80. Multi-omics models and ctDNA-based predictors showed strong potential for clinical translation, a perspective worth considering in further studies. Conclusions: AI/ML methods are increasingly used in DLBCL to improve prognostic accuracy by leveraging data types with diverse inputs. These approaches allow an enhanced stratification, superior to traditional indices, and support the early identification of high-risk patients, earlier guidance for therapy tailoring, and early trial enrollment for flagged cases. Future investigations should focus on external validation and improvement of model interpretability, with tangible perspectives of integration into real-world workflows and translation from bench to bedside.
1. Introduction
Diffuse large B-cell lymphoma (DLBCL) is the most common subtype of non-Hodgkin’s lymphoma, characterized by clinically aggressive behavior and a heterogeneous biological landscape [1]. The current standard of care involves a chemoimmunotherapy backbone regimen, either R-CHOP (rituximab, cyclophosphamide, doxorubicin, vincristine, and prednisone) or pola-R-CHP (CD79b-directed antibody drug conjugate polatuzumab vedotin-piiq plus R-CHP), which has a near 60% curability rate. Nevertheless, a significant proportion of subjects will most likely fall into the category of primary refractory DLBCL or will relapse in the first 24 months after therapy discontinuation [1]. Undoubtedly, these patients face a poor prognosis, with lower survival rates for those who do not undergo a curative salvage therapy, such as stem cell transplantation or chimeric antigen receptor T-cell (CAR-T) therapy. According to the most recent version of the National Comprehensive Cancer Network (NCCN) B-cell lymphoma treatment guidelines, DLBCL patients who are primary refractory or who relapse less than 12 months after therapy discontinuation can be referred to CD19-directed CAR-T therapies (axicabtagene ciloleucel, lisocabtagene maraleucel) and receive bridging therapy as required until the CAR-T product is available. Those who are not CAR-T cell therapy candidates can be treated with CD20-directed bispecific antibodies (epcoritamab, glofitamab), conventional chemotherapy, or other options. DLBCL patients who experience disease relapse after 12 months from therapy discontinuation and are strong candidates for stem cell transplantation should receive aggressive chemotherapy as a bridge to transplant, whereas those who are not strong candidates for the procedure can benefit from CD19-directed CAR-T cell therapy, bispecific antibodies, or other treatment regimens. CAR-T cell therapy and bispecific antibodies can also be used as therapeutic options in the third and subsequent treatment lines in DLBCL [2].
Since reliable prognostic tools for DLBCL are insufficient, different instruments based either on clinically oriented parameters (e.g., IPI, NCCN-IPI), molecular classification (e.g., cell-of-origin) and even more advanced genetic markers (e.g., MYC/BCL2 rearrangements, DHITsig, MCD/EZB clusters), have been tested [1]. However, individualization of DLBCL treatment plans according to such instruments remains limited as there are barriers in a comprehensive evaluation of disease markers in the clinic. Moreover, even when there are no impeding factors, there is still inter-patient molecular diversity and a lack of consensus on how to translate these findings from bench to bedside [3]. For example, recent investigations have shown that ctDNA could emerge as a promising biomarker in detecting early relapses and in DLBCL monitoring; however, it must be taken into account that its assessment requires notable financial costs and faces challenges in standardization [1].
As healthcare specialists have been searching for better diagnostic and prognostic tools to manage hematological malignancies, artificial intelligence (AI), particularly through machine learning (ML) techniques, has displayed the potential to fill in some unmet gaps. The major advantage of these particular algorithms lies in their ability to summarize and classify high-dimensional data from various sources—clinical records, histopathology, radiology, genomics, and liquid biopsies—augmenting the use-case of decisional trees and multiple layered networks—to obtain clinically relevant tools for prognosis and risk prediction [4,5]. In oncology and hematology, ML algorithms have proven to be potentially useful in several frameworks aimed at prediction of risk and categorization into subtypes with the final aim of implementing a more precise treatment protocol [6]. In particular, for DLBCL, AI/ML applications encompass various fields, from image-centered approaches (PET/CT techniques, digital histopathology) and molecular analysis (transcriptomics, mutational profiling) to integrative approaches such as multi-omics. However, current data is fragmented and only available in the setting of individual experiments.
This scoping review aims to extensively map the existing literature on the use of AI and ML for prognostic modeling in DLBCL. Our objective was to categorize studies by data modality and methodological approach, following key trends and performance outcomes, and identifying gaps which could lead to further iterations. Unlike traditional systematic reviews focused on effect estimates, our work prioritizes an investigational approach to classification, in line with scoping review methodology and PRISMA-ScR guidance. Encompassing advances across radiomics, digital pathology, omics, and risk modeling algorithms, we outlined a structured overview of how ML/AI was leveraged in various scenarios to address unmet needs in DLBCL.
Figure 1 illustrates the systematic categorization of 91 studies applying AI and ML for prognostic modeling in DLBCL.
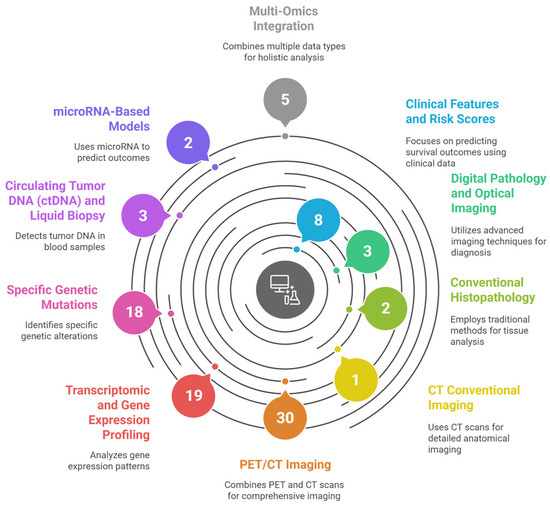
Figure 1.
Graphical abstract—Artificial Intelligence for Risk Stratification in Diffuse Large B-Cell Lymphoma: A Systematic Review, illustrating the systematic categorization of 91 studies applying Artificial Intelligence and Machine Learning for prognostic modeling in Diffuse Large B-Cell Lymphoma (DLBCL). The figure maps the current research landscape by grouping studies into ten distinct data modalities and computational approaches identified in the review’s results, including Clinical Features and Risk Scores, various Imaging Techniques (PET/CT, CT, and Digital Pathology), and diverse Omics data (Transcriptomic, Specific Genetic Mutations, ctDNA, microRNA, and Multi-Omics Integration). This figure was generated using the AI tool napkin.ai version 3, based on the “Overview of Included Studies” (Section 3) of this systematic review. AI, artificial intelligence. DLBCL, diffuse large B-cell lymphoma.
2. Methods
This scoping review was conducted in accordance with the Preferred Reporting Items for Systematic Reviews and Meta-Analyses extension for Scoping Reviews (PRISMA-ScR) guidelines. The aim was to map and synthesize the existing literature on the application of AI, including ML and deep learning (DL), for prognostic modeling in DLBCL.
2.1. Eligibility Criteria
We included original research articles that applied AI, ML, or DL techniques to predict clinical outcomes, stratify risk, or enhance prognostic modeling in patients with DLBCL. Studies using imaging, clinical, pathological, transcriptomic, genomic, epigenomic, or circulating biomarkers as model inputs were eligible. In terms of article types, reviews, editorials, abstracts, conference posters, and studies that did not report performance metrics or relevant endpoints, e.g., overall survival (OS), progression-free survival (PFS), complete response, or molecular subtypes, were excluded.
2.2. Information Sources and Search Strategy
Our study involved a search in three major relevant electronic databases: PubMed/MEDLINE, Scopus, and Cochrane Library. The search strategy combined terms related to DLBCL, prognosis, and AI or ML concepts. The subsequent search strings, designed for comprehensive discovery, were applied:
- PubMed/MEDLINE: ((“Lymphoma, Large B-Cell, Diffuse”[Mesh]) AND “Prognosis”[Mesh]) AND “Artificial Intelligence”[Mesh]
- Scopus: TITLE-ABS-KEY ((“diffuse large B-cell lymphoma” OR DLBCL) AND (prognosis OR prognostic) AND (“artificial intelligence” OR “machine learning”))
- Cochrane Library: (“diffuse large B-cell lymphoma” AND prognosis AND “artificial intelligence”)
This review was conducted in accordance with PRISMA-ScR guidelines and was prospectively registered in PROSPERO (CRD420251083702). The final search was performed in July 2025.
3. Results
Literature search: A total of 215 records were identified across databases: 56 from PubMed/MEDLINE, 158 from Scopus, and 1 from the Cochrane Library. After deduplication, 180 unique articles were retained for screening. After screening of the 180 articles, 75 were excluded based on relevance, lack of outcome data, or absence of performance metrics. Discrepancies were resolved by consensus between investigators on a case-by-case basis. Of the remaining papers, 13 articles could not be retrieved in full and were excluded, and one article was excluded during full-text review. A final total of 91 articles were included in this review (Figure 2).
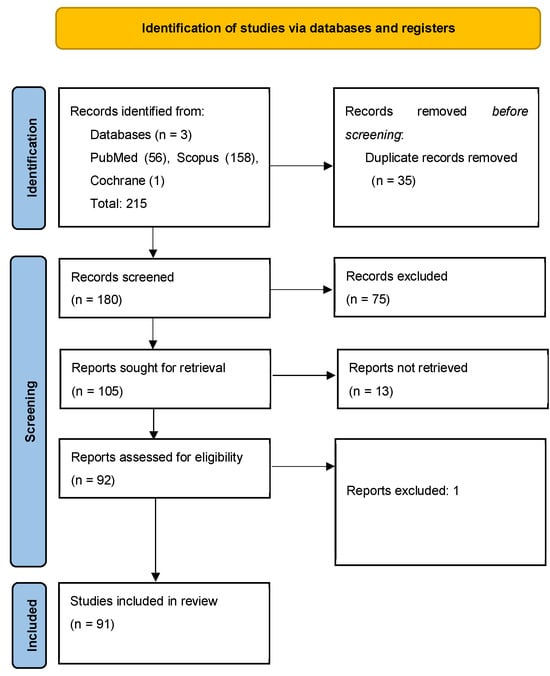
Figure 2.
PRISMA-SCR flow diagram outlining the study selection process for the scoping review on the implications of AI/ML to uncover prognostic and predictive factors in DLBCL [7].
Overview of Included Studies: The 91 included studies were published between 2003 and 2025, reflecting a steady rise in the application of AI/ML in DLBCL prognostication. Studies were sorted and reported according to data manipulation method used or domain of application, as follows:
- Clinical Features and Risk Scores (n = 8)—Most of these studies reported logistic regression, ensemble models (e.g., XGBoost, LightGBM), or Bayesian networks to enhance prediction of OS and PFS based on data involving clinical and demographic features.
- Digital Pathology and Optical Imaging (n = 3)—Based on CNNs and MIL models that used hematoxylin and eosin (H&E)-stained whole slide images for diagnosis, decoded cell-of-origin (COO) classification, or served tools for therapy response prediction.
- Conventional Histopathology (n = 2)—Amongst these studies, ML algorithms were used on gene expression signatures or immunohistochemical surrogates to classify COO and predict survival.
- CT conventional imaging (n = 1)—A single study reports a model which focuses on secondary endpoints such as major cardiac events, estimated based on a calculated calcium score.
- PET/CT Imaging (n = 30)—A numerous cohort of studies using machine learning techniques such as deep learning and radiomics-based models to select various prognostic features derived from PET/CT scans. The studies mostly benchmarked their OS and PFS predictive scores to IPI models, outperforming them.
- Transcriptomic and Gene Expression Profiling (n = 19)—Many models included LASSO, autoencoders, and swarm optimization. The outputs ranged from immune subtype classification to gene signature-based survival prediction.
- Specific Genetic Mutations (n = 18)—Various supervised models, incorporating mutational data (e.g., TP53, MYD88, EZH2), aimed at risk stratification with refined molecular subtyping.
- ctDNA and Liquid Biopsy (n = 3)—A small number of reported studies employed ML to predict early relapse or survival using parameters such as the ctDNA burden, clonality, and even fragmentation features.
- microRNA-Based Models (n = 2)—Two studies which used miRNA expression to predict R-CHOP response via Random Forest classification and to diagnose a rare subtype of DLBCL via fluid expression of microRNA.
- Multi-Omics Integration (n = 5)—Integrative models which combine gene expression, methylation, CNVs, and clinical data using ML techniques (e.g., Random Forest, Cox regression) to produce advanced and refined composite prognostic scores.
3.1. Clinical Features and Risk Score Modeling
The current traditional prognostic tools in DLBCL include the IPI and NCCN-IPI scoring systems, which provide a generally accepted risk stratification but lack the ability to estimate the survival prognosis of an individual. Novel approaches could employ ML to enhance risk modeling from the routinely available clinical variables, similarly to traditional scoring systems, but with enhanced performances.
An investigation published by Biccler et al. aimed to assess the superiority of ML models over conventional scores in a cohort of over 10,000 lymphoma patients—of whom 4420 suffered from DLBCL [8]. The methods proposed by these researchers included ML models such as random survival forest and penalized Cox regression, which consistently outperformed the IPI score in predicting OS. It is notable to say that a simplified Cox model using only age and performance status managed to classify DLBCL patients better than the traditional IPI scale. Therefore, we can infer that there is a solid use case for non-dichotomized ML approaches for individualized prognostics in DLBCL [8].
In another study, also conducted by Biccler, the investigators used data from nationwide Danish and Swedish DLBCL cohorts totaling 5173 patients [8]. The ML methods used in this experiment combined Cox, AFT, and parametric models bundled in a stacked format, which outperformed IPI and NCCN-IPI in both cohorts, achieving a higher C-index (concordance index) (0.756 DK; 0.744 SE), and integrating lower Brier scores [8].
Fan et al. developed a prognostic score using logistic regression, which aimed to classify de novo DLBCL patients into high- and low-risk cases, using clinical and molecular features as inputs [9]. Moreover, the score served as an input for five other ML classifiers, i.e., Logistic Regression (LR), Random Forest (RF), Support Vector Machine (SVM), Naive Bayes (NB), and Feed-Forward Neural Network (FFNN), in order to further improve group stratification. Based on the datasets analyzed using their approach, the logistic regression model showed the best performance, scoring a C-index of 0.71 on external validation [9].
A rather different approach involving clinical data was conducted in a trial aimed at boosting the NCCN-IPI score itself. Kim et al. investigated whether the integration of stromal FOXC1 and tumor pERK1/2 expression with the NCCN-IPI score would benefit the prediction of actual survival. Therefore, they selected a cohort of 134 DLBCL patients treated with a standard R-CHOP regimen, for whom they applied six survival-specific machine learning algorithms (FastSVM, Random Survival Forest, XGBoost, and Bagging SurvTree) [10]. A 5-fold cross-validation and nine feature selection methods were applied. The time-to-death prediction results for the best performing model reported a C-index of 0.801 (p = 0.030), a result which, even tested on an internal cohort, highlights the importance of additional variables for prediction model enhancement [10].
Another assessment with a significant number of patients was based on information collected from the Surveillance, Epidemiology, and End Results (SEER) database and focused on pediatric DLBCL. The authors analyzed the data of 836 patients with DLBCL, applying an algorithm for prognostic model discovery through either Cox regression, generalized Cox regression, or XGBoost (Extreme Gradient Boosting) [11]. The prognostic features used as input data included: age, Ann Arbor stage, treatment modalities, and time from diagnosis to therapy. Qin et al. report that the XGBoost model achieved the best predictive performance, with an AUC of 0.892 (training settings) and 0.889 (validation), outperforming traditional methods. Therefore, we can state that this study demonstrated that in the pediatric population, prediction of overall survival in DLBCL could be improved by integrating ML techniques that leverage clinical data [11].
There were also other studies which looked at combining the IPI risk groups with immunohistochemical modifiers (namely the subtype—GCB and non-GCB) by using a classification and regression tree (CART) approach. In a study by Samarina et al., a cohort of 81 eligible patients treated with R-CHOP from Russian databases were stratified into low-, intermediate-, and high-risk groups. The results indicated prediction scores for the high-risk group at a 2-year OS with 46% accuracy, a median OS of 25 months, and for the low-risk group, achieved 100% accuracy in predicting 2-year and 5-year OS compared to the actual monitoring data available, as the authors report [12].
Besides the classical IPI scoring system, several researchers analyzed the medical records of DLBCL patients and investigated whether routinely documented parameters (demographic data, clinical stage, ECOG (Eastern Cooperative Oncology Group), GCB subtype, Hans algorithm, CBC (Complete Blood Count) indices, and serum markers such as albumin and cholesterol) could serve as independent predictors [13]. Based on data from 1211 newly diagnosed DLBCL cases from seven Chinese centers, Shen et al. retrospectively analyzed prognostic models for OS using both linear and non-linear ML methods. A penalized Cox regression model using LASSO (linear model) and a non-linear random forest model were compared, with LASSO achieving superior discrimination (AUC 75.8%, C-index 0.704) in the training cohort. In addition, they identified several independent predictors of OS in DLBCL, namely: age, WBC (White Blood Cell) count, hemoglobin, CNS (Central Nervous System) involvement, gender, and Ann Arbor stage [13].
Another innovative approach used data from the SEER registry and tackled a more challenging topic by selecting a rare subgroup of lymphomas, namely patients with composite Hodgkin’s lymphoma and DLBCL. Zhao et al. analyzed a subgroup of 869 patients, and applied six ML algorithms (XGBoost, Random Forest, AdaBoost, KNN, ANN, and GBDT). The prediction tests evaluated the 1-, 5-, and 10-year mortality, the best performing algorithm, returning an AUC > 0.80, being the XGBoost technique [14]. The authors also designed a Cox-based nomogram for OS prediction and validated all the results on external testing cohorts. While the XGBoost has proven superiority in these particular settings, the novel approach targeted a challenging group in clinical settings, i.e., composite lymphomas, and also provided tools which could be translated into clinical practice [14].
ML was also tested in the setting of relapsed/refractory DLBCL, aiming to build prognostic models for OS and PFS prediction using clinical and PET/CT data. The small study conducted by Zhu et al. aimed to investigate a subgroup of 28 Chinese DLBCL patients who would benefit from the R-ICE and ibrutinib combination. The study investigated four survival analysis methods (Random Survival Forest, Gradient Boosting Machine, Cox-XGBoost, and Stepwise Cox regression) [15]. The test cohort revealed time-dependent AUCs for OS prediction, which reached 0.863 (1 year), 0.864 (2 years), and 0.898 (3 years), while PFS AUCs ranged from 0.769 to 0.784. The paper also reports that the prognostic features that were most significant during the experiment were as follows: CD5+ expression, LDH (lactate dehydrogenase), ALB (albumin), β2-MG (beta-2 microglobulin), and time to relapse >12 months. Also, as seen in other studies, the best results for this type of application were obtained with a gradient boosting technique, Cox-XGBoost (AUC > 0.8) [15].
Table 1 summarizes the risk score models that were based on clinical features.

Table 1.
Clinical features and risk score modeling—summary table.
3.2. Digital Pathology and Optical Imaging
Deep learning (DL) models applied to whole-slide imaging (WSI) in DLBCL have started to gain traction, both as a means of diagnostic support but also in terms of prognostic modeling, especially by leveraging decisional networks as surrogates for the detection of molecular markers. The architecture with the most promising results utilized segmentation models, CNNs, and also assisted techniques such as AI-assisted annotations [17]. The literature reports that the aforementioned supportive measures enhanced the reproducibility and efficiency of histopathological workflows.
Work dating back to 2020 reported by Swiderska-Chadaj et al. suggested a DL system to predict MYC translocation in DLBCL using conventional H&E-stained whole-slide images (WSIs). The authors used data from 287 cases, recruited across 11 hospitals in the Netherlands, which served as the basis input data for a U-Net architecture design that was used to generate pixel-wise likelihood maps [17]. Furthermore, the data obtained was processed using a Random Forest model which designated a final classification (MYC+ vs. MYC−). The model achieved a sensitivity of 0.90–0.95 and specificity of 0.52–0.53 in internal and external validation cohorts. In a diagnostic environment which also values the judicious usage of resources, the same group concludes that this approach could reduce MYC fluorescence in situ hybridization (FISH) testing by up to 34% without compromising sensitivity [17]. As specialized FISH tests require additional logistics, a ML-aided piece of advice on who to test for this specific translocation would decrease the healthcare cost burden and also decrease the workload of the facilities which perform these tests, improving the turnaround of the results.
The digital imaging of the slides has also been suggested in predictive studies in an attempt to predict the response to the gold-standard first line therapy (R-CHOP) and also to estimate the relapse-free survival (RFS). The data for this experiment was obtained from 216 DLBCL patients selected in a Korean center, with a total of 251 slides examined. Lee et al. extracted histopathological features using a contrastive learning method (DINO—self-distillation with no labels), paired them with 54 clinical features from TabNet and modeled the input through a MIL (Multiple Instance Learning) framework [18]. The multimodal model achieved an AUROC (Area Under the Receiver Operating Characteristic curve) of 0.856 and AUPRC (Area Under the Precision–Recall Curve) of 0.961, outperforming the pathology-only model (AUROC 0.744). The prognostic validity was confirmed through Kaplan–Meier and Cox survival analyses but also involved an external validation with data from TCGA (The Cancer Genome Atlas) (p = 0.037), which provided a rigorous validation of the model [18]. This study proves that assisted biological tests could be translated into clinical practice for individual therapeutic planning and also as a means of treatment response assessment as an add-on to the existing imaging techniques recommended by the guides.
In another study regarding the histopathology of DLBCL, another prognostic marker was evaluated: the Ki67 proliferation index. Cristian et al. evaluated the concordance between manual and AI-assisted quantification of Ki67 in 15 cases of gastrointestinal lymphoma (13 DLBCL, NOS, and 2 HGBL). Using WSI, automated scoring was performed with QuPath on IHC stained slides, with a strong correlation between the automated method and the manual assessments (R2 = 0.87) [19]. This certifies the feasibility of the method for identifying high-risk cases, as elevated levels of Ki67 are associated with a poorer OS (p = 0.0014—reported by the authors) and a shorter PFS (also reported by the authors—p = 0.0028) [19].
Table 2 summarizes the risk score models based on digital pathology and optical imaging data.
Table 2.
Digital pathology and optical imaging—summary table.
3.3. Conventional Histopathology (Non-Digital)
The classification of DLBCL, both from a biological and from a clinical point of view, relies on traditional morphological features, immunohistochemical profiling, and documenting characteristic gene expressions. Therefore, most of the work in this particular field sought to involve ML in COO classification and also into mapping patterns which could predict the outcomes of these cases.
One study by Da Costa et al. investigated a technique meant to use immunohistochemical data from 475 DLBCL patients processed through a ML algorithm (J48). The group designed a decision-tree model that used CD10 (50% cutoff), MUM1 (5%), and FOXP1 (80%) without prior biological assumptions and achieved a kappa of 0.83 with strong concordance to gene expression profiling (GEP) of the cases studied [20]. The model performed well in terms of prognostic significance and also excelled in its prognostic capabilities for previously unclassifiable (GEP-UC) cases (PFS p = 0.017; OS p = 0.007) [20]. Worse outcomes emerged in a multivariate Cox regression, due to the non-GC class, lack of CR, and high IPI cases. Therefore, AI-assisted models can supplement traditional gene profiling in the borderline cases.
Another study involved quantitative RT-PCR data to obtain an AI powered classifier for COO subtypes in DLBCL from 143 formalin-embedded samples [21]. A set of 20 gene expression markers and 5 genes involved in the NF-κB target (a pathway renowned for its upregulation in the ABC DLBCL subtype) were measured via high-throughput qRT-PCR (Fluidigm BioMark HD system). Amongst the ML algorithms tested, the optimal one was a SimpleLogistic classifier which effectively distinguished ABC and GCB subtypes as well as returning data for the OS and NF-κB activity. Of 120 R-CHOP-treated patients, the ABC subtype was associated with a poorer prognosis, and its gene signature included elevated IRF4, CCND2, CD44, cFLIP, and CCR7 expression [21]. Therefore, a simple classifier could refine the assignment for COO case sorting and can also provide insights on the activity of various pathogenic upregulated signaling pathways.
Table 3 summarizes risk score models based on conventional, non-digital, histopathology data.
Table 3.
Conventional histopathology (non-digital)—summary table.
3.4. CT Conventional Imaging
One of the most used methods required for the management of lymphomas is computed tomography (CT), an assessment which provides essential anatomical data for staging and treatment planning and is also an indispensable tool for patient monitoring [15]. However, these imaging reports do rely heavily on the subjective visual interpretation of the operator and also on standardized morphological criteria, a step which some might argue might introduce a degree of bias, especially in the context of the complex heterogeneous masses which arise in lymphoma cases. Therefore, a need for AI-driven tools has arisen in the search for better surveillance with regard to imagistic lesions [4,5].
In the only study identified in this section, Shen et al. developed a CT radiomics model following the analysis of 1468 DLBCL patients from four hospitals in Asia, aiming to provide an automated predictive score for treatment-related cardiotoxicity for patients treated with anthracycline-based regimens. The model investigated whether an automatically calculated coronary artery calcium score (CACS) could be indicative of major adverse cardiovascular events (MACEs). Using the CACS (0, 1–100, >100) paired with logistic regression, they detected increased odds of chemotherapy-related cardiac dysfunction (CTRCD) with higher CACS values (OR 2.59 and 5.24, respectively) [22]. Moreover, an increased MACE risk was reported in both elevated CACS groups (SHR 3.73 and 7.86, respectively; p < 0.001), with 5-year cumulative incidences rising from 3.3% (CACS 0) to 31.1% (CACS > 100) [22]. While not focusing only on traditional markers such as OS or PFS, this tool delineates an innovative approach to supportive measures for patients with DLBCL, who could benefit from superior supportive care and better cardiological surveillance in the attempt to mitigate the undesired effects of chemotherapy.
Table 4 summarizes risk score models based on CT conventional imaging data.
Table 4.
CT conventional imaging—summary table.
3.5. PET-CT Imaging
The 18F-FDG PET/CT imaging test revolutionized the assessment of the disease burden and control for patients with lymphoproliferative disorders, including the subset suffering from DLBCL. The enhancement compared to traditional CT imaging techniques lies in the quantitative and spatial information on the tumor itself and also the better recognition of its activity. With the rise of AI and ML techniques, interest has also grown in leveraging these complimentary radiomic markers for the development of better predictive models during the treatment timeline. In recent years, studies have explored data extraction strategies to reveal potential biological characteristic patterns beyond the traditional SUVmax or total metabolic tumor volume (TMTV)—an accomplishment enabled by the power of complex rationalizing algorithms, which have unveiled new, subtle connections between the investigated parameters.
The focus reported was mainly on automation and also the enhancement of traditional PET scan reports. Amongst the literature we searched, we aim to report the tools listed in Table 5, which are distinct from existing work in this field.
Table 5.
Innovative PET-CT AI tools in DLBCL.
The studies retrieved report a wide range of ML models used to predict survival outcomes and treatment responses. Notably, the considered classical models include logistic regression (LR) [24,29,30,31,32,33,34], support vector machines (SVM) [31,32,34,35,36,37], and random forest (RF) [31,32,34,37,38,39]. These methods served most commonly for binary classification while documenting treatment responses or PET positivity status. Newer studies retain the usage of deep learning architectures such as CNN [40,41,42,43], fuzzy neural networks (FNN) [31], and graph neural networks (GNN) [25], designs which extract spatial, as well as other context-specific parameters from the provided scans. The stacking method [37] or the AutoML [24,26,44] combinatorics serve the purpose of further distilling the prediction feature by integrating multiple models in the same logistic construction.
Other techniques were centered on dimensionality reduction and feature selection methods, including LASSO regression [23,26,35,37,44,45], elastic net [33], random forest ranking [38,39], and AutoML feature pipelines [26,44,45]. Future work is supported through the fact that many of the applications described were supported by open-source tools such as PyRadiomics paired with manual or semi-automated segmentation methods which have specific thresholds for selection (e.g., SUV4.0 or PERCIST criteria) [38,45].
Considering the emerging literature around AI-driven analysis of PET/CT imaging, we can infer that the improvements in this field will be reshaping the risk stratification of DLBCL patients. By combining radiomics and clinical data in upcoming risk prediction models, the iterations of future scores will likely outperform traditional tools like IPI score in predicting PFS and OS, with better expectations in terms of treatment response rates [15,37]. Worth reiterating are novel approaches such as the interpretability of spatial biomarkers (e.g., lesion-spleen distance) [28] and also models which require minimum human supervision [46], which call for a translational approach. The major challenge remains strong external validation (as many studies report only internal validation cohorts), a rigorous set of segmentation standards to be made available and used by all designed models, and a harmonization across cohorts, as independent tools have reported segmented applications of their prognostic models in what we can call the intended population for testing.
Table 6 summarizes risk score models based on PET-CT imaging data.
Table 6.
PET-CT imaging—summary table.
3.6. Gene Expression and Transcriptomic Profiling
Gene expression profiling (GEP) has delineated itself as a distinct field for dissecting the biological heterogeneity of DLBCL. The traditional COO classification has begun to have a more granular taxonomy with the addition of the new subgroups identified by these genetic arrays, which seek to even further refine the risk groups and impact new potential therapeutic approaches. In terms of technical data, the most promising studies applied unsupervised clustering, survival modeling, and functional pathway analyses to develop robust gene-based classifiers, validated across independent cohorts [5,54,55]. Their performances were weighted against clinically accepted and used prognostic indices.
Innovative AI methods have expanded GEP applications by uncovering biologically informed subtypes and refining prediction models. Carreras et al., contributed an algorithm designed for anomaly detection and ensemble learning (XGBoost, ANN) to identify apoptosis- and immune-related signatures (RELB) associated with outcome [56]. Another pipeline, the SurvIAE, involves a deep learning method by Zaccaria and colleagues, which integrates autoencoders, seen as an emergent trend in oncology, and multi-layer perceptrons (MLPs) to outperform R-IPI using explainable latent features [57]. Other works incorporate immune deconvolution into LASSO–Cox survival models, demonstrating that transcriptomic-immune signatures enhance outcome prediction over IPI [58]. Two other studies applied clustering and multi-algorithmic ML frameworks to model mitochondrial and programmed cell death-related expression profiles, showing strong survival associations that are validated in external datasets [59,60].
Table 7 summarizes several innovative tools for GEP.
Table 7.
GEP innovative tools.
Grouped by method, in the GEP field, AI techniques included the following: supervised learning (e.g., XGBoost, random forest, SVM) for classification and risk scoring [62,63]; unsupervised clustering (e.g., consensus clustering, SOMs) for subtype identification [60,64,65]. Hybrid pipelines such as LASSO, PSO, and PNNs were used for gene selection and survival modeling [58,66]. Deep learning frameworks like SurvIAE [57] have introduced representations of learning platforms for long-term outcome prediction.
The GEP-based AI tools shed a new light on a promising integration of novel immune classifiers as means of further subdivision of DLBCL. The cohorts described revealed superior predictive performance for personalized prognostics by using the various proposed models’ decisions [54,57,59].
Table 8 summarizes several innovative tools for GEP in DLBCL.
Table 8.
GEP summary table.
3.7. Specific Genetic Mutations
The molecular heterogeneity of DLBCL was the catalyst for the search of specific genetic markers, which could be embedded in prognostic algorithms to further refine the results. The major reason for this effort is the need for a better stratification of the patients beyond the COO and IPI frameworks. Recent ML applications involve the use of transcriptomic, mutational, and epigenetic data to characterize biologically distinct subgroups and highlight different survival scenarios. The hallmark biomarkers to-date include MYC, BCL2, BCL6 translocations, TP53 mutations, lactylation signatures, and mitochondrial gene expression, demonstrated by various authors to be of significant impact in large multicohort analyses [4,72,73,74].
Researchers have proposed several tools to refine the prognosis of such a heterogeneous disease, even at the level of specific mutations. Albitar et al. focused on a modified Naïve Bayes classifier on FFPE RNA-seq data to define four survival categories. Another group of researchers investigated oncogenic markers, such as the TP53 mutation, and implemented an algorithm pipeline consisting of 10 variables to stratify TP53-mutated DLBCL using mutation class, VAF, and structure [72]. Moreover, Zhou et al. implemented a mitochondria-based transcriptomic risk model [74] and another group of researchers proposed and tested a lactylation gene-based score, which integrates immune landscape metrics, demonstrating the importance of the tumoral microenvironmental factors apart from the transcription defects [73]. A similar approach falls partly into the multi-omics domain, documenting the importance of the stromal ambient, uncovering a stem cell-like, immune-deserted subgroup marked by ornithine decarboxylase 1 (ODC1) expression [75]. The automation enabled by ML techniques serves various purposes, ranging from gene burden scoring to metabolic and immunogenomic modeling.
Table 9 summarizes several innovative approaches to the prediction of DLBCL outcome based on genetic mutations.
Table 9.
Innovative approaches to specific prognostic genetic mutations in DLBCL.
Carreras and colleagues have made numerous contributions to the field by publishing studies which showcase various integrations of AI in this particular field. Their work spans across applied neural networks, decision trees, and logistic regression across gene expression and immunohistochemistry datasets to identify prognostic markers such as PD-L1, IKAROS, and Caspase-8 [77,78,79,80]. Not only did they document the aforementioned markers, but their subsequent papers proposed the use of immune-distinct signatures, the state of tumor-associated macrophages, and CSF1R patterns to define prognostic subtypes [80]. In terms of performance, the ML models achieved high OS prediction accuracy, with almost AUC 0.98 reported, and validation was performed on large datasets, demonstrating the power of layered AI pipelines [77,80].
Grouped by approach, ML techniques included supervised models like random forest, support vector machines, and logistic regression [4,81,82]; deep learning frameworks such as Bi-LSTM and multilayer perceptrons [77,81]; and unsupervised clustering tools, including iClusterPlus and SOM [83,84]. Other hybrid pipelines included LASSO–Cox, SubLymE multinomial classifiers, and gene signature selection, which further enhanced interpretability and robustness [74,85]. The diversity of AI methods which were battletested with good results once again underscores the utility and adaptability of ML models to integrate complex omics data in meaningful clinical settings.
AI-enhanced genetic profiling has substantially improved prognostic modeling in DLBCL. Even models which incorporate transcriptomics, mutational burden, metabolic signatures, and immune microenvironment profiles deliver consistent and reliable results, outperforming traditional risk assessment tools. For a wider adoption and translational use, there is still room for explainable AI frameworks and multi-omics integration, which will enable personalized therapies once clinicians have access to and have routinely worked with these new types of tools [76,83,86].
Table 10 summarizes the importance of specific gene mutations in risk score modeling in DLBCL.
Table 10.
Specific genetic mutations—summary table.
3.8. microRNA Profiling in DLBCL
MicroRNAs (miRNAs) are small, non-coding RNA molecules that regulate gene expression post-transcriptionally, which have recently been evaluated in relation to the signaling oncogenic pathways they might reveal, disclosing dysregulation in apoptosis and immune responses. Also particular to these molecules is their stability in biofluids as well as on tissue samples, making them promising biomarkers in the setting of DLBCL as well. In recent years, ML approaches have been increasingly applied to miRNA expression data to classify molecular subtypes, forecast clinical outcomes, and identify key regulatory miRNA signatures with potential translational value. Therefore, we will try to cover the existing data on these small molecules, which were investigated for risk stratification and outcome prediction in DLBCL.
In a specialized analysis, Minezaki et al. investigated a potential diagnostic algorithm which would involve miRNA profiling in vitreoretinal lymphoma (VRL) by analyzing vitreous and serum samples from 14 VRL patients and 78 controls [89]. ML identified 17 significant miRNAs and a Random Forest model was trained to classify VRL versus controls, achieving 87.5% accuracy. miR-361-3p was the top predictive feature (AUC = 0.921). Also, the subsequent analysis of the miRNA target pathways revealed the importance of ECM–receptor interaction and IL-10 signaling [89]. ML models aided in miRNA selection for a niche subtype of DLBCL, which also shows promising diagnosis results via serum samples, based on the subset of miRNA discovered.
Nakamura et al. analyzed integrated miRNA expression profiles from two GEO datasets (GSE21848 and GSE40239), including 128 R-CHOP-treated DLBCL responders and 24 non-responders. To precisely predict the most relevant microRNAs, the study performed a selection via p-value ranking, stepwise selection, and Boruta (which proved to be the best selection method) and elected 11 classifiers. In individual testing, the maximum AUC of single miRNAs was modest (AUCs < 0.57), but multi-miRNA panels achieved higher predictive accuracy [90]. The authors report that a random forest Boruta-selected 36-miRNA panel scored an AUC of 0.751 in its predictive response [90]. Even if single miRNA items fail to represent a reliable biomarker in DLBCL, AUCs nearing 0.8 in relatively small clusters seem to predict the clinical use of miRNA panels for predictive purposes.
Table 11 summarizes risk score models based on microRNA profiling in DLBCL.
Table 11.
microRNA profiling in DLBCL—summary table.
3.9. Circulating Tumor DNA (ctDNA) Analysis and Liquid Biopsy Applications
Recent studies have highlighted the utility of ctDNA as a risk stratifier, an early outcome predictor, and also as a monitoring tool in DLBCL. The current emphasis falls mostly on monitoring the plasmatic levels of this marker, often seen as a minimal residual disease (MRD) surrogate marker. However, ML data manipulation iterations have also made it a feasible tool in the early stages, with its outcome predictive properties boosting its use-case.
A study by Meriranta et al. prospectively evaluated 101 high-risk DLBCL patients to assess the prognostic utility of ctDNA. Baseline ctDNA burden, mutational profiles, and fragmentation characteristics have been obtained and analyzed, and further correlations with patient survival and MRD have been proposed. Using ML classifiers, based on 60 ctDNA-derived variables, the automated model was able to predict OS with an AUROC with values ranging from 0.75 to 0.87 [91]. Therefore, biological data derived from diagnostic samples could safely enrich the clinical decisions and satisfactorily predict the evolution of these patients, given the AUROC parameters reported.
A more targeted but equally important application of ctDNA has emerged as a biomarker in identifying central nervous system lymphoma (CNSL), particularly useful when stereotactic biopsies cannot be retrieved due to various reasons, and the imagistic workup points towards such a diagnosis. Therefore, Mutter et al. looked into a cohort of 92 CNSL patients using CAPP-Seq on plasma, CSF, and tumor samples. The first part of the experiment demonstrated the high correlation between ctDNA and the diagnosis, untreated patients presenting ctDNA in 78% of plasma and 100% of CSF samples [92]. Their work pushed forward with the design of a proof-of-concept model through a machine learning-based approach for a biopsy-free CNSL classification. The reported predictive data achieved sensitivities of 59% (CSF) and 25% (plasma), with a high positive predictive value [92]. This approach proves that AI mutation profiling tools can enhance non-invasive diagnostic tools for difficult-to-diagnose cases.
In another paper, Zhao et al. explored the predictive value of pairing the immunoglobulin heavy chain (IgH) VDJ rearrangement proportions in the ctDNA of newly diagnosed DLBCL patients. The cohort included 55 patients with two defined clonotypes: the “dominant circulating clonotype” (highest in ctDNA) and the “dominant tissue-matched clonotype” (highest in tumor tissue and found in ctDNA) [93]. The first attempt was to match it to the tissue samples’ clonotype, but the results were rather poor in predictive terms. Subsequent runs included clinical variables, the most satisfactory result involving the extranodal presence of a covariant that revealed a dominant circulating clonotype proportion ≥37% and yielded a progression prediction model with an AUC = 0.724, a sensitivity = 0.63, and specificity = 0.81 [93]. This highlights the prognostic relevance of IgH monitoring in tissue samples and reveals the promising prognostic value of a score which involves IgH tissue monitoring paired with a well-documented extra nodal involvement assessment.
Table 12 summarizes risk score models based on ctDNA in DBLCL.
Table 12.
Circulating tumor DNA (ctDNA)—summary table.
3.10. Multi-Omics Integration
Multi-omics, an umbrella-like term, which combines data such as genomics, transcriptomics, epigenomics, proteomics, and metabolomics, offers a bundle of characteristics which display a comprehensive picture of the biology of any disease. As complex interactions are a hallmark of neoplastic cells, it is implied that the heterogeneity of cancer types relies on these interactions, thus explaining the tumor phenotype and behavior, calling for more refined classifications.
In DLBCL, there is a biological diversity that has been partially uncovered by the current classification systems, as in almost half of the cases patients either experience a poor response or relapse. Therefore, there is growing support for an approach that involves ML techniques focusing on the global picture of the pathogenic spectrum of the disease and that strive to individualize the cases based on markers that are not frequently documented through an emphasis on pathway signaling changes, which do occur during the life-span.
As early as 2003, Futschik et al. described the development of a hierarchical modular model which integrates gene expression microarray data (the omics part) and the clinical IPI score to predict the outcomes in DLBCL. From a technical standpoint, the IPI scores were modeled using a Bayesian classifier, while the microarray data was processed using evolving fuzzy neural networks (EFuNN); the work was based on a preexisting lot of 58 patients [94]. An interesting feature of the comparison between the microarray results and the IPI score was the fact that both seemed to be independent in terms of prediction, even in pathways that should have been shared between them. Therefore, the idea was sparked to imagine a combined mode using a hierarchical modular model, which, when tested, achieved a prediction accuracy of 87.5%, outperforming either modality alone [94].
In another study, Mosquera Orgueira et al. examined 481 DLBCL patients from a UK cohort, using transcriptomic features via the LymForest-25 algorithm paired with IPI derived data and mutational identified clusters. Their techniques suggested the use of PCA and Cox regression in order to constitute a multi-omics survival model with internal bootstrapping [95]. They also performed the tests on different age groups, obtaining the best performance in the <70 year subgroup, achieving AUCs of 0.82 at 5 years and over 0.81 from 0.5 to 2 years [95]. This strongly suggests that adding molecular data to the traditional prognostic score would boost its predictive performance.
The use of LymForest-25 is highlighted also in another study led by the same author that looked into a more specific scientific question, the benefit of adding a proteasome inhibitor to the old R-CHOP regimen. Therefore, after training the model on a 469 patients cohort treated with R-CHOP, they tried to predict the PFS for the subgroup with the addition of bortezomib (RB-CHOP) [96]. The prediction yielded a significant 30% reduction or death for the DLBCL patients at higher molecular risk [96].
Further studies tried to improve the existing models; one of them even describes the development of an empirical Bayes version of Bayesian additive regression trees (EB-coBART) to predict 2-year PFS in DLBCL. A model composed of 101 uniformly treated DLBCL cases, with 140 covariates factored in, demonstrated a superior predictive performance in the EB-coBART model with a C-index of 0.714 [97]. This data reveals that robust multi-omics models can be constructed to demystify the biological prognostic in this subtype of lymphomas.
Another distinctive approach was applied in the paper by Ouyang et al., who applied ML strategies to identify novel cell death pathways such as cuproptosis in DLBCL. They used featured selection techniques (Random Forest, LASSO, Boruta, Univariate Filtering) and a Transformer-based deep learning model to identify lncRNAs from transcriptomic data across five large DLBCL datasets. The final group included 831 patients and the predictive model created for OS prediction achieved AUCs of 0.79–0.83 in internal validation and 0.66–0.69 in external cohorts. Also, the study highlights lncRNA MALAT1 as a consistent key prognostic factor for cell proliferation in DLBCL, with subsequent reductions in cell division in DLBCL cell lines with MALAT1 knockdown, raising questions about its potential therapeutic role as well [98].
Table 13 summarizes risk score models based on multi-omics in DLBCL.
Table 13.
Multi-omics—summary table.
3.11. Superiority of AI/ML over Traditional Prognostic Indices
While the studies analyzed datasets that differed across clinical, imaging, histopathologic, and multi-omics dimensions, there were nonetheless common, recurring, high-impact predictors identified across the various, independent AI and ML frameworks. In order to build a useful, translational perspective, a distillation of the most common parameters would illustrate the most promising data types to prioritize for potential prognostic feature extraction. Accordingly, we extracted and ranked the variables that were most frequently or successfully consolidated from the studies we reviewed—those which consistently emerged as leading parameters within the various feature selection AI algorithms (e.g., LASSO, Random Forest ranking, AutoML pipelines) or that were retained as independent variables within the context of multivariable survival analysis. The table below (Table 14) presents the top 13 prognostic indicators that exhibited consistent predictive value for PFS and OS in DLBCL, including their data source, key studies, and the extent to which they contributed to the predictive model.
Table 14.
Frequently reported AI/ML-derived prognostic parameters in DLBCL across modalities.
Integrating evidence across different fields reveals a shared ‘core’ set of prognostic indicators regardless of the dataset or model architecture used. These include age; LDH; ECOG performance status; extranodal involvement; and radiomic features such as total metabolic tumor volume (TMTV) and dissemination indices (Dmax and spleen-referenced distances) as well as molecular profiles (CAF, TP53, and mitochondrial gene panels). These indicators have been confirmed repeatedly in different studies, contributing to the performance of models scoring C-index or AUC values of 0.74 to 0.87 as opposed to the older IPI-based scores (0.60–0.70) [8,23,26,33,55,57,72,74]. These findings indicate that hybrid models in AI should include these variables as primary components. This synthesis thus connects distinct methods with practical goals and concentrates evidence-based DLBCL AI research on reproducibility and clinical integration.
3.12. Model Interpretability and the Path to Clinical Translation
An important factor in the clinical translation of AI prognostic models is the need for a level of transparency. The inability to interpret such models remains a barrier to widespread adoption. In healthcare environments, explainability determines trust. A physician will want to have a full understanding of the rationale behind the model’s high-risk prediction for a particular patient before any treatment is based on such a prediction. Our analysis points out that the most advanced AI prognostic models, especially those based on clinical or genomic data, have utilized interpretable machine learning approaches. Notably there was a tendency towards models such as LASSO, which penalizes the Cox regression and therefore aids in the selection of key features for patient stratification [13,16]. Another widely used framework was represented by XGBoost or other similar ensemble methods which explain feature importance, thus determining the selection of the most vital markers to be used in the stratification process (see Table 14) [10,11,14]. This approach captures salient prognostic markers such as age, ECOG, and particular mutational profiles [10,13]. In stark contrast, the literature lacks data on the adoption of advanced models. In particular, the use of SHAP (SHapley Additive exPlanations) or LIME (Local Interpretable Model-agnostic Explanations) to explain the prediction of a model for an individual patient is remarkably absent for models considered to be part of post hoc XAI class.
Future research should focus beyond mere performance metrics and take into consideration how AI-derived insights can be rendered clinically actionable and understandable, thereby facilitating a seamless transition from research to real-world workflow integration.
4. Discussions, Future Perspectives
4.1. Synthesis of Findings and Domain-Specific Trends
This scoping review underscores the rapidly evolving landscape of ML in prognostic modeling for DLBCL. Our work focused on an in-depth collection of the expanding literature in this field, mainly documenting ML approaches in relation to the investigated markers, while also synthesizing the outcomes obtained by each individual experiment.
We underline a consistent finding across the scouted domains in the superior discriminatory capacity of ML models. In PET/CT imaging, CNNs operating on maximum intensity projections (MIPs) or radiomics-enhanced input data, with impressive AUCs > 0.8 for PFS prediction or treatment failure, data which is independently validated [26,27,30,32,33,36,44,99]. It has been demonstrated that even small changes in quantitative data such as the MTVrate (MTV lesion/total volume), empowered robust logistic regression models with strong stratification capability, transforming available data into valuable input for classifiers [33]. Therefore, we can safely say that ML can detect subtle spatial or volumetric patterns and extract data indicative of aggressive biology earlier than visual reads or SUVmax alone.
Survival endpoints have always been an area of interest in terms of prognostics. The review of the existing literature uncovered a pattern which emerged from linking specific input parameters and superior model performance for PFS and OS prediction. Radiomics-based PET/CT models which rely on patient data regarding the total metabolic tumor volume (TMTV), lesion dissemination indices, and metabolic tumor volume rate have consistently reported C-index or AUC values ranging between 0.75 and 0.80, performances which yield slightly superior results to IPI-based benchmarks (reported C-indices/AUCs values of 0.60–0.72) using data derived from the independent cohorts mentioned by the authors [23,26,27,28,33,37,44,48].
Another sought endpoint of clinical significance, PFS prediction, was investigated in some of the reviewed papers. The most appealing results came from convolutional and ensemble learning frameworks, where spatial metrics such as spleen-referenced dissemination captured the strongest discriminatory capacity (sDmax HR ≈ 11–12; ΔC-index +0.05–0.07)—capturing early metabolic and spatial heterogeneity of disease [28,37,51].
OS-oriented models have demonstrated the highest prognostic accuracy by using data derived from multi-omics or transcriptomic datasets. Amongst the input variables, studies used either complex molecular signatures (gene-expression patterns, immune microenvironment composition) or TP53 mutation-aware profiles, to classify and decode the biological heterogeneity of long-term outcome trends and treatment resistance patterns. The best performing models, which achieved C-index values ranging from 0.78 to 0.87, include the CAF-related transcriptomic signature [55], the autoencoder-based SurvIAE model [57], and mitochondrial or TP53-integrated risk scores [59,72,74,75]. These C-index values above 0.7 mark these approaches as superior to the IPI or NCCN-IPI models (which have a mean performance lower than 0.7), highlighting the fact that processing high-dimensional molecular data through interpretable ML architectures is positioned to enable refined survival predictions, calling for further investigations of treatment intensity tailoring according to biological lymphoma aggressiveness grading.
Classical clinical variables such as age, serum LDH, ECOG performance status, and extranodal involvement maintained a strong and independent prognostic value amongst the described AI-based models, irrespective of the model complexity or data integration workflow [8,13,14,15,33]. The large registry-based studies by Biccler et al., which analyzed a cohort of over 4000 DLBCL cases through both random survival forest and stacked Cox models, reported the consistent predictive value of the age and ECOG parameters (overall model C-indices of 0.74–0.76) that were superior to the IPI benchmark (C-index ≈ 0.70) [8].
Another reinforcing signal of the robust predictive value of clinical parameters was demonstrated by Shen et al., who reported that the individual variables of age, WBC count, hemoglobin, and LDH were retained as top-ranking coefficients in their penalized Cox (LASSO) model (C-index of 0.704 and AUC 75.8%), outperforming the conventional established scores [13]. Furthermore, a SEER-based cohort of 869 patients analyzed by Zhao et al. highlighted the age and extranodal disease parameters’ impact on survival, using integrated XGBoost models (AUCs > 0.80) for 5-year and 10-year mortality prediction [14]. Additionally, another Cox–XGBoost model by Zhu et al., using LDH and time to relapse > 12 months as input data, reached AUCs 0.863–0.898 for OS and 0.769–0.784 for PFS [15]. Even in imaging-enhanced models such as that proposed by Czibor et al., which used additional PET/CT features, biological markers, such as LDH, maintained their role as top-ranked predictor variables (AUC of 0.83 for 24-month PFS) [33].
Collectively, we cannot fail to notice the robust emerging data which indicate that various AI and ML framework designs re-validate established clinical markers. Rather than rendering these biomarkers obsolete, the published papers highlight these markers as core, high-impact variables which maintain strong discriminative power as a backbone for improved scoring systems alongside radiomic or genomic features. Therefore, we have to emphasize that there is a strong need for hybrid models that leverage accessible, low-cost clinical parameters paired with advanced computational input-processing models, targeting superior classification strategies which do not replace the existing ones, but complement the previously designed and well-used performance indices.
4.2. Challenges, Knowledge Gaps, and Future Directions
The same trend has been seen and implemented successfully in other hematologic malignancies. A pivotal AML study by Eckardt et al., developed and validated nine ML models trained on clinical, cytogenetic, and molecular features from 1383 intensively treated patients, with impressive AUROC values of 0.77–0.86 for complete remission and 0.63–0.74 for 2-year survival, exceeding conventional ELN-based scores [100]. Also, other researchers inferred, from peripheral blood smears, an early relapse predictor for AML using a transformer-based deep learning model, outpacing the existing clinical risk groups [101]. The concordance of these results depicts that multi-step ML pipelines, which are still under development, can already enhance risk stratification across hematologic cancers.
In DLBCL, there is a diversity of input modalities. Data can be derived from digital histopathology, gene expression, methylation, and ctDNA mutation profiles, streams that raise the opportunity for ML models to integrate disparate signals into unified risk scores. The increasing number of data inputs perfects the prediction capabilities of the ML model; multi-omics tools such as LymForest-25 prognostic signatures outperformed traditional indices and often revealed immune, stromal, or metabolic features predictive of poor outcomes [95]. A more targeted approach involves a narrower path but is extremely lucrative in extracting biologic drivers of risk, such as through the use of MYC signaling or T-cell exclusion [83,102].
Moving a step backward, the performance and interpretability of the ML-based models raises their use into the domain of clinically actionable decision tools. One example is the identification of patients with high-risk features (e.g., high lesion count or immune-desert transcriptomes) at baseline, which could guide early trial enrollment, up-front CAR-T referral, or intensified immunochemotherapy. As a parallel, AML random forests and logistic models using molecular data such as NPM1, FLT3-ITD, and TP53 mutations reshaped induction strategies once they were uncovered [100]. Therefore, we anticipate that translational use in DLBCL might have a similar impact if integrated into pre-treatment workflows.
4.3. Strengths and Limitations of the Scoping Review Methodology
However, we should not fail to acknowledge some challenges which still have to be mitigated. During our research, we encountered a heterogeneity in sample sizes, validation methods, and even in model transparency reporting amongst papers. We have noticed that few studies accounted for real-world deployment constraints, mostly relying on data derived from preexisting retrospective cohorts, with few mentions or design-wise notes related to computational cost, sequencing availability, or the need for model explainability, as models are sometimes regarded as black-boxes by clinicians, with their good outcomes but obscure workflows making clinicians skeptical of relying on them [6]. A long-awaited harmonization of reporting standards, integrated data feeding systems, and clear work concepts would improve clinical workflow integration, providing confidence amongst its users.
We also have to report some clinical limitations of this review. As this paper represents a scoping review, a formal risk of bias assessment was not performed, in line with the PRISMA-ScR guidance considering the heterogeneous nature and primary objective of the included studies, which was a systematic categorization rather than a synthesis of effect estimates [7]. Therefore, we focused on mapping the breadth and diversity of machine learning applications in DLBCL. Also, we have to reiterate the vast subdomains included, with highly heterogeneous sample sizes, data modalities, and model architectures, which precluded direct comparison or quantitative synthesis between all the articles. A third hindrance would be the high number of studies that lacked external validation, thus bringing the performance of some models in uncontrolled settings into question. Also, there might be a publication bias, especially against reporting negative or poorly performing ML models, which may thus be underrepresented in the literature.
5. Conclusions
To conclude, this review highlights that ML methods have the potential to predict outcomes in DLBCL earlier and more accurately than traditional approaches. The existing IPI score exhibited a satisfactory predictive power, but many of the reported models demonstrated enhanced discriminative features, even in patients which did not display a clear biological heterogeneous phenotype as per current classification standards. ML techniques uncovered non-obvious risk patterns, especially in multi-omics cohorts, which are not yet fully described in the literature. The strength of all the studies resided in the constant outperformance of the IPI score as a prognostic metric, and several studies also hinted at promising applications for personalized therapies in some cohorts. It was unanimously mentioned that all the studies tried to emphasize the use-case of decisional structures in accelerating the time-to-intervention in high-risk patients, a goal which is also intensely investigated in other hematological malignancies.
Author Contributions
Conceptualization: D.-C.P.; data curation: M.-A.G. and D.-C.P.; formal analysis: M.-A.G. and D.-C.P.; funding acquisition: D.-C.P.; investigation: M.-A.G. and D.-C.P.; methodology: D.-C.P.; project administration: D.-C.P.; resources: M.-A.G. and D.-C.P.; software: M.-A.G. and D.-C.P.; supervision: D.-C.P.; validation: M.-A.G. and D.-C.P.; visualization: M.-A.G. and D.-C.P.; writing—original draft: M.-A.G. and D.-C.P.; writing—review and editing: M.-A.G. and D.-C.P. All authors have read and agreed to the published version of the manuscript.
Funding
This research was funded by a grant from the Competitiveness Operational Programme (COP) A1.1.4. ID: P_37_798 MYELOAL-EDIAPROT, Contract 149/26.10.2016, (MySMIS2014+: 106774).
Institutional Review Board Statement
Not applicable.
Informed Consent Statement
Not applicable.
Data Availability Statement
No new data were created or analyzed in this study.
Acknowledgments
We would like to thank Andrea Lynch—Scholarly Communication Librarian at City of Hope for the article retrieval contribution during the research phase. During the preparation of this manuscript ChatGPT (OpenAI, GPT-5) was used for the purposes of language editing. The authors have contributed to, reviewed, and edited the output and take full responsibility for the content of this publication.
Conflicts of Interest
The authors declare no conflicts of interest.
Abbreviations
The following abbreviations are used in this manuscript:
| ABC | Activated B-cell-like |
| AI | Artificial Intelligence |
| ALB | Albumin |
| ANN | Artificial Neural Network |
| ASPP | Atrous Spatial Pyramid Pooling |
| AUC | Area Under the Curve |
| AUROC | Area Under the Receiver Operating Characteristic Curve |
| BCL-2 | B-cell Lymphoma 2 |
| CAF | Cancer-Associated Fibroblast |
| CACS | Coronary Artery Calcium Score |
| CD20 | Cluster of Differentiation 20 |
| CHAID | Chi-squared Automatic Interaction Detection |
| COO | Cell of Origin |
| CR | Complete Response |
| CVD | Cardiovascular Disease |
| CXR | Chest X-ray |
| DL | Deep Learning |
| DLBCL | Diffuse Large B-cell Lymphoma |
| DSC | Dice Similarity Coefficient |
| ECOG | Eastern Cooperative Oncology Group |
| EFS | Event-Free Survival |
| FISH | Fluorescence In Situ Hybridization |
| FFNN | Feedforward Neural Network |
| FFPE | Formalin-Fixed Paraffin-Embedded |
| FL | Follicular Lymphoma |
| FNN | Fuzzy Neural Network |
| FOXP1 | Forkhead Box Protein P1 |
| GCB | Germinal Center B-cell |
| GEP | Gene Expression Profiling |
| GNN | Graph Neural Network |
| H&E | Hematoxylin and Eosin |
| HGBL | High-Grade B-cell Lymphoma |
| HR | Hazard Ratio |
| ICC | Intraclass Correlation Coefficient |
| IHC | Immunohistochemistry |
| IPI | International Prognostic Index |
| IRF4 | Interferon Regulatory Factor 4 |
| KNN | k-Nearest Neighbors |
| KM | Kaplan–Meier |
| LASSO | Least Absolute Shrinkage and Selection Operator |
| LDH | Lactate Dehydrogenase |
| LR | Logistic Regression |
| MACEs | Major Adverse Cardiovascular Events |
| ML | Machine Learning |
| MLP | Multilayer Perceptron |
| MRI | Magnetic Resonance Imaging |
| MTV | Metabolic Tumor Volume |
| MYC | Myelocytomatosis Viral Oncogene |
| NCCN-IPI | National Comprehensive Cancer Network version of the IPI |
| NF-κB | Nuclear Factor Kappa-light-chain-enhancer of Activated B cells |
| NGTDM | Neighborhood Gray Tone Difference Matrix |
| NN | Neural Network |
| OS | Overall Survival |
| ODC1 | Ornithine Decarboxylase 1 |
| PARS | PET Automated Region Segmentation |
| PCA | Principal Component Analysis |
| PERCIST | PET Response Criteria in Solid Tumors |
| PET/CT | Positron Emission Tomography/Computed Tomography |
| PFS | Progression-Free Survival |
| qRT-PCR | Quantitative Reverse Transcription Polymerase Chain Reaction |
| RF | Random Forest |
| RFS | Relapse-Free Survival |
| R-CHOP | Rituximab, Cyclophosphamide, Doxorubicin, Vincristine, Prednisone |
| RSF | Random Survival Forest |
| scRNA-seq | Single-Cell RNA Sequencing |
| SEER | Surveillance, Epidemiology, and End Results Program |
| SHAP | SHapley Additive exPlanations |
| SHR | Subdistribution Hazard Ratio |
| SOM | Self-Organizing Map |
| SUV | Standardized Uptake Value |
| SUVmax | Maximum Standardized Uptake Value |
| SVC | Support Vector Classifier |
| SVM | Support Vector Machine |
| TLA | Three-Letter Acronym |
| TLG | Total Lesion Glycolysis |
| TMTV | Total Metabolic Tumor Volume |
| TME | Tumor Microenvironment |
| TP53 | Tumor Protein P53 |
| UMAP | Uniform Manifold Approximation and Projection |
| VAF | Variant Allele Frequency |
| VOI | Volume of Interest |
| WSI | Whole-Slide Image |
| XGBoost | Extreme Gradient Boosting |
References
- Tavakkoli, M.; Barta, S.K. 2024 Update: Advances in the Risk Stratification and Management of Large B-cell Lymphoma. Am. J. Hematol. 2023, 98, 1791–1805. [Google Scholar] [CrossRef]
- Zelenetz, A.D.; Gordon, L.I.; Abramson, J.S.; Advani, R.H.; Andreadis, B.; Bartlett, N.L.; Budde, L.E.; Caimi, P.F.; Chang, J.E.; Christian, B.; et al. NCCN Guidelines® Insights: B-Cell Lymphomas 3.2025: Featured Updates to the NCCN Guidelines. J. Natl. Compr. Canc. Netw. 2025, 23, e250048. [Google Scholar] [CrossRef]
- Jebaraj, B.M.C.; Liew, M.; Seyfried, F. Editorial: Reviews in Hematologic Malignancies: 2023. Front. Oncol. 2024, 14, 1412843. [Google Scholar] [CrossRef]
- Zhang, W.; Yang, L.; Guan, Y.Q.; Shen, K.F.; Zhang, M.L.; Cai, H.D.; Wang, J.C.; Wang, Y.; Huang, L.; Cao, Y.; et al. Novel Bioinformatic Classification System for Genetic Signatures Identification in Diffuse Large B-Cell Lymphoma. BMC Cancer 2020, 20, 714. [Google Scholar] [CrossRef]
- Shipp, M.A.; Ross, K.N.; Tamayo, P.; Weng, A.P.; Kutok, J.L.; Aguiar, R.C.T.; Gaasenbeek, M.; Angelo, M.; Reich, M.; Pinkus, G.S.; et al. Diffuse Large B-Cell Lymphoma Outcome Prediction by Gene-Expression Profiling and Supervised Machine Learning. Nat. Med. 2002, 8, 68–74. [Google Scholar] [CrossRef]
- Shouval, R.; Fein, J.A.; Savani, B.; Mohty, M.; Nagler, A. Machine Learning and Artificial Intelligence in Haematology. Br. J. Haematol. 2021, 192, 239–250. [Google Scholar] [CrossRef] [PubMed]
- Page, M.J.; McKenzie, J.E.; Bossuyt, P.M.; Boutron, I.; Hoffmann, T.C.; Mulrow, C.D.; Shamseer, L.; Tetzlaff, J.M.; Akl, E.A.; Brennan, S.E.; et al. The PRISMA 2020 Statement: An Updated Guideline for Reporting Systematic Reviews. BMJ 2021, 372, n71. [Google Scholar] [CrossRef]
- Biccler, J.L.; Eloranta, S.; de Nully Brown, P.; Frederiksen, H.; Jerkeman, M.; Jørgensen, J.; Jakobsen, L.H.; Smedby, K.E.; Bøgsted, M.; El-Galaly, T.C. Optimizing Outcome Prediction in Diffuse Large B-Cell Lymphoma by Use of Machine Learning and Nationwide Lymphoma Registries: A Nordic Lymphoma Group Study. JCO Clin. Cancer Inform. 2018, 2, 1–13. [Google Scholar] [CrossRef] [PubMed]
- Fan, S.; Zhao, Z.; Zhang, Y.; Yu, H.; Zheng, C.; Huang, X.; Yang, Z.; Xing, M.; Lu, Q.; Luo, Y. Probability Calibration-Based Prediction of Recurrence Rate in Patients with Diffuse Large B-Cell Lymphoma. BioData Min. 2021, 14, 38. [Google Scholar] [CrossRef]
- Kim, J.-Y.; Kahttana, I.; Yoon, H.; Chang, S.; Yoon, S.O. Exploring the Potential of Enhanced Prognostic Performance of NCCN-IPI in Diffuse Large B-Cell Lymphoma by Integrating Tumor Microenvironment Markers: Stromal FOXC1 and Tumor pERK1/2 Expression. Cancer Med. 2024, 13, e70305. [Google Scholar] [CrossRef] [PubMed]
- Qin, J.-J.; Zhu, X.-X.; Chen, X.; Sang, W.; Jin, Y.-L. Comparison of Cox Regression and Generalized Cox Regression Models to Machine Learning in Predicting Survival of Children with Diffuse Large B-Cell Lymphoma. Transl. Cancer Res. 2024, 13, 3370–3381. [Google Scholar] [CrossRef]
- Samarina, S.V.; Luchinin, A.S.; Minaeva, N.V.; Paramonov, I.V.; D’yakonov, D.A.; Vaneeva, E.V.; Rosin, V.A.; Gritsaev, S.V. Immunohistochemical subtype and parameters of international prognostic index in the new prognostic model of diffuse large B-Cell lymphoma. Clin. Oncohematol. 2019, 12, 385–390. [Google Scholar] [CrossRef]
- Shen, Z.; Zhang, S.; Jiao, Y.; Shi, Y.; Zhang, H.; Wang, F.; Wang, L.; Zhu, T.; Miao, Y.; Sang, W.; et al. LASSO Model Better Predicted the Prognosis of DLBCL than Random Forest Model: A Retrospective Multicenter Analysis of HHLWG. J. Oncol. 2022, 2022, 1618272. [Google Scholar] [CrossRef]
- Zhao, A.; Sun, X.; Cheng, W.; Yang, Y.; Xiang, B.; Niu, T. Epidemiology Characteristics and Clinical Outcomes of Composite Hodgkin Lymphoma and Diffuse Large B-Cell Lymphoma Using Machine Learning. Oncol. 2025, 30, oyae221. [Google Scholar] [CrossRef]
- Zhu, N.; Shen, R.-B.; Chen, J.-F.; Gu, J.-Y.; Xiang, S.-C.; Zhang, Y.; Qian, L.-L.; Guo, Q.; Chen, S.-N.; Shen, J.-P.; et al. Predicting the Risk of Ibrutinib in Combination with R-ICE in Patients with Relapsed or Refractory DLBCL Using Explainable Machine Learning Algorithms. Clin. Exp. Med. 2025, 25, 177. [Google Scholar] [CrossRef]
- Biccler, J.L.; El-Galaly, T.C.; Bøgsted, M.; Jørgensen, J.; de Nully Brown, P.; Poulsen, C.B.; Starklint, J.; Juul, M.B.; Christensen, J.H.; Josefsson, P.; et al. Clinical Prognostic Scores Are Poor Predictors of Overall Survival in Various Types of Malignant Lymphomas. Leuk. Lymphoma 2019, 60, 1580–1583. [Google Scholar] [CrossRef]
- Swiderska-Chadaj, Z.; Hebeda, K.M.; van den Brand, M.; Litjens, G. Artificial Intelligence to Detect MYC Translocation in Slides of Diffuse Large B-Cell Lymphoma. Virchows Arch. 2021, 479, 617–621. [Google Scholar] [CrossRef] [PubMed]
- Lee, J.H.; Song, G.-Y.; Lee, J.; Kang, S.-R.; Moon, K.M.; Choi, Y.-D.; Shen, J.; Noh, M.-G.; Yang, D.-H. Prediction of Immunochemotherapy Response for Diffuse Large B-Cell Lymphoma Using Artificial Intelligence Digital Pathology. J. Pathol. Clin. Res. 2024, 10, e12370. [Google Scholar] [CrossRef]
- Cristian, M.; Așchie, M.; Deacu, M.; Boșoteanu, M.; Bălțătescu, G.I.; Stoica, A.G.; Nicolau, A.A.; Poinăreanu, I.; Orășanu, C.I. Comparison of Ki67 Proliferation Index in Gastrointestinal Non-Hodgkin Large B-Cell Lymphomas: The Conventional Method of Evaluation or AI Evaluation? Diagnostics 2023, 13, 2775. [Google Scholar] [CrossRef]
- Da Costa, C.B.T. Machine Learning Provides an Accurate Classification of Diffuse Large B-Cell Lymphoma from Immunohistochemical Data. J. Pathol. Inform. 2018, 9, 21. [Google Scholar] [CrossRef] [PubMed]
- Xue, X.; Zeng, N.; Gao, Z.; Du, M.-Q. Diffuse Large B-Cell Lymphoma: Sub-Classification by Massive Parallel Quantitative RT-PCR. Lab. Investig. 2015, 95, 113–120. [Google Scholar] [CrossRef] [PubMed]
- Shen, H.; Lian, Y.; Yin, J.; Zhu, M.; Yang, C.; Tu, C.; Peng, Y.; Li, X.; Zhang, J. Cardiovascular Risk Stratification by Automatic Coronary Artery Calcium Scoring on Pretreatment Chest Computed Tomography in Diffuse Large B-Cell Lymphoma Receiving Anthracycline-Based Chemotherapy: A Multicenter Study. Circ. Cardiovasc. Imaging 2023, 16, e014829. [Google Scholar] [CrossRef]
- Capobianco, N.; Meignan, M.; Cottereau, A.-S.; Vercellino, L.; Sibille, L.; Spottiswoode, B.; Zuehlsdorff, S.; Casasnovas, O.; Thieblemont, C.; Buvat, I. Deep-Learning 18F-FDG Uptake Classification Enables Total Metabolic Tumor Volume Estimation in Diffuse Large b-Cell Lymphoma. J. Nucl. Med. 2021, 62, 30–36. [Google Scholar] [CrossRef]
- Zhao, J.; Zhao, W.; Chen, M.; Rong, J.; Teng, Y.; Chen, J.; Xu, J. 18F-FDG PET Radiomics Score Construction by Automatic Machine Learning for Treatment Response Prediction in Elderly Patients with Diffuse Large B-Cell Lymphoma: A Multicenter Study. J. Cancer Res. Clin. Oncol. 2025, 151, 125. [Google Scholar] [CrossRef]
- Thiery, O.; Rizkallah, M.; Bailly, C.; Bodet-Milin, C.; Itti, E.; Casasnovas, R.-O.; Le Gouill, S.; Carlier, T.; Mateus, D. PET-Based Lesion Graphs Meet Clinical Data: An Interpretable Cross-Attention Framework for DLBCL Treatment Response Prediction. Comput. Med. Imaging Graph. 2025, 120, 102481. [Google Scholar] [CrossRef]
- Chen, J.; Lin, F.; Dai, Z.; Chen, Y.; Fan, Y.; Li, A.; Zhao, C. Survival Prediction in Diffuse Large B-Cell Lymphoma Patients: Multimodal PET/CT Deep Features Radiomic Model Utilizing Automated Machine Learning. J. Cancer Res. Clin. Oncol. 2024, 150, 452. [Google Scholar] [CrossRef]
- Ferrández, M.C.; Golla, S.S.V.; Eertink, J.J.; Wiegers, S.E.; Zwezerijnen, G.J.C.; Heymans, M.W.; Lugtenburg, P.J.; Kurch, L.; Hüttmann, A.; Hanoun, C.; et al. Validation of an Artificial Intelligence–Based Prediction Model Using 5 External PET/CT Datasets of Diffuse Large B-Cell Lymphoma. J. Nucl. Med. 2024, 65, 1802–1807. [Google Scholar] [CrossRef] [PubMed]
- Girum, K.B.; Cottereau, A.-S.; Vercellino, L.; Rebaud, L.; Clerc, J.; Casasnovas, O.; Morschhauser, F.; Thieblemont, C.; Buvat, I. Tumor Location Relative to the Spleen Is a Prognostic Factor in Lymphoma Patients: A Demonstration from the REMARC Trial. J. Nucl. Med. Off. Publ. Soc. Nucl. Med. 2024, 65, 313–319. [Google Scholar] [CrossRef] [PubMed]
- Carlier, T.; Frécon, G.; Mateus, D.; Rizkallah, M.; Kraeber-Bodéré, F.; Kanoun, S.; Blanc-Durand, P.; Itti, E.; Le Gouill, S.; Casasnovas, R.-O.; et al. Prognostic Value of 18F-FDG PET Radiomics Features at Baseline in PET-Guided Consolidation Strategy in Diffuse Large B-Cell Lymphoma: A Machine-Learning Analysis from the GAINED Study. J. Nucl. Med. 2024, 65, 156–162. [Google Scholar] [CrossRef] [PubMed]
- de Jesus, F.M.; Yin, Y.; Mantzorou-Kyriaki, E.; Kahle, X.U.; de Haas, R.J.; Yakar, D.; Glaudemans, A.W.J.M.; Noordzij, W.; Kwee, T.C.; Nijland, M. Machine Learning in the Differentiation of Follicular Lymphoma from Diffuse Large B-Cell Lymphoma with Radiomic [18F]FDG PET/CT Features. Eur. J. Nucl. Med. Mol. Imaging 2022, 49, 1535–1543. [Google Scholar] [CrossRef] [PubMed]
- Chang, C.-C.; Chen, C.-H.; Hsieh, J.-G.; Jeng, J.-H. Iterated Cross Validation Method for Prediction of Survival in Diffuse Large B-Cell Lymphoma for Small Size Dataset. Sci. Rep. 2023, 13, 1438. [Google Scholar] [CrossRef]
- Detrait, M.Y.; Warnon, S.; Lagasse, R.; Dumont, L.; De Prophétis, S.; Hansenne, A.; Raedemaeker, J.; Robin, V.; Verstraete, G.; Gillain, A.; et al. A Machine Learning Approach in a Monocentric Cohort for Predicting Primary Refractory Disease in Diffuse Large B-Cell Lymphoma Patients. PLoS ONE 2024, 19, e0311261. [Google Scholar] [CrossRef]
- Czibor, S.; Csatlós, Z.; Fábián, K.; Piroska, M.; Györke, T. Volumetric and Textural Analysis of PET/CT in Patients with Diffuse Large B-Cell Lymphoma Highlights the Importance of Novel MTVrate Feature. Nucl. Med. Commun. 2024, 45, 931–937. [Google Scholar] [CrossRef] [PubMed]
- Liu, J.; Tu, J.; Yao, L.; Peng, L.; Fang, R.; Lu, Y.; He, F.; Xiong, J.; Li, Y. MRI-Based Radiomics Virtual Biopsy for BCL6 in Primary Central Nervous System Lymphoma. Clin. Radiol. 2025, 80, 106746. [Google Scholar] [CrossRef]
- Jiang, C.; Qian, C.; Jiang, Z.; Teng, Y.; Lai, R.; Sun, Y.; Ni, X.; Ding, C.; Xu, Y.; Tian, R. Robust Deep Learning-Based PET Prognostic Imaging Biomarker for DLBCL Patients: A Multicenter Study. Eur. J. Nucl. Med. Mol. Imaging 2023, 50, 3949–3960. [Google Scholar] [CrossRef]
- Luo, Y.; Li, Y.; Yang, Z.; Zhang, Y.; Yu, H.; Zhao, Z.; Yu, K.; Guo, Y.; Wang, X.; Yang, N.; et al. A Multi-View Prognostic Model for Diffuse Large B-Cell Lymphoma Based on Kernel Canonical Correlation Analysis and Support Vector Machine. BMC Cancer 2024, 24, 1495. [Google Scholar] [CrossRef]
- Zhao, S.; Wang, J.; Jin, C.; Zhang, X.; Xue, C.; Zhou, R.; Zhong, Y.; Liu, Y.; He, X.; Zhou, Y.; et al. Stacking Ensemble Learning-Based [(18)F]FDG PET Radiomics for Outcome Prediction in Diffuse Large B-Cell Lymphoma. J. Nucl. Med. Off. Publ. Soc. Nucl. Med. 2023, 64, 1603–1609. [Google Scholar] [CrossRef]
- Santiago, R.; Ortiz Jimenez, J.; Forghani, R.; Muthukrishnan, N.; Del Corpo, O.; Karthigesu, S.; Haider, M.Y.; Reinhold, C.; Assouline, S. CT-Based Radiomics Model with Machine Learning for Predicting Primary Treatment Failure in Diffuse Large B-Cell Lymphoma. Transl. Oncol. 2021, 14, 101188. [Google Scholar] [CrossRef] [PubMed]
- Zhou, Y.; Zhou, X.-Y.; Xu, Y.-C.; Ma, X.-L.; Tian, R. Radiomics Based on 18F-FDG PET for Predicting Treatment Response and Prognosis in Newly Diagnosed Diffuse Large B-Cell Lymphoma Patients: Do Lesion Selection and Segmentation Methods Matter? Quant. Imaging Med. Surg. 2025, 15, 103–120. [Google Scholar] [CrossRef] [PubMed]
- Kuker, R.A.; Lehmkuhl, D.; Kwon, D.; Zhao, W.; Lossos, I.S.; Moskowitz, C.H.; Alderuccio, J.P.; Yang, F. A Deep Learning-Aided Automated Method for Calculating Metabolic Tumor Volume in Diffuse Large B-Cell Lymphoma. Cancers 2022, 14, 5221. [Google Scholar] [CrossRef]
- Pinochet, P.; Eude, F.; Becker, S.; Shah, V.; Sibille, L.; Toledano, M.N.; Modzelewski, R.; Vera, P.; Decazes, P. Evaluation of an Automatic Classification Algorithm Using Convolutional Neural Networks in Oncological Positron Emission Tomography. Front. Med. 2021, 8, 628179. [Google Scholar] [CrossRef]
- Yuan, C.; Zhang, M.; Huang, X.; Xie, W.; Lin, X.; Zhao, W.; Li, B.; Qian, D. Diffuse Large B-Cell Lymphoma Segmentation in PET-CT Images via Hybrid Learning for Feature Fusion. Med. Phys. 2021, 48, 3665–3678. [Google Scholar] [CrossRef]
- Ferrández, M.C.; Golla, S.S.V.; Eertink, J.J.; de Vries, B.M.; Lugtenburg, P.J.; Wiegers, S.E.; Zwezerijnen, G.J.C.; Pieplenbosch, S.; Kurch, L.; Hüttmann, A.; et al. An Artificial Intelligence Method Using FDG PET to Predict Treatment Outcome in Diffuse Large B Cell Lymphoma Patients. Sci. Rep. 2023, 13, 13111. [Google Scholar] [CrossRef]
- Ritter, Z.; Papp, L.; Zámbó, K.; Tóth, Z.; Dezső, D.; Veres, D.S.; Máthé, D.; Budán, F.; Karádi, E.; Balikó, A.; et al. Two-Year Event-Free Survival Prediction in DLBCL Patients Based on In Vivo Radiomics and Clinical Parameters. Front. Oncol. 2022, 12, 820136. [Google Scholar] [CrossRef]
- Jing, F.; Zhang, X.; Liu, Y.; Chen, X.; Zhao, J.; Zhao, X.; Chen, X.; Yuan, H.; Dai, M.; Wang, N.; et al. Baseline 18F-FDG PET/CT Radiomics for Prognosis Prediction in Diffuse Large B Cell Lymphoma with Extranodal Involvement. Clin. Transl. Oncol. 2025, 27, 727–735. [Google Scholar] [CrossRef] [PubMed]
- Huang, Z.; Guo, Y.; Zhang, N.; Huang, X.; Decazes, P.; Becker, S.; Ruan, S. Multi-Scale Feature Similarity-Based Weakly Supervised Lymphoma Segmentation in PET/CT Images. Comput. Biol. Med. 2022, 151, 106230. [Google Scholar] [CrossRef]
- Frood, R.; Clark, M.; Burton, C.; Tsoumpas, C.; Frangi, A.F.; Gleeson, F.; Patel, C.; Scarsbrook, A.F. Discovery of Pre-Treatment FDG PET/CT-Derived Radiomics-Based Models for Predicting Outcome in Diffuse Large B-Cell Lymphoma. Cancers 2022, 14, 1711. [Google Scholar] [CrossRef] [PubMed]
- Girum, K.B.; Rebaud, L.; Cottereau, A.-S.; Meignan, M.; Clerc, J.; Vercellino, L.; Casasnovas, O.; Morschhauser, F.; Thieblemont, C.; Buvat, I. 18F-FDG PET Maximum-Intensity Projections and Artificial Intelligence: A Win-Win Combination to Easily Measure Prognostic Biomarkers in DLBCL Patients. J. Nucl. Med. 2022, 63, 1925–1932. [Google Scholar] [CrossRef] [PubMed]
- Jemaa, S.; Paulson, J.N.; Hutchings, M.; Kostakoglu, L.; Trotman, J.; Tracy, S.; de Crespigny, A.; Carano, R.A.D.; El-Galaly, T.C.; Nielsen, T.G.; et al. Full Automation of Total Metabolic Tumor Volume from FDG-PET/CT in DLBCL for Baseline Risk Assessments. Cancer Imaging Off. Publ. Int. Cancer Imaging Soc. 2022, 22, 39. [Google Scholar] [CrossRef]
- Jiang, C.; Huang, X.; Li, A.; Teng, Y.; Ding, C.; Chen, J.; Xu, J.; Zhou, Z. Radiomics Signature from [18F]FDG PET Images for Prognosis Predication of Primary Gastrointestinal Diffuse Large B Cell Lymphoma. Eur. Radiol. 2022, 32, 5730–5741. [Google Scholar] [CrossRef]
- Jiang, C.; Li, A.; Teng, Y.; Huang, X.; Ding, C.; Chen, J.; Xu, J.; Zhou, Z. Optimal PET-Based Radiomic Signature Construction Based on the Cross-Combination Method for Predicting the Survival of Patients with Diffuse Large B-Cell Lymphoma. Eur. J. Nucl. Med. Mol. Imaging 2022, 49, 2902–2916. [Google Scholar] [CrossRef]
- Jing, F.; Liu, Y.; Zhao, X.; Wang, N.; Dai, M.; Chen, X.; Zhang, Z.; Zhang, J.; Wang, J.; Wang, Y. Baseline 18F-FDG PET/CT Radiomics for Prognosis Prediction in Diffuse Large B Cell Lymphoma. EJNMMI Res. 2023, 13, 92. [Google Scholar] [CrossRef]
- Chen, M.; Rong, J.; Zhao, J.; Teng, Y.; Jiang, C.; Chen, J.; Xu, J. PET-Based Radiomic Feature Based on the Cross-Combination Method for Predicting the Mid-Term Efficacy and Prognosis in High-Risk Diffuse Large B-Cell Lymphoma Patients. Front. Oncol. 2024, 14, 1394450. [Google Scholar] [CrossRef]
- Risueno, A.; Hagner, P.R.; Towfic, F.; Fontanillo, C.; Djebbari, A.; Parker, J.S.; Drew, C.; Nowakowski, G.S.; Maurer, M.J.; Cerhan, J.R.; et al. Leveraging Gene Expression Subgroups to Classify DLBCL Patients and Enrich for Clinical Benefit to a Novel Agent. Blood 2020, 135, 1008–1018. [Google Scholar] [CrossRef]
- Cui, H.; Chen, M.; Zhao, M.; Li, B. A Novel Cancer-Associated Fibroblast–Related Gene Signature for Predicting Diffuse Large B Cell Lymphoma Prognosis Using Weighted Gene Co-Expression Network Analysis and Machine Learning. J. Int. Med. Res. 2025, 53, 3000605251331250. [Google Scholar] [CrossRef]
- Carreras, J.; Hamoudi, R. Anomaly Detection and Artificial Intelligence Identified the Pathogenic Role of Apoptosis and RELB Proto-Oncogene, NF-kB Subunit in Diffuse Large B-Cell Lymphoma. BioMedInformatics 2024, 4, 1480–1505. [Google Scholar] [CrossRef]
- Zaccaria, G.M.; Altini, N.; Mezzolla, G.; Vegliante, M.C.; Stranieri, M.; Pappagallo, S.A.; Ciavarella, S.; Guarini, A.; Bevilacqua, V. SurvIAE: Survival Prediction with Interpretable Autoencoders from Diffuse Large B-Cells Lymphoma Gene Expression Data. Comput. Methods Programs Biomed. 2024, 244, 107966. [Google Scholar] [CrossRef] [PubMed]
- Merdan, S.; Subramanian, K.; Ayer, T.; Van Weyenbergh, J.; Chang, A.; Koff, J.L.; Flowers, C. Gene Expression Profiling-Based Risk Prediction and Profiles of Immune Infiltration in Diffuse Large B-Cell Lymphoma. Blood Cancer J. 2021, 11, 2. [Google Scholar] [CrossRef] [PubMed]
- Wang, F.; Gao, Y.; Chen, Y.; Li, P.; Zeng, Y.; Chen, Y.; Yin, Y.; Jia, Y.; Wang, Y. Development of a Mitochondria-Related Gene Signature for Prognostic Assessment in Diffuse Large B Cell Lymphoma. Front. Oncol. 2025, 15, 1542829. [Google Scholar] [CrossRef]
- He, T.; Geng, J.; Hou, C.; Li, H.; Zhang, H.; Zhao, P.; He, P.; Lu, X. Predictive Biomarkers and Molecular Subtypes in DLBCL: Insights from PCD Gene Expression and Machine Learning. Discov. Oncol. 2025, 16, 542. [Google Scholar] [CrossRef] [PubMed]
- Steen, C.B.; Luca, B.A.; Esfahani, M.S.; Azizi, A.; Sworder, B.J.; Nabet, B.Y.; Kurtz, D.M.; Liu, C.L.; Khameneh, F.; Advani, R.H.; et al. The Landscape of Tumor Cell States and Ecosystems in Diffuse Large B Cell Lymphoma. Cancer Cell 2021, 39, 1422–1437.e10. [Google Scholar] [CrossRef]
- Qi, J.; Xu, L.; Huang, D.; He, H.; Yao, J.; Zhang, J.; Xu, Y.; Yang, L. Defining Diffuse Large B-Cell Lymphoma Immunotypes by CD8+ T Cells and Natural Killer Cells. J. Oncol. 2022, 2022, 3168172. [Google Scholar] [CrossRef]
- Zhang, J.; Jia, Z.; Zhang, J.; Mu, X.; Ai, L. Identification of M2 Macrophage-Related Genes Associated with Diffuse Large B-Cell Lymphoma via Bioinformatics and Machine Learning Approaches. Biol. Direct 2025, 20, 58. [Google Scholar] [CrossRef]
- Bentink, S.; Wessendorf, S.; Schwaenen, C.; Rosolowski, M.; Klapper, W.; Rosenwald, A.; Ott, G.; Banham, A.H.; Berger, H.; Feller, A.C.; et al. Pathway Activation Patterns in Diffuse Large B-Cell Lymphomas. Leukemia 2008, 22, 1746–1754. [Google Scholar] [CrossRef]
- Hopp, L.; Löffler-Wirth, H.; Binder, H. Epigenetic Heterogeneity of B-Cell Lymphoma: DNA Methylation, Gene Expression and Chromatin States. Genes 2015, 6, 812–840. [Google Scholar] [CrossRef] [PubMed]
- Xu, R.; Cai, X.; Wunsch II, D.C. Gene Expression Data for DLBCL Cancer Survival Prediction with a Combination of Machine Learning Technologies. Conf. Proc. IEEE Eng. Med. Biol. Soc. 2005, 2006, 894–897. [Google Scholar]
- Halder, A.; Kumar, A. Active Learning Using Rough Fuzzy Classifier for Cancer Prediction from Microarray Gene Expression Data. J. Biomed. Inform. 2019, 92, 103136. [Google Scholar] [CrossRef] [PubMed]
- Murphy, R.G.; Gilmore, A.; Senevirathne, S.; O’Reilly, P.G.; LaBonte Wilson, M.; Jain, S.; McArt, D.G. Particle Swarm Optimization Artificial Intelligence Technique for Gene Signature Discovery in Transcriptomic Cohorts. Comput. Struct. Biotechnol. J. 2022, 20, 5547–5563. [Google Scholar] [CrossRef]
- Wang, Y.; Tsukamoto, Y.; Hori, M.; Iha, H. Disulfidptosis: A Novel Prognostic Criterion and Potential Treatment Strategy for Diffuse Large B-Cell Lymphoma (DLBCL). Int. J. Mol. Sci. 2024, 25, 7156. [Google Scholar] [CrossRef]
- Zhao, S.; Dong, X.; Shen, W.; Ye, Z.; Xiang, R. Machine Learning-Based Classification of Diffuse Large B-Cell Lymphoma Patients by Eight Gene Expression Profiles. Cancer Med. 2016, 5, 837–852. [Google Scholar] [CrossRef]
- Zhuang, X.; Liu, B.; Long, J.; Wang, H.; Yu, J.; Ji, X.; Li, J.; Zhu, N.; Li, L.; Chen, Y.; et al. Machine-Learning-Based Classification of Diffuse Large B-Cell Lymphoma Patients by a 7-mRNA Signature Enriched with Immune Infiltration and Cell Cycle. Clin. Transl. Oncol. Off. Publ. Fed. Span. Oncol. Soc. Natl. Cancer Inst. Mex. 2024, 26, 936–950. [Google Scholar] [CrossRef]
- Du, K.-X.; Wu, Y.-F.; Hua, W.; Duan, Z.-W.; Gao, R.; Liang, J.-H.; Li, Y.; Yin, H.; Wu, J.-Z.; Shen, H.-R.; et al. Identify Truly High-Risk TP53-Mutated Diffuse Large B Cell Lymphoma Patients and Explore the Underlying Biological Mechanisms. Cell Commun. Signal. 2024, 22, 401. [Google Scholar] [CrossRef]
- Zhu, M.; Xiao, Q.; Cai, X.; Chen, Z.; Shi, Q.; Sun, X.; Xie, X.; Sun, M. Predicting Lymphoma Prognosis Using Machine Learning-Based Genes Associated with Lactylation. Transl. Oncol. 2024, 49, 102102. [Google Scholar] [CrossRef]
- Zhou, Z.-Z.; Lu, J.-C.; Guo, S.-B.; Tian, X.-P.; Li, H.-L.; Zhou, H.; Huang, W.-J. A Mitochondria-Related Signature in Diffuse Large B-Cell Lymphoma: Prognosis, Immune and Therapeutic Features. Cancer Med. 2025, 14, e70602. [Google Scholar] [CrossRef]
- Liang, X.; Guo, J.; Wang, X.; Luo, B.; Fu, R.; Chen, H.; Yang, Y.; Jin, Z.; Lin, C.; Zang, A.; et al. Overexpression of Ornithine Decarboxylase 1 Mediates the Immune-Deserted Microenvironment and Poor Prognosis in Diffuse Large B-Cell Lymphoma. J. Natl. Cancer Cent. 2025, 5, 57–74. [Google Scholar] [CrossRef]
- Albitar, M.; Zhang, H.; Goy, A.; Xu-Monette, Z.Y.; Bhagat, G.; Visco, C.; Tzankov, A.; Fang, X.; Zhu, F.; Dybkaer, K.; et al. Determining Clinical Course of Diffuse Large B-Cell Lymphoma Using Targeted Transcriptome and Machine Learning Algorithms. Blood Cancer J. 2022, 12, 25. [Google Scholar] [CrossRef]
- Carreras, J.; Kikuti, Y.Y.; Miyaoka, M.; Hiraiwa, S.; Tomita, S.; Ikoma, H.; Kondo, Y.; Ito, A.; Nakamura, N.; Hamoudi, R. A Combination of Multilayer Perceptron, Radial Basis Function Artificial Neural Networks and Machine Learning Image Segmentation for the Dimension Reduction and the Prognosis Assessment of Diffuse Large B-Cell Lymphoma. AI Switz. 2021, 2, 106–134. [Google Scholar] [CrossRef]
- Carreras, J.; Kikuti, Y.Y.; Roncador, G.; Miyaoka, M.; Hiraiwa, S.; Tomita, S.; Ikoma, H.; Kondo, Y.; Ito, A.; Shiraiwa, S.; et al. High Expression of Caspase-8 Associated with Improved Survival in Diffuse Large B-Cell Lymphoma: Machine Learning and Artificial Neural Networks Analyses. BioMedInformatics 2021, 1, 18–46. [Google Scholar] [CrossRef]
- Carreras, J.; Hiraiwa, S.; Kikuti, Y.Y.; Miyaoka, M.; Tomita, S.; Ikoma, H.; Ito, A.; Kondo, Y.; Roncador, G.; Garcia, J.F.; et al. Artificial Neural Networks Predicted the Overall Survival and Molecular Subtypes of Diffuse Large B-Cell Lymphoma Using a Pancancer Immune Oncology Panel. Cancers 2021, 13, 6384. [Google Scholar] [CrossRef] [PubMed]
- Carreras, J.; Kikuti, Y.Y.; Miyaoka, M.; Roncador, G.; Garcia, J.F.; Hiraiwa, S.; Tomita, S.; Ikoma, H.; Kondo, Y.; Ito, A.; et al. Integrative Statistics, Machine Learning and Artificial Intelligence Neural Network Analysis Correlated CSF1R with the Prognosis of Diffuse Large B-Cell Lymphoma. Hemato 2021, 2, 182–206. [Google Scholar] [CrossRef]
- Peng, H.; Su, M.; Guo, X.; Shi, L.; Lei, T.; Yu, H.; Xu, J.; Pan, X.; Chen, X. Artificial Intelligence-Based Prognostic Model Accurately Predicts the Survival of Patients with Diffuse Large B-Cell Lymphomas: Analysis of a Large Cohort in China. BMC Cancer 2024, 24, 621. [Google Scholar] [CrossRef]
- Mosquera Orgueira, A.; Díaz Arias, J.Á.; Cid López, M.; Peleteiro Raíndo, A.; Antelo Rodríguez, B.; Aliste Santos, C.; Alonso Vence, N.; Bendaña López, Á.; Abuín Blanco, A.; Bao Pérez, L.; et al. Improved Personalized Survival Prediction of Patients with Diffuse Large B-Cell Lymphoma Using Gene Expression Profiling. BMC Cancer 2020, 20, 1017. [Google Scholar] [CrossRef]
- Stokes, M.E.; Wenzl, K.; Huang, C.C.; Ortiz, M.; Hsu, C.-C.; Maurer, M.J.; Stong, N.; Nakayama, Y.; Wu, L.; Chiu, H.; et al. Transcriptomic Classification of Diffuse Large B-Cell Lymphoma Identifies a High-Risk Activated B-Cell-like Subpopulation with Targetable MYC Dysregulation. Nat. Commun. 2024, 15, 6790. [Google Scholar] [CrossRef]
- Loeffler-Wirth, H.; Kreuz, M.; Hopp, L.; Arakelyan, A.; Haake, A.; Cogliatti, S.B.; Feller, A.C.; Hansmann, M.-L.; Lenze, D.; Möller, P.; et al. A Modular Transcriptome Map of Mature B Cell Lymphomas. Genome Med. 2019, 11, 27. [Google Scholar] [CrossRef]
- Tyryshkin, K.; Moore, A.; Good, D.; Popov, J.; Crocker, S.; Rauh, M.J.; Baetz, T.; LeBrun, D.P. Expression of TCF3 Target Genes Defines a Subclass of Diffuse Large B-Cell Lymphoma Characterized by up-Regulation of MYC Target Genes and Poor Clinical Outcome Following R-CHOP Therapy. Leuk. Lymphoma 2023, 64, 119–129. [Google Scholar] [CrossRef]
- Xu-Monette, Z.Y.; Zhang, H.; Zhu, F.; Tzankov, A.; Bhagat, G.; Visco, C.; Dybkaer, K.; Chiu, A.; Tam, W.; Zu, Y.; et al. A Refined Cell-of-Origin Classifier with Targeted NGS and Artificial Intelligence Shows Robust Predictive Value in DLBCL. Blood Adv. 2020, 4, 3391–3404. [Google Scholar] [CrossRef] [PubMed]
- Dai, Y.; Li, J.; Yamamoto, K.; Goyama, S.; Loza, M.; Park, S.-J.; Nakai, K. Integrative Analysis of Cancer Multimodality Data Identifying COPS5 as a Novel Biomarker of Diffuse Large B-Cell Lymphoma. Front. Genet. 2024, 15, 1407765. [Google Scholar] [CrossRef]
- de Groen, R.A.L.; de Groot, F.A.; Böhringer, S.; Kret, E.J.; de Haan, L.M.; Noordenbos, T.; Blommers, S.; Jansen, R.E.W.; van Wezel, T.; van Eijk, R.; et al. Superior Survival in Diffuse Large B Cell Lymphoma of the Bone with Immune Rich Tumor Microenvironment. Blood Cancer J. 2025, 15, 82. [Google Scholar] [CrossRef]
- Minezaki, T.; Usui, Y.; Asakage, M.; Takanashi, M.; Shimizu, H.; Nezu, N.; Narimatsu, A.; Tsubota, K.; Umazume, K.; Yamakawa, N.; et al. High-throughput Microrna Profiling of Vitreoretinal Lymphoma: Vitreous and Serum Microrna Profiles Distinct from Uveitis. J. Clin. Med. 2020, 9, 1844. [Google Scholar] [CrossRef]
- Nakamura, N.; Hamada, R.; Kaneko, H.; Ohta, S. Selecting Optimum miRNA Panel for miRNA Signature-Based Companion Diagnostic Model to Predict the Response of R-CHOP Treatment in Diffuse Large B-Cell Lymphoma. J. Biosci. Bioeng. 2023, 135, 341–347. [Google Scholar] [CrossRef]
- Meriranta, L.; Alkodsi, A.; Pasanen, A.; Lepistö, M.; Mapar, P.; Blaker, Y.N.; Jørgensen, J.; Karjalainen-Lindsberg, M.-L.; Fiskvik, I.; Mikalsen, L.T.G.; et al. Molecular Features Encoded in the ctDNA Reveal Heterogeneity and Predict Outcome in High-Risk Aggressive B-Cell Lymphoma. Blood 2022, 139, 1863–1877. [Google Scholar] [CrossRef]
- Mutter, J.A.; Alig, S.K.; Esfahani, M.S.; Lauer, E.M.; Mitschke, J.; Kurtz, D.M.; Kühn, J.; Bleul, S.; Olsen, M.; Liu, C.L.; et al. Circulating Tumor DNA Profiling for Detection, Risk Stratification, and Classification of Brain Lymphomas. J. Clin. Oncol. 2023, 41, 1684–1694. [Google Scholar] [CrossRef] [PubMed]
- Zhao, K.; Zheng, X.; Liu, X.; Liu, T.; Ke, Z.; Zhu, F.; Wen, Q.; Xin, B.; Li, Q.; Zhang, L. Tissue-Matched IgH Gene Rearrangement of Circulating Tumor DNA Shows Significant Value in Predicting the Progression of Diffuse Large B Cell Lymphoma. Oncologist 2024, 29, e672–e680. [Google Scholar] [CrossRef]
- Futschik, M.E.; Sullivan, M.; Reeve, A.; Kasabov, N. Prediction of Clinical Behaviour and Treatment for Cancers. Appl. Bioinform. 2003, 2, S53–S58. [Google Scholar]
- Mosquera Orgueira, A.; Diaz Arias, J.A.; Cid Lopez, M.; Peleteiro Raindo, A.; Lopez Garcia, A.; Abal Garcia, R.; Gonzalez Perez, M.S.; Antelo Rodriguez, B.; Aliste Santos, C.; Perez Encinas, M.M.; et al. Prognostic Stratification of Diffuse Large B-Cell Lymphoma Using Clinico-Genomic Models: Validation and Improvement of the LymForest-25 Model. HemaSphere 2022, 6, e706. [Google Scholar] [CrossRef]
- Mosquera Orgueira, A.; Díaz Arías, J.Á.; Serrano Martín, R.; Portela Piñeiro, V.; Cid López, M.; Peleteiro Raíndo, A.; Bao Pérez, L.; González Pérez, M.S.; Pérez Encinas, M.M.; Fraga Rodríguez, M.F.; et al. A Prognostic Model Based on Gene Expression Parameters Predicts a Better Response to Bortezomib-Containing Immunochemotherapy in Diffuse Large B-Cell Lymphoma. Front. Oncol. 2023, 13, 1157646. [Google Scholar] [CrossRef]
- Goedhart, J.M.; Klausch, T.; Janssen, J.; van de Wiel, M.A. Adaptive Use of Co-Data Through Empirical Bayes for Bayesian Additive Regression Trees. Stat. Med. 2025, 44, e70004. [Google Scholar] [CrossRef]
- Ouyang, W.; Lai, Z.; Huang, H.; Ling, L. Machine Learning-Based Identification of Cuproptosis-Related lncRNA Biomarkers in Diffuse Large B-Cell Lymphoma. Cell Biol. Toxicol. 2025, 41, 72. [Google Scholar] [CrossRef]
- Liu, R.; Rizzo, S.; Wang, L.; Chaudhary, N.; Maund, S.; Garmhausen, M.R.; McGough, S.; Copping, R.; Zou, J. Characterizing Mutation-Treatment Effects Using Clinico-Genomics Data of 78,287 Patients with 20 Types of Cancers. Nat. Commun. 2024, 15, 10884. [Google Scholar] [CrossRef]
- Eckardt, J.-N.; Röllig, C.; Metzeler, K.; Kramer, M.; Stasik, S.; Georgi, J.-A.; Heisig, P.; Spiekermann, K.; Krug, U.; Braess, J.; et al. Prediction of Complete Remission and Survival in Acute Myeloid Leukemia Using Supervised Machine Learning. Haematologica 2022, 108, 690–704. [Google Scholar] [CrossRef]
- Ilyas, M.; Ramzan, M.; Deriche, M.; Mahmood, K.; Naz, A. An Efficient Leukemia Prediction Method Using Machine Learning and Deep Learning with Selected Features. PLoS ONE 2025, 20, e0320669. [Google Scholar] [CrossRef] [PubMed]
- Zhang, W.; Zhu, Y.; Liu, H.; Zhang, Y.; Liu, H.; Adegboro, A.A.; Dang, R.; Dai, L.; Wanggou, S.; Li, X. Pan-Cancer Evaluation of Regulated Cell Death to Predict Overall Survival and Immune Checkpoint Inhibitor Response. Npj Precis. Oncol. 2024, 8, 77. [Google Scholar] [CrossRef] [PubMed]


Disclaimer/Publisher’s Note: The statements, opinions and data contained in all publications are solely those of the individual author(s) and contributor(s) and not of MDPI and/or the editor(s). MDPI and/or the editor(s) disclaim responsibility for any injury to people or property resulting from any ideas, methods, instructions or products referred to in the content. |
© 2025 by the authors. Licensee MDPI, Basel, Switzerland. This article is an open access article distributed under the terms and conditions of the Creative Commons Attribution (CC BY) license (https://creativecommons.org/licenses/by/4.0/).