
Sonographic Evaluation of Peripheral Nerves and Cervical Nerve Roots in Amyotrophic Lateral Sclerosis: A Systematic Review and Meta-Analysis

 ,
, 
Abstract
1. Introduction
2. Methodology
2.1. Materials and Methods
2.2. Search Strategy
2.3. Eligibility Criteria
- (1)
- Research articles published in international peer-reviewed journals.
- (2)
- Studies that assessed nerve cross-sectional area (CSA) or diameter using ultrasound in individuals with ALS.
- (3)
- Studies providing numerical data for nerve measurements, detailed as the mean and standard deviation (SD) for each group (ALS or control), separately.
- (4)
- Other studies lacking the required numerical data were incorporated solely in the systematic review.
- (1)
- Studies that did not utilize ultrasound for measuring nerve CSA or diameter.
- (2)
- Studies that failed to present the results of ultrasound measurements.
- (3)
- Other study designs, e.g., literature review, case studies, case series.
2.4. Extraction
2.5. Quality Assessment
2.6. Statistical Analysis
3. Results
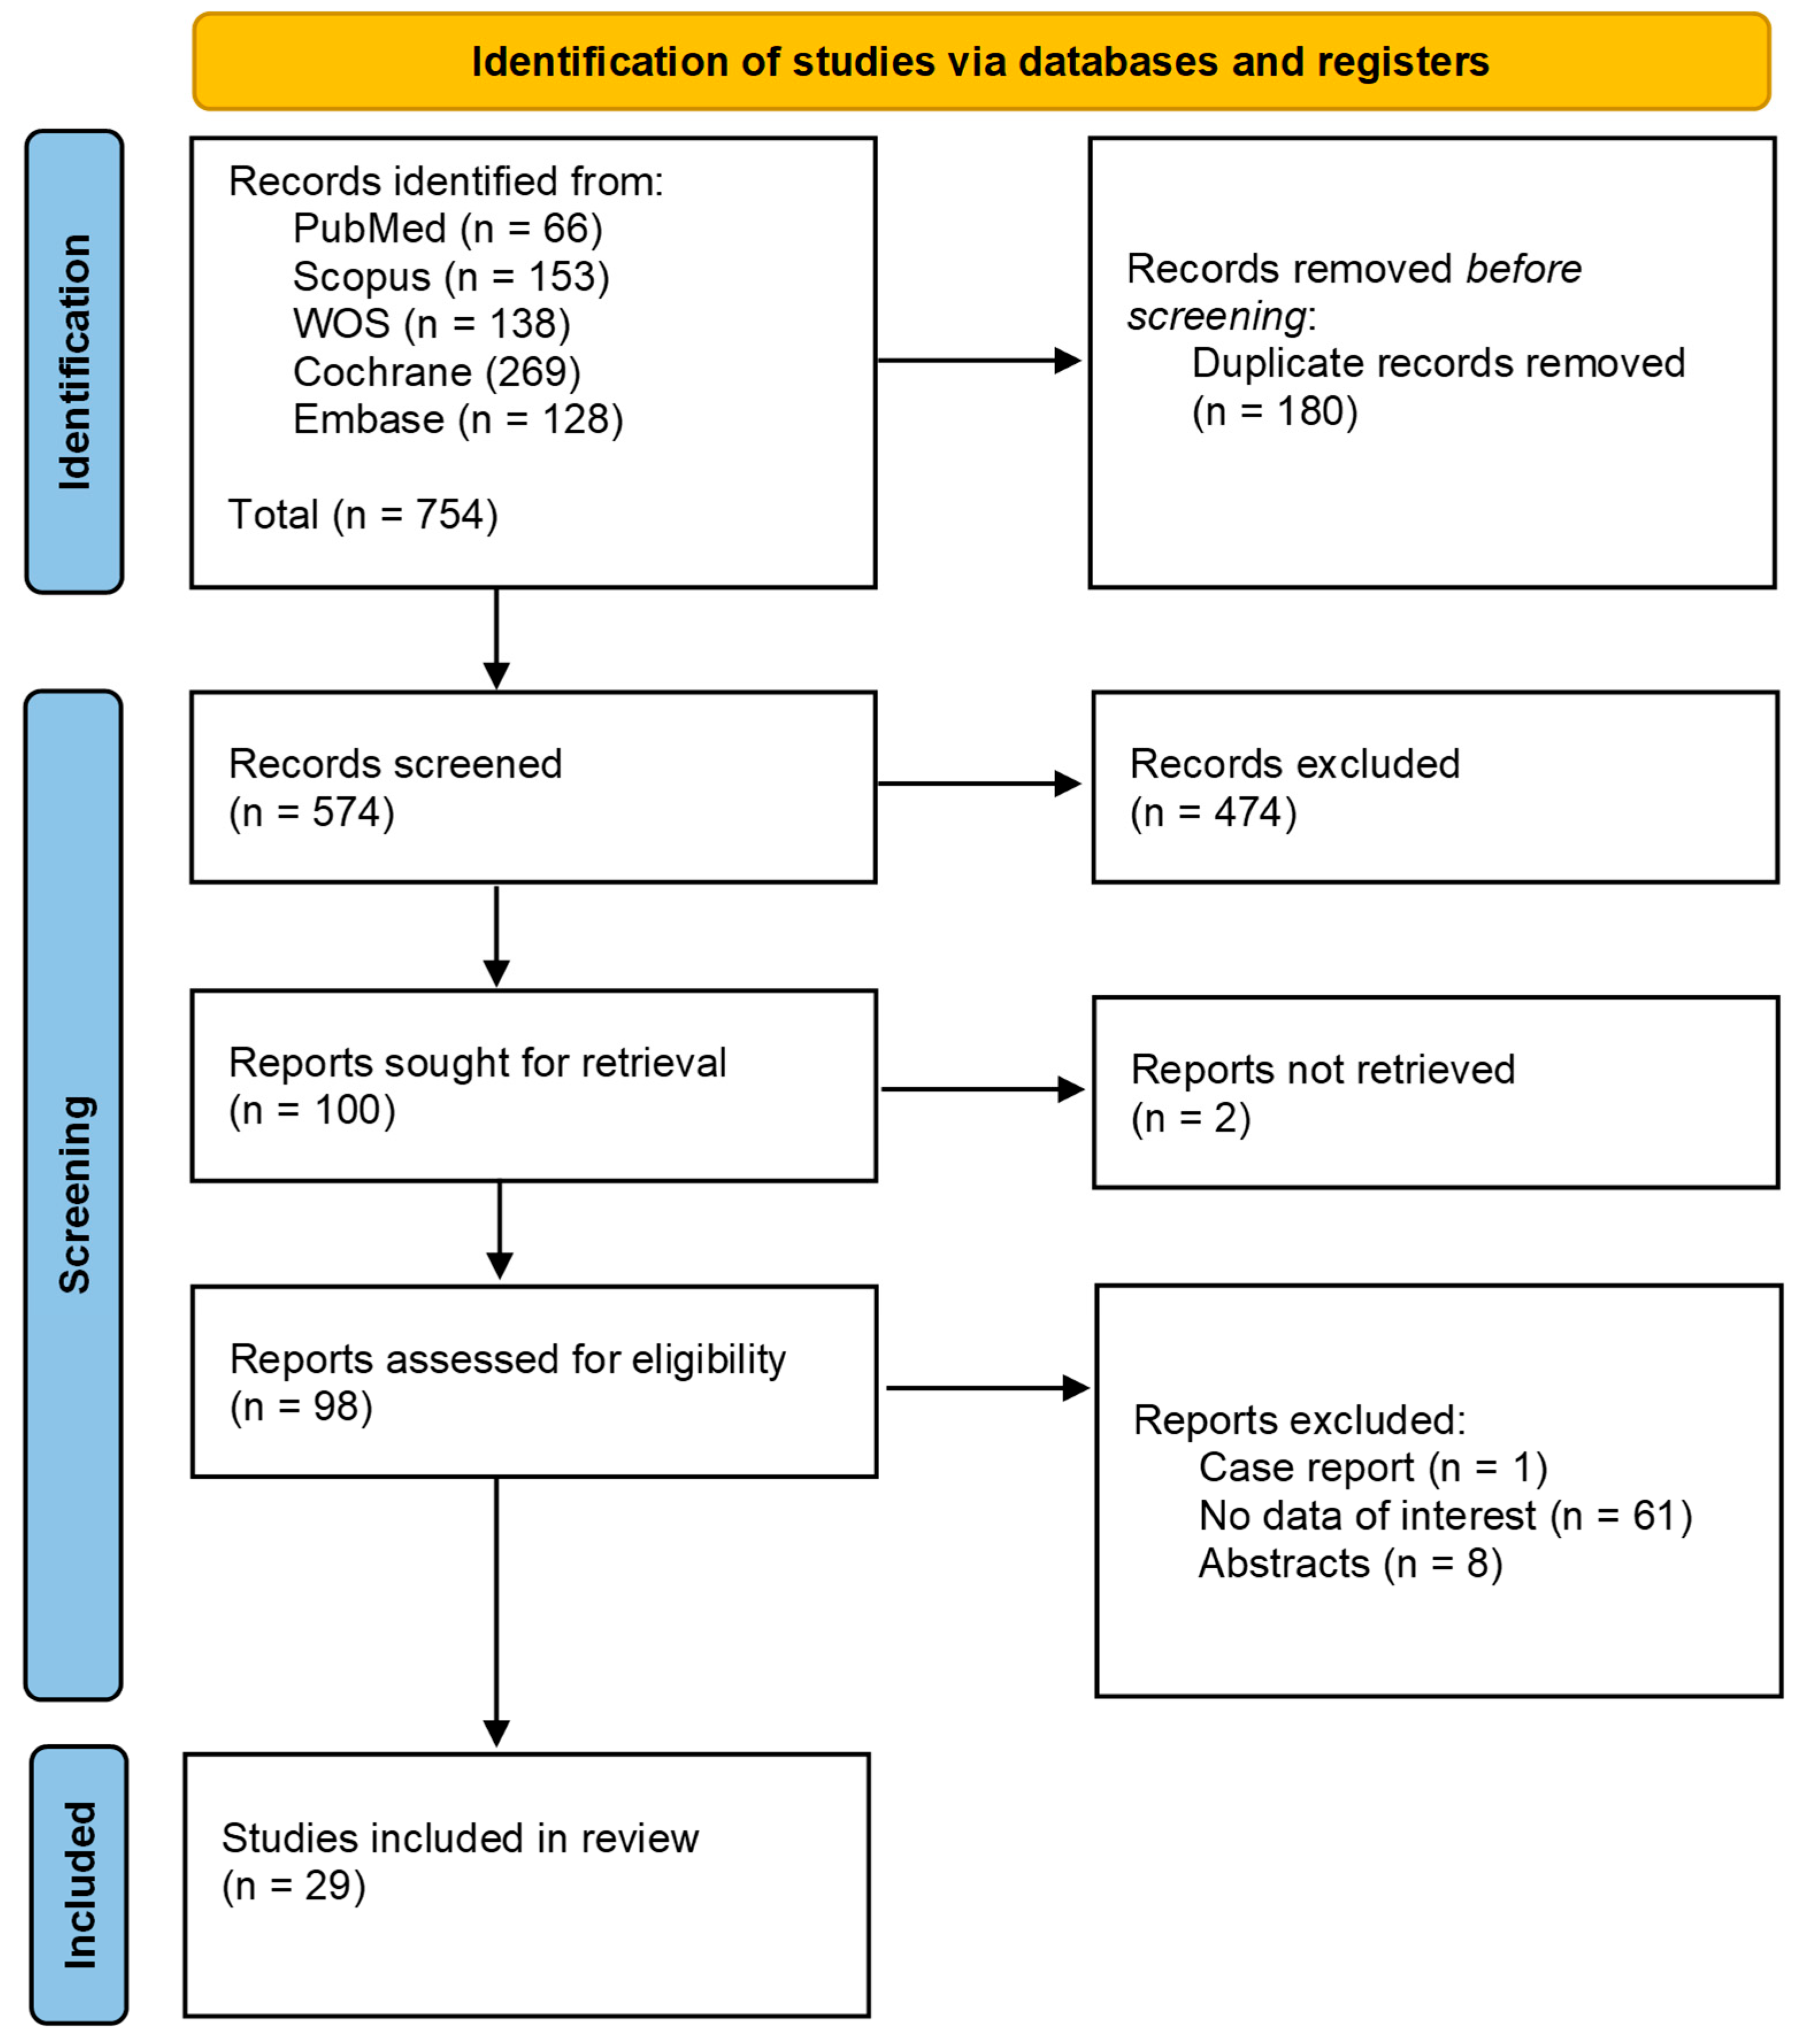
3.1. Search Results
3.2. Summary Characteristics
3.3. Meta-Analysis
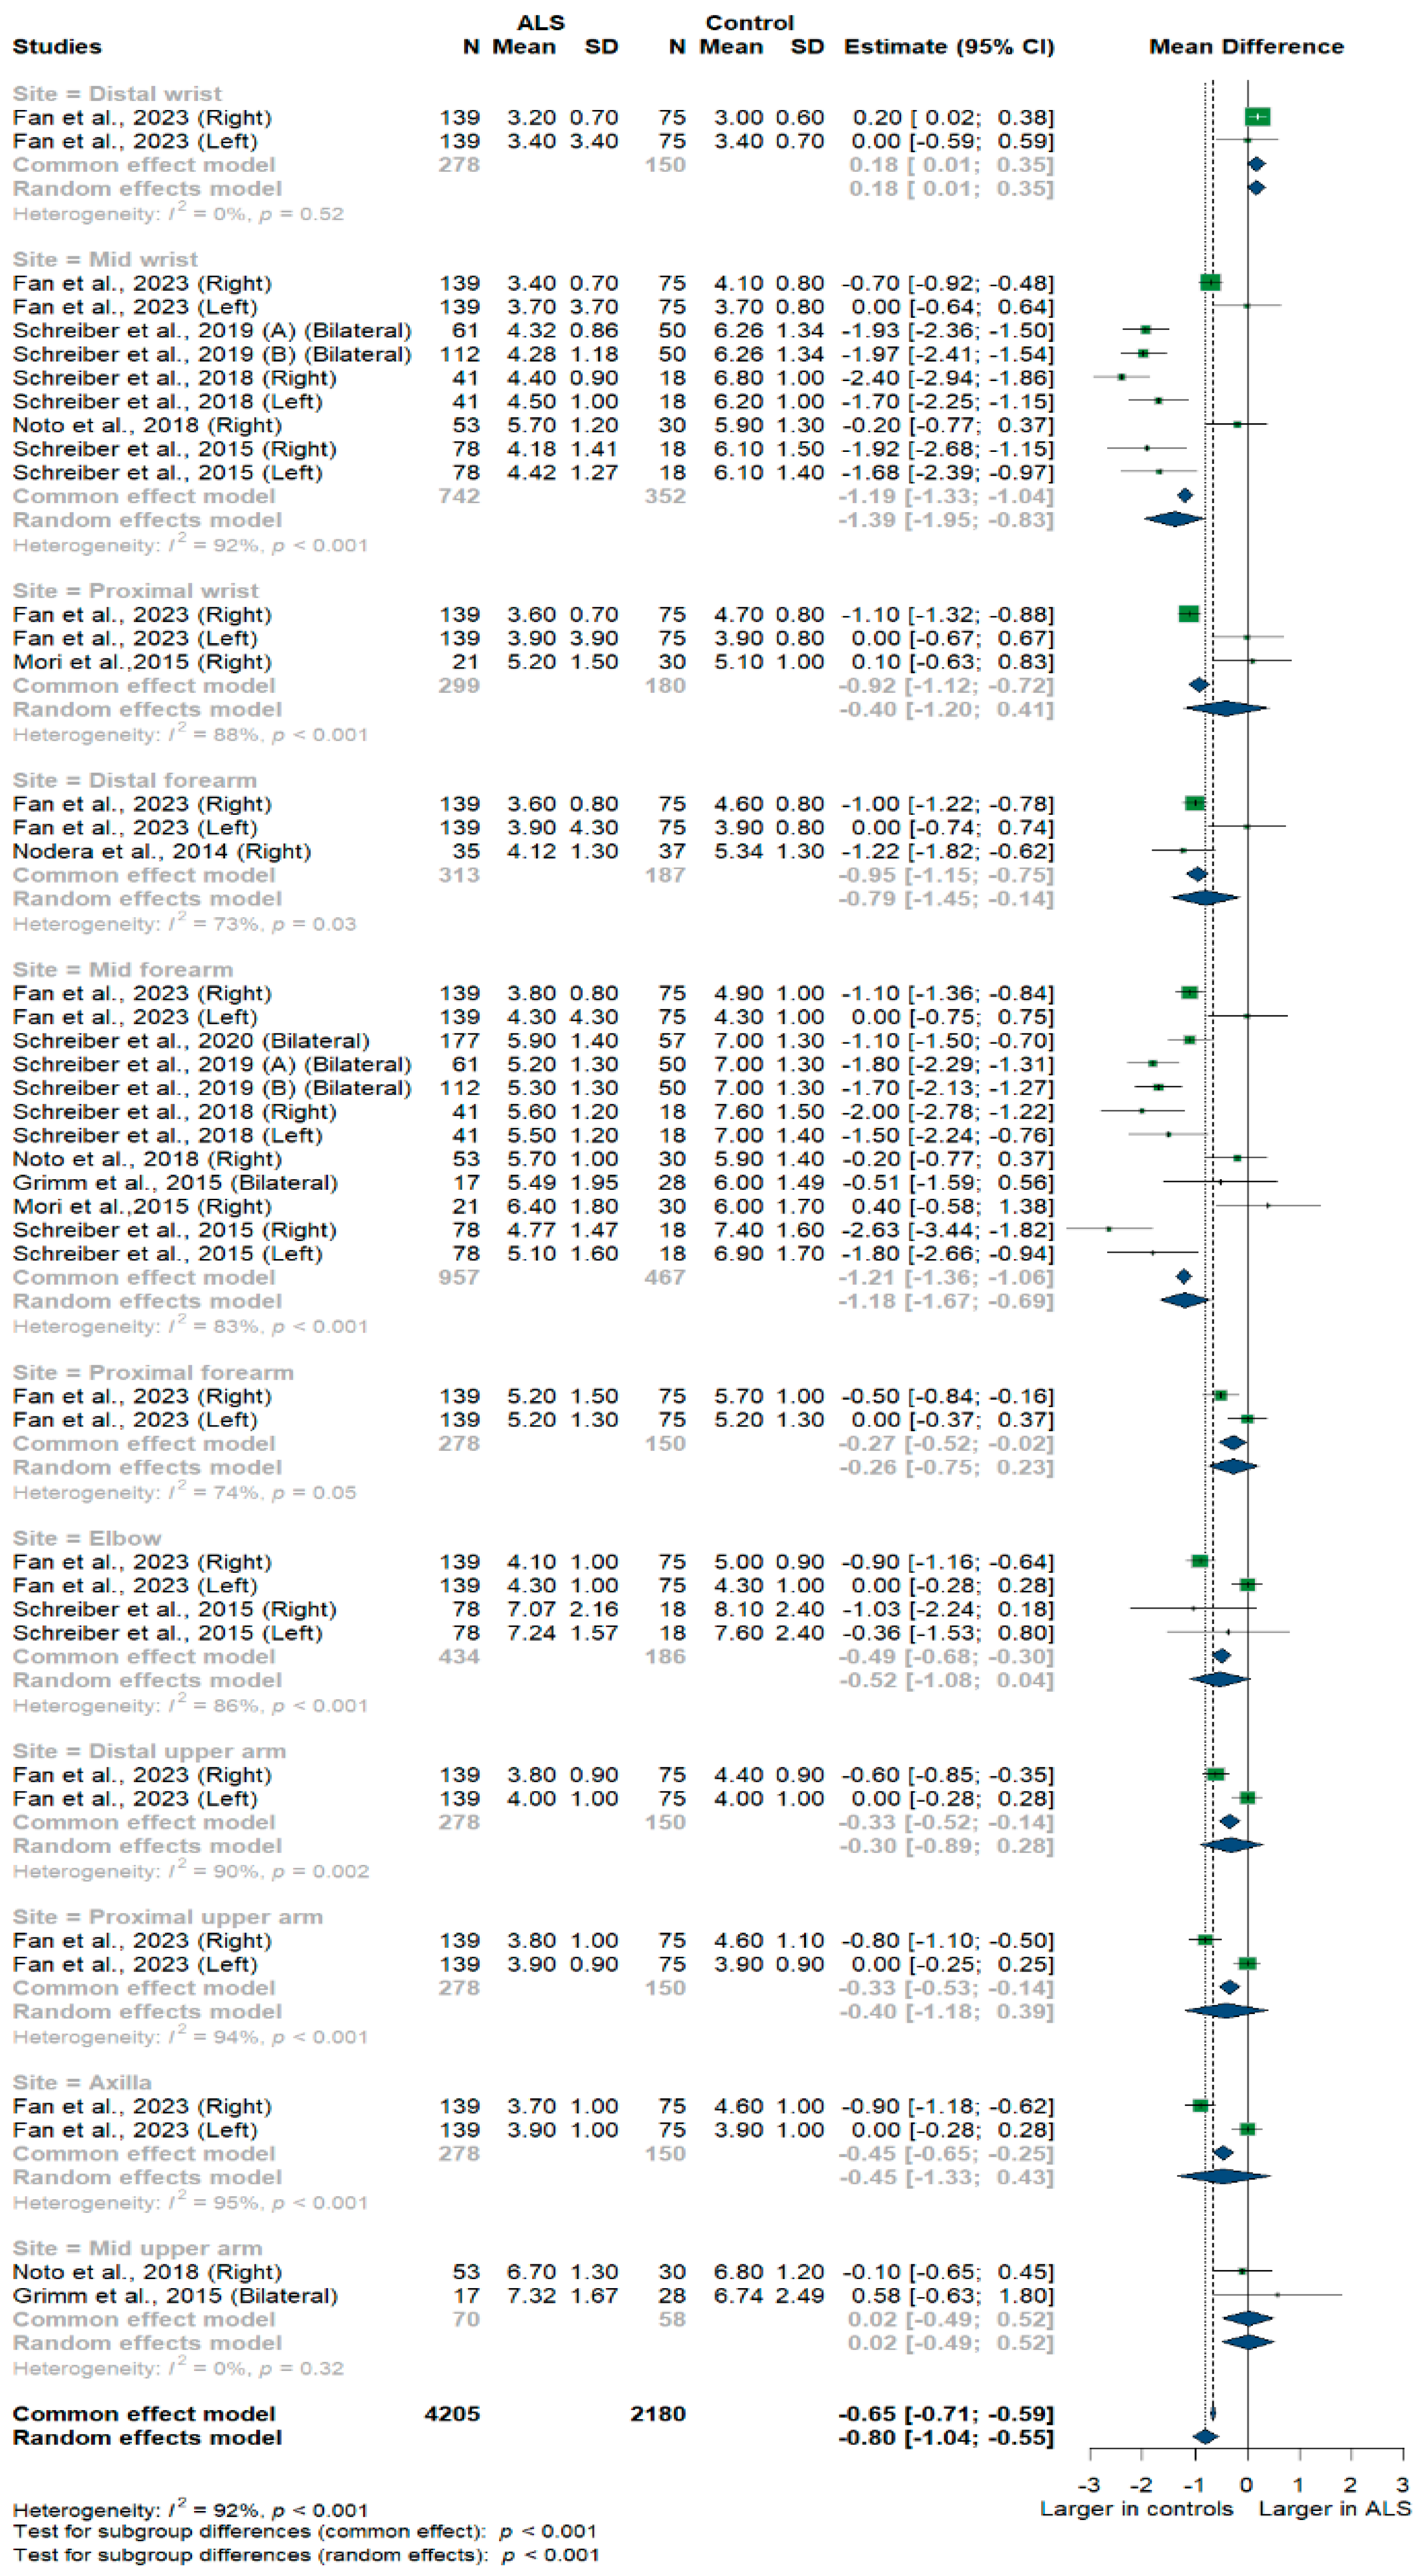
3.3.1. Ulnar Nerve
3.3.2. Median Nerve
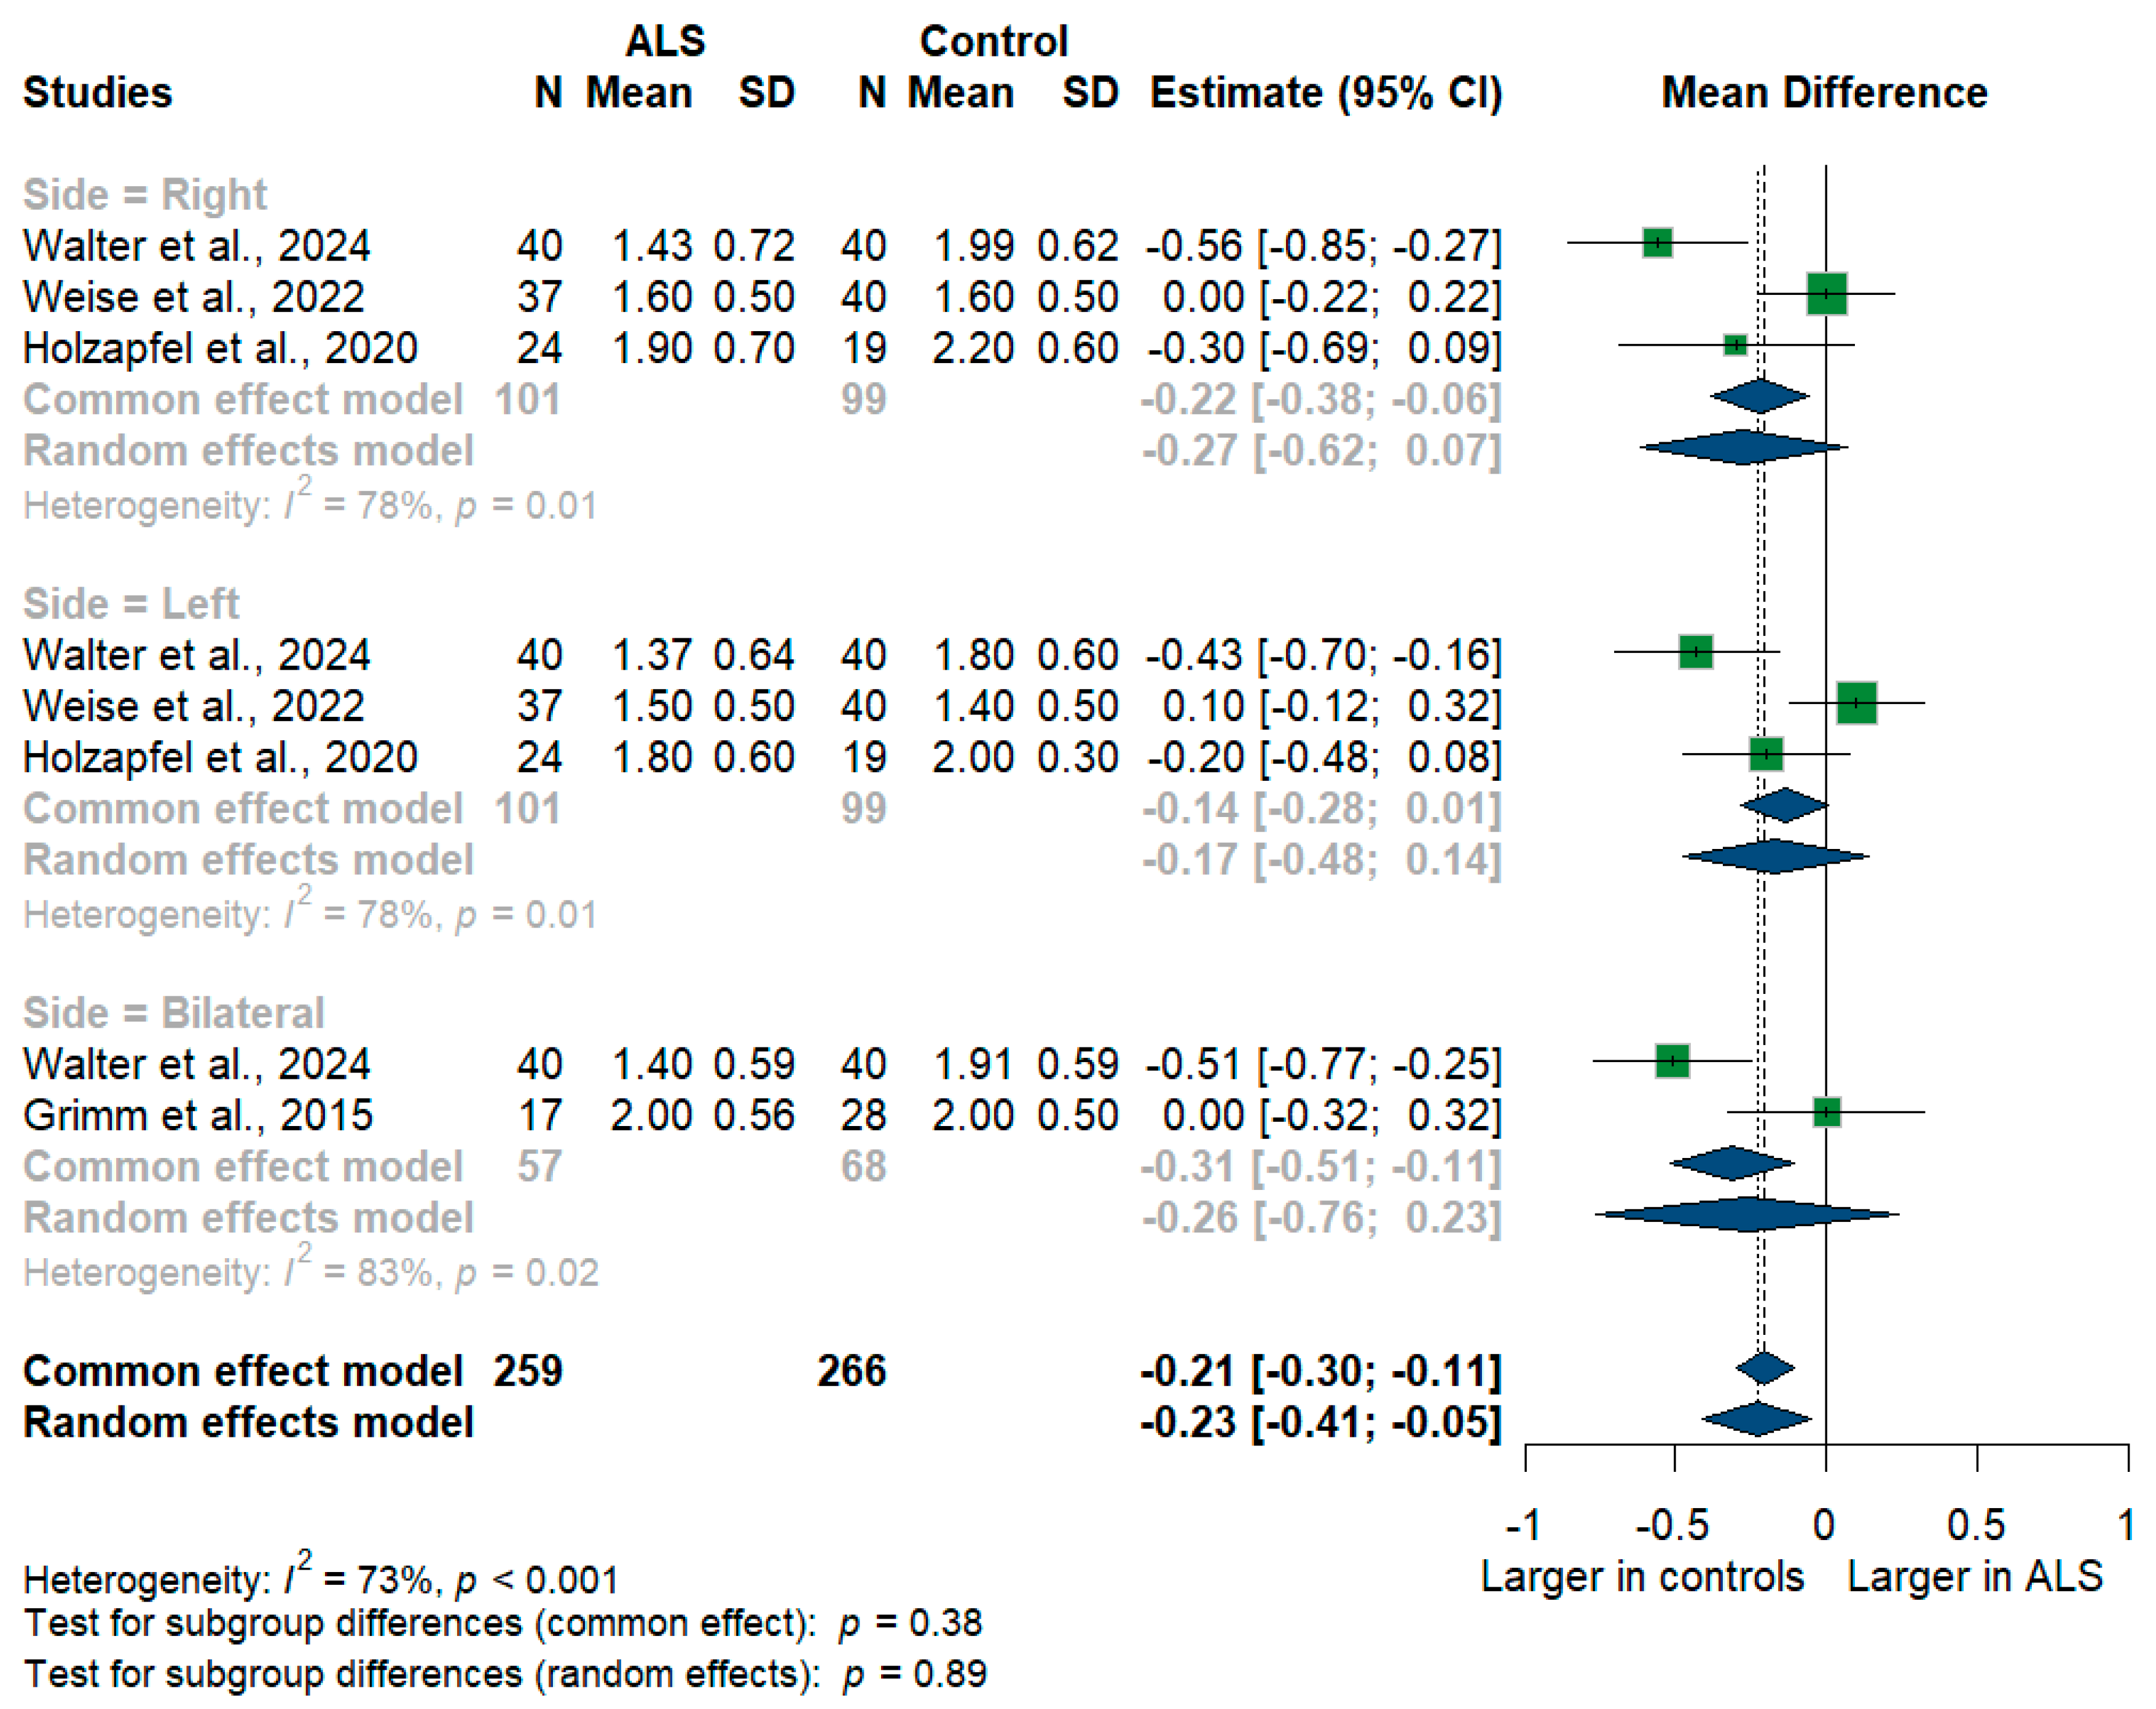
3.3.3. Vagus Nerve
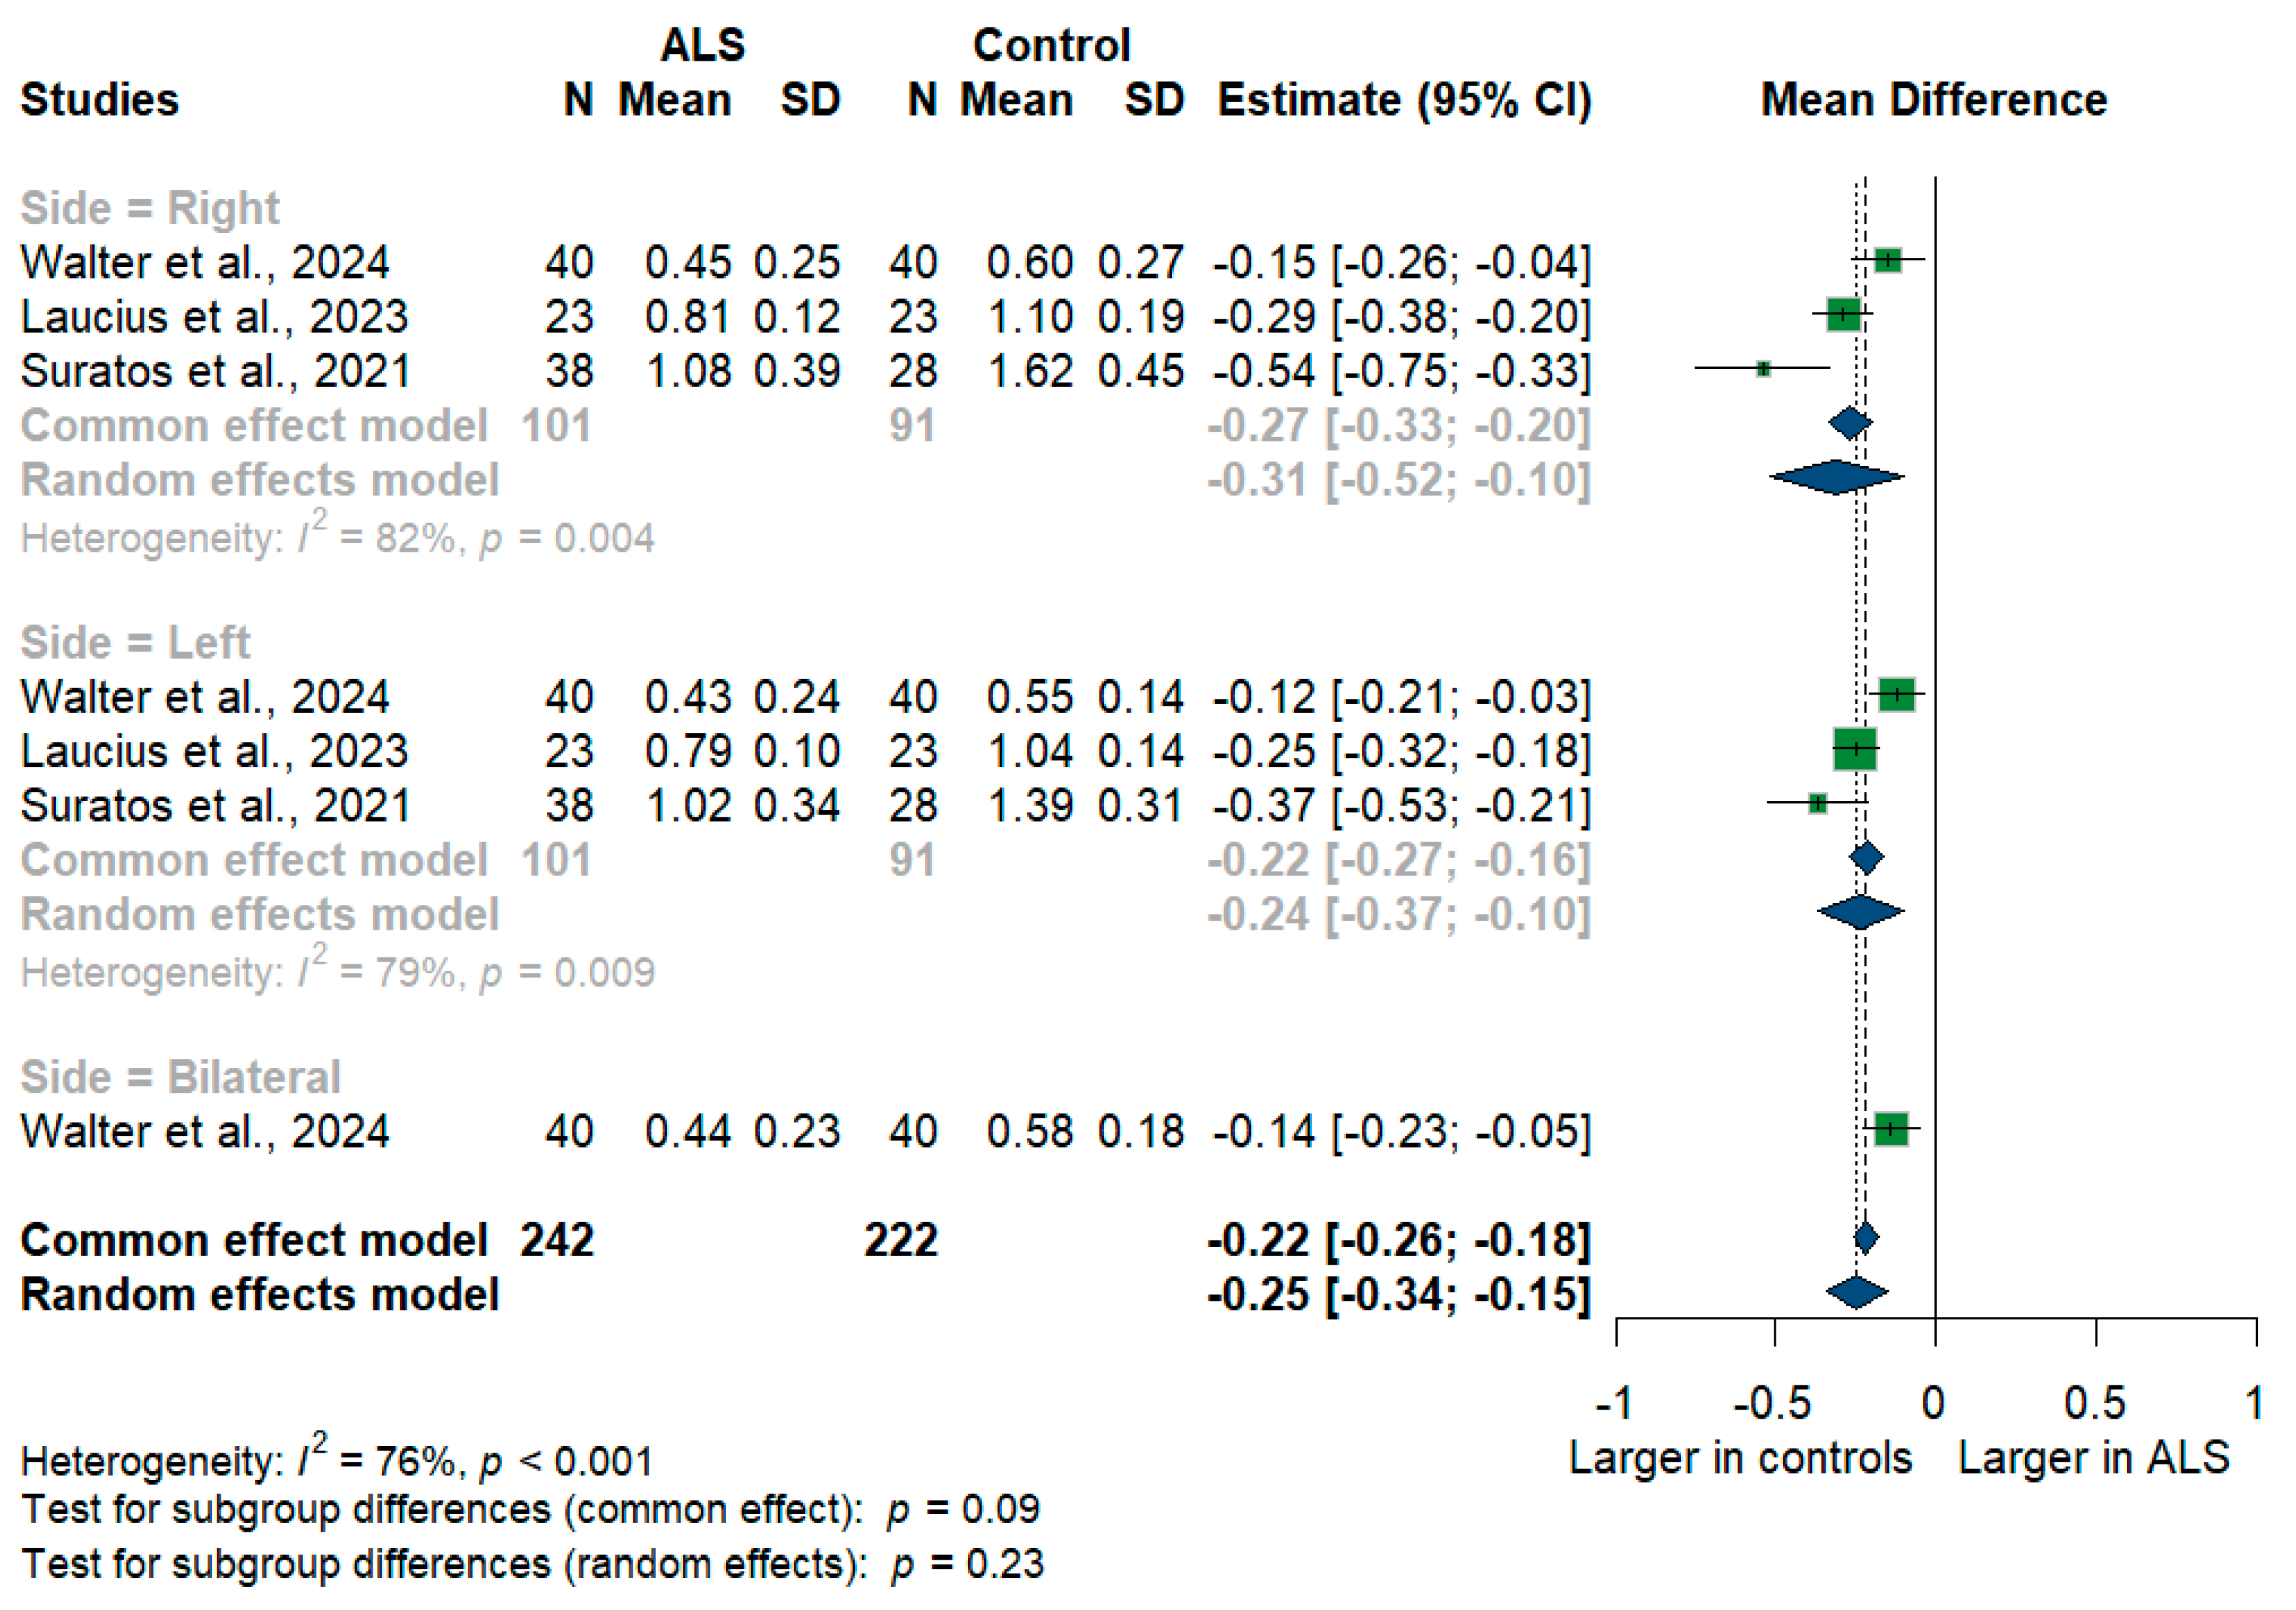
3.3.4. Phrenic Nerve
3.3.5. C5 Root
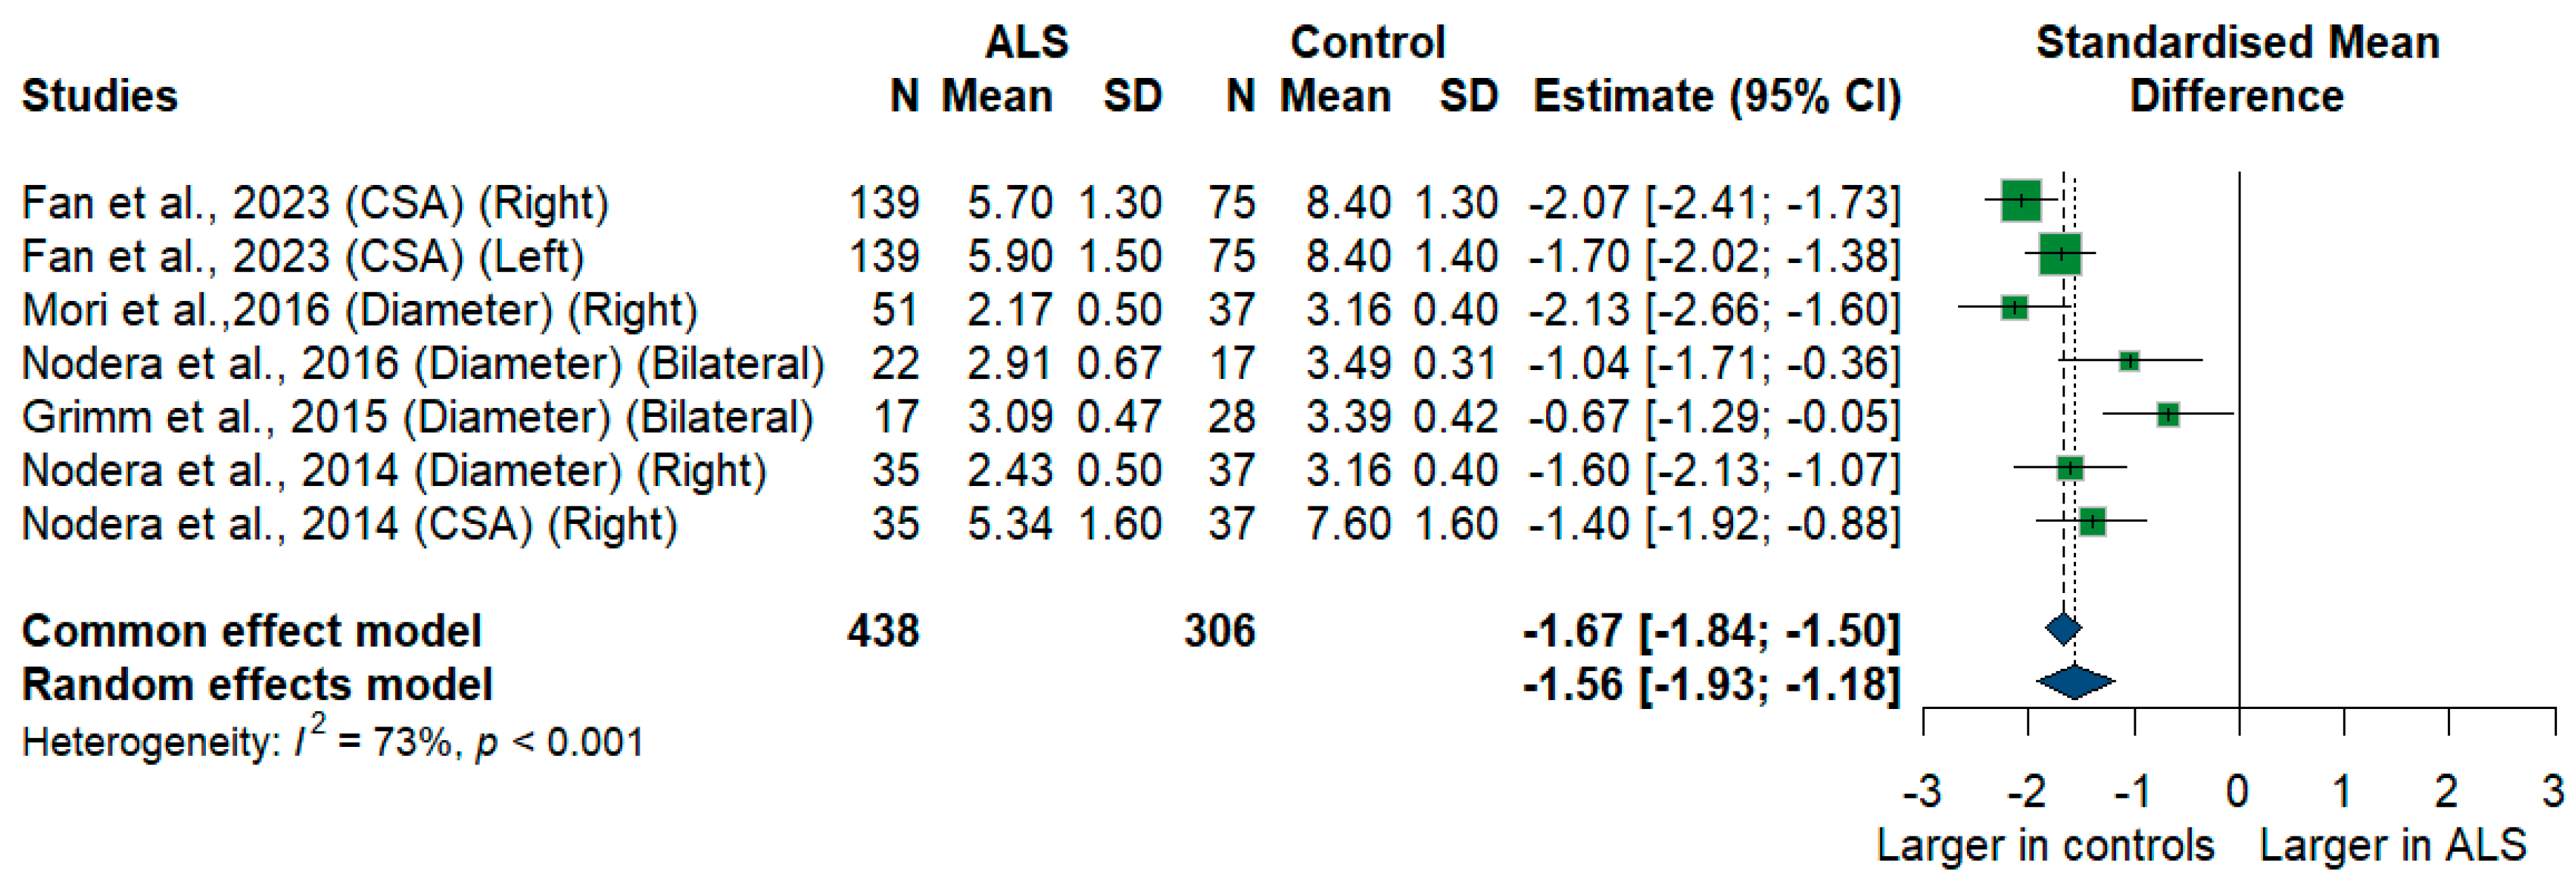
3.3.6. C6 Root
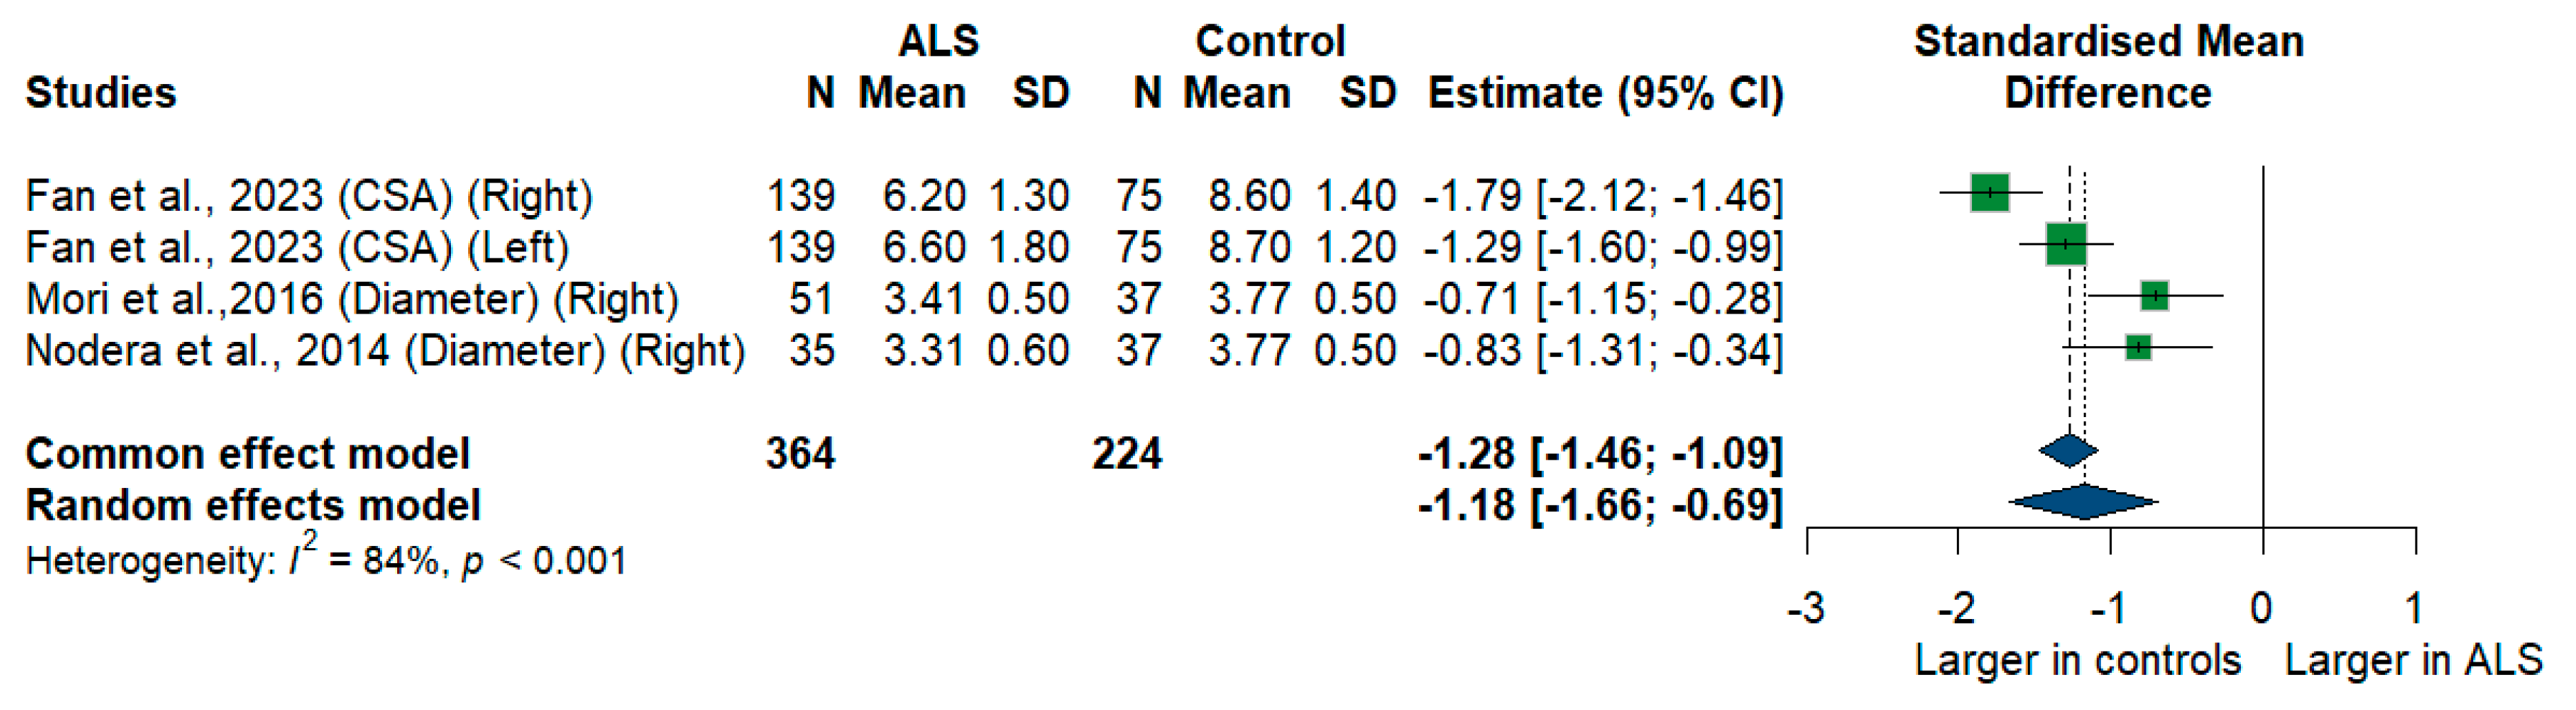
3.3.7. C7 Root
3.3.8. C8 Nerve Root
3.3.9. Accessory Nerve
3.3.10. Sciatic Nerve
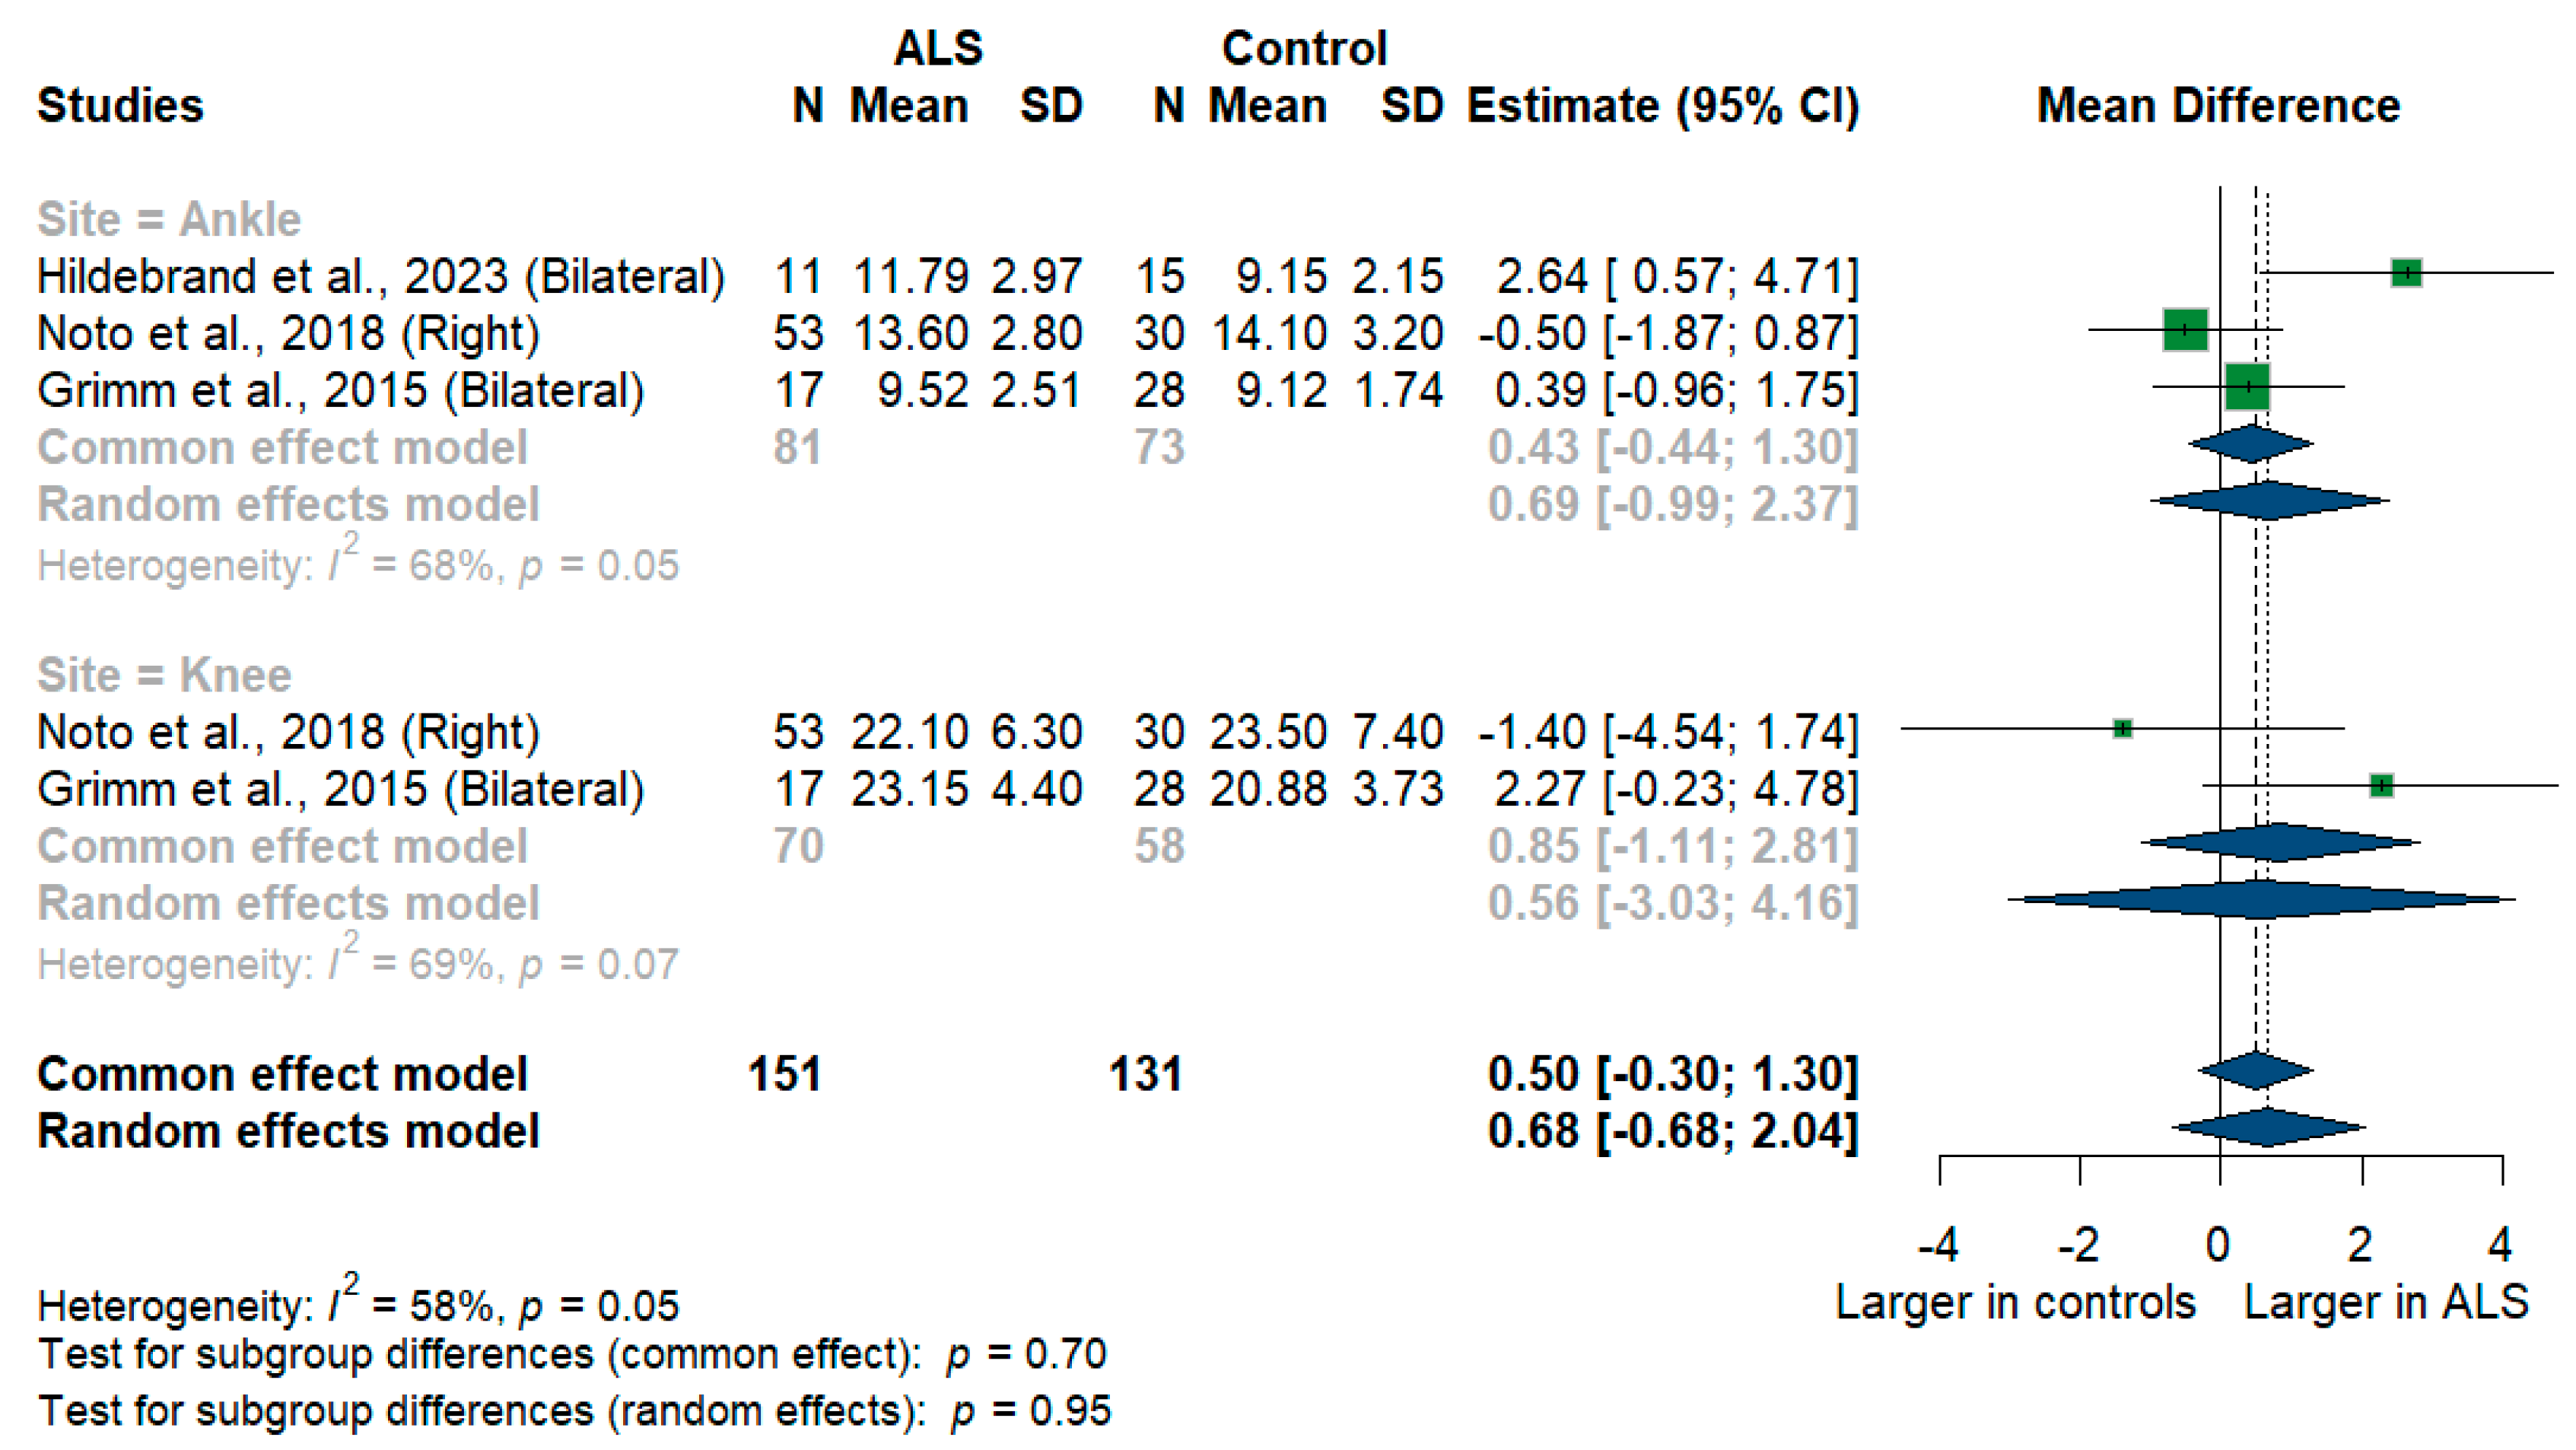
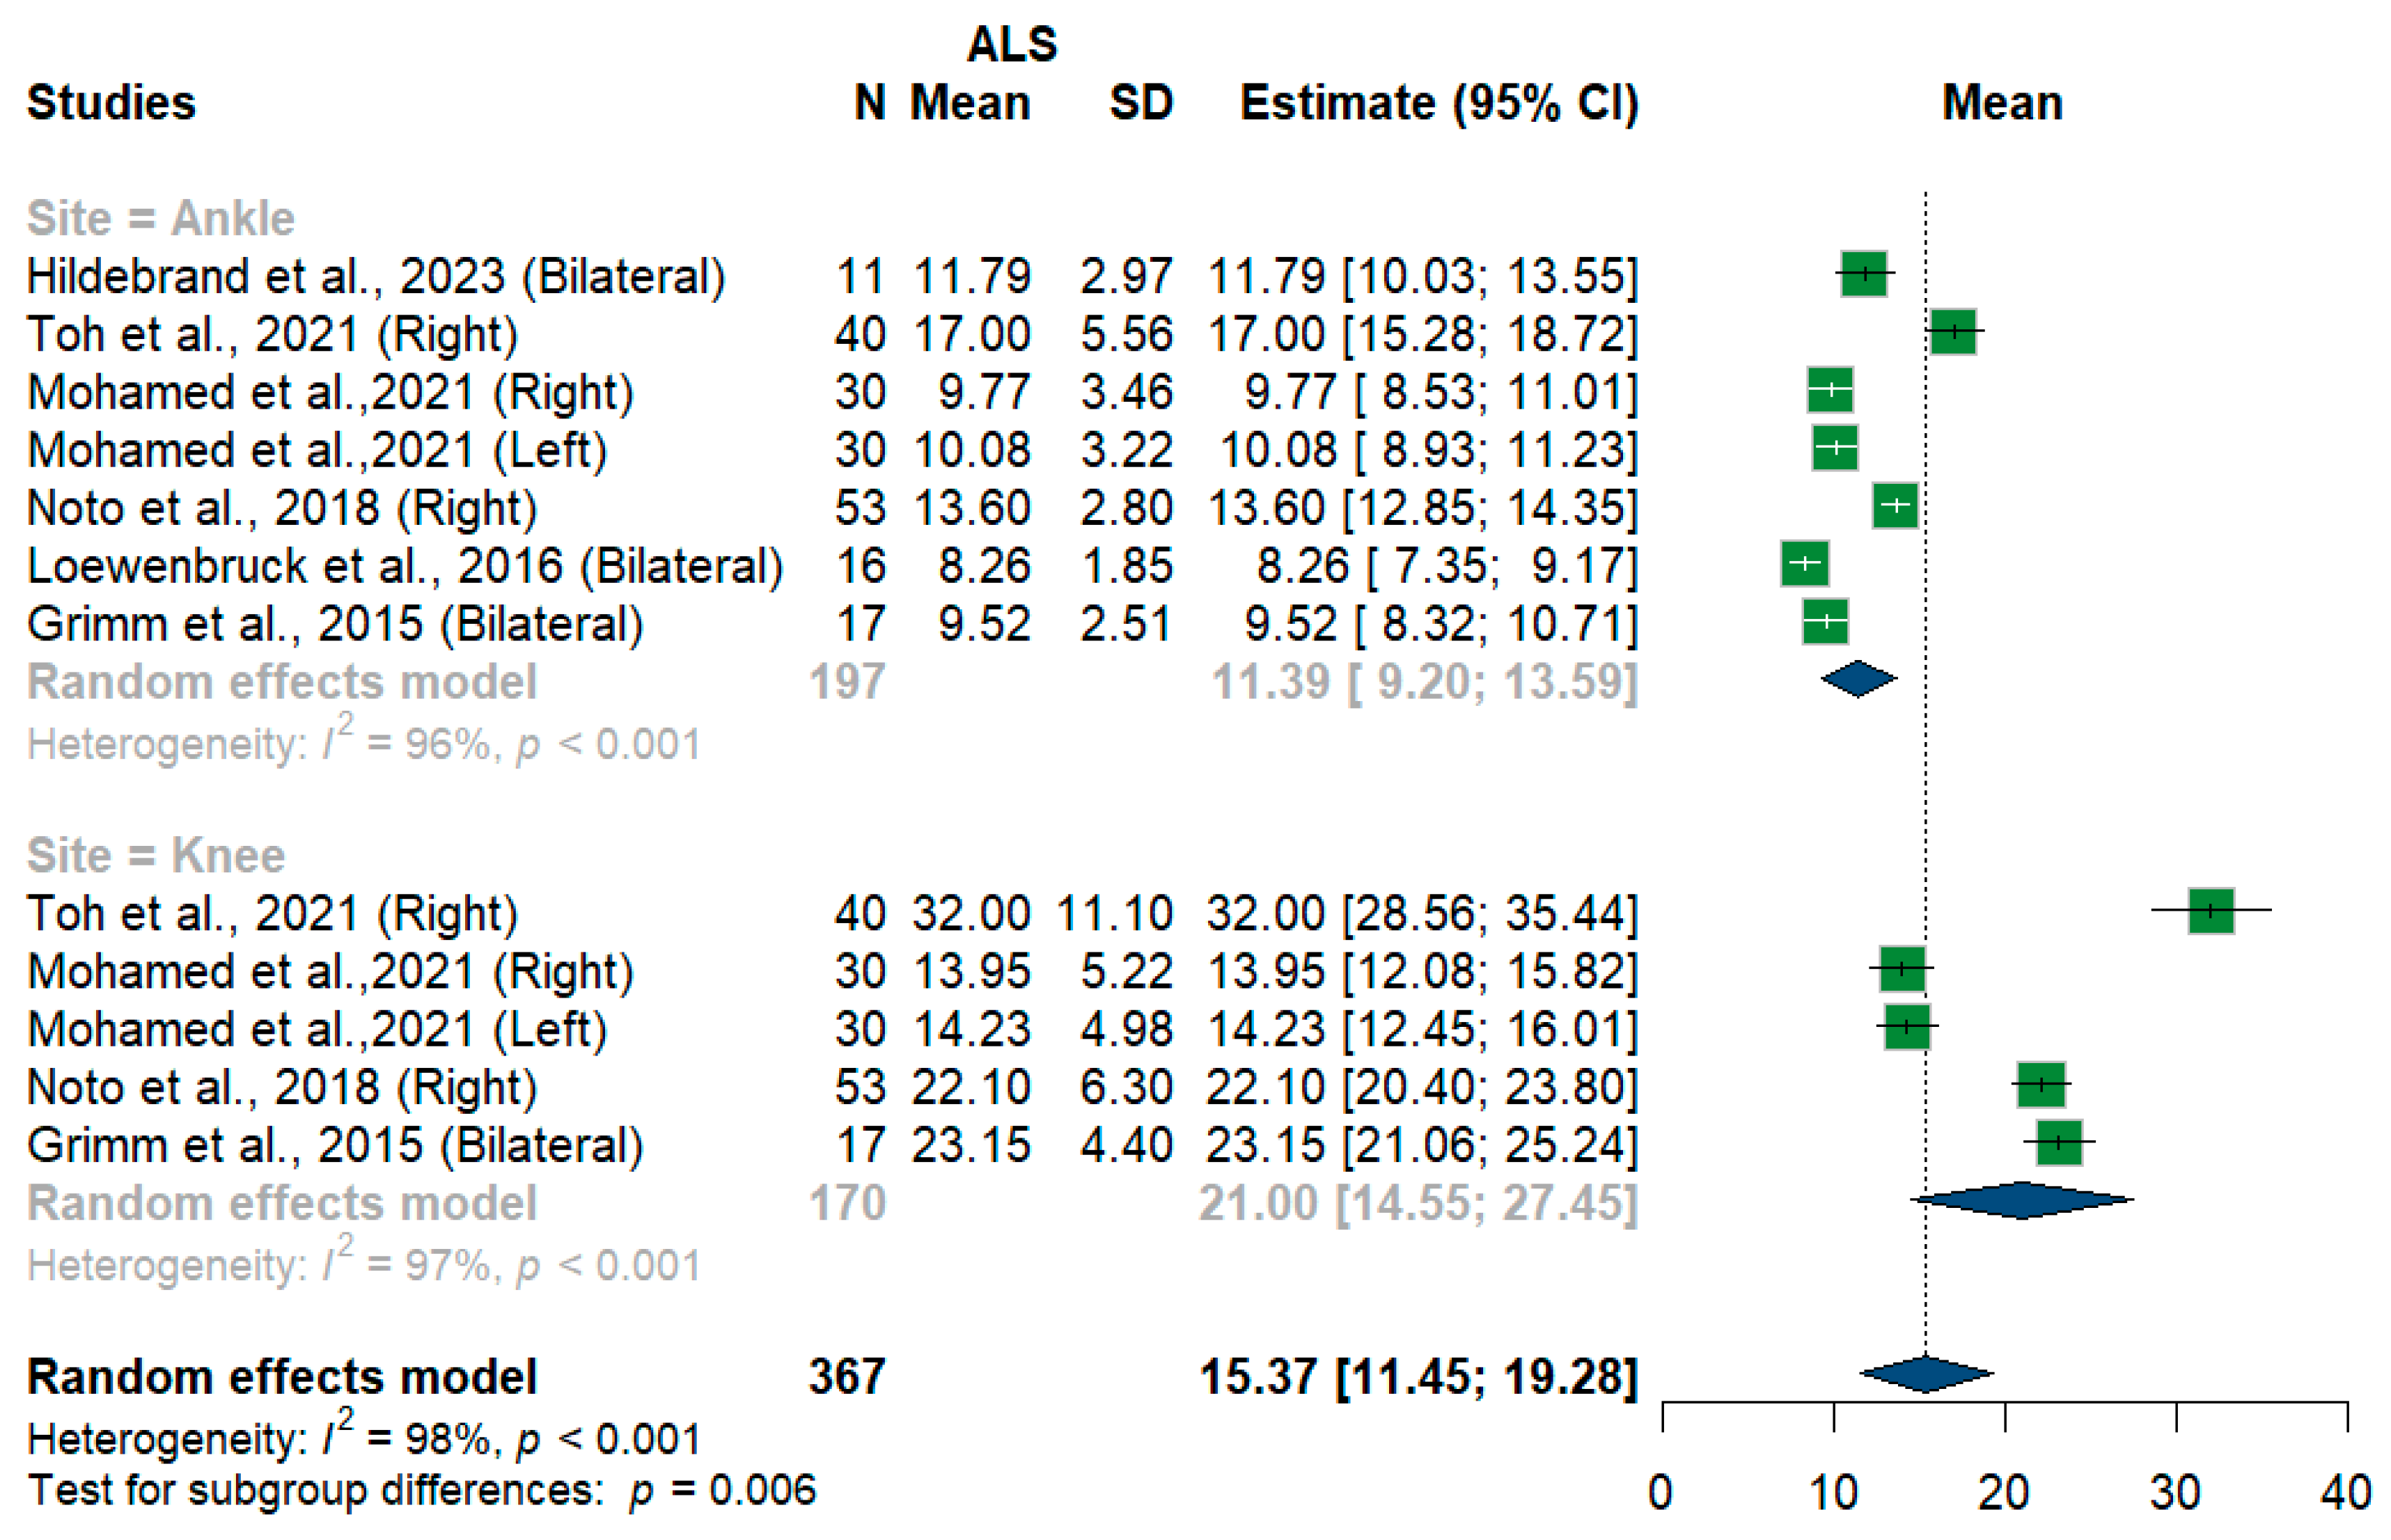
3.3.11. Tibial Nerve
3.3.12. Fibular Nerve
3.3.13. Sural Nerve
3.3.14. Radial Nerve
3.4. Leave-One-Out Meta-Analysis
3.5. Publication Bias
3.6. ROC
3.7. Quality Assessment
4. Discussion
Limitations
5. Conclusions
Supplementary Materials
Author Contributions
Funding
Institutional Review Board Statement
Informed Consent Statement
Data Availability Statement
Conflicts of Interest
References
- Walling, A.D. Amyotrophic Lateral Sclerosis: Lou Gehrig’s Disease. Am. Fam. Physician 1999, 59, 1489–1496. [Google Scholar] [PubMed]
- Zakharova, M.N.; Abramova, A.A. Lower and upper motor neuron involvement and their impact on disease prognosis in amyotrophic lateral sclerosis. Neural Regen. Res. 2022, 17, 65. [Google Scholar] [CrossRef] [PubMed]
- Gladman, M.; Zinman, L. The economic impact of amyotrophic lateral sclerosis: A systematic review. Expert. Rev. Pharmacoecon Outcomes Res. 2015, 15, 439–450. [Google Scholar] [CrossRef]
- van den Bos, M.A.J.; Geevasinga, N.; Higashihara, M.; Menon, P.; Vucic, S. Pathophysiology and Diagnosis of ALS: Insights from Advances in Neurophysiological Techniques. Int. J. Mol. Sci. 2019, 20, 2818. [Google Scholar] [CrossRef]
- Dubbioso, R.; Provitera, V.; Pacella, D.; Santoro, L.; Manganelli, F.; Nolano, M. Autonomic dysfunction is associated with disease progression and survival in amyotrophic lateral sclerosis: A prospective longitudinal cohort study. J. Neurol. 2023, 270, 4968–4977. [Google Scholar] [CrossRef] [PubMed]
- Kramer, M.; Grimm, A.; Winter, N.; Dörner, M.; Grundmann-Hauser, K.; Stahl, J.H.; Wittlinger, J.; Kegele, J.; Kronlage, C.; Willikens, S. Nerve Ultrasound as Helpful Tool in Polyneuropathies. Diagnostics 2021, 11, 211. [Google Scholar] [CrossRef]
- Richards, D.; Morren, J.A.; Pioro, E.P. Time to diagnosis and factors affecting diagnostic delay in amyotrophic lateral sclerosis. J. Neurol. Sci. 2020, 417, 117054. [Google Scholar] [CrossRef]
- Matharan, M.; Mathis, S.; Bonabaud, S.; Carla, L.; Soulages, A.; Le Masson, G. Minimizing the Diagnostic Delay in Amyotrophic Lateral Sclerosis: The Role of Nonneurologist Practitioners. Neurol. Res. Int. 2020, 2020, 1473981. [Google Scholar] [CrossRef]
- Hannaford, A.; Vucic, S.; Kiernan, M.C.; Simon, N.G. Review Article “Spotlight on Ultrasonography in the Diagnosis of Peripheral Nerve Disease: The Evidence to Date”. Int. J. Gen. Med. 2021, 14, 4579. [Google Scholar] [CrossRef]
- Abdelnaby, R.; Elgenidy, A.; Sonbol, Y.T.; Dardeer, K.T.; Ebrahim, M.A.; Maallem, I.; Youssef, M.W.; Moawad, M.H.E.D.; Hassan, Y.G.; Rabie, S.A.; et al. Nerve Sonography in Charcot-Marie-Tooth Disease: A Systematic Review and Meta-analysis of 6061 Measured Nerves. Ultrasound Med. Biol. 2022, 48, 1397–1409. [Google Scholar] [CrossRef]
- Page, M.J.; McKenzie, J.E.; Bossuyt, P.M.; Boutron, I.; Hoffmann, T.C.; Mulrow, C.D.; Shamseer, L.; Tetzlaff, J.M.; Akl, E.A.; Brennan, S.E.; et al. The PRISMA 2020 statement: An updated guideline for reporting systematic reviews. BMJ 2021, 2021, 372. [Google Scholar] [CrossRef]
- The EndNote Team. Preprint at Clarivate; EndNote: Philadelphia, PA, USA, 2013. [Google Scholar]
- National Institutes of Health. Quality Assessment Tool for Observational Cohort and Cross-Sectional Studies. 2014. Available online: https://www.nhlbi.nih.gov/health-pro/guidelines/in-develop/cardiovascular-risk-reduction/tools/cohort (accessed on 11 November 2024).
- Wells, G.A.; Shea, B.; O’Connell, D.; Peterson, J.; Welch, V.; Losos, M.; Tugwell, P. The Newcastle-Ottawa Scale (NOS) for Assessing the Quality of Nonrandomised Studies in Meta-Analyses. 2014. Available online: https://www.ohri.ca/programs/clinical_epidemiology/oxford.asp (accessed on 11 November 2024).
- R: The R Project for Statistical Computing. Available online: https://www.r-project.org/ (accessed on 11 November 2024).
- Schwarzer, G.; Carpenter, J.R.; Rücker, G. Meta-Analysis with R; Springer: Berlin/Heidelberg, Germany, 2015. [Google Scholar] [CrossRef]
- Wan, X.; Wang, W.; Liu, J.; Tong, T. Estimating the sample mean and standard deviation from the sample size, median, range and/or interquartile range. BMC Med. Res. Methodol. 2014, 14, 135. [Google Scholar] [CrossRef]
- Luo, D.; Wan, X.; Liu, J.; Tong, T. Optimally estimating the sample mean from the sample size, median, mid-range, and/or mid-quartile range. Stat. Methods Med. Res. 2018, 27, 1785–1805. [Google Scholar] [CrossRef]
- CombineMeanSD. Available online: https://www.statstodo.com/CombineMeansSDs.php (accessed on 11 November 2024).
- Assessing Risk of Bias Due to Missing Results in a Synthesis|Cochrane Training. Chapter 13. Available online: https://training.cochrane.org/handbook/current/chapter-13 (accessed on 11 November 2024).
- Watanabe, D.; Tsukamoto, H.; Abe, T.; Kitao, R.; Okuma, A.; Mihara, M.; Katsumoto, A.; Iwahashi, Y.; Higashiyama, Y.; Miyaji, Y.; et al. Ultrasonographic evaluation reveals thinning of cervical nerve roots and peripheral nerves in spinal and bulbar muscular atrophy. Neurol. Sci. 2022, 43, 4267–4274. [Google Scholar] [CrossRef] [PubMed]
- Grimm, A.; Décard, B.F.; Athanasopoulou, I.; Schweikert, K.; Sinnreich, M.; Axer, H. Nerve ultrasound for differentiation between amyotrophic lateral sclerosis and multifocal motor neuropathy. J. Neurol. 2015, 262, 870–880. [Google Scholar] [CrossRef] [PubMed]
- Cartwright, M.S.; Walker, F.O.; Griffin, L.P.; Caress, J.B. Peripheral nerve and muscle ultrasound in amyotrophic lateral sclerosis. Muscle Nerve 2011, 44, 346–351. [Google Scholar] [CrossRef]
- Fan, J.; Li, Y.; Niu, J.; Liu, J.; Guan, Y.; Cui, L.; Liu, M. The cross-sectional area of peripheral nerve in amyotrophic lateral sclerosis: A case-control study. Clin. Neurol. Neurosurg. 2023, 231, 107847. [Google Scholar] [CrossRef]
- Hildebrand, A.; Schreiber, F.; Weber, L.; Arndt, P.; Garz, C.; Petri, S.; Prudlo, J.; Meuth, S.G.; Waerzeggers, Y.; Henneicke, S.; et al. Peripheral Nerve Ultrasound for the Differentiation between ALS, Inflammatory, and Hereditary Polyneuropathies. Medicina 2023, 59, 1192. [Google Scholar] [CrossRef]
- Holzapfel, K.; Naumann, M. Ultrasound Detection of Vagus Nerve Atrophy in Bulbar Amyotrophic Lateral Sclerosis. J. Neuroimaging 2020, 30, 762–765. [Google Scholar] [CrossRef]
- Laucius, O.; Drūteika, J.; Balnytė, R.; Petrikonis, K.; Ališauskienė, M.; Vaitkus, A. Sonographic Phrenic Nerve Changes in Amyotrophic Lateral Sclerosis. Medicina 2023, 59, 1745. [Google Scholar] [CrossRef]
- Loewenbrück, K.F.; Liesenberg, J.; Dittrich, M.; Schäfer, J.; Patzner, B.; Trausch, B.; Machetanz, J.; Hermann, A.; Storch, A. Nerve ultrasound in the differentiation of multifocal motor neuropathy (MMN) and amyotrophic lateral sclerosis with predominant lower motor neuron disease (ALS/LMND). J. Neurol. 2016, 263, 35–44. [Google Scholar] [CrossRef] [PubMed]
- Martínez-Payá, J.J.; Ríos-Díaz, J.; del Baño-Aledo, M.E.; Hervás, D.; Tembl-Ferrairó, J.I.; Sevilla-Mantecón, T.; Vázquez-Costa, J.F. The cross-sectional area of the median nerve: An independent prognostic biomarker in amyotrophic lateral sclerosis. Neurologia 2022, 39, 564–572. [Google Scholar] [CrossRef]
- Mohamed, R.Z.A.; Salem, H.H.; Sakr, H.M.E.S.; Afifi, H.E.M.; Elsadek, A.M.; Fahmy, N.A. Role of neuro-sonography of peripheral nerves as a diagnostic and a differentiation tool of amyotrophic lateral sclerosis. Egypt. J. Neurol. Psychiatry Neurosurg. 2021, 57, 1–8. [Google Scholar] [CrossRef]
- Mori, A.; Nodera, H.; Takamatsu, N.; Maruyama-Saladini, K.; Osaki, Y.; Shimatani, Y.; Oda, M.; Izumi, Y.; Kaji, R. Sonographic evaluation of cervical nerve roots in ALS and its clinical subtypes. J. Med. Investig. 2016, 63, 54–57. [Google Scholar] [CrossRef] [PubMed]
- Mori, A.; Nodera, H.; Takamatsu, N.; Shimatani, Y.; Maruyama, K.; Oda, M.; Izumi, Y.; Kaji, R. Focal nerve enlargement is not the cause for increased distal motor latency in ALS: Sonographic evaluation. Clin. Neurophysiol. 2015, 126, 1632–1637. [Google Scholar] [CrossRef]
- Nodera, H.; Izumi, Y.; Takamatsu, N.; Kaji, R. Cervical root sonography to differentiate multifocal motor neuropathy from ALS. J. Med. Investig. 2016, 63, 2016. [Google Scholar] [CrossRef] [PubMed]
- Nodera, H.; Takamatsu, N.; Shimatani, Y.; Mori, A.; Sato, K.; Oda, M.; Terasawa, Y.; Izumi, Y.; Kaji, R. Thinning of cervical nerve roots and peripheral nerves in ALS as measured by sonography. Clin. Neurophysiol. 2014, 125, 1906–1911. [Google Scholar] [CrossRef]
- Noto, Y.I.; Garg, N.; Li, T.; Timmins, H.C.; Park, S.B.; Shibuya, K.; Shahrizaila, N.; Huynh, W.; Matamala, J.M.; Dharmadasa, T.; et al. Comparison of cross-sectional areas and distal-proximal nerve ratios in amyotrophic lateral sclerosis. Muscle Nerve 2018, 58, 777–783. [Google Scholar] [CrossRef]
- Ríos-Díaz, J.; del Baño-Aledo, M.E.; Tembl-Ferrairó, J.I.; Chumillas, M.J.; Vázquez-Costa, J.F.; Martínez-Payá, J.J. Quantitative neuromuscular ultrasound analysis as biomarkers in amyotrophic lateral sclerosis. Eur. Radiol. 2019, 29, 4266–4275. [Google Scholar] [CrossRef]
- Schreiber, F.; Garz, C.; Heinze, H.J.; Petri, S.; Vielhaber, S.; Schreiber, S. Textural markers of ultrasonographic nerve alterations in amyotrophic lateral sclerosis. Muscle Nerve 2020, 62, 601–610. [Google Scholar] [CrossRef]
- Schreiber, S.; Schreiber, F.; Garz, C.; Debska-Vielhaber, G.; Assmann, A.; Perosa, V.; Petri, S.; Dengler, R.; Nestor, P.; Vielhaber, S. Toward in vivo determination of peripheral nervous system immune activity in amyotrophic lateral sclerosis. Muscle Nerve 2019, 59, 567–576. [Google Scholar] [CrossRef] [PubMed]
- Schreiber, S.; Schreiber, F.; Debska-Vielhaber, G.; Garz, C.; Hensiek, N.; Machts, J.; Abdulla, S.; Dengler, R.; Petri, S.; Nestor, P.J.; et al. Differential involvement of forearm muscles in ALS does not relate to sonographic structural nerve alterations. Clin. Neurophysiol. 2018, 129, 1438–1443. [Google Scholar] [CrossRef]
- Schreiber, S.; Debska-Vielhaber, G.; Abdulla, S.; Machts, J.; Schreiber, F.; Kropf, S.; KÖrtvelyessy, P.; KÖrner, S.; Kollewe, K.; Petri, S.; et al. Peripheral nerve atrophy together with higher cerebrospinal fluid progranulin indicate axonal damage in amyotrophic lateral sclerosis. Muscle Nerve 2018, 57, 273–278. [Google Scholar] [CrossRef]
- Schreiber, S.; Abdulla, S.; Debska-Vielhaber, G.; Machts, J.; Dannhardt-Stieger, V.; Feistner, H.; Oldag, A.; Goertler, M.; Petri, S.; Kollewe, K.; et al. Peripheral nerve ultrasound in amyotrophic lateral sclerosis phenotypes. Muscle Nerve 2015, 51, 669–675. [Google Scholar] [CrossRef] [PubMed]
- Schreiber, S.; Dannhardt-Stieger, V.; Henkel, D.; Debska-Vielhaber, G.; Machts, J.; Abdulla, S.; Kropf, S.; Kollewe, K.; Petri, S.; Heinze, H.J.; et al. Quantifying disease progression in amyotrophic lateral sclerosis using peripheral nerve sonography. Muscle Nerve 2016, 54, 391–397. [Google Scholar] [CrossRef] [PubMed]
- Suratos, C.T.; Takamatsu, N.; Yamazaki, H.; Osaki, Y.; Fukumoto, T.; Nodera, H.; Izumi, Y. Utility of phrenic nerve ultrasound in amyotrophic lateral sclerosis. Acta Neurol. Belg. 2021, 121, 225–230. [Google Scholar] [CrossRef]
- Toh, T.H.; Abdul-Aziz, N.A.; Yahya, M.A.; Goh, K.J.; Loh, E.C.; Capelle, D.P.; Shahrizaila, N. A model incorporating ultrasound to predict the probability of fast disease progression in amyotrophic lateral sclerosis. Clin. Neurophysiol. 2021, 132, 2722–2728. [Google Scholar] [CrossRef]
- Walter, U.; Sobiella, G.; Prudlo, J.; Batchakaschvili, M.; Böhmert, J.; Storch, A.; Hermann, A. Ultrasonic detection of vagus, accessory, and phrenic nerve atrophy in amyotrophic lateral sclerosis: Relation to impairment and mortality. Eur. J. Neurol. 2024, 31, e161re. [Google Scholar] [CrossRef]
- Weise, D.; Menze, I.; Metelmann, M.C.F.; Woost, T.B.; Classen, J.; Otto Pelz, J. Multimodal assessment of autonomic dysfunction in amyotrophic lateral sclerosis. Eur. J. Neurol. 2022, 29, 715–723. [Google Scholar] [CrossRef]
- Deilami, P.; Ghourchian, S.; Ashtiani, B.H.; Esmaeili, S.; Bahadori, M.; Shojaee, S.F.; Babaei, M.R.; Raeesmohammadi, L.; Afrakhteh, M.; Zamani, B. Correlations Between Median Nerve Sonography and Conduction Study Results and Functional Scales in Amyotrophic Lateral Sclerosis. Acta Med. Iran. 2019, 57, 658–662. [Google Scholar] [CrossRef]
- Jongbloed, B.A.; Haakma, W.; Goedee, H.S.; Bos, J.W.; Bos, C.; Hendrikse, J.; Van Den Berg, L.H.; Van Der Pol, W.L. Comparative study of peripheral nerve MRI and ultrasound in multifocal motor neuropathy and amyotrophic lateral sclerosis. Muscle Nerve 2016, 54, 1133–1135. [Google Scholar] [CrossRef] [PubMed]
- López-Navarro, C.; Serrano-Valero, M.; Fages-Caravaca, E.M.; Martínez-Payá, J.J.; del Baño-Aledo, M.E.; Ríos-Díaz, J. Dynamic analysis of muscles and the internal structure of the peripheral nerve as biomarkers of amyotrophic lateral sclerosis: A pilot study with ultrasound imaging. Neurología 2024, 39, 457–466. [Google Scholar] [CrossRef]
- Eisen, A. Amyotrophic lateral sclerosis: A 40-year personal perspective. J. Clin. Neurosci. 2009, 16, 505–512. [Google Scholar] [CrossRef]
- Deng, H.X.; Zhai, H.; Bigio, E.H.; Yan, J.; Fecto, F.; Ajroud, K.; Mishra, M.; Ajroud-Driss, S.; Heller, S.; Sufit, R.; et al. FUS-immunoreactive inclusions are a common feature in sporadic and non-SOD1 familial amyotrophic lateral sclerosis. Ann. Neurol. 2010, 67, 739–748. [Google Scholar] [CrossRef]
- Rothstein, J.D.; Martin, L.J.; Kuncl, R.W. Decreased glutamate transport by the brain and spinal cord in amyotrophic lateral sclerosis. N. Engl. J. Med. 1992, 326, 1464–1468. [Google Scholar] [CrossRef] [PubMed]
- Martin, L.J. Mitochondrial and Cell Death Mechanisms in Neurodegenerative Diseases. Pharmaceuticals 2010, 3, 839–915. [Google Scholar] [CrossRef] [PubMed]
- Kraemer, M.; Buerger, M.; Berlit, P. Diagnostic problems and delay of diagnosis in amyotrophic lateral sclerosis. Clin. Neurol. Neurosurg. 2010, 112, 103–105. [Google Scholar] [CrossRef]
- Philips, T.; Rothstein, J.D. Glial cells in amyotrophic lateral sclerosis. Exp. Neurol. 2014, 262 Pt B, 111–120. [Google Scholar] [CrossRef]
- Beleza-Meireles, A.; Al-Chalabi, A. Genetic studies of amyotrophic lateral sclerosis: Controversies and perspectives. Amyotroph. Lateral Scler. 2009, 10, 1–14. [Google Scholar] [CrossRef]


| Nerve/Subgroup | N | Sample Size | MD/SMD | 95%CI | Heterogeneity | ||
|---|---|---|---|---|---|---|---|
| ALS | Control | I2 | p | ||||
| Vagus | |||||||
| Total | 4 | 259 | 266 | −0.23 | −0.41 to −0.05 | 73% | <0.001 |
| RT | 3 | 101 | 99 | −0.27 | −0.62 to −0.07 | 78% | 0.01 |
| LT | 3 | 101 | 99 | −0.17 | −0.48 to 0.14 | 78% | 0.01 |
| Bilateral | 2 | 57 | 68 | −0.26 | −0.76 to 0.23 | 83% | 0.02 |
| Phrenic | |||||||
| Total | 3 | 242 | 222 | −0.25 | −0.34 to −0.15 | 76% | <0.001 |
| RT | 3 | 101 | 91 | −0.31 | −0.52 to −0.10 | 82% | 0.004 |
| LT | 3 | 101 | 91 | −0.24 | −0.37 to −0.10 | 79% | 0.009 |
| Bilateral | 1 | 40 | 40 | −0.14 | −0.23 to −0.05 | - | |
| C5 root * | 4 | 386 | 241 | −0.94 | −1.15 to −0.73 | 18% | 0.3 |
| C6 root * | 5 | 438 | 306 | −1.56 | −1.93 to −1.18 | 73% | <0.001 |
| C7 root * | 3 | 364 | 224 | −1.18 | −1.66 to −0.69 | 84% | <0.001 |
| C8 root | 1 | 139 | 75 | −1.9 | −1.51 to −2.29 | - | - |
| Accessory | 1 | 40 | 40 | −0.32 | −0.42 to −0.22 | - | - |
| Sciatic | 1 | 14 | 14 | −11 | −115.89 to 93.89 | - | - |
| Tibial | |||||||
| Total | 3 | 151 | 131 | −0.68 | −0.68 to 2.04 | 58% | 0.05 |
| Ankle | 3 | 81 | 73 | 0.69 | −0.99 to 2.37 | 68% | 0.05 |
| Knee | 2 | 70 | 58 | 0.56 | −3.03 to 4.16 | 69% | 0.07 |
| Sural | 2 | 57 | 68 | −0.32 | −0.81 to 0.18 | 49% | 0.14 |
| Ulnar | |||||||
| Total | 9 | 4205 | 2180 | −0.80 | −1.04 to −0.55 | 92% | <0.001 |
| Distal wrist | 2 | 278 | 150 | 0.18 | 0.01 to 0.35 | 0% | 0.52 |
| Mid wrist | 9 | 742 | 352 | −1.39 | −1.95 to −0.83 | 92% | <0.001 |
| Proximal wrist | 3 | 299 | 180 | −0.40 | −1.20 to 0.41 | 88% | <0.001 |
| Distal forearm | 3 | 313 | 187 | −0.79 | −1.45 to −0.14 | 73% | 0.03 |
| Mid forearm | 12 | 957 | 467 | −1.18 | −1.67 to −0.69 | 83% | <0.001 |
| Proximal forearm | 2 | 278 | 150 | −0.26 | −0.75 to −0.23 | 74% | 0.05 |
| Elbow | 4 | 434 | 186 | −0.52 | −1.08 to 0.04 | 86% | 0.002 |
| Proximal upper arm | 2 | 278 | 150 | −0.40 | −1.18 to 0.39 | 94% | <0.001 |
| Distal upper arm | 2 | 278 | 150 | −0.30 | −0.89 to 0.28 | 90% | 0.002 |
| Mid upper arm | 2 | 70 | 58 | 0.02 | −0.49 to 0.52 | 0% | 0.32 |
| Axilla | 2 | 278 | 150 | −0.45 | −1.33 to 0.43 | 95% | <0.001 |
| Median | |||||||
| Total | 15 | 4540 | 2537 | −1.21 | −1.46 to −0.95 | 93% | <0.001 |
| Distal wrist | 3 | 298 | 170 | −0.93 | −1.98 to 0.12 | 79% | 0.009 |
| Mid wrist | 5 | 478 | 216 | −0.69 | −1.12 to −0.27 | 56% | 0.06 |
| Proximal wrist | 4 | 313 | 194 | −1.82 | −2.01 to −1.62 | 27% | 0.25 |
| Distal forearm | 3 | 313 | 194 | −1.20 | −1.57 to −0.83 | 73% | 0.02 |
| Mid forearm | 17 | 1136 | 652 | −0.56 | −0.80 to −0.32 | 73% | <0.001 |
| Proximal forearm | 2 | 278 | 150 | −1.10 | −1.49 to −0.71 | 78% | 0.03 |
| Elbow | 3 | 295 | 178 | −2.34 | −4.03 to −0.66 | 87% | <0.001 |
| Distal upper arm | 2 | 278 | 150 | −2.59 | −2.85 to −2.34 | 0% | 0.44 |
| Proximal upper arm | 3 | 298 | 170 | −2.56 | −2.93 to −2.19 | 40% | 0.19 |
| Mid upper arm | 9 | 549 | 292 | −1.41 | −1.84 to −0.98 | 36% | 0.13 |
| Axilla | 3 | 295 | 178 | −1.57 | −3.59 to 0.45 | 91% | <0.001 |
| Article | Nerve | AUC | Sensitivity | Specificity |
|---|---|---|---|---|
| Holzapfel et al., 2020 [26] | Vagus nerve (CSA) | 0.69 | 66.7% | 63.2% |
| Schreiber et al., 2019 [38] | Ulnar nerve wrist (CSA) | 0.897 | 69.2% | 92.5% |
| Ulnar nerve forearm (CSA) | 0.866 | 87.8% | 74.1% | |
| Median nerve wrist (CSA) | 0.625 | 73.5% | 60.7% | |
| Median nerve forearm (CSA) | 0.687 | 75.0% | 57.1% | |
| Nodera et al., 2014 [34] | C5 (Diameter) | 0.77 | - | - |
| C6 (Diameter) | 0.87 | - | - | |
| C6 (CSA) | 0.84 | - | - | |
| C7 (Diameter) | 0.74 | - | - | |
| Median nerve (Diameter) | 0.66 | - | - | |
| Median nerve (CSA) | 0.72 | - | - | |
| Ulnar nerve (Diameter) | 0.71 | - | - | |
| Ulnar nerve (CSA) | 0.76 | - | - |
Disclaimer/Publisher’s Note: The statements, opinions and data contained in all publications are solely those of the individual author(s) and contributor(s) and not of MDPI and/or the editor(s). MDPI and/or the editor(s) disclaim responsibility for any injury to people or property resulting from any ideas, methods, instructions or products referred to in the content. |
© 2025 by the authors. Licensee MDPI, Basel, Switzerland. This article is an open access article distributed under the terms and conditions of the Creative Commons Attribution (CC BY) license (https://creativecommons.org/licenses/by/4.0/).
Share and Cite
Elgenidy, A.; Hassan, I.A.; Hamed, Y.; Hashem, H.A.; Abuel-naga, O.; Abdel-Rahman, H.I.; Mohamed, K.R.; Hamed, B.M.; Shehab, M.A.; Zeyada, M.; et al. Sonographic Evaluation of Peripheral Nerves and Cervical Nerve Roots in Amyotrophic Lateral Sclerosis: A Systematic Review and Meta-Analysis. Med. Sci. 2025, 13, 67. https://doi.org/10.3390/medsci13020067
Elgenidy A, Hassan IA, Hamed Y, Hashem HA, Abuel-naga O, Abdel-Rahman HI, Mohamed KR, Hamed BM, Shehab MA, Zeyada M, et al. Sonographic Evaluation of Peripheral Nerves and Cervical Nerve Roots in Amyotrophic Lateral Sclerosis: A Systematic Review and Meta-Analysis. Medical Sciences. 2025; 13(2):67. https://doi.org/10.3390/medsci13020067
Chicago/Turabian StyleElgenidy, Anas, Ibrahim A. Hassan, Yasser Hamed, Hassan Ahmed Hashem, Osama Abuel-naga, Hazem I. Abdel-Rahman, Kawashty R. Mohamed, Belal Mohamed Hamed, Mennatullah A. Shehab, Mohamed Zeyada, and et al. 2025. "Sonographic Evaluation of Peripheral Nerves and Cervical Nerve Roots in Amyotrophic Lateral Sclerosis: A Systematic Review and Meta-Analysis" Medical Sciences 13, no. 2: 67. https://doi.org/10.3390/medsci13020067
APA StyleElgenidy, A., Hassan, I. A., Hamed, Y., Hashem, H. A., Abuel-naga, O., Abdel-Rahman, H. I., Mohamed, K. R., Hamed, B. M., Shehab, M. A., Zeyada, M., Kassab, S., Abdelgawad, S. S. A., Ibrahim, A. I., Hasanin, E. H., Elhoufey, A. A., Mahmoud, K. H., & Saad, K. (2025). Sonographic Evaluation of Peripheral Nerves and Cervical Nerve Roots in Amyotrophic Lateral Sclerosis: A Systematic Review and Meta-Analysis. Medical Sciences, 13(2), 67. https://doi.org/10.3390/medsci13020067