
Trends and Disparities in Liver Transplantation in the United States: A Nationwide Analysis of Demographic, Clinical, and Socioeconomic Factors (2016–2021)

 , ,
, ,
Abstract
1. Introduction
2. Methods
3. Results
4. Discussion
5. Conclusions
Author Contributions
Funding
Institutional Review Board Statement
Informed Consent Statement
Data Availability Statement
Conflicts of Interest
References
- Starzl, T.E.; Demetris, A.J.; Van Thiel, D. Medical progress: Liver transplantation. N. Engl. J. Med. 1990, 321, 1014–1022. [Google Scholar] [CrossRef] [PubMed]
- Adam, R.; McMaster, P.; O’Grady, J.G.; Castaing, D.; Klempnauer, J.L.; Jamieson, N.; Neuhaus, P.; Lerut, J.; Salizzoni, M.; Pollard, S.; et al. Evolution of liver transplantation in Europe: Report of the European Liver Transplant Registry. Liver Transplant. 2003, 9, 1231–1243. [Google Scholar] [CrossRef]
- Younossi, Z.M.; Stepanova, M.; Afendy, M.; Fang, Y.; Younossi, Y.; Mir, H.; Srishord, M. Changes in the prevalence of the most common causes of chronic liver diseases in the United States from 1988 to 2008. Clin. Gastroenterol. Hepatol. 2011, 9, 524–530. [Google Scholar] [CrossRef]
- World Health Organization. Global Status Report on Alcohol and Health; WHO: Geneva, Switzerland, 2018. [Google Scholar]
- Organ Procurement and Transplantation Network (OPTN). National Data: Transplant Trends; UNOS: Richmond, VA, USA, 2020. [Google Scholar]
- Artinyan, A.; Mailey, B.; Sanchez-Luege, N.; Khalili, J.; Sun, C.; Bhatia, S.; Wagman, L.D.; Nissen, N.; Colquhoun, S.D.; Kim, J. Race, ethnicity, and socioeconomic status influence the survival of patients with hepatocellular carcinoma in the United States. Cancer 2010, 116, 1367–1377. [Google Scholar] [CrossRef] [PubMed]
- Moylan, C.A.; Brady, C.W.; Johnson, J.L.; Smith, A.D.; Tuttle-Newhall, J.E.; Muir, A.J. Disparities in liver transplantation before and after introduction of the MELD score. JAMA 2008, 300, 2371–2378. [Google Scholar] [CrossRef] [PubMed]
- Charlson, M.E.; Pompei, P.; Ales, K.L.; MacKenzie, C.R. A new method of classifying prognostic comorbidity in longitudinal studies: Development and validation. J. Chronic Dis. 1987, 40, 373–383. [Google Scholar] [CrossRef]
- Volk, M.L.; Choi, H.; Warren, G.J.; Sonnenday, C.J.; Saini, S.D. Geographic variation in organ availability is responsible for disparities in liver transplantation between Hispanics and whites. Am. J. Transplant. 2009, 9, 2113–2118. [Google Scholar] [CrossRef] [PubMed]
- Cholankeril, G.; Ahmed, A. Alcoholic liver disease replaces hepatitis C virus infection as the leading indication for liver transplantation in the United States. Clin. Gastroenterol. Hepatol. 2018, 16, 1356–1358. [Google Scholar] [CrossRef]
- Kim, W.R.; Lake, J.R.; Smith, J.M.; Schladt, D.P.; Skeans, M.A.; Harper, A.M.; Wainright, J.L.; Snyder, J.J.; Israni, A.K.; Kasiske, B.L. OPTN/SRTR 2016 Annual Data Report: Liver. Am. J. Transplant. 2018, 18 (Suppl. S1), 172–253. [Google Scholar] [CrossRef]
- Kwong, A.J.; Kim, W.R.; Lake, J.R.; Smith, J.M.; Schladt, D.P.; Skeans, M.A.; Noreen, S.M.; Foutz, J.; Miller, E.; Snyder, J.J.; et al. OPTN/SRTR 2018 Annual Data Report: Liver. Am. J. Transplant. 2020, 20 (Suppl. S1), 193–299. [Google Scholar] [CrossRef]
- Durand, F.; Levistky, J.; Cauchy, F.; Gilgenkrantz, H.; Soubrane, O.; Francoz, C. Age and liver transplantation. J. Hepatol. 2019, 70, 745–758. [Google Scholar] [CrossRef] [PubMed]
- Goldberg, D.S.; French, B.; Sahota, G.; Wallace, A.E.; Lewis, J.D.; Halpern, S.D. Use of population-based data to demonstrate how waitlist-based metrics overestimate geographic disparities in access to liver transplant care. Am. J. Transplant. 2016, 16, 2903–2911. [Google Scholar] [CrossRef]
- Volk, M.L.; Choi, H.; Warren, G.J.; Sonnenday, C.J.; Marrero, J.A. Geographic variations in liver transplantation in the United States: Socioeconomic factors, center characteristics, and outcomes. J. Hepatol. 2009, 50, 811–818. [Google Scholar]
- Tickoo, R.; Chopra, J.; Abt, P.; Bloom, R.D.; Goldberg, D.S. Variation in health care resource utilization and outcomes in adult living donor versus deceased donor liver transplant recipients. Clin. Transplant. 2022, 36, e14617. [Google Scholar]
- Adam, R.; Karam, V.; Cailliez, V.; O’Grady, J.G.; Mirza, D.; Cherqui, D.; Klempnauer, J.; Salizzoni, M.; Pratschke, J.; Jamieson, N.; et al. 2018 Annual Report of the European Liver Transplant Registry (ELTR): 50-year evolution of liver transplantation. Transpl. Int. 2018, 31, 1293–1317. [Google Scholar] [CrossRef] [PubMed]
- Singh, T.P.; Naemi, M.; Blumberg, E.A. Infectious complications in the early period after liver transplantation. Transpl. Infect. Dis. 2021, 23, e13559. [Google Scholar]
- Petrowsky, H.; Rana, A.; Kaldas, F.M.; Sharma, A.; Hong, J.C.; Agopian, V.G.; Durazo, F.; Honda, H.; Gornbein, J.; Wu, V.; et al. Liver transplantation in highest acuity recipients: Identifying factors to avoid futility. Ann. Surg. 2014, 259, 1186–1194. [Google Scholar] [CrossRef] [PubMed]
- Nye, J.A.; Schaffner, A. The role of comorbidities in liver transplant outcomes. J. Clin. Gastroenterol. 2019, 53, 353–364. [Google Scholar]
- Asrani, S.K.; Devarbhavi, H.; Eaton, J.; Kamath, P.S. Burden of liver diseases in the world. J. Hepatol. 2019, 70, 151–171. [Google Scholar] [CrossRef]
- Blachier, M.; Leleu, H.; Peck-Radosavljevic, M.; Valla, D.C.; Roudot-Thoraval, F. The burden of liver disease in Europe: A review of available epidemiological data. J. Hepatol. 2013, 58, 593–608. [Google Scholar] [CrossRef]
- Kwong, A.J.; Kim, W.R.; Lake, J.R.; Smith, J.M.; Schladt, D.P.; Skeans, M.A.; Noreen, S.M.; Foutz, J.; Booker, S.E.; Cafarella, M.; et al. OPTN/SRTR 2019 Annual Data Report: Liver. Am. J. Transplant. 2021, 21 (Suppl. 2), 208–315. [Google Scholar] [CrossRef] [PubMed]
- Mathur, A.K.; Schaubel, D.E.; Gong, Q.; Guidinger, M.K.; Merion, R.M. Sex-based disparities in liver transplant rates in the United States. Am. J. Transplant. 2011, 11, 1435–1443. [Google Scholar] [CrossRef] [PubMed]

| Year | Total Number of Transplants | Mean Age | Sex | Race | All-Cause in Hospital Mortality | Mean of Total Hospital Charges ($) | Mean Length of Stay (Days) | Primary Co Payer |
|---|---|---|---|---|---|---|---|---|
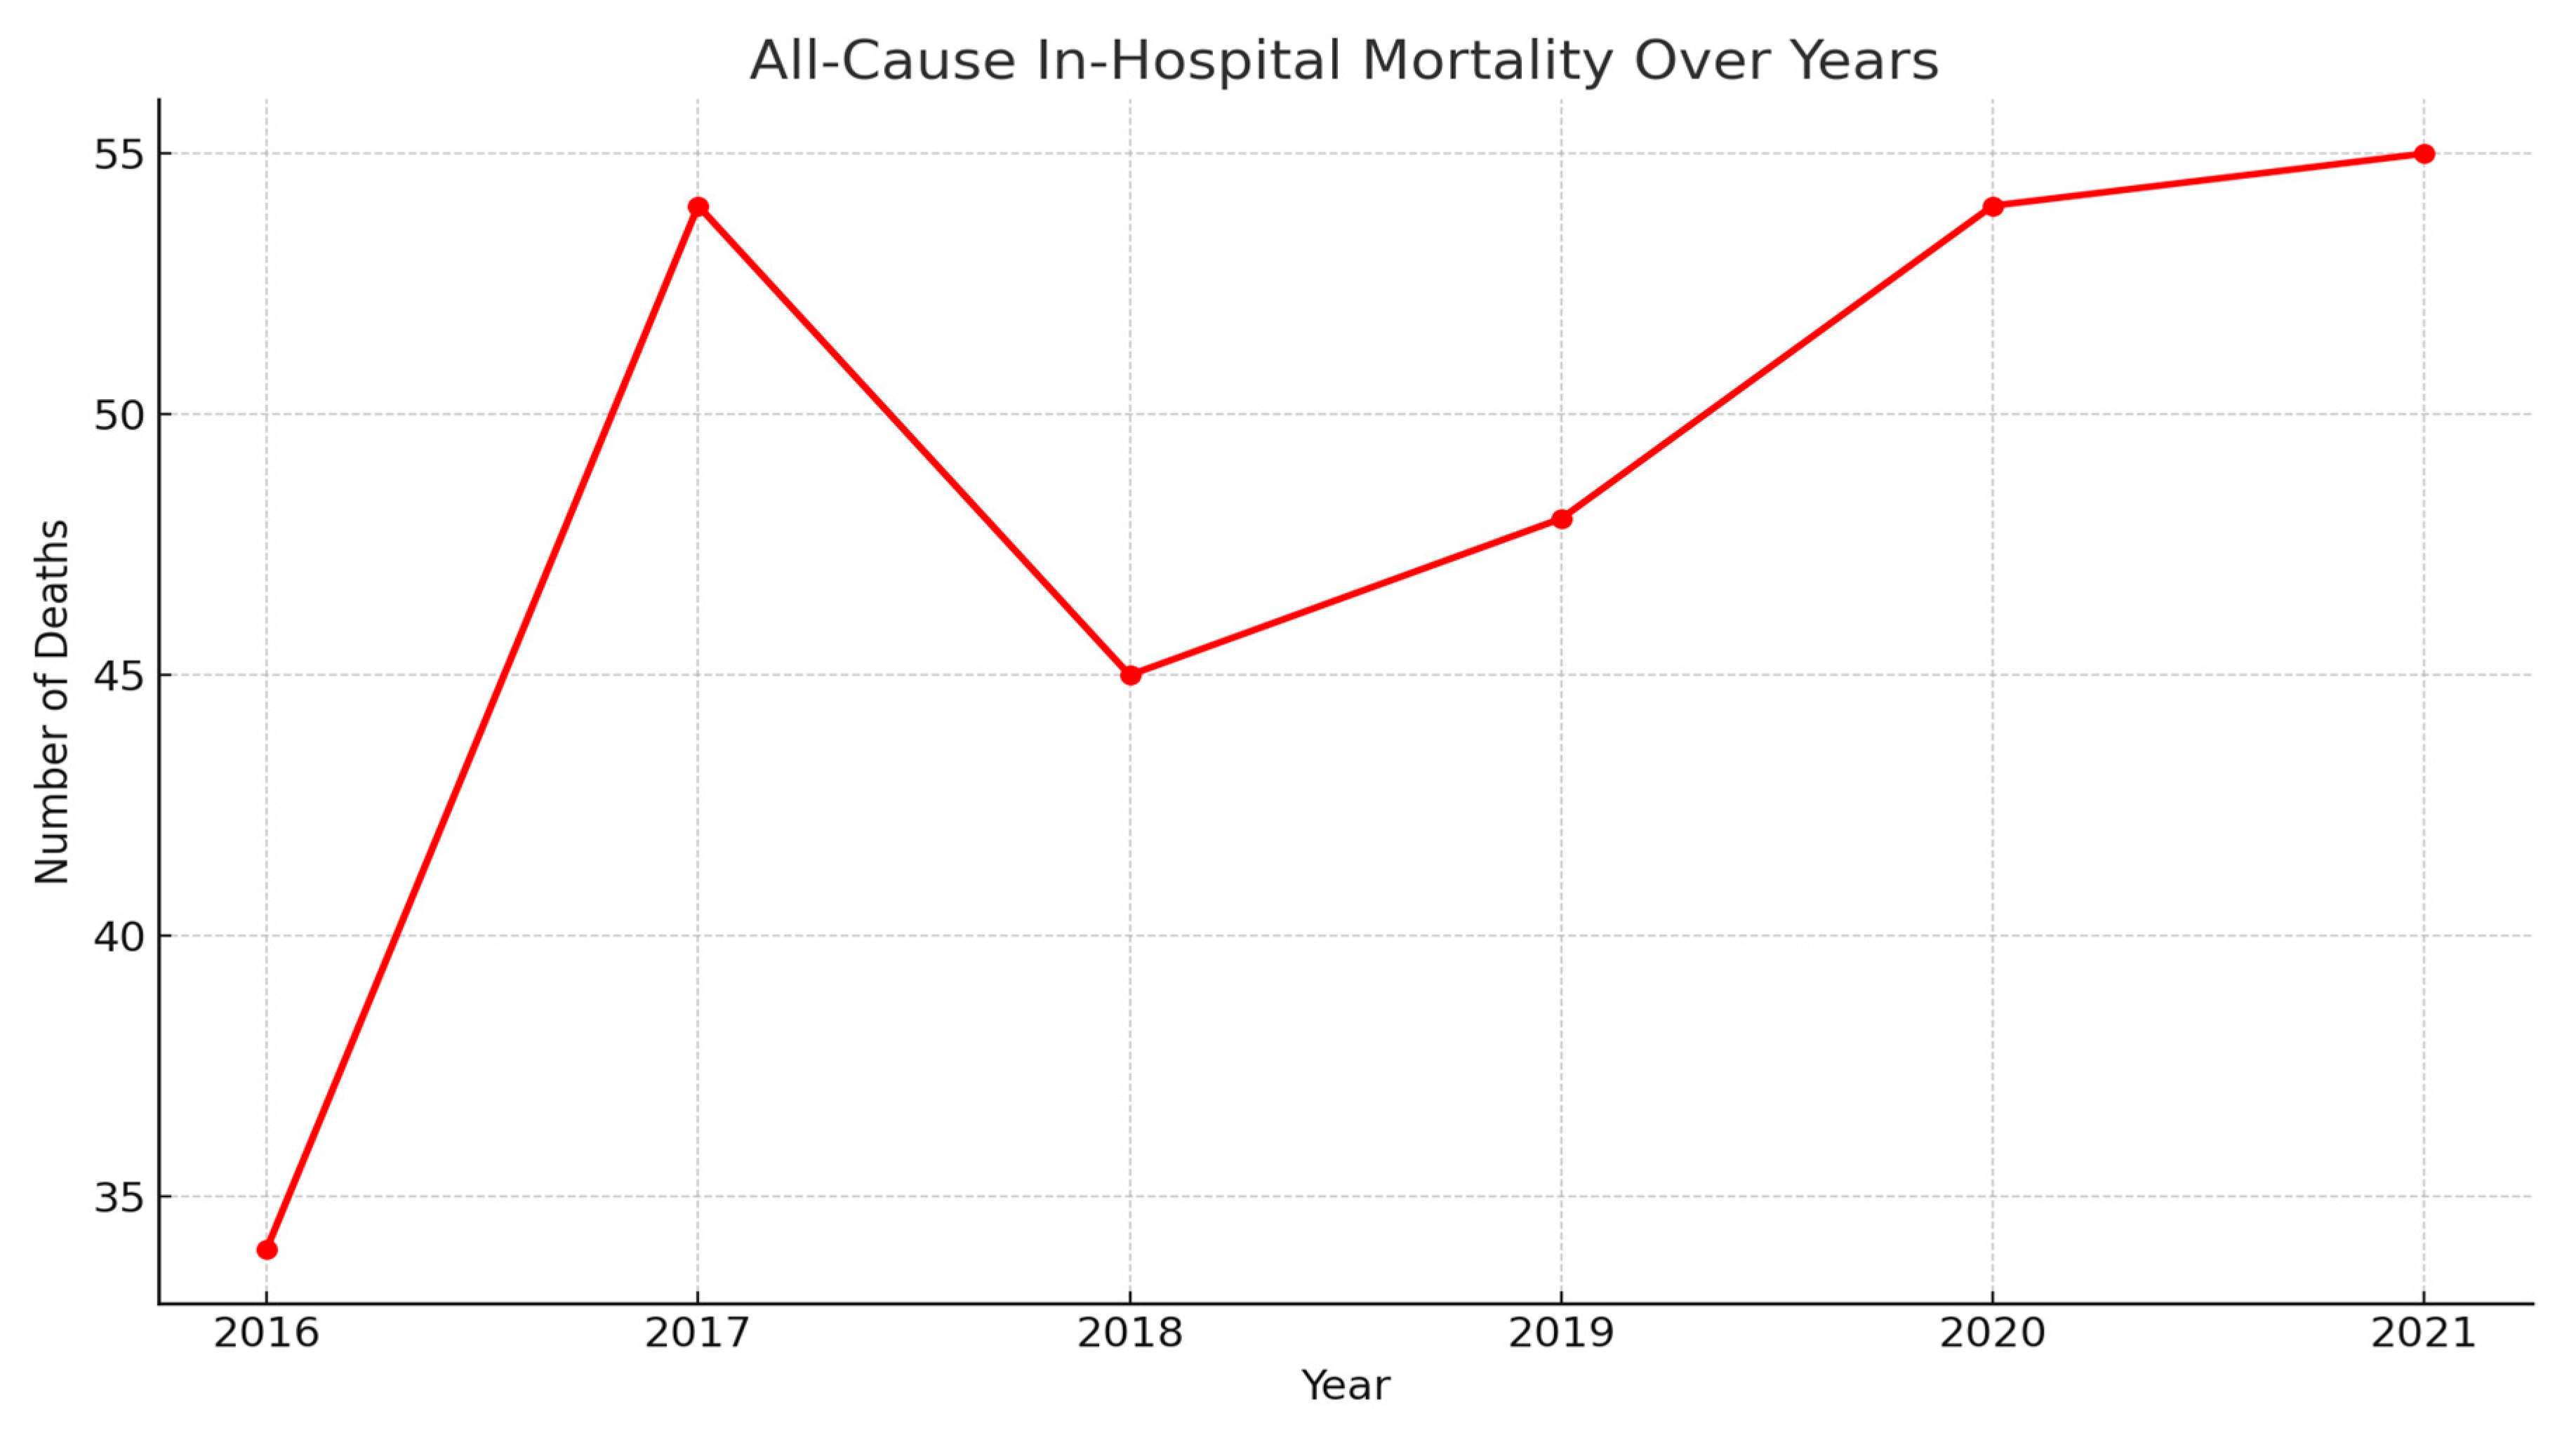
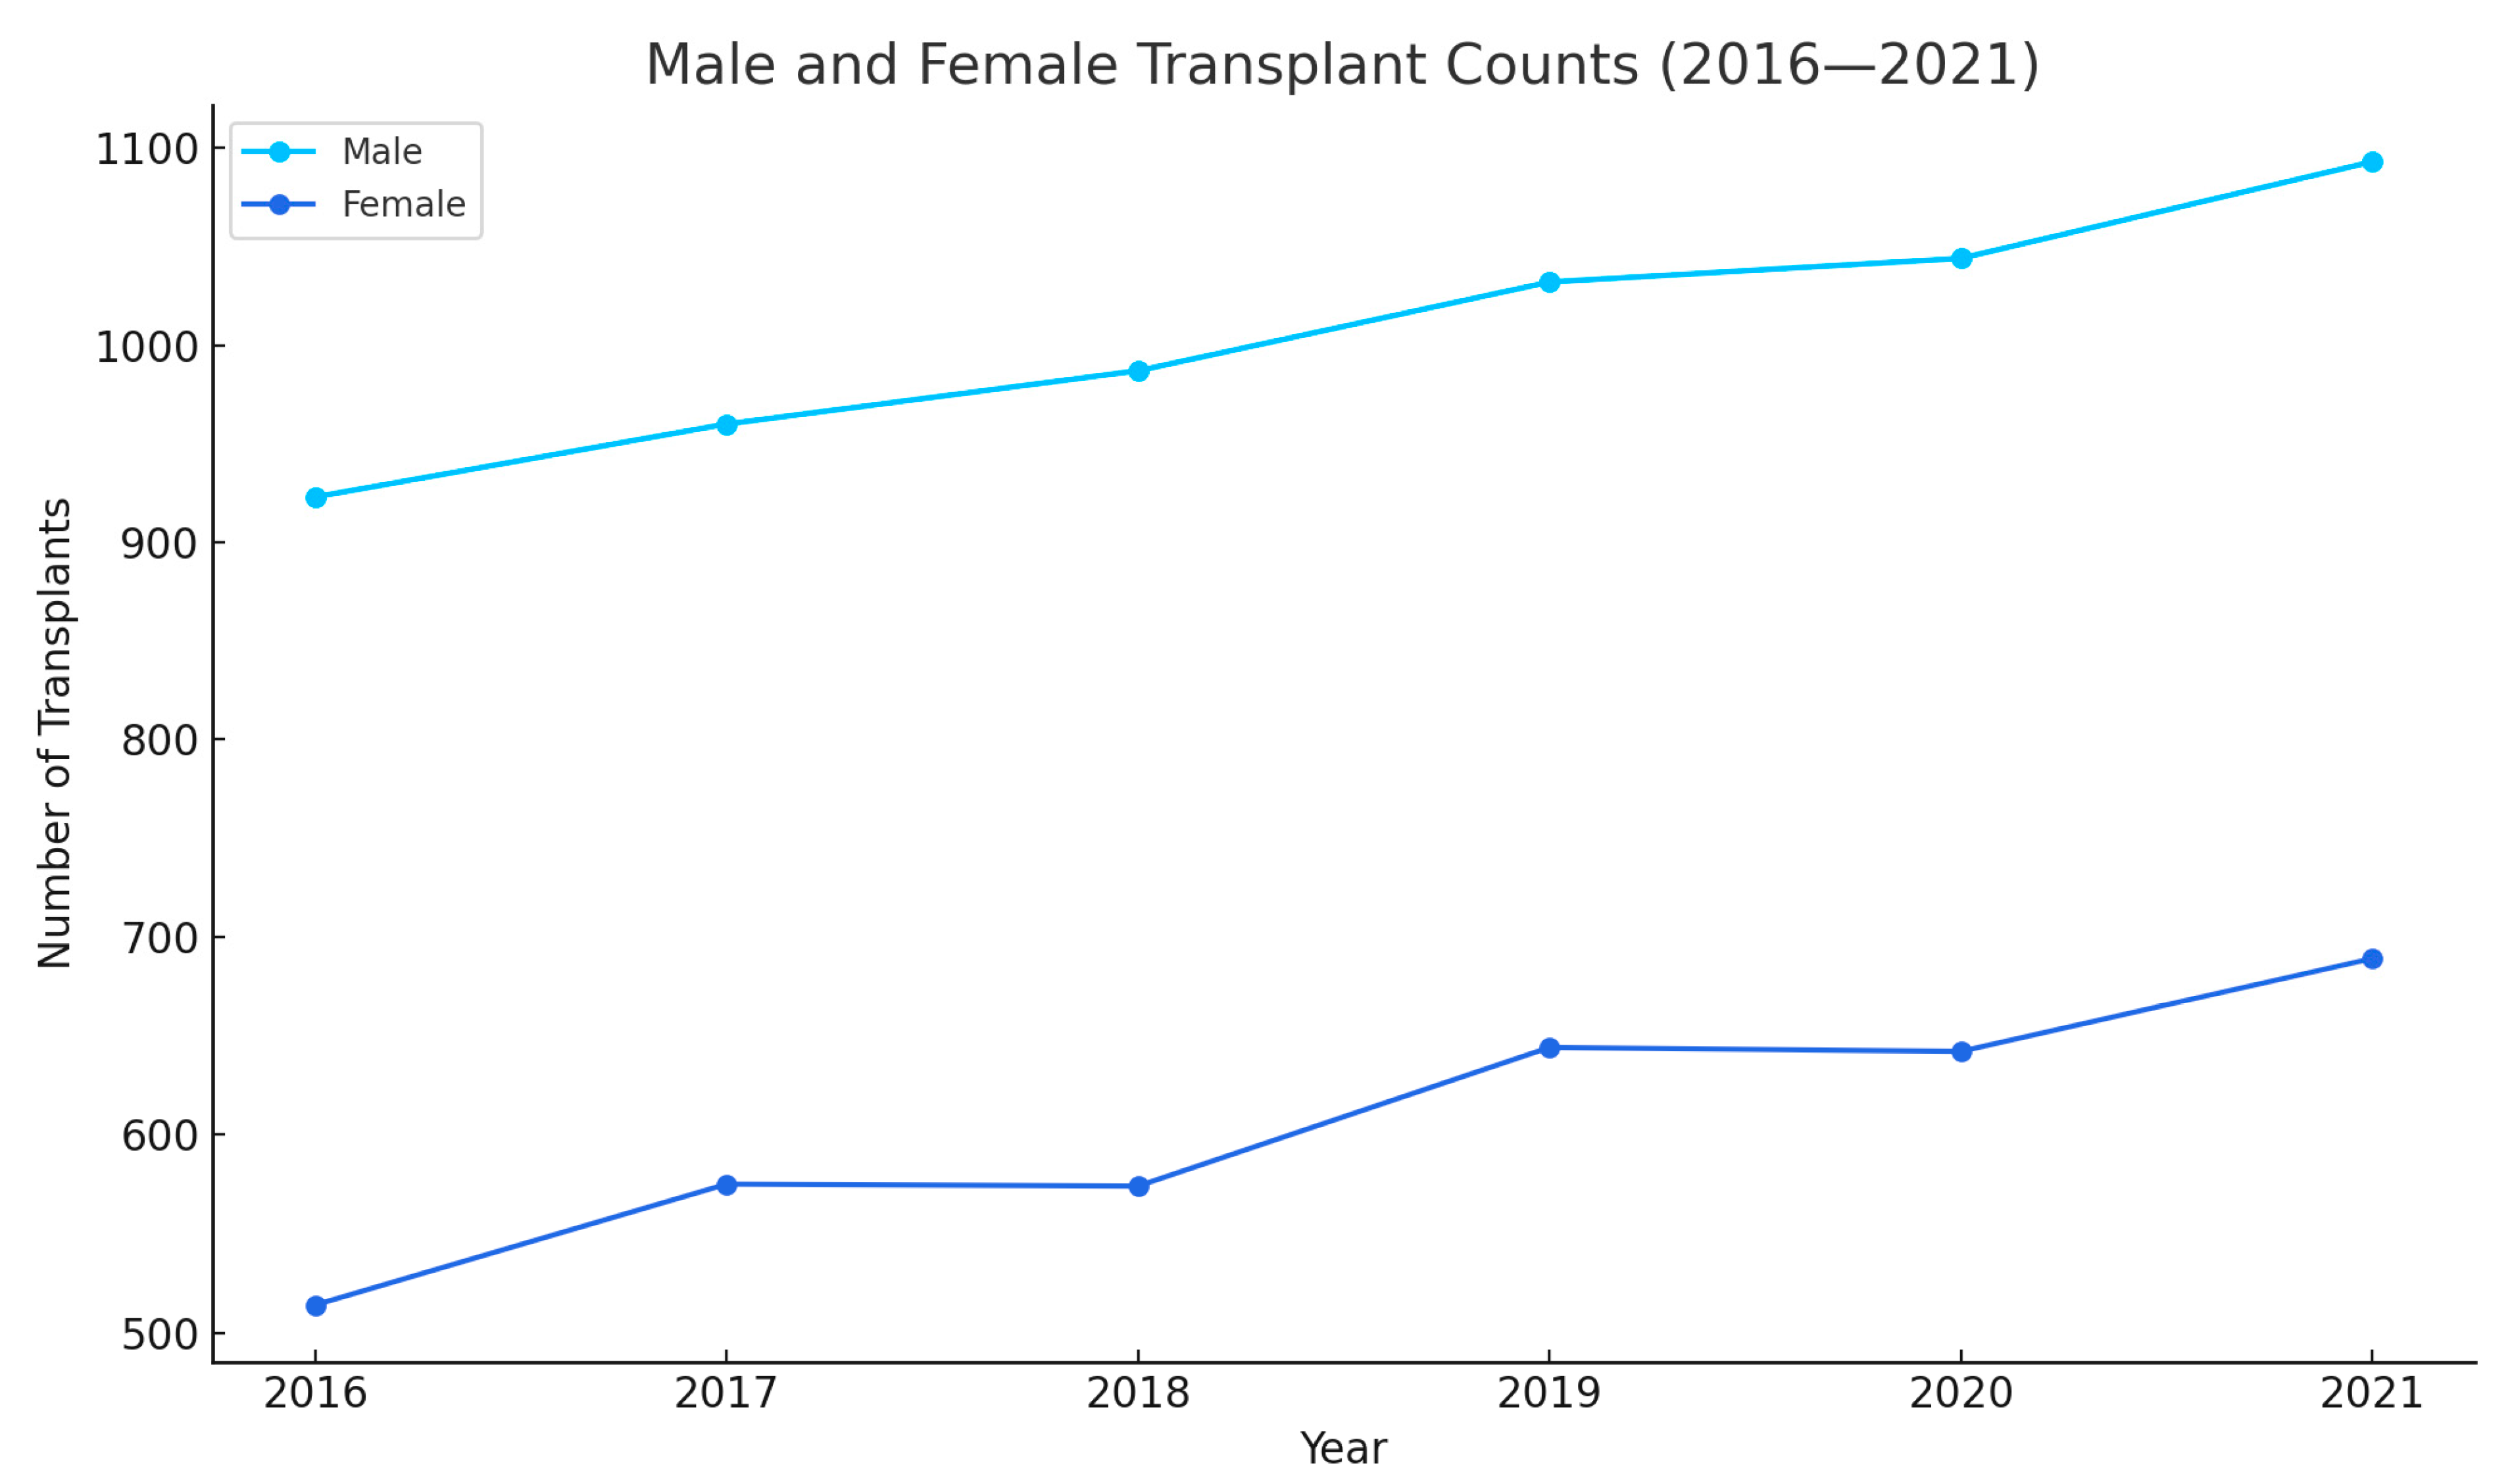
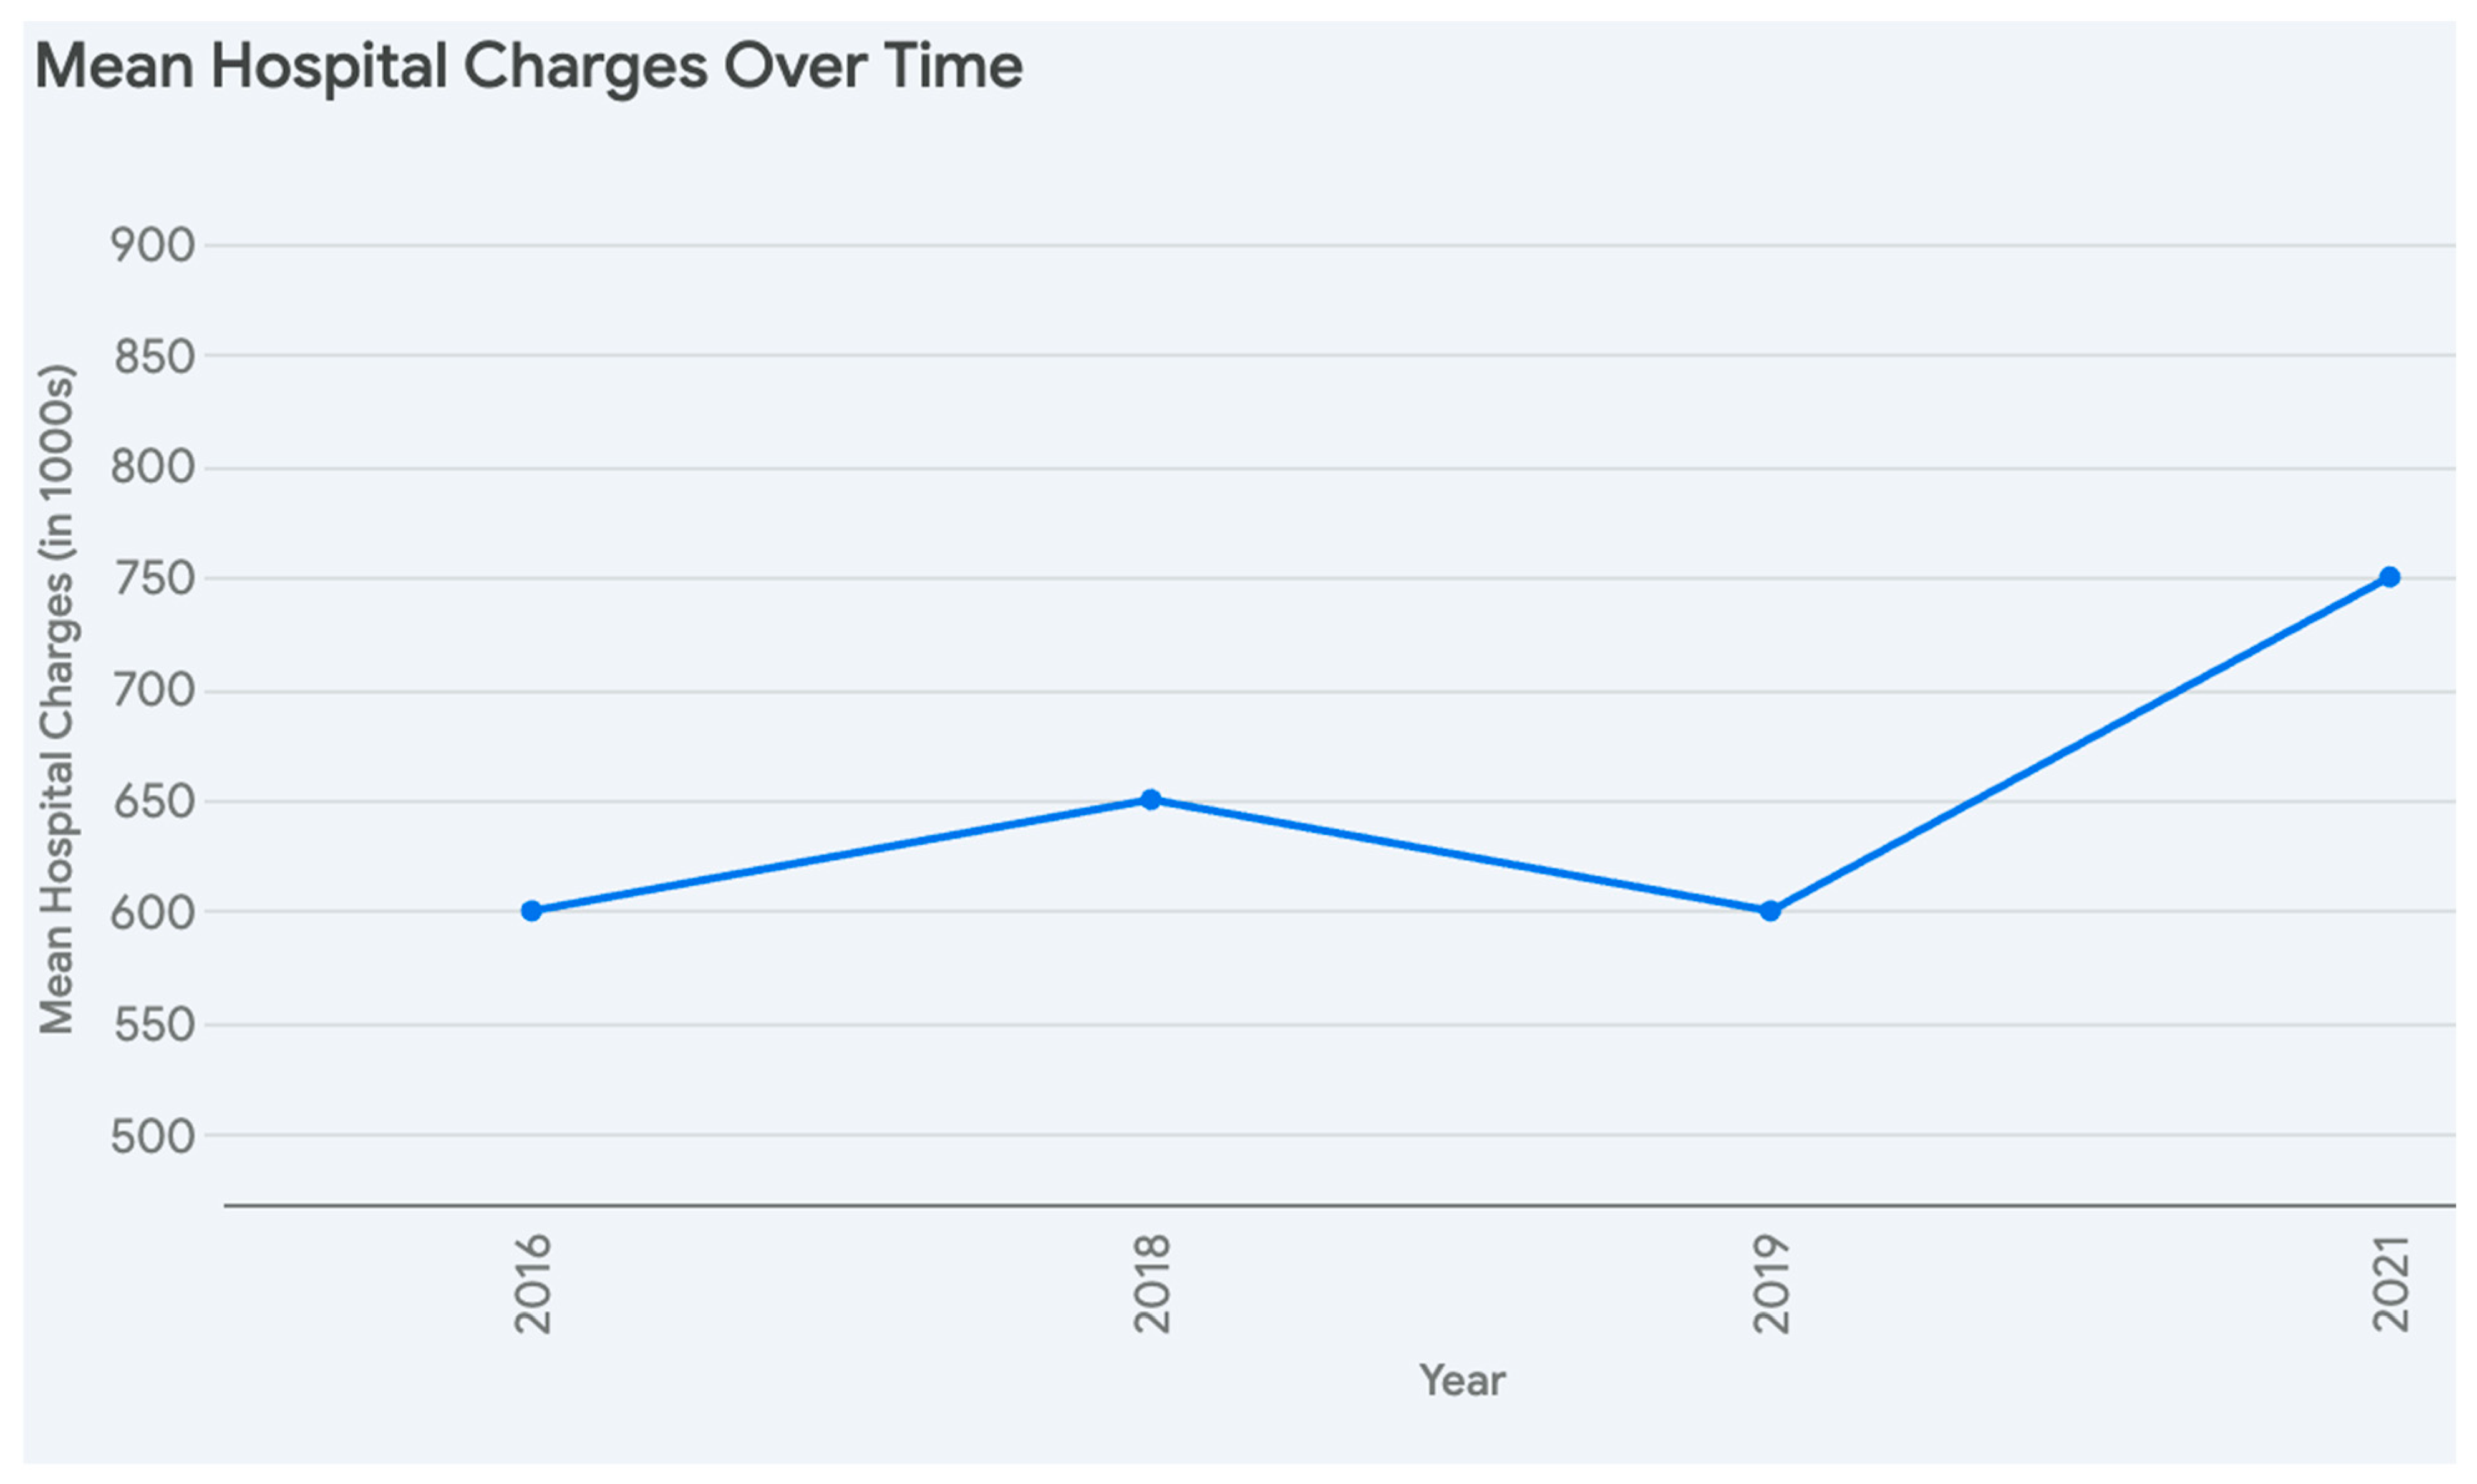
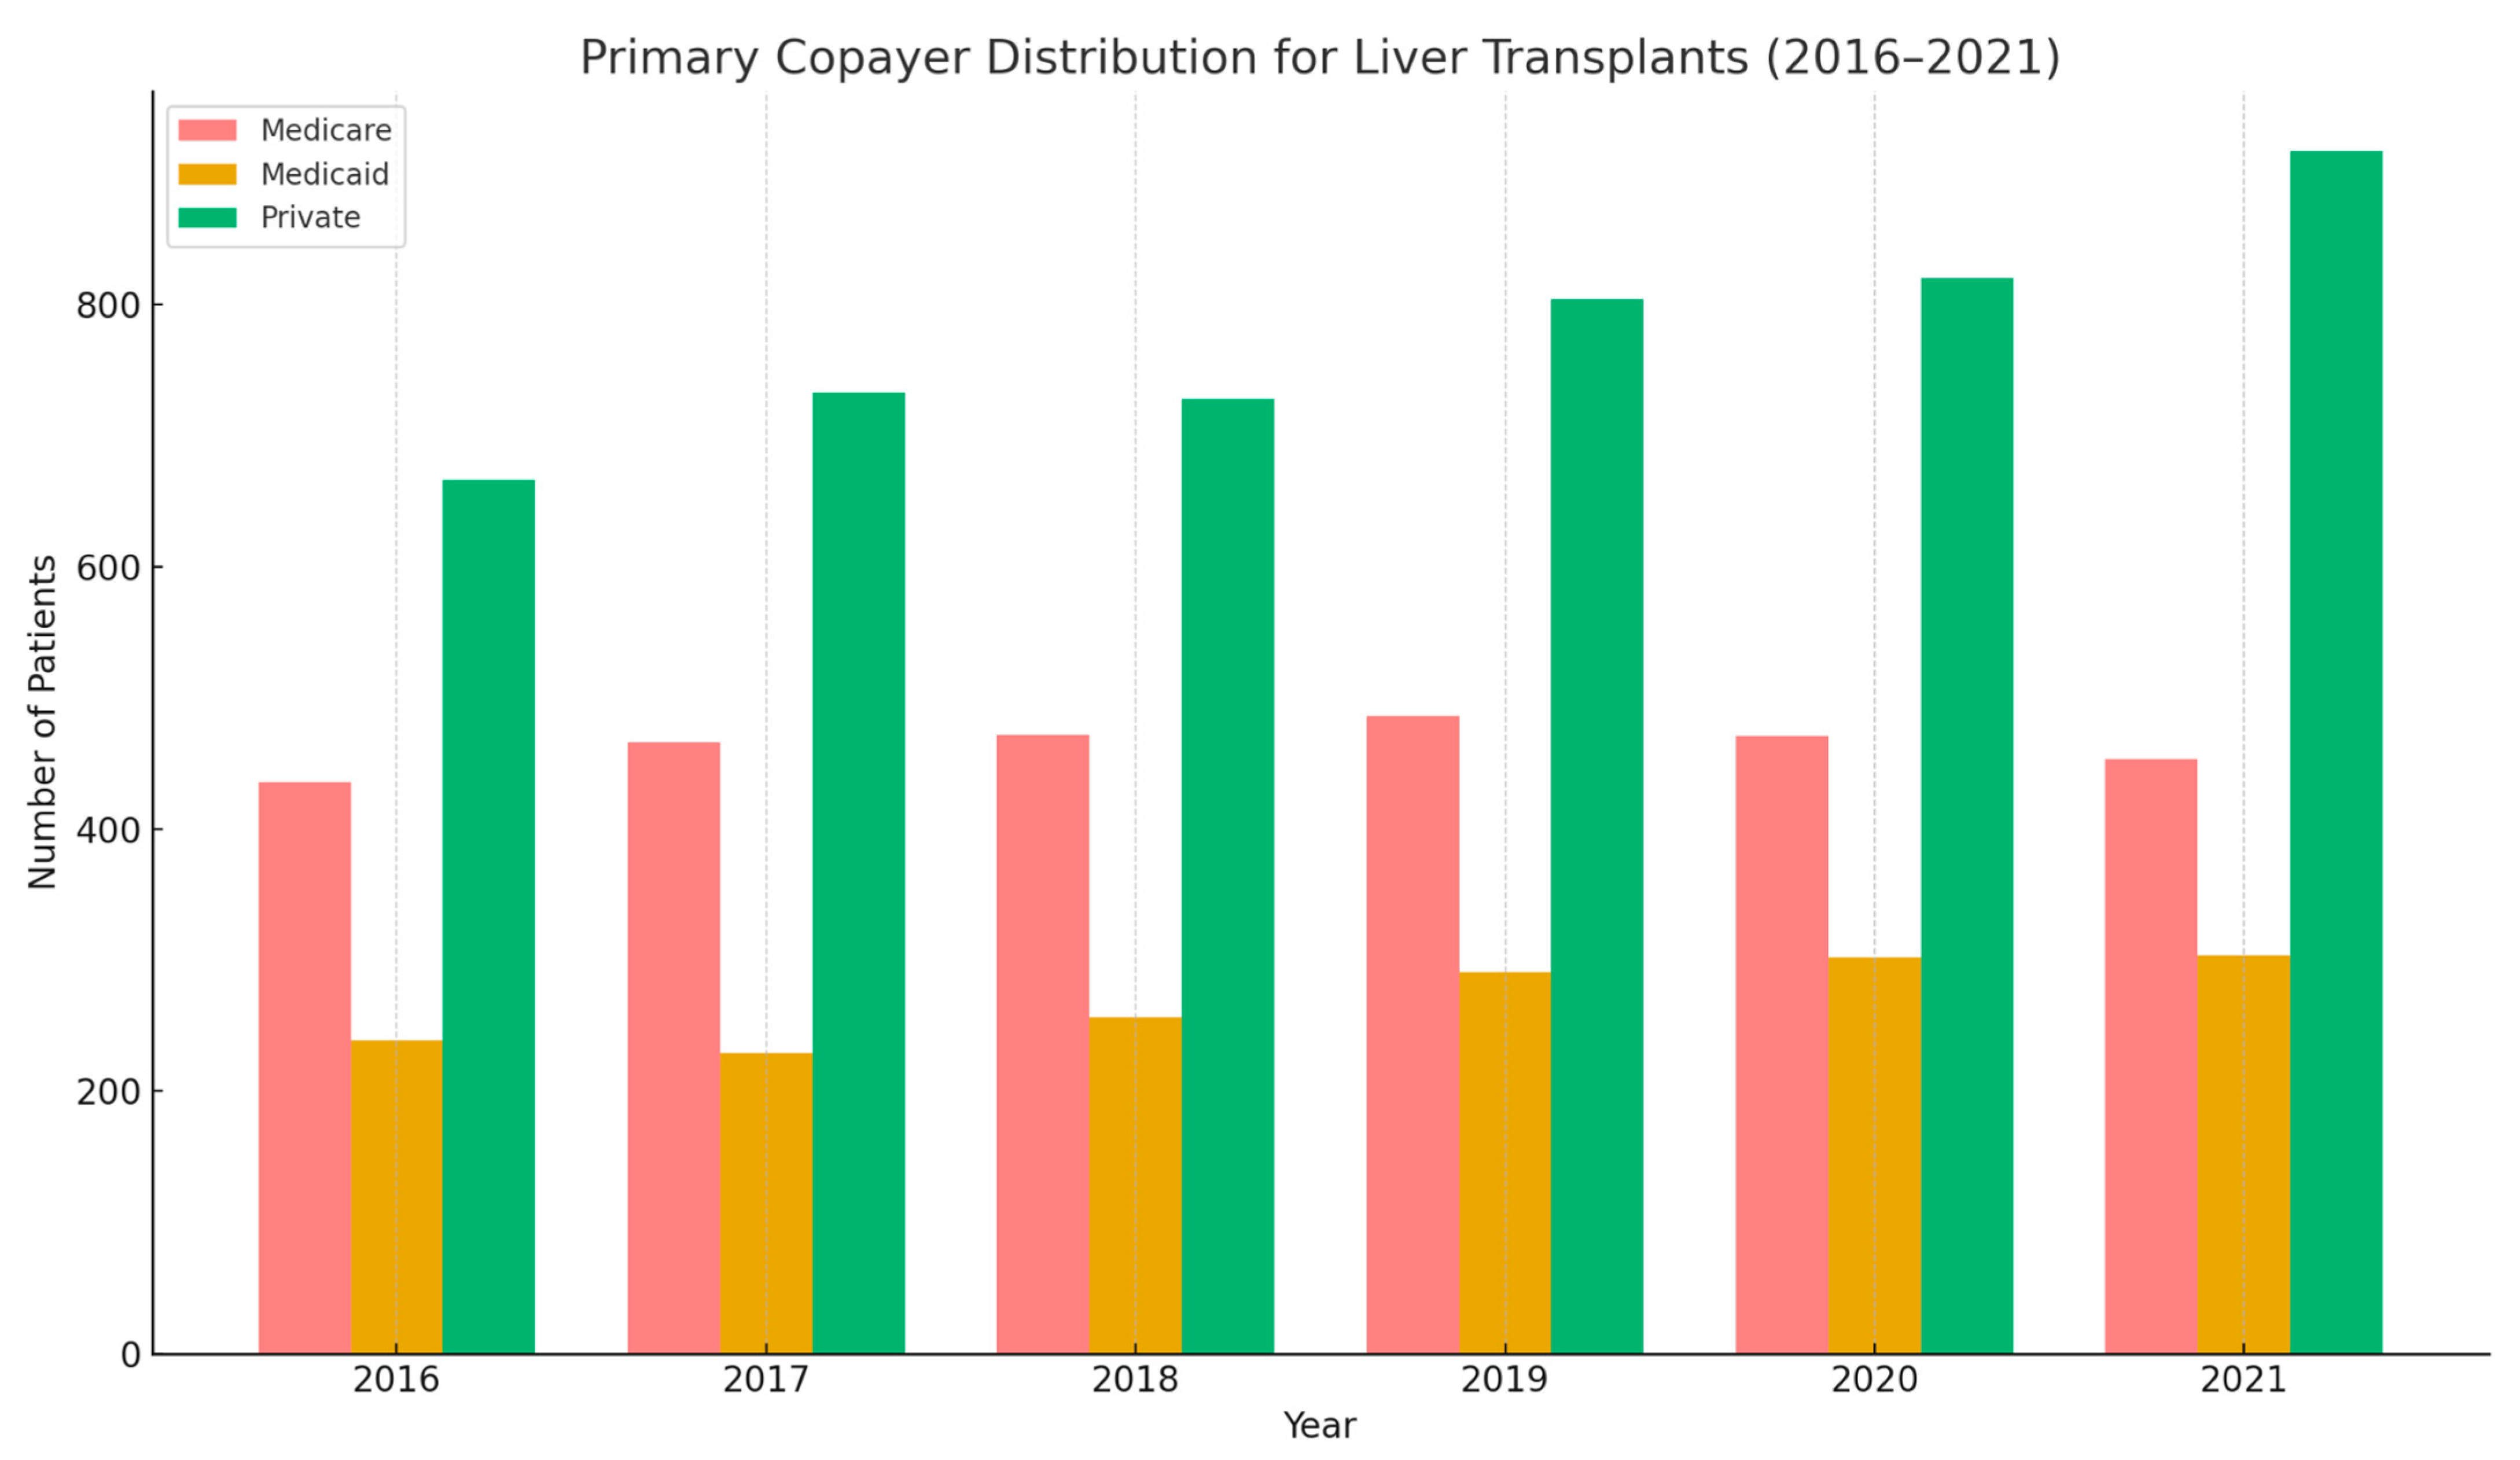
| 2016 | 1437 | 51.80 (50.92–58.68) | Male: 923 (64.23%) | White 866 (68.26%) | 34 (2.37%) | 578,291.7 | 21.06 (19.90–22.22) | Medicare 436 (30.64%) |
| Black 121 (9.24%) | Medicaid 239 (16.80%) | |||||||
| Female 514 (35.77%) | ||||||||
| Hispanic 202 (15.42%) | Private 666 (46.80%) | |||||||
| 2017 | 1535 | 52.10 (51.25–52.96) | Male 960 (62.54%) | White 946 (65.74%) | 54 (3.52%) | 584,345.6 | 20.80 (19.60–22.00) | Medicare 466 (30.56%) |
| Black 141 (9.80%) | Medicaid 229 (15.02%) | |||||||
| Female 575 (37.46) | ||||||||
| Hispanic 204 (14.18%) | Private 733 (48.07%) | |||||||
| 2018 | 1561 | 51.86 (51.01–52.71) | Male 987 (63.23%) | White 994 (66.58%) | 45 (2.88%) | 643,858.8 | 21.23 (19.86–22.41) | Medicare 472 (30.31%) |
| Black 129 (8.64%) | Medicaid 256 (16.44%) | |||||||
| Female 574 (36.77%) | ||||||||
| Hispanic 234 (15.67%) | Private 728 (46.76%) | |||||||
| 2019 | 1676 | 51.98 (51.18–52.78) | Male 1032 (61.58%) | White 1404 (68.53%) | 48 (2.86%) | 614,708.4 | 20.47 (19.26–21.68) | Medicare 486 (29%) |
| Black 112 (6.95%) | Medicaid 291 (17.36%) | |||||||
| Female 644 (38.42%) | ||||||||
| Hispanic 272 (16.88%) | Private 804 (47.97%) | |||||||
| 2020 | 1686 | 52.12 (51.33–52.91) | Male 1044 (61.92%) | White 1088 (67%) | 54 (3.20%) | 685,850/4 | 21.15 (19.94–22.36) | Medicare 471 (27.94%) |
| Black 123 (7.57%) | Medicaid 302 (17.91%) | |||||||
| Female 642 (38.08%) | ||||||||
| Hispanic 282 (17.36%) | Private 820 (48.64%) | |||||||
| 2021 | 1782 | 51.59 (50.85–52.33) | Male 1093 (61.34%) | White 1140 (66.55%) | 55 (3.09%) | 766,002 | 22.77 (21.45–24.10) | Medicare 453 (25.44%) |
| Black 138 (8.06%) | Medicaid 304 (17.07%) | |||||||
| Female 689 (38.66%) | ||||||||
| Hispanic 281 (16.40%) | Private 917 (51.49%) |
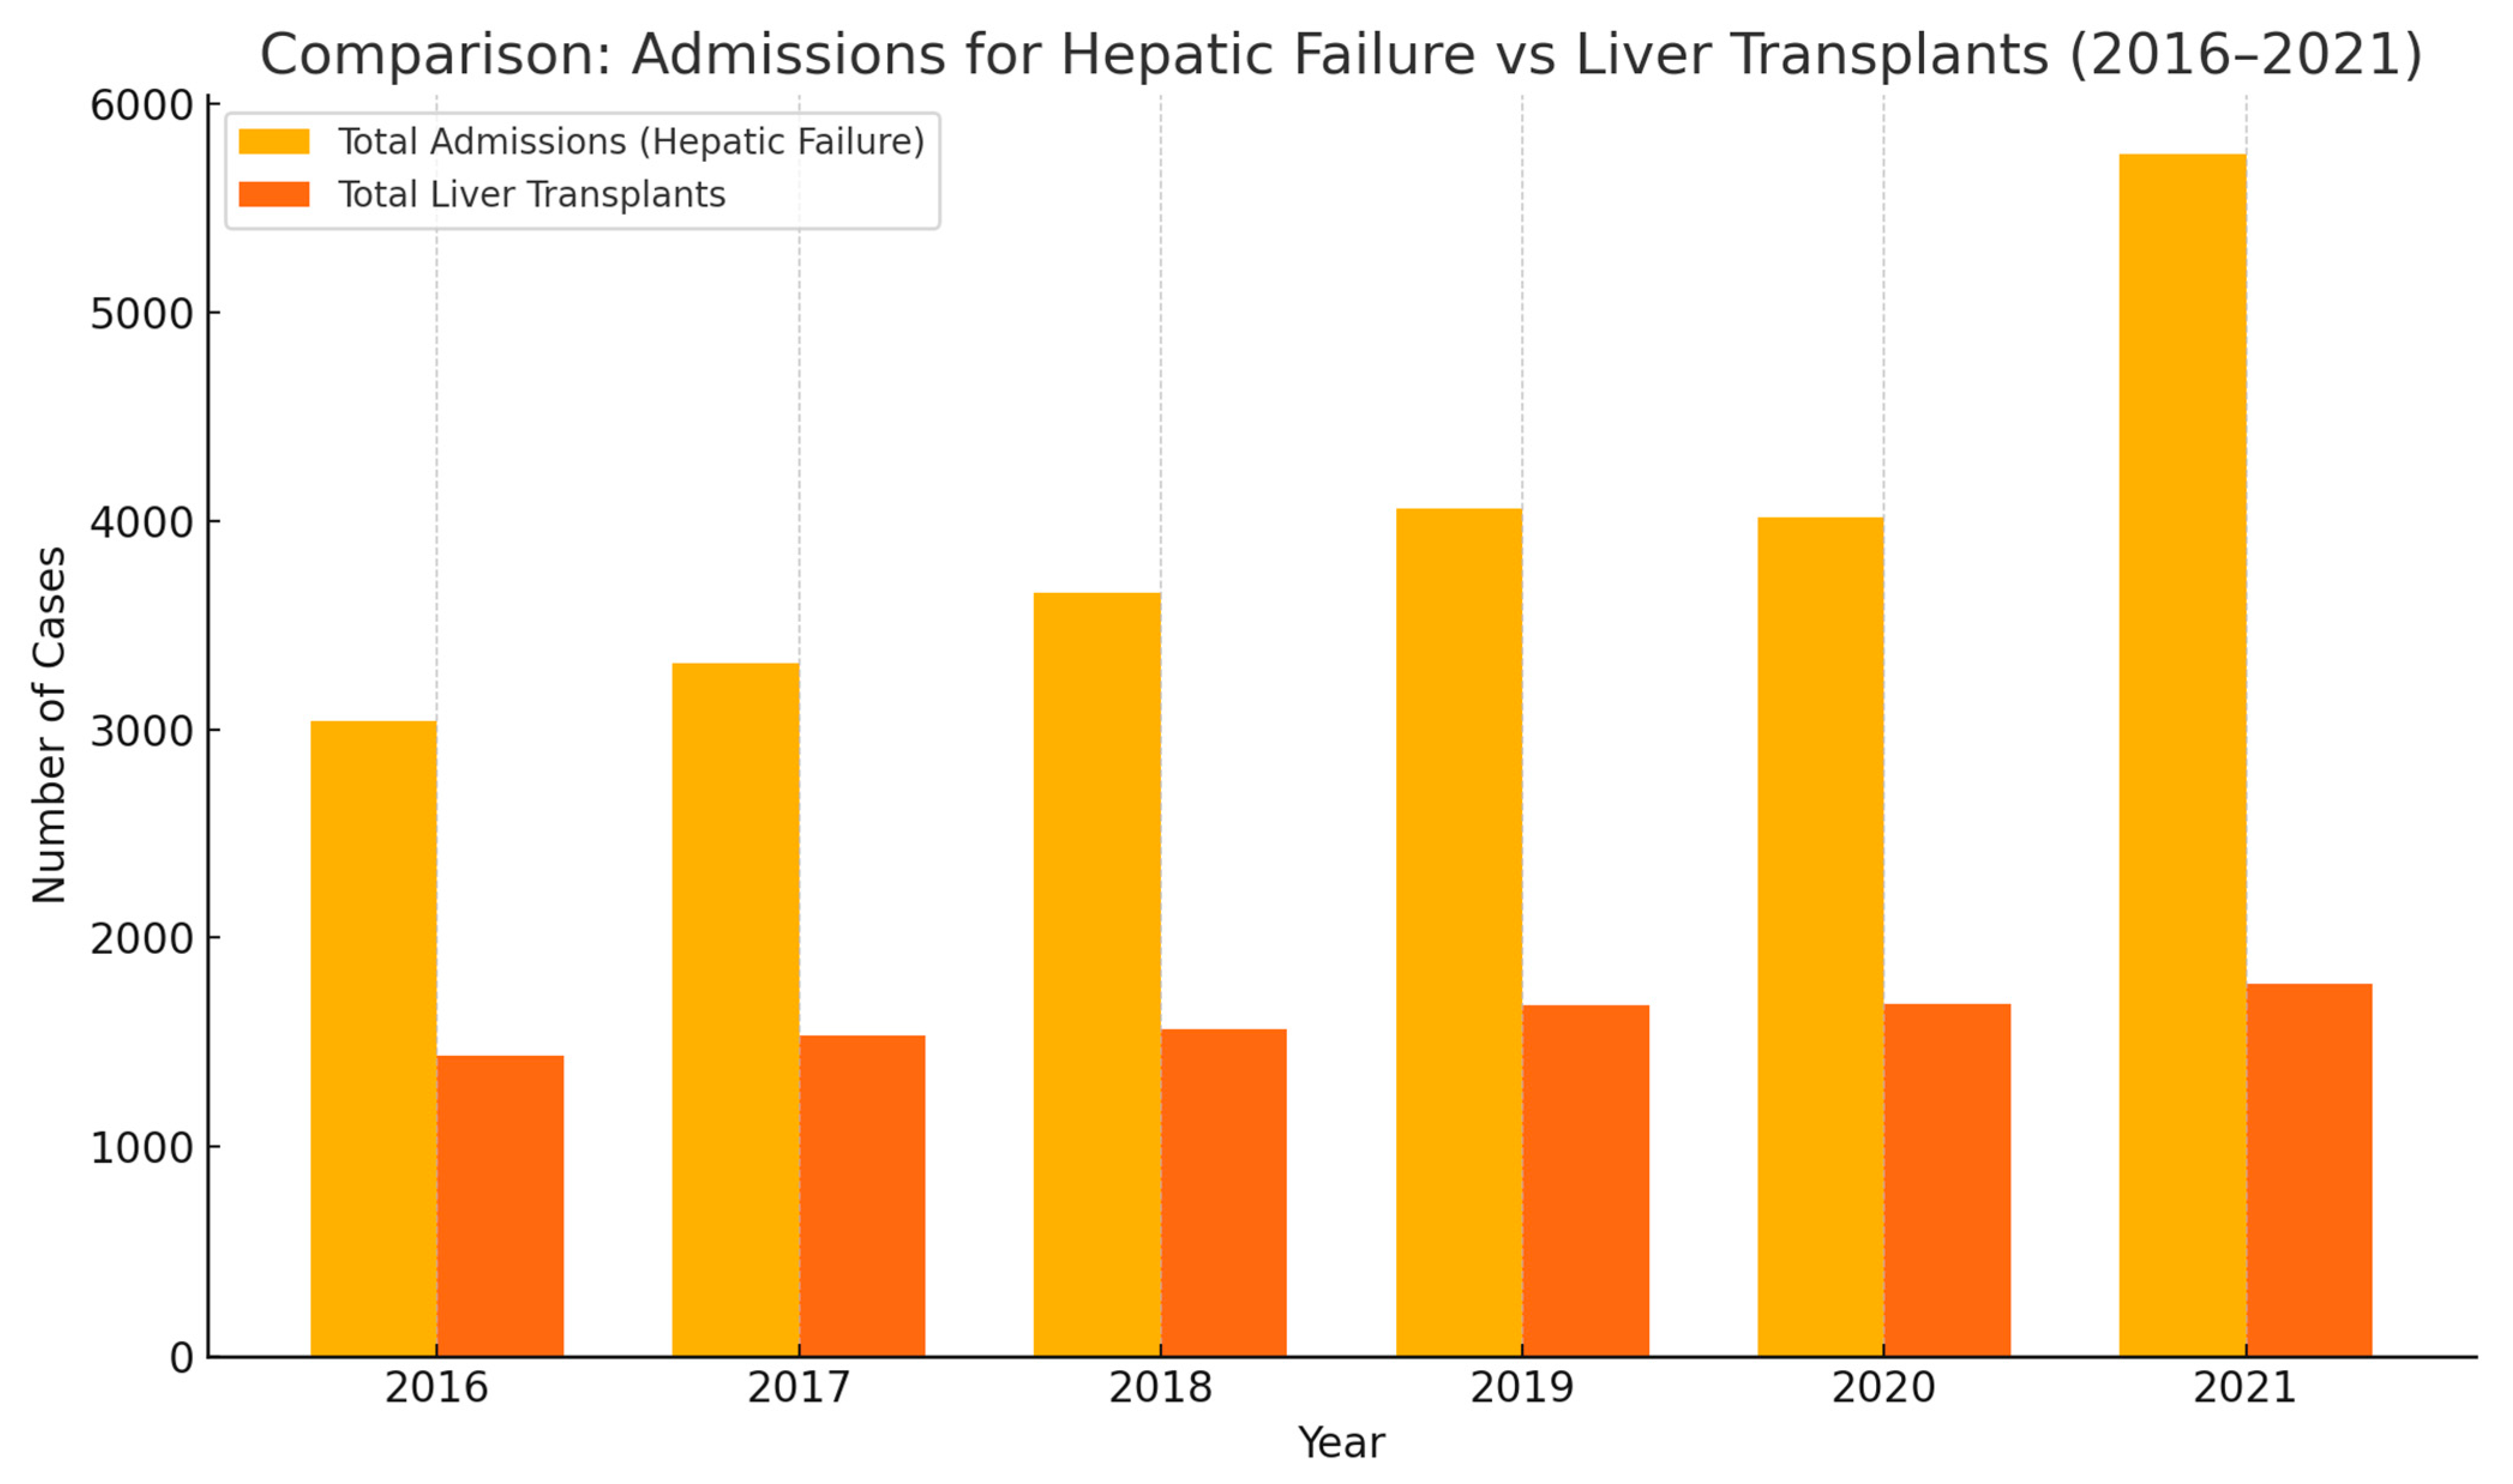
| Year | Total Number of Admissions for Hepatic Failure with and Without Coma | Total Number of Liver Transplants | Race Stratification of Total Admissions for Hepatic Failure with and Without Coma | Race Stratification of Liver Transplantations |
|---|---|---|---|---|
| 2016 | 3041 | 1437 | White 1978 (68.59%) | White 866 (68.26%) |
| Black 284 (9.85%) | Black 121 (9.24%) | |||
| Hispanic 409 (14.18%) | Hispanic 202 (15.42%) | |||
| 2017 | 3316 | 1535 | White 2059 (64.99%) | White 946 (65.74%) |
| Black 298 (9.41%) | Black 141 (9.80%) | |||
| Hispanic 537 (16.95%) | Hispanic 204 (14.18%) | |||
| 2018 | 3653 | 1561 | White 2330 (65.39%) | White 994 (66.58%) |
| Black 335 (9.40%) | Black 129 (8.64%) | |||
| Hispanic 623 (17.49%) | Hispanic 234 (15.67%) | |||
| 2019 | 4062 | 1676 | White 2671 (67.28%) | White 1404 (68.53%) |
| Black 351 (8.84%) | Black 112 (6.95%) | |||
| Hispanic 652 (16.42%) | Hispanic 272 (16.88%) | |||
| 2020 | 4019 | 1686 | White 2541 (64.64%) | White 1088 (67%) |
| Black 386 (9.82%) | Black 123 (7.57%) | |||
| Hispanic 710 (18.06%) | Hispanic 282 (17.36%) | |||
| 2021 | 5757 | 1782 | White 3844 (66.77%) | White 1140 (66.55%) |
| Black 491 (8.53%) | Black 138 (8.06%) | |||
| Hispanic 992 (17.23%) | Hispanic 281 (16.40%) |
| Quartile | Frequency | Percent (%) | Cumulative (%) |
|---|---|---|---|
| 1 (Lowest) | 2279 | 24.06 | 24.06 |
| 2 | 2320 | 24.49 | 48.55 |
| 3 | 2475 | 26.13 | 74.68 |
| 4 (Highest) | 2399 | 25.32 | 100 |
| Total | 9473 | 100 |
| All Liver Transplants | Liver Transplants That Died During Hospital Stay After Procedure | One Way ANOVA (p-Value) | |
|---|---|---|---|
| Mean Age | 51.91 (51.57–52.24) | 52.28 (50.28–54.27) | 0.15 |
| Sex | Male: 6039 Female: 3638 | Male: 177 Female: 113 | 0.24 |
| Race | White: 6140 Black: 764 Hispanic: 1475 | White: 166 Black: 30 Hispanic: 47 | 0.23 |
| Median Household Income | 1st Quartile: 2279 2nd Quartile: 2320 3rd Quartile: 2475 4th Quartile: 2399 | 1st Quartile: 76 2nd Quartile: 72 3rd Quartile: 68 4th Quartile: 64 | 0.13 |
| Charlson Comorbidity Index > 5 | 812 (48.56%) | 22 (45.83%) | 0.154 |
Disclaimer/Publisher’s Note: The statements, opinions and data contained in all publications are solely those of the individual author(s) and contributor(s) and not of MDPI and/or the editor(s). MDPI and/or the editor(s) disclaim responsibility for any injury to people or property resulting from any ideas, methods, instructions or products referred to in the content. |
© 2025 by the authors. Licensee MDPI, Basel, Switzerland. This article is an open access article distributed under the terms and conditions of the Creative Commons Attribution (CC BY) license (https://creativecommons.org/licenses/by/4.0/).
Share and Cite
Nagesh, V.K.; Varughese, V.J.; Basta, M.; Martinez, E.; Badam, S.; Shobana, L.S.; Mohamed, A.; J, A.; Weissman, S.; Atoot, A. Trends and Disparities in Liver Transplantation in the United States: A Nationwide Analysis of Demographic, Clinical, and Socioeconomic Factors (2016–2021). Med. Sci. 2025, 13, 66. https://doi.org/10.3390/medsci13020066
Nagesh VK, Varughese VJ, Basta M, Martinez E, Badam S, Shobana LS, Mohamed A, J A, Weissman S, Atoot A. Trends and Disparities in Liver Transplantation in the United States: A Nationwide Analysis of Demographic, Clinical, and Socioeconomic Factors (2016–2021). Medical Sciences. 2025; 13(2):66. https://doi.org/10.3390/medsci13020066
Chicago/Turabian StyleNagesh, Vignesh Krishnan, Vivek Joseph Varughese, Marina Basta, Emelyn Martinez, Shruthi Badam, Lokaesh Subramani Shobana, Abdifitah Mohamed, Alin J, Simcha Weissman, and Adam Atoot. 2025. "Trends and Disparities in Liver Transplantation in the United States: A Nationwide Analysis of Demographic, Clinical, and Socioeconomic Factors (2016–2021)" Medical Sciences 13, no. 2: 66. https://doi.org/10.3390/medsci13020066
APA StyleNagesh, V. K., Varughese, V. J., Basta, M., Martinez, E., Badam, S., Shobana, L. S., Mohamed, A., J, A., Weissman, S., & Atoot, A. (2025). Trends and Disparities in Liver Transplantation in the United States: A Nationwide Analysis of Demographic, Clinical, and Socioeconomic Factors (2016–2021). Medical Sciences, 13(2), 66. https://doi.org/10.3390/medsci13020066