
Population Risk Factors for Severe Disease and Mortality in COVID-19 in the United States during the Pre-Vaccine Era: A Retrospective Cohort Study of National Inpatient Sample

 ,
,  , , ,
, , ,
Abstract
1. Introduction
2. Materials and Methods
2.1. Data Source
2.2. Data Selection
2.3. Outcomes
2.4. Definition of Variables
2.5. Statistical Analysis
3. Results
3.1. Distribution of Risk Factors among Varying Severities of COVID-19
3.2. Risk Factors for Severe Complications in COVID-19
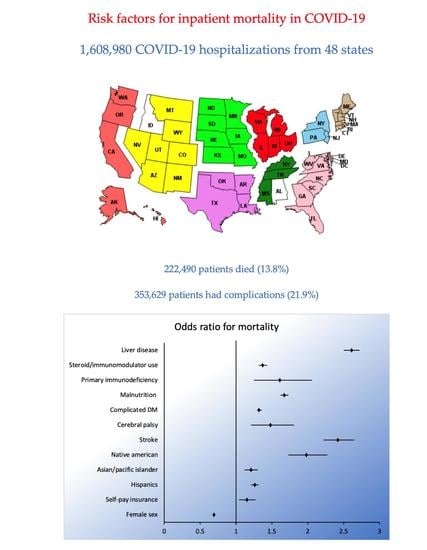
3.3. Risk Factors for Mortality in COVID-19
4. Discussion
5. Limitations
6. Conclusions
Supplementary Materials
Author Contributions
Funding
Institutional Review Board Statement
Informed Consent Statement
Data Availability Statement
Acknowledgments
Conflicts of Interest
References
- Zhu, N.; Zhang, D.; Wang, W.; Li, X.; Yang, B.; Song, J.; Zhao, X.; Huang, B.; Shi, W.; Lu, R.; et al. A Novel Coronavirus from Patients with Pneumonia in China, 2019. N. Engl. J. Med. 2020, 382, 727–733. [Google Scholar] [CrossRef] [PubMed]
- Wu, Z.; McGoogan, J.M. Characteristics of and Important Lessons From the Coronavirus Disease 2019 (COVID-19) Outbreak in China: Summary of a Report of 72314 Cases From the Chinese Center for Disease Control and Prevention. JAMA 2020, 323, 1239–1242. [Google Scholar] [CrossRef] [PubMed]
- World Health Organization. Coronavirus Disease (COVID-19) Weekly Epidemiological Update and Weekly Operational Update. Available online: https://www.who.int/emergencies/diseases/novel-coronavirus-2019/situation-reports (accessed on 10 October 2022).
- Li, J.; Huang, D.Q.; Zou, B.; Yang, H.; Hui, W.Z.; Rui, F.; Yee, N.T.S.; Liu, C.; Nerurkar, S.N.; Kai, J.C.Y.; et al. Epidemiology of COVID-19: A systematic review and meta-analysis of clinical characteristics, risk factors, and outcomes. J. Med. Virol. 2021, 93, 1449–1458. [Google Scholar] [CrossRef] [PubMed]
- Henry, B.M.; Lippi, G. Chronic kidney disease is associated with severe coronavirus disease 2019 (COVID-19) infection. Int. Urol. Nephrol. 2020, 52, 1193–1194. [Google Scholar] [CrossRef] [PubMed]
- Du, R.-H.; Liang, L.-R.; Yang, C.-Q.; Wang, W.; Cao, T.-Z.; Li, M.; Guo, G.-Y.; Du, J.; Zheng, C.-L.; Zhu, Q.; et al. Predictors of mortality for patients with COVID-19 pneumonia caused by SARS-CoV-2: A prospective cohort study. Eur. Respir. J. 2020, 55, 2000524. [Google Scholar] [CrossRef]
- Richardson, S.; Hirsch, J.S.; Narasimhan, M.; Crawford, J.M.; McGinn, T.; Davidson, K.W.; the Northwell COVID-19 Research Consortium. Presenting Characteristics, Comorbidities, and Outcomes Among 5700 Patients Hospitalized With COVID-19 in the New York City Area. JAMA 2020, 323, 2052–2059. [Google Scholar] [CrossRef]
- Weber, G.M.; Zhang, H.G.; L’Yi, S.; Bonzel, C.-L.; Hong, C.; Avillach, P.; Gutiérrez-Sacristán, A.; Palmer, N.P.; Tan, A.L.M.; Wang, X.; et al. International Changes in COVID-19 Clinical Trajectories Across 315 Hospitals and 6 Countries: Retrospective Cohort Study. J. Med. Internet Res. 2021, 23, e31400. [Google Scholar] [CrossRef]
- National (Nationwide) Inpatient Sample (NIS). Overview of the National (Nationwide) Inpatient Sample (NIS). Available online: https://www.hcup-us.ahrq.gov/nisoverview.jsp (accessed on 25 November 2022).
- Garg, S.; Patel, M.K.; Pham, M.H.; Whitaker, M.M.; O’Halloran, A.; Milucky, M.J.; Anglin, M.O.; Kirley, M.P.D.; Reingold, A.; Kawasaki, M.B.; et al. Clinical Trends Among U.S. Adults Hospitalized With COVID-19, March to December 2020: A Cross-Sectional Study. Ann. Intern. Med. 2021, 174, 1409–1419. [Google Scholar] [CrossRef]
- Williamson, E.J.; Walker, A.J.; Bhaskaran, K.; Bacon, S.; Bates, C.; Morton, C.E.; Curtis, H.J.; Mehrkar, A.; Evans, D.; Inglesby, P.; et al. Factors associated with COVID-19-related death using OpenSAFELY. Nature 2020, 584, 430–436. [Google Scholar] [CrossRef]
- Moon, A.M.; Webb, G.J.; Aloman, C.; Armstrong, M.J.; Cargill, T.; Dhanasekaran, R.; Genescà, J.; Gill, U.S.; James, T.W.; Jones, P.D.; et al. High mortality rates for SARS-CoV-2 infection in patients with pre-existing chronic liver disease and cirrhosis: Preliminary results from an international registry. J. Hepatol. 2020, 73, 705–708. [Google Scholar] [CrossRef]
- Goronzy, J.; Gustafson, C.; Weyand, C. Immune Deficiencies at the Extremes of Age. In Clinical Immunology; Elsevier: Amsterdam, The Netherlands, 2019; pp. 535–543. [Google Scholar] [CrossRef]
- Gao, Y.-D.; Ding, M.; Dong, X.; Zhang, J.-J.; Azkur, A.K.; Azkur, D.; Gan, H.; Sun, Y.-L.; Fu, W.; Li, W.; et al. Risk factors for severe and critically ill COVID-19 patients: A review. Allergy 2021, 76, 428–455. [Google Scholar] [CrossRef] [PubMed]
- Gebhard, C.; Regitz-Zagrosek, V.; Neuhauser, H.K.; Morgan, R.; Klein, S.L. Impact of sex and gender on COVID-19 outcomes in Europe. Biol. Sex Differ. 2020, 11, 29. [Google Scholar] [CrossRef] [PubMed]
- Kragholm, K.; Andersen, M.P.; A Gerds, T.; Butt, J.H.; Østergaard, L.; Polcwiartek, C.; Phelps, M.; Andersson, C.; Gislason, G.H.; Torp-Pedersen, C.; et al. Association Between Male Sex and Outcomes of Coronavirus Disease 2019 (COVID-19)-A Danish Nationwide, Register-based Study. Clin. Infect. Dis. 2021, 73, e4025–e4030. [Google Scholar] [CrossRef] [PubMed]
- Mackey, K.; Ayers, M.C.K.; Kondo, K.K.; Saha, S.; Advani, S.M.; Young, M.S.; Spencer, D.H.; Rusek, M.; Anderson, M.J.; Veazie, M.S.; et al. Racial and Ethnic Disparities in COVID-19-Related Infections, Hospitalizations, and Deaths: A Systematic Review. Ann. Intern. Med. 2021, 174, 362–373. [Google Scholar] [CrossRef] [PubMed]
- Price-Haywood, E.G.; Burton, J.; Fort, D.; Seoane, L. Hospitalization and Mortality among Black Patients and White Patients with COVID-19. N. Engl. J. Med. 2020, 382, 2534–2543. [Google Scholar] [CrossRef]
- Kabarriti, R.; Brodin, N.P.; Maron, M.I.; Guha, C.; Kalnicki, S.; Garg, M.K.; Racine, A.D. Association of Race and Ethnicity With Comorbidities and Survival Among Patients With COVID-19 at an Urban Medical Center in New York. JAMA Netw. Open. 2020, 3, e2019795. [Google Scholar] [CrossRef]
- Muñoz-Price, L.S.; Nattinger, A.B.; Rivera, F.; Hanson, R.; Gmehlin, C.; Perez, A.; Singh, S.; Buchan, B.W.; Ledeboer, N.A.; Pezzin, L.E. Racial Disparities in Incidence and Outcomes Among Patients With COVID-19. JAMA Netw. Open. 2020, 3, e2021892. [Google Scholar] [CrossRef]
- Leggat-Barr, K.; Uchikoshi, F.; Goldman, N. COVID-19 Risk Factors and Mortality among Native Americans; Demographic Research: Rostock, Germany, 2021; Available online: https://www.demographic-research.org/volumes/vol45/39/45-39.pdf (accessed on 10 October 2022).
- Stoto, M.A.; Schlageter, S.; Kraemer, J.D. COVID-19 mortality in the United States: It’s been two Americas from the start. PLoS ONE 2022, 17, e0265053. [Google Scholar] [CrossRef]
- Isath, A.; Malik, A.; Goel, A.; Gupta, R.; Srivastav, R.; Bandyopadhyay, D. Nationwide Analysis of The Outcomes and Mortality of Hospitalized COVID-19 Patients. Curr. Probl. Cardiol. 2022, 48, 101440. [Google Scholar] [CrossRef]
- Petrilli, C.M.; Jones, S.A.; Yang, J.; Rajagopalan, H.; O’Donnell, L.; Chernyak, Y.; Tobin, K.A.; Cerfolio, R.J.; Francois, F.; Horwitz, L.I. Factors associated with hospital admission and critical illness among 5279 people with coronavirus disease 2019 in New York City: Prospective cohort study. BMJ 2020, 369, m1966. [Google Scholar] [CrossRef]
- Gansevoort, R.T.; Hilbrands, L.B. CKD is a key risk factor for COVID-19 mortality. Nat. Rev. Nephrol. 2020, 16, 705–706. [Google Scholar] [CrossRef] [PubMed]
- Centers for Disease Control and Prevention. Science Brief: Evidence Used to Update the List of Underlying Medical Conditions Associated with Higher Risk for Severe COVID-19. Available online: https://www.cdc.gov/coronavirus/2019-ncov/science/science-briefs/underlying-evidence-table.html (accessed on 10 October 2022).
- Lim, S.; Bae, J.H.; Kwon, H.S.; Nauck, M.A. COVID-19 and diabetes mellitus: From pathophysiology to clinical management. Nat. Rev. Endocrinol. 2021, 17, 11–30. [Google Scholar] [CrossRef] [PubMed]
- Wu, Z.H.; Tang, Y.; Cheng, Q. Diabetes increases the mortality of patients with COVID-19: A meta-analysis. Acta Diabetol. 2021, 58, 139–144. [Google Scholar] [CrossRef] [PubMed]
- Belani, P.; Schefflein, J.; Kihira, S.; Rigney, B.; Delman, B.; Mahmoudi, K.; Mocco, J.; Majidi, S.; Yeckley, J.; Aggarwal, A.; et al. COVID-19 Is an Independent Risk Factor for Acute Ischemic Stroke. AJNR Am. J. Neuroradiol. 2020, 41, 1361–1364. [Google Scholar] [CrossRef]
- Nagarajan, R.; Krishnamoorthy, Y.; Rajaa, S.; Hariharan, V.S. COVID-19 Severity and Mortality Among Chronic Liver Disease Patients: A Systematic Review and Meta-Analysis. Prev. Chronic Dis. 2022, 19, E53. [Google Scholar] [CrossRef] [PubMed]
- Chavez-MacGregor, M.; Lei, X.; Zhao, H.; Scheet, P.; Giordano, S.H. Evaluation of COVID-19 Mortality and Adverse Outcomes in US Patients With or Without Cancer. JAMA Oncol. 2022, 8, 69–78. [Google Scholar] [CrossRef] [PubMed]
- Ramani, V.K.; Naik, R. A narrative review of the pathophysiology of COVID-19 infection among cancer patients: Current evidence and research perspectives. Health Sci. Rep. 2021, 4, e237. [Google Scholar] [CrossRef]
- Miyashita, H.; Mikami, T.; Chopra, N.; Yamada, T.; Chernyavsky, S.; Rizk, D.; Cruz, C. Do patients with cancer have a poorer prognosis of COVID-19? An experience in New York City. Ann. Oncol. 2020, 31, 1088–1089. [Google Scholar] [CrossRef]

| Asymptomatic COVID-19 | COVID-19 Bronchitis and LRTI | COVID-19 Pneumonia | COVID-19 ARDS | |
|---|---|---|---|---|
| Age (mean) | 59.9 (59.6–60.3) | 61.8 (61.2–62.5) | 64.4 (64.2–64.6) | 64.1 (63.8–64.3) |
| Age categories | ||||
| 18–40 | 22.8 (22.1–23.4) | 15.6 (14.4–17) | 8.7 (8.5–8.9) | 6.3 (5.9–6.7) |
| 41–64 | 29 (28.6–29.4) | 35.3 (33.7–37) | 38 (37.7–38.4) | 40.9 (40.1–41.7) |
| 65 and above | 46.5 (45.8–47.2) | 46.9 (45.1–48.7) | 51.1 (50.7–51.5) | 50.1 (49.3–51) |
| Female sex | 55.3 (54.8–55.7) | 53.2 (51.4–54.9) | 45.5 (45.2–45.8) | 38.9 (38.1–39.6) |
| Primary payer | ||||
| Medicare | 48.8 (48.1–49.6) | 48.9 (47–50.8) | 51.4 (50.9–52) | 49.8 (48.8–50.8) |
| Medicaid | 20.1 (19.4–20.8) | 16.7 (15.1–18.4) | 12.3 (11.9–12.8) | 15 (14.2–15.8) |
| Private insurance | 22.5 (21.9–23) | 26.8 (25.1–28.5) | 27.6 (27.1–28.2) | 27.1 (26.1–28) |
| Self-pay | 4.2 (3.9–4.5) | 3.4 (2.7–4.2) | 3.6 (3.3–3.9) | 3.3 (2.9–3.8) |
| No charge | 0.3 (0.2–0.3) | 0.1 (0.05–0.3) | 0.2 (0.1–0.3) | 0.1 (0.1–0.2) |
| Other | 3.9 (3.6–4.2) | 3.8 (3.2–4.6) | 4.5 (4.3–4.8) | 4.5 (4.1–4.9) |
| Race | ||||
| Whites | 53.8 (52.5–55) | 50.1 (47.5–52.7) | 49.7 (48.6–50.9) | 43.3 (41.6–44.9) |
| Blacks | 20.3 (19.3–21.2) | 19.6 (18–21.2) | 18.6 (17.8–19.4) | 18.2 (17–19.4) |
| Hispanics | 18.8 (17.8–19.8) | 22.7 (20.3–25.2) | 22.5 (21.4–23.5) | 26.8 (25.2–28.4) |
| Asian or pacific islander | 2.4 (2.2–2.6) | 2.5 (2–3.1) | 3.5 (3.2–3.7) | 4.3 (3.9–4.8) |
| Native American | 0.8 (0.7–0.9) | 0.6 (0.4–1) | 1 (0.8–1.2) | 2 (1.5–2.6) |
| Others | 3.7 (3.4–4.1) | 4.3 (3.4–5.3) | 4.4 (4–4.8) | 5.2 (4.5–5.9) |
| Zip Income Quartile | ||||
| 0–25th percentile | 34.6 (33.4–35.8) | 34.1 (32–36.3) | 33.7 (32.6–34.9) | 34.2 (32.5–35.8) |
| 26th to 50th percentile | 27.4 (26.6–28.3) | 28.7 (26.9–30.5) | 26.9 (26.1–27.7) | 26.9 (25.8–28.1) |
| 51st to 75th percentile | 21.8 (21.1–22.5) | 20.6 (19.1–22.2) | 22.4 (21.6–23.1) | 22.4 (21.3–23.4) |
| 76th to 100th percentile | 16 (15.1–16.9) | 16.4 (14.8–18.2) | 16.8 (15.9–17.8) | 16.3 (15.1–17.7) |
| Hospital bed size | ||||
| Small | 23.2 (22.2–24.2) | 23.9 (21.5–26.5) | 24 (22.9–25.1) | 19.3 (17.7–21.1) |
| Medium | 27.8 (26.7–28.9) | 30.4 (27.6–33.4) | 29.4 (28.3–30.5) | 27.4 (25.3–29.5) |
| Large | 48.9 (47.6–50.2) | 45.5 (42.3–48.7) | 46.4 (45.2–47.7) | 53.2 (50.8–55.5) |
| Hospital type | ||||
| Rural | 10 (9.5–10.6) | 10.5 (9–12.2) | 8.9 (8.4–9.4) | 5.2 (4.5–6) |
| Urban non-teaching | 16.2 (15.4–17) | 21.6 (19.2–24.2) | 19.4 (18.5–20.3) | 14.1 (12.8–15.6) |
| Urban teaching | 73.6 (72.6–74.6) | 67.8 (64.9–70.5) | 71.5 (70.5–72.8) | 80.6 (79–82.1) |
| Hospital region | ||||
| Northeast | 19.7 (18.6–20.9) | 16.9 (14.2–20) | 17.8 (16.8–18.9) | 21 (19.-23.2) |
| Midwest | 23.7 (22.7–24.8) | 20.9 (18.9–23.2) | 21.5 (20.6–22.5) | 23.1 (21.2–25.1) |
| South | 40.3 (39.1–41.6) | 45.6 (42.5–48.8) | 41.4 (40.1–42.6) | 34.4 (32.3–36.6) |
| West | 16 (15.2–16.9) | 16.3 (14.3–18.5) | 19.1 (18.1–20.1) | 21.3 (19.5–23.3) |
| Hospital control | ||||
| Government, non-federal | 13.6 (12.7–14.5) | 12.4 (9.9–15.4) | 11.4 (10.7–12.1) | 12 (10.7–13.4) |
| Private, not-profit | 74 (72.9–75) | 67.8 (64.5–71) | 73 (72–74.1) | 78.3 (76.4–80) |
| Private, invest-own | 12.3 (11.6–13) | 19.6 (17.2–22.4) | 15.4 (14.6–16.3) | 9.6 (8.4–11) |
| Asymptomatic COVID-19 Percentage (95% CI) | COVID-19 Bronchitis and LRTI Percentage (95% CI) | COVID-19 Pneumonia Percentage (95% CI) | COVID-19 ARDS Percentage (95% CI) | |
|---|---|---|---|---|
| Stroke | 1.8 (1.7–1.9) | 0.7 (0.5–1.1) | 1.1 (1–1.1) | 2.9 (2.7–3.2) |
| CKD | 20.1 (19.7–20.5) | 18 (16.7–19.3) | 20.9 (20.6–21.2) | 22.7 (22–23.5) |
| All Disability * | 2.1 (2–2.2) | 1.6 (1.2–2.1) | 1.1 (1.1–1.2) | 1.5 (1.3–1.7) |
| Heart failure, cardiomyopathy and ischemic heart disease | 3 (2.9–3.1) | 2.4 (1.9–2.9) | 2.8 (2.7–2.8) | 3.5 (3.2–3.8) |
| Mood or psychotic disorders | 1.2 (1.1–1.3) | 0.6 (0.4–1) | 0.6 (0.6–0.6) | 0.6 (0.5–0.7) |
| HIV/AIDS | 0.7 (0.6–0.8) | 0.6 (0.4–0.9) | 0.5 (0.5–0.6) | 0.5 (0.4–0.6) |
| Diabetes | 33.3 (32.9–33.8) | 36.6 (35.1–38.2) | 42.1 (41.8–42.5) | 47.7 (46.8–48.5) |
| Hypertension | 58.8 (58.1–59.4) | 62.7 (60.9–64.4) | 67.1 (66.7–67.5) | 66.7 (65.7–67.6) |
| Solid cancer | 3.7 (3.5–3.9) | 2.7 (2.2–3.3) | 2.4 (2.3–2.5) | 2.1 (1.9–2.3) |
| Dyslipidemia | 35.2 (34.7–35.8) | 38.2 (36.6–39.9) | 41.6 (41.2–42.1) | 40.9 (39.9–41.9) |
| Overweight and obesity | 17.8 (17.4–18.2) | 25.1 (23.6–26.6) | 28.5 (28–29) | 35.3 (34.3–36.2) |
| Malnutrition | 14.8 (14.4–15.1) | 14.2 (12.8–15.6) | 15.9 (15.5–16.2) | 29.9 (28.8–30.9) |
| Primary immunodeficiency | 0.1 (0.08–0.1) | 0.1 (0.08–0.3) | 0.1 (0.1–0.1) | 0.2 (0.1–0.3) |
| Nicotine abuse | 9.4 (9.1–9.6) | 8.5 (7.7–9.5) | 5.3 (5.2–5.5) | 4.2 (3.9–4.5) |
| Sickle cell and thalassemia | 0.1 (0.1–0.1) | 0.08 (0.02–0.2) | 0.1 (0.09–0.1) | 0.07 (0.04–0.1) |
| Any transplant | 0.7 (0.7–0.8) | 0.5 (0.3–0.7) | 0.7 (0.7–0.8) | 0.9 (0.8–1.1) |
| Substance abuse | 4.3 (4.1–4.5) | 2.7 (2.2–3.3) | 1.6 (1.6–1.7) | 2 (1.8–2.2) |
| Tuberculosis | 0.03 (0.02–0.04) | 0.02 (0.003–0.1) | 0.01 (0.01–0.02) | 0.02 (0.01–0.06) |
| Long term steroid or immunomodulators | 8.9 (8.7–9.2) | 13.8 (12.7–15) | 14.6 (14.4–14.9) | 19.3 (18.7–20) |
| Chronic pulmonary disorders | 18.9 (18.5–19.3) | 47.8 (45.4–50.2) | 22.9 (22.6–23.2) | 22.6 (21.9–23.4) |
| Liver disease | 5.5 (5.3–5.7) | 4.8 (4.1–5.6) | 5.4 (5.3–5.5) | 10.7 (10.2–11.2) |
| Rheumatoid arthritis or collagen vascular disease | 2.6 (2.5–2.7) | 3.2 (2.6–3.8) | 3 (2.9–3.1) | 3.1 (2.9–3.4) |
| Obstructive sleep apnea | 6 (5.8–6.3) | 8.5 (7.6–9.5) | 8.8 (8.6–9.1) | 10.6 (10–11.1) |
| Mean Elixhauser comorbidity index | 3.4 (3.3–3.4) | 3.7 (3.6–3.8) | 3.8 (3.7–3.8) | 4.8 (4.7–4.8) |
| Elixhauser comorbidity index categories | ||||
| ≤3 | 53.8 (53.2–54.4) | 48.1 (46.1–50.1) | 47.8 (47.3–48.2) | 27 (26.1–28) |
| 4–6 | 35.8 (35.3–36.3) | 40.2 (38.4–42) | 40.1 (39.8–40.4) | 51.6 (50.8–52.5) |
| >6 | 10.3 (10–10.6) | 11.6 (10.5–12.8) | 12 (11.7–12.3) | 21.2 (20.3–22.1) |
| Mean length of stay | 5.8 (5.7–5.9) | 7.6 (7.2–7.9) | 8.8 (8.7–8.9) | 19.7 (19.3–20.1) |
| Mean total charge | 55,813 (54,288–57,339) | 80,833 (73,720–87,947) | 104,776 (101,927–107,625) | 325,294 (309,542–341,047) |
| Asymptomatic COVID-19 | COVID-19 Bronchitis and LRTI | COVID-19 Pneumonia | COVID-19 ARDS | |
|---|---|---|---|---|
| Severe sepsis | 2.3 (2.2–2.5) | 3.5 (2.9–4.2) | 5.5 (5.2–5.8) | 8.2 (7.6–8.8) |
| Septic shock | 2.6 (2.5–2.7) | 4.3 (3.7–5.1) | 8.8 (8.6–9) | 42.4 (41.2–43.6) |
| Acute kidney injury | 22.7 (22.3–23.1) | 21.9 (20.5–23.5) | 30.7 (30.4–31.1) | 60.2 (59.2–61.1) |
| Urinary filtration | 3.8 (3.6–4) | 3.1 (2.6–3.8) | 5.5 (5.4–5.7) | 17.1 (16.3–17.9) |
| RBC transfusion | 3.7 (3.5–3.9) | 2.9 (2.4–3.5) | 3.5 (3.3–3.7) | 10.7 (9.8–11.7) |
| Vasopressor need | 0.9 (0.8–1) | 1.4 (1–1.9) | 3.1 (2.9–3.4) | 18 (16.3–19.8) |
| Acute respiratory failure | 22.4 (21.8–23) | 40.7 (38.3–43.1) | 64.8 (64.2–65.4) | |
| BIPAP/CPAP and HFNC ^ | 1.7 (1.6–1.8) | 4.1 (3.4–4.8) | 7.7 (7.4–8.1) | 18.1 (17–19.4) |
| Mechanical Ventilation | 3.2 (3–3.3) | 6.6 (5.8–7.6) | 12.6 (12.4–12.9) | 59.5 (58.2–60.9) |
| Acute liver failure | 1 (0.9–1.1) | 0.6 (0.4–0.9) | 1.5 (1.4–1.5) | 6.5 (6.1–6.9) |
| Extracorporeal membrane oxygenation | 0.02 (0.01–0.04) | 0.2 (0.1–0.5) | 0.2 (0.2–0.2) | 2.3 (1.9–2.8) |
| Cardiac arrest | 1.1 (1.1–1.2) | 1.5 (1.1–2) | 3.2 (3–3.3) | 10.3 (9.7–10.8) |
| Composite complications * | 13.1 (12.7–13.4) | 14.7 (13.5–16) | 25 (24.7–25.4) | 78.3 (77.3–79.3) |
| Uncomplicated COVID-19 1,255,350 (1,225,394–1,285,306) | Complicated COVID-19 353,629 (343,525–363,734) | Unadjusted | Adjusted * | |||
|---|---|---|---|---|---|---|
| Proportion (95% CI) | Proportion (95% CI) | OR (95% CI) | p-Value | OR (95% CI) | p-Value | |
| Age | 62.4 (62.2–62.6) | 65.9 (65.8–66.1) | 1.01 (1.01–1.01) | 0.00 | 1.00 (1.00–1.00) | 0.00 |
| Age categories (years) | ||||||
| 18–40 | 14.2 (13.9–14.5) | 6.2 (6–6.5) | Reference | |||
| 41–64 | 35.7 (35.4–36) | 35.5 (35–35.9) | 2.25 (2.17–2.33) | 0.00 | ||
| 65 and above | 48.2 (47.7–48.7) | 55.8 (55.2–56.3) | 2.61 (2.52–2.71) | 0.00 | ||
| Female sex | 49.9 (49.7–50.2) | 41.7 (41.3–42.1) | 0.71 (0.70–0.73) | 0.72 (0.70–0.73) | 0.00 | |
| Insurance status | ||||||
| Private insurance | 48.3 (47.8–48.9) | 59.2 (58.5–59.9) | Reference | Reference | ||
| Medicare | 14.7 (14.2–15.2) | 13.6 (13–14.1) | 1.67 (1.63–1.72) | 0.00 | 1.25 (1.21–1.29) | 0.00 |
| Medicaid | 27.9 (27.4–28.4) | 20.4 (19.8–21) | 1.26 (1.22–1.31) | 0.00 | 1.10 (1.06–1.14) | 0.00 |
| Self-pay | 4 (3.7–4.3) | 2.8 (2.5–3) | 0.95 (0.89–1.01) | 0.10 | 0.90 (0.85–0.96) | 0.02 |
| No charge | 0.2 (0.2–0.4) | 0.1 (0.1–0.2) | 0.92 (0.71–1.19) | 0.54 | 0.83 (0.65–1.07) | 0.15 |
| Other | 4.6 (4.3–4.8) | 3.6 (3.3–3.9) | 1.08 (1.02–1.14) | 0.00 | 0.96 (0.90–1.02) | 0.19 |
| Race | ||||||
| Whites | 52.2 (51.3–53.3) | 45.7 (44.4–47) | Reference | Reference | ||
| Blacks | 18.2 (17.5–19) | 22 (21–23) | 1.37 (1.33–1.42) | 0.00 | 1.24 (1.19–1.28) | 0.00 |
| Hispanics | 21.2 (20.2–22.2) | 22.5 (21.4–23.7) | 1.21 (1.17–1.25) | 0.00 | 1.34 (1.29–1.39) | 0.00 |
| Asian or pacific islander | 3.1 (2.9–3.3) | 3.6 (3.3–3.9) | 1.33 (1.26–1.40) | 0.00 | 1.44 (1.36–1.52) | 0.00 |
| Native American | 0.9 (0.7–1) | 1.3 (1–1.6) | 1.65 (1.48–1.85) | 0.00 | 1.81 (1.63–2.02) | 0.00 |
| Others | 4.1 (3.8–4.5) | 4.6 (4.2–5.1) | 1.26 (1.19–1.34) | 0.00 | 1.37 (1.30–1.45) | 0.00 |
| Zip Income quartile | ||||||
| 0–25th percentile | 33.2 (32.1–34.3) | 36.9 (35.5–38.2) | Reference | Reference | ||
| 26th to 50th percentile | 27.2 (26.5–28) | 26.5 (25.6–27.3) | 0.87 (0.84–0.90) | 0.00 | 0.92 (0.89–0.95) | 0.00 |
| 51st to 75th percentile | 22.5 (21.8–23.2) | 21.3 (20.5–22.1) | 0.85 (0.82–0.88) | 0.00 | 0.87 (0.84–0.90) | 0.00 |
| 76th to 100th percentile | 16.9 (16–17.9) | 15.2 (14.3–16.2) | 0.80 (0.77–0.84) | 0.00 | 0.84 (0.80–0.87) | 0.00 |
| Hospital bed size | ||||||
| Small | 24.5 (23.5–25.6) | 21 (19.8–22.2) | Reference | Reference | ||
| Medium | 28.9 (27.9–29.9) | 29.5 (28.2–30.7) | 1.19 (1.13–1.25) | 0.00 | 1.16 (1.10–1.22) | 0.00 |
| Large | 46.5 (45.3–47.7) | 49.4 (48–50.8) | 1.24 (1.18–1.30) | 0.00 | 1.24 (1.18–1.31) | 0.00 |
| Hospital type | ||||||
| Rural | 10 (9.5–10.5) | 6.6 (6–7.2) | Reference | Reference | ||
| Urban non-teaching | 18.9 (18–19.7) | 17.4 (16.5–18.4) | 1.39 (1.29–1.50) | 0.00 | 1.34 (1.24–1.45) | 0.00 |
| Urban teaching | 71 (70.1–72) | 75.8 (74.7–76.9) | 1.61 (1.50–1.72) | 0.00 | 1.52 (1.41–1.64) | 0.00 |
| Hospital region | ||||||
| Northeast | 17.8 (16.8–18.8) | 20.4 (19.1–21.8) | Reference | Reference | ||
| Midwest | 22.6 (21.7–23.6) | 20.5 (19.3–21.6) | 0.78 (0.74–0.84) | 0.00 | 0.72 (0.67–0.77) | 0.00 |
| South | 41.4 (40.2–42.6) | 39.9 (38.6–41.3) | 0.84 (0.79–0.88) | 0.00 | 0.80 (0.75–0.85) | 0.00 |
| West | 18 (17.1–19) | 19 (17.9–20.1) | 0.91 (0.86–0.96) | 0.00 | 0.81 (0.76–0.87) | 0.00 |
| Hospital control | ||||||
| Government, non-federal | 11.9 (11.2–12.6) | 12.2 (11.4–13.2) | Reference | Reference | ||
| Private, not-profit | 73.7 (72.7–74.6) | 72 (70.7–73.2) | 0.95 (0.89–1.00) | 0.07 | 0.87 (0.82–0.93) | 0.00 |
| Private, invest-own | 14.3 (13.6–15.1) | 15.6 (14.7–16.6) | 1.06 (0.99–1.13) | 0.06 | 1.00 (0.93–1.07) | 0.96 |
| Uncomplicated COVID-19 | Complicated COVID-19 | Unadjusted | Adjusted ^ | |||
|---|---|---|---|---|---|---|
| Proportion (95% CI) | Proportion (95% CI) | OR (95% CI) | p-Value | OR (95% CI) | p-Value | |
| Stroke | 0.9 (0.9–1) | 2.5 (2.4–2.7) | 2.73 (2.56–2.91) | 0.00 | 2.48 (2.28–2.69) | 0.00 |
| Chronic kidney disease | 16.3 (16–16.5) | 36.2 (35.7–36.8) | 2.91 (2.84–2.98) | 0.00 | 1.80 (1.74–1.87) | 0.00 |
| Severe IQ disability, iodine def, downs syndrome and autism | 0.1 (0.1–0.1) | 0.1 (0.1–0.1) | 0.84 (0.66–1.07) | 0.23 | 1.02 (0.78–1.33) | 0.85 |
| ADHD * | 0.3 (0.3–0.4) | 0.1 (0.1–0.2) | 0.44 (0.36–0.53) | 0.00 | 0.72 (0.58–0.88) | 0.00 |
| Cerebral palsy | 0.3 (0.3–0.3) | 0.3 (0.2–0.3) | 1.00 (0.87–1.15) | 0.96 | 1.33 (1.13–1.56) | 0.00 |
| Paralysis | 0.5 (0.5–0.6) | 1 (0.9–1.1) | 1.90 (1.74–2.08) | 0.00 | 1.01 (0.89–1.13) | 0.88 |
| Heart failure | 13.4 (13.2–13.6) | 26.8 (26.3–27.2) | 2.35 (2.30–2.41) | 0.00 | 1.42 (1.38–1.47) | 0.00 |
| Cardiomyopathy | 2.3 (2.2–2.4) | 4.7 (4.6–4.9) | 2.10 (2.01–2.20) | 0.00 | 1.20 (1.14–1.26) | 0.00 |
| Ischemic heart disease | 16.6 (16.4–16.9) | 22.5 (22.1–22.9) | 1.45 (1.41–1.48) | 0.00 | 0.92 (0.90–0.95) | 0.00 |
| Mood or psychotic disorders | 0.8 (0.7–0.8) | 0.7 (0.6–0.8) | 0.85 (0.77–0.94) | 0.00 | 0.90 (0.81–1.01) | 0.09 |
| HIV/AIDS | 0.5 (0.5–0.6) | 0.7 (0.6–0.8) | 1.24 (1.12–1.38) | 0.00 | 0.92 (0.81–1.04) | 0.21 |
| Uncomplicated Diabetes mellitus | 15.2 (15–15.4) | 12.5 (12.2–12.9) | 0.79 (0.77–0.82) | 0.00 | 1.05 (1.02–1.08) | 0.00 |
| Complicated Diabetes mellitus | 22.4 (22.2–22.7) | 40.1 (39.6–40.6) | 2.31 (2.26–2.36) | 0.00 | 1.56 (1.52–1.60) | 0.00 |
| Uncomplicated hypertension | 40.4 (40.1–40.7) | 29.8 (29.3–30.2) | 0.62 (0.61–0.63) | 0.00 | 1.00 (0.97–1.03) | 0.72 |
| Complicated hypertension | 22.3 (22–22.6) | 44 (43.25–44.6) | 2.73 (2.67–2.79) | 0.00 | 1.20 (1.16–1.25) | 0.00 |
| Solid cancer | 2.5 (2.5–2.6) | 3.4 (3.3–3.6) | 1.34 (1.28–1.41) | 0.00 | 1.15 (1.08–1.21) | 0.00 |
| Dyslipidemia | 39.1 (38.7–39.6) | 42.7 (42.1–43.3) | 1.15 (1.13–1.18) | 0.00 | 0.83 (0.81–0.85) | 0.00 |
| Overweight and obesity | 24.9 (24.4–25.3) | 28.3 (27.7–28.9) | 1.19 (1.16–1.22) | 0.00 | 1.14 (1.10–1.17) | 0.00 |
| Malnutrition | 12.6 (12.3–12.9) | 26.3 (25.7–26.9) | 2.47 (2.40–2.54) | 0.00 | 2.26 (2.19–2.33) | 0.00 |
| Primary immunodeficiency | 0.1 (0.1–0.1) | 0.1 (0.1–0.2) | 1.50 (1.21–1.87) | 0.00 | 1.74 (1.36–2.22) | 0.00 |
| Nicotine abuse | 6.6 (6.4–6.8) | 5.7 (5.5–5.9) | 0.86 (0.83–0.89) | 0.00 | 0.82 (0.79–0.86) | 0.00 |
| Sickle cell and thalassemia | 0.1 (0.1–0.1) | 0.09 (0.07–0.1) | 0.85 (0.66–1.11) | 0.22 | 0.84 (0.63–1.22) | 0.24 |
| Any transplant | 0.7 (0.6–0.7) | 0.9 (0.8–1) | 1.32 (1.21–1.45) | 0.00 | 0.76 (0.68–0.84) | 0.00 |
| Substance abuse | 2.2 (2.2–2.3) | 2.7 (2.6–2.9) | 1.20 (1.14–1.27) | 0.00 | 1.00 (0.94–1.07) | 0.78 |
| Tuberculosis | 0.01 (0.01–0.02) | 0.03 (0.02–0.04) | 1.77 (1.05–2.99) | 0.03 | 1.29 (0.71–2.35) | 0.39 |
| Long term steroid or immunomodulators | 12.3 (12–12.5) | 16.1 (15.7–16.5) | 1.36 (1.32–1.40) | 0.00 | 1.28 (1.24–1.33) | 0.00 |
| Asthma | 8.2 (8.1–8.4) | 6.4 (6.1–6.6) | 0.75 (0.73–0.78) | 0.00 | 0.90 (0.87–0.94) | 0.00 |
| COPD $ | 1.6 (1.6–1.7) | 2.2 (2–2.3) | 1.31 (1.23–1.39) | 0.00 | 1.30 (1.21–1.39) | 0.00 |
| Cystic fibrosis | 0.02 (0.01–0.03) | 0.01 (0.01–0.03) | 0.84 (0.46–1.53) | 0.57 | 0.75 (0.37–1.52) | 0.43 |
| Other Chronic pulmonary disorders | 11.3 (11.1–11.5) | 16.3 (15.9–16.6) | 1.52 (1.48–1.56) | 0.00 | 1.21 (1.17–1.24) | 0.00 |
| Liver disease | 3.9 (3.8–4) | 10.9 (10.6–11.2) | 3.00 (2.91–3.11) | 0.00 | 2.90 (2.83–3.05) | 0.00 |
| Rheumatoid arthritis or collagen vascular disease | 2.8 (2.8–2.9) | 3 (2.8–3.1) | 1.04 (0.99–1.10) | 0.06 | 1.05 (0.99–1.10) | 0.07 |
| Obstructive sleep apnea | 7.3 (7.1–7.5) | 10.9 (10.5–11.3) | 1.54 (1.49–1.60) | 0.00 | 1.33 (1.28–1.38) | 0.00 |
| Elixhauser comorbidity index categories | ||||||
| ≤3 | 56.6 (56.1–57.1) | 23.5 (22.9–24) | Reference | |||
| 4–6 | 35.4 (35.1–35.8) | 51.6 (51.1–52.1) | 3.51 (3.41–3.60) | 0.00 | ||
| >6 | 7.8 (7.6–8) | 24.8 (24.2–25.4) | 7.60 (7.33–7.88) | 0.00 | ||
| Mean Elixhauser | 3.3 (3.3–3.3) | 5.07 (5.03–5.1) | 1.43 (1.42–1.44) | 0.00 | ||
| Survivors 1,385,330 (1,352,424–1,418,236) | Non-Survivors 222,490 (215,758–229,221) | Unadjusted | Adjusted * | |||
|---|---|---|---|---|---|---|
| Proportion (95% CI) | Proportion (95% CI) | OR (95% CI) | p-Value | OR (95% CI) | p-Value | |
| Age (continuous) | 61.7 (61.5–61.9) | 72.7 (72.5–72.9) | 1.04 (1.04–1.04) | 0.00 | 1.05 (1.04–1.05) | 0.00 |
| Age categories | ||||||
| 18–40 | 14.1 (13.8–14.4) | 2 (1.9–2.2) | Reference | 0.00 | ||
| 41–64 | 37.8 (37.5–38.1) | 22.1 (21.6–22.6) | 3.99 (3.72–4.28) | 0.00 | ||
| 65 and above | 46 (45.6–46.5) | 73.7 (73.1–74.3) | 10.9 (10.1–11.6) | 0.00 | ||
| Female sex | 49.2 (49–49.4) | 41.5 (41–42) | 0.73 (0.71–0.74) | 0.00 | 0.69 (0.68–0.71) | 0.00 |
| Insurance status | ||||||
| Private insurance | 48 (47.4–48.6) | 67.7 (66.9–68.5) | Reference | Reference | ||
| Medicare | 15.3 (14.8–15.8) | 8.9 (8.4–9.4) | 2.48 (2.38–2.58) | 0.00 | 0.97 (0.93–1.02) | 0.29 |
| Medicaid | 27.9 (27.4–28.4) | 15.8 (15.2–16.5) | 1.02 (0.97–1.08) | 0.33 | 1.09 (1.04–1.15) | 0.00 |
| Self-pay | 4 (3.7–4.3) | 2.3 (2.1–2.6) | 1.03 (0.93–1.14) | 0.47 | 1.15 (1.04–1.27) | 0.00 |
| No charge | 0.2 (0.2–0.4) | 0.1 (0.1–0.2) | 0.95 (0.69–1.32) | 0.80 | 0.82 (0.60–1.14) | 0.25 |
| Other | 4.3 (4–4.5) | 4.8 (4.4–5.3) | 1.99 (1.82–2.17) | 0.00 | 1.57 (1.44–1.70) | 0.00 |
| Race | ||||||
| Whites | 50.4 (49.3–51.5) | 53.1 (51.7–54.5) | Reference | Reference | ||
| Blacks | 19.3 (18.5–20.2) | 17.4 (16.5–18.3) | 0.85 (0.82–0.88) | 0.00 | 1.03 (0.99–1.07) | 0.12 |
| Hispanics | 21.7 (20.7–22.7) | 20.2 (19–21.4) | 0.88 (0.84–0.92) | 0.00 | 1.26 (1.21–1.31) | 0.00 |
| Asian or pacific islander | 3.1 (2.9–3.4) | 3.4 (3.1–3.8) | 1.02 (0.95–1.10) | 0.50 | 1.21 (1.12–1.30) | 0.00 |
| Native American | 0.9 (0.8–1.1) | 1.2 (1–1.5) | 1.24 (1.10–1.40) | 0.00 | 1.98 (1.73–2.27) | 0.00 |
| Others | 4.2 (3.8–4.6) | 4.5 (4–5) | 1.01 (0.94–1.09) | 0.66 | 1.27 (1.19–1.36) | 0.00 |
| Zip Income quartile | ||||||
| 0–25th percentile | 33.7 (32.6–34.9) | 35.4 (34.1–36.8) | Reference | Reference | ||
| 26th to 50th percentile | 27.9 (26.4–27.9) | 26.7 (25.7–27.6) | 0.93 (0.90–0.97) | 0.00 | 0.89 (0.85–0.92) | 0.00 |
| 51st to 75th percentile | 22.4 (21.7–23.1) | 21.2 (20.3–22.1) | 0.90 (0.86–0.94) | 0.00 | 0.82 (0.78–0.85) | 0.00 |
| 76th to 100th percentile | 16.6 (15.7–17.5) | 16.5 (15.4–17.6) | 0.94 (0.90–0.99) | 0.03 | 0.78 (0.74–0.82) | 0.00 |
| Hospital bed size | ||||||
| Small | 24 (23–25.1) | 22.2 (20.9–23.5) | Reference | Reference | ||
| Medium | 28.7 (27.8–29.8) | 30.5 (29.2–31.9) | 1.14 (1.08–1.21) | 0.00 | 1.13 (1.07–1.20) | 0.00 |
| Large | 47.1 (45.9–48.3) | 47.2 (45.7–48.7) | 1.08 (1.03–1.14) | 0.00 | 1.14 (1.08–1.20) | 0.00 |
| Hospital type | ||||||
| Rural | 9.5 (9–10) | 7.8 (7.2–8.4) | Reference | Reference | ||
| Urban non-teaching | 18.7 (17.9–19.5) | 17.7 (16.7–18.7) | 1.15 (1.07–1.22) | 0.00 | 1.25 (1.16–1.34) | 0.00 |
| Urban teaching | 71.7 (70.8–72.6) | 74.4 (73.2–75.5) | 1.26 (1.19–1.33) | 0.00 | 1.38 (1.29–1.47) | 0.00 |
| Hospital region | ||||||
| Northeast | 17.6 (16.6–18.6) | 23 (21.5–24.5) | Reference | Reference | ||
| Midwest | 22.5 (21.5–23.4) | 20.2 (19.1–21.3) | 0.68 (0.64–0.73) | 0.00 | 0.65 (0.60–0.69) | 0.00 |
| South | 41.5 (40.4–42.7) | 38.3 (36.9–39.8) | 0.70 (0.66–0.75) | 0.00 | 0.70 (0.66–0.75) | 0.00 |
| West | 18.2 (17.3–19.2) | 18.3 (17.2–19.5) | 0.76 (0.71–0.82) | 0.00 | 0.76 (0.71–0.82) | 0.00 |
| Hospital control | ||||||
| Government, non-federal | 12 (11.3–12.7) | 11.9 (11–12.9) | Reference | Reference | ||
| Private, not-profit | 73.3 (72.4–74.3) | 72.9 (71.6–74.2) | 1.00 (0.93–1.06) | 0.94 | 0.88 (0.83–0.94) | 0.00 |
| Private, invest-own | 14.5 (13.8–15.3) | 15 (14–16.1) | 1.04 (0.96–1.12) | 0.28 | 0.92 (0.85–0.99) | 0.04 |
| Survivors | Non-Survivors | Unadjusted | Adjusted & | |||
|---|---|---|---|---|---|---|
| Proportion (95% CI) | Proportion (95% CI) | OR (95% CI) | p-Value | OR (95% CI) | p-Value | |
| Stroke | 1 (1–1) | 2.9 (2.7–3.1) | 2.84 (2.65–3.04) | 0.00 | 2.42 (2.22–2.65) | 0.00 |
| CKD | 18.7 (18.5–19) | 32.7 (32.1–33.3) | 2.10 (2.05–2.15) | 0.00 | 1.19 (1.14–1.24) | 0.00 |
| Severe IQ disability, iodine def, downs syndrome and autism | 0.1 (0.1–0.1) | 0.1 (0.09–0.1) | 0.86 (0.65–1.15) | 0.31 | 1.31 (0.97–1.78) | 0.07 |
| ADHD | 0.3 (0.3–0.3) | 0.07 (0.05–0.1) | 0.20 (0.14–0.29) | 0.00 | 0.68 (0.48–0.97) | 0.03 |
| Cerebral palsy | 0.3 (0.3–0.3) | 0.2 (0.2–0.3) | 0.84 (0.70–1.00) | 0.00 | 1.48 (1.21–1.81) | 0.00 |
| Paralysis | 0.6 (0.5–0.6) | 1.1 (1–1.2) | 1.85 (1.67–2.05) | 0.00 | 0.95 (0.83–1.09) | 0.53 |
| Heart failure | 14.6 (14.4–14.8) | 27.2 (26.7–27.8) | 2.18 (2.12–2.24) | 0.00 | 1.25 (1.20–1.30) | 0.00 |
| Cardiomyopathy | 2.6 (2.5–2.7) | 4.2 (4–4.5) | 1.65 (1.56–1.73) | 0.00 | 1.12 (1.05–1.18) | 0.00 |
| Ischemic heart disease | 16.8 (16.5–17.1) | 25 (24.4–25.5) | 1.64 (1.60–1.68) | 0.00 | 0.97 (0.94–1.00) | 0.09 |
| Mood or psychotic disorders | 0.8 (0.8–0.9) | 0.5 (0.4–0.6) | 0.63 (0.55–0.72) | 0.00 | 0.68 (0.59–0.80) | 0.00 |
| HIV/AIDS | 0.6 (0.5–0.6) | 0.5 (0.4–0.6) | 0.86 (0.73–1.01) | 0.10 | 0.93 (0.78–1.11) | 0.43 |
| Uncomplicated Diabetes mellitus | 14.8 (14.6–15) | 13.8 (13.4–14.2) | 0.92 (0.89–0.95) | 0.00 | 1.11 (1.07–1.15) | 0.00 |
| Complicated Diabetes mellitus | 24.9 (24.7–25.2) | 35 (34.4–35.6) | 1.62 (1.58–1.66) | 0.00 | 1.32 (1.29–1.36) | 0.00 |
| Uncomplicated Hypertension | 39 (38.7–39.3) | 31.9 (31.3–32.5) | 0.73 (0.71–0.75) | 0.00 | 0.79 (0.76–0.82) | 0.00 |
| Complicated Hypertension | 24.7 (24.4–25) | 41.8 (41.2–42.5) | 2.19 (2.13–2.24) | 0.00 | 0.94 (0.90–0.98) | 0.01 |
| Solid cancer | 2.5 (2.4–2.6) | 4.1 (3.9–4.3) | 1.63 (1.54–1.72) | 0.00 | 1.22 (1.15–1.30) | 0.00 |
| Dyslipidemia | 39.4 (39–39.8) | 43.1 (42.4–43.8) | 1.16 (1.13–1.19) | 0.00 | 0.78 (0.76–0.80) | 0.00 |
| Overweight and obesity | 26.3 (25.8–26.7) | 21.7 (21.1–22.3) | 0.77 (0.75–0.80) | 0.00 | 1.07 (1.03–1.11) | 0.00 |
| Malnutrition | 14 (13.7–14.3) | 25.4 (24.7–26) | 2.08 (2.03–2.14) | 0.00 | 1.67 (1.62–1.73) | 0.00 |
| Primary immunodeficiency | 0.1 (0.1–0.1) | 0.1 (0.1–0.2) | 1.32 (1.04–1.67) | 0.03 | 1.61 (1.25–2.06) | 0.00 |
| Nicotine abuse | 6.8 (6.6–7) | 3.9 (3.7–4.1) | 0.56 (0.53–0.59) | 0.00 | 0.68 (0.64–0.72) | 0.00 |
| Sickle cell and thalassemia | 0.1 (0.1–0.1) | 0.05 (0.03–0.08) | 0.44 (0.29–0.67) | 0.00 | 0.52 (0.34–0.81) | 0.00 |
| Any transplant | 0.7 (0.7–0.8) | 0.8 (0.7–0.9) | 1.06 (0.94–1.19) | 0.30 | 0.95 (0.83–1.08) | 0.44 |
| Substance abuse | 2.4 (2.3–2.5) | 1.8 (1.7–2) | 0.75 (0.69–0.80) | 0.00 | 0.81 (0.74–0.88) | 0.00 |
| Tuberculosis | 0.01 (0.01–0.02) | 0.02 (0.01–0.05) | 1.52 (0.84–2.77) | 0.16 | 1.45 (0.71–2.92) | 0.29 |
| Long term steroid or immunomodulators | 13.3 (13–13.5) | 12.2 (11.8–12.6) | 0.91 (0.88–0.94) | 0.00 | 1.37 (1.32–1.43) | 0.00 |
| Asthma | 8.3 (8.2–8.5) | 4.6 (4.4–4.8) | 0.53 (0.50–0.55) | 0.00 | 0.81 (0.77–0.85) | 0.00 |
| COPD | 1.6 (1.6–1.7) | 2.5 (2.3–2.7) | 1.52 (1.42–1.62) | 0.00 | 1.27 (1.18–1.37) | 0.00 |
| Cystic fibrosis | 0.02 (0.01–0.02) | 0.02 (0.01–0.04) | 0.98 (0.51–1.89) | 0.97 | 1.87 (0.92–3.81) | 0.08 |
| Other Chronic pulmonary disorders | 11.5 (11.3–11.7) | 18.1 (17.7–18.6) | 1.70 (1.65–1.75) | 0.00 | 1.20 (1.17–1.24) | 0.00 |
| Liver disease | 4.7 (4.6–4.8) | 9.8 (9.5–10.2) | 2.19 (2.11–2.27) | 0.00 | 2.61 (2.50–2.72) | 0.00 |
| Rheumatoid arthritis or collagen vascular disease | 2.8 (2.8–2.9) | 3.1 (3–3.3) | 1.10 (1.04–1.17) | 0.00 | 1.10 (1.03–1.18) | 0.00 |
| Obstructive sleep apnea | 8.2 (8–8.4) | 7.5 (7.2–7.8) | 0.91 (0.87–0.94) | 0.00 | 0.89 (0.85–0.93) | 0.00 |
| Elixhauser comorbidity index categories | ||||||
| ≤3 | 53.3 (52.9–53.8) | 24.4 (23.8–25.1) | Reference | |||
| 4–6 | 37 (36.7–37.3) | 51.2 (50.6–51.8) | 3.01 (2.91–3.11) | 0.00 | ||
| >6 | 9.5 (9.3–9.7) | 24.2 (23.6–24.9) | 5.52 (5.29–5.76) | 0.00 | ||
| Elixhauser comorbidity index (numerical scale) | 3.5 (3.4–3.5) | 5 (4.9–5) | 1.34 (1.33–1.35) | 0.00 | ||
| Severe sepsis | 4.1 (3.9–4.3) | 8.1 (7.7–8.6) | 2.06 (1.96–2.17) | 0.00 | ||
| Septic shock | 3 (2.9–3.1) | 33.7 (32.9–34.5) | 16.4 (15.8–17) | 0.00 | ||
| Acute kidney injury | 23.2 (22.9–23.5) | 62.1 (61.5–62.8) | 5.40 (5.25–5.56) | 0.00 | ||
| Urinary filtration | 3.6 (3.5–3.7) | 14.5 (14–15) | 4.52 (4.33–4.71) | 0.00 | ||
| RBC transfusion | 2.7 (2.5–2.8) | 9.1 (8.6–9.6) | 3.58 (3.41–3.75) | 0.00 | ||
| Vasopressor need | 1 (0.9–1.1) | 12.2 (11.3–13.2) | 13.1 (12.2–14) | 0.00 | ||
| Acute respiratory failure | 50.4 (49.9–51) | 71.2 (70.2–72) | 2.42 (2.31–2.53) | 0.00 | ||
| BIPAP/CPAP and HFNC ^ | 4.1 (3.9–4.3) | 18.4 (17.6–19.4) | 5.21 (4.99–5.45) | 0.00 | ||
| Mechanical Ventilation | 4.1 (4–4.3) | 47.8 (47–48.7) | 21 (20.1–21.9) | 0.00 | ||
| Acute liver failure | 0.6 (0.5–0.6) | 6.2 (6–6.5) | 10.8 (10.2–11.6) | 0.00 | ||
| Extracorporeal membrane oxygenation | 0.1 (0.08–0.1) | 0.7 (0.6–0.9) | 7.38 (6.17–8.84) | 0.00 | ||
| Cardiac arrest | 0.3 (0.3–0.3) | 17.2 (16.6–17.8) | 57.9 (53.4–62.7) | 0.00 | ||
| Composite complications * | 14 (13.7–14.3) | 71.3 (70.5–72) | 15.1 (14.6–15.7) | 0.00 | ||
Publisher’s Note: MDPI stays neutral with regard to jurisdictional claims in published maps and institutional affiliations. |
© 2022 by the authors. Licensee MDPI, Basel, Switzerland. This article is an open access article distributed under the terms and conditions of the Creative Commons Attribution (CC BY) license (https://creativecommons.org/licenses/by/4.0/).
Share and Cite
Raj, K.; Yeruva, K.; Jyotheeswara Pillai, K.; Kumar, P.; Agrawal, A.; Chandna, S.; Khuttan, A.; Tripathi, S.; Akella, R.; Gudi, T.R.; et al. Population Risk Factors for Severe Disease and Mortality in COVID-19 in the United States during the Pre-Vaccine Era: A Retrospective Cohort Study of National Inpatient Sample. Med. Sci. 2022, 10, 67. https://doi.org/10.3390/medsci10040067
Raj K, Yeruva K, Jyotheeswara Pillai K, Kumar P, Agrawal A, Chandna S, Khuttan A, Tripathi S, Akella R, Gudi TR, et al. Population Risk Factors for Severe Disease and Mortality in COVID-19 in the United States during the Pre-Vaccine Era: A Retrospective Cohort Study of National Inpatient Sample. Medical Sciences. 2022; 10(4):67. https://doi.org/10.3390/medsci10040067
Chicago/Turabian StyleRaj, Kavin, Karthik Yeruva, Keerthana Jyotheeswara Pillai, Preetham Kumar, Ankit Agrawal, Sanya Chandna, Akhilesh Khuttan, Shalini Tripathi, Ramya Akella, Thulasi Ram Gudi, and et al. 2022. "Population Risk Factors for Severe Disease and Mortality in COVID-19 in the United States during the Pre-Vaccine Era: A Retrospective Cohort Study of National Inpatient Sample" Medical Sciences 10, no. 4: 67. https://doi.org/10.3390/medsci10040067
APA StyleRaj, K., Yeruva, K., Jyotheeswara Pillai, K., Kumar, P., Agrawal, A., Chandna, S., Khuttan, A., Tripathi, S., Akella, R., Gudi, T. R., Watts, A., Toquica Gahona, C. C., Bhagat, U., Aedma, S. K., Jalal, A. T., Ganti, S., Varadarajan, P., & Pai, R. G. (2022). Population Risk Factors for Severe Disease and Mortality in COVID-19 in the United States during the Pre-Vaccine Era: A Retrospective Cohort Study of National Inpatient Sample. Medical Sciences, 10(4), 67. https://doi.org/10.3390/medsci10040067