Abstract
Many studies demonstrated the coexistence of subaqueous permafrost and gas hydrate. Subaqueous permafrost could be a factor affecting the formation/dissociation of gas hydrate. Here, we propose a simple empirical approach that allows estimating the steady-state conditions for gas hydrate stability in the presence of subaqueous permafrost. This approach was derived for pressure, temperature, and salinity conditions typical of subaqueous permafrost in marine (brine) and lacustrine (freshwater) environments.
1. Introduction
Gas hydrate is a naturally occurring “ice-like” material of water molecules containing gas that forms at high pressure and low temperature, and it is present worldwide in permafrost regions (e.g., References [1,2]) and in marine sediments of outer continental margins [3,4,5], as well as beneath ice sheets [6,7]. Methane hydrates make up to 80% of the total inventory of gas hydrates [8]. This locked methane could be a potential future energy resource, and field experiments suggest that it may be produced with existing conventional oil and gas production technology [9,10,11,12,13]. At present, ocean warming-induced hydrate dissociation may be occurring in permafrost regions and in shallow marine sediments in polar continental margins (e.g., References [5,14,15]), as well as in ice sheets that stored methane in hydrate form during the last glaciation [6,7]. A significant release of methane from dissociated gas hydrate could create a positive feedback loop of warming [16,17], as suggested for past hyperthermal events such as the Paleocene Eocene Thermal Maximum (e.g., Reference [18]).
Permafrost is defined as the ground that remains at or below 0 °C for more than two years; its extent reaches about 20% of the land of the Earth [1]. Over half of Canada and Russia, most of Alaska, and northeast China are underlain by permafrost. Climate is one of the main drivers for permafrost distribution [1]; note that heat flow within permafrost is mainly due to conduction, because most of the pore fluid is in a solid state even if the presence of unfrozen fluid affects mass redistribution with temperature and pressure changes. A way to indirectly understand if the permafrost constitutes fully frozen bearing sediments, i.e., not unfrozen fluid, is to determine if the temperature remains almost constant with depth. The thickness of permafrost is mainly controlled by the geothermal heat flow and by the lithology [1]. As reported by several authors, gas hydrate can exist below permafrost, but also within it (Reference [19] and references therein), due to the temperature and pressure conditions favorable to its stability sustained by the presence of permafrost (e.g., References [20,21]).
If the surface temperature increases due to climate change, gas hydrate could dissociate, releasing large quantities of methane into the atmosphere [8]. In addition, during warm periods, the sea level increases and the permafrost slowly degrades beneath warm and salty water. The subaqueous permafrost (SAP) in marine and lacustrine environments differs from onshore permafrost because it is generally relict, warmer, and degrading (e.g., Reference [1]); however, several tens of thousands of years are necessary to melt it. Presently, SAP exists both in marine (e.g., Reference [22] and references therein) and lacustrine [23,24,25,26] environments, as confirmed by drilling (e.g., Reference [22]), and there is increasing interest in better understanding its response to changes in climate as indicated by several studies [22,27,28,29,30,31,32]. The most studied SAP is located in the Arctic shelf, and several authors (e.g., References [1,3,4,5,27,29]) suggested that the SAP thickness could reach locally 1000 m with coexistence of fully frozen and unfrozen fluid-bearing sediments. Note that the integration of sophisticated data acquisition techniques is required to detect the presence of SAP, but the extreme environmental conditions hinder the acquisition of data and, thus, the mapping of SAP thickness and distribution [33]. Cleary, this topic remains a challenge for the scientific and industrial communities, and modeling offers a useful alternative to overcome the lack of data [34,35,36,37].
Hydrate located in SAP is considered only a small fraction of the global hydrate inventory, but it is suggested to be a highly susceptible reservoir to the effects of global warming [38,39,40]. Clearly, degradation of SAP and the consequent destabilization of gas hydrate could increase the flux of methane to the ocean and, perhaps, to the atmosphere. Some authors [4,31] suggested that SAP-associated gas hydrate deposits are present at water depths of ~120–130 m. Generally, permafrost is composed of fully frozen bearing sediments for water depths of less than 60 m and both frozen and unfrozen fluid-bearing sediments for greater water depths [22,41]. Sub-aerial emergence of portions of the Arctic continental shelf over repeated Pleistocene glaciations exposed the shelf to temperature conditions, which favored the formation of permafrost and gas hydrate. After the Last Glacial Maximum (~19 ka), coastal inundation from sea-level rise [42,43] thawed the SAP across the Arctic (e.g., References [30,38]). Thus, some authors [44,45] suggested that “relict” permafrost and gas hydrate may exist on the continental shelf of the Arctic Ocean, even if a limited number of direct measurements of permafrost occurrence on the shelf exist. At the West Yamal shelf, high-resolution seismic data indicate a continuous SAP extending to water depths up to ~20 m offshore, and a presence of both ice- and unfrozen fluid-bearing sediments extending further offshore to ~115 m water depth [31]. Similarly, in the western Laptev Sea, evidence from a coastal and offshore drilling program confirms the existence of frozen sediments on the shelf [46] with a discontinuous SAP controlled by the dynamics of coastal inundation. In this site, the presence of unfrozen and saline permafrost suggests that permafrost may not be as cold or thick as predicted by thermal modeling. As noticed by Romanovskii et al. [29], the reduction of the thickness of the fully frozen bearing sediments is more pronounced than the reduction of the total thickness of SAP during transgressions. Temperature changes in climate and transgression–regression cycles may affect the thicknesses of the SAP and gas hydrate stability zone (GHSZ) differently. In the East Siberian Seas, at present, permafrost degradation may be occurring in the outer part of the shelf, whereas GHSZ may be stable or even thickening, indicating that the dynamic of permafrost thickness and the variation of the GHSZ are similar but not identical [29]. Several authors [5,31,32] suggested that shallow permafrost sediments in some areas of the Arctic shelf are charged with methane gas, and sustained warming may increase the gas-venting rate in the future.
SAP can be present in the lacustrine environment even if it is highly sensitive to climate change [46]. Warmer climate accelerates the complete permafrost thaw and enhances seasonal flow within the active layer. Hydrate could also exist in lakes with permafrost deposits, and its presence is strongly controlled by lithology, porosity, and lake size and shape, as suggested by Majorowicz et al. [27]. They modeled the behavior of talik permafrost and gas hydrate below shallow lakes and compared the results with similar models of the Beaufort Mackenzie Basin. In particular, they suggested that, below a lake of any size, where the underlying lithology is sand, the change on thermal conditions only cannot produce a spread talik or dissociate significant gas hydrate accumulations, but just a talik of about a few tens of meters. Regarding the effect of the porosity, their results suggest that permafrost degradation is facilitated for porosities <40%, and, for higher porosities, gas hydrate can be stable even where deep taliks formed [27]. Data from the Qalluuraq Lake indicate a very high concentration of methane in the seepage gas, which could be related to hydrate dissociation [47,48]. Here, we propose a simple empirical approach that allows assessing, under steady-state conditions, if hydrate below SAP could be stable for different thermodynamic conditions typical of SAP in shallow waters both in marine and lacustrine environments. To our knowledge, this is the first empirical method that allows a quick look and easy initial estimation of the conditions sufficient to have the stability of hydrate below SAP in absence of direct geological or geophysical data.
2. Materials and Methods
We evaluated the sufficient conditions to have hydrate stability below the bottom of the SAP under steady-state conditions (Figure 1). We numerically estimated the intersection between the hydrate stability curve and the temperature profile versus pressure below sea level in order to obtain the pressure at the GHSZ base. We used the following input parameters: (i) water depths ranging from 50 to 150 m, (ii) SAP thickness from 0 to 500 m, (iii) saturation of ice in the SAP from 80 to 100%, (iv) SAP temperature of −1, −1.5, or −2 °C, (v) geothermal gradient (GG) from 20 to 40 °C/km, and (vi) water salinity of 0 (freshwater) or 3.5 wt.% (brine). These parameter ranges are based on the literature where SAP was identified [22,29,30,31,32]. Portnov et al. [44] reported the presence of SAP in shallow waters at about 20 m in the South Kara Sea shelf, but SAP is discontinuous for water depths greater than about 60 m [29]. In the absence of SAP, hydrate is stable in the Arctic Ocean for water depths greater than 250 m [22,49,50,51]. Romanovskii et al. [29] reported a maximum SAP thickness of about 700 m, even if other authors considered a maximum permafrost thickness up to 500 m [31]. We considered a range of geothermal gradients, which span the variability in thermal structure reported globally in SAP sediments (e.g., References [29,32,52]). We imposed an annual mean SAP temperature from −1 °C to −2 °C (e.g., References [22,53]), which needs to be at or below zero to allow the formation of ice in the lacustrine and marine permafrost zones, respectively [22]. The pore water was assumed to be freshwater and brine to model the lacustrine and marine environments, respectively.
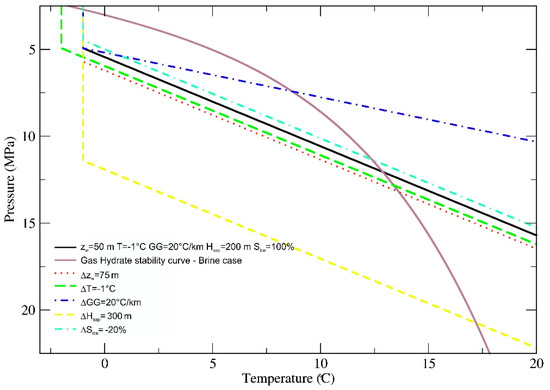
Figure 1.
Thickness of the gas hydrate stability zone (GHSZ) for different combinations of controlling parameters in the marine environment (brine with 3.5 wt.% salinity). The black solid line represents the reference case. The other curves represent a variation of one parameter with respect to the reference case. Red dotted line: Δzw = 75 m. Green dashed line: ΔΤ = −1 °C. Yellow dashed line: ΔHSAP = 300 m. Light-blue dashed-dotted line: ΔSice = −20%. Δ means variation with respect to the reference case. Explanation of the parameters is reported in the text.
The saturation of ice-bearing permafrost, which indicates the thickness of ice-bearing permafrost with respect to the total thickness of SAP, was introduced to model the discontinuity of the SAP [5]. We assumed a minimum ice-bearing SAP saturation of 80% because this is the minimum amount of ice necessary to reach a stable permafrost system [31]. For example, if the SAP is assumed equal to 100 m and composed of 80 m of fully frozen bearing sediments and 20 m of unfrozen fluid-bearing sediments, it means that there is 80% ice saturation. Note that we assumed the thickness of the active layer (ground zone that freezes and thaws each year) to be much thinner than the thickness of perennial permafrost and, thus, the active layer was not modeled. Regarding gas composition, most parts of the Arctic permafrost are composed of pure methane (e.g., References [4,29,51,54]), although other gases such as CO2 could also be present at the base of the permafrost driven by vertical fluid flow from deep sources.
We evaluated the hydrate stability by using Moridis et al.’s [55] stability boundary for pure methane hydrate. This is a conservative assumption, because the base of methane HSZ is shallower compared to that of hydrate formed by a mixture of different type of gases. Moridis’s [55] stability boundary is defined for pure water; therefore, we applied Dickens and Quinby-Hunt’s [56] relationship to account for a water salinity of 3.5% weight total (wt.%) of sodium chloride. For the conversion, we assume a pure water fusion temperature of 273.2 K, a pure water fusion enthalpy of 6008 J∙mol−1, an enthalpy of hydrate dissociation of 54,200 J∙mol−1, six water molecules in the hydrate formula (CH4∙6H2O), and Blangden’s law [57] to calculate the fusion temperature of water in an electrolyte solution of 3.5 wt.% salinity. For Blangden’s law, we assumed a water cryoscopic constant of 1853 K∙g∙mol−1 and a sodium chloride van’t Hoff factor of 2. In permafrost regions, the correlation between pressure and depth is affected by poor data on pressure regime (e.g., Reference [2]). However, some authors underlined that hydrostatic pressures should not be used in permafrost environments because most pores are filled with ice, likely generating a pore pressures above the hydrostatic (e.g., Reference [58]). In this case, the depth of the base of the GHSZ would be deeper than in the hydrostatic case [59]. Based on these considerations, we assumed the following pressure formulation modified after Liu et al. [2]:
where P is the pore pressure below SAP at the depth H below seabed, PSAP is the pore pressure at the base of the SAP with a thickness HSAP, Pa is the atmospheric pressure, Pw is the hydrostatic pressure of the water column above sediments (zw), ρw is the water density (1046 kg/m3, e.g., References [50,59]), ρs is the bulk sediment density of the fully frozen SAP assumed as 2200 kg/m3, g is the gravitational acceleration constant (9.81 m/s2), and Sice is the saturation of ice-bearing SAP.
P = PSAP + ρw g (H − HSAP),
PSAP = Pa + Pw + ρs g HSAP Sice + ρw g HSAP (1 − Sice),
Pw = ρw g zw,
To model the temperature versus depth profile, we propose the following formula:
where T is the temperature at the depth H below seabed, TSAP is the SAP temperature, and GG is the geothermal gradient. To model the heat flow in the SAP due to the presence of unfrozen water that allows fluid circulation, we included the term ΔTSAP that is the temperature increase in the SAP due to the coexistence of fully frozen and unfrozen fluid-bearing sediments, as given by the parameter Sice. Equation (2) was verified by using well data (4D12 and 4D13) in the East Siberian Arctic shelf (e.g., Reference [60]); the temperature increase from top to bottom of the SAP, evaluated using Equation (2), is in agreement with the temperature measurements.
T = TSAP + ΔTSAP + GG (H − HSAP),
ΔTSAP = GG HSAP (1 − Sice),
The hydrate stability curve was compared with the temperature/pressure curve to estimate the depth of the base of the GHSZ for the marine (brine) and lacustrine (freshwater) environments. Figure 1 shows the influence of the controlling parameters (geothermal gradient, SAP temperature, water depth, and saturation of ice-bearing SAP) in the thickness of the GHSZ for SAP in a marine environment. Figure 2 shows the pressure at the base of the GHSZ versus the pressure at the base of SAP for different combinations of the controlling parameters for both marine and lacustrine environments. To easily evaluate the stability of the gas hydrate below the SAP and the depth of its base, we fit the curves in Figure 2 using the following relationship:
where PSAP is the pressure at the base of SAP (see Equation (1)), and PGHSZ is the pressure at the base of the GHSZ, which is given by the intersection of the hydrate stability curve with the temperature/pressure curve of sediments. The parameters a1, a2, and a3 are reported in Table 1 and Table 2 for the cases of freshwater and brine, respectively. The expression reported in Equation (3) was the function that better reproduced the theoretical curves (i.e., minimum standard deviation) and simplified the estimation of the hydrate stability thickness below SAP. The fitting was performed by using our codes and the open-source software XMGRACE.
PGHSZ = a1 + a2 PSAP + a3 PSAP2,
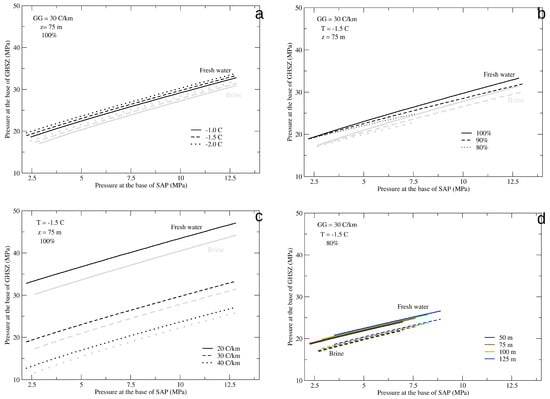
Figure 2.
PGHSZ versus PSAP for freshwater and brine cases. In each panel, one parameter is changed, while the others are fixed.

Table 1.
Fitting parameters a1, a2, and a3 for modeled bottom water temperatures (T), geothermal gradient (GG), and water depths (WD) for the freshwater case. The standard deviation (SD) is also reported, as well as the range of pressure in which the hydrate stability is satisfied, indicated as Min/Max PSAP and Min/Max PGHSZ.
Table 2.
Fitting parameters a1, a2, and a3 for modeled bottom water temperatures (T), geothermal gradient (GG), and water depths (WD) for the pore water with a 3.5 wt.% salinity (brine). The standard deviation (SD) is also reported, as well as the range of pressure in which the hydrate stability is satisfied, indicated as Min/Max PSAP and Min/Max PGHSZ.
3. Results
The curves in Figure 2 summarize the results of our empirical approach. As can be observed in Table 1 and Table 2, the parameter a3 is generally low, indicating a linear relationship between the pressure at the base of SAP and the pressure at the base of the GHSZ. Comparing the results obtained in the freshwater and brine cases, we deduced that a1 was higher for the freshwater case. This trend is clearly observed in Figure 2, in which the intercepts of the freshwater cases were higher. On the other hand, the parameter a2 had an opposite trend, as observed by the highest slopes of the curves related to brine (Figure 2).
Regarding the correlation of a1 and a2 with the other variables, they showed an opposite trend. We noted that (i) a1/a2 increased/decreased if SAP temperature decreased; (ii) a1/a2 decreased/increased if GG increased; (iii) a1/a2 increased/decreased if water depth increased; (iv) a1/a2 increased/decreased if the saturation of ice-bearing SAP decreased.
The ranges of pressures at the base of SAP (PSAP) and GHSZ (PGHSZ) are reported for freshwater and brine in Table 1 and Table 2, respectively. Figure 1 shows that the range of PSAP in the freshwater case was smaller than that in the brine case; on the contrary, the range of PGHSZ in the brine case was smaller than that in the freshwater case. Regarding the pressure dependence with GG, TSAP, zw, and Sice, the minimum PSAP at which the hydrate was stable was independent of GG, while it increased if TSAP or zw increased and if Sice decreased. The maximum PSAP was independent of both GG and TSAP, while it increased if water depth increased. The minimum and maximum PGHSZ increased if (i) GG or TSAP decreased, or (ii) zw or Sice increased.
4. Conclusions
In this paper, we proposed an empirical approach that considers the dominant physical parameters controlling the stability of hydrate under steady-state conditions in SAP environments. It is a simple method that can be easily and reliably applied to assess if the sufficient conditions to have hydrate stability below SAP are satisfied. Because of the growing interest in SAP environments, this approach is particularly useful in SAP areas with environmental conditions that hinder the acquisition of data, to allow an initial and quick estimation of the thickness of the gas hydrate stability zone.
Author Contributions
Conceptualization, U.T., M.G., and H.M.-M.; simulations, U.T.; analysis, U.T. and M.G.; writing—original draft, U.T. and M.G.; writing—review and editing, U.T., M.G., and H.M.-M.
Funding
This research was partially supported by (I) the Italian Ministry of Education, Universities and Research (Decreto MIUR No. 631 dd. 8 August 2016) under the extraordinary contribution for Italian participation in activities related to the international infrastructure PRACE—The Partnership for Advanced Computing in Europe (www.prace-ri.eu) and (2) TALENTS FVG Programme Activity 1-Incoming Mobility Scheme-European Social Fund, Operational Programme 2007–2013, Objective 2 Regional Competitiveness and Employment, Axis 5 Transnational cooperation (decision n. 7629 of 26/11/2013).
Acknowledgments
We thank the three anonymous reviewers for their insightful comments and suggestions that helped us to improve the manuscript.
Conflicts of Interest
The authors declare no conflicts of interest.
References
- Osterkamp, T.E.; Burn, C.R. Permafrost. In Encyclopedia of Atmospheric Sciences; Holton, J.R., Ed.; Academic Press: Oxford, UK, 2003; pp. 1717–1729. [Google Scholar] [CrossRef]
- Liu, S.; Jiang, Z.; Liu, H.; Pang, S.; Xia, Z.; Jin, Z.; Wang, J.; Wei, X. The natral-gas exploration prospects of the Nayixiong formation in the Kaixinling-Wuli permafrost, Qinghai-Tibet plateau. Mar. Pet. Geol. 2016, 72, 179–192. [Google Scholar] [CrossRef]
- Osterkamp, T.E. Sub-sea Permafrost. In Encyclopedia of Ocean Sciences, 1st ed.; Academic Press: New York, NY, USA, 2001; pp. 2902–2912. [Google Scholar]
- Collett, T.S.; Lee, M.W.; Agena, W.F.; Miller, J.J.; Lewis, K.A.; Zyrianova, M.V.; Boswell, R.; Inks, T.L. Permafrost-associated natural gas hydrate occurrences on the Alaska North Slope. Mar. Petr. Geol. 2011, 28, 279–294. [Google Scholar] [CrossRef]
- Frederick, J.M.; Buffett, B.A. Taliks in relict submarine permafrost and gas hydrate deposits: Pathways for methane escape under present and future conditions. J. Geophys. Res. Earth Surf. 2014, 119, 106–122. [Google Scholar] [CrossRef]
- Portnov, A.; Vadakkepuliyambatta, S.; Mienert, J.; Hubbard, A. Ice-sheet-driven methane storage and release in the Arctic. Nat. Commun. 2016, 7, 101314. [Google Scholar] [CrossRef]
- Crémière, A.; Lepland, A.; Chand, S.; Sahy, D.; Condon, D.J.; Noble, S.R.; Martma, T.; Thorsnes, T.; Sauer, S.; Brunstad, H. Timescales of methane seepage on the Norwegian margin following collapse of the Scandinavian Ice Sheet. Nat. Commun. 2016, 7, 11509. [Google Scholar] [CrossRef]
- Kvenvolden, K.A. Gas hydrates—Geological perspective and global change. Rev. Geophys. 1993, 31, 173–187. [Google Scholar] [CrossRef]
- Anderson, L.G.; Björk, G.; Jutterström, S.; Pipko, I.; Shakhova, N.; Semiletov, I.; Wåhlström, I. East Siberian Sea, an Arctic region of very high biogeochemical activity. Biogeosciences 2011, 8, 1745–1754. [Google Scholar] [CrossRef]
- Dallimore, S.R.; Wright, J.F.; Nixon, F.M.; Kurihara, M.; Yamamoto, K.; Fujii, T.; Fujii, K.; Numasawa, M.; Yasuda, M.; Imasato, Y. Geologic and porous media factors affecting the 2007 production response characteristics of the JOGMEC/NRCAN/AURORA Mallik gas hydrate production research well. In Proceedings of the 6th International Conference on Gas Hydrates, Vancouver, BC, Canada, 6–10 July 2008; p. 10. [Google Scholar]
- Dallimore, S.R.; Wright, J.F.; Yamamoto, K. Appendix D: Update on Mallik. In Energy from Gas Hydrates: Assessing the Opportunities and Challenges for Canada; Council of Canadian Academies: Ottawa, ON, Canada, 2008; pp. 196–200. [Google Scholar]
- Moridis, G.J.; Collett, T.S.; Pooladi-Darwish, M.; Hancock, S.; Santamarina, C.; Boswell, R.; Kneafsey, T.; Rutqvist, J.; Kowalsky, M.J.; Reagan, M.T.; et al. Challenges, Uncertainties and Issues Facing Gas Production From Hydrate Deposits in Geologic Systems. SPE Res. Eval. Eng 2011, 14, 76–112. [Google Scholar] [CrossRef]
- Yamamoto, K.; Kanno, T.; Wang, X.-X.; Tamaki, M.; Fujii, T.; Chee, S.-S.; Wang, X.-W.; Pimenov, V.; Shako, V. Thermal responses of a gas hydrate-bearing sediment to a depressurization operation. R. Soc. Chem. 2017, 7, 5554–5577. [Google Scholar] [CrossRef]
- Marín-Moreno, H.; Minshull, T.A.; Westbrook, G.K.; Sinha, B. Estimates of future warming-induced methane emissions from hydrate offshore west Svalbard for a range of climate models. Geochem. Geophys. Geosyst. 2015, 16, 1307–1323. [Google Scholar] [CrossRef]
- Marin-Moreno, H.; Giustiniani, M.; Tinivella, U. The Potential Response of the Hydrate Reservoir in the South Shetland Margin, Antarctic Peninsula, to Ocean Warming over the 21st Century. Polar Res. 2015, 34, 27443. [Google Scholar] [CrossRef]
- Nisbet, E. Some northern sources of atmospheric methane: Production, history, and future implications. Can. J. Earth Sci. 1989, 26, 1603–1611. [Google Scholar] [CrossRef]
- Nisbet, E.G. The end of the ice age. Can. J. Earth Sci. 1990, 27, 148–157. [Google Scholar] [CrossRef]
- Dickens, G.R. Down the Rabbit Hole: Toward appropriate discussion of methane release from gas hydrate systems during the Paleocene-Eocene thermal maximum and other past hyperthermal events. Clim. Past 2011, 7, 831–846. [Google Scholar] [CrossRef]
- Chuvilin, E.; Davletshina, D. Formation and Accumulation of Pore Methane Hydrates in Permafrost: Experimental Modeling. Geosciences 2018, 8, 467. [Google Scholar] [CrossRef]
- Makogon, Y.F. A Gas Hydrate Formation in the Gas Saturated Layers under Low Temperature. Gas Ind. 1965, 5, 14–15. [Google Scholar]
- Chuvilin, E.; Bukhanov, B.; Davletshina, D.; Grebenkin, S.; Istomin, V. Dissociation and Self-Preservation of Gas Hydrates in Permafrost. Geosciences 2018, 8, 431. [Google Scholar] [CrossRef]
- Bogoyavlensky, V.; Kishankov, A.; Yanchevskaya, A.; Bogoyavlensky, I. Forecast of Gas Hydrates Distribution Zones in the Arctic Ocean and Adjacent Offshore Areas. Geosciences 2018, 8, 453. [Google Scholar] [CrossRef]
- Istomin, V.A.; Yakushev, V.S. Gas Hydrates in Nature; Nedra: Moscow, Russia, 1992; p. 235. ISBN 5-247-02442-7. [Google Scholar]
- Rivkin, F.M.; Levantovskaya, N.P. Dynamics of sub-river channel taliks and the formation of gas hydrates. Kriosf. Zemli. 2002, 6, 36–42. [Google Scholar]
- Kraev, G.; Schulze, E.-D.; Yurova, A.; Kholodov, A.; Chuvilin, E.; Rivkina, E. Cryogenic Displacement and Accumulation of Biogenic Methane in Frozen Soils. Atmosphere 2017, 8, 105. [Google Scholar] [CrossRef]
- Istomin, V.A.; Chuvilin, E.M.; Sergeeva, D.V.; Buhkanov, B.A.; Stanilovskaya, Y.V.; Green, E.; Badetz, C. Thermodynamic calculation of freezing temperature of gas-saturated pore water in talik zones. In Proceedings of the 5th European Conference Permafrost, Chamonix, France, 23 June–1 July 2018; pp. 480–481. [Google Scholar]
- Majorowicz, J.; Osadetz, K.; Safanda, J. Models of Talik, Permafrost and Gas Hydrate Histories—Beaufort Mackenzie Basin, Canada. Energies 2015, 8, 6738–6764. [Google Scholar] [CrossRef]
- Chuvilin, E.; Bukhanov, B. Thermal conductivity of frozen sediments containing self-preserved pore gas hydrates at atmospheric pressure: An experimental study. Geosciences 2019, 9. [Google Scholar] [CrossRef]
- Romanovskii, N.N.; Hubberten, H.-W.; Gavrilov, A.V.; Eliseeva, A.A.; Tipenko, G.S. Offshore permafrost and gas hydrate stability zone on the shelf of East Siberian Seas. Geo Mar. Lett. 2005, 25, 167–182. [Google Scholar] [CrossRef]
- Malakhova, V.V.; Eliseev, A.V. Influence of rift zones and thermokarst lakes on the formation of subaqueous permafrost and the stability zone of methane hydrates of the Laptev sea shelf in the Pleistocene. Ice Snow 2018, 58, 231–242. [Google Scholar] [CrossRef]
- Portnov, A.; Mienert, J.; Serov, P. Modeling the evolution of climate sensitive Arctic subsea permafrost in regions of extensive gas expulsion at the West Yamal shelf. Biogeosciences 2014, 119, 2082–2094. [Google Scholar] [CrossRef]
- Malakhova, V.V. Estimation of the subsea permafrost thickness in the Arctic Shelf. In Proceedings of the 24th International Symposium on Atmospheric and Ocean Optics: Atmospheric Physics, Tomsk, Russia, 2–5 July 2018; p. 108337T. [Google Scholar] [CrossRef]
- Loktev, A.S.; Tokarev, M.Y.; Chuvilin, E.M. Problems and technologies of offshore permafrost investigation. Procedia Eng. 2017, 189, 459–465. [Google Scholar] [CrossRef]
- Romanovskii, N.N.; Hubberten, H.-W.; Gavrilov, A.V.; Tumskoy, V.E.; Tipenko, G.S.; Grigoriev, M.N.; Siegert, C. Thermokarst and Land-Ocean Interactions, Laptev Sea, Region Russia. Permafr. Periglac. Process. 2000, 11, 157–162. [Google Scholar] [CrossRef]
- Nikolsky, D.; Shakhova, N. Modeling sub-sea permafrost in the East Siberian Arctic Shelf: The Dmitry Laptev Strait. Environ. Res. Lett. 2010, 5, 015006. [Google Scholar] [CrossRef]
- Nikolsky, D.; Romanovsky, V.E.; Romanovskii, N.N.; Kholodov, A.L.; Shakhova, N.E.; Semiletov, I.P. Modeling sub-sea permafrost in the East Siberian Arctic Shelf: The Laptev Sea region. J. Geophys. Res. 2012, 117, F03028. [Google Scholar] [CrossRef]
- Overduin, P.P.; Schneider von Deimling, T.; Miesner, F.; Grigoriev, M.N.; Ruppel, C.; Vasiliev, A.; Lantuit, H.; Juhls, B.; Westermann, S. Submarine Permafrost Map in the Arctic Modeled Using 1-D Transient Heat Flux (SuPerMAP). J. Geophys. Res. Ocean. 2019, 124. [Google Scholar] [CrossRef]
- Ruppel, C. Methane Hydrates and Contemporary Climate Change. Nat. Educ. Knowl. 2011, 3, 29. [Google Scholar]
- Ruppel, C. Permafrost-Associated Gas Hydrate: Is it Really ~1% of the Global System? J. Chem. Eng. Data 2014. [Google Scholar] [CrossRef]
- Streletskaya, I.D.; Vasiliev, A.A.; Oblogov, G.E.; Streletskiy, D.A. Methane content in ground ice and sediments of the Kara Sea coast. Geosciences 2018, 8, 434. [Google Scholar] [CrossRef]
- Romanovskii, N.; Hubberten, H.-W.; Gavrilov, A.; Tumskoy, V.; Kholodov, A.L. Permafrost of the east Siberian Arctic shelf and coastal lowlands. Quat. Sci. Rev. 2004, 23, 1359–1369. [Google Scholar] [CrossRef]
- Peltier, W.R. Ice age paleotopography. Science 2004, 265, 195–201. [Google Scholar] [CrossRef] [PubMed]
- Kendall, R.A.; Mitrovica, J.X.; Milne, G.A. On post-glacial sea level—II. Numerical formulation and comparative results on spherically symmetric models. Geophys. J. Int. 2005, 161, 679–706. [Google Scholar] [CrossRef]
- Portnov, A.; Smith, A.J.; Mienert, J.; Cherkashov, G.; Rekant, P.; Semenov, P.; Serov, P.; Vanshtein, B. Offshore permafrost decay and massive seabed methane escape in water depths >20 m at the South Kara Sea shelf. Geo. Res. Lett. 2013, 40, 1–6. [Google Scholar] [CrossRef]
- Chuvilin, E.M.; Yakushev, V.S.; Perlova, E.V. Gas hydrates in the permafrost of Bovanenkovo gas field, Yamal Peninsula, West Siberia. Polarforschung 2000, 68, 215–219. [Google Scholar]
- Wellman, T.P.; Voss, C.I.; Walvoord, M.A. Impacts of climate, lake size, and supra- and sub-permafrost groundwater flow on lake-talik evolution, Yukon Flats, Alaska (USA). Hydrogeol. J. 2013, 21, 281–298. [Google Scholar] [CrossRef]
- Ruo, H.; Wooller, M.J.; Pohlman, J.W.; Quensen, J.; Tiedje, J.M.; Beth Leigh, M. Shifts in Identity and Activity of Methanotrophs in Arctic Lake Sediments in Response to Temperature Changes. Appl. Environ. Microbiol. 2012, 78, 4715–4723. [Google Scholar]
- Wooller, M.J.; Gaglioti, B.; Fulton, T.L.; Lopez, A.; Shapiro, B. Post-glacial dispersal patterns of Northern pike inferred from an 8,800 year old pike (Esox cf. lucius) skull from interior Alaska. Quat. Sci. Rev. 2015, 120, 118–125. [Google Scholar] [CrossRef]
- Giustiniani, M.; Tinivella, U.; Jakobsson, M.; Rebesco, M. Arctic Ocean Gas Hydrate Stability in a Changing Climate. J. Geol. Res. 2013. [Google Scholar] [CrossRef]
- Marín-Moreno, H.; Giustiniani, M.; Tinivella, U.; Piñero, E. The challenges of quantifying the carbon stored in Arctic marine gas hydrate. Mar. Pet. Geol. 2016, 71, 76–82. [Google Scholar] [CrossRef]
- Makogon, Y.F. Production from natural gas hydrate deposits. Gazov. Promishlennost 1984, 10, 24–26. [Google Scholar]
- Bugge, T.; Elvebakk, G.; Fanavoll, S.; Mangerud, G.; Smelror, M.; Weiss, H.M.; Gjelberg, J.; Kristensen, S.E.; Nilsen, K. Shallow stratigraphic drilling applied in hydrocarbon exploration of the Nordkapp Basin, Barents Sea. Mar. Pet. Geol. 2002, 19, 13–37. [Google Scholar] [CrossRef]
- Rachold, V.; Yu, D.; Bolshiyanov, M.N.; Grigoriev, H.-W.; Hubberten, R.; Junker, V.V.; Kunitsky, F.; Merker, P.P.; Overduin, P.; Schneider, W. Near-shore Arctic Subsea Permafrost in Transition. EOS: Trans. Am. Geophys. Union 2007, 88, 149–156. [Google Scholar] [CrossRef]
- Shakhova, N.; Semiletov, I. Methane release and coastal environment in the East Siberian Arctic shelf. J. Mar. Syst. 2007, 66, 227–243. [Google Scholar] [CrossRef]
- Moridis, G.J.; Kowalsky, M.B.; Pruess, K. TOUGH+HYDRATE v1.2 User’s Manual: A Code for The Simulation of System Behavior in Hydrate-Bearing Geological Media. 2012. Available online: https://tough.lbl.gov/assets/docs/TplusH_Manual_v1.pdf (accessed on 26 July 2019).
- Dickens, G.R.; Quinby-Hunt, M.S. Methane hydrate stability in pore water: A simple theoretical approach for geophysical applications. JGR 1997, 102, 773–783. [Google Scholar] [CrossRef]
- Ladd, M. Introduction to Physical Chemistry; Cambridge University Press: Cambridge, UK, 1998. [Google Scholar]
- Betlem, P.; Senger, K.; Hodson, A. 3D thermobaric modelling of the gas hydrate stability zone onshore central Spitsbergen, Arctic Norway. Mar. Pet. Geol. 2019, 100, 246–262. [Google Scholar] [CrossRef]
- Tinivella, U.; Giustiniani, M. Variations in BSR depth due to gas hydrate stability versus pore pressure. Glob. Planet. Chang. 2013, 100, 119–128. [Google Scholar] [CrossRef]
- Shakhova, N.; Semiletov, I.; Gustafsson, O.; Sergienko, V.; Lobkovsky, L.; Dudarev, O.; Tumskoy, V.; Grigoriev, M.; Mazurov, A.; Salyuk, A.; et al. Current rates and mechanisms of subsea permafrost degradation in the East Siberian Arctic Shelf. Nat. Commun. 2017, 8, 15872. [Google Scholar] [CrossRef] [PubMed]


© 2019 by the authors. Licensee MDPI, Basel, Switzerland. This article is an open access article distributed under the terms and conditions of the Creative Commons Attribution (CC BY) license (http://creativecommons.org/licenses/by/4.0/).