Article

Copper and its Isotopes in Organic-Rich Sediments: From the Modern Peru Margin to Archean Shales

by
Emily R. Ciscato
1,*,
Tomaso R. R. Bontognali
2,
Simon W. Poulton
3 and
Derek Vance
1
1
Institute of Geochemistry and Petrology, Department of Earth Sciences, ETH Zürich, Clausiusstrasse 25, 8092 Zürich, Switzerland
2
Space Exploration Institute, Fbg de l’Hopital 68, 2000 Neuchatel, Switzerland
3
School of Earth and Environment, University of Leeds, Leeds LS2 9JT, UK
*
Author to whom correspondence should be addressed.
Geosciences 2019, 9(8), 325; https://doi.org/10.3390/geosciences9080325
Submission received: 16 June 2019 / Revised: 21 July 2019 / Accepted: 23 July 2019 / Published: 25 July 2019

Abstract

:
The cycling of copper (Cu) and its isotopes in the modern ocean is controlled by the interplay of biology, redox settings, and organic complexation. To help build a robust understanding of Cu cycling in the modern ocean and investigate the potential processes controlling its behavior in the geological past, this study presents Cu abundance and isotope data from modern Peru Margin sediments as well as from a suite of ancient, mostly organic-rich, shales. Analyses of an organic-pyrite fraction extracted from bulk modern sediments suggest that sulphidation is the main control on authigenic Cu enrichments in this setting. This organic-pyrite fraction contains, in most cases, >50% of the bulk Cu reservoir. This is in contrast to ancient samples, for which a hydrogen fluoride (HF)-dissolvable fraction dominates the total Cu reservoir. With <20% of Cu found in the organic-pyrite fraction of most ancient sediments, interpretation of the associated Cu isotope composition is challenging, as primary signatures may be masked by secondary processes. But the Cu isotope composition of the organic-pyrite fraction in ancient sediments hints at the potential importance of a significant Cu(I) reservoir in ancient seawater, perhaps suggesting that the ancient ocean was characterized by different redox conditions and a different Cu isotope composition to that of the modern ocean.

1. Introduction

The oceanic cycling of metals and their isotopes, and the degree to which the inputs are partitioned into different sedimentary sinks as controlled by biology, redox, and the physical chemistry of seawater, has led to applications in Earth history via records from ancient sediments. [1,2]. One example of such a system is the transition element copper (Cu), whose isotope composition is universally heavy in seawater and all other surface Earth aqueous fluids [3,4]—heavier, for example, than the rocks of the upper continental crust. This prominent modern feature appears to result exclusively through its complexation by organic ligands, whose only known source is cyanobacterial cells [5]. It seems likely that this phenomenon may have exerted a long-term control on Cu and its isotopes through a portion of Earth history [3], with potential utility in understanding the ecological importance of this and other metabolisms. However, the potential of the sedimentary record of Cu and its isotopes is currently not underpinned by a complete and robust understanding of its modern water column cycling, in addition to its behavior in modern and ancient sediments. For example, despite the dominant controls of these organic ligands on the modern Earth, a recent study of changes in the Cu isotope composition of organic-rich shales from across the Great Oxidation Event (GOE) attributes secular changes exclusively to the demise of Banded Iron Formations [6].
In the modern ocean, copper (Cu) is a bio-essential trace metal, required for enzymatic activity by phytoplankton [7,8]. But it is also toxic in its free Cu2+ ion form, even at the nanomolar concentrations that are normal in the modern ocean [5]. Dissolved copper concentrations show a linearly increasing profile with depth, with a deep/surface concentration ratio below 10. This is in contrast to some other bio-essential metals (e.g., zinc, cadmium) where this deep/surface ratio can be an order of magnitude greater. Other metals, such as zinc (Zn), cadmium (Cd), and nickel (Ni) also often exhibit mid-depth maxima [9]. The main control on Cu speciation and distribution in the modern water column is its complexation by organic ligands. A class of strong Cu-binding ligands (L1) complex more than 99% of the free Cu in surface waters of the North Pacific [10,11]. Complexation decreases Cu bioavailability [12], and the fact that some phytoplankton, such as the cyanobacteria Synechococcus sp., exude organic ligands very similar to the L1 class may represent an attempt to regulate free Cu2+ to below toxicity levels [13,14]. Though early work suggested that these ligands might be restricted to the photic zone [10,11], more recent studies find them to be ubiquitous throughout the water column [15,16,17].
There are at least two other processes that control the geochemistry of Cu in seawater and its dissolved phase distribution: its particle reactivity and sequestration by sulphide. The linearity of the dissolved Cu concentration profile is consistent with reversible scavenging, the continuous exchange of copper between seawater and particle surfaces, throughout the water column [14,18,19]. Strong particle-reactivity is especially observed towards Fe-Mn oxides, which represent an important output from the dissolved pool in oxygen replete settings [20]. Copper is also highly reactive towards sulphide, and in oxygen deficient settings, such as the Black Sea and Cariaco Basin, it is nearly quantitatively removed [21,22,23].
Overall, it is the competition between biological uptake, organic complexation, particle scavenging, and sulphide precipitation that controls Cu speciation and distribution profiles in the modern ocean. In the modern and ancient ocean, copper can occur as both oxidized, Cu(II), and reduced, Cu(I), species. Much of the previous work on Cu stable isotopes (see review in Moynier et al. [4]) has focused on determining the isotope fractionations associated with these redox transformations, either experimentally or via ab initio calculations. Changes in redox state, which may occur during biological uptake and sulphide sequestration, impart the largest fractionations observed so far. Experimental constraints on the fractionation between Cu(I) in sulphides and Cu(II) in the associated aqueous solution, indicate a fractionation on the order of ∼3‰ in δ65Cu (where δ65Cu = [((65Cu/63Cusample)/(65Cu/63CuNIST SRM976)) − 1] × 1000) [24]. Even larger fractionations—maximum 4.4‰—have been observed for bacterial cellular uptake of aqueous Cu(II) and its associated reduction to Cu(I) [25]. Fractionations as small as ∼0.4‰, with preferential removal of the heavy isotope from solution onto dead cells [25] may reflect sorption rather than uptake. Sorption of copper onto Fe-Mn oxides can also fractionate in both directions. Pokrovsky et al. [26] document the preferential uptake of heavy Cu, imparting a fractionation up to 0.8 ± 0.2‰ for goethite, in the same range as that of 0.73 ± 0.08‰ observed by Balistrieri et al. [27] for sorption onto ferrihydrite. On the other hand, Ijichi et al. [28] report the sorption of light copper onto birnessite, imparting a fractionation up to 0.45 ± 0.18‰. It is important to note, however, that all these experiments quantify the isotope composition of sorbed Cu relative to simple aqueous phases where, for example, the Cu is not organically complexed.
Natural samples of Fe-Mn crusts and nodules characterized to date are all lighter than seawater, which would indicate preferential uptake of light copper [29,30]. Little et al. [20,30] emphasize the role of natural organic ligands in controlling these natural samples. Strongly Cu-binding organic ligands have been shown to prefer the heavier isotope relative to free aqueous Cu, with an experimentally determined fractionation of up to ∼0.8‰ [31]. Thus, competition between these organic ligands and Fe-Mn oxides for the heavy Cu, with the well-known tendency for the heavier isotope to prefer the strongest binding environment [32], could explain the light Cu in natural Fe-Mn oxides relative to the dissolved pool of the oceans.
Efforts aimed at understanding the oceanic cycling and isotopic mass balance of Cu are relatively recent. Copper isotope data available from the Atlantic, Pacific, and Indian Ocean indicate that the oceanic dissolved load is homogeneous at depths below 800 m, with an average δ65Cu of +0.66‰ [3,4,33,34,35]. The surface ocean shows more variability, between about +0.4 and +0.9‰. All these values are substantially heavier than the upper continental crust (UCC) average of +0.08 ± 0.17‰ [3,4,33,34]. The main control on such a heavy dissolved load is thought to be the preferential association of the heavy copper isotope with soluble, strongly complexing organic ligands, as mentioned above, and their competition with the particulate oxide sink [4,20]. The only two sinks of Cu from the ocean characterized so far are Fe-Mn crusts and nodules, and reducing sediments. Fe-Mn crusts and nodules are nearly identical, with a global average of ∼+0.3‰ [20,29]. Little et al. [36] find that organic-rich sediments from the Black Sea, Cariaco Basin, and upwelling margins, are all lighter than the dissolved phase in seawater with an average authigenic composition of +0.28 ± 0.11‰. The homogeneously light isotope signature of the sinks identified so far contrasts with the heavy isotope composition of the dominant input, rivers, at +0.70‰ [3]. If the oceans are in steady-state, which Fe-Mn crusts records suggest they are [36], this contrast requires either an unidentified light source or a heavy sink [20].
Here, we present data for Cu abundance and isotopic composition for organic-rich sediments from the Peru Margin, building on the first observations by Little et al. [36] and better characterising the authigenic sink into organic-rich sediments in a modern upwelling setting. In particular, we isolate and analyse an organic-pyrite fraction (OPF) to more precisely investigate the host of Cu in such sediments. We also present data for a suite of similar, mostly organic-rich, sediments from the geological record, from the Archean to the Silurian/Ordovician, and compare the findings to the modern Peru Margin, with implications for the processes controlling Cu and its isotopes in the ancient ocean and its sediments.

2. Materials and Methods

A comprehensive description of the settings targeted in this study and details of the samples analysed is presented in the Supplementary Information. Here only a brief summary is provided.
The modern study focuses on the Peru Margin, as it offers the opportunity to investigate organic-rich sediments deposited at sites with a range of bottom-water oxygen (O2) and pore water sulphide (H2S) abundance, thus sampling different sedimentary redox states. Following Böning et al. [37], the samples are subdivided into three groups based on their location with respect to the oxygen minimum zone (OMZ): (i) upper edge of the OMZ, where dissolved O2 is <10 μM but may fluctuate to higher values during El Niño years; (ii) lower shelf and upper slope, within the OMZ where O2 is at or below 5 μM; (iii) lower continental slope, below the OMZ, where O2 is plentiful. We also present data on 50 samples from 27 formations, ranging in age from Archean to Ordovician/Silurian. These are all organic-rich shales, sampled from lithologies that underwent at most lower greenschist facies metamorphism. The aim in extending the dataset to older samples is to apply what we learn from the analysis of similar modern Peru Margin sediments to the geological record.
All procedural steps described in this study were performed in the clean laboratory facilities at the Institute of Geochemistry and Petrology at ETH Zürich. All containers used were trace metal cleaned Savillex PFA labware products and all acids were either of ultrapure grade or twice distilled before use. The analytical methodology followed here has been described previously [20,38,39,40]. Full details are provided in the Supplementary Information of Ciscato et al. [40], and a summary is given here.
We present data from two fractions of the sediment, an organic matter-dominated fraction and its HF-digestible counterpart, with the aim of learning more about the location, abundance and isotope composition of Cu within a bulk sample. The approach is the same as that described for Ni in Ciscato et al. [40] and was inspired by Eigenbrode and Freeman [41], who extracted kerogen from ancient organic-rich samples for the analysis of carbon isotopes. Briefly, ∼1 g of bulk sediment was digested for 24 h at 150 °C in a 3:2 concentrated HF and 7 M HCl mixture, followed by two steps of 24 h refluxing at 150 °C with 7 M HCl, evaporating to dryness between each step. 7 M HCl was then added a final time, again refluxing for 24 h. The resulting supernatant (the HF-dissolvable fraction or HFD), and the residual solid (organic matter and associated pyrite, OPF), were separated by centrifugation. The residual OPF was brought into solution via high-pressure ashing (HPA-S by Anton Paar) in a 10:1 mixture by volume of 13 M HNO3 and 10 M HCl.
The aim of the above approach was to separate an organic fraction from the bulk as quantitatively as possible. There is, though, the possibility that Cu may be mobilized by the HF-HCl treatment from the OPF. We have investigated this using three subsamples, analysed in duplicate, of a single Peru Margin core-top sample. The three sets of subsamples were subjected to either one, two, or three separate HF digestions after which the three separate resulting HFD fractions were analysed. In addition, the OPFs obtained after one, two, or three HF digestions were ashed and analysed. This test is not definitive, there being no way to assess the purity or isotopic integrity of the two fractions after a single digestion. However, the second and third HF digestions do yield information on the completeness of the first. Further HF treatments also yield information on the extent to which such a treatment extracts material that is potentially from the OPF. In addition, the reproducibility of the OPF isotopic analysis, after one, two, or three digestions, provides some information on the potential for isotope fractionation associated with partial extraction of elements from this fraction by HF digestion. Further details on the setup and results of these tests are provided in the Supplementary Information, and we return to this issue in the light of the new data presented here in Section 4.1 and Section 4.2. All the data tables also present bulk chemical and isotope data, calculated simply by adding together the two separated fractions.
Elemental abundances in the separated OPF and HFD fractions were determined with a ThermoScientific Element XRTM inductively-coupled plasma mass spectrometer (ICP-MS) at ETH Zürich. Accuracy and reproducibility were determined by repeat analyses of a commercially available carbonate-enriched shale standard (Green River Shale, SGR-1, United States Geological Survey, USA). For Cu, Al, and P the long-term reproducibility of SGR-1 assessed over the period during which the data here presented were obtained, is ±13%, ±11%, and ±18% (2SD, n = 44), respectively, and the measured concentrations are 97, 99, and 92% of their certified values, respectively.
Subsequently, Cu was isolated and purified from the matrix by a double pass through an anion exchange chromatography column, following the method described by Maréchal et al. [38] then modified for smaller sample volumes and procedural blanks by Archer and Vance [39]. A final oxidation overnight in HNO3 + H2O2 was performed in order to remove any residual organics prior to isotope analysis. Isotope analyses of the purified Cu cuts were performed on a ThermoFinnigann NeptunePlus multicollector inductively-coupled plasma mass spectrometer (MC-ICPMS) at ETH Zürich, following typical set-up procedures as described in Little et al. [20]. Mass discrimination was corrected for by sample standard bracketing using a 100 ppb solution of the NIST SRM 976 standard and all isotopic compositions are reported relative to this standard.
The long-term reproducibility was determined by repeat analyses of a 100 ppb solution of a secondary pure Cu standard obtained from A. Matthews, Hebrew University, Jerusalem. The secondary standard was run against the NIST SRM 976 and gave δ65Cu = 0.12 ± 0.07‰ (2σ, n = 90) for a period of 21 months during which the data presented in this study were obtained. This laboratory has previously published analyses of rock standards, in replicate, that demonstrate that reproducibility as well as accuracy of Cu isotope analysis of samples with more complex matrices is similar to the reproducibility of the pure secondary standard [36].
Powdered bulk samples were analyzed for total organic carbon (TOC) using a Vario MICRO Element Analyzer (Analysensysteme GmbH), with an analytical reproducibility of ±0.2%. Prior to analysis the inorganic carbon was removed via fumigation with 12 M HCl for 72 h, followed by 84 h of drying over NaOH pellets at 70 °C in a desiccator. Acetanilide and atropine were used as standards for calibration, and the data were processed using the Vario MICRO software.
The extracted OPFs of Peru Margin samples were analyzed for their TOC and δ13C as detailed in Ciscato et al. [40] and the isotope ratios are reported in the conventional notation with respect to the V-PDB (Vienna Pee Dee Belemnite) standard:
δ 13 C = [ ( 13 C / 12 C ) s a m p l e ( 13 C / 12 C ) V P D B 1 ] ×   1000 ,

3. Results

3.1. Organic Carbon Abundance and Isotope Composition

The TOC contents and carbon isotope composition of the Peru Margin sediments have already been presented and discussed in Ciscato et al. [40]. However, they are tabulated again in Table 1 for easier reference. Overall, the TOC contents vary between 1.6 and 12.4 wt.%. Samples from within the OMZ are the most organic-rich, followed by the samples from the upper edge of the OMZ, with the samples from below the OMZ containing the least organic carbon. In line with previous results from sediments collected in the same area [37,42], this likely reflects the greater preservation potential of more oxygen depleted and shallower locations. The δ13C of the extracted organic fractions covers a narrow range, between −20.3 and −22.2‰, typical of marine-derived organic matter for sediments from the same area [43].
The TOC contents of the geological record samples vary between 0.1 and 23 wt.% (Table 2). Sediments with a range of TOC contents were intentionally chosen, whilst especially targeting those samples with the highest organic carbon contents among those available for each formation. The δ13C of the extracted organic fractions ranges between −22.3 and −39.2‰, with the lightest values observed for Archean samples. Overall, our data are in agreement with δ13C signatures obtained from both bulk TOC and extracted kerogens compiled by Eigenbrode and Freeman [41]. Where a comparison between our data and previously published data on the same samples is possible, we find good agreement to within ±2‰.

3.2. Copper Concentrations and Isotope Composition of Modern Organic-Rich Sediments

Copper concentrations and isotope compositions for the bulk (Figure 1a) and individual OPF and HFD fractions (Figure 1b) of Peru Margin samples are presented in Table 1. Bulk Cu concentrations range between 11 and 66 ppm. The highest abundances are observed in samples from the most anoxic core MC11C, located within the OMZ, with lower values in samples from the more oxic cores MC6A and MC9G, located on the upper edge and below the OMZ, respectively.
Variations in Cu concentrations for the core-tops appear to be de-coupled from oxygen availability and vary in a more random fashion. For all samples >35% of the total Cu is contained in the OPF fraction, and for most of these (29 of 33) >50% of the Cu is in the OPF (Figure 1a,b; Table 1). As with the bulk concentration data, this proportion decreases with increasing bottom water oxygen for the samples from cores MC11C (77–92%), MC6A (35–70%), and MC9G (38–65%). Again, there is a more random variation in the core-tops.
A clear difference in the isotope composition is observable between the two fractions (Figure 1b), with δ65Cu ranging from −0.38 to +0.37 in the OPF and from +0.44 to +1.32‰ in the HFD. The δ65Cu of the bulk sample covers a narrower range, of +0.07 to +0.61, mostly between the average values for the UCC and the deep ocean.

3.3. Copper Concentrations and Isotope Composition of Ancient Organic-Rich Sediments

Copper concentrations and isotope compositions for the bulk and the individual OPF and HFD fractions of the geological record samples are presented in Table 2. With the exception of two anomalously enriched samples, all bulk Cu concentrations fall within a range of 1.3 and 155 ppm, with no systematic secular trend. In contrast to the Peru Margin samples, most of the Cu is contained in the HFD fractions (65–99.8% of the bulk). The OPF fractions always contain <35% of the bulk Cu, with the exception of two samples (WS2 and WS4) that have 71% and 86% in the OPF. Absolute concentrations in the HFD fractions range between 0.36 and 131 ppm, with two anomalously enriched samples at 306 and 353 ppm. As the HFD is the main contributor to the bulk Cu abundance, the range of Cu concentrations in this fraction follows nearly the same constant pattern through time as that for the bulk samples. Absolute Cu concentrations in the OPF range between 0.01 and 42 ppm, with the highest concentrations observed in samples from the Archean and Paleoproterozoic.
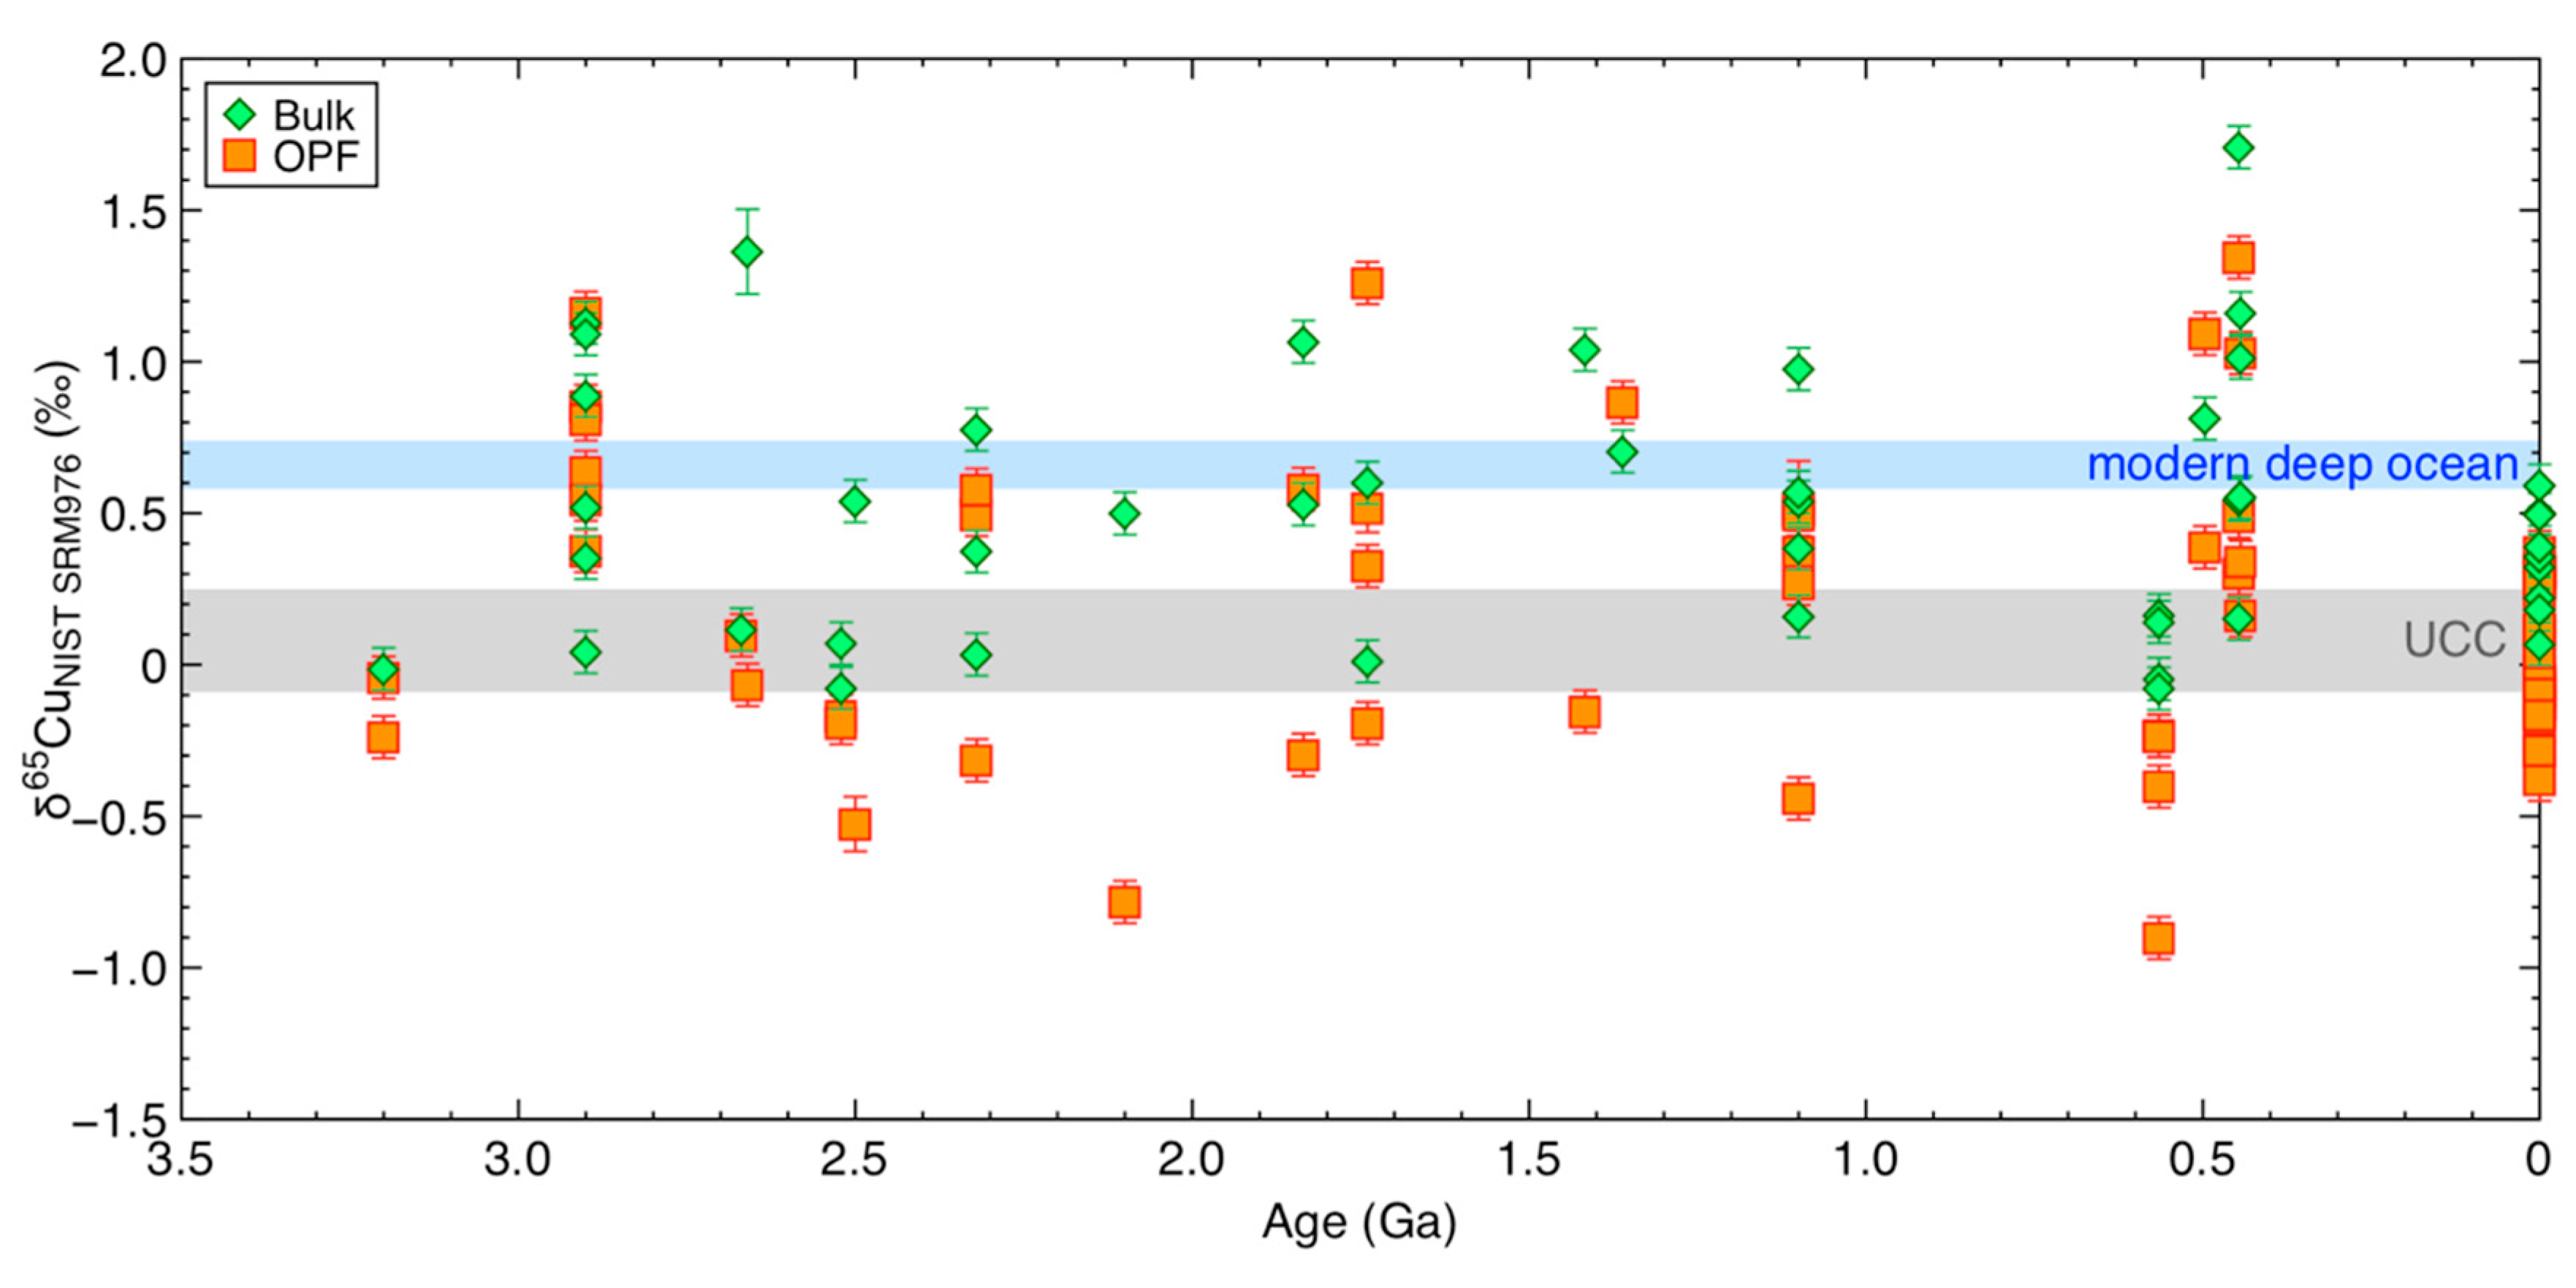
The bulk δ65Cu is heavier than or within uncertainty of the UCC average at all times, with an overall range of −0.08 to +1.71‰. The OPF and HFD cover a much wider range, between −0.90 and +1.34‰ for the OPF, and between −0.10 and +1.86‰ for the HFD (Figure 2, Table 2).

4. Discussion

4.1. Tests of the Two-Step Digestion Methodology

The approach adopted here, whereby we separate and analyse the two operationally defined fractions (HFD and OPF), provides more information on the distribution and behavior of Cu and other elements in organic-rich sediments than can be achieved with a traditional bulk digestion. As described and demonstrated in Ciscato et al. [40], the extraction of organic matter in the OPF is nearly complete and there is virtually no method-induced carbon isotope fractionation. The presence of small amounts of Al in the OPF fraction is almost certainly due to residual fluoride salts [40], a common feature of HF digestion of silicates [44] that should not affect the distribution of Cu among the different fractions. The OPF fraction is also known to contain very small sulphide grains that are intimately associated with the organic matter in the OPF, but scanning electron microscope (SEM) observations demonstrate that these survive the HF treatment [40]. The digestion tests conducted here (see details in Section 3 and in Supplementary Information) suggest that mobilization of Cu from such grains, or from the organic matter of the OPF, by the HF digestion is minimal. At this stage we cannot confirm whether Cu is mobilized from other larger grains that are not intimately associated with organic matter. Specific observations from the digestion tests include: (1) the amount of Cu dissolved after a sample is subjected to a second and third HF digestion is analytically identical to that obtained after a single digestion; (2) the δ65Cu of the OPF fractions, whether the sample is subjected to one, two, or three HF treatments before the OPF residue is ashed and analysed, are within analytical uncertainty of each other; (3) nearly all the Cu in the HFD fraction is recovered by the first digestion, with an additional 16–22% added by a second treatment and ∼14% by a third treatment; (4) because most of the Cu is located in the OPF, these latter amounts correspond to <5% of the bulk Cu; (5) the δ65Cu of the HFD extracted by the first digestion is 0.10‰–0.17‰ heavier than that of the second treatment, with the HFD of the third treatment being about 0.5‰ lighter than that extracted by the first treatment. These tests suggest that the HF treatment does not extract significant amounts of Cu from the OPF, and that the isotope composition of the Cu in the residual OPF is not significantly affected by the HF treatment used to isolate the OPF residue. Though the small amounts of Cu obtained via a second and third HF digestion are significant in terms of the size of the HF-digestible fraction, they are small relative to the size of the OPF reservoir. These tests clearly demonstrate that the method adopted here does not achieve a perfect separation between the two targeted fractions. But it is also clear that it is adequate for our purposes. Most significantly, it seems clear that the Cu isotope composition of the OPF is not affected by the HF treatment.

4.2. The Source of Cu in Peru Margin Organic-Rich Sediments

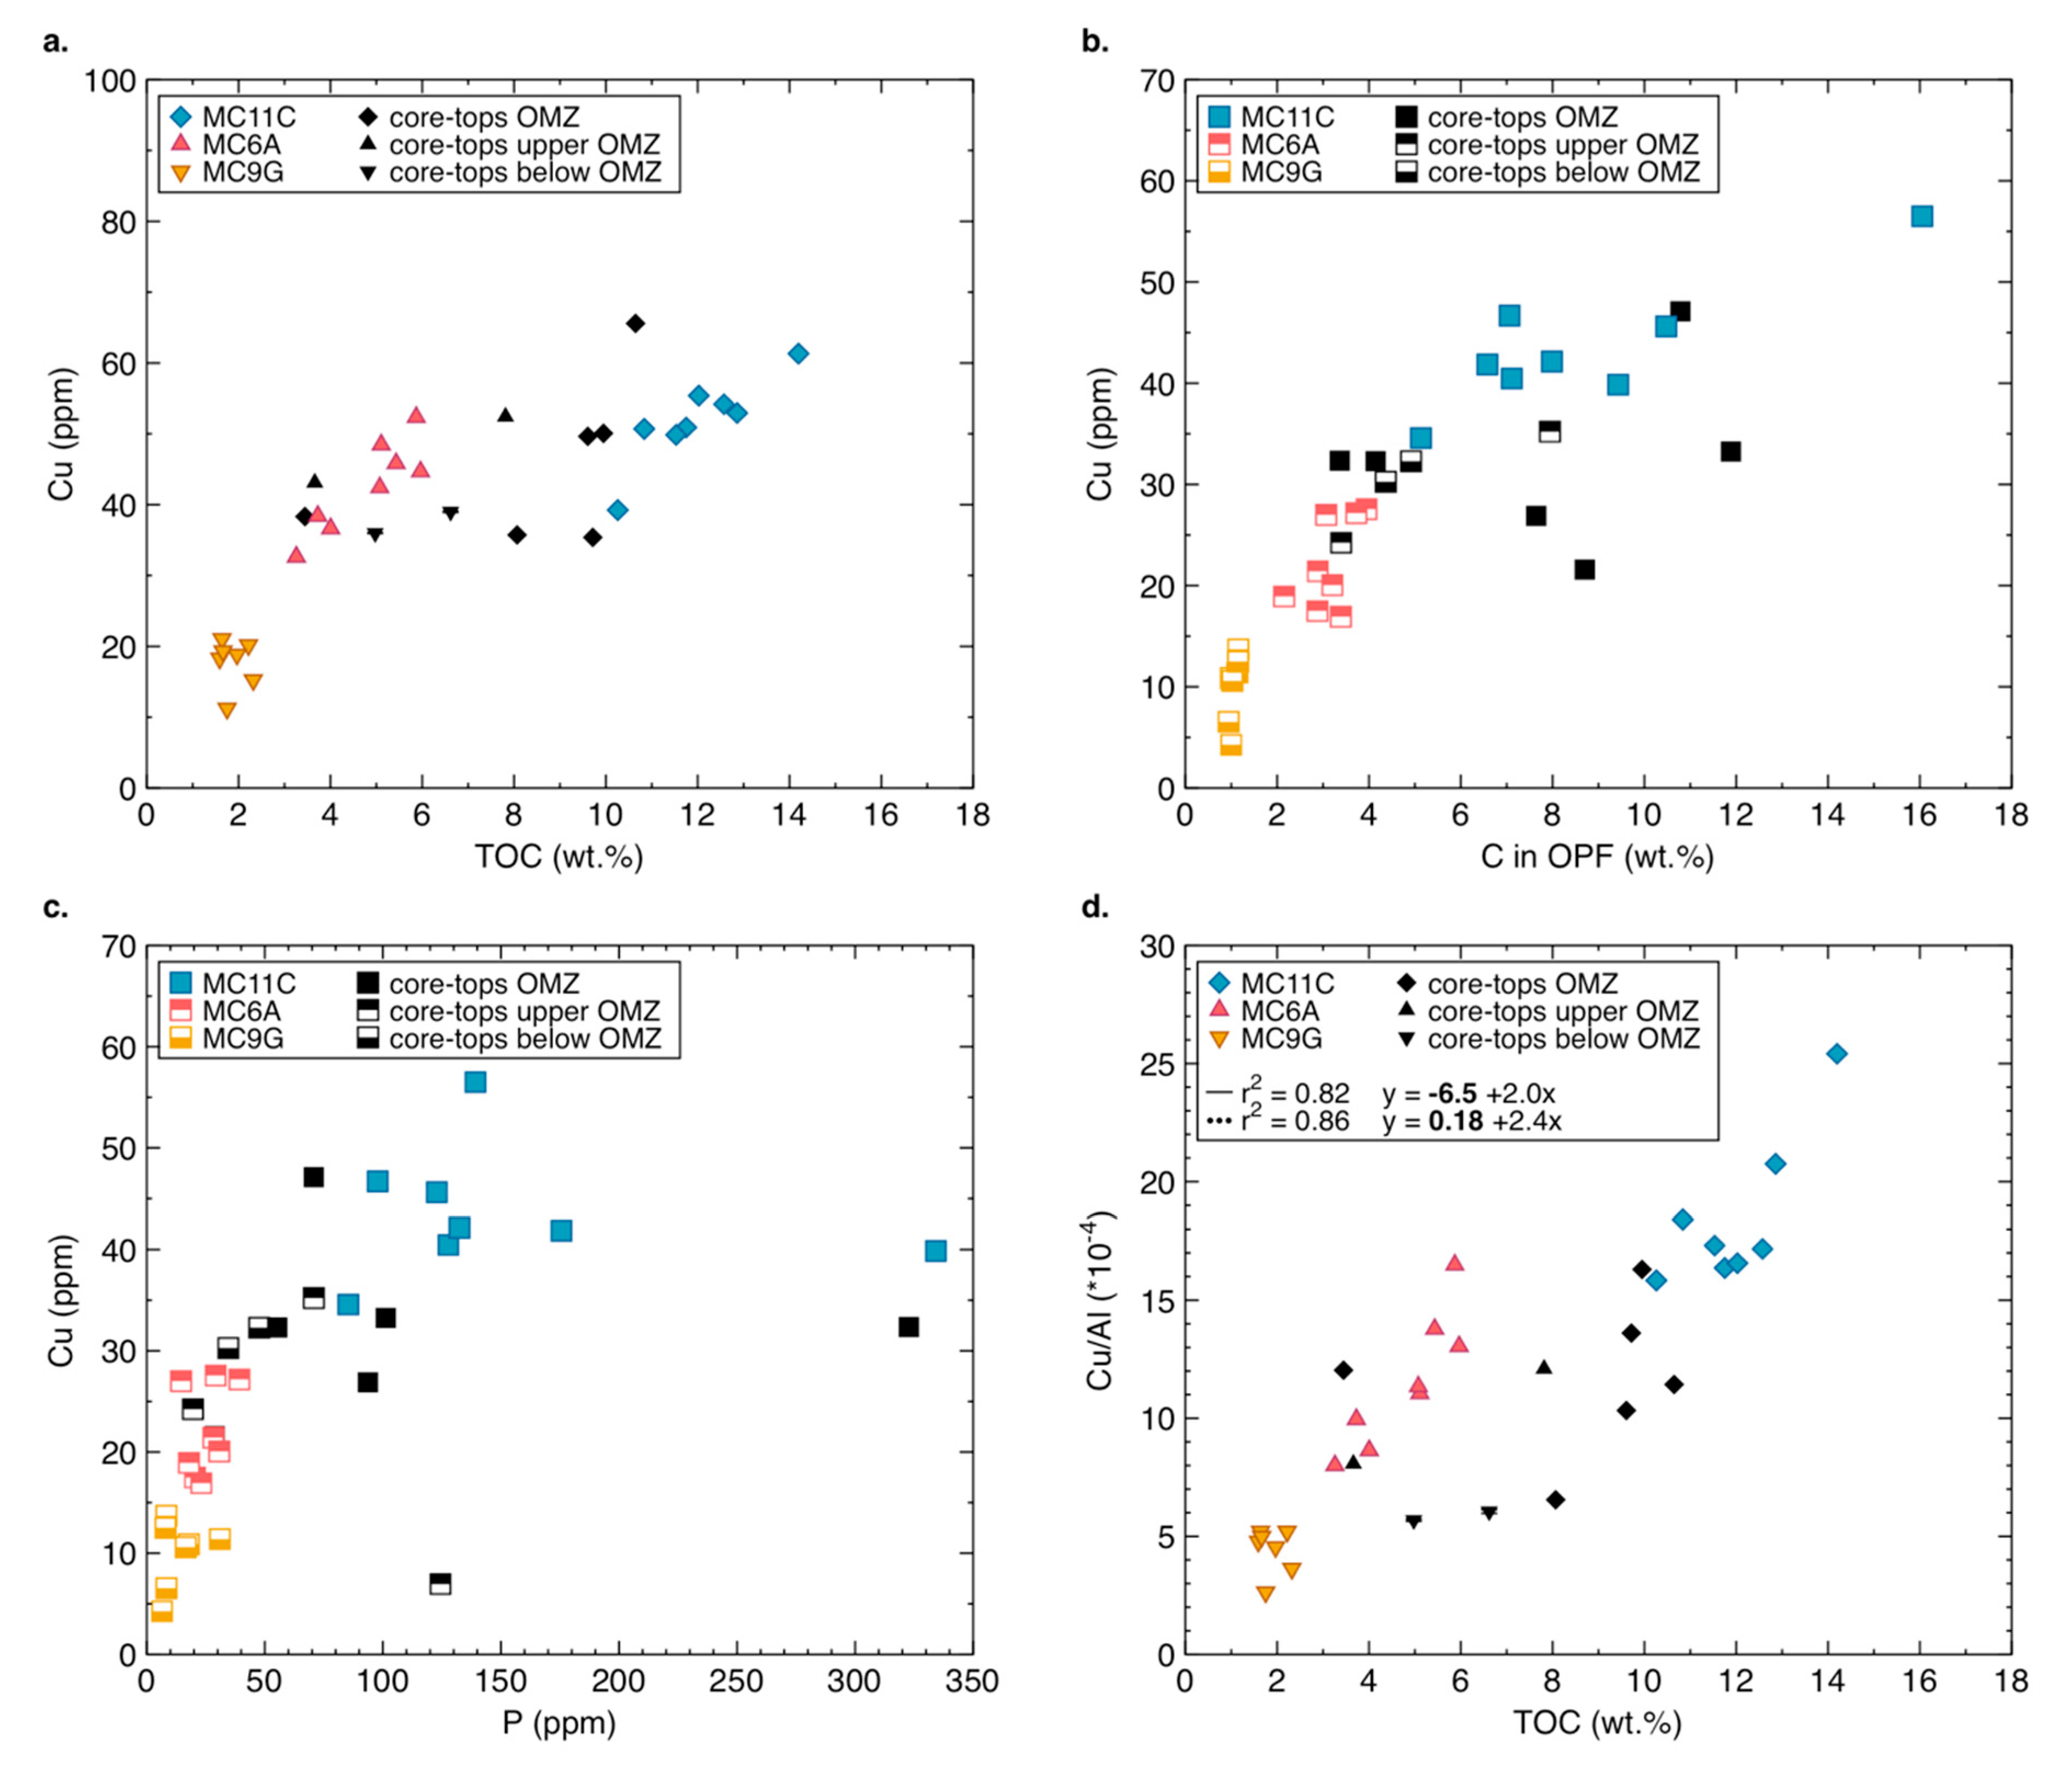
Böning et al. [45] and Ciscato et al. [40] previously reported a strong correlation between Ni abundance and TOC content in sediments from the Peru Margin, often with a near-zero intercept. Though both studies conclude that the Ni inventory of these sediments seems to be dominated by delivery from the photic zone to the sediment in association with organic matter, Ciscato et al. [40] highlighted the problem that Ni/TOC ratios implied by the correlations are much higher than those measured in phytoplankton cells. Ciscato et al. [40] note that this problem also applies to the organic-pyrite fraction of these sediments, which they also investigated for Ni, though for this latter fraction the Ni/TOC ratios are closer to those of photic zone organic matter. These authors put forward the hypothesis that Ni enrichment relative to carbon in the OPF of Peru Margin sediments may be due to preferential remineralisation of carbon, while the equivalent cellular Ni is retained. This idea is consistent with the finding that Ni/C ratios are elevated, to levels close to those seen in the OPF, in particulates collected in situ from sub-surface oxygen deficient zones (ODZ) along the Peru Margin [46]. It is also consistent with recent observational and modelling studies that stress the potential importance of metal sequestration into sulphide generated during the passage of organic matter through sub-surface low oxygen environments [47,48,49]. Here we observe a similar relationship between Cu and TOC in the bulk samples as well as in the OPF (Figure 3a,b). The Cu-TOC relationship observed for the bulk samples (Figure 3a) could either be described as a positive linear correlation with samples from the most oxic core MC9G lying on a different line, or the relationship may be curved and convex-up. If the former is the case, then the main correlation has a positive intercept, implying significant Cu in these sediments that is not associated with organic matter. This latter feature stands in contrast to Ni, and makes the consideration of the copper inventory of the bulk sediment more complicated. Another contrast with Ni lies in the fact that most of the Cu in these sediments is in the OPF, which is the opposite of Ni, where this proportion was generally only 5–25%.
Ciscato et al. [40] compared Ni/P and Ni/C ratios measured in the OPF fraction to those for plankton cells collected in the photic zone, specifically for the diatom cells that dominate the Peru Margin upwelling region [50,51]. Unfortunately, no such data exists for Cu in natural diatoms. Twining and Baines [8] report Cu/P ratios for bulk particles in coastal and open ocean sites and find them to be 0.18–2.1 mmol/mol, with extra-Southern Ocean diatoms represented by a single datum at 0.18 mmol/mol. In addition, Twining and Baines [8] note that some of the higher values for these bulk samples are contaminated by lithogenic material. Ho et al. [52] report values of 0.18–0.28 mmol/mol for cultured diatoms. These ratios provide a useful starting point in the interpretation of the OPF data presented here. The Cu:TOC and Cu:P relationships illustrated in Figure 3b,c are similar to those for the bulk Cu:TOC data, but do appear to be better described by a convex upward trend that comes close to passing through the origin. The Cu:P relationship suggests Cu/P ratios of 0.1–1.8 g/g equivalent to 50–900 mmol/mol. Though these Cu/P ratios are far in excess of the cellular quotas given above, C/P ratios for these samples are also much higher than Redfield ratios (up to 7800 mol/mol), consistent with the preferential remineralization of phosphorus relative to that of carbon that is well-known to occur in organic-rich sediments [53,54]. This complicates the interpretation of sedimentary metal/P ratios and we instead focus here on Cu/TOC. Apparent diatom Cu/P ratios of 0.2–0.3 mmol/mol (see above) correspond to Cu/C ratios of 2–3 μmol/mol for Redfield C/P ratios. The Cu/TOC ratios implied by the Cu-TOC relationship for the OPF vary from 2.5 to 12 × 10−4 g/g, equivalent to 5–22 μmol/mol. The positions of the different cores along the curve are probably significant. Thus, core MC9G (most oxic) is on the steep lower part of the curve and these samples have highest Cu/TOC ratios. Samples from the most reducing setting, core MC11C, on the other hand, are on the more gently-sloping upper part of the curve, having lower Cu/TOC ratios.
Thus, and as found by Ciscato et al. [40] for Ni, Cu/TOC ratios in the OPF of Peru Margin sediments are in excess of those that can be explained by intra-cellular quotas alone. Further, the amount of excess Cu depends on the redox setting, with more oxidising settings being associated with the highest Cu/TOC. One potentially significant difference between Ni and Cu is the much greater tendency for Cu to be scavenged to particulate surfaces (e.g., [9]), so that the Cu/C ratios in particles exported from the photic zone could potentially be much greater than intra-cellular ratios. Though this process may be relevant to some degree, it is not obvious why such scavenging would be so much more intense in the photic zone above oxic settings, leading to factor 5 higher Cu/TOC in sediments beneath these oxic as opposed to reducing settings (Figure 3b). Rather, it seems most likely that the main control on variable Cu/TOC ratios in the OPF occurs via regenerative modification of the organic material during its passage to the sediments, in response to variable redox control.
This suggestion, that the relationship between Cu and organic carbon content in the OPF is controlled by uptake in the photic zone and the subsequent modification of the Cu/TOC ratio during transfer to sediment, is similar to the hypothesis of Ciscato et al. [40] for Ni, outlined earlier. These authors attributed excess nickel in the OPF (relative to Ni/TOC ratios in the photic zone cells) to loss of carbon to regeneration from settling organic matter, while Ni from the same organic material is sequestered to sulphide and retained. Copper is highly reactive towards sulphide, and in anoxic sediments more than 60% of the Cu that is not bound to silicates can co-precipitate with pyrite at the sediment-water interface [55]. Thus, it seems likely that a similar mechanism can be invoked to explain excess Cu over TOC here. In the context of this explanation, the highest Cu/TOC ratios, found in the core from the most oxic bottom water, would be rationalised in terms of greater loss of carbon over Cu relative to more reducing settings. Again as noted earlier, Ohnemus et al. [46] found high metal/TOC ratios in particulates from sub-surface oxygen deficient zones on the Peru Margin, including Cu/P ratios consistent with Cu/TOC ratios in Figure 3b. Although the original paper in which these data are presented interpreted them in terms of anomalous cellular metal/P ratios in prokaryotic organisms, an interpretation in terms of “normal” eukaryotic uptake ratios to carbon in the photic zone followed by preferential retention of metal over carbon during regeneration is perhaps more likely.
We return to the details of Cu isotopes in the OPF in Section 4.3. To summarize the discussion up to this point, the processes controlling the OPF Cu isotopes are likely to be: (a) uptake in the photic zone; (b) transfer of Cu to sulphide on the way down the water column while carbon is lost; (c) possible transfer of Cu from other authigenic components of the sediment, and perhaps Cu from seawater during passage from the photic zone to the sediment, into sulphide.

4.3. The Control of Sulphidation on Cu Isotopes in Peru Margin Sediments

Ciscato et al. [40] use relationships between patterns of Ni abundance and isotope composition in the OPF, as well as between Ni and carbon isotopes, to suggest that the OPF extracted using the same approach as employed here must remain a pseudo-closed system for Ni from the photic zone to the sediment, with loss of carbon to regeneration while Ni is retained through sequestration to small sulphide grains intimately associated with residual organic carbon. Whether this suggestion also applies to Cu as well is important because, in the context of the hypothesis presented in the previous section, it determines the degree to which the OPF reflects the isotope composition of Cu taken up in the photic zone. Recently, Bianchi et al. [49] modelled the dynamics of sulphide formation within particles sinking through the water column, and suggest that such sulphides would scavenge metal from the water column in addition to sequestering metal from the regenerating organic matter itself. Given the greater affinity of Cu for particle surfaces in general, and the greater reactivity towards sulphide in particular, such a process may be much more important for Cu than for Ni, implying that the OPF is significantly modified in its passage through the water column and into the sediment. This potential for modification of the Cu isotope composition of the OPF is further enhanced by the very large isotope fractionations between sulphide bound Cu and other forms [24,56,57]. In this section we explore this issue using the isotope data from the OPF in sediments from the Peru Margin.
Figure 4 shows the relationship between Cu abundance and δ65Cu of the OPF for all Peru Margin sediments. With the exception of samples from the most oxic core MC9G, most samples lie on an array consistent with removal from a homogeneous reservoir in a closed system (Rayleigh distillation), with preferential removal of the heavy isotope and an apparent fractionation factor of 1.0007. The evolution of the OPF towards lighter Cu could be seen as tracking the reservoir, moving to lower Cu concentrations and lighter isotopes, as heavy Cu is removed. In principle, the reservoir from which the Cu is removed might be seawater. Such a hypothesis is similar to the process invoked by Ciscato et al. [40] for Ni, though with a fractionation into organic matter in the opposite direction. The removal of Cu from the photic zone could be associated with this sign of fractionation if it were controlled by scavenging and sorption rather than by biological uptake.
However, such a hypothesis would require a seawater reservoir with a starting Cu isotope composition of −0.3‰, while subsequent removal of heavy Cu would drive it even lighter; e.g., the lightest OPF (about −0.4‰) would require a reservoir that is −1.1‰ at this point. Importantly, the correlation between Ni concentrations and isotope compositions of the OPFs reported by Ciscato et al. [40] is consistent with observed Ni seawater compositions. For Cu it is not: seawater Cu that is this light has never been measured [3,33]. Furthermore, the relationships between Cu isotopes and those of carbon are not systematic as they are for Ni [40]. Therefore, the controls on Cu delivery from the photic zone to the sediment and the associated isotope fractionations cannot be explained by the same processes used to describe Ni systematics, and point towards a more complex scenario.
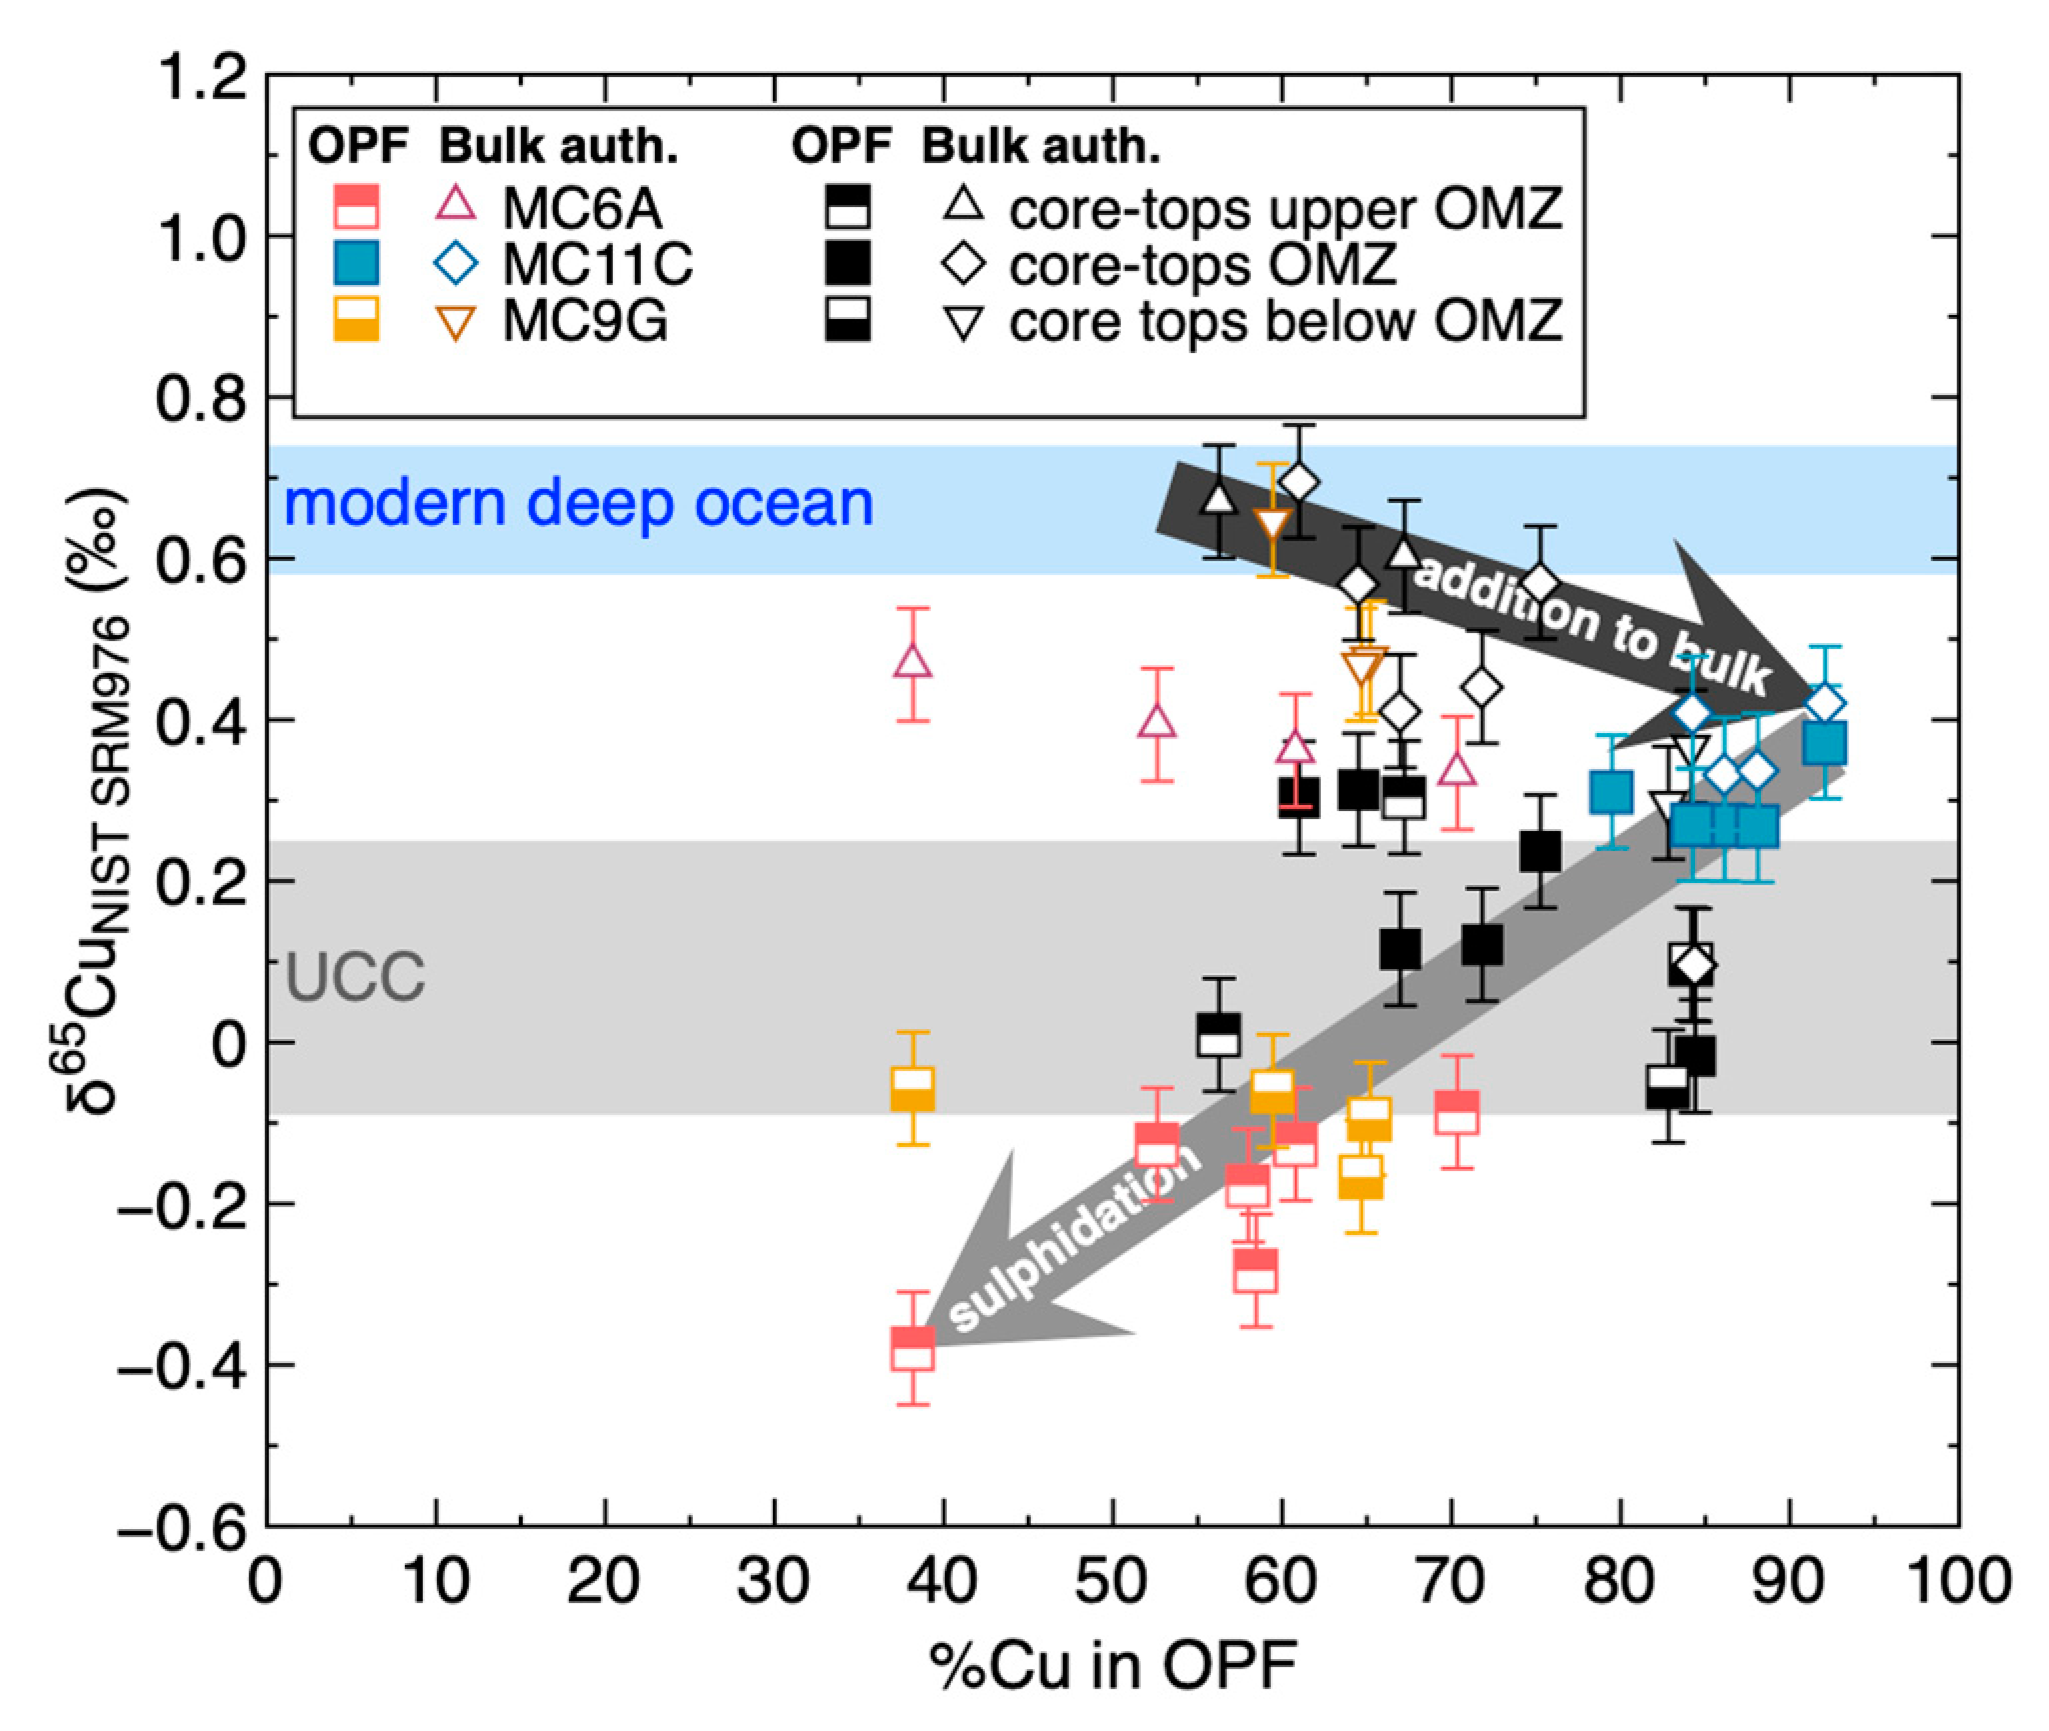
Figure 5 compares the δ65Cu of the OPF and that of the authigenic bulk sample (see Section 4.4 for details on the calculation of bulk authigenic compositions) as a function of the proportion of bulk Cu found in the OPF. These data are consistent with a more complex scenario for Cu than for Ni, as follows: (1) an initial bulk authigenic reservoir (acquired in the water column) that is similar to seawater δ65Cu [33]; (2) variable degrees of sulphidation of this reservoir, and transfer to the OPF, in either the water column or the sediment or both; (3) near complete transfer to the OPF for the more anoxic core (e.g., MC11C), leading to higher percentages of Cu in the OPF and, because of near-quantitative transfer, an OPF isotope composition that is identical, within uncertainty, to the bulk authigenic value; (4) less complete transfer of Cu to the OPF for the more oxic cores, leading to a lighter OPF because of the large fractionation into sulphide [4,24,56,57] and non-quantitative transfer. This set of processes is shown schematically via the lighter grey arrow on Figure 5.
An important question that arises at this point concerns the extent to which the bulk authigenic Cu pool is closed as the above scenario plays out. Or is there additional Cu scavenged on the way through the water column and into the sediment, and also added to the OPF? If the variable proportion of bulk Cu in the OPF were simply due to different partitioning of a single authigenic source of Cu from the photic zone, between the HFD and the OPF, then the δ65Cu of the bulk should not vary. The bulk authigenic δ65Cu in Figure 5, however, suggests that there may be addition of light Cu to the bulk authigenic reservoir. For example, samples at the right-hand side of Figure 5 do appear to show lighter bulk Cu isotopes (dark grey arrow on Figure 5) as the proportion of bulk Cu in the OPF increases. This is potentially important because it might suggest the addition of light Cu to the bulk authigenic reservoir in more anoxic settings, for the same samples where the authigenic Cu is near-quantitatively transferred to the OPF. If correct, and given again that sulphidized Cu would be isotopically light [4,24,56,57], such a hypothesis would support recent studies [49] that invoke sequestration of water column metals into organic-associated sulphide during transfer to sediment. The data in Figure 5 would suggest that such a process is minor, however. The shift towards lighter Cu isotope compositions across Figure 5, of about 0.2‰–0.3‰, would imply about 10% addition of Cu with a δ65Cu of about −2.4‰, consistent with that from sulphidation (measured ∆ = 3.06‰; [24]) of deep seawater (+0.66‰). On the other hand, if Cu were scavenged from seawater without fractionation and only transferred to sulphide later, the data on Figure 5 would permit greater scavenging during passage through the water column.
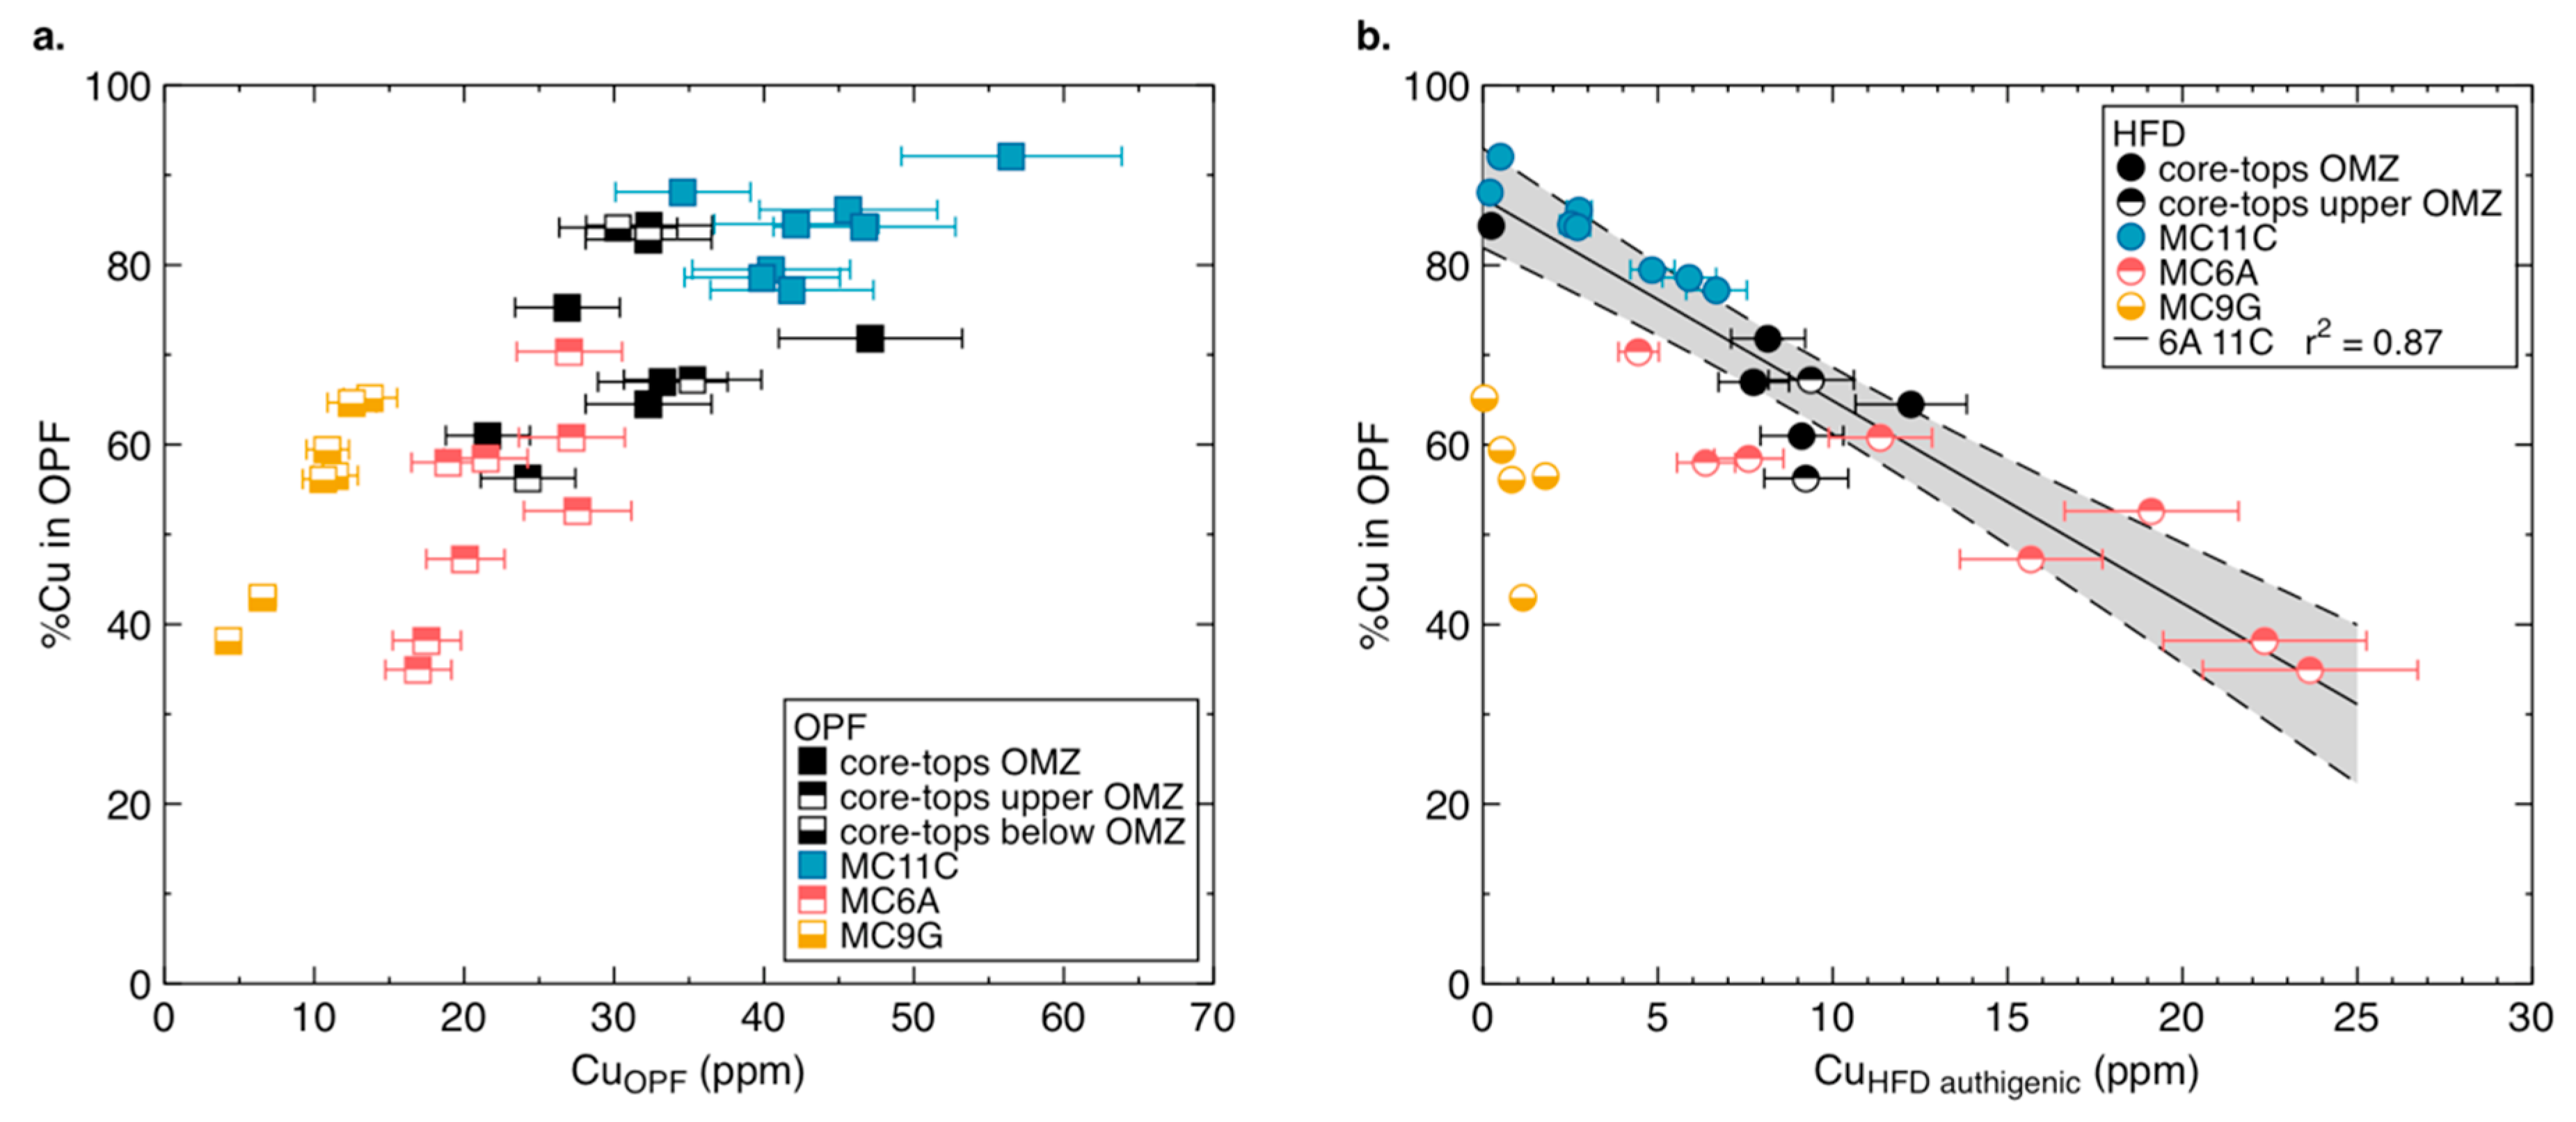
In theory, the above hypotheses would predict higher authigenic Cu contents in the samples that have acquired light Cu from the water column. This is a difficult prediction to test, however, because the highest productivity also occurs above the most anoxic core location, also impacting amounts of bulk authigenic Cu. Another potential test involves the degree to which the proportion of Cu in the OPF is controlled by changes in the absolute concentration in the OPF only—which one might expect if there was addition by sulphidation of seawater—or whether the variability in this proportion is also driven by changes in absolute contents of Cu in the HFD fraction. Higher absolute abundances of Cu in the OPF are associated with higher proportions of the bulk Cu found in the OPF (Figure 6a). Thus, the proportion of Cu in the OPF is certainly driven, to some degree, by increasing absolute amounts of Cu in the OPF. On the other hand, there is also a good negative relationship between the absolute amount of authigenic Cu in the HFD and the proportion of bulk Cu in the OPF for cores MC6A and MC11C (Figure 6b), suggesting that the proportion of Cu in the OPF is driven by variability there too.

4.4. Detrital Correction and Authigenic Cu in Peru Margin and Ancient Sediments

A further similarity between Cu and Ni is that both metals exhibit substantial authigenic con- tributions to bulk concentrations in sediments of the Peru Margin, as already highlighted by Böning et al. [58]. In particular, these authors emphasize the need for an appropriate detrital correction in order to adequately estimate the authigenic portion of these metals. The traditional approach, and that adopted here, is to use Al concentrations to track detrital input, as this metal is abundant in silicate minerals but present at low concentrations in seawater [59]. Thus:
[Cu]authigenic = [Cu]bulk sample − [Al]bulk sample × (Cu/Al)detrital,
Traditionally, a value of average shale or UCC is taken for the Cu/Al detrital ratio. However, Böning et al. [58] found that this overestimates detrital contributions to the Cu and Ni inventories of upwelling margin sediment, and proposed an alternative approach. On a Cu/Al vs. TOC plot the y-intercept of the linear correlation between these two parameters should indicate the local and more appropriate detrital background, provided that the correlation is good (see Figure 3d for the samples discussed here; [58]). Böning et al. [58] found a value of detrital Cu/Al = 1.8 × 10⁻⁴ g/g for sediments from the Peru Margin. Given the much greater data and spatial coverage than available here, we use this value of 1.8 × 10⁻⁴ g/g. The detrital correction will also affect the δ65Cu of the sample, given that the detrital input will contribute a detrital isotope signature to the bulk composition of the sediment. The associated authigenic isotope composition is then obtained from:
δ 65 C u a u t h i g e n i c = δ 65 C u b u l k f d e t r i t a l   ×   δ 65 C u d e t r i t a l f a u t h i g e n i c ,
where fauthigenic and fdetrital are the authigenic and detrital fractions, respectively, and δ65Cubulk, δ65Cudetrital, and δ65Cuauthigenic are the isotope compositions of the bulk, detrital, and authigenic copper, respectively. The detrital δ65Cu used here is −0.09‰, which is the lightest possible value for the detrital end-member given an average of +0.08 ± 0.17‰ as the current best estimate available for the UCC [4], and hence yields the maximum possible correction to the δ65Cu. Our choice of detrital δ65Cu also involves the assumption that there is no significant difference between the isotopic composition of the local detrital background and that of the average UCC.
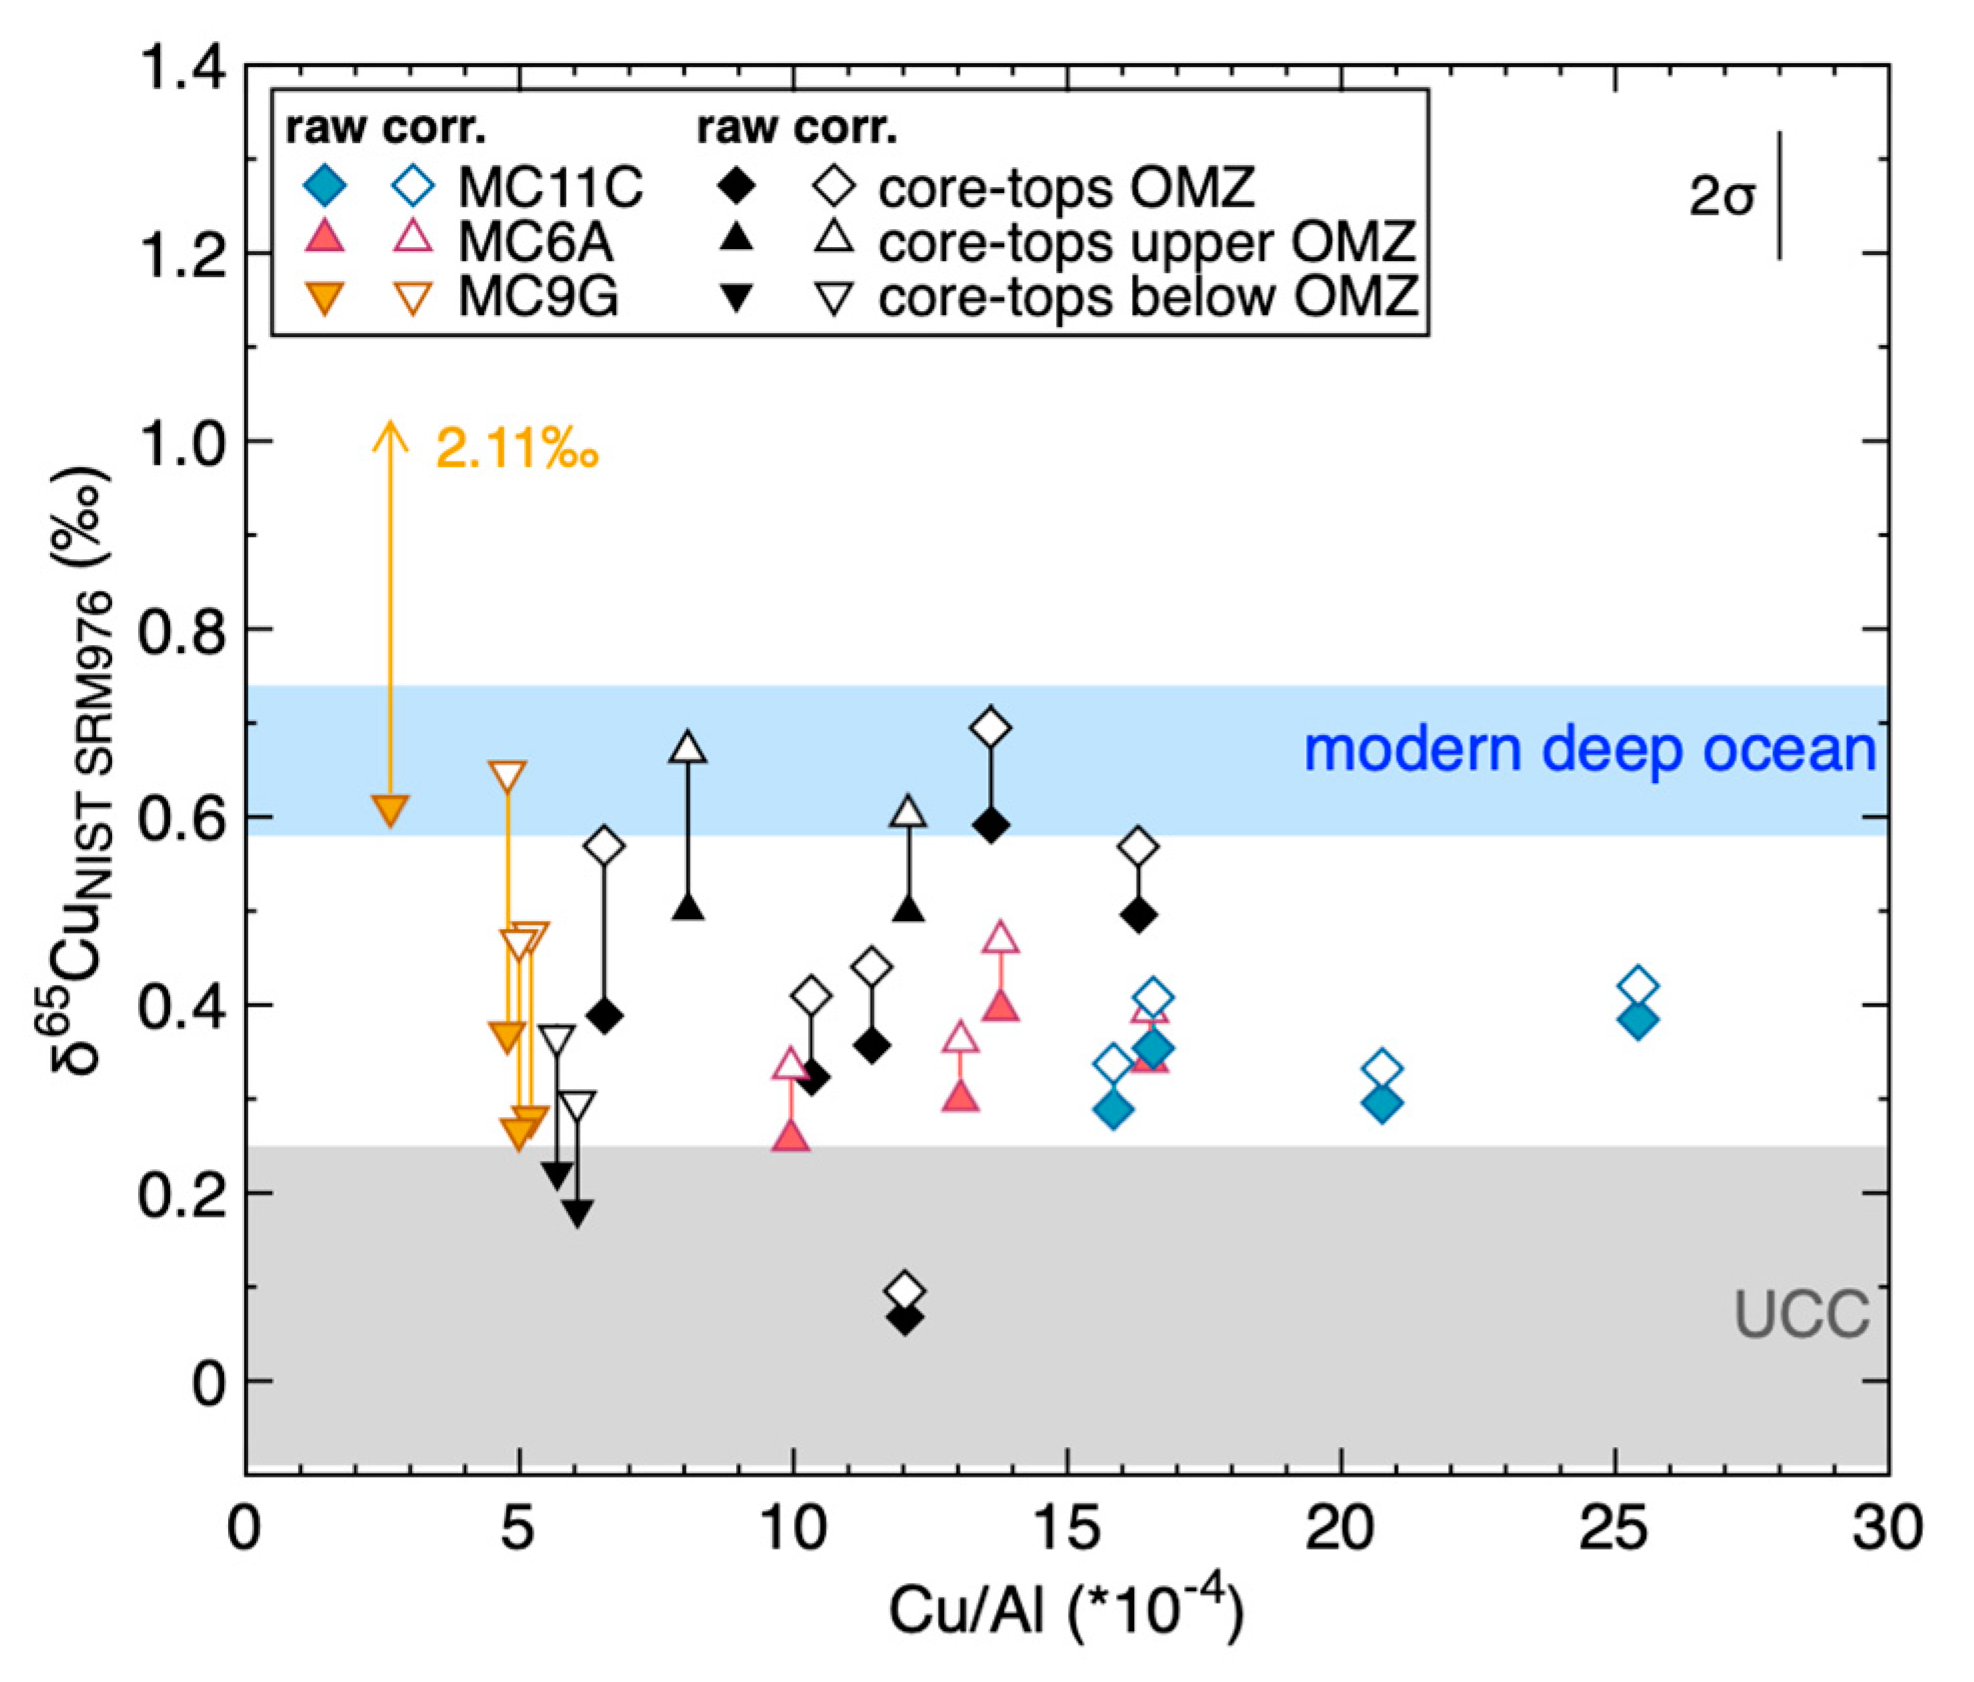
As illustrated in Figure 7, the applied detrital correction returns a ∆65Cuauthigenic-measured within the long-term reproducibility of the bulk value (±0.07‰) for most samples. The exception is those samples from the most oxic core MC9G. The measured bulk δ65Cu data are in line with the authigenic range reported by Little et al. [36] for bulk organic-rich sediments in upwelling margins. The corrected authigenic compositions are mostly heavier than this, but, as just noted, within the long-term reproducibility of the measured bulk values and hence also in agreement with Little et al. [36] within uncertainty.

4.5. Copper and its Isotopes in Bulk Ancient Shales

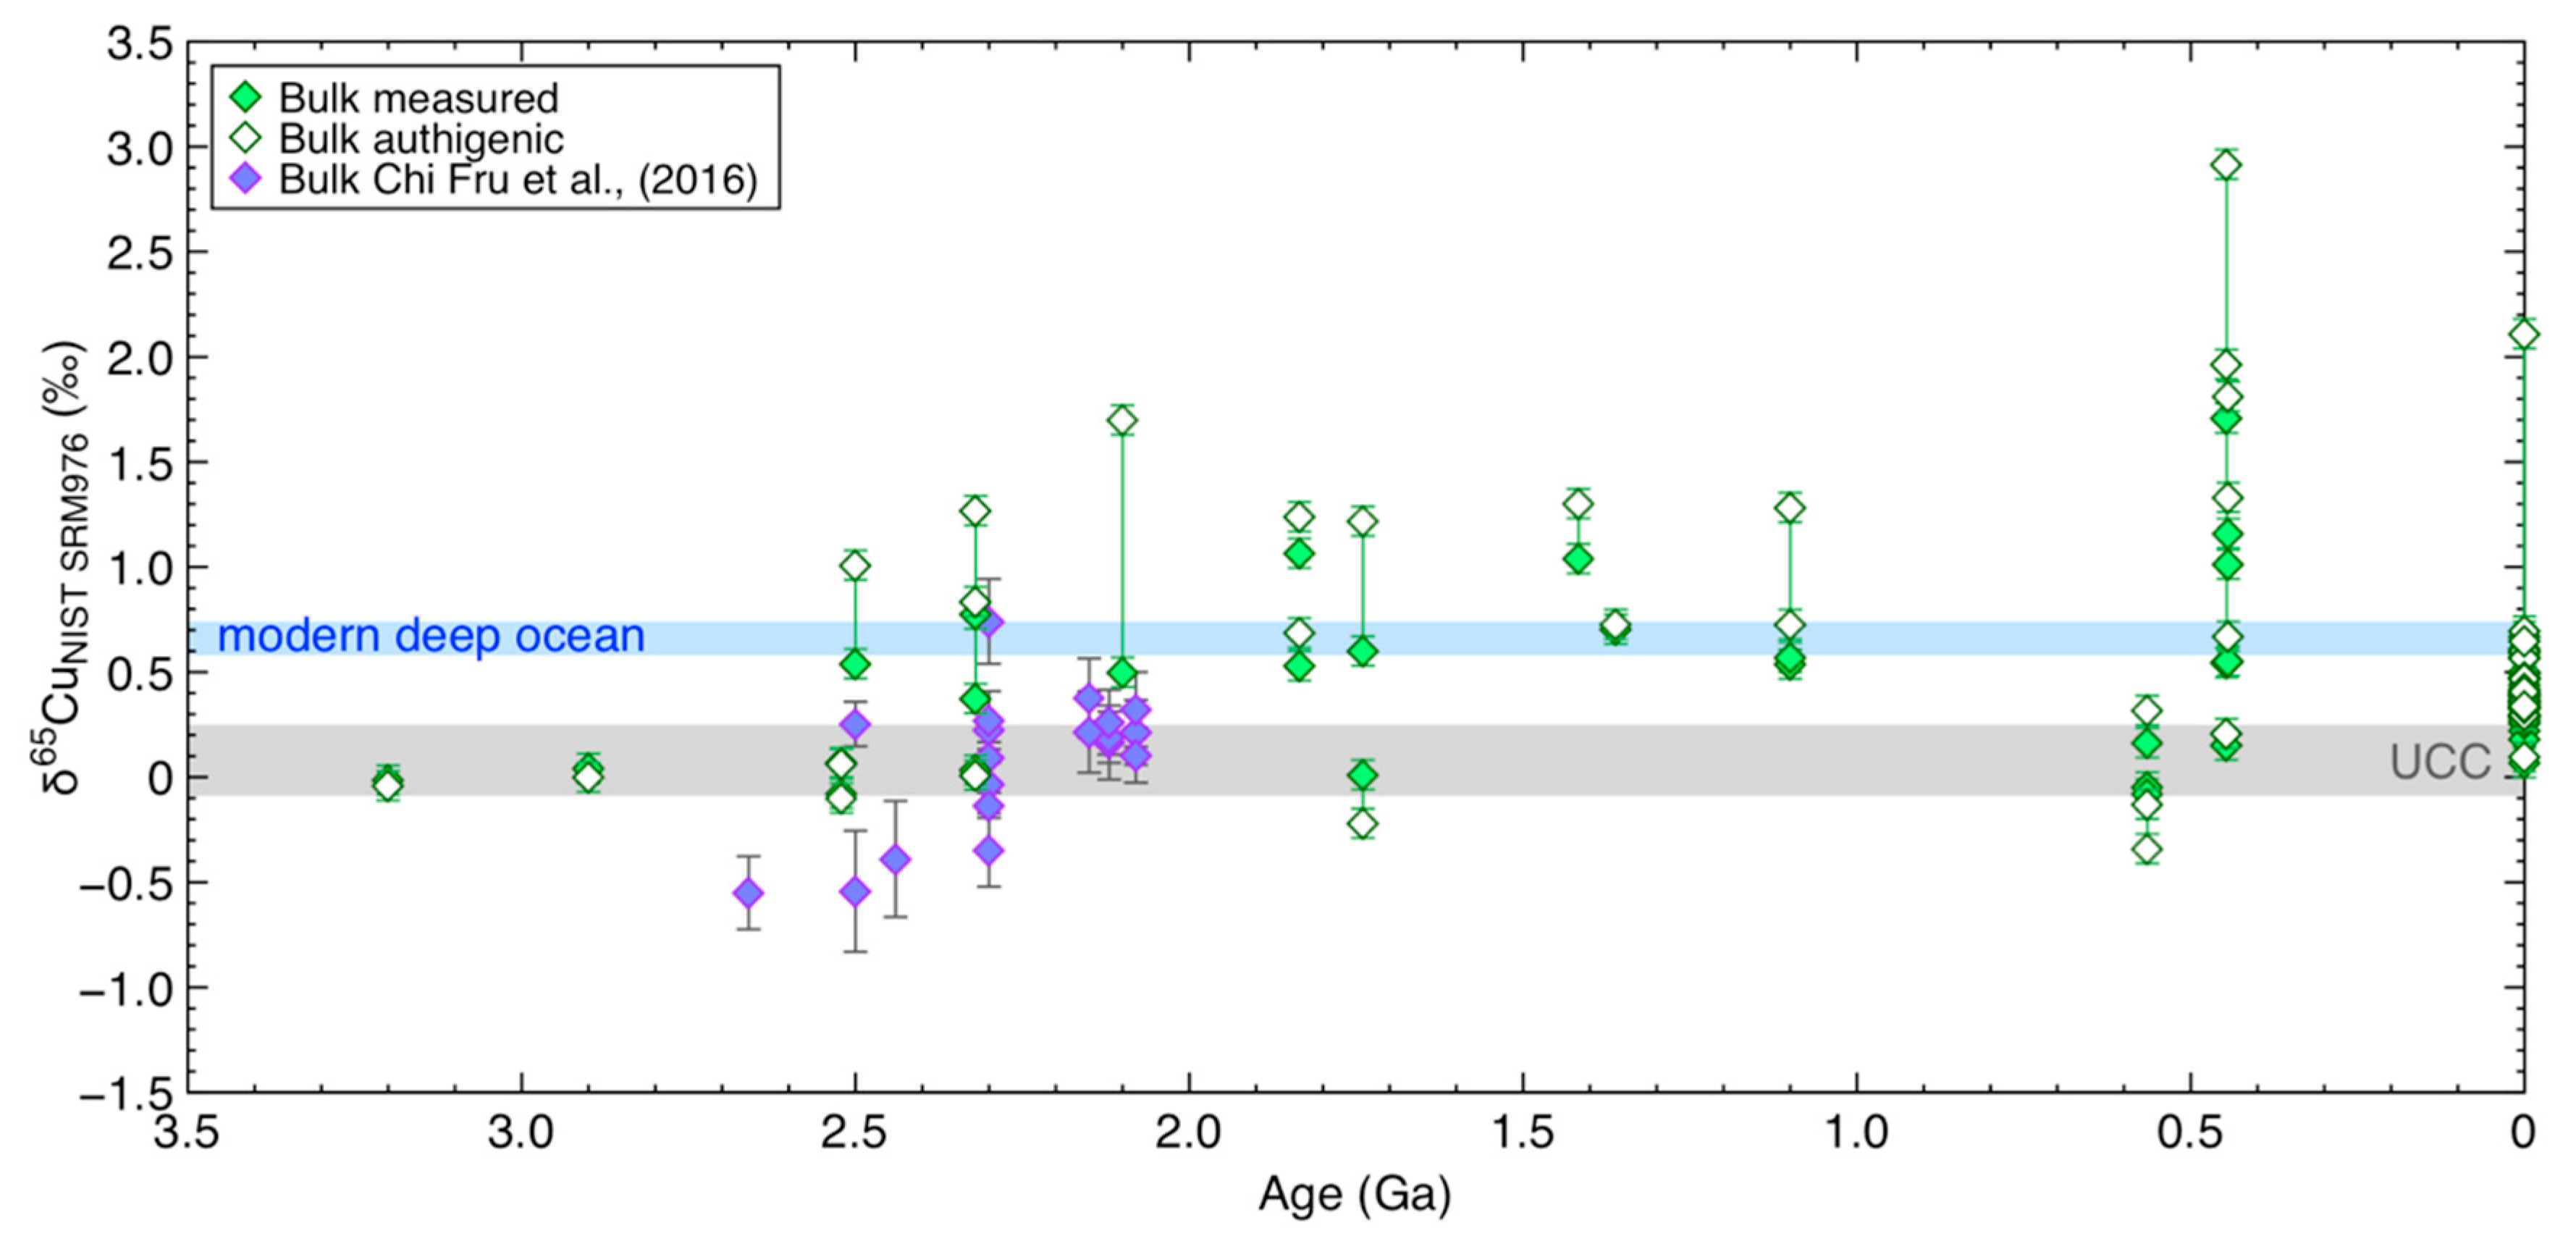
Extraction of an authigenic signature from bulk copper isotope compositions to understand seawater composition and related processes back in time, also requires a detrital correction. However, in this case, the precise local detrital background is not available. The conventional approach is to use average crustal Cu/Al ratios. Figure 8 shows the results of such an approach for all samples with fauthigenic > 0.2, using Equations (2) and (3) above, with δ65Cudetrital = +0.08‰ and Cu/Aldetrital of 1.0 × 10⁻³ g/g for the Archean and of 3.1 × 10⁻⁴ g/g for post-Archean samples [60]. The resultant bulk authigenic δ65Cu values are shifted from the measured bulk δ65Cu beyond the long-term analytical reproducibility in cases when fauthigenic is less than 0.60 or the measured δ65Cu is not itself within the detrital range (+0.08 ± 0.17‰).
The detrital Cu/Al ratio used above for the Archean is significantly greater than that used for modern Peru Margin sediments and for post-Archean samples, and some samples have a Cu/Al ratio that is less than this value. This high value has been suggested to result from low atmospheric oxygen concentrations [6], so that the detrital fraction contains un-weathered Cu-rich sulphides derived from crustal rocks. Chi Fru et al. [6], who present a record of δ65Cu for bulk shales ranging in age between 2.66 and 2.08 Ga do not present Al data, but their samples have much higher bulk Cu concentrations than those analysed here (90–2000 ppm versus 1–350 ppm here, with only 8 values higher than 100 ppm), so that their use of the bulk Cu isotope compositions without any detrital correction is probably justified. For example, samples in the dataset under consideration here that have Cu concentrations in excess of 90 ppm all require small, though significant, detrital corrections. For the dataset presented here, most samples containing appreciable authigenic Cu show bulk Cu that is similar to or heavier than the UCC average.
The above considerations highlight the challenge in the determination and interpretation of a bulk authigenic signature from ancient samples, especially samples with small fractions of authigenic Cu. Figure 8, however, and in particular with the Chi Fru et al. [6] data, hints at some interesting features. Though data are scarce, none of the pre-Great Oxidation Event (GOE) samples contain Cu with an isotope composition above the average UCC. On the other hand, none of the data presented here show evidence for isotope compositions below it either. Chi Fru et al. [6] suggest that the negative values in their dataset may record preferential removal of the heavy isotope into Fe-oxides, a process that waned following the GOE. The data presented here are more consistent with a simple supply of crustal Cu to the oceans, and no isotope fractionation within them. However, it is acknowledged that more definitive statements require more data in this critical time interval. Subsequent to the GOE, Cu isotope compositions recorded by black shales are almost universally heavier than the UCC, with the bulk and authigenic values presented here often bracketing modern seawater. The increase during the interval just before and after the GOE mirrors that found by Chi Fru et al. [6] but is systematically displaced to slightly higher values overall. Again, data are scarce at this early stage, but the exception to these generally high δ65Cu values occurs in the interval 570–520 Ma, after which there are more very high values in samples associated with the Hirnantian Glaciation at about 444–446 Ma. The dataset is much too small to do more than hint at this stage, but it is intriguing that this step occurs close in time to the Neoproterozoic Oxidation Event (NOE; [61]), while the excursion in δ65Cu at 444–446 Ma coincides with the recently proposed Paleozoic Oxygenation Event (POE; [62]).

4.6. Copper in the OPF of Ancient Shales: Not Only Sulphidation

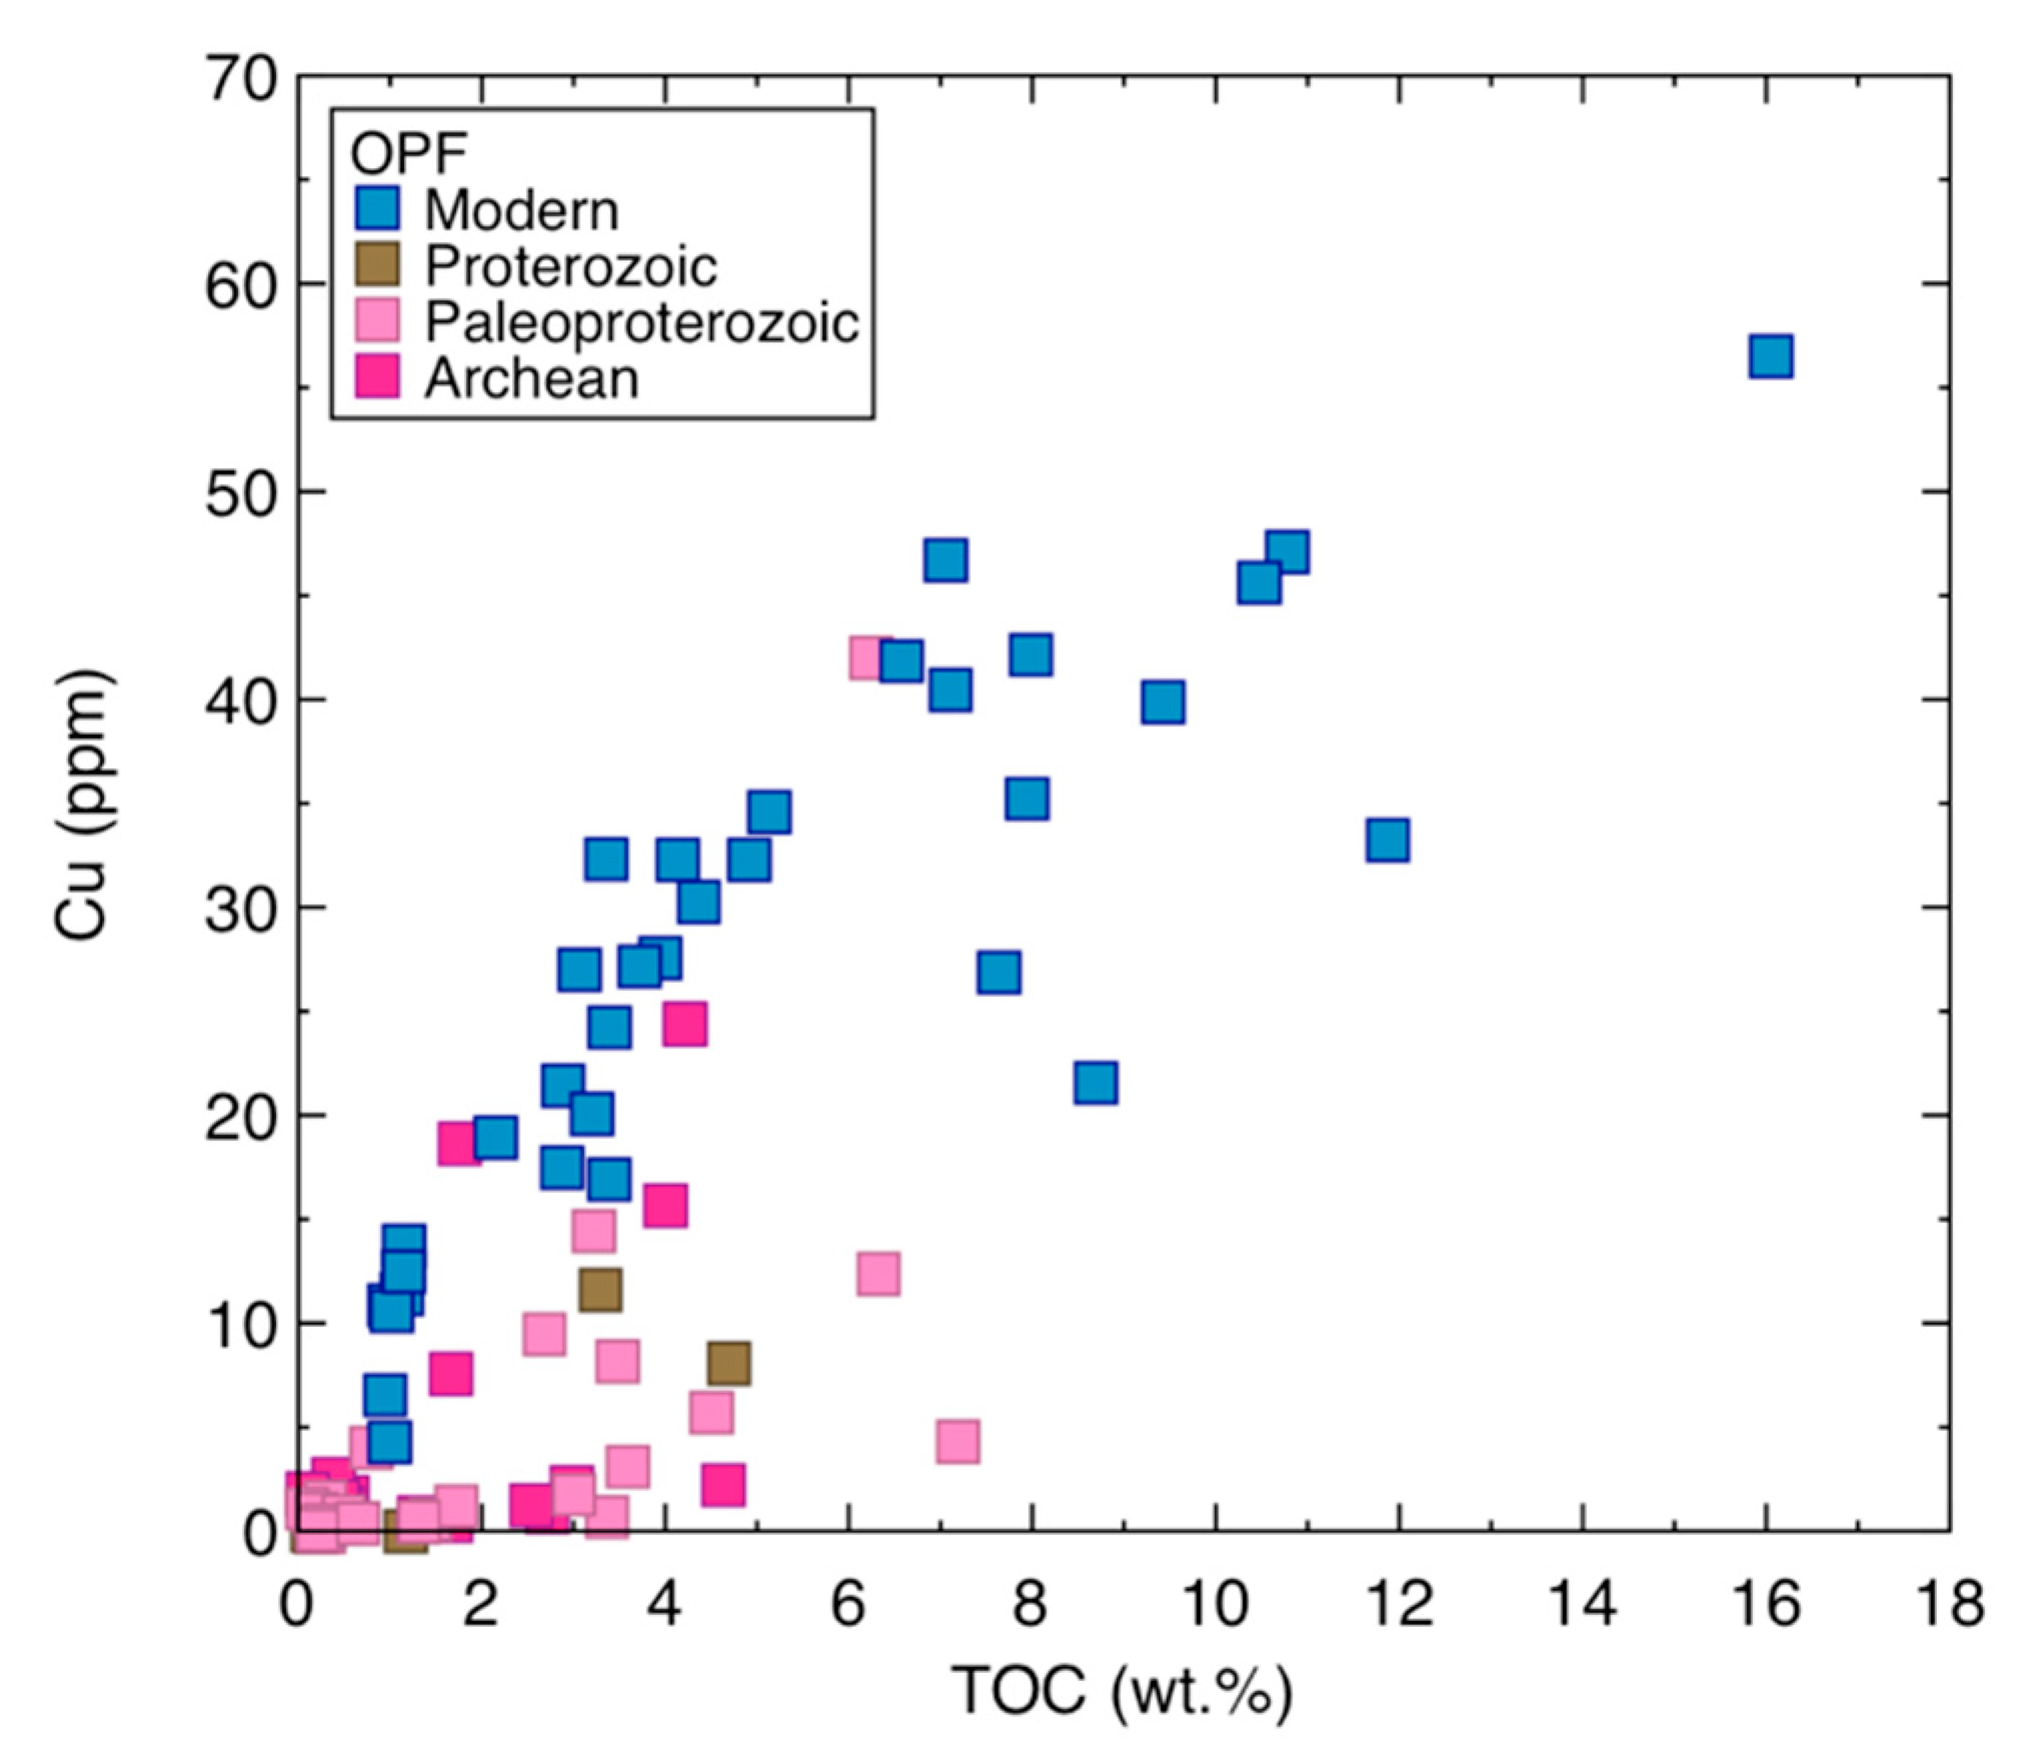
The ancient samples analysed here are distinguished from the modern Peru Margin samples in having much more variable δ65Cu for the OPF, between −0.90 to +1.34‰. A second observation is that for most of the geological record samples <20% of the bulk Cu is contained in the OPF, whereas for most Peru Margin samples >50% of the bulk copper is in the organic and pyrite fraction (Table 1; Table 2). There is also no clear correlation between Cu abundance and TOC for the ancient samples (Figure 9). Though this is the first attempt at isolating the organic-pyrite fraction for Cu analysis for any sediments, the Peru Margin organic-rich sediments are similar to other sediments from upwelling margins around the modern ocean with respect to their trace metal characteristics (e.g., [36]), including the Cu-TOC correlation.
A first question to arise is whether the lower Cu proportions in the OPF of the older samples, and potentially also the associated isotopic signatures, are the result of Cu mobility during diagenesis or whether they represent a primary feature. These two possibilities are considered below.
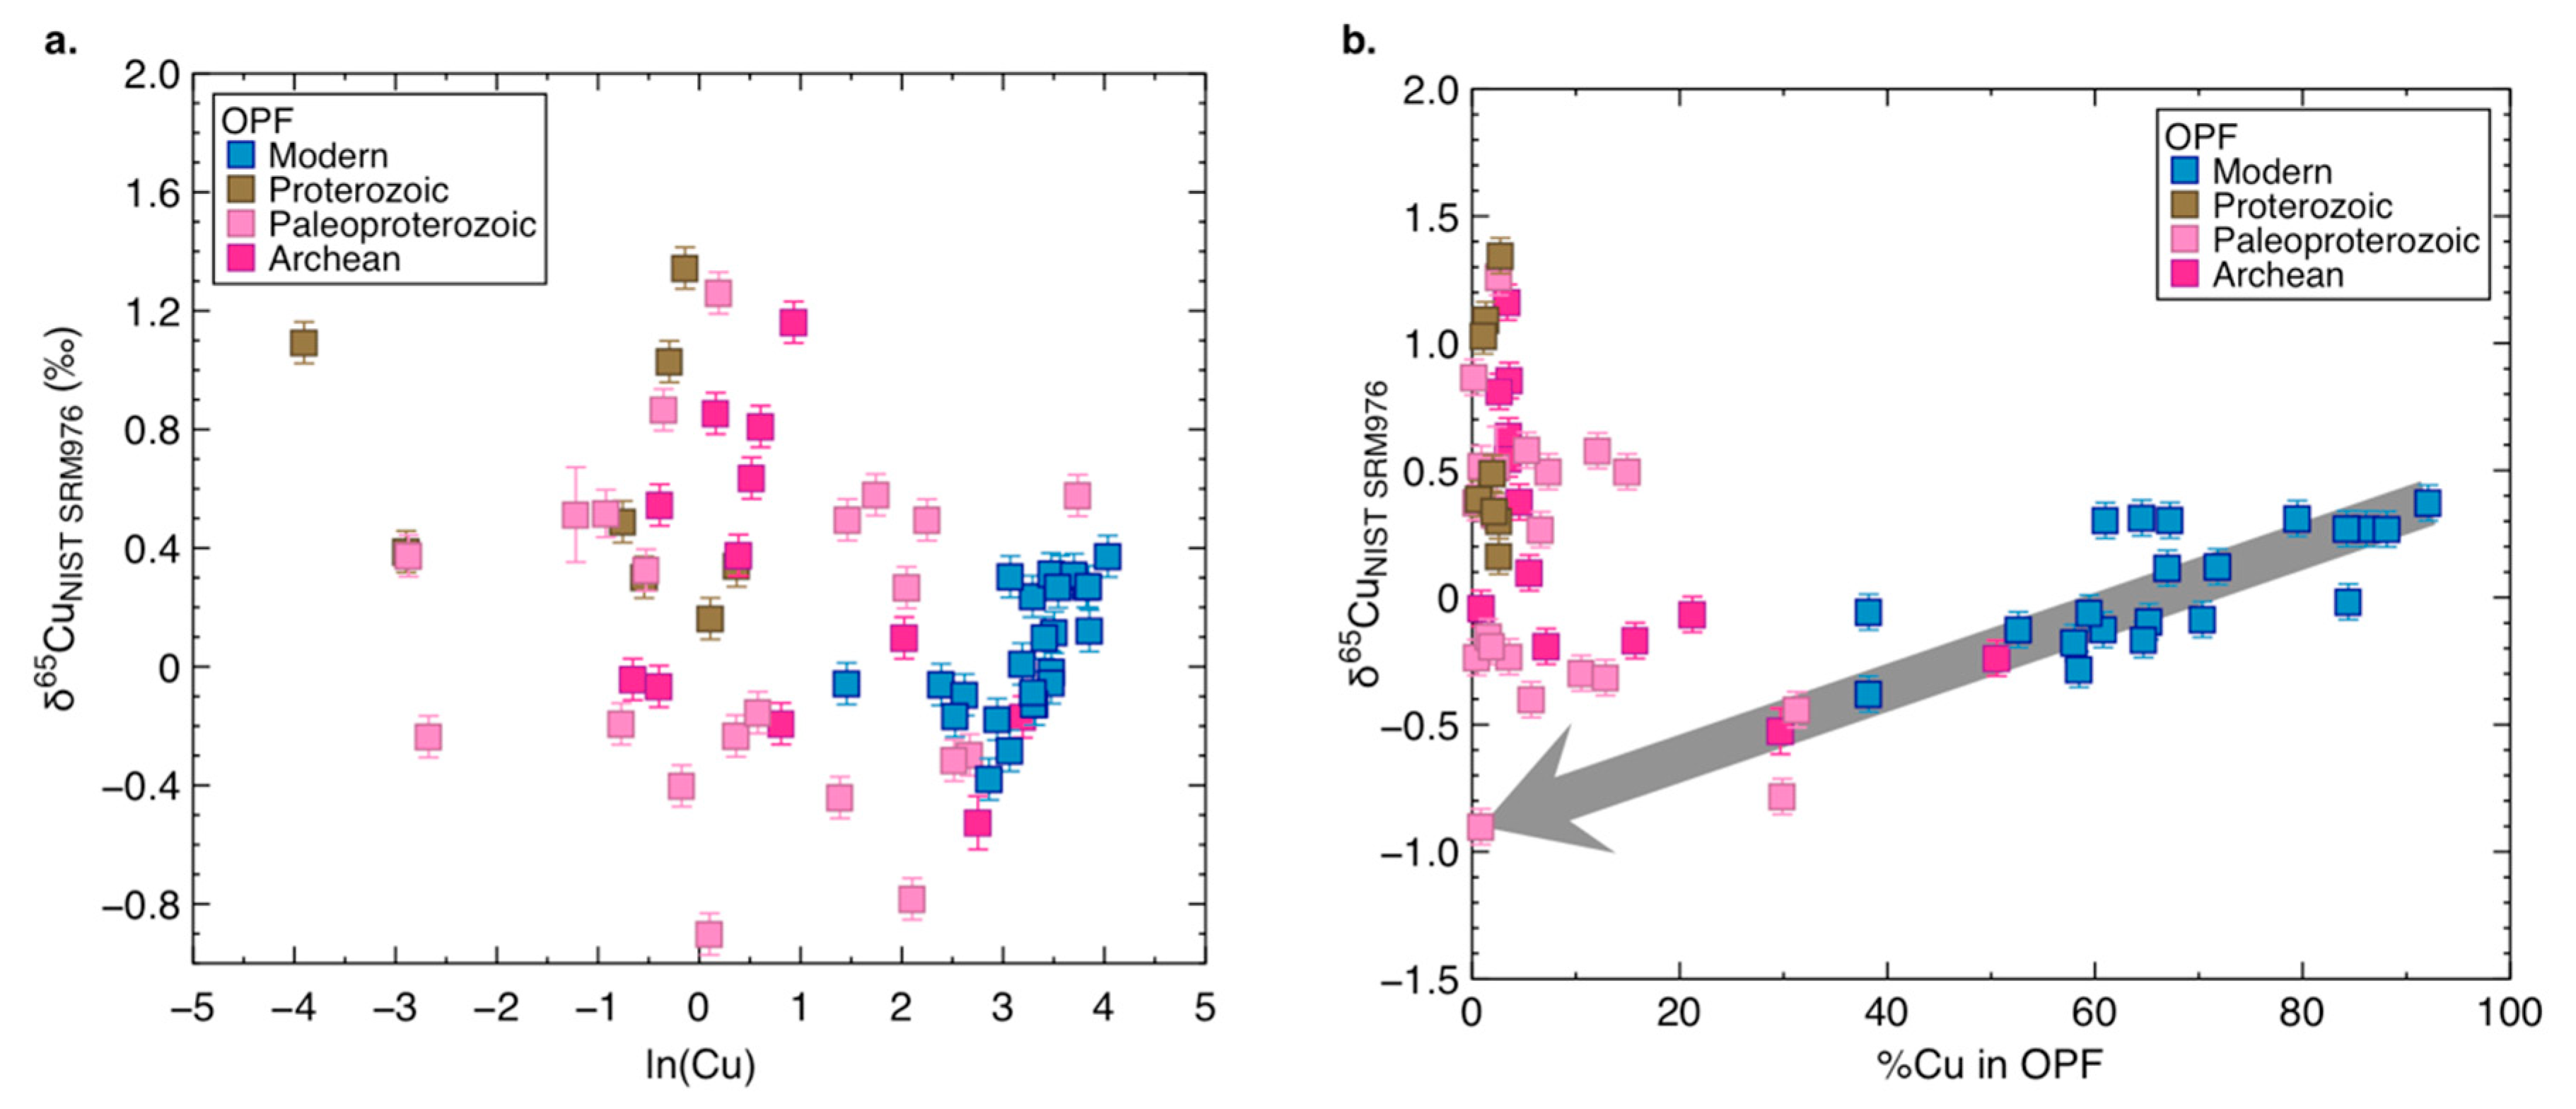
Figure 10a displays the relationship between Cu abundance and isotope composition in the OPF. The striking feature is that almost all of the ancient samples show lower absolute abundances of Cu in the OPF relative to those from the Peru Margin. Moreover, and in contrast to the trend followed by Peru Margin samples in Figure 4, there is no clear relationship between Cu concentrations and their isotopes in the case of the older samples. The lack of a relationship between Cu abundances and the δ65Cu of these organic-pyrite fractions, suggests that the Cu isotope composition of ancient organic-rich sediments was likely controlled by different processes than those proposed for the modern Peru Margin. Figure 10b compares the δ65Cu of these fractions to the proportion of bulk Cu in the OPF. Again, the lower proportion of the bulk Cu contained in the OPF of the ancient samples relative to the Peru Margin is striking. In addition, only five samples, Paleoproterozoic and Archean in age, fall close to the trend defined by Peru Margin sediments, with a δ65Cu that becomes lighter as the proportion of bulk Cu in the OPF decreases. All other geological record samples present proportions of bulk Cu in the OPF below 20%, are shifted towards heavier δ65Cu, and do not fall on the proposed sulphidation trend of modern Peru Margin sediments. This further highlights the likelihood of different controls on the Cu composition of these samples with respect to those deposited in the modern Peru Margin setting.
An obvious difference between the Peru Margin and the ancient samples is that the former are freshly-deposited unconsolidated sediments whereas the latter are rocks that have been through diagenetic processes and low-grade metamorphism. It is possible that these post-sedimentary processes could lead to differences in the location of the bulk Cu inventory that could in turn lead to a different response to the digestion approach used here. For example, Cu and sulphur re-mobilised from small sulphide grains intimately associated with the organic material, as they are in the Peru Margin sediments, could have recrystallized as other phases in the matrix of the rock. It is possible that such phases are more accessible to the HF digestion, whereas in the Peru Margin sediments small sulphide grains, perhaps protected by organic matter, demonstrably survive this treatment. It is difficult to rule out such an explanation for the patterns in Figure 10. But Cu leached from sulphide will be isotopically heavy [63], leaving behind a light residual composition. In this case, the fact that the ancient OPF samples are universally heavier than the Peru Margin array might predict, argues against such an interpretation. A slightly more complicated explanation could involve the following two-step process: (1) the incomplete sulphidation of an authigenic pool of Cu associated with organic matter, creating a light (sulphidised) portion and a heavy (residual organic) pool; (2) complete post-sedimentary remobilisation of the sulphide-bound pool, leaving only the residual organic pool in the OPF. Transfer of the sulphide-bound pool to other phases that are HF-extractable would explain the very low Cu contents of the OPF in ancient samples. In this case, however, one would predict a negative relationship between the authigenic δ65Cu in the HFD fraction (as light Cu is added to this pool from sulphide in the OPF) and the δ65Cu in the OPF, and a positive correlation between the authigenic δ65Cu in the HFD fraction and the proportion of Cu in the OPF, but no such correlations exist.
In fact, it is noteworthy that the bulk authigenic fraction in the post-GOE ancient samples is also heavier than that of the Peru Margin, often much heavier, including samples with high fauthigenic. This lends credence to the other interpretation of these data: that the clear and striking differences between the behaviour of Cu in the ancient samples and those from the modern Peru Margin are indeed primary. If so, the lower proportions of Cu in the OPF, in the context of the interpretation put forward earlier for the Peru Margin data, would suggest less quantitative transfer of Cu to sulphide for the ancient samples. Such a suggestion would imply lower ratios of authigenic Cu to available sulphide for these samples, an implication that may be consistent both with lower sulphate concentrations in the pre-Cambrian ocean [64] and with higher concentrations of other metals competing for the available sulphide, e.g., Fe. [65]. However, again in the context of the interpretation of the Peru Margin samples, the initial expectation would be that the OPF would become increasingly light as sulphidation became less quantitative. In contrast, nearly all samples on Figure 10b lie above the extension of the trend defined on the basis of the Peru Margin samples.
In principle, the heavier Cu in the ancient samples overall, and the heavier Cu in the OPF than suggested by the interpretation of those from the Peru Margin could have three explanations: (a) a different—variably heavier—Cu isotope composition for ancient seawater; (b) different processes sequestering Cu to particulate material, leading to a variably heavier bulk authigenic fraction; (c) a very different process transferring Cu from the bulk authigenic pool to the OPF, or a different Cu isotope fractionation accompanying it. Any attempt to distinguish between these alternatives must be highly speculative due to a lack of constraints on many key parameters. From what is known about Cu isotope fractionations from experiments, the single process that could result in the acquisition of heavy Cu by authigenic particulates is sorption [25]. In the modern ocean, the heavy Cu isotope composition of seawater is controlled by organic complexation, which likely also determines the fraction of Cu that is available for sorption from the dissolved pool. The complexing ligands almost certainly derive from cyanobacteria [13] and Saito et al. [66] suggest that cyanobacteria only started to release Cu-complexing organic ligands in response to the higher Cu abundance in the oceans that would have resulted from higher oxygen availability and oxidative weathering of sulphide on the continents. Such a suggestion would be consistent with the tentatively identified step-up in the bulk authigenic δ65Cu at the GOE—Perhaps implying a heavy seawater reservoir only after the GOE. On the other hand, it is difficult to envisage how this idea could explain the heavy Cu in all the OPF except those for the modern Peru Margin samples. Moreover, Neaman et al. [67], in their study of Al, P, Cu, and Fe mobility during weathering of black shales, suggest that biologically-secreted organic ligands were already present in soils at 2.76 Ga.
In a scenario with much reduced abundance or absence of organic ligands, or in the presence of significantly weaker ones, the Cu isotope composition of seawater could have been more strongly controlled by redox variations alone. As discussed previously, these can account for very large fractionations [24]. The transition from Cu(II) to Cu(I) for pH 7–8 occurs at redox conditions consistent with the presence of Fe(II) [68]. If the pH of seawater in the past was comparable to that of the modern ocean, then this would suggest that Cu(I) could have been present in the ancient ocean, at least in small amounts. Consequently, due to the fractionations expected from the redox transition between Cu(II) and Cu(I), we can further hypothesize the presence of a small very heavy Cu(II) pool in the ancient ocean due to partial conversion of the total Cu pool to Cu(I). The presence of this small heavier Cu pool would be consistent with point (a) suggested above.

5. Conclusions

Separate analyses of the organic-pyrite fraction and of the HF-digestible fraction extracted from bulk Peru Margin sediments better characterise the behaviour of Cu and its isotopes in a modern setting with variable redox conditions. The same type of analysis was performed on ancient, mostly organic-rich sediments ranging in age from the Proterozoic to the Archean. The following key findings emerge from a comparison of Cu and its isotopes in different components of a single sample as well as in modern vs. ancient samples:
(1).
Cu abundance and total organic carbon (TOC) are positively correlated in modern samples, but not in ancient ones;
(2).
the organic-pyrite fraction dominates the total Cu reservoir in modern samples, in most cases containing >50% of the bulk Cu;
(3).
the HF-digestible fraction dominates the total Cu reservoir in ancient samples, in most cases containing >80% of the bulk Cu;
(4).
Cu isotopes are correlated with enrichment of Cu in the organic-pyrite fraction of modern samples, but this is not the case for ancient samples.
We hypothesize that an organic-pyrite fraction extracted from the bulk sediment may represent an authigenic fraction and that sulphidation is the main control on authigenic Cu enrichments in the modern Peru Margin setting. Although interpretation of this type of data is currently challenging, it clearly indicates that the controls on the behavior of Cu and its isotopes in seawater and sediments in the past were probably different, at least in part, from those observed today. Alternatively, the differences seen for Cu and its isotopes in ancient vs. modern samples may be the result of a different seawater Cu isotope composition in the past than that observed today, or a primary signature may be masked by secondary processes (e.g. diagenesis).
We encourage further characterisation of bulk and extracted organic-pyrite fractions from shales throughout the geological past in order to build upon this first record, especially to better characterize the currently undersampled Phanerozoic. The same type of analysis is also encouraged for modern samples, in order to constrain the behaviour of the authigenic phase in samples with a more Cu-lean organic-pyrite fraction and better characterise this end of the modern OPF spectrum. Such studies will provide further insight into the marine cycling of Cu and its isotopes, hence elucidating the value of Cu and its isotopes as a tool to investigate the biogeochemistry of the modern and ancient ocean.

Supplementary Materials

The following are available online at https://www.mdpi.com/2076-3263/9/8/325/s1, Supplementary Information to Copper and its isotopes in organic-rich sediments: from the modern Peru Margin to Archean shales.

Author Contributions

Data curation, E.R.C.; Funding acquisition, D.V.; Methodology, E.R.C.; Supervision, T.R.R.B. and D.V.; Visualization, E.R.C.; Writing—original draft, E.R.C.; Writing—review and editing, T.R.R.B., S.W.P. and D.V.

Funding

This research was funded by the Swiss National Science Fund (grants 200021-143262 and 200020-165904) and ETH Zürich.

Acknowledgments

We wish to thank X. Chen, T. Eglinton, A. Hofmann and F. Ossa Ossa for providing samples. Drilling in the Barberton greenstone belt was supported by the International Continental Scientific Drilling Program (ICDP). C. Archer and M. Jaggi are greatly thanked for their help and support in the lab. We thank two anonymous reviewers for their constructive comments on an earlier version of this paper, and Marion Garcon for editorial handling and helpful discussions.

Conflicts of Interest

The authors declare no conflict of interest.

References

  1. Asael, D.; Rouxel, O.; Poulton, S.W.; Lyons, T.W.; Bekker, A. Molybdenum record from black shales indicates oscillating atmospheric oxygen levels in the early Paleoproterozoic. Am. J. Sci. 2018, 318, 275–299. [Google Scholar] [CrossRef]
  2. Kendall, B.; Gordon, G.W.; Poulton, S.W.; Anbar, A.D. Molybdenum isotope constraints on the extent of late Paleoproterozoic ocean euxinia. Earth Planet. Sci. Lett. 2011, 307, 450–460. [Google Scholar] [CrossRef]
  3. Vance, D.; Archer, C.; Bermin, J.; Perkins, J.; Statham, P.J.; Lohan, M.C.; Ellwood, M.J.; Mills, R.A. The copper isotope geochemistry of rivers and the oceans. Earth Planet. Sci. Lett. 2008, 274, 204–213. [Google Scholar] [CrossRef]
  4. Moynier, F.; Vance, D.; Fujii, T.; Savage, P. The isotope geochemistry of zinc and copper. Rev. Mineral. Geochem. 2017, 82, 543–600. [Google Scholar] [CrossRef]
  5. Moffett, J.W.; Brand, L.E. Production of strong, extracellular Cu chelators by marine cyanobacteria in response to Cu stress. Limnol. Oceanogr. 1996, 41, 388–395. [Google Scholar] [CrossRef]
  6. Chi, F.E.; Rodriguez, N.P.; Partin, C.A.; Lalonde, S.V.; Andersson, P.; Weiss, D.J.; El Albani, A.; Rodushkin, I.; Konhauser, K.O. Cu isotopes in marine black shales record the Great Oxidation Event. Proc. Natl. Acad. Sci. 2016, 113, 4941–4946. [Google Scholar] [Green Version]
  7. Peers, G.; Price, N.M. Copper-containing plastocyanin used for electron transport by an oceanic diatom. Nature 2006, 441, 341–344. [Google Scholar] [CrossRef] [PubMed]
  8. Twining, B.S.; Baines, S.B. The trace metal composition of marine phytoplankton. Annu. Rev. Mar. Sci. 2013, 5, 191–215. [Google Scholar] [CrossRef] [PubMed]
  9. Bruland, K.W. Oceanographic distributions of cadmium, zinc, nickel, and copper in the North Pacific. Earth Planet. Sci. Lett. 1980, 47, 176–198. [Google Scholar] [CrossRef]
  10. Coale, K.H.; Bruland, K.W. Copper complexation in the Northeast Pacific. Limnol. Oceanogr. 1988, 33, 1084–1101. [Google Scholar] [CrossRef]
  11. Coale, K.H.; Bruland, K.W. Spatial and temporal variability in copper complexation in the North Pacific. Deep Sea Res. Part A: Oceanogr. Res. Pap. 1990, 37, 317–336. [Google Scholar] [CrossRef]
  12. Sunda, W.G. Trace metal/phytoplankton interactions in the sea. In Chemistry of Aquatic Systems: Local and Global Perspectives; Bidoglio, G., Stumm, W., Eds.; Springer: Dordrecht, The Netherlands, 1994; pp. 213–247. [Google Scholar]
  13. Moffett, J.; Zika, R.; Brand, L.E. Distribution and potential sources and sinks of copper chelators in the Sargasso Sea. Deep Sea Res. Part A: Oceanogr. Res. Pap. 1990, 37, 27–36. [Google Scholar] [CrossRef]
  14. Bruland, K.W.; Lohan, M.C. Controls of trace metals in seawater. Treaties Geochem. 2003, 6, 23–47. [Google Scholar]
  15. Moffett, J.W.; Dupont, C. Cu complexation by organic ligands in the sub-arctic NW Pacific and Bering Sea. Deep Sea Res. Part A: Oceanogr. Res. Pap. 2007, 54, 586–595. [Google Scholar] [CrossRef]
  16. Buck, K.N.; Moffett, J.; Barbeau, K.A.; Bundy, R.M.; Kondo, Y.; Wu, J. The organic complexation of iron and copper: An intercomparison of competitive ligand exchange-adsorptive cathodic stripping voltammetry (CLE-ACSV) techniques. Limnology Oceanogr.: Methods 2012, 10, 496–515. [Google Scholar] [CrossRef]
  17. Jacquot, J.E.; Moffett, J.W. Copper distribution and speciation across the International GEOTRACES Section GA03. Deep Sea Res. Part II: Top. Stud. Oceanogr. 2015, 116, 187–207. [Google Scholar] [CrossRef]
  18. Boyle, E.A.; Sclater, F.R.; Edmond, J.M. The distribution of dissolved copper in the Pacific. Earth Planet. Sci. Lett. 1977, 37, 38–54. [Google Scholar] [CrossRef]
  19. Little, S.H.; Vance, D.; Siddall, M.; Gasson, E. A modeling assessment of the role of reversible scavenging in controlling oceanic dissolved Cu and Zn distributions. Glob. Biogeochem. Cycles 2013, 27, 780–791. [Google Scholar] [CrossRef] [Green Version]
  20. Little, S.; Vance, D.; Walker-Brown, C.; Landing, W. The oceanic mass balance of copper and zinc isotopes, investigated by analysis of their inputs, and outputs to ferromanganese oxide sediments. Geochim. Cosmochim. Acta 2014, 125, 673–693. [Google Scholar] [CrossRef] [Green Version]
  21. Jacobs, L.; Emerson, S.; Huested, S.S. Trace metal geochemistry in the Cariaco Trench. Deep Sea Res. Part A: Oceanogr. Res. Pap. 1987, 34, 965–981. [Google Scholar] [CrossRef]
  22. Huerta-Diaz, M.A.; Morse, J.W. Pyritization of trace metals in anoxic marine sediments. Geochim. Cosmochim. Acta 1992, 56, 2681–2702. [Google Scholar] [CrossRef]
  23. Tankéré, S.P.C.; Muller, F.L.L.; Burton, J.D.; Statham, P.J.; Guieu, C.; Martin, J.M. Trace metal distributions in shelf waters of the northwestern Black Sea. Cont. Shelf Res. 2001, 21, 1501–1532. [Google Scholar] [CrossRef]
  24. Ehrlich, S.; Butler, I.; Halicz, L.; Rickard, D.; Oldroyd, A.; Matthews, A. Experimental study of the copper isotope fractionation between aqueous Cu(II) and covellite, CuS. Chem. Geol. 2004, 209, 259–269. [Google Scholar] [CrossRef]
  25. Navarrete, J.U.; Borrok, D.M.; Viveros, M.; Ellzey, J.T. Copper isotope fractionation during surface adsorption and intracellular incorporation by bacteria. Geochim. Cosmochim. Acta 2011, 75, 784–799. [Google Scholar] [CrossRef] [Green Version]
  26. Pokrovsky, O.S.; Viers, J.; Emnova, E.E.; Kompantseva, E.I.; Freydier, R. Copper isotope fractionation during its interaction with soil and aquatic microorganisms and metal oxy(hydr)oxides: Possible structural control. Geochim. Cosmochim. Acta 2008, 72, 1742–1757. [Google Scholar] [CrossRef]
  27. Balistrieri, L.S.; Borrok, D.M.; Wanty, R.B.; Ridley, W.I. Fractionation of Cu and Zn isotopes during adsorption onto amorphous Fe(III) oxyhydroxide: Experimental mixing of acid rock drainage and ambient river water. Geochim. Cosmochim. Acta 2008, 72, 311–328. [Google Scholar] [CrossRef]
  28. Ijichi, Y.; Ohno, T.; Sakata, S. Copper isotopic fractionation during adsorption on manganese oxide: Effects of pH and desorption. Geochem. J. 2018, 52, e1–e6. [Google Scholar] [CrossRef]
  29. Albarède, F. The stable isotope geochemistry of copper and zinc. Rev. Mineral. Geochem. 2004, 55, 409–427. [Google Scholar] [CrossRef]
  30. Little, S.H.; Sherman, D.M.; Vance, D.; Hein, J.R. Molecular controls on Cu and Zn isotopic fractionation in Fe-Mn crusts. Earth and Planet. Sci. Lett. 2014, 396, 213–222. [Google Scholar] [CrossRef]
  31. Ryan, B.M.; Kirby, J.K.; Degryse, F.; Scheiderich, K.; McLaughlin, M.J. Copper isotope fractionation during equilibration with natural and synthetic ligands. Environ. Sci. Technol. 2014, 48, 8620–8626. [Google Scholar] [CrossRef]
  32. Bigeleisen, J.; Mayer, M.G. Calculation of equilibrium constants for isotopic exchange reactions. J. Chem. Phys. 1947, 15, 261–267. [Google Scholar] [CrossRef]
  33. Takano, S.; Tanimizu, M.; Hirata, T.; Sohrin, Y. Isotopic constraints on biogeochemical cycling of copper in the ocean. Nat. Commun. 2014, 5, 5663. [Google Scholar] [CrossRef] [PubMed] [Green Version]
  34. Thompson, C.M.; Ellwood, M.J. Dissolved copper isotope biogeochemistry in the Tasman Sea, SW Pacific Ocean. Mar. Chem. 2014, 165, 1–9. [Google Scholar] [CrossRef]
  35. Little, S.H.; Archer, C.; Milne, A.; Schlosser, C.; Achterberg, E.P.; Lohan, M.C.; Vance, D. Paired dissolved and particulate phase Cu isotope distributions in the South Atlantic. Chem. Geol. 2018, 502, 29–43. [Google Scholar] [CrossRef]
  36. Little, S.H.; Vance, D.; McManus, J.; Severmann, S.; Lyons, T.W. Copper isotope signatures in modern marine sediments. Geochim. Cosmochim. Acta 2017, 212, 253–273. [Google Scholar] [CrossRef] [Green Version]
  37. Böning, P.; Brumsack, H.-J.; Böttcher, M.E.; Schnetger, B.; Kriete, C.; Kallmeyer, J.; Borchers, S.L. Geochemistry of Peruvian near-surface sediments. Geochim. Cosmochim. Acta 2004, 68, 4429–4451. [Google Scholar] [CrossRef]
  38. Maréchal, C.N.; Télouk, P.; Albarède, F. Precise analysis of copper and zinc isotopic compositions by plasma-source mass spectrometry. Chem. Geol. 1999, 156, 251–273. [Google Scholar] [CrossRef]
  39. Archer, C.; Vance, D. Mass discrimination correction in multiple-collector plasma source mass spectrometry: An example using Cu and Zn isotopes. J. Anal. At. Spectrom. 2004, 19, 656. [Google Scholar] [CrossRef]
  40. Ciscato, E.R.; Bontognali, T.R.R.; Vance, D. Nickel and its isotopes in organic-rich sediments: Implications for oceanic budgets and a potential record of ancient seawater. Earth Planet. Sci. Lett. 2018, 494, 239–250. [Google Scholar] [CrossRef]
  41. Eigenbrode, J.L.; Freeman, K.H. Late Archean rise of aerobic microbial ecosystems. Proc. Natl. Acad. Sci. 2006, 103, 15759–15764. [Google Scholar] [CrossRef] [Green Version]
  42. Arthur, M.A.; Dean, W.E.; Laarkamp, K. Organic carbon accumulation and preservation in surface sediments on the Peru Margin. Chem. Geol. 1998, 152, 273–286. [Google Scholar] [CrossRef]
  43. Calvert, S.E.; Price, N.B. Geochemistry of Namibian shelf sediments. In Coastal Upwelling Its Sediment Record; Springer: Dordrecht, The Netherlands, 1983; pp. 337–375. [Google Scholar]
  44. Croudace, I.W. A possible error source in silicate wet-chemistry caused by insoluble fluorides. Chem. Geol. 1980, 31, 153–155. [Google Scholar] [CrossRef]
  45. Böning, P.; Shaw, T.; Pahnke, K.; Brumsack, H.-J. Nickel as indicator of fresh organic matter in upwelling sediments. Geochim. Cosmochim. Acta 2015, 162, 99–108. [Google Scholar] [CrossRef]
  46. Ohnemus, D.C.; Rauschenberg, S.; Cutter, G.A.; Fitzsimmons, J.N.; Sherrell, R.M.; Twining, B.S. Elevated trace metal content of prokaryotic communities associated with marine oxygen deficient zones. Limnol. Oceanogr. 2016, 62, 3–25. [Google Scholar] [CrossRef]
  47. Janssen, D.J.; Conway, T.M.; John, S.G.; Christian, J.R.; Kramer, D.I.; Pedersen, T.F.; Cullen, J.T. Undocumented water column sink for cadmium in open ocean oxygen-deficient zones. Proc. Natl. Acad. Sci. 2014, 111, 6888–6893. [Google Scholar] [CrossRef] [PubMed] [Green Version]
  48. Janssen, D.J.; Cullen, J.T. Decoupling of zinc and silicic acid in the subarctic northeast Pacific interior. Mar. Chem. 2015, 117, 124–133. [Google Scholar] [CrossRef]
  49. Bianchi, D.; Weber, T.S.; Kiko, R.; Deutsch, C. Global niche of marine anaerobic metabolisms expanded by particle microenvironments. Nat. Geosci. 2018, 11, 263–268. [Google Scholar] [CrossRef]
  50. Scheidegger, K.F.; Krissek, L.A. Dispersal and deposition of eolian and fluvial sediments off Peru and northern Chile. GSA Bull. 1982, 93, 150–162. [Google Scholar] [CrossRef]
  51. DiTullio, G.R.; Geesey, M.E.; Maucher, J.M.; Alm, M.B.; Riseman, S.F.; Bruland, K.W. Influence of iron on algal community composition and physiological status in the Peru upwelling system. Limnol. Oceanogr. 2005, 50, 1887–1907. [Google Scholar] [CrossRef]
  52. Ho, T.-Y.; Quigg, A.; Finkel, Z.V.; Milligan, A.J.; Wyman, K.; Falkowski, P.G.; Morel, F.M.M. The elemental composition of some marine phytoplankton. J. Phycol. 2003, 39, 1145–1159. [Google Scholar] [CrossRef]
  53. Ingall, E.; Jahnke, R. Evidence for enhanced phosphorus regeneration from marine sediments overlain by oxygen depleted waters. Geochim. Cosmochim. Acta 1994, 58, 2571–2575. [Google Scholar] [CrossRef]
  54. Paytan, A.; McLaughlin, K. The oceanic phosphorus cycle. Chem. Rev. 2007, 107, 563–576. [Google Scholar] [CrossRef] [PubMed]
  55. Morse, J.W. Interactions of trace metals with authigenic sulfide minerals: implications for their bioavailability. Mar. Chem. 1994, 46, 1–6. [Google Scholar] [CrossRef]
  56. Fujii, T.; Moynier, F.; Abe, M.; Nemoto, K.; Albarède, F. Copper isotope fractionation between aqueous compounds relevant to low temperature geochemistry and biology. Geochim. Cosmochim. Acta 2013, 110, 29–44. [Google Scholar] [CrossRef] [Green Version]
  57. Fujii, T.; Moynier, F.; Blichert-Toft, J.; Albarède, F. Density functional theory estimation of isotope fractionation of Fe, Ni, Cu, and Zn among species relevant to geochemical and biological environments. Geochim. Cosmochim. Acta 2014, 140, 553–576. [Google Scholar] [CrossRef] [Green Version]
  58. Böning, P.; Fröllje, H.; Beck, M.; Schnetger, B.; Brumsack, H.-J. Underestimation of the authigenic fraction of Cu and Ni in organic-rich sediments. Mar. Geol. 2012, 324, 24–28. [Google Scholar] [CrossRef]
  59. Brumsack, H.-J. Geochemistry of recent TOC-rich sediments from the Gulf of California and the Black Sea. Geol. Rundsch. 1989, 78, 851–852. [Google Scholar] [CrossRef]
  60. Taylor, S.; McLennan, S.M. The Continental crust: Its composition and evolution; Blackwell Scientific Publications: Hoboken, NJ, USA, 1985; p. 312. [Google Scholar]
  61. Och, L.M.; Shields-Zhou, G.A. The Neoproterozoic oxygenation event: Environmental perturbations and biogeochemical cycling. Earth-Sci. Rev. 2012, 110, 26–57. [Google Scholar] [CrossRef]
  62. Krause, A.J.; Mills, B.J.W.; Zhang, S.; Planavsky, N.; Lenton, T.M.; Poulton, S.W. Stepwise oxygenation of the Paleozoic atmosphere. Nat. Commun. 2018, 9, 4081. [Google Scholar] [CrossRef]
  63. Mathur, R.; Ruiz, J.; Titley, S.; Liermann, L.; Buss, H.; Brantley, S. Cu isotopic fractionation in the supergene environment with and without bacteria. Geochim. Cosmochim. Acta 2005, 69, 5233–5246. [Google Scholar] [CrossRef]
  64. Canfield, D. A new model for Proterozoic ocean chemistry. Nature 1998, 396, 450–453. [Google Scholar] [CrossRef]
  65. Rouxel, O.J.; Bekker, A.; Edwards, K. Iron isotope constraints on the Archean and Paleoprterozoic ocean redox state. Science 2005, 307, 1088–1091. [Google Scholar] [CrossRef] [PubMed]
  66. Saito, M.A.; Sigman, D.M.; Morel, F.M.M. The bioinorganic chemistry of the ancient ocean: The co-evolution of cyanobacterial metal requirements and biogeochemical cycles at the Archean-Proterozoic boundary. Inorg. Chim. Acta 2003, 356, 308–318. [Google Scholar] [CrossRef]
  67. Neaman, A.; Chorover, J.; Brantley, S.L. Element mobility patterns record organic ligands in soils on Early Earth. Geology 2005, 33, 117–120. [Google Scholar] [CrossRef]
  68. Takeno, N. Atlas of Eh-pH diagrams. Geol. Surv. Jpn. Open File Rep. 2005, 419, 102. [Google Scholar]
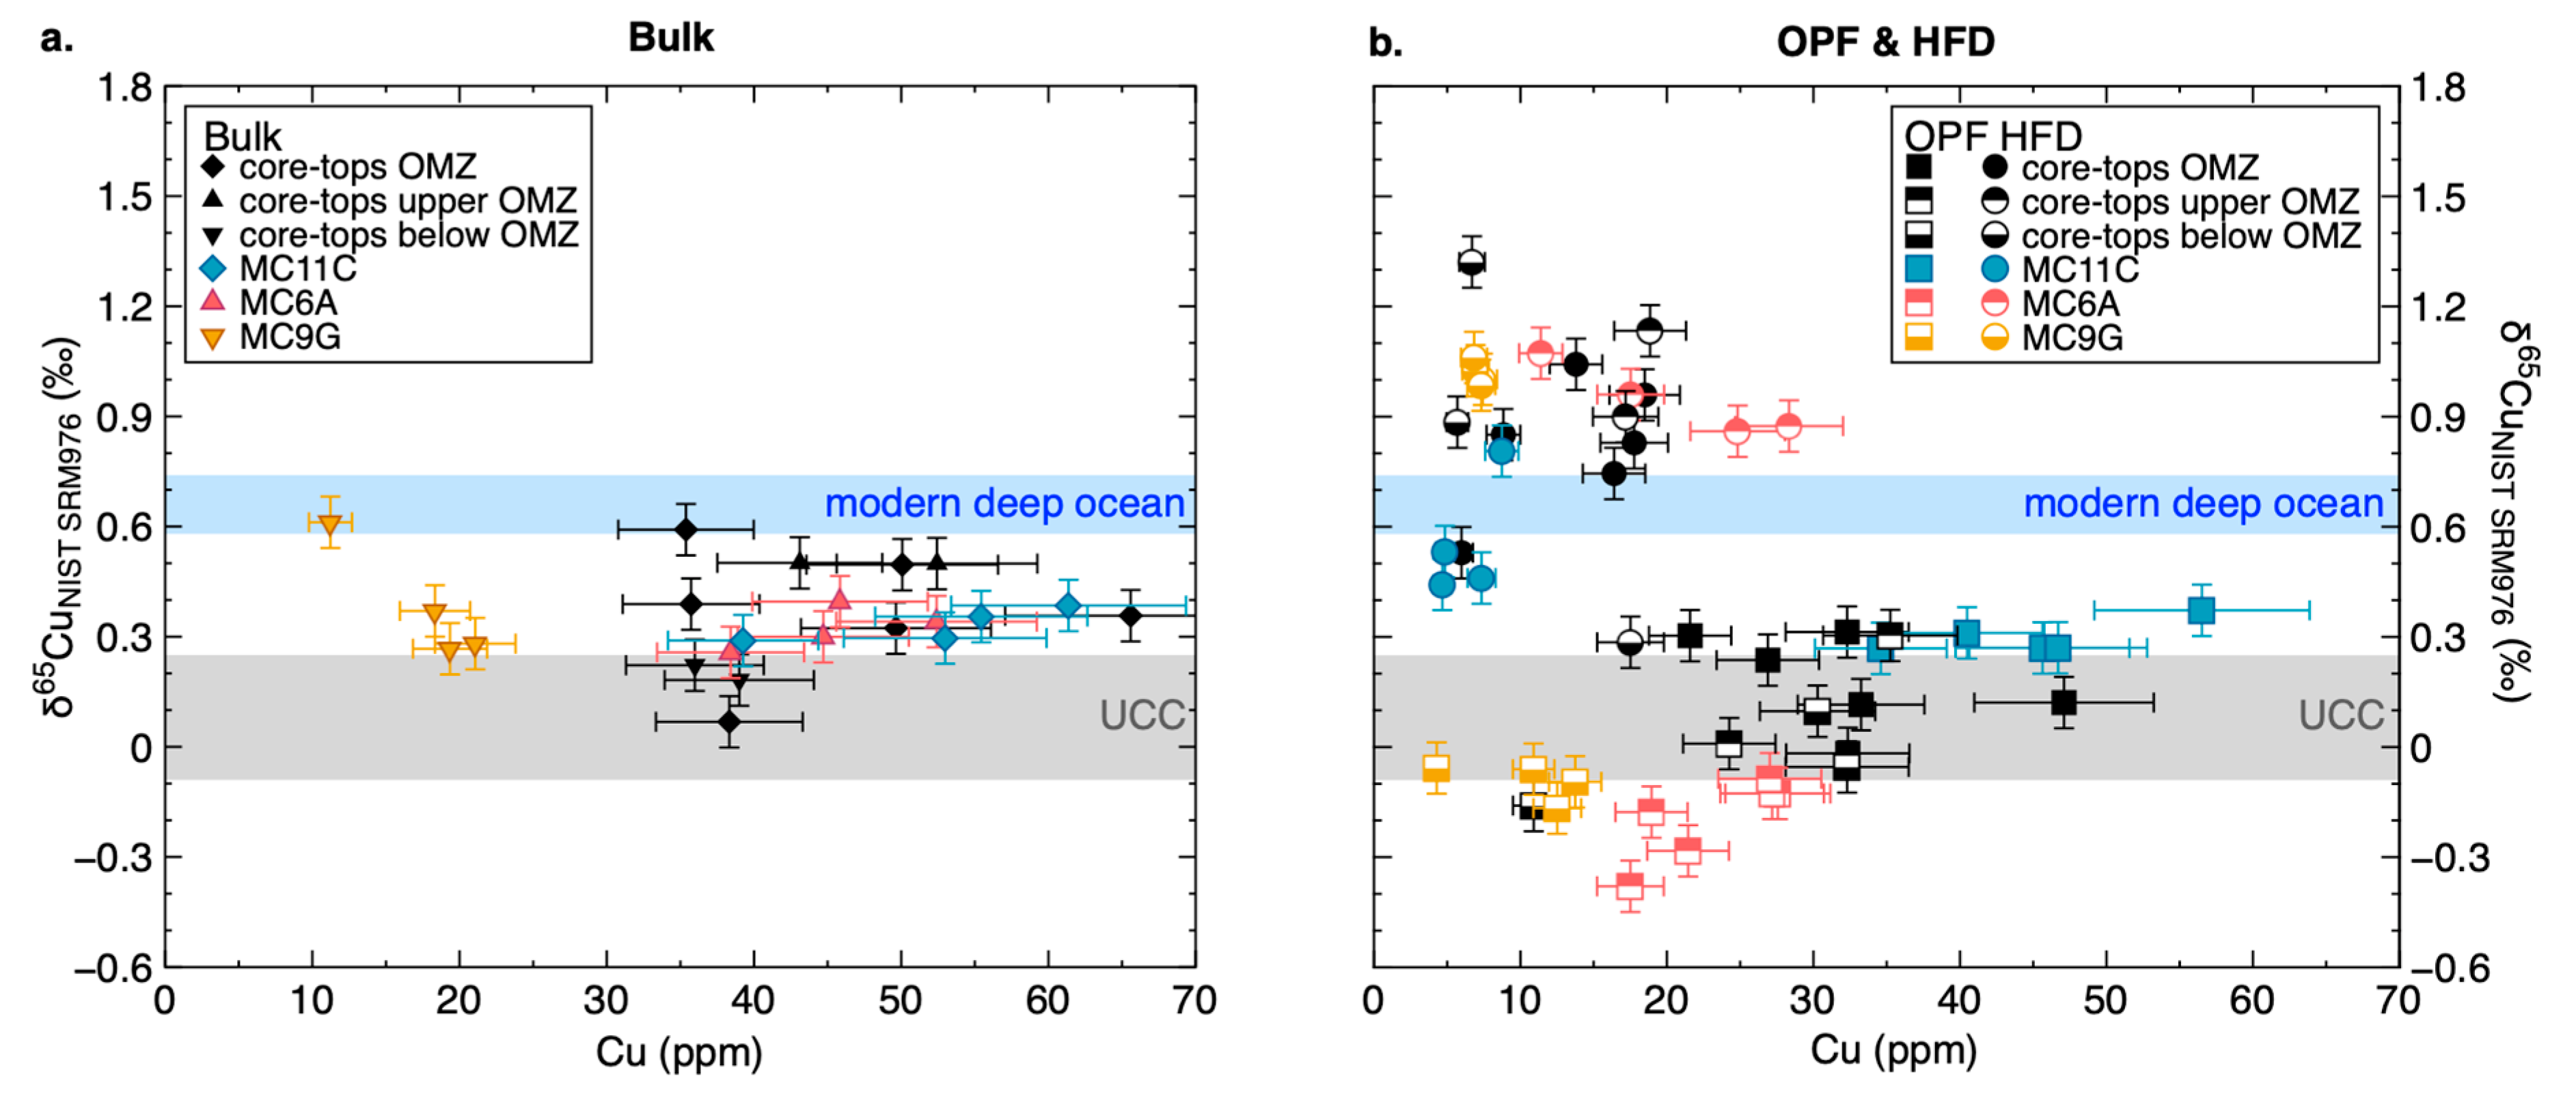
Figure 1. Peru Margin Cu abundance and isotope composition calculated for bulk samples (a) and as measured for the respective organic-pyrite fraction (OPF) and HF-dissolvable (HFD) fractions of the same samples (b). The blue band indicates the current best estimate of the Cu isotope composition of the modern deep ocean (>800 m depth; +0.66 ± 0.08‰; [4]) whereas the grey band indicates the composition for upper continental crust (UCC; [4]).
Geosciences 09 00325 g001
Figure 2. Copper isotope composition of bulk sample and OPF for the geological record samples. The blue band indicates the current best estimate of the Cu isotope composition of the modern deep ocean (>800 m depth; +0.66 ± 0.08‰; [4]) whereas the grey band indicates that of the upper continental crust (UCC; [4]).
Geosciences 09 00325 g002
Figure 3. Peru Margin Cu abundances and Cu/Al ratios plotted versus TOC, and Cu abundances plotted versus P. (a) Peru Margin bulk copper abundances versus TOC, and (b) OPF copper concentrations versus organic carbon content. (c) OPF copper concentrations versus phosphorus concentrations. (d) Cu/Al versus TOC for the bulk Peru Margin samples.
Geosciences 09 00325 g003
Figure 4. δ65Cu vs. ln[Cu] in the organic-pyrite fractions (OPF) of Peru Margin sediments. Most samples fall on an array described by a process potentially involving closed system uptake with a fractionation factor of 1.0007. Note that samples from the most oxic core MC9G are the most removed from this array.
Geosciences 09 00325 g004
Figure 5. Bulk authigenic and OPF δ65Cu plotted against the percentage of bulk Cu found in the OPF. The blue band indicates the current best estimate of the Cu isotope composition of the modern deep ocean (>800 m depth; +0.66 ± 0.08‰; [4]) whereas the grey band indicates that for the upper continental crust (UCC; [4]). The light grey arrow highlights the increasing difference between the δ65Cu of the OPF and that of the bulk sample as the proportion of Cu in the OPF decreases, both hypothesized to result from non-quantitative transfer of Cu to sulphide in the OPF in more oxic settings whereas this transfer is more complete for the more anoxic setting. The dark grey arrow highlights the possible addition of light Cu to the more anoxic samples, perhaps due to sequestration of Cu directly from seawater into sulphide.
Geosciences 09 00325 g005
Figure 6. The proportion of Cu in the OPF as a function of Cu abundance in the OPF (a) and authigenic Cu in the HFD (b). Note that core-top samples from below the OMZ are not shown in (b) as they have no authigenic Cu. Authigenic Cu amounts in the HFD were corrected for detrital Cu using the measured bulk Al content and a Cu/Al ratio of 1.8 × 10⁻⁴ g/g [58]. Note that the fit (with r2 = 0.87) is only for the anoxic down-core samples, and does not include the samples from the most oxic core MC9G.
Geosciences 09 00325 g006
Figure 7. Peru Margin bulk authigenic δ65Cu obtained after detrital correction using Cu/Al of 1.8 × 10⁻⁴ g/g (empty symbols, labelled as “corr.” in the legend). The filled symbols, connected to each corrected datum with a vertical line, show the original bulk data with no correction (labelled as “raw” in the legend). The blue band indicates the current best estimate of the Cu isotope composition of the modern deep ocean (>800 m depth; 0.66 ± 0.08‰; [4]) whereas the grey band indicates that for the upper continental crust (UCC; [4]).
Geosciences 09 00325 g007
Figure 8. Comparison of bulk measured δ65Cu and bulk authigenic δ65Cu values for all samples with fauthigenic > 0.2, using δ65Cudetrital = +0.08 ‰ and Cu/Aldetrital of 1.0 × 10⁻³ g/g for the Archean and of 3.1 × 10⁻⁴ g/g for post-Archean samples [61]. The filled symbols, connected to each corrected datum (empty symbol) with a green vertical line, show the original bulk data with no correction. The individual bulk δ65Cu data from shales analysed by Chi Fru et al. [6] are also plotted for comparison. The blue band indicates the current best estimate of the Cu isotope composition of the modern deep ocean (>800m depth; 0.66 ± 0.08‰; [4]) whereas the grey band indicates that for the upper continental crust (UCC; [4]).
Geosciences 09 00325 g008
Figure 9. Copper abundances plotted against TOC contents for OPF samples of Peru Margin sediments, and ancient samples colour coded by age.
Geosciences 09 00325 g009
Figure 10. Copper abundance and isotope composition in the OPF of Peru Margin and geological record samples, colour coded by age (a). In (b) the δ65Cu of the same OPFs is plotted as a function of the proportion of bulk Cu found in the OPF. The grey arrow indicates a trend consistent with removal of Cu into the OPF via sequestration into sulphides, as per Figure 6. The grey arrow also highlights the trend seen in the Peru Margin samples: Increasingly low δ65Cu of the OPF as the proportion of Cu in the OPF decreases, earlier hypothesized to result from non-quantitative transfer of Cu to sulphide in the OPF in the more oxic settings whereas this transfer is more complete for the more anoxic settings.
Geosciences 09 00325 g010
Table 1. Element and isotope data for Cu in Peru Margin sediments.
Water Depth/ OPF HFD Bulk
SampleDepth in CorebBWObwtcCδ13CAldPdCud% Cuδ65CueAldCud% Cuδ65CueTOCbδ13CAldCudCu/Alδ65Cue
(m) or (cm)(μM)(%)(wt.%)(%)(wt.%)(ppm)(ppm)(of bulk)(‰)(‰)(wt.%)(ppm)(of bulk)(‰)(‰)(wt.%)(‰)(wt.%)(ppm)(x104)(‰)(‰)
BC 3955010203.4−20.91.03233284−0.020.032.26.0160.530.073.4−21.13.238120.070.04
BC 57172<103412−20.80.710133670.120.034.116330.750.049.6−20.54.850100.320.04
BC 6264310214.4−21.30.93530840.100.035.45.7160.880.035.0−20.96.3365.70.220.03
BC 7672515304.9−21.21.4483283−0.050.035.06.7171.320.066.6−21.16.4396.10.180.04
BC 81130103611−20.61.17147720.120.034.618280.960.0410.6n/a5.766110.360.03
KC 8310610447.9−20.41.37135670.300.033.017330.900.047.8−20.24.352120.500.04
BC 931005253.4−20.80.32024560.010.035.019441.130.043.7−20.55.3438.10.500.04
BC 1253405367.6−21.30.79427750.240.044.88.8250.850.038.1−20.75.5366.50.390.04
KC 1273095454.1−20.90.45532650.310.042.718350.830.049.9−20.63.150160.500.04
BC 1532505518.7−20.90.12922610.300.032.514391.040.049.7−20.82.635140.590.03
MC6A10–12.2342.9−21.20.7211838−0.380.032.628620.870.035.4n/a3.346140.400.03
MC6A65–62.2364.0−20.40.8292853−0.130.022.325470.860.035.9−20.73.252170.340.03
MC6A1413–142.2323.7−20.30.9392761−0.130.022.618390.960.036.0−20.73.445130.300.03
MC6A1615–162.2303.4−21.21.1231735n/an/a3.33265n/an/a5.1−21.24.44811n/an/a
MC6A2221–222.2222.2−22.20.9181958−0.180.023.21442n/an/a3.3−22.24.1338.0n/an/a
MC6A2625–262.2242.9−21.81.2282158−0.280.033.11542n/an/a4.0−21.84.2378.7n/an/a
MC6A3736–372.2193.2−20.80.5312047n/an/a3.22253n/an/a5.1−20.93.74211n/an/a
MC6A444644–462.2203.1−21.00.8152770−0.090.033.011301.070.043.7n/a3.938100.260.03
MC11C43–42.14316−21.20.713957920.370.031.74.87.90.530.0514.2−21.32.461250.380.03
MC11C87–82.13510−21.80.712346860.270.021.87.3140.460.0212.9−21.72.653210.300.02
MC11C1716–172.1317.1−22.00.912840790.310.022.21021n/an/a11.8−21.73.15116n/an/a
MC11C2322–232.1308.0−21.90.81334285n/an/a2.17.715n/an/a11.5−21.72.95017n/an/a
MC11C2827–282.1307.1−21.80.79847840.270.032.68.7160.810.0312.0−21.83.355170.350.03
MC11C3534–352.1155.1−22.00.38635880.270.032.24.7120.440.0410.3n/a2.539160.290.03
MC11C3736–372.1296.6−21.70.91764277n/an/a2.31223n/an/a12.6−21.43.25417n/an/a
MC11C464846–482.1319.4−21.61.03344079n/an/a1.71121n/an/a10.8−21.42.85118n/an/a
MC9G10–180191.0−21.50.4181159−0.060.033.47.4411.000.031.6n/a3.8184.80.370.03
MC9G32–380191.1−21.40.4311157n/an/a3.58.843n/an/a2.2−21.63.9205.2n/an/a
MC9G54–580161.0−21.10.4171156n/an/a3.78.344n/an/a2.0−21.64.1194.6n/an/a
MC9G76–780141.0−20.90.26.64.338−0.060.034.06.9621.030.031.8−21.74.2112.60.610.03
MC9G98–980151.0−21.20.48.56.643n/an/a3.88.757n/an/a2.3−21.64.2153.6n/an/a
MC9G1110–1180171.2−20.50.38.41465−0.090.033.77.3350.990.031.6n/a4.0215.20.280.03
MC9G1312–1380141.2−20.60.48.11365−0.170.023.56.8351.060.051.7−21.83.9195.00.270.04
aTOC, δ13C, Al, P data as presented in Ciscato et al. [37]. bWater depth for R/V Seward Johnson samples and depth in core for all other samples; BWO is bottom water oxygen; TOC measured in bulk sample wt.% of total sample found to be in the OPF; dCopper concentrations obtained from the Element analysis. Copper concentrations obtained by Element analysis and isotope dilution agree to within 10–20%, but Element concentrations are used in all diagrams because of the inclusion of Cu/Al ratios; eThe 2σ uncertainties reported here are internal errors propagated through the double spike reduction procedure. fData for the bulk are calculated as the sum of the OPF and HFD contributions.
Table 2. Element and isotope data for Cu in ancient sediments.
Sample IDCore IDGroup, FormationLithologyRedoxAgeDepth in CoreOPFHFD Bulk
wtaδ13CAlbPbCub% Cuδ65CucAlbCub% Cuδ65CucTOCdAlbCubCu/Alδ65Cuc
(Ma)(m)(%)(‰)(wt.%)(ppm)(ppm)(of bulk)(‰)(‰)(wt.%)(ppm)(of bulk)(‰)(‰)(wt.%)(wt.%)(ppm)(x104)(‰)(‰)
GYX GC3n/aWufeng Fm. Guizhou Provinceblack shale 446.34n/a13n/a1.74.40.582.60.300.033.722970.550.03n/a5.4224.10.540.03
GYX GC7n/aWufeng Fm. Guizhou Provinceblack shale 446.34n/a4.6n/a0.00942.60.472.00.490.023.323980.150.04n/a3.3247.10.150.04
GYX GC11an/aWufeng Fm. Guizhou Provinceblack shale 446.34n/a5.5n/a0.0524.00.872.71.340.034.331971.720.03n/a4.4327.31.710.03
GRSW15n/aLongmaxi Fm. Guizhou Provinceblack shale 443.83n/a8.3n/a0.556.51.42.10.340.045.066981.030.03n/a5.568121.010.03
GRSW21n/aLongmaxi Fm. Guizhou Provinceblack shale 443.83n/a4.4n/a0.213.70.741.11.030.044.167990.550.02n/a4.468160.550.02
GRSW27n/aLongmaxi Fm. Guizhou Provinceblack shale 443.83n/a6.0n/a1.59.91.12.60.160.033.742971.190.03n/a5.2438.31.160.03
Baldwin1 B1Baldwin-1Red Heart Dolomiteblack shale 521968.56.7n/a1.08.00.0120.86n/an/a6.51.4991.860.030.207.51.40.19n/an/a
Baldwin1 B2Baldwin-1Red Heart Dolomiteblack shale 521968.27.8n/a1.59.20.0550.650.390.057.98.5990.820.030.169.38.50.910.810.03
Baldwin1 B13Baldwin-1Thorntonia Limestoneblack shale 515899.516n/a0.136.70.0201.31.090.060.31.599n/an/a1.20.41.53.4n/an/a
Baldwin1 B22Baldwin-1Arthur Creekblack shale 505888.013−32.00.211018.115n/an/a3.64685n/an/a4.73.85414n/an/a
Baldwin1 B25Baldwin-1Arthur Creekblack shale 505878.023−32.10.8811391213n/an/a2.07787n/an/a3.32.98930n/an/a
M1 866.8Munta-1Officer Basin, Observatory Hillshale 520866.820−30.92.83.91.43.6−0.230.046.23996−0.040.04n/a9.1404.5−0.050.04
M1 953.2Munta-1Officer Basin, Naranashale 565953.219−32.81.70.70.0690.44−0.240.041.6161000.170.040.233.3164.80.160.04
M1 1172Munta-1Officer Basin, Munyarashale 5651172.016−22.33.6131.10.84−0.900.036.713199−0.070.040.101013213−0.080.04
M1 1215Munta-1Officer Basin, Tananashale 5701215.910−29.11.97.40.845.7−0.400.037.414940.170.030.209.3151.60.140.03
Wallara W40Wallara-1Amadeus Basin, Finke beds Fm.black shaleferruginous7501486.332−27.30.393.90.742.8n/an/a1.72697n/an/a0.502.12712n/an/a
AEM 59.18S3Mauritania, Aguelt El Mabhalam black shaleferruginous110059.2n/an/a1.75.80.302.40.510.161012980.380.050.2812121.10.380.06
AEM 59.33S3Mauritania, Aguelt El Mabhalam black shaleferruginous110059.33n/an/a0.0240.60.0570.420.370.0610131000.160.050.2210141.30.160.05
Tourist S2 141S2Mauritania, Touristdark grey/black shaleferruginous1100141.8n/an/a0.81257.76.60.270.0410110930.560.042311118110.540.04
Tourist S2 171S2Mauritania, Touristdark grey/black shaleferruginous1100151.7n/an/a0.82294.37.30.500.041055930.580.047.211595.20.570.04
Tourist S3 181S3Mauritania, Touristdark grey/black shaleferruginous1100181.5n/an/a0.692.84.031−0.440.045.48.8691.620.060.806.1132.10.980.05
RP 4.12BMR Urapunga4Roper Gr., McArthur Basin, Velkerrishaleeuxinic1361216.74.3n/a0.213.50.700.200.870.034.03531000.700.033.44.2353840.700.03
RP 4.22BMR Urapunga4Roper Gr., McArthur Basin, Velkerrishaleeuxinic1417363.48.5n/a0.918.61.81.6−0.150.036.9112981.060.043.07.8114151.040.04
MB14GRNT 79-7Barney Creek, McArthur Basinshaleeuxinic16394915.8n/a0.56150.592.20.330.056.126980.000.031.56.7274.00.010.03
MB19GRNT 79-7Barney Creek, McArthur Basinshaleeuxinic16394965.9n/a0.68331.22.61.260.047.546970.580.041.78.2475.70.600.04
MB27GRNT 79-7Barney Creek, McArthur Basinshaleeuxinic16395081.9n/a0.246.10.400.900.520.088.84499n/an/a0.669.0444.9n/an/a
MB36GRNT 79-7Barney Creek, McArthur Basinshaleeuxinic163985112n/a0.65110.461.9−0.190.054.62498n/an/a1.35.3254.6n/an/a
981 05_08PR98-1Animikie Basin, Roveshaleferruginous183555.514n/a1.6145.75.30.580.043.6103951.090.044.55.2109211.070.04
MGS2 22MGS2Animikie Basin, Virginiashaleeuxinic183599.17.0−32.31.64.91411−0.300.039.8123890.630.043.211138120.530.04
PC10477BLD3Mt. Partridge, Pine Creek, Wildman Sltstblack shaleferruginous201985.024n/a1.44.38.230−0.780.075.119701.050.043.56.5274.20.500.05
PC11077BLD3Mt. Partridge, Pine Creek, Wildman Sltstblack shaleferruginous201996.214−30.61.84.43.121n/an/a1112790.310.033.613151.1n/an/a
EBA1 826.2EBA-1Pretoria, Timeball Hillblack shaleferruginous2316826.214−30.92.25.49.5150.490.041354850.350.032.715644.10.370.03
EBA1 1158.5EBA-1Pretoria, Timeball Hillblack shaleferruginous23161158.58.8−35.00.521771213−0.320.041084870.090.046.311969.00.030.04
EBA1 1160EBA-1Pretoria, Timeball Hillblack shaleferruginous2316116010n/a0.701242120.580.028.2306880.800.046.38.9348390.780.04
McRS10n/aHamersley Basin, Pilbara Craton, Mt. McRaeblack shale 2479n/a7.4n/a0.00760.421630−0.530.092.737700.990.034.02.753200.540.06
WS 2n/aHamersley Basin, Pilbara Craton, Whaleback Shaleblack shale 2463n/a59−31.41.3142.186n/an/a3.00.36140.060.113.04.32.50.58n/an/a
WS 4n/aHamersley Basin, Pilbara Craton, Whaleback Shaleblack shale 2463n/a46−31.80.483.80.9471n/an/a3.50.3829−0.100.132.74.01.30.33n/an/a
GKP01 310.2GKP-01Transvaal, Klein Nauteblack shaleinterm. eux2521310.28.0−39.20.32382416−0.170.045.8131840.120.034.26.2155250.070.04
GKP01 337GKP-01Transvaal, Upper NaugaBIF/chertinterm. eux25213371.0−34.70.170.422.27−0.190.040.22993−0.070.044.60.43182−0.080.04
GKP01 1209.6GKP-01Transvaal, Vryburgorg-rich silicic mdst 26691209.626−34.14.9277.65.50.100.049.0130940.120.041.7141379.90.120.04
WRL1 HM21WRL-1Fortescue Gr., Maramambashale 2597590.528n/a2.52.80.6721−0.070.030.72.5791.750.161.33.23.21.01.360.14
PGA 46.27TSB07-26Mozaan Gr., Ntombeshale 295446.2721n/a0.910.711.73.50.640.044.246961.150.040.545.1489.31.130.04
PGA 46.53TSB07-27Mozaan Gr., Ntombeshale 295046.5319n/a0.500.101.23.60.850.043.232960.510.030.493.7338.80.520.03
PGA 46.67TSB07-28Mozaan Gr., Ntombeshale 295046.6718n/a0.671.12.53.41.160.043.373970.000.020.394.075190.040.02
PGA 70.18TSB07-29Mozaan Gr., Ntombeshale 295070.188.3n/a0.670.350.683.50.540.043.519970.350.04n/a4.2204.70.350.04
PGA 93.36TSB07-30Mozaan Gr., Ntombeshale 295093.3617n/a1.10.701.54.60.380.033.931950.910.040.445.0326.50.890.04
PGA 162.4TSB07-31Mozaan Gr., Sinqenishale 2950162.441n/a3.92.61.82.60.810.034.068971.100.030.118.0708.81.090.03
BARB3 ETH1BARB 3Buck Reef Chertblack shale 3400208.71.8n/a0.063.60.2551−0.240.043.60.25491.660.033.23.70.500.140.700.04
BARB3 ETH2BARB 3Buck Reef Chertblack shale 3400213.13.5−31.20.00.001.335n/an/a6.32.3651.380.062.66.33.60.58n/an/a
BARB3 ETH9BARB 3Buck Reef Chertblack laminated chert 3400871.50.6n/a0.191.60.520.88−0.040.041.15899−0.010.031.71.35944−0.010.03
BARB4 ETH24BARB 4Upper Mendon Formationblack chert 3280434.715−26.81.22.01919n/an/a127881n/an/a1.813967.4n/an/a
awt.% of total sample found to be in the OPF; bConcentrations obtained from the Element analysis. Copper concentrations obtained by Element analysis and isotope dilution agree to within 10–20%, but Element concentrations are used in all diagrams because of the inclusion of Cu/Al ratios; cThe 2σ uncertainties reported here are internal errors propagated through the double spike reduction procedure; dData for the bulk are calculated as the sum of the OPF and HFD contributions.