Article

An Agent-Based Evaluation of Varying Evacuation Scenarios in Merapi: Simultaneous and Staged

1
Faculty of Geography, Universitas Muhammadiyah Surakarta, Surakarta 57162, Indonesia
2
Centre for Spatial Analysis & Policy, School of Geography, University of Leeds, Leeds LS2 9JT, UK
3
River Basin Processes & Management, School of Geography, University of Leeds, Leeds LS2 9JT, UK
*
Author to whom correspondence should be addressed.
Geosciences 2019, 9(7), 317; https://doi.org/10.3390/geosciences9070317
Submission received: 2 June 2019 / Revised: 10 July 2019 / Accepted: 15 July 2019 / Published: 18 July 2019

Abstract

:
Mass evacuation should be conducted when a disaster threatens within a regional scale. It is reported that 400,000 people were evacuated during the last eruption of Merapi Volcano in 2010. Such a large-scale evacuation can lead to chaos or congestion, unless well managed. Staged evacuation has been investigated as a solution to reducing the degree of chaos during evacuation processes. However, there is a limited conception of how the stages should be ordered in terms of which group should move first and which group should follow. This paper proposes to develop evacuation stage ordering based on the geographical character of the people at risk and examine the ordering scenarios through an agent-based model of evacuation. We use several geographical features, such as proximity to the hazard, road network conditions (accessibility), size of the population, and demographics as the parameters for ranking the order of each population unit in GIS. From this concept, we produced several scenarios of ranking based on different weightings of the parameters. We applied the scenarios in an agent-based model of volcanic evacuation experiment to observe the results. Afterwards, the results were evaluated based on the ability to reduce the risk and spatio-temporal traffic density along road networks compared to the result of simultaneous evacuation to establish the relative effectiveness of the outcome. The result shows that the staged scenario has a better ability to reduce the potential traffic congestion during the peak time of the evacuation compared to the simultaneous strategy. However, the simultaneous strategy has better performance regarding the speed of reducing the risk. An evaluation of the relative performance of the four varying staged scenarios is also presented and discussed in this paper.

1. Introduction

The human population growth and distribution changes on earth increase the occurrence of natural disasters over time [1]. Natural disasters occur worldwide but have a greater impact on developing countries, for example Indonesia. These disasters occur when geophysical events, such as earthquakes, volcanic eruptions, landslides, and floods, threaten human life [2]. The impact of natural disasters is increasing in present years due to the increasing size of the population in the hazard-prone areas [3]. Indonesia is one of the countries that are prone to suffering natural hazards, especially volcanic eruptions [4]. Indonesia is also one of the most volcanically active countries, with over 130 volcanoes and some of the most densely populated areas in the world [5,6,7]. This combination of both physical and social factors has led to Indonesia suffering the greatest number of fatalities due to eruptions [2,8]. Merapi, in central Java, is one of the most dangerous volcanoes in Indonesia because of its frequent activity, location in a densely populated area, and proximity to the city of Yogyakarta [9,10,11]. More than a million people live in this city, and 400,000 people are at particular risk [9,10].
Mass evacuations should be conducted when a volcanic crisis threatens the surrounding areas and demands effective management. Over 400,000 people were evacuated in the last eruption of 2010. Various problems arose following this mass mobility, and it can particularly lead to congestion and excessive delays unless well managed [12]. These conditions not only decrease the effectiveness of evacuations in minimising the risk but also lead to secondary fatalities, such as traffic accidents [13]. Providing a well-tested evacuation plan is one of the ways to increase the effectiveness of evacuations in terms of saving lives [14]. It is necessary to evaluate the evacuation plan based on the population’s behaviour, in order to test the plan. As the goal of the plan is to save human lives from the volcano’s impact, the effectiveness of the plan is measured by its ability to achieve this goal.
Two major evacuation plans are commonly applied, namely, staged and simultaneous evacuation [15]. In the simultaneous strategy, all of the residents in the affected area are evacuated simultaneously, while a staged strategy divides the affected area into zones and organizes the evacuation of residents in each zone in a sequence [16]. The simultaneous strategy has been applied widely but examples of the staged strategy remain limited. A well-documented staged evacuation was that in New Orleans in response to Hurricane Katrina in 2005 [17]. Staged evacuation has been investigated as a potential solution for reducing the time required for evacuation processes when the road network is incapacitated [16].
Studies exist on developing methods for a staged evacuation strategy, including scheduling the start time for the evacuation of each group using a mathematical approach [18], defining the evacuation time and delay time using a mathematical approach [15], identifying the priority ranking using a heuristic approach [19], and defining the evacuation zones using a clustering approach [20]. However, there exists limited knowledge regarding how the sequential ordering of the evacuation measures should be managed, i.e., how to prioritise which zone should be evacuated first and which should follow. Moreover, evaluation of the effect of evacuation staging on reducing disaster risk is absent from the literature.
This paper develops evacuation stage ordering based on the geographical character of the people at risk and examines the scenarios within the agent-based model of evacuation. We use several parameters modified from Mitchell and Radwan [19], such as proximity to the hazard, the accessibility of shelters, and population density, as the parameters for ranking the order of each population unit in GIS. Based on this concept, we produced several ranking scenarios based on different weightings of the parameters. We use the scenarios in the agent-based model of volcanic evacuation experiment to observe the results. Afterwards, the results were evaluated based on the ability to reduce risk and spatio-temporal traffic density along road networks compared to the result of simultaneous evacuation in providing the relative effectiveness of the outcome. The background theory on developing the staging scenarios is provided in the following section, while the details about the method are provided in the third section. Consequently, the results and discussion are provided in the third section and, finally, the conclusion is presented in the fourth section.

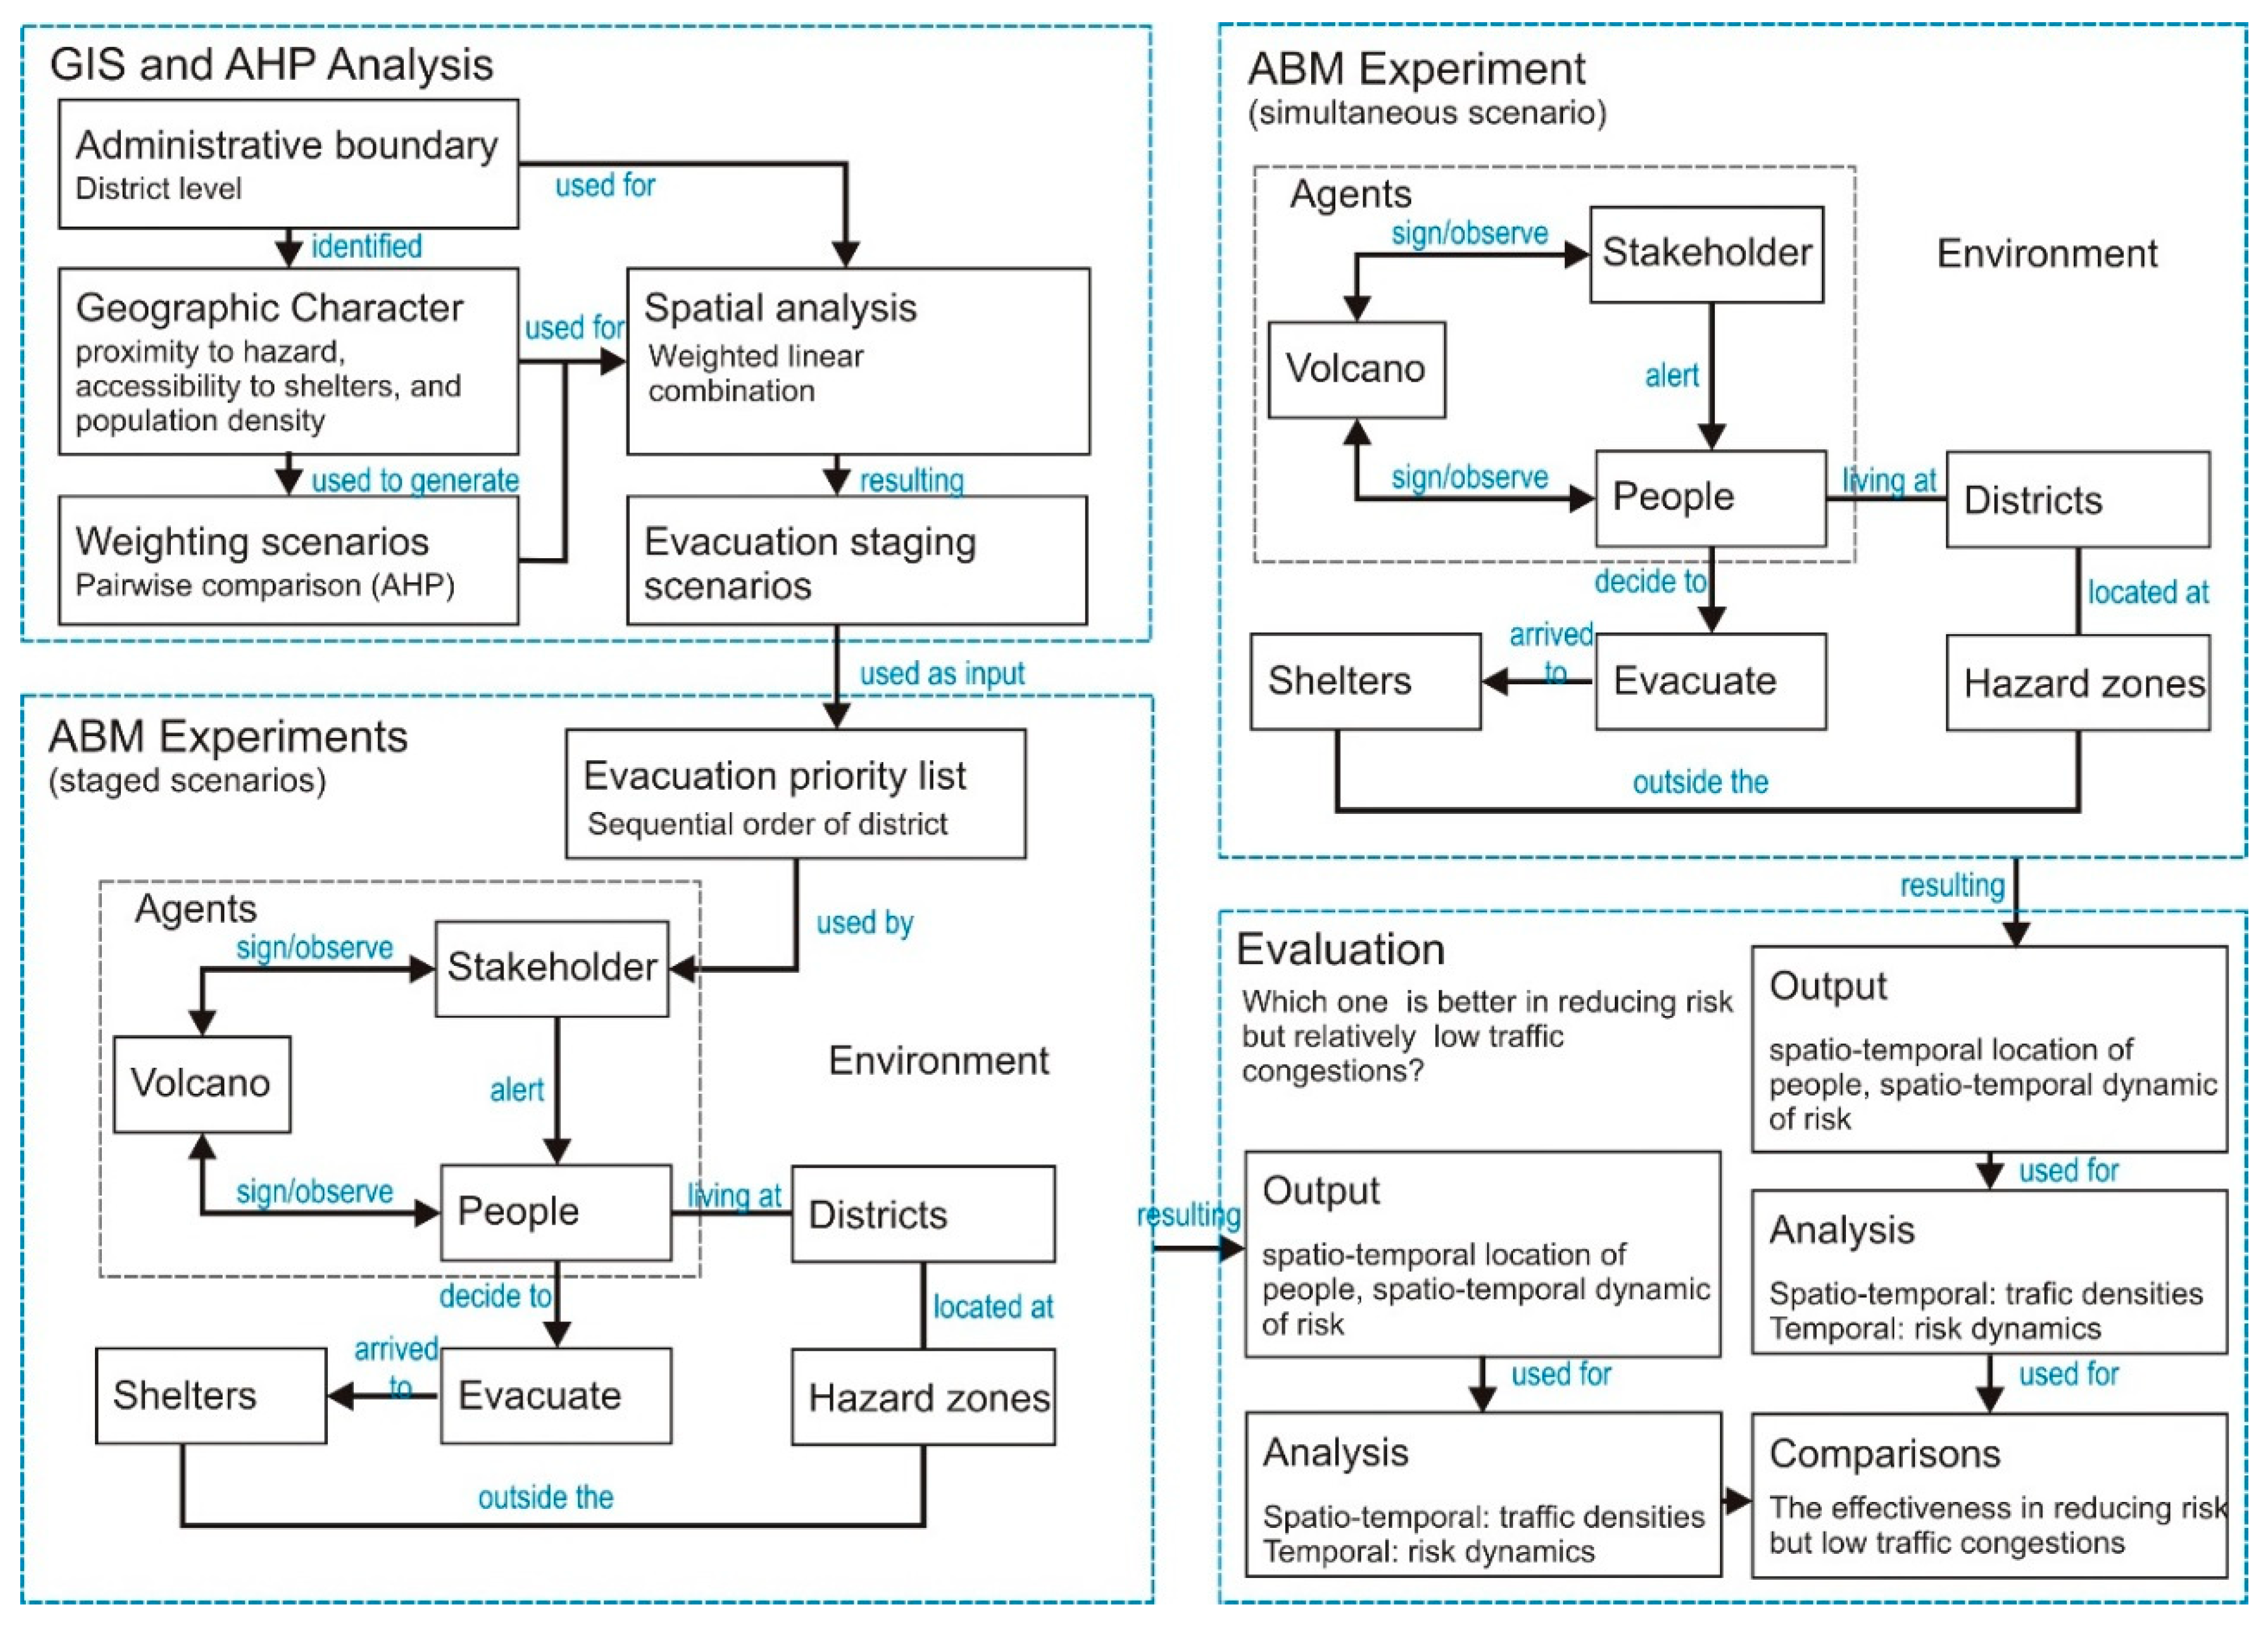
2. Materials and Method
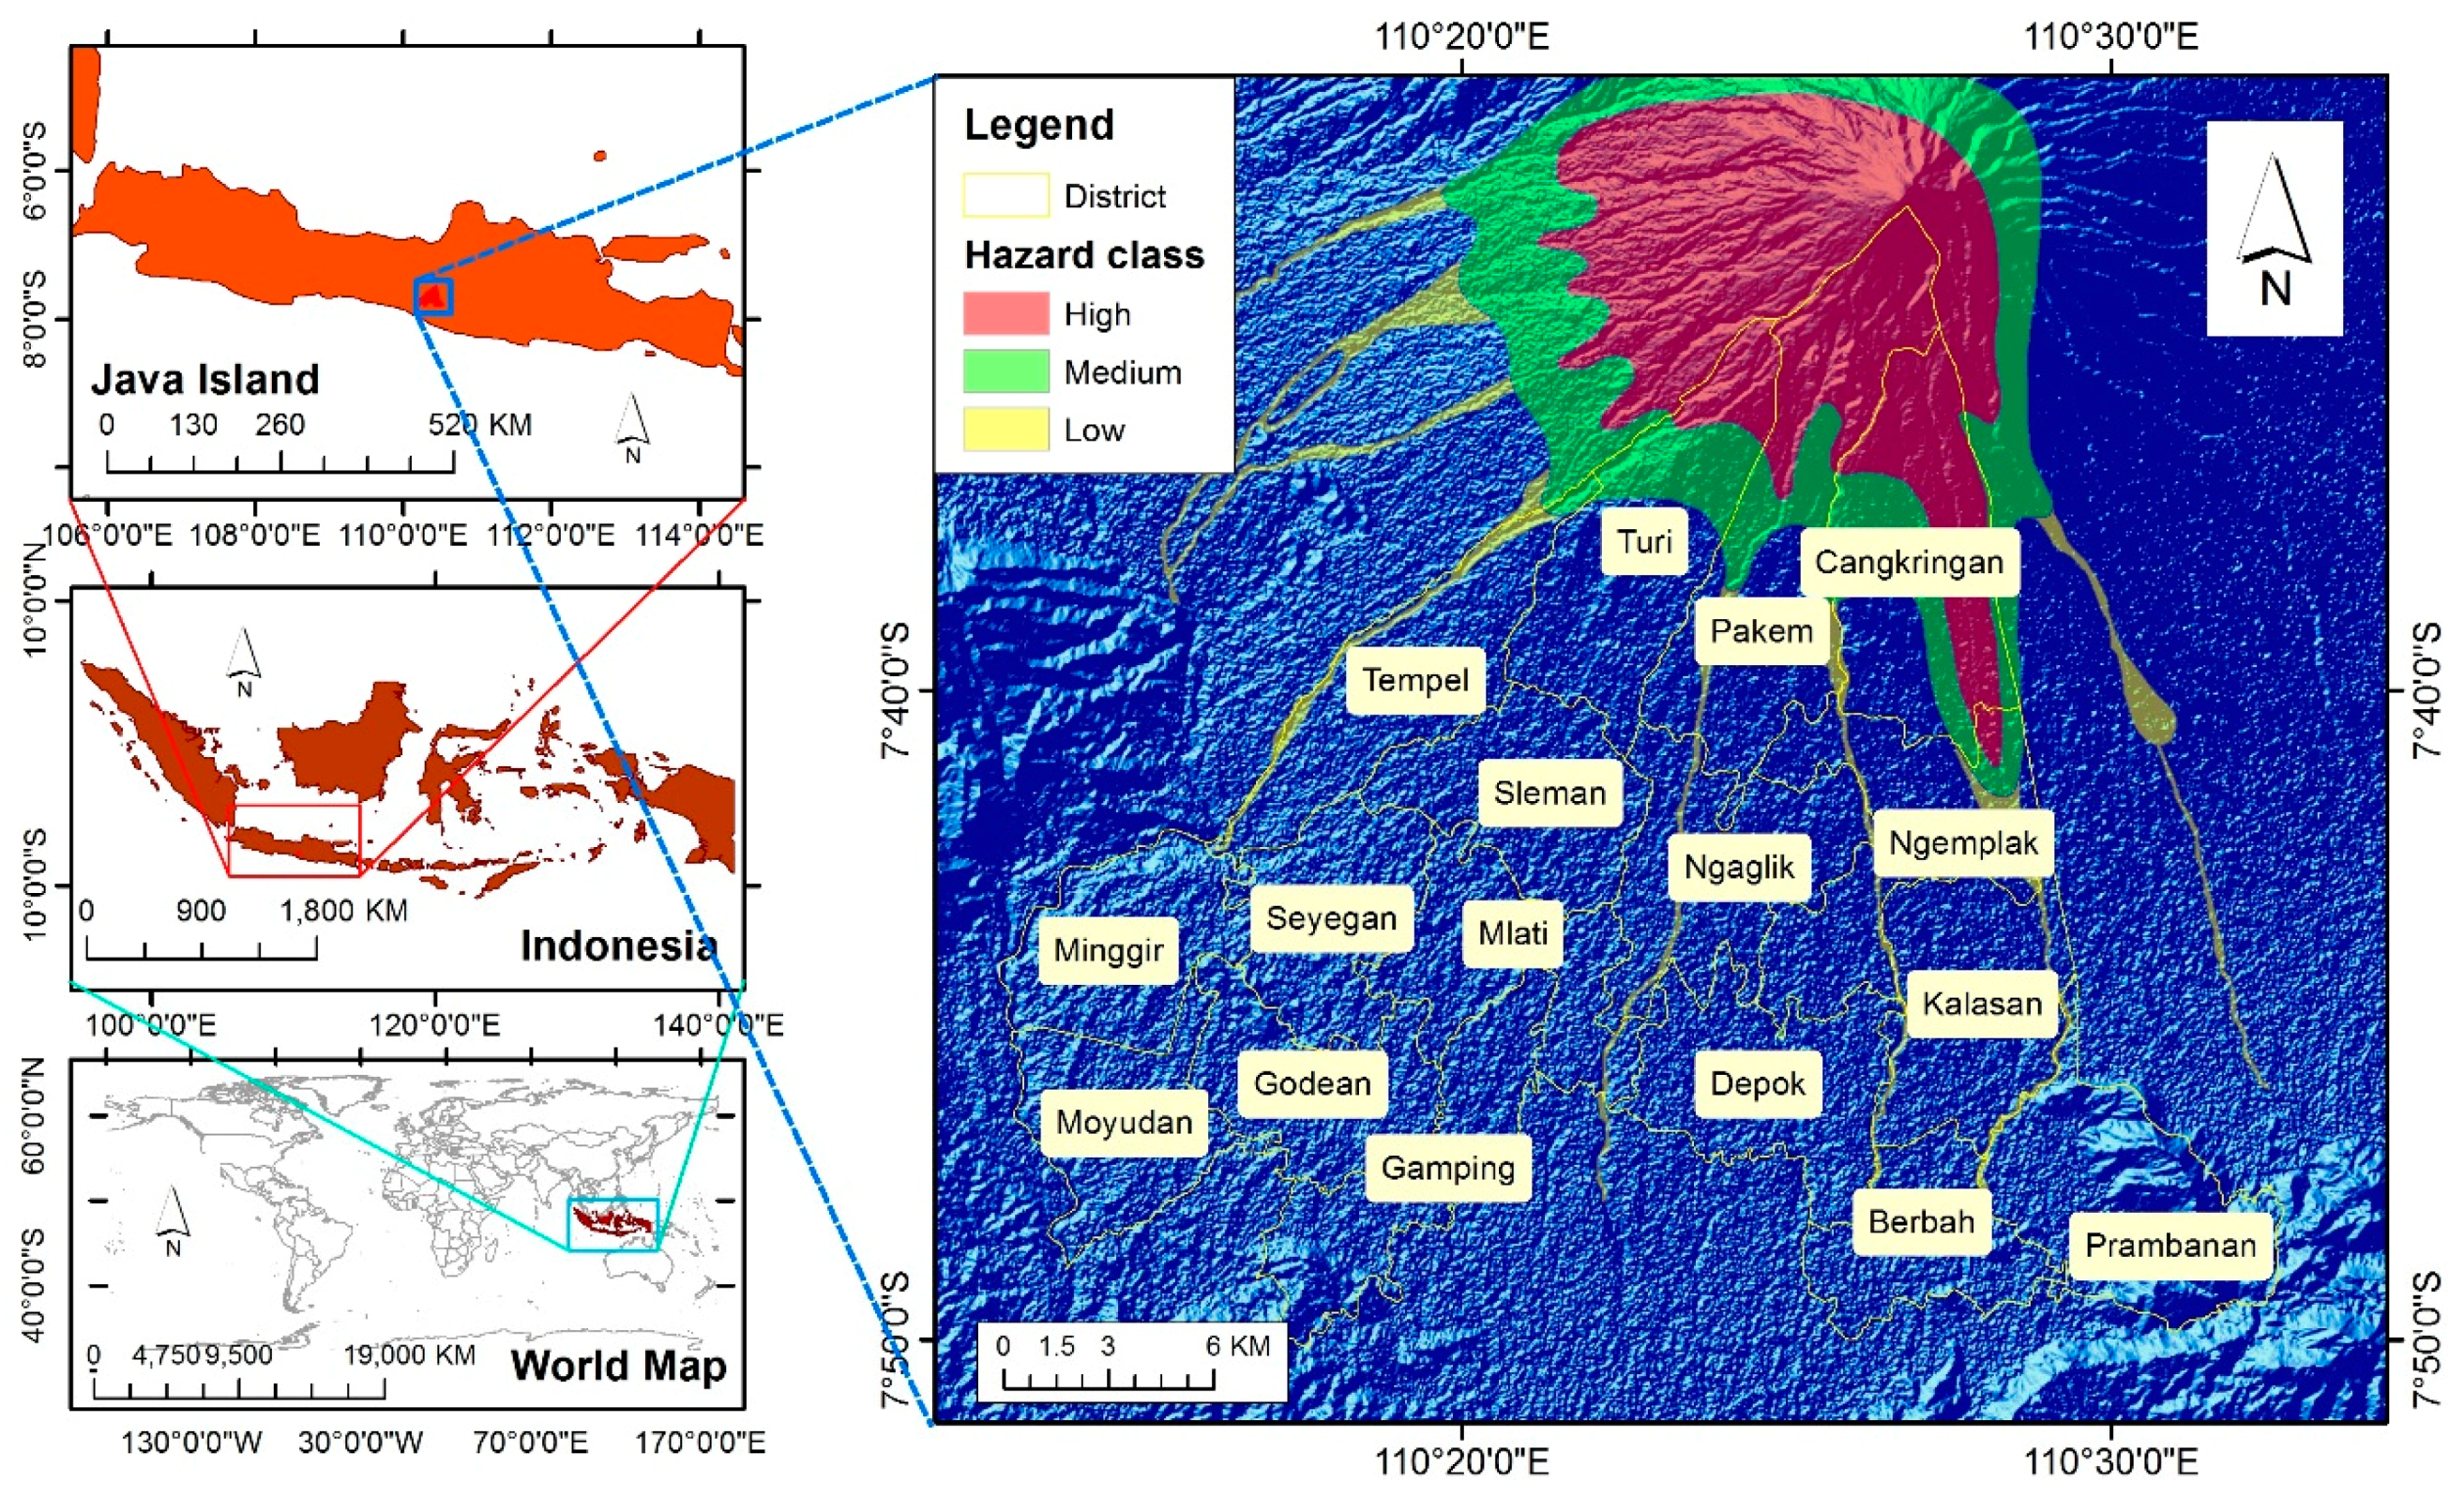
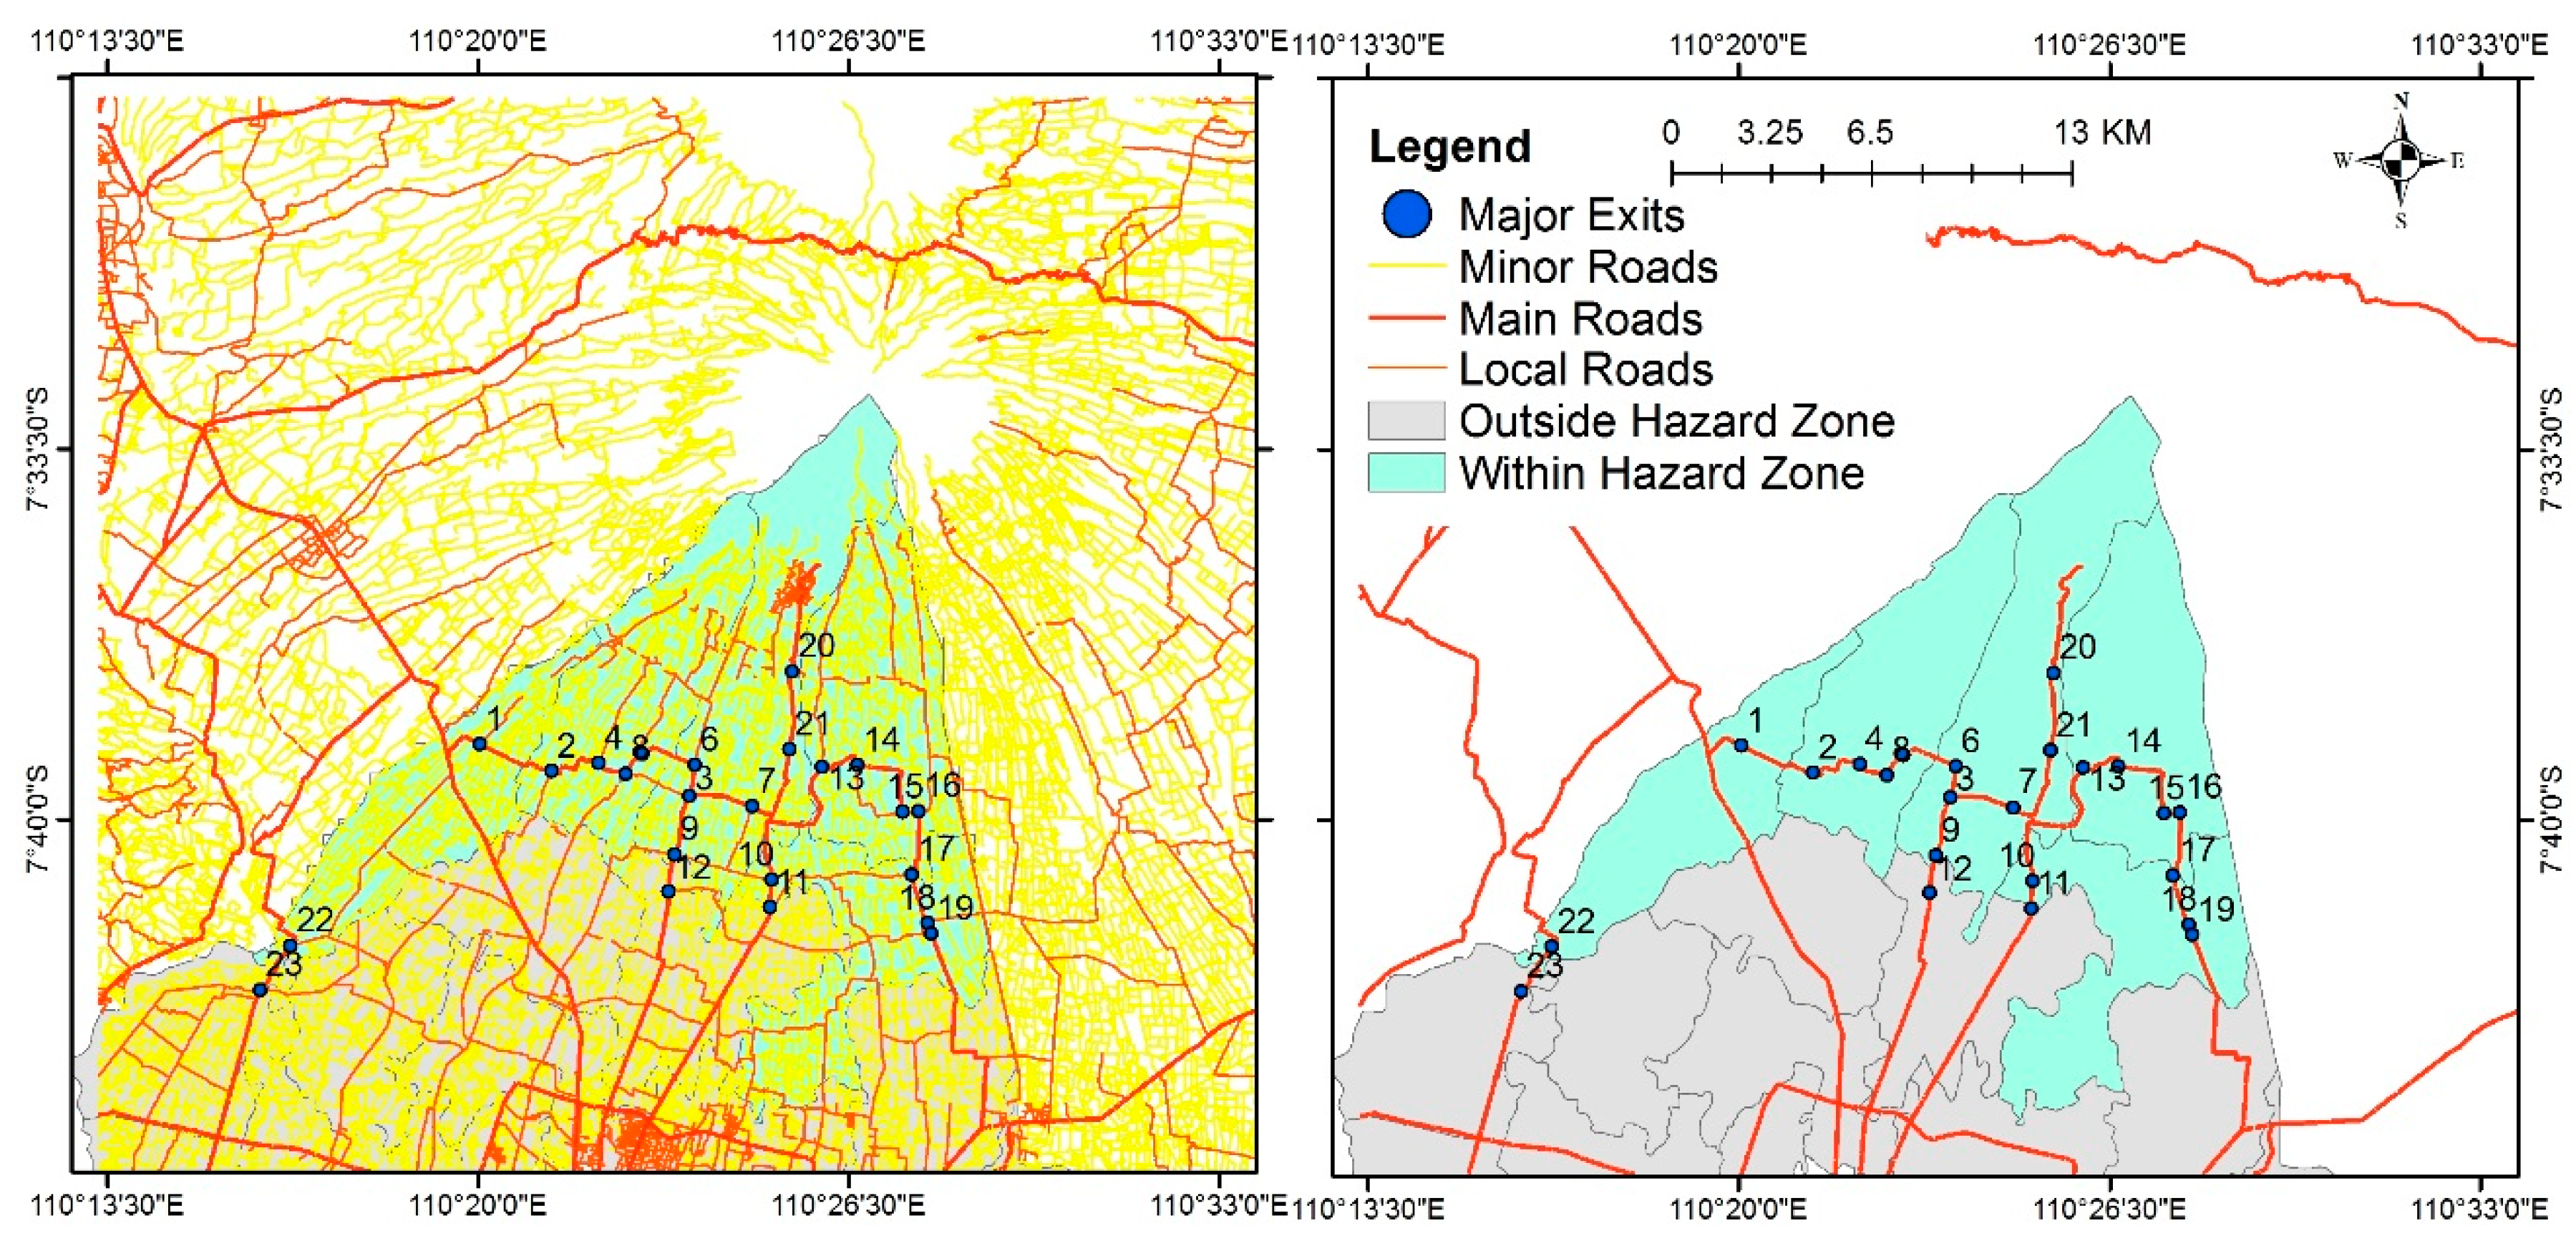
We used an agent-based experiment to examine the “what if” scenarios of evacuation staging produced by Spatial Multi-criteria Evaluation (SMCE) in GIS (Figure 1). The results of these scenarios were compared against simultaneous scenarios to evaluate: (1) whether staged evacuation is more effective than simultaneous evacuation, and (2) the importance of the ranking of the criteria in planning the zonal order. Pairwise comparison analysis (AHP) [21] was used to rank the criteria. Afterwards, a weighted linear combination (WLC) [22,23] was used to analyse the population unit spatially to produce the evacuation sequence in GIS, where the sequence results are used to set the agent-based model (ABM) that was previously developed (see [24,25,26]), whereby a detailed framework is provided in reference [24], the individual evacuation decision concept in reference [25], and the spatio-temporal dynamics of the risk model in reference [26]. For the experimentation, we used Merapi as a case study of evacuation during a volcanic crisis. This section provides: (1) an overview of the study area, (2) a technique for developing the zonal ranking to short the evacuation sequence in the staged evacuation scenario, (3) the agent-based model used to evaluate the scenarios, (4) the implementation of the scenarios in the ABM experiment to examine them, and (5) an approach to evaluating the effectiveness of each scenario.

2.1. Study Area

Merapi Volcano is located in Indonesia, in the central part of Java Island. Geographically, Merapi is located across four districts of two provinces, namely Sleman (Yogyakarta), Magelang, Boyolali, and Klaten districts (Central Java). More precisely, it is located at 7°32′30″ latitude and 110°26′30″ longitude. In this study, we only use the Sleman area, that is located on the southern flank of Merapi (Figure 2). It is geographically located between 107°15′03″ and 107°29′30″ longitude, 7°34′51″ and 7°47′30″ latitude. Sleman covers 57,482 hectares or 574.82 km2 (about 18% of Yogyakarta Province). Administratively, this region consists of 17 districts, 86 villages, and 1,212 hamlets.
The latest eruption occurred in 2010 and was said by the authorities to have been the largest since the 1870s. The eruption began in late October 2010 and continued into November 2010. During this period, the activity of Merapi culminated in numerous pyroclastic flows down to the populated area on the lower slope. Almost 50,000 people were located in the high-risk area. Moreover, 367 of these people lost their life, 277 were injured, and 410,388 were displaced [27]. After the eruption, Merapi lahars can remain a potential threat to the surrounding communities for at least three years. This threat not only damaged hundreds of settlements but also bridges, tourism sites, irrigation channels, and agricultural land. Accordingly, the National Agency for Disaster Management (BNPB) published a map of the vulnerable area of Merapi due to the neighbouring volcano (Figure 2). It can be seen that the vulnerable area spread down from the summit into the settlement areas.
There are two potential hazards, namely Nue’esardentes and lahars, that usually kill people. Nue´esardentes are produced by occasional gravitational collapses [28], and deposits can travel up to 3.5 km from only a few individual events [29]. They can be triggered by gravitational dome collapse, the extent of the impacts of which are commonly controlled by topographical factors [30]. On the other hand, Lahars events are usually initiated by intense rainfall [31]. Lahars are an overbank pyroclastic coupled with rainwater flow, which is considered the most dangerous part of the material flow system in Merapi [32]. The direction of this flow is strongly influenced by the initial flow direction and the topography that affect the spatial extent of the hazard afterwards [33]. This kind of disaster is prone to occur in Merapi [34] and potentially posed the major risk after the 2010 eruption [35]. In particular, the abundance of pyroclastic deposits on the slope lead to occurrences of lahars flooding during rainstorms.

2.2. Zones Ranking for Evacuation Staging

A staged evacuation strategy needs scenarios of leaving sequences among the evacuation zones. The sequence for which zone should be evacuated first and which later requires careful prioritisation. There are some aspects to consider when setting these priorities. Mitchell and Radwan [19] used population density, roadway exit capacity, distance to safety or shelter, distance to major evacuation routes, and number of other regions or level of population density to transit. Conversely, Lim et al. [36] used the distance of regions from the hazard, the hazard extent, and the population density, while Alaeddine et al. [37] used similar factors to Lim et al. [36], with the additional factor of the age of the population. Based on the previous studies, we developed a method for building a sequence of evacuation staging using a spatial approach. We used this approach since evacuation is a geographically-related problem, therefore decisions based on spatial data will provide better results. We used a pairwise comparison to rank and order the evacuation zones into a sequence in GIS. Several aspects were used to develop the priority ranking, modified from references [36,37]. Here, we used three slightly different factors, namely, distance of the region from the hazard (the volcano’s crater), population density, accessibility to shelter, and the proportion of those of vulnerable age. The various evacuation staging scenarios, which will be evaluated using an agent-based experiment, are provided in Section 2.3.

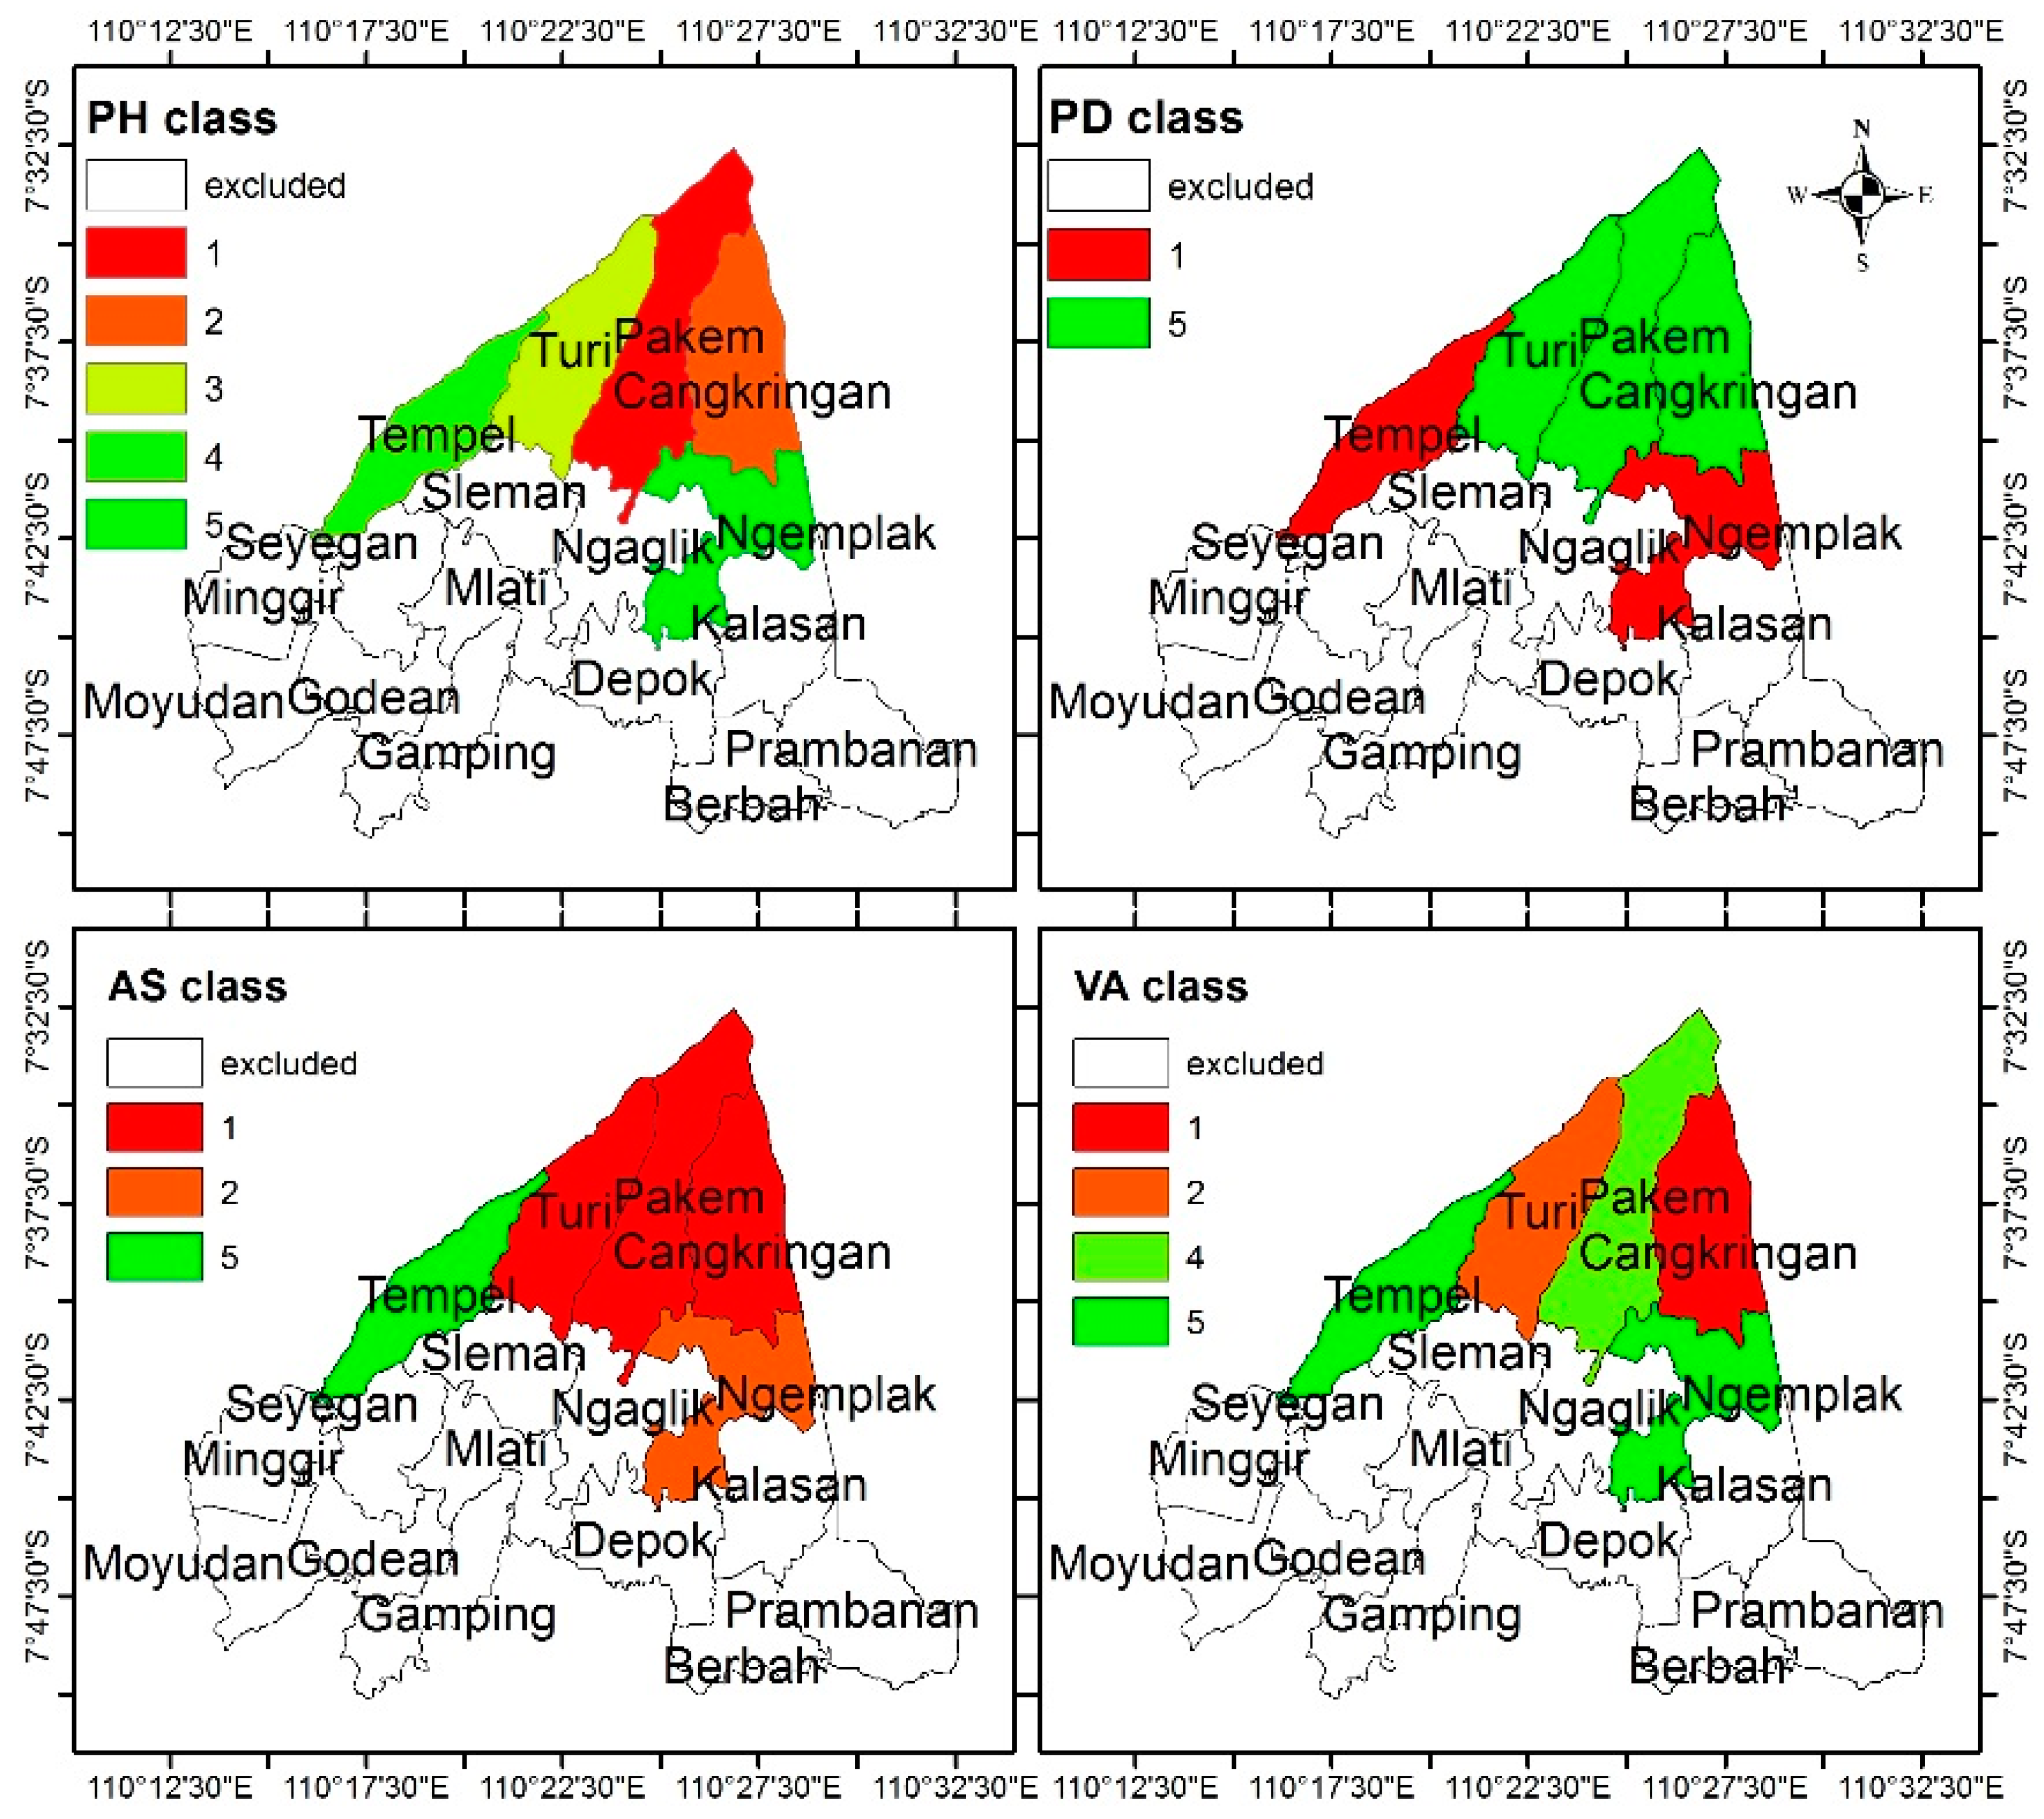
2.2.1. Evacuation Zones and Spatial Characteristics

The administrative boundary of the district level (Figure 2) will be used as the unit of the zones of the group since the evacuation command will be organized mainly by the local government [38]. There are five districts located in the main hazard zones of Merapi, including Tempel, Turi, Pakem, Cangkringan, and Ngemplak (see Figure 2), while districts at minor risk were excluded from the plan. The characteristics of each zone were identified to map the criteria used to design the staging. The data used to obtain the criteria included administrative boundaries, hazard zones [39], 2010 evacuation distribution data [40,41,42,43], and population data (each age category) [44]. All of the data were analysed and mapped to each zone (district) to establish the criteria.
The criteria used to analyse the zones’ ranking consisted of four spatial datasets (Figure 3), including: (1) proximity to the hazard (PH), provided by calculating the distance between the centroid of each zone and the volcano (summit), (2) population density (PD), provided by dividing the area of the zone by the population size within the zone, (3) accessibility to shelter (AS), analysed using the Hansen Index [45,46] provided in Equation (1), where Ai is the accessibility index for zone i to shelters (S), Sj is the capacity of shelter j, and Tij is the distance from zone i to shelter j, and (4) the proportion of population of vulnerable age (VA), based on the proportion of children (<15) and elderly people (>75).
A i =   j = 1 n S j T i j

2.2.2. “What if” Scenarios Development Using Pairwise Comparison Analysis

All of the datasets provided above (Section 2.2.1) were then analysed to design the staging scenarios using pairwise comparison analysis (Table 1 and Table 2). Since there has been little research on which factors are more important than others when designing the ordering, we used “what if” scenarios to examine all possible scenarios and select the most effective composition. Each scenario varied due to assigning the weight of each criteria depending on the importance scale (Table 2). The scenarios were designed to give all of the criteria a chance to be the most, medium, or least prioritized in designing the scenario. The final score for each district was calculated using WLC (Equation (2)), after which the results were ordered to obtain the ranking.
S c o r e = i = 1 n I i W i
where, Score indicates the degree of priority derived from the characteristics of the zone, Ii indicates the value of i criterion (Table 1), and Wi expresses the weight of i criterion (Table 2).

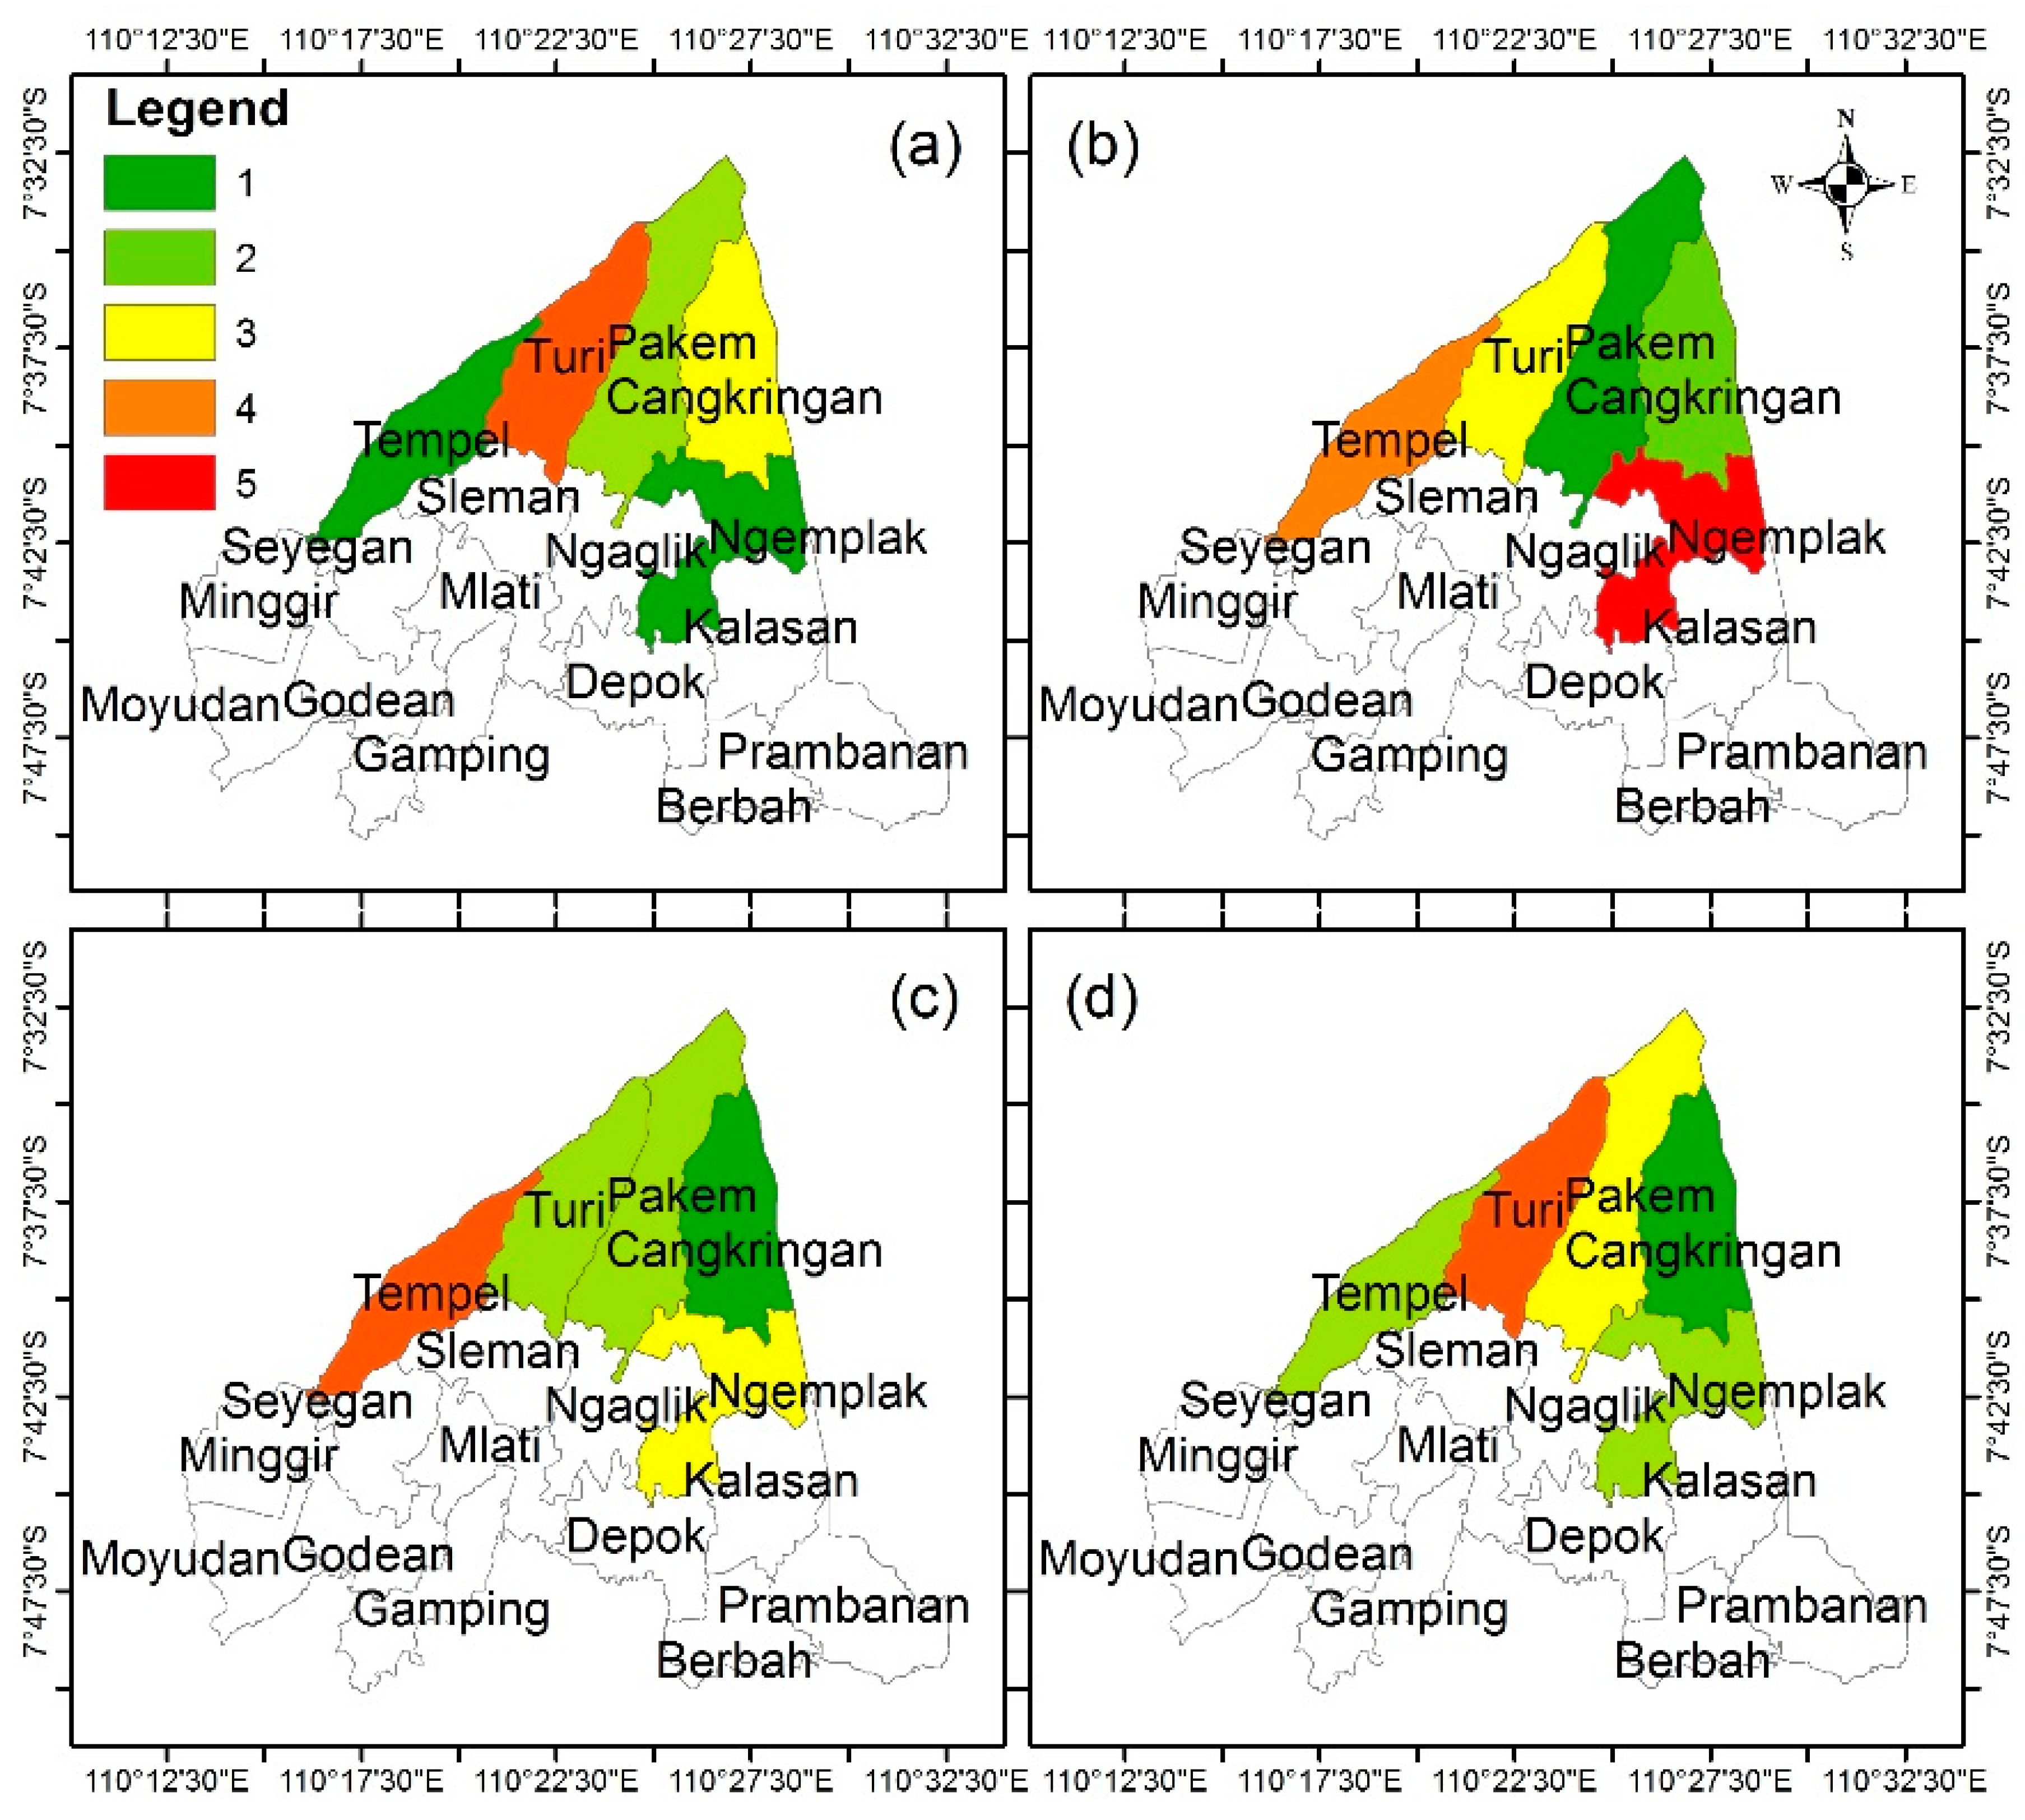
2.2.3. Staging Scenarios

A staging strategy is needed during a mass evacuation when the transportation network is unable to accommodate the whole population at the same time [37]. Therefore, a priority list is required to establish an affective evacuation staging scheme when scheduling the evacuation [19]. We provide the staging scenarios based on the scoring approach of the zone characteristics (Section 2.2.2). Based on an analysis of the datasets using WLC, a distinct sequential order for each scenario was created, based on the degree of priority (Table 3 and Figure 4). The prioritisation result shows that each zone is assigned a different priority rating for each scenario. Only one of the scenarios has the full five stages, while three have four stages, since two zones have the same score.

2.2.4. Time Interval between the Stages

The time interval is required to be set at the optimum value. This should be as low as possible but sufficient for the population within a zone to reach a major road network. It is assumed that after reaching the major road, the traffic can run smoothly. To provide the values for the time intervals, we analysed the average time that people required to reach the major exit points using Google Maps Distance Matrix Application Programming Interface (API). To provide the averages, we used the centroid of the population areas (districts) and found the minimum travel times from the grids to the exit points (Figure 5). The average of all of the travel times from the districts to reach the surrounding major exit points was used as the time interval between the stages (Table 4).

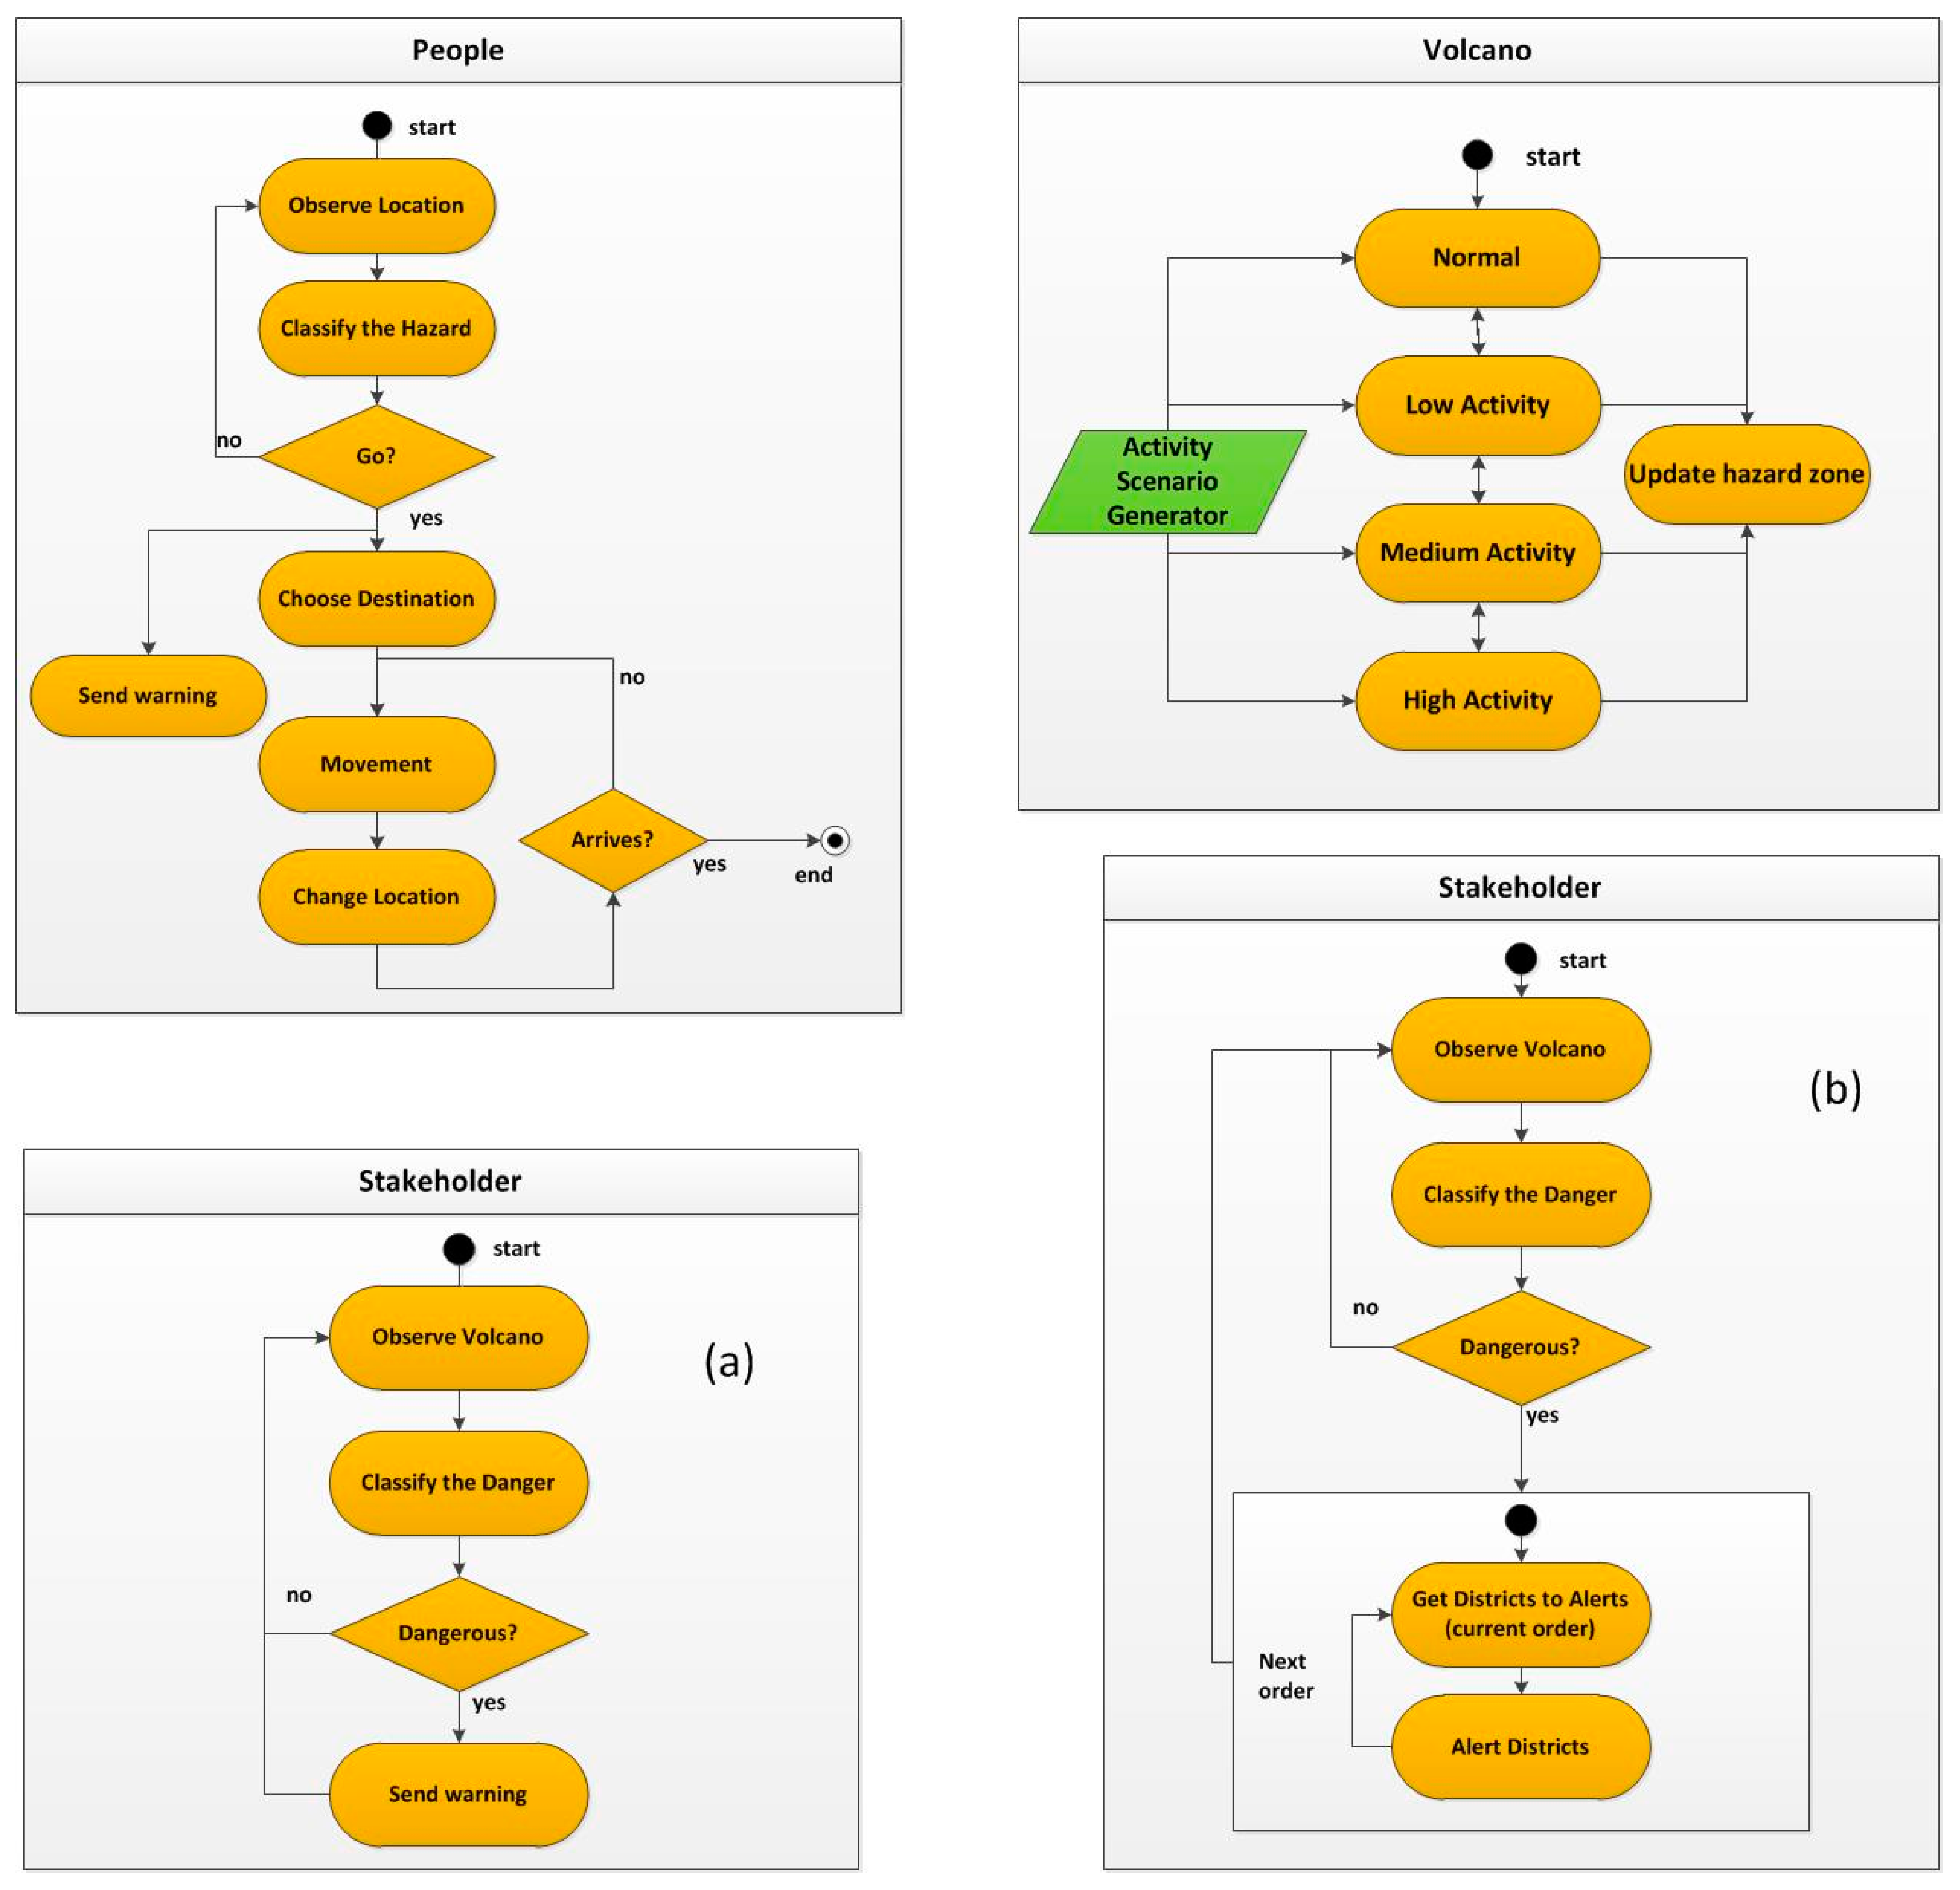
2.3. The Agent-based Volcanic Evacuation Model

The simulation used an agent-based volcanic evacuation model that was provided elsewhere (see [24,25,26]). We used this model because the model has been tested and validated [25]. Overall, the framework of this model consists of three main agents, namely, the volcano, stakeholders, and people (population) who interact within the geographical environment [24]. The volcano acts as an agent which initiates the hazardous situation and influences the environment by posing a potential threat to the surrounding population. The other agents in the interactions are the stakeholders and the population (people). The stakeholders, in this case, the authorities (government), play a significant role in observing and analysing the activities of the volcano and issuing warnings to the population, where the human agent (population) is assigned an evacuation decision rule. This evacuation decision is based on the Normal–Investigating–Evacuating state model, that is provided elsewhere [25]. In the ABM simulation, each agent displays a specific behaviour and mechanisms when interacting with others as well as with the environment. The environment is represented through spatial data with dynamic hazard properties. Meanwhile, the risk to individuals, that is used as the main evaluation of evacuation effectiveness in this paper, is evaluated based on the hazard and vulnerability variables [26]. The hazard level is measured by the environment properties at the agent’s location, whereas the vulnerability of individuals is based on SoVI, that is calculated according to socio-demographic factors. The following sub-section describes this risk model in detail. The risk of the individual might change after the decision and movement are made, as his/her location changes. When people make a movement due to the evacuation process, the level of hazard of their environment changes, as does their degree of risk. Therefore, the value of their risk is dynamic over time as an individual moves.

2.4. Applying the Staging Strategy in the Agent-Based Experiment

The previously developed agent-based evacuation model (see [26]) was used to design the experiments. The Unified Modeling Language (UML) of the agents are presented in Figure 6. The difference between simultaneous and staged simulation is on the alerting rule of the Stakeholder agent, where there is no significant change with regard to the simultaneous scenario (Figure 6a). While the alerting rule of the stakeholder agent was modified for the staged scenario (Figure 6b), iterative alerting was used to alert the population agents in the districts on the list sequentially based on the provided order (Section 2.2.4). The interval between the alerts is based on the optimal value provided by the sensitivity analysis (Section 2.5). The full source code of both simultaneous and staged scenarios is provided in the Supplementary Material S5 and S6, respectively. The program was written in AnyLogic that is Java-based programming language. Further description about the model and the parameterisation is provided in the Supplementary Material S7. The description was written based on Overview, Design Concept, and Detail (ODD) [47,48].
We use the parameter generated from the 2010 event in the simulation. The scenario parameter is provided in Table 5. The results were analysed from 50 time runs of the simulation using the scenarios. The main parameter consists of Volcanic Explosivity Index (VEI), crisis length, temporal length of volcanic activities, and the probability distributions of evacuees’ destination choice. The VEI together with the level of volcanic activity intensity (Low, Medium, High) affect the distribution of the dangerous zone [25]. Temporally, the activity level of the volcano changed over time. In this model, we divided the level of activity into four classes: normal (excluded from the volcanic crisis period), low, medium, and high. Learning from 2 crises period records, the relative length of each level vary randomly (see [38,49] for the chronological detail). However, we use the periodical increase/decrease activity based on the event in 2010. This provides the activities profile from rest condition to the climax of activities and the turn down to the rest condition. The total duration of the crisis is defined in the crisis length, the probability of crisis length defined by the eruption in 2010 was 104 days [9]. For the destination choice mode, agents are randomly classified into three types that are: preference to the nearest shelter, close to public service, or they have relatives in a destination area/far away from the risk area (danger zone). The compositions are: 80.3% prefer to select the shortest distance, 12.4% prefer to select a destination which is close to public services zones, and the rest (7.2%) either use relatives or risk indicator as a preference that is generated from the shelter zoning [25].

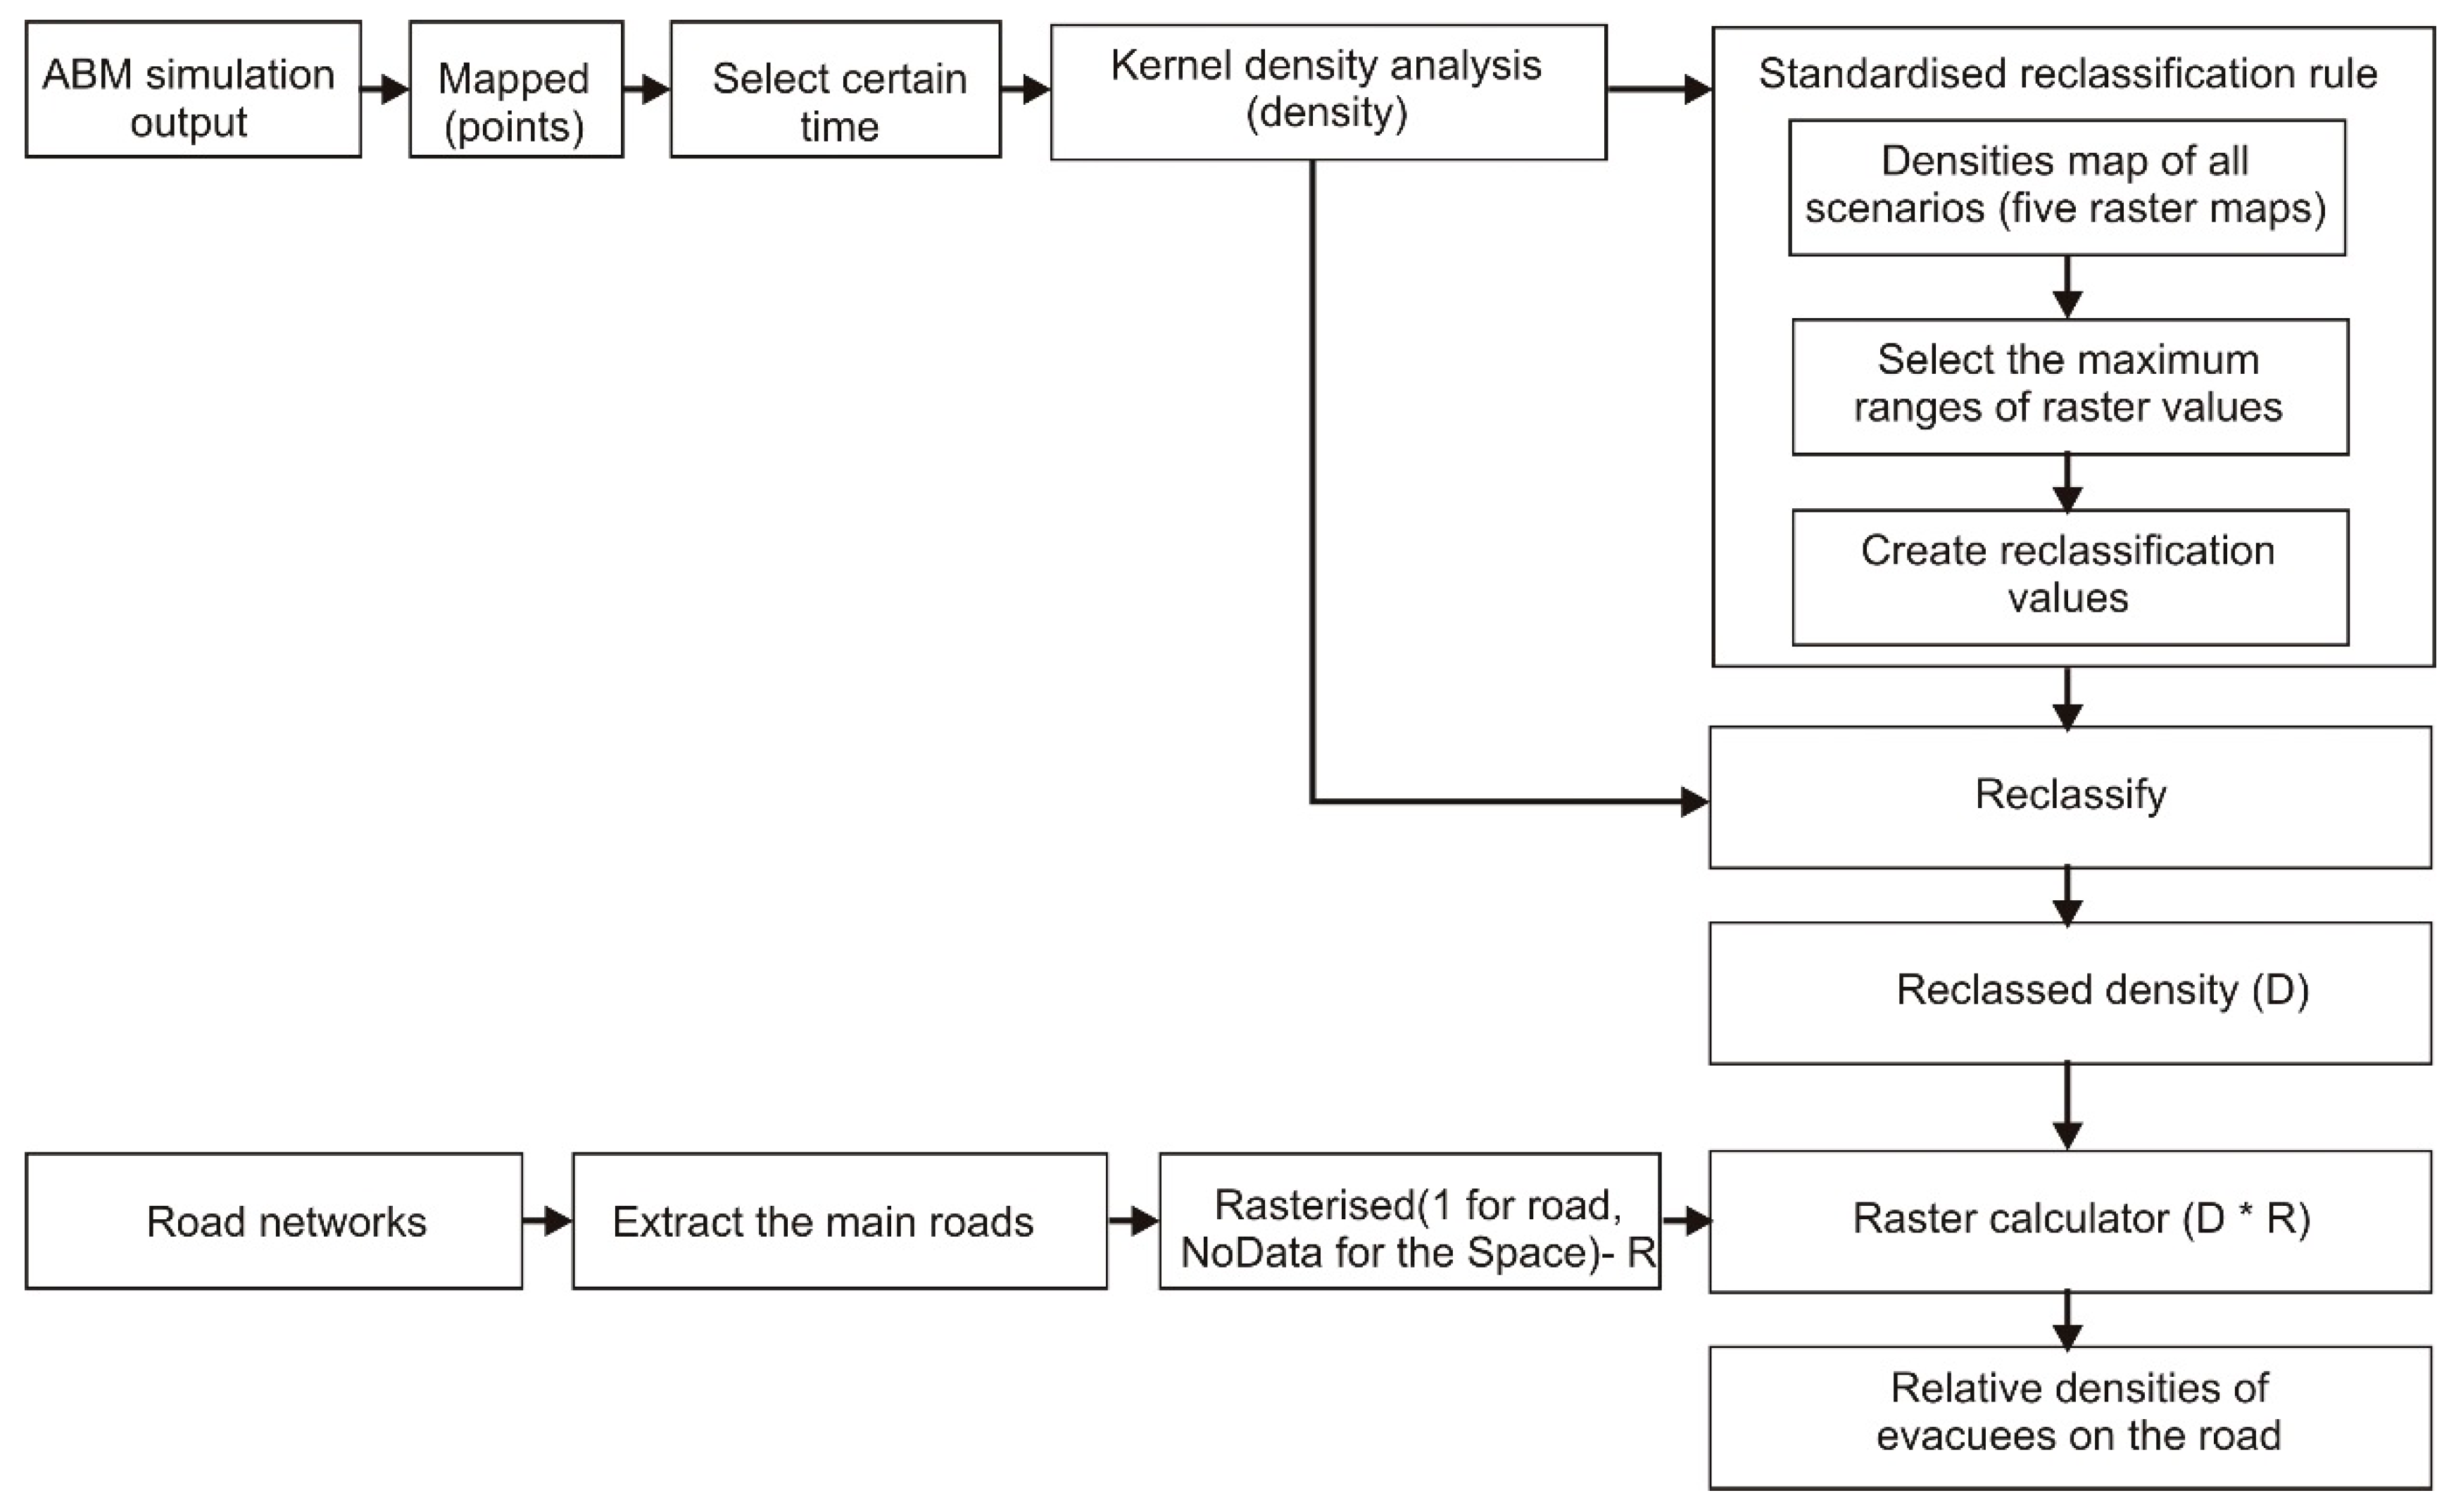
2.5. Effectiveness Measures, Analysis, Comparison, and Evaluation

Three measurements were used to make relative comparisons among the scenarios, including the temporal and spatial distribution of evacuees on the road and the effectiveness in reducing the risk. The temporal distribution was expressed as a percentage of the evacuees on the road (evacuating) over time. The peak time of the evacuation, where the percentage was at a maximum, was used to compare all of the scenarios. Meanwhile, the spatial distribution was based on the relative density of the evacuees on the road. Figure 7 provides a flowchart of the spatial analysis to illustrate the relative density. The relative density at the peak time of evacuation, as identified by the percentage, is used to compare the outcome of all scenarios. To promote the effectiveness of the risk reduction, the graph showing the temporal distribution of the people at risk is used for the comparison. We focus on the high- and medium-risk group for this comparison. The risk reduction ability is measured based on the time needed to clear people at risk (see [26] on the risk concept). The comparison is not only between a simultaneous and a staged strategy but also among staged-scenarios’ output to select the most effective staging scenarios.

3. Results and Discussion

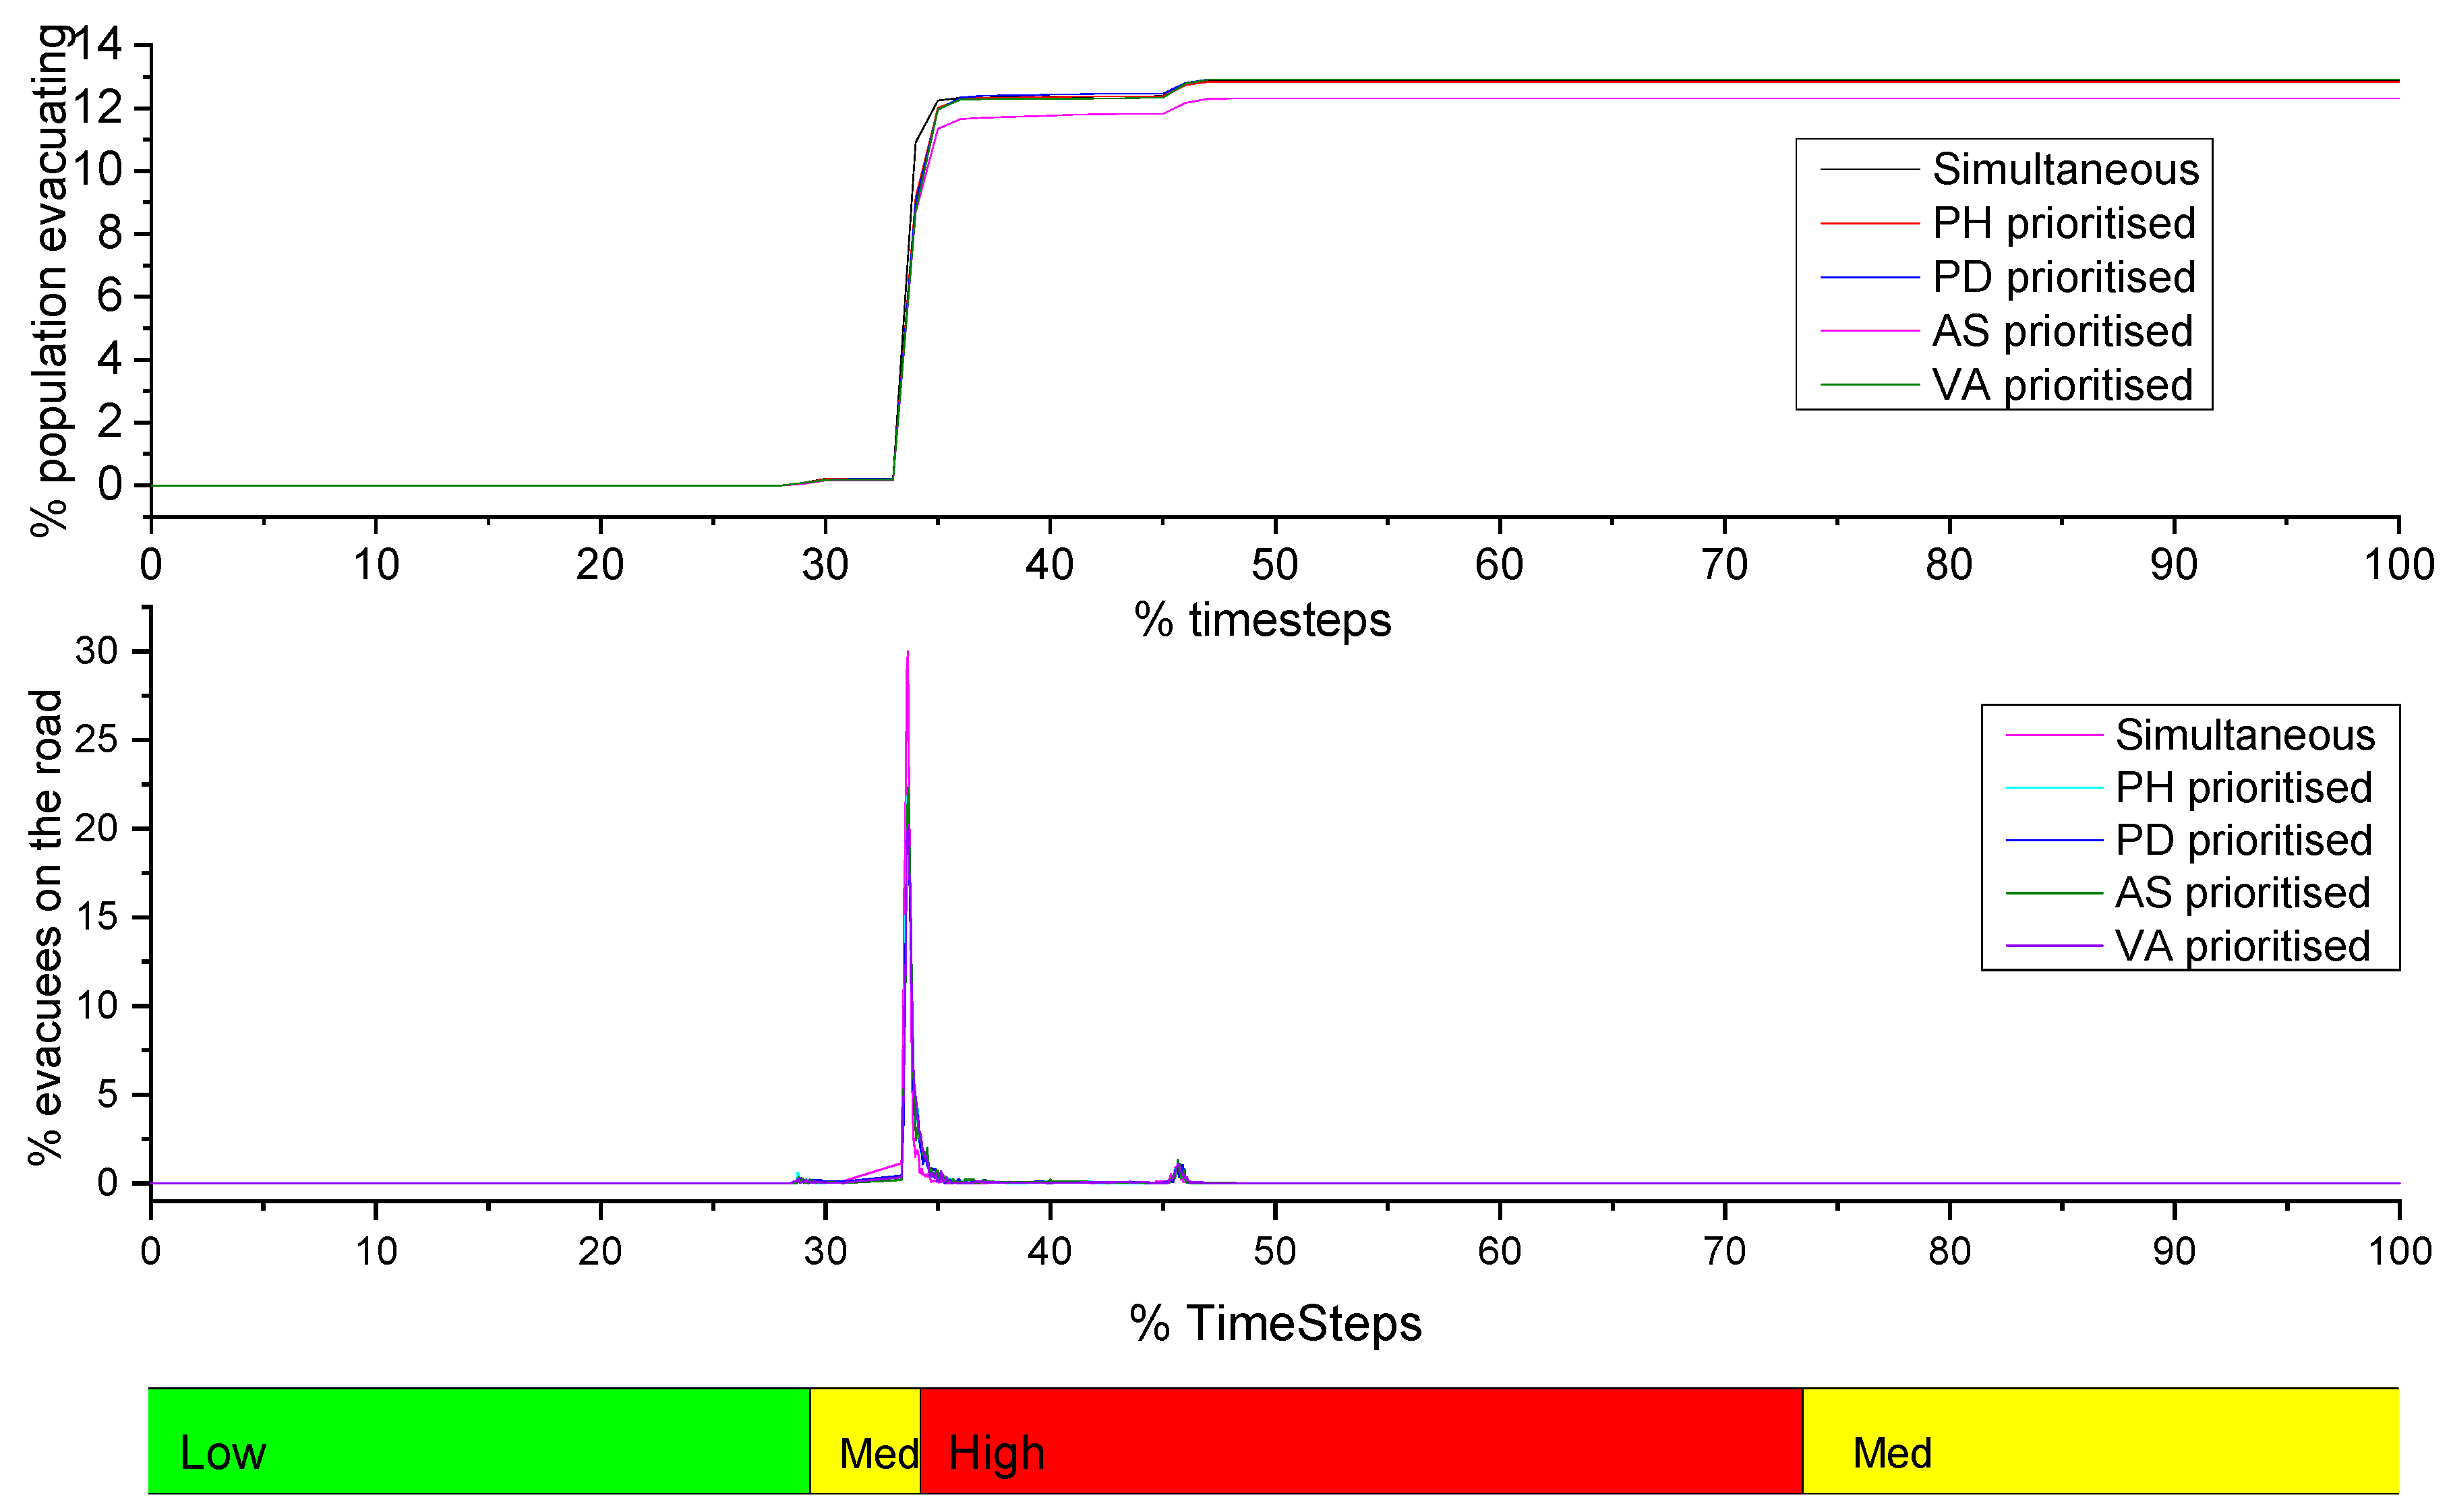
3.1. Overview of the Simulations Run

The simulations were run over 102 days of a volcanic crisis length of VEI (Volcanic Explosivity Index) 4 and the activities phases following the 2010 eruption. These parameters affected the spatio-temporal configuration of the simulation (see [24,25]). A brief overview of the simulations run for all scenarios is provided in Figure 8. This figure shows that the evacuation peak times occurred between 30% and 35% of the crisis length, where the volcanic activity reaches a peak. A small percentage of evacuees were evacuated during the early and medium level of volcanic activity (before the peak evacuation time) and also at the explosion time (after the peak of the evacuation time). The maximum percentage of the evacuees on the road (Figure 8b) exceeded 27% at the peak evacuation time under the simultaneous evacuation strategy. The result of each scenario presented in this paper is averaged from several results of simulation runs.

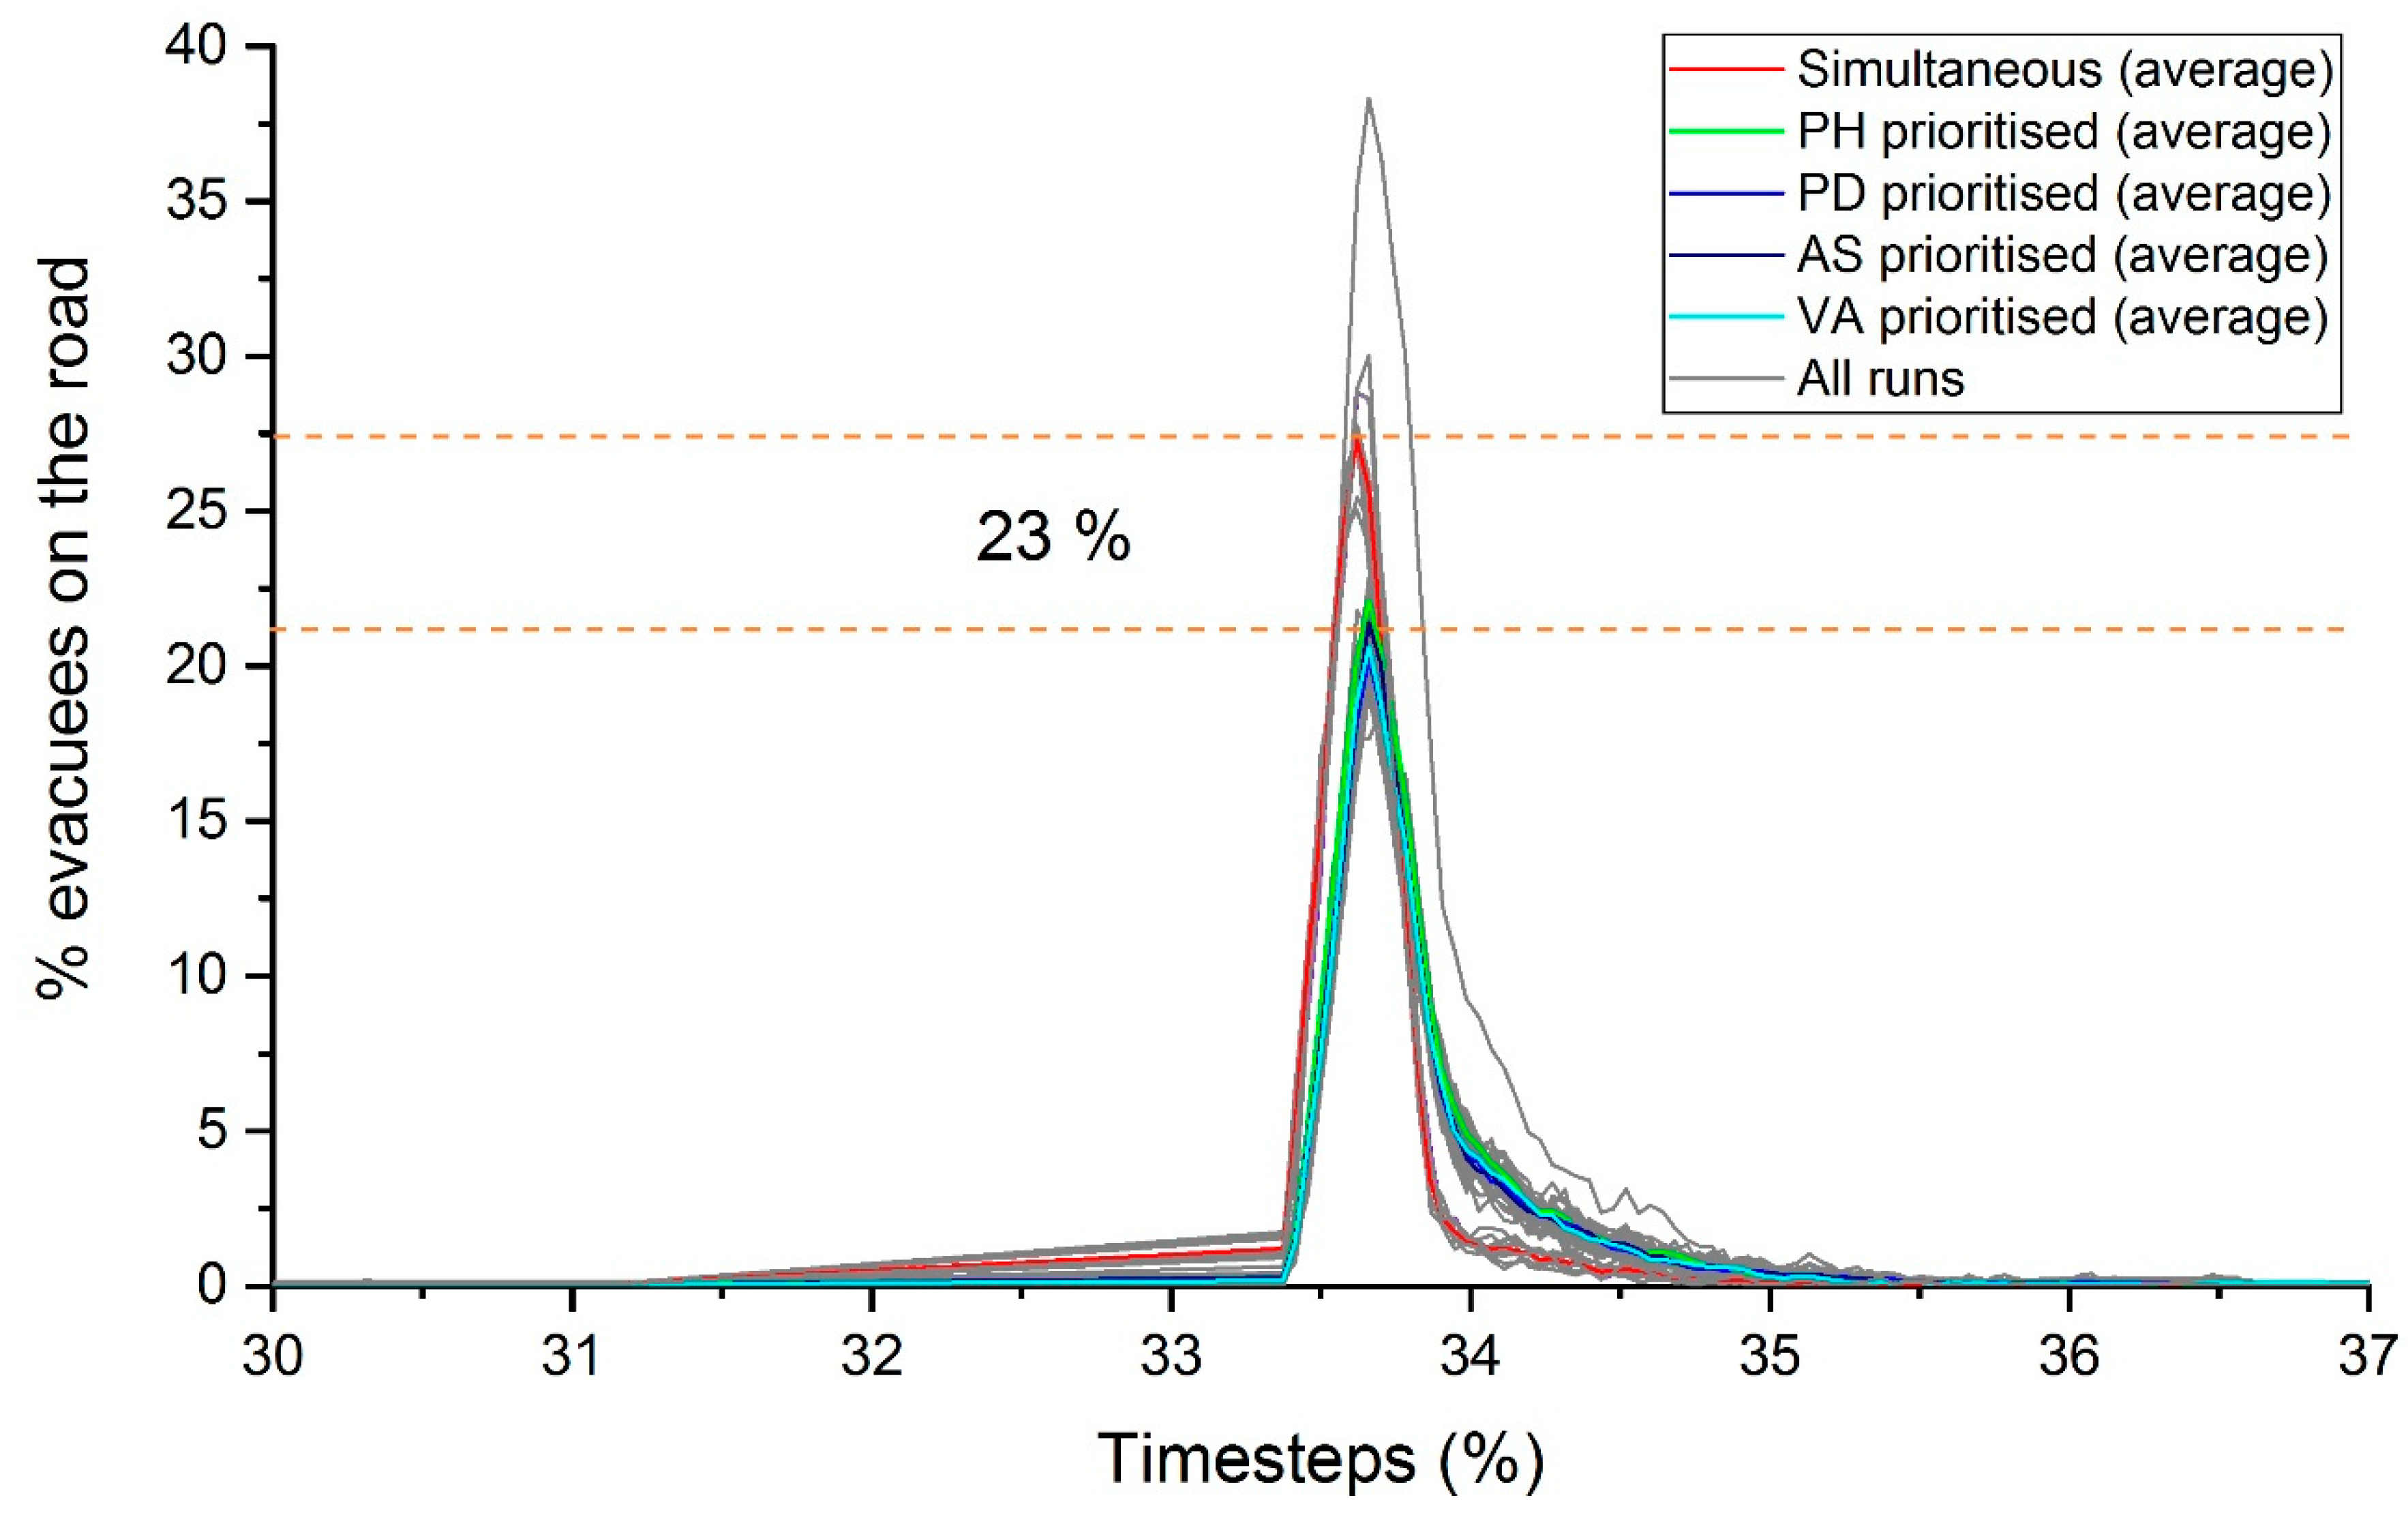
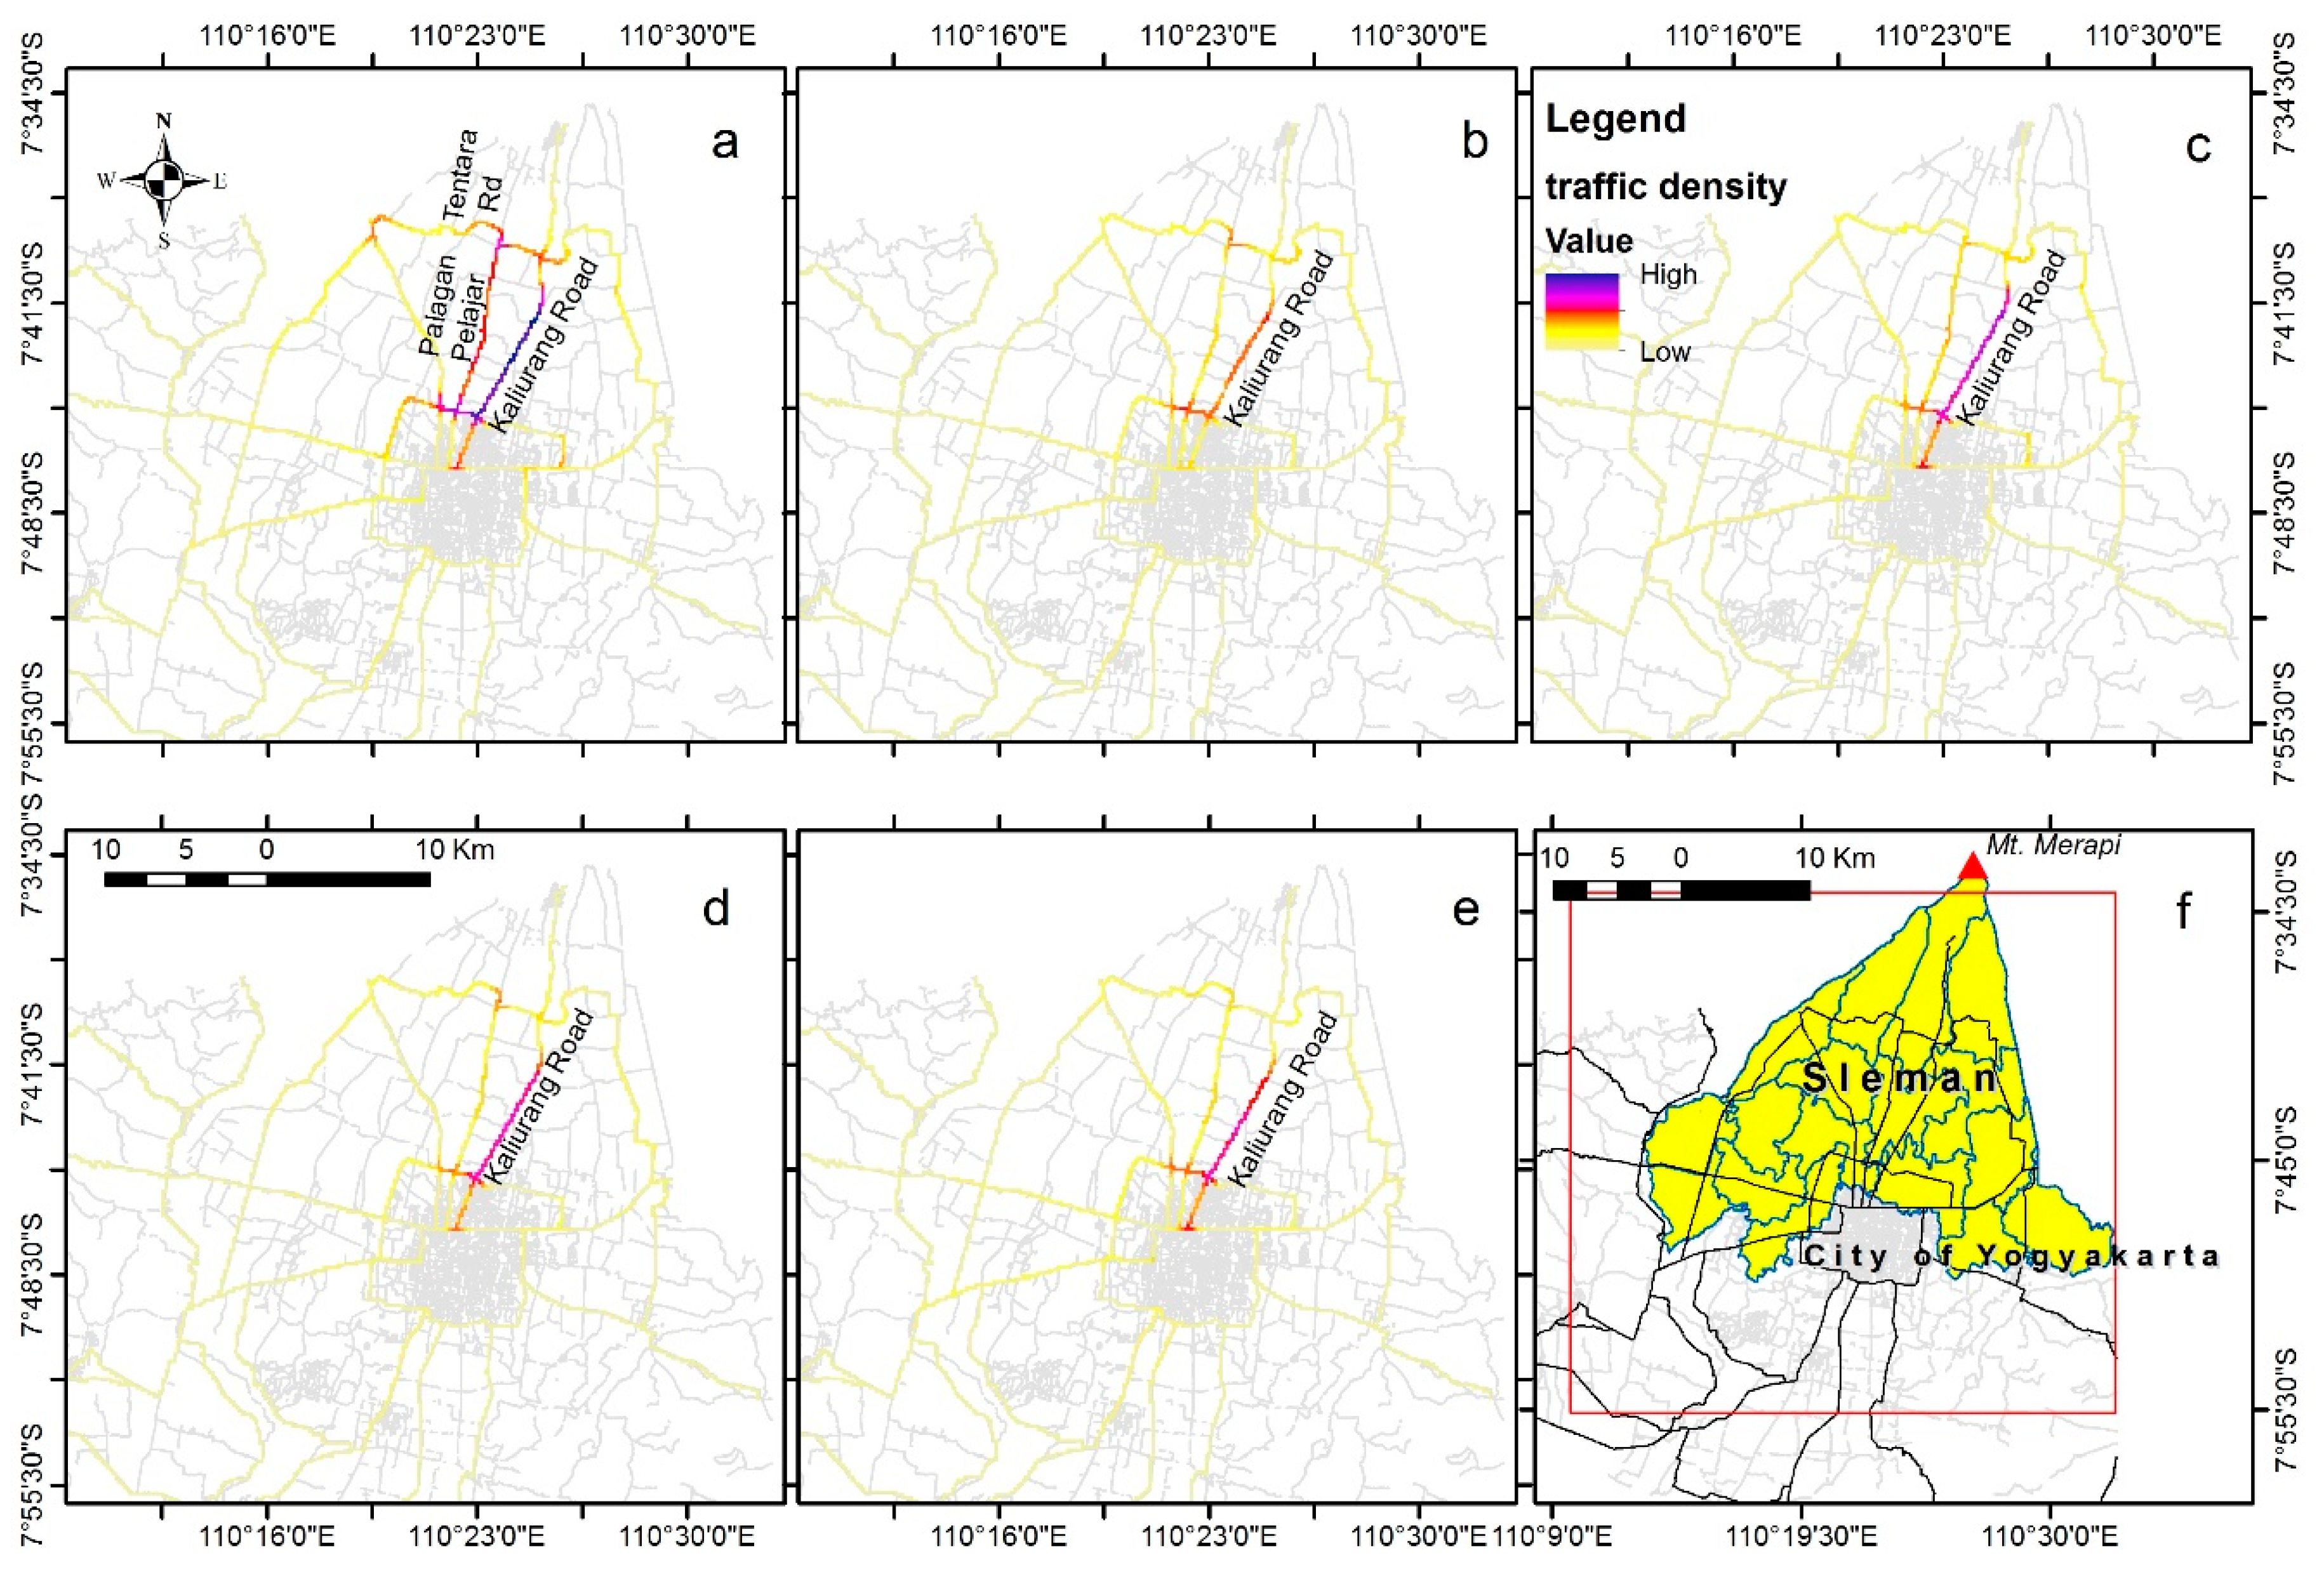
3.2. Spatial and Temporal Distribution of Evacuees on the Road

The agent-based model is possible to be used in simulating the spatial distribution of traffic as a result of human behaviour [50]. This ability is employed in this research to evaluate the effectiveness of implementation of the staged evacuation strategy. The evaluation is not only based on the spatial distribution but also based on the percentage of evacuees distributed on the road at the peak time of evacuation. Based on the simulation results, as presented in Figure 8, we highlighted the peak time of the evacuation (Figure 9). Figure 9 shows the variance of all simulations run as well as the comparison among scenarios at the peak time of evacuation. It is clear that there are different percentages of evacuees on the road at the peak time of the evacuation in the simultaneous scenario and staged scenario, respectively. The staged scenario has about 23% fewer evacuees at the peak time of evacuation compared to the simultaneous scenario. This relative effectiveness of the staged scenario in reducing evacuee traffic compared to the simultaneous scenario is also proven by the spatial density distribution of evacuees at the peak time (Figure 10). Figure 10 shows that the simultaneous scenario produces relatively higher traffic density at two major roads, namely, Kaliurang Road and Palagan Tentara Pelajar Road (Figure 10a). On the other hand, the staged scenario highlighted that mainly Kaliurang Road is congested, but has a smaller density compared to the simultaneous scenario (Figure 10b–e).

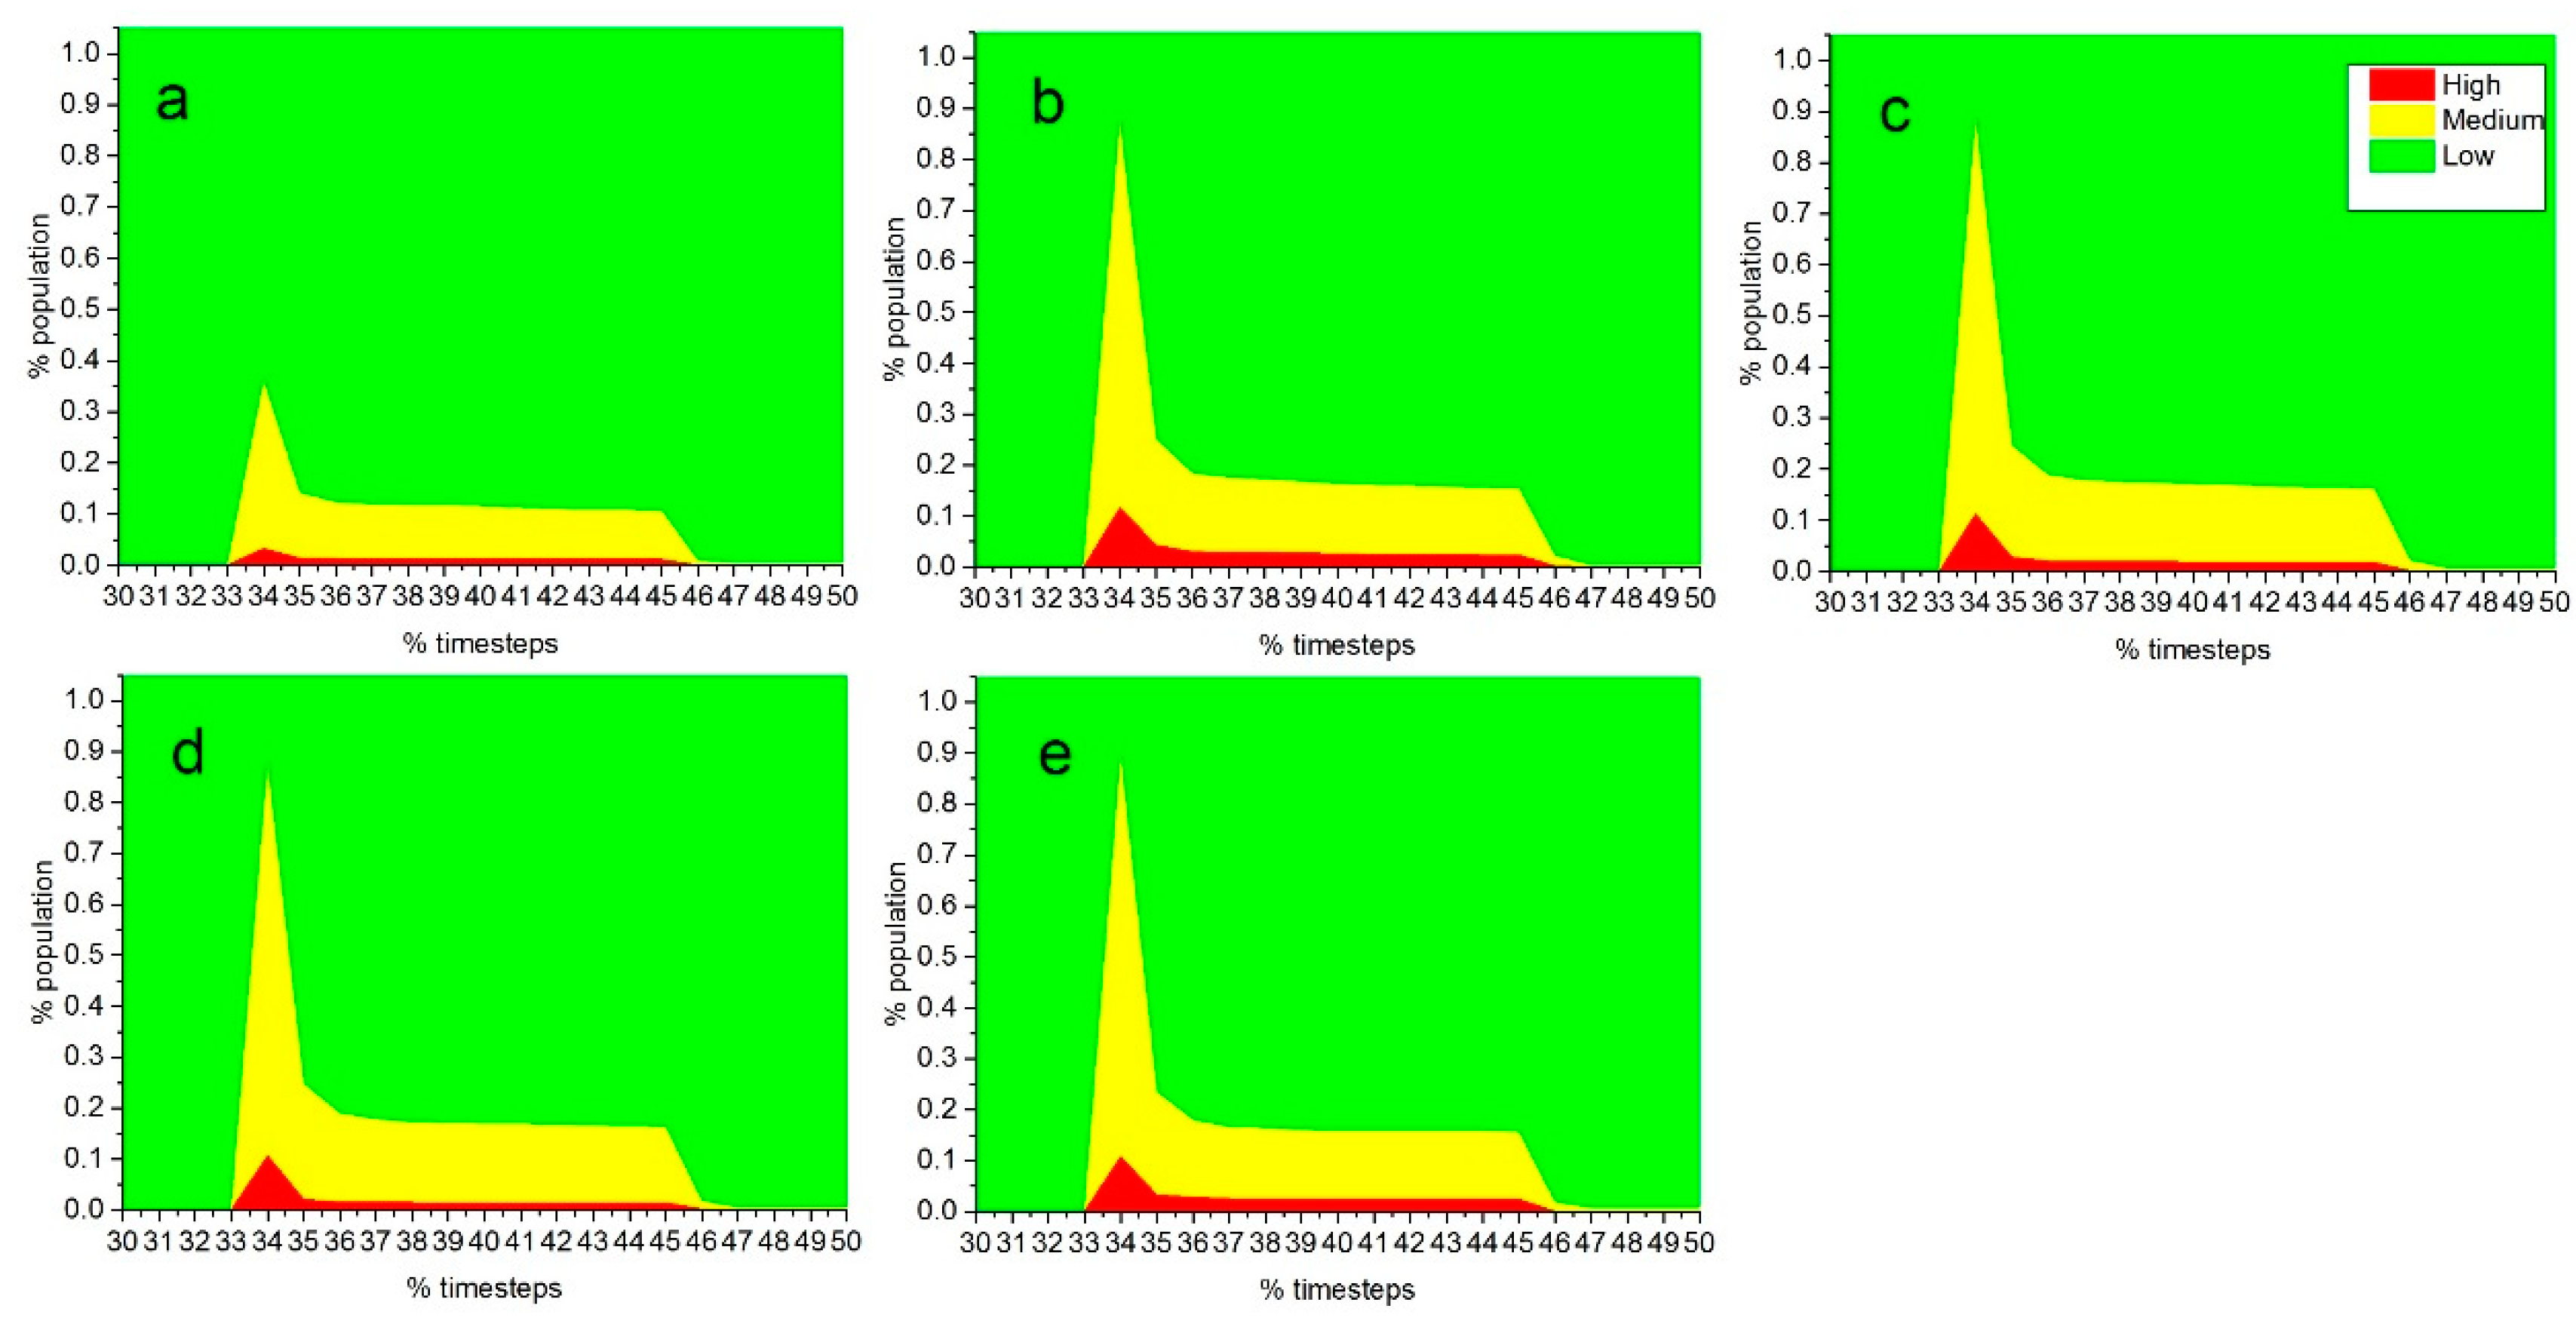
3.3. Efficiency in Reducing the Risk

Figure 11 presents graphs showing how the evacuation reduces the number of people at risk (%) temporally. The variation in the percentages of the at-risk group (high-risk and medium-risk group) in these graphs is caused by the random nature of the ABM. These graphs show that there is no significant difference between the speed of reducing the risk among the staged scenarios (Figure 11b–e), but the simultaneous strategy (Figure 11a) has the best performance of all. The percentage of risk of both the high- and medium-risk groups never reach the same number with the staged strategy, because the population within the hazard zone is evacuating directly at the same time.

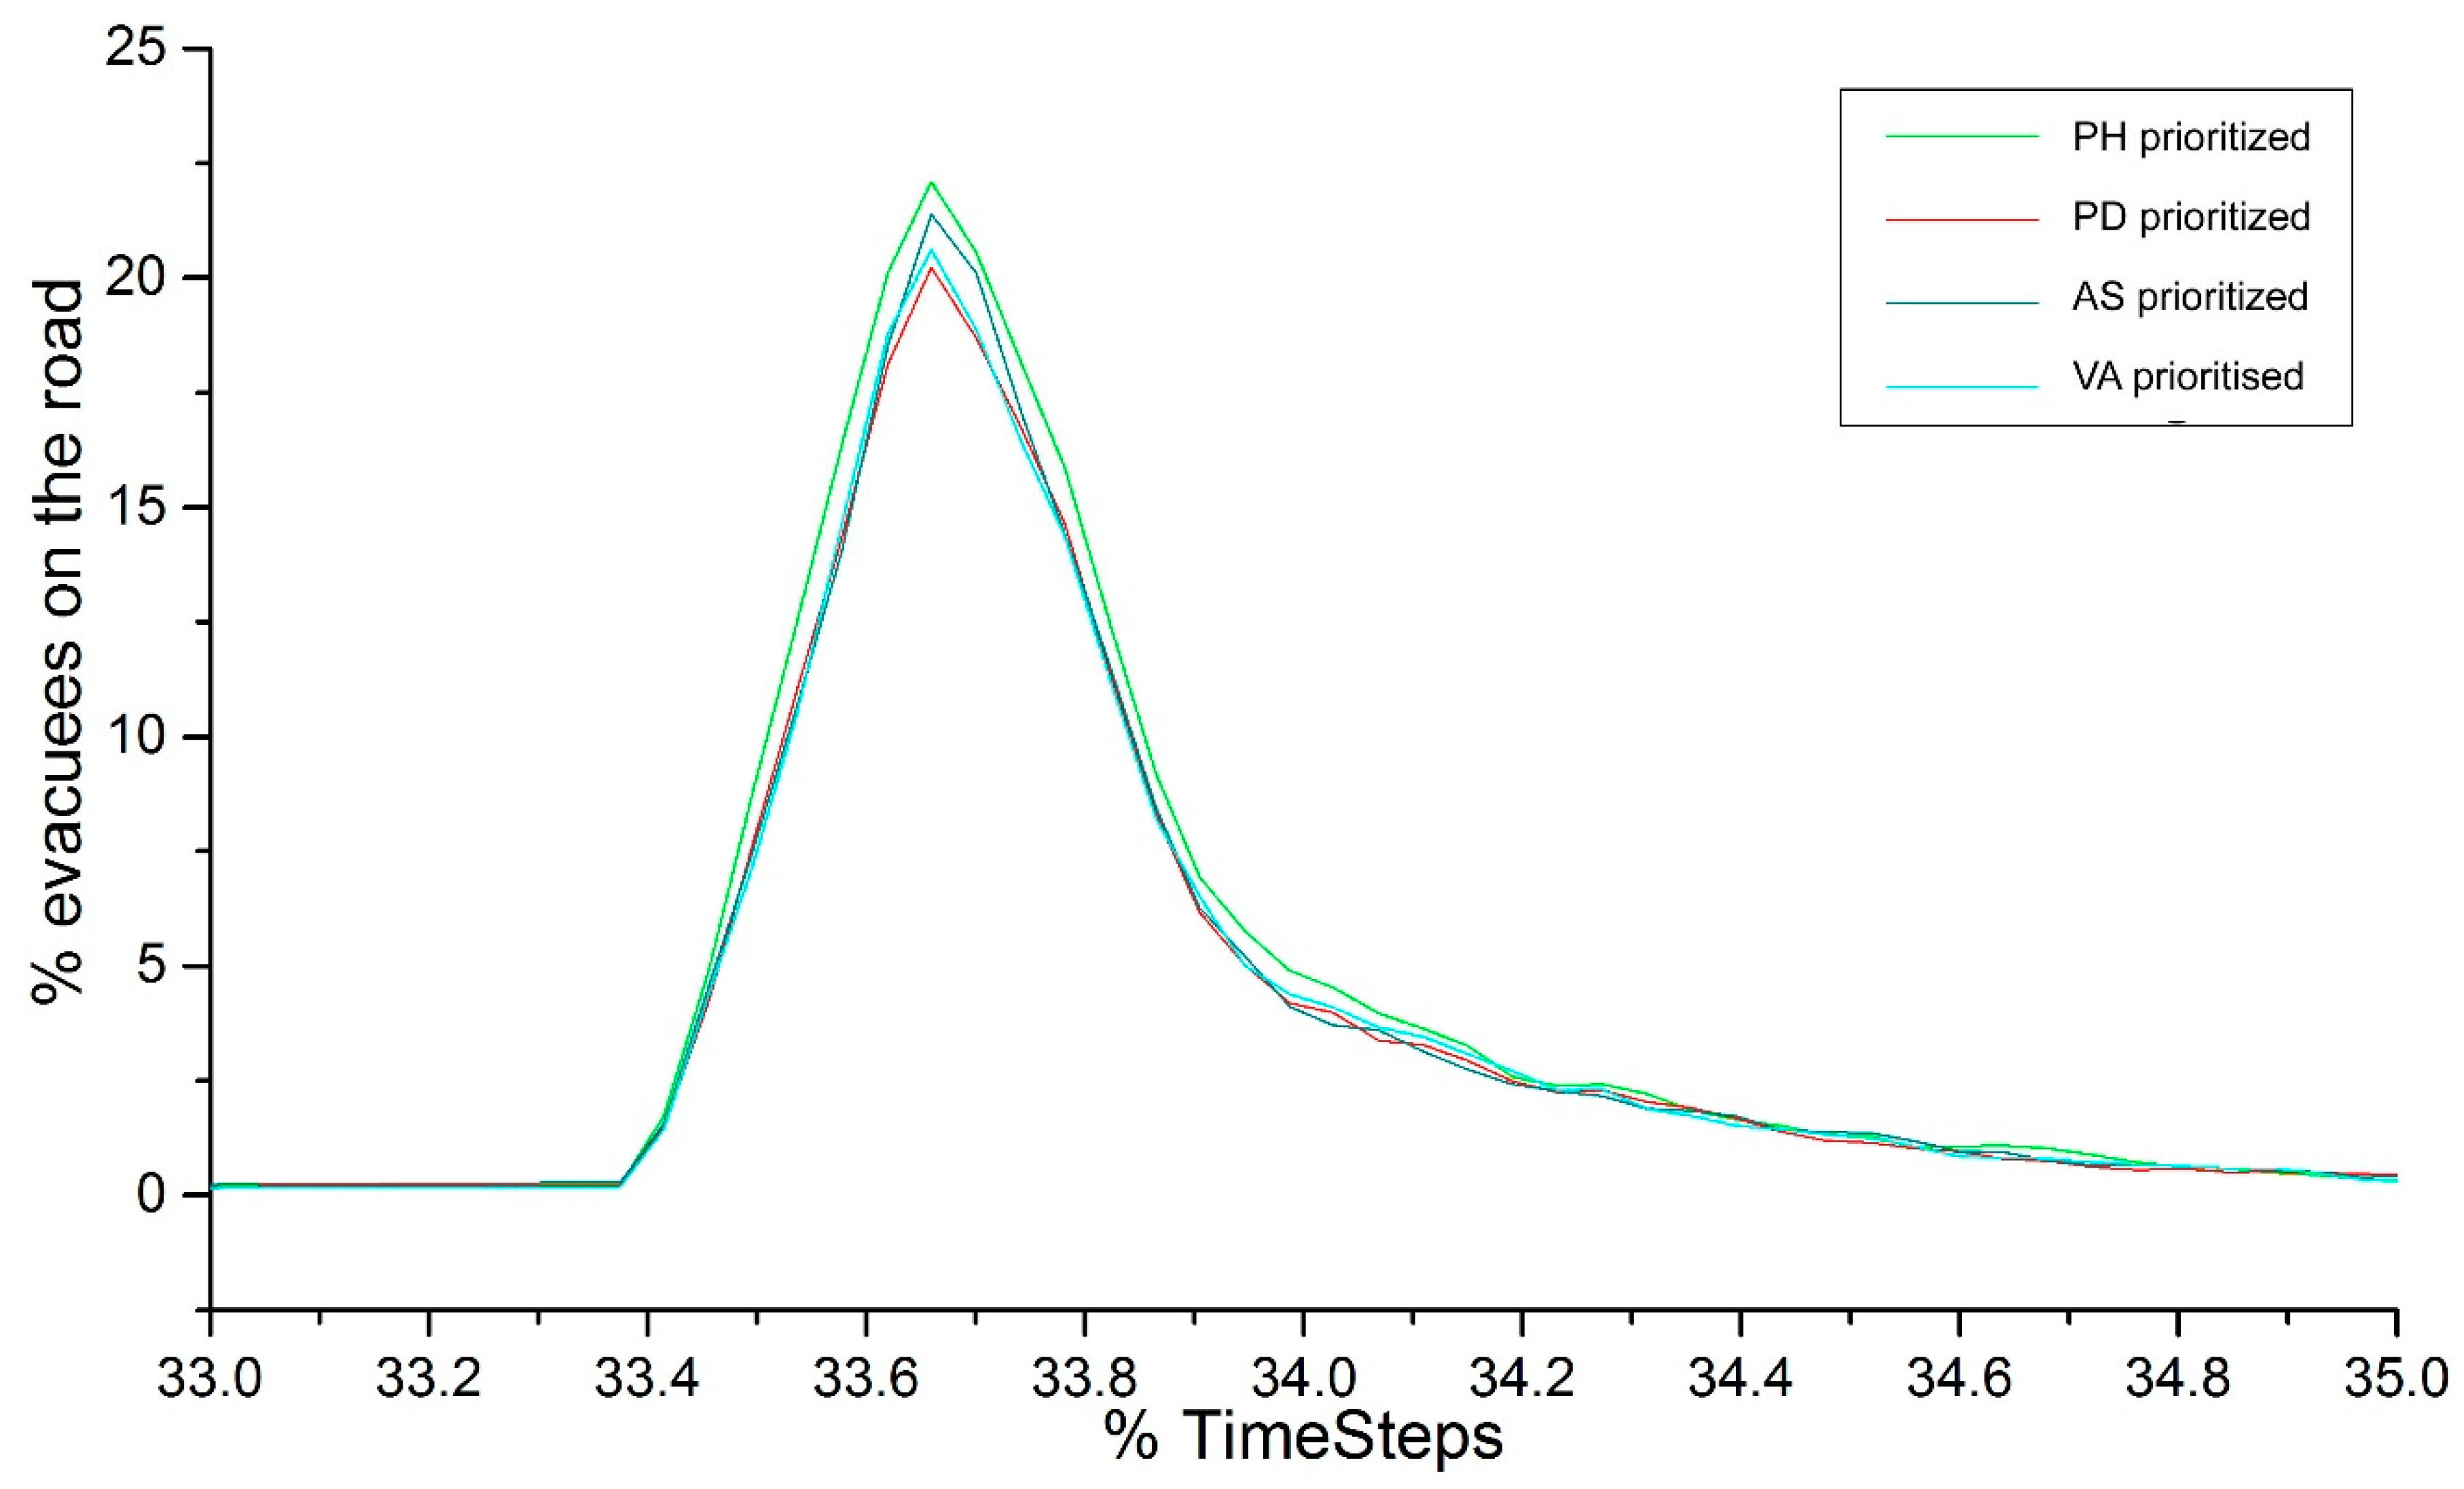
3.4. Evaluating the Performance of the Staged Scenarios

Among the four scenarios for staged evacuation (see Section 2.2.4), the second scenario (Staged 2) performs best in reducing the percentage of evacuees (potential traffic congestion) on the road during the peak time of the evacuation (Figure 12). This scenario sets the population density (PD) as the most important criterion in developing the prioritisation, followed by accessibility to shelter (AS), proportion of people of vulnerable age (VA), and proximity to the hazard (PH), respectively. However, in terms of the evacuees distribution on the road at that time, the third staged scenario, which places accessibility to shelter (AS) as the most important criteria, followed by the proportion of people of vulnerable age (VA), population density (PD), and proximity to the hazard (PH), performs best in terms of reducing traffic density, as identified from the spatial distribution of the traffic density (see Figure 10d). Meanwhile, the first staged scenario (Staged 1) performs worst in terms of reducing the potential for traffic congestion.

4. Discussion

There are four important contributions and findings that can be highlighted from this research: (1) a novel approach of zones prioritising a staged evacuation strategy, based on the demographic and geographical characteristics of the zones using SMCE, was developed and examined, (2) the experiments and analysis confirm that staged evacuation is more effective in reducing the potential traffic congestion at the peak time of the evacuation, (3) the problem regarding potential traffic congestion under the simultaneous evacuation strategy was identified and proven using actual evacuation data (2010 evacuation), and (4) the optimum formulation of the prioritising criteria was found.
The staging technique used in this research offers a more geographical approach than the existing methods, such as [18,19]. Both Mitchell and Radwan [19] and Li et al. [18] implement numerical modelling to provide a staging technique which pays less consideration to the geographical aspect of the evacuation zones. Meanwhile, the ABM experiment and the evaluation, that demonstrate the ability of a staged evacuation scenario to reduce the potential traffic congestion during the peak time of the evacuation, complemented the research by [15,16]. Both Chen and Zhan [16] and Chien and Korikanthimath [15] focus on the effect of adding a staging strategy to the evacuation duration. They commonly agree that a staged evacuation strategy, under certain conditions, is effective in reducing the overall evacuation duration. Meanwhile, the simulation presented in this paper focuses on the effect of implementing a staged evacuation in reducing traffic congestion.
The simulation identified that two major roads were mainly likely to become crowded during the simultaneous evacuation process, namely, Kaliurang Road and Palagan Tentara Pelajar Road. This result is proved by a report of the evacuation in 2010 by national mass media “The movement of citizens simultaneously made Kaliurang Road full and jammed. A number of accidents occurred in the evacuation process” (translated from Indonesian) [51]. Kaliurang Road remains the most densely crowded road during the implementation of the staged evacuation strategy but to a lesser extent than during a simultaneous evacuation strategy (see Section 3.2). Therefore, the application of a staged strategy will potentially reduce the chaos and congestion that occurred during the 2010 evacuation process [51].
Among the staged scenarios examined by the ABM, the PD-prioritised performed the best in terms of reducing traffic density, as identified from the spatial aspect. This scenario ranks proximity to hazard (PD) as the most important criterion when developing the prioritisation, followed by accessibility to shelter (AS), proportion of people of vulnerable age (VA), and proximity to the hazard (PH), respectively.

Limitations and Future Works

The result of traffic evaluation based on various scenarios of evacuation may be improved as there is an absence of involvement of congestion effect, road capacity variability, and variability in the decision of destination choices. The current model used in the experiment disregards the possible effects of congestion to the movement of agents, therefore, it is unable to simulate the dynamics of evacuees following the interaction on the road. The congestions commonly occur when the volume of traffic is too close to the maximum capacity of the road [52]. Therefore, the result of the model might be different when this factor is applied, but that depends on the value of road capacity and the number of evacuees conducting the evacuation. The distribution of evacuees is also defined by the variability of destination choice of evacuees since this affects their route selection.
It is also important to highlight the future stages to integrate the model into disaster management policy. Gilbert et al. [53] suggest that there are seven aspects which should be taken into account when bringing the model into public policy. (1) The appropriateness of the process means that the plausibility of the model is not merely measured from the output, but also the correctness of the process. It is needed to convince that the model is designed as a representation of the process in the real world. (2) The appropriateness of the level of model abstraction means the model should represent the real world in appropriate detail. All models require a generalisation of the real system to simplify and make it easy to understand and validate. Therefore, the level of generalisation should consider the purpose of modelling [54]. (3) By recognising the data and validation challenge, the future data collection and validation requirements can be identified for improvement, because modelling for policy is a continuous processes [53]. (4) Collaborative processes of model development and use are needed to ensure the model is focused on the purpose and to provide more effective peer review and scrutiny of the modelling processes [53]. (5) Consideration of ethical issues is also important because policy will affect human life. At least, it will involve human participants in developing the model. Likewise, the questionnaire survey that was conducted to develop the model in this thesis has undergone ethical review. (6) Communicating the modelling processes with stakeholders as well as the users who are involved in the policy development is also important and should be taken into account. (7) Lastly, the model also needs to be maintained regarding the evaluation of the policy implementation as well as the progress of technology.
It is thus, considering the above successful keys of developing a model to support policymaker, important to plan a roadmap to make sure that this volcanic evacuation model is implementable. The roadmap of the integration of the model to policy is presented in Figure 13. The roadmap consists of several steps that include improvement of the model as well as stakeholder engagement. The improvement is in order to consider, as well as to address, the limitations that were previously presented in Section 3.4. Therefore, because it should involve some additional rules, e.g., the destination choice model, it should undergo some further validations and data improvements whereby the stakeholder engagement is started by communicating the model with the stakeholder who responded to the evacuation management.
The integration of the model is then presented in Figure 14. The evacuation management procedure involves various parties of stakeholders including scientists (volcanologists), local government, and emergency response teams, in which some of the members are volunteers (Figure 14a) [38], whereas the model is attached to the procedure as a tool to support the local government in generating policy regarding the evacuation command issuance (Figure 14b). For example, the scenarios of the hazard following the result of the observation is then used to parameterise the simulation. The result of the simulation such as the evacuees’ density distribution along road networks is used to distribute police officers to anticipate bottlenecks or congestions.

5. Conclusions

A novel approach to a staged scenario design using spatial multi-criteria analysis to create the prioritisation is presented and examined in this paper. The prioritisation was applied in ABM to evaluate the relative comparison between simultaneous and staged evacuation, and among various staged scenarios based on different criteria weightings. The evaluation is based on the ability to reduce the potential road congestion during evacuation processes, which includes the percentage of evacuees on the road and the spatial distribution of relative traffic density, as well as the ability (fastness) to reduce the number of the population at risk. The result shows that the staged scenario was more effective in reducing the potential traffic congestion during the peak time of the evacuation compared to the simultaneous strategy. However, the simultaneous evacuation strategy has better performance in reducing the risk compared to the staged strategy. Among the four staged evacuation scenarios, there is no significant difference between them with regard to the speed at which the risk is reduced. Among the staged scenarios, the second one performed best in terms of reducing traffic density, as identified from the percentage of evacuees on the road during the peak time of evacuation.

Supplementary Materials

The following are available online at https://zenodo.org/record/3341105#.XTBYwEcRWpo, S1: Criteria weight calculation for Table 1 (https://osf.io/hfxas/), S2: Criteria weight calculation for Table 2 (https://osf.io/fzhua/), S3: Data for Table 3 (https://osf.io/bjfcv/), S4: Data time interval calculation for Table 4 (https://osf.io/ef4n3/), S5: Source code for simultaneous experiment (https://osf.io/ef4n3/), S6: Source code for staged experiment (https://osf.io/v3gfd/), S7: Model description (ODD) (https://osf.io/s936h/), S8: Spatial output data and analysis (https://osf.io/u386r/), S9: Temporal output data and analysis (https://osf.io/7j3se/).

Author Contributions

J.J. conceived, designed the model, performed the simulation and analysed the output, S.J.C. and D.J.Q. supported developing the concept of the model. J.J. drafted the manuscript, S.J.C. and D.J.Q. improved the manuscript. All the authors read and approved the final manuscript.

Funding

This research as well as the APC was funded by LPPM – Universitas Muhammadiyah Surakarta.

Acknowledgments

We gratefully acknowledge several experts who helped on developing this paper especially Nick Malleson, Alison Heppenstall, and Andy Baird from University of Leeds. Also, Ed Manley from CASA, University College London.

Conflicts of Interest

The authors declare no conflict of interest.

References

  1. Shahabi, K.; Wilson, J.P. Scalable evacuation routing in a dynamic environment. Comput. Environ. Urban Syst. 2018, 67, 29–40. [Google Scholar] [CrossRef]
  2. Alcántara-Ayala, I. Geomorphology, natural hazards, vulnerability and prevention of natural disasters in developing countries. Geomorphology 2002, 47, 107–124. [Google Scholar] [CrossRef]
  3. Beck, U. World at Risk; Polity: Cambridge, UK, 2009. [Google Scholar]
  4. Siagian, T.H.; Purhadi, P.; Suhartono, S.; Ritonga, H. Social vulnerability to natural hazards in Indonesia: Driving factors and policy implications. Nat. Hazards 2013, 70, 1603–1617. [Google Scholar] [CrossRef]
  5. Mehta, M.; Kumar, V.; Singh, S.; Singh, R.; Singh, A. Spatial and temporal changes of aerosol optical depth in three most populated countries of Asia over the last decade. In Proceedings of the 2015 1st International Conference on Next Generation Computing Technologies (NGCT), Dehradun, India, 4–5 September 2015; pp. 523–526. [Google Scholar]
  6. Thouret, J.-C.; Lavigne, F.; Kelfoun, K.; Bronto, S. Toward a revised hazard assessment at Merapi volcano, Central Java. J. Volcanol. Geotherm. Res. 2000, 100, 479–502. [Google Scholar] [CrossRef]
  7. Voight, B.; Sukhyar, R.; Wirakusumah, A.D. Introduction to the special issue on Merapi Volcano. J. Volcanol. Geotherm. Res. 2000, 100, 1–8. [Google Scholar] [CrossRef]
  8. GVP Global Volcanism Program, Smithsonian Institution, Museum of Natural History. Available online: http://www.webcitation.org/6qsJbuRFi (accessed on 31 May 2017).
  9. Mei, E.T.W.; Lavigne, F.; Picquout, A.; de Bélizal, E.; Brunstein, D.; Grancher, D.; Sartohadi, J.; Cholik, N.; Vidal, C. Lessons learned from the 2010 evacuations at Merapi volcano. J. Volcanol. Geotherm. Res. 2013, 261, 348–365. [Google Scholar] [CrossRef]
  10. Mei, E.T.W.; Lavigne, F.; Picquout, A.; Grancher, D. Crisis Management during the 2010 Eruption of Merapi Volcano. In Proceedings of the Regional Geographic Conference–International Geographical Union, Santiago, Chile, 14–18 November 2011; pp. 15–19. [Google Scholar]
  11. Sadono, R.; Hartono, H.; Machfoedz, M.M.; Setiaji, S. Monitoring Land Cover Changes in the Disaster-Prone Area: A Case Study of Cangkringan Sub-District, the Flanks of Mount Merapi, Indonesia. Forum Geogr. 2017, 31, 209–219. [Google Scholar] [CrossRef] [Green Version]
  12. Sbayti, H.; Mahmassani, H.S. Optimal scheduling of evacuation operations. Transp. Res. Rec. J. Transp. Res. Board 2006, 1964. [Google Scholar] [CrossRef]
  13. Rizvi, S.R.; Olariu, S.; Weigle, M.C.; Rizvi, M.E. A Novel Approach to Reduce Traffic Chaos in Emergency and Evacuation Scenarios. In Proceedings of the VTC Fall, Baltimore, MD, USA, 30 September–3 October 2007; pp. 1937–1941. [Google Scholar]
  14. Pidd, M.; de Silva, F.N.; Eglese, R.W. A simulation model for emergency evacuation. Eur. J. Oper. Res. 1996, 90, 413–419. [Google Scholar] [CrossRef]
  15. Chien, S.I.; Korikanthimath, V.V. Analysis and Modeling of Simultaneous and Staged Emergency Evacuations. J. Transp. Eng. 2007, 133, 190–197. [Google Scholar] [CrossRef]
  16. Chen, X.; Zhan, F.B. Agent-based modelling and simulation of urban evacuation: Relative effectiveness of simultaneous and staged evacuation strategies. J. Oper. Res. Soc. 2008, 59, 25–33. [Google Scholar] [CrossRef]
  17. Wolshon, B.; Catarella-Michel, A.; Lambert, L. Louisiana Highway Evacuation Plan for Hurricane Katrina: Proactive Management of a Regional Evacuation. J. Transp. Eng. 2006, 132, 1–10. [Google Scholar] [CrossRef]
  18. Li, X.; Huang, B.; Liu, Z.; Zhang, X.; Sun, J. A novel method for planning a staged evacuation. J. Syst. Sci. Complex. 2012, 25, 1093–1107. [Google Scholar] [CrossRef]
  19. Mitchell, S.; Radwan, E. Heuristic Priority Ranking of Emergency Evacuation Staging to Reduce Clearance Time. Transp. Res. Rec. J. Transp. Res. Board 2006, 1964, 219–228. [Google Scholar] [CrossRef]
  20. Lim, G.J.; Zangeneh, S.; Kim, S.J. Clustering approach for defining hurricane evacuation zones. J. Urban Plan. Dev. 2016, 142, 04016008. [Google Scholar] [CrossRef]
  21. Saaty, T.L. Decision making with the analytic hierarchy process. Int. J. Serv. Sci. 2008, 1, 83–98. [Google Scholar] [CrossRef]
  22. Eastman, J.R. Multi-criteria evaluation and GIS. Geogr. Inf. Syst. 1999, 1, 493–502. [Google Scholar]
  23. Malczewski, J. On the Use of Weighted Linear Combination Method in GIS: Common and Best Practice Approaches. Trans. GIS 2000, 4, 5–22. [Google Scholar] [CrossRef]
  24. Jumadi, J.; Carver, S.; Quincey, D. A Conceptual Design of Spatio-Temporal Agent-Based Model for Volcanic Evacuation. Systems 2017, 5, 53. [Google Scholar] [CrossRef]
  25. Jumadi, J.; Heppenstall, A.J.; Malleson, N.S.; Carver, S.J.; Quincey, D.J.; Manville, V.R. Modelling Individual Evacuation Decisions during Natural Disasters: A Case Study of Volcanic Crisis in Merapi, Indonesia. Geosciences 2018, 8, 196. [Google Scholar] [CrossRef]
  26. Jumadi, J.; Malleson, N.; Carver, S.; Quincey, D. An Agent-based Approach for Spatio-temporal Dynamics of Risk Modelling in Merapi. Submitted to JASSS. Available online: https://tinyurl.com/y6mlnp7h (accessed on 2 June 2019).
  27. Surono; Jousset, P.; Pallister, J.; Boichu, M.; Buongiorno, M.F.; Budisantoso, A.; Costa, F.; Andreastuti, S.; Prata, F.; Schneider, D.; et al. The 2010 explosive eruption of Java’s Merapi volcano—A ‘100-year’ event. J. Volcanol. Geotherm. Res. 2012, 241–242, 121–135. [Google Scholar] [CrossRef]
  28. Voight, B.; Constantine, E.K.; Siswowidjoyo, S.; Torley, R. Historical eruptions of Merapi Volcano, Central Java, Indonesia, 1768–1998. J. Volcanol. Geotherm. Res. 2000, 100, 69–138. [Google Scholar] [CrossRef]
  29. Abdurachman, E.K.; Bourdier, J.-L.; Voight, B. Nuées ardentes of 22 November 1994 at Merapi volcano, Java, Indonesia. J. Volcanol. Geotherm. Res. 2000, 100, 345–361. [Google Scholar] [CrossRef]
  30. Kelfoun, K.; Legros, F.; Gourgaud, A. A statistical study of trees damaged by the 22 November 1994 eruption of Merapi volcano (Java, Indonesia): Relationships between ash-cloud surges and block-and-ash flows. J. Volcanol. Geotherm. Res. 2000, 100, 379–393. [Google Scholar] [CrossRef]
  31. Lavigne, F.; Thouret, J.-C. Sediment transportation and deposition by rain-triggered lahars at Merapi Volcano, Central Java, Indonesia. Geomorphology 2003, 49, 45–69. [Google Scholar] [CrossRef]
  32. Charbonnier, S.J.; Gertisser, R. Field observations and surface characteristics of pristine block-and-ash flow deposits from the 2006 eruption of Merapi Volcano, Java, Indonesia. J. Volcanol. Geotherm. Res. 2008, 177, 971–982. [Google Scholar] [CrossRef]
  33. Itoh, H.; Takahama, J.; Takahashi, M.; Miyamoto, K. Hazard estimation of the possible pyroclastic flow disasters using numerical simulation related to the 1994 activity at Merapi Volcano. J. Volcanol. Geotherm. Res. 2000, 100, 503–516. [Google Scholar] [CrossRef]
  34. Lavigne, F.; de Bélizal, E.; Cholik, N.; Aisyah, N.; Picquout, A.; Mei, E.T.W. Lahar hazards and risks following the 2010 eruption of Merapi volcano, Indonesia. EGU Gen. Assem. 2011, 13, 4400. [Google Scholar]
  35. De Bélizal, E.; Lavigne, F.; Hadmoko, D.S.; Degeai, J.-P.; Dipayana, G.A.; Mutaqin, B.W.; Marfai, M.A.; Coquet, M.; Le Mauff, B.; Robin, A.-K.; et al. Rain-triggered lahars following the 2010 eruption of Merapi volcano, Indonesia: A major risk. J. Volcanol. Geotherm. Res. 2013, 261, 330–347. [Google Scholar] [CrossRef]
  36. Lim, G.J.; Zangeneh, S.; Reza Baharnemati, M.; Assavapokee, T. A capacitated network flow optimization approach for short notice evacuation planning. Eur. J. Oper. Res. 2012, 223, 234–245. [Google Scholar] [CrossRef]
  37. Alaeddine, H.; Serrhini, K.; Maizia, M.; Néron, E. A spatiotemporal optimization model for the evacuation of the population exposed to flood hazard. Nat. Hazards Earth Syst. Sci. 2015, 15, 687–701. [Google Scholar] [CrossRef] [Green Version]
  38. Mei, E.T.W.; Lavigne, F. Influence of the institutional and socio-economic context for responding to disasters: Case study of the 1994 and 2006 eruptions of the Merapi Volcano, Indonesia. Geol. Soc. Lond. Spec. Publ. 2012, 361, 171–186. [Google Scholar] [CrossRef]
  39. BNPB Peta Kawasan Rawan Bencana Merapi. Available online: http://geospasial.bnpb.go.id/wp-content/uploads/2011/05/2011-04-29_KRB_Area_Terdampak_Langsung_Merapi.pdf (accessed on 10 October 2015).
  40. BNPB Peta Lokasi dan Jumlah Pengungsi Letusan G.Api Merapi di Wilayah Kab. Sleman (15 nov). Available online: http://www.webcitation.org/6piPoQCLs (accessed on 14 April 2017).
  41. BNPB Peta Lokasi dan Jumlah Pengungsi Letusan G.Api Merapi di Wilayah Kab. Bantul (11 nov). Available online: http://www.webcitation.org/6pikQru7D (accessed on 14 April 2017).
  42. BNPB Peta Lokasi dan Jumlah Pengungsi Letusan G.Api Merapi di Wilayah Kota Yogyakarta (15 nov). Available online: http://www.webcitation.org/6pilvuYiE (accessed on 14 April 2017).
  43. BNPB Peta Lokasi dan Jumlah Pengungsi Letusan G.Api Merapi di Wilayah Kab. Kulon Progo (15 nov). Available online: http://www.webcitation.org/6piskXxQF (accessed on 15 April 2017).
  44. Local Government of DIY Informasi Jumlah Penduduk D.I. Yogyakarta. Available online: http://kependudukan.jogjaprov.go.id/ (accessed on 17 April 2018).
  45. Hansen, W.G. How Accessibility Shapes Land Use. J. Am. Inst. Plan. 1959, 25, 73–76. [Google Scholar] [CrossRef]
  46. Morris, J.M.; Dumble, P.L.; Wigan, M.R. Accessibility indicators for transport planning. Transp. Res. Part A Gen. 1979, 13, 91–109. [Google Scholar] [CrossRef]
  47. Grimm, V.; Berger, U.; Bastiansen, F.; Eliassen, S.; Ginot, V.; Giske, J.; Goss-Custard, J.; Grand, T.; Heinz, S.K.; Huse, G.; et al. A standard protocol for describing individual-based and agent-based models. Ecol. Model. 2006, 198, 115–126. [Google Scholar] [CrossRef]
  48. Polhill, J.G. ODD Updated. J. Artif. Soc. Soc. Simul. 2010, 13, 9. [Google Scholar] [CrossRef]
  49. Mei, E.T.W.; Lavigne, F. Mass evacuation of the 2010 Merapi eruption. Int. J. Emerg. Manag. 2013, 9, 298–311. [Google Scholar] [CrossRef]
  50. Manley, E.; Cheng, T. Exploring the role of spatial cognition in predicting urban traffic flow through agent-based modelling. Transp. Res. Part A Policy Pract. 2018, 109, 14–23. [Google Scholar] [CrossRef]
  51. Liputan6.com Kesaksian Korban Merapi. Available online: http://www.webcitation.org/71FT3eKkI (accessed on 28 July 2018).
  52. Goodwin, P. The Economic Costs of Road Traffic Congestion; UCL (University College London), The Rail Freight Group: London, UK, 2004. [Google Scholar]
  53. Gilbert, N.; Ahrweiler, P.; Barbrook-Johnson, P.; Narasimhan, K.; Wilkinson, H. Computational Modelling of Public Policy: Reflections on Practice. J. Artif. Soc. Soc. Simul. 2018, 21, 1–14. [Google Scholar] [CrossRef]
  54. Edmonds, B.; Moss, S. From KISS to KIDS–an ‘anti-simplistic’modelling approach. In Proceedings of the International Workshop on Multi-Agent Systems and Agent-Based Simulation, Washington, DC, USA, 5–8 December 2004; Springer: New York, NY, USA, 2004; pp. 130–144. [Google Scholar]
Figure 1. The general framework.
Geosciences 09 00317 g001
Figure 2. The hazard zones of Merapi volcano and the Sleman area.
Geosciences 09 00317 g002
Figure 3. Spatial data for the zone ranking from 1 (most prioritised) to 5 (least prioritised). PH = proximity to hazard, PD = population density, AS = accessibility to shelter, VA = percentage of vulnerable age.
Geosciences 09 00317 g003
Figure 4. Staging scenarios map. (a) PH Prioritised, (b) PD Prioritised, (c) AS Prioritised, (d) VA Prioritised.
Geosciences 09 00317 g004
Figure 5. Population at risk’s origin and the major exits for calculating the average travel time to reach the major evacuation routes.
Geosciences 09 00317 g005
Figure 6. Alerting rule, (a) simultaneous scenarios, (b) staged scenarios.
Geosciences 09 00317 g006
Figure 7. Relative density analysis of the evacuees’ traffic.
Geosciences 09 00317 g007
Figure 8. Overview of the simulations run for all scenarios. (a) The temporal accumulation of the evacuees (% of population), (b) the temporal distribution of the evacuees on the road (% of evacuees), (c) volcanic crisis phases setup.
Geosciences 09 00317 g008
Figure 9. Comparison of the percentage of evacuees on the road during the peak evacuation time.
Geosciences 09 00317 g009
Figure 10. Relative densities of evacuee traffic on the road at the peak evacuation time. (a) Simultaneous, (b) staged 1, (c) staged 2, (d) staged 3, (e) staged 4 scenario, and (f) inset map. Road name: (1) Kaliurang road, (2) Palagan tentara pelajar road (the data is provided in Supplementary Material S8).
Geosciences 09 00317 g010
Figure 11. Risk reduction comparison. (a) Simultaneous, (b) proximity to the hazard (PH) prioritized, (c) population density (PD) prioritized, (d) accessibility to shelter (AS) prioritized, (e) vulnerable age (VA) prioritised scenarios (the data is provided in Supplementary Material S9).
Geosciences 09 00317 g011
Figure 12. Performance comparison among the four staged scenarios.
Geosciences 09 00317 g012
Figure 13. Road map of model implementation—leading to policy integration.
Geosciences 09 00317 g013
Figure 14. Attachment of the model to evacuation decision process (modified from [38]). (a) Current procedure of evacuation management process, (b) the evacuation procedure supported by the model.
Geosciences 09 00317 g014
Table 1. Criteria and attributes value for the priority design.
CriteriaClassDescriptionPriorityI
PHVery highVery high priority to evacuate10.503
HighHigh priority to evacuate20.260
MediumModerate priority to evacuate30.134
LowSlightly less priority to evacuate40.068
Very lowLess priority to evacuate50.035
PDVery highVery high priority to evacuate10.503
HighHigh priority to evacuate20.260
MediumModerate priority to evacuate30.134
LowSlightly less priority to evacuate40.068
Very lowLess priority to evacuate50.035
ASVery lowVery high priority to evacuate10.503
LowHigh priority to evacuate20.260
MediumModerate priority to evacuate30.134
HighSlightly less priority to evacuate40.068
Very highLess priority to evacuate50.035
VAVery lowVery high priority to evacuate10.503
LowHigh priority to evacuate20.260
MediumModerate priority to evacuate30.134
HighSlightly less priority to evacuate40.068
Very highLess priority to evacuate50.035
Remark: I = priority index. The detailed calculation is included in the Supplementary Material S1. PH = proximity to hazard, PD = population density, AS = accessibility to shelter, VA = percentage of vulnerable age.
Table 2. “What if” weighting scenarios’ criteria.
CriteriaPH PrioritisedPD PrioritisedAS PrioritisedVA Prioritised
RWRWRWRW
PH10.55840.05730.12220.263
PD20.26310.55840.05730.122
AS30.12220.26310.55840.057
VA40.05730.12220.26310.558
Remarks: R = importance rank, W = weight. The detailed calculation is included in the Supplementary Material S2.
Table 3. Staging scenarios calculation and ranking.
DistrictPH PrioritisedPD PrioritisedAS PrioritisedVA Prioritised
ScorePriority RankScorePriority RankScorePriority RankScorePriority Rank
Ngemplak0.3010.0750.1130.162
Tempel0.3010.0840.0940.162
Pakem0.2220.4210.3320.143
Turi0.1240.2330.3320.134
Cangkringan0.1830.3420.4310.351
The detailed calculation is included in the Supplementary Material S3.
Table 4. Time intervals between the stages.
NoDistrictAverage Travel Time to Reach a Major Road (in Minutes)
1.Cangkringan23.5
2.Ngemplak24.5
3.Pakem21.9
4.Tempel28.2
5.Turi20.9
Average (time interval)23.8
The detailed calculation is included in the Supplementary Material S4.
Table 5. Main Parameters of Simulation Scenario.
ParameterValueSource
VEI4[9,27]
Crisis length104[9]
Temporal length of volcanic activities(Low, Medium, High, Medium, Low) = (0.26, 0.03, 0.32, 0.23, 0.13)Constructed from [9]
Evacuees’ destination choices distribution(shortest distance, close to public service zones, risk indicator/relatives) = (0.803, 0.124, 0.72)[25]

