Article

Method for Near-Real Time Estimation of Tsunami Sources Using Ocean Bottom Pressure Sensor Network (S-Net)

1
Tokyo Electric Power Service, KDX Toyosu Grandsquare, 7-12, Shinonome 1-chome, Koto-ku, Tokyo 135-0062, Japan
2
Faculty of Science, Institute of Seismology and Volcanology, Hokkaido University, Kita 10 Nishi 8, Kita-ku, Sapporo 062-0810, Japan
3
Department of Civil Engineering, The University of Tokyo, 7-3-1 Hongo, Bunkyo-ku, Tokyo 113-8656, Japan
*
Author to whom correspondence should be addressed.
Geosciences 2019, 9(7), 310; https://doi.org/10.3390/geosciences9070310
Submission received: 11 June 2019 / Revised: 9 July 2019 / Accepted: 10 July 2019 / Published: 12 July 2019
(This article belongs to the Special Issue Interdisciplinary Geosciences Perspectives of Tsunami Volume 2)

Abstract

:
A dense cabled observation network, called the seafloor observation network for earthquakes and tsunami along the Japan Trench (S-net), was installed in Japan. This study aimed to develop a near-real time tsunami source estimation technique using the ocean bottom pressure data observed at those sensors in S-net. Synthetic pressure waveforms at those sensors were computed for 64 earthquake tsunami scenarios with magnitude ranging between M8.0 and M8.8. The pressure waveforms within a time window of 500 s after an earthquake were classified into three types. Type 1 has the following pressure waveform characteristic: the pressure decreases and remains low; sensors exhibiting waveforms associated with Type 1 are located inside a co-seismic uplift area. The pressure waveform characteristic of Type 2 is that one up-pulse of a wave is within the time window; sensors exhibiting waveforms associated with Type 2 are located at the edge of the co-seismic uplift area. The other pressure waveforms are classified as Type 3. Subsequently, we developed a method to estimate the uplift area using those three classifications of pressure waveforms at sensors in S-net and a method to estimate earthquake magnitude from the estimated uplift area using a regression line. We systematically applied those methods for two cases of previous large earthquakes: the 1952 Tokachi-oki earthquake (Mw8.2) and the 1968 Tokachi-oki earthquake (Mw8.1). The locations of the large computed uplift areas of the earthquakes were well defined by the estimated ones. The estimated magnitudes of the 1952 and 1968 Tokachi-oki earthquakes from the estimated uplift area were 8.2 and 7.9, respectively; they are almost consistent with the moment magnitudes derived from the source models. Those results indicate that the tsunami source estimation method developed in this study can be used for near-real time tsunami forecasts.

1. Introduction

The Tohoku-oki earthquake (Mw9.0) that occurred on March 11, 2011 generated a large tsunami along the Pacific coast from the Tohoku region to the Kanto region [1]. Although the Japan Meteorological Agency (JMA) issued a major tsunami warning along the Pacific coast of Japan immediately after the earthquake [2], this tsunami caused catastrophic destruction along the coast with approximately 19,000 casualties [3]. The JMA’s tsunami early warnings are based on a rapid analysis of seismic waves and a linear interpolation scheme of a precomputed tsunami database containing tsunami heights at coasts from a large set of earthquake scenarios [4]. The first estimation of the 2011 Tohoku earthquake’s magnitude from strong motion data by the JMA was 7.9, which was much smaller than Mw9.0. The magnitude was subsequently used to issue the initial tsunami height forecast of 3–6 m for near-field regions. This initial tsunami warning underestimated the real tsunami heights that were larger than 10 m along 500 km of the Pacific coast in the Tohoku region [1]. Subsequently, the tsunami height forecast by the JMA was updated twice to 6–10 m at 28 min after the earthquake and to beyond 10 m at 44 min after the event [2]. Therefore, a tsunami warning system that is more accurate and rapid has become highly demanded in Japan.
To improve tsunami early warning systems, a dense cabled observation network, called the seafloor observation network for earthquakes and tsunami along the Japan Trench (S-net), was installed in 2017, and it is operated by the National Research Institute for Earth Science and Disaster Resilience (NEID) (Figure 1). This network consists of 150 observation stations in which ocean bottom pressure sensors and seismometers are installed [5,6]. These stations are connected by cables at 30-km intervals. The cables are distributed at the seafloor offshore of Kanto, Tohoku, and Hokkaido (Figure 1). Currently, various tsunami early forecast methods using a dense seafloor observation network have been proposed. Tsunami Forecasting based on Inversion for initial sea Surface Height (tFISH) is a forecast method that estimates the initial sea surface deformation from tsunami waveforms observed at ocean bottom pressure sensors [7,8]. A tsunami forecast using a large precomputed database, developed by Yamamoto et al. [9], rapidly estimate a tsunami inundation based on a multi-index method with a comparison of observed tsunami heights and precomputed tsunami heights at ocean bottom sensors. As other rapid estimation methods, data assimilation methods in which tsunami wave fields are computed by assimilating ocean bottom pressure data into numerical simulation, have been developed [10,11,12]. However, all these methods require large computational resources or advanced analysis procedures that only experts can manage. As pressure data observed at the S-net will be available from the NEID soon, it is important to develop a simple tsunami forecast method applicable to local governments located in the coastal area.
In this study, we developed a much simpler tsunami forecast method compared with other existing methods. The method does not require sophisticated techniques such as tsunami numerical simulations or assimilation techniques, but it only requires a simple analysis of the characteristics of the observed tsunami waveforms from the sensors in S-net. To develop the new tsunami forecast method, we numerically computed the ocean bottom pressure waveforms from the sensors in the S-net from various fault models. Finally, the method was tested for cases of the 1952 and 1968 Tokachi-oki earthquakes.

2. Great Earthquakes Generated Tsunamis along the Pacific Coast of Hokkaido

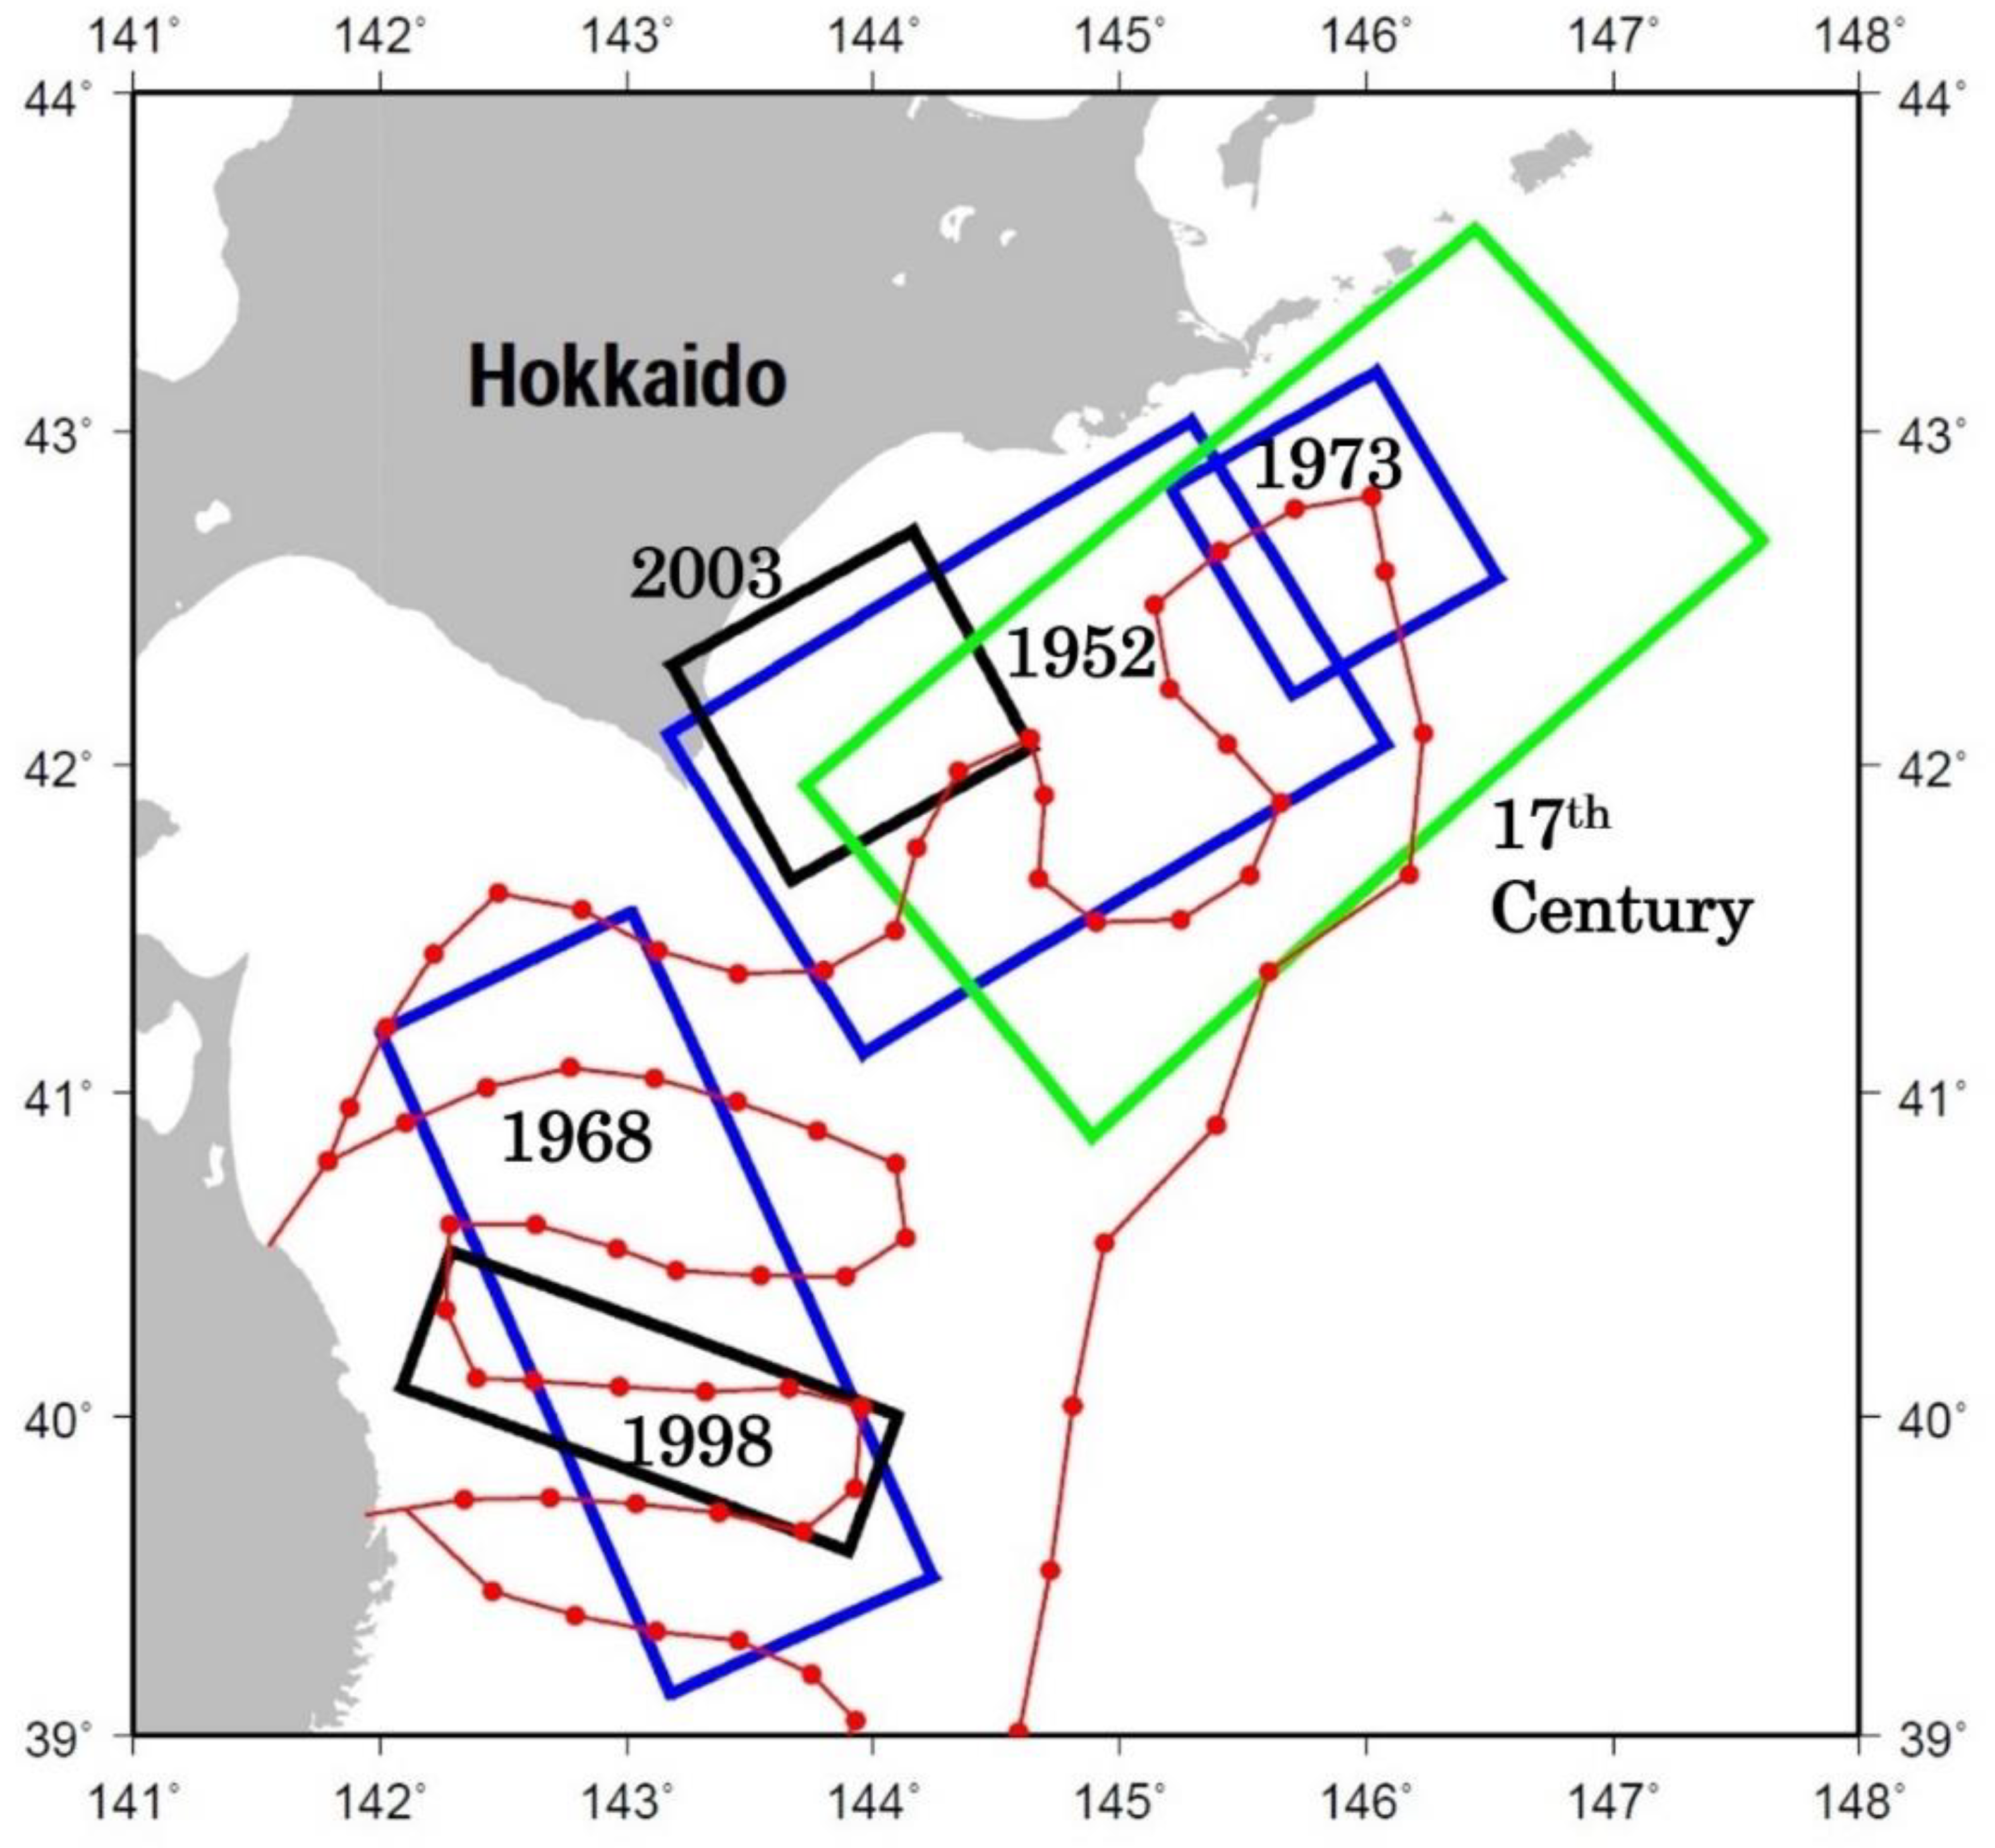
Great underthrust earthquakes repeatedly occurred at the plate interface in the subduction zone where the Pacific plate subduct along the Kurile trench off Hokkaido (Figure 2). The Pacific coasts of Hokkaido have therefore suffered from large tsunami disasters associated with the earthquakes. The 1952 great Tokachi-oki earthquake (Mw8.2) occurred at the plate interface off the Tokachi area and generated a large tsunami along the Tokachi coast, including a maximum tsunami height of 7 m [13]. The 1968 great Tokachi-oki earthquake (Mw 8.1) occurred along the plate interface located in the southwest of the source area of the 1952 Tokachi-oki earthquake [14]. The earthquake generated a large tsunami causing large disasters along the coast of Tohoku and Hokkaido regions. The 1973 Nemuro-oki earthquake (Mw7.8) ruptured the plate interface located in east of the 1952 Tokachi-oki earthquake [15]. A large tsunami generated by the earthquake caused damage in the Pacific coast of Nemuro city. The 1994 Sanriku-oki earthquake (Mw7.7) ruptured the plate interface that was already ruptured by the 1968 Tokachi-oki earthquake. However, the source area of the 1994 Sariku-oki earthquake was only the Southern part of the source area of the 1968 Tokachi-oki event [16], and thus a small tsunami was generated by the earthquake. The 2003 great Tokachi-oki earthquake (Mw 8.0) ruptured the plate interface that was already ruptured by the 1952 Tokachi-oki earthquake [17]. However, the maximum tsunami height in the 2003 event was 4 m, which was smaller than that of the 1952 Tokachi-oki event of 7 m [18]. The source area of the 2003 Tokachi-oki event was smaller than that of the 1952 Tokachi-oki event [17]. All those tsunami disasters in the Pacific coast of Hokkaido were caused by underthrust large earthquakes that ruptured the plate interface in the subduction zone.
Paleo-earthquake studies using tsunami deposits along the Pacific coast of Hokkaido revealed that much larger tsunamis have repeatedly occurred for approximately 6000 years compared with historical tsunamis described in the previous paragraph [19,20,21]. The most recent large paleo-tsunami occurred in the early 17th century, and fault models of an earthquake that is capable of generating a tsunami large enough to explain the observed tsunami deposit distribution were suggested [22,23]. The earthquake was a great underthrust earthquake with a moment magnitude of 8.8 [23] and ruptured a large area of the plate interface off Tokachi and Nemuro (Figure 2).
As various great underthrust earthquakes off the Pacific coast of Hokkaido generated large tsunamis along the coast, disaster mitigation from future large tsunamis is an urgent issue in local governments along the coast of Hokkaido. Therefore, we chose the region shown in Figure 2 as a test region to develop a new tsunami forecast method using observed waveforms at sensors in S-net. Various sizes of fault models are distributed in this region, as shown in Figure 2. A method for estimating the tsunami source location and earthquake magnitude is developed by analyzing those synthetic waveforms.

3. Fault Models

To develop a simple tsunami forecast method from the pressure waveforms of the sensors in S-net, the waveforms must be computed during tsunami generation and propagation based on fault models of various magnitudes of large earthquakes. Several empirical relationships exist between the sizes of fault areas and magnitudes of large earthquakes, as suggested by previous studies. Utsu and Seki [24] first determined the following relationship between the aftershock area, S (km2), and earthquake magnitude, M, using the earthquakes that occurred in Japan.
log S = 1.0 M 3.9 .
Wells and Coppersmith [25] determined the following empirical relationship between the rupture area (the early aftershock area), S (km2), and earthquake magnitude, M, using crustal earthquakes that occurred in the world excluding those that occurred in the subduction zone.
M = 4.33 + 0.9 log S .
Somerville et al. [26] determined the following empirical relationship between the rupture area S (km2), directly estimated from the slip distributions and the moment magnitude of the earthquake, Mw, using large crustal earthquakes that occurred in the world.
M w = log S + 3.95 .
More recently, Blaser et al. [27] determined the empirical relationship between the fault length, L (km), and moment magnitude, Mw, as shown in Equation (4), and the relationship between the fault width, W (km), and moment magnitude, Mw, as shown in Equation (5) for large interplate earthquakes in subduction zones in the world.
log L = 2.28 + 0.55 M w ,
log W = 1.8 + 0.45 M w ,
Although the two empirical relationships, i.e., Equations (2) and (3) by Wells and Coppersmith [25] and Somerville et al. [26] are not for interplate large earthquakes, we used all four empirical relationships to create various fault models for various magnitudes to clarify the uncertainty of the empirical relationships.
To create rectangular fault models, we assumed the ratio of fault length to fault width as 2:1 when the three empirical relationships, Equations (1)–(3) are used. A slip amount, D (m), is calculated from Equation (6):
D = M 0 μ L W ,   M 0 = 10 1.5 M w + 9.1 ,
where M 0 (Nm) is the seismic moment, L is the fault length in m, W is the fault width in m, and μ is a rigidity that is assumed to be 3.5 × 10 10   N/ m 2 . The strike and rake of the fault parameters are fixed as 230° and 109°, respectively, using parameters of the 1952 Tokachi-oki earthquake estimated by Satake et al. [28]. The depth and dip of the fault models are calculated along the plate interface from Kita et al. [29].
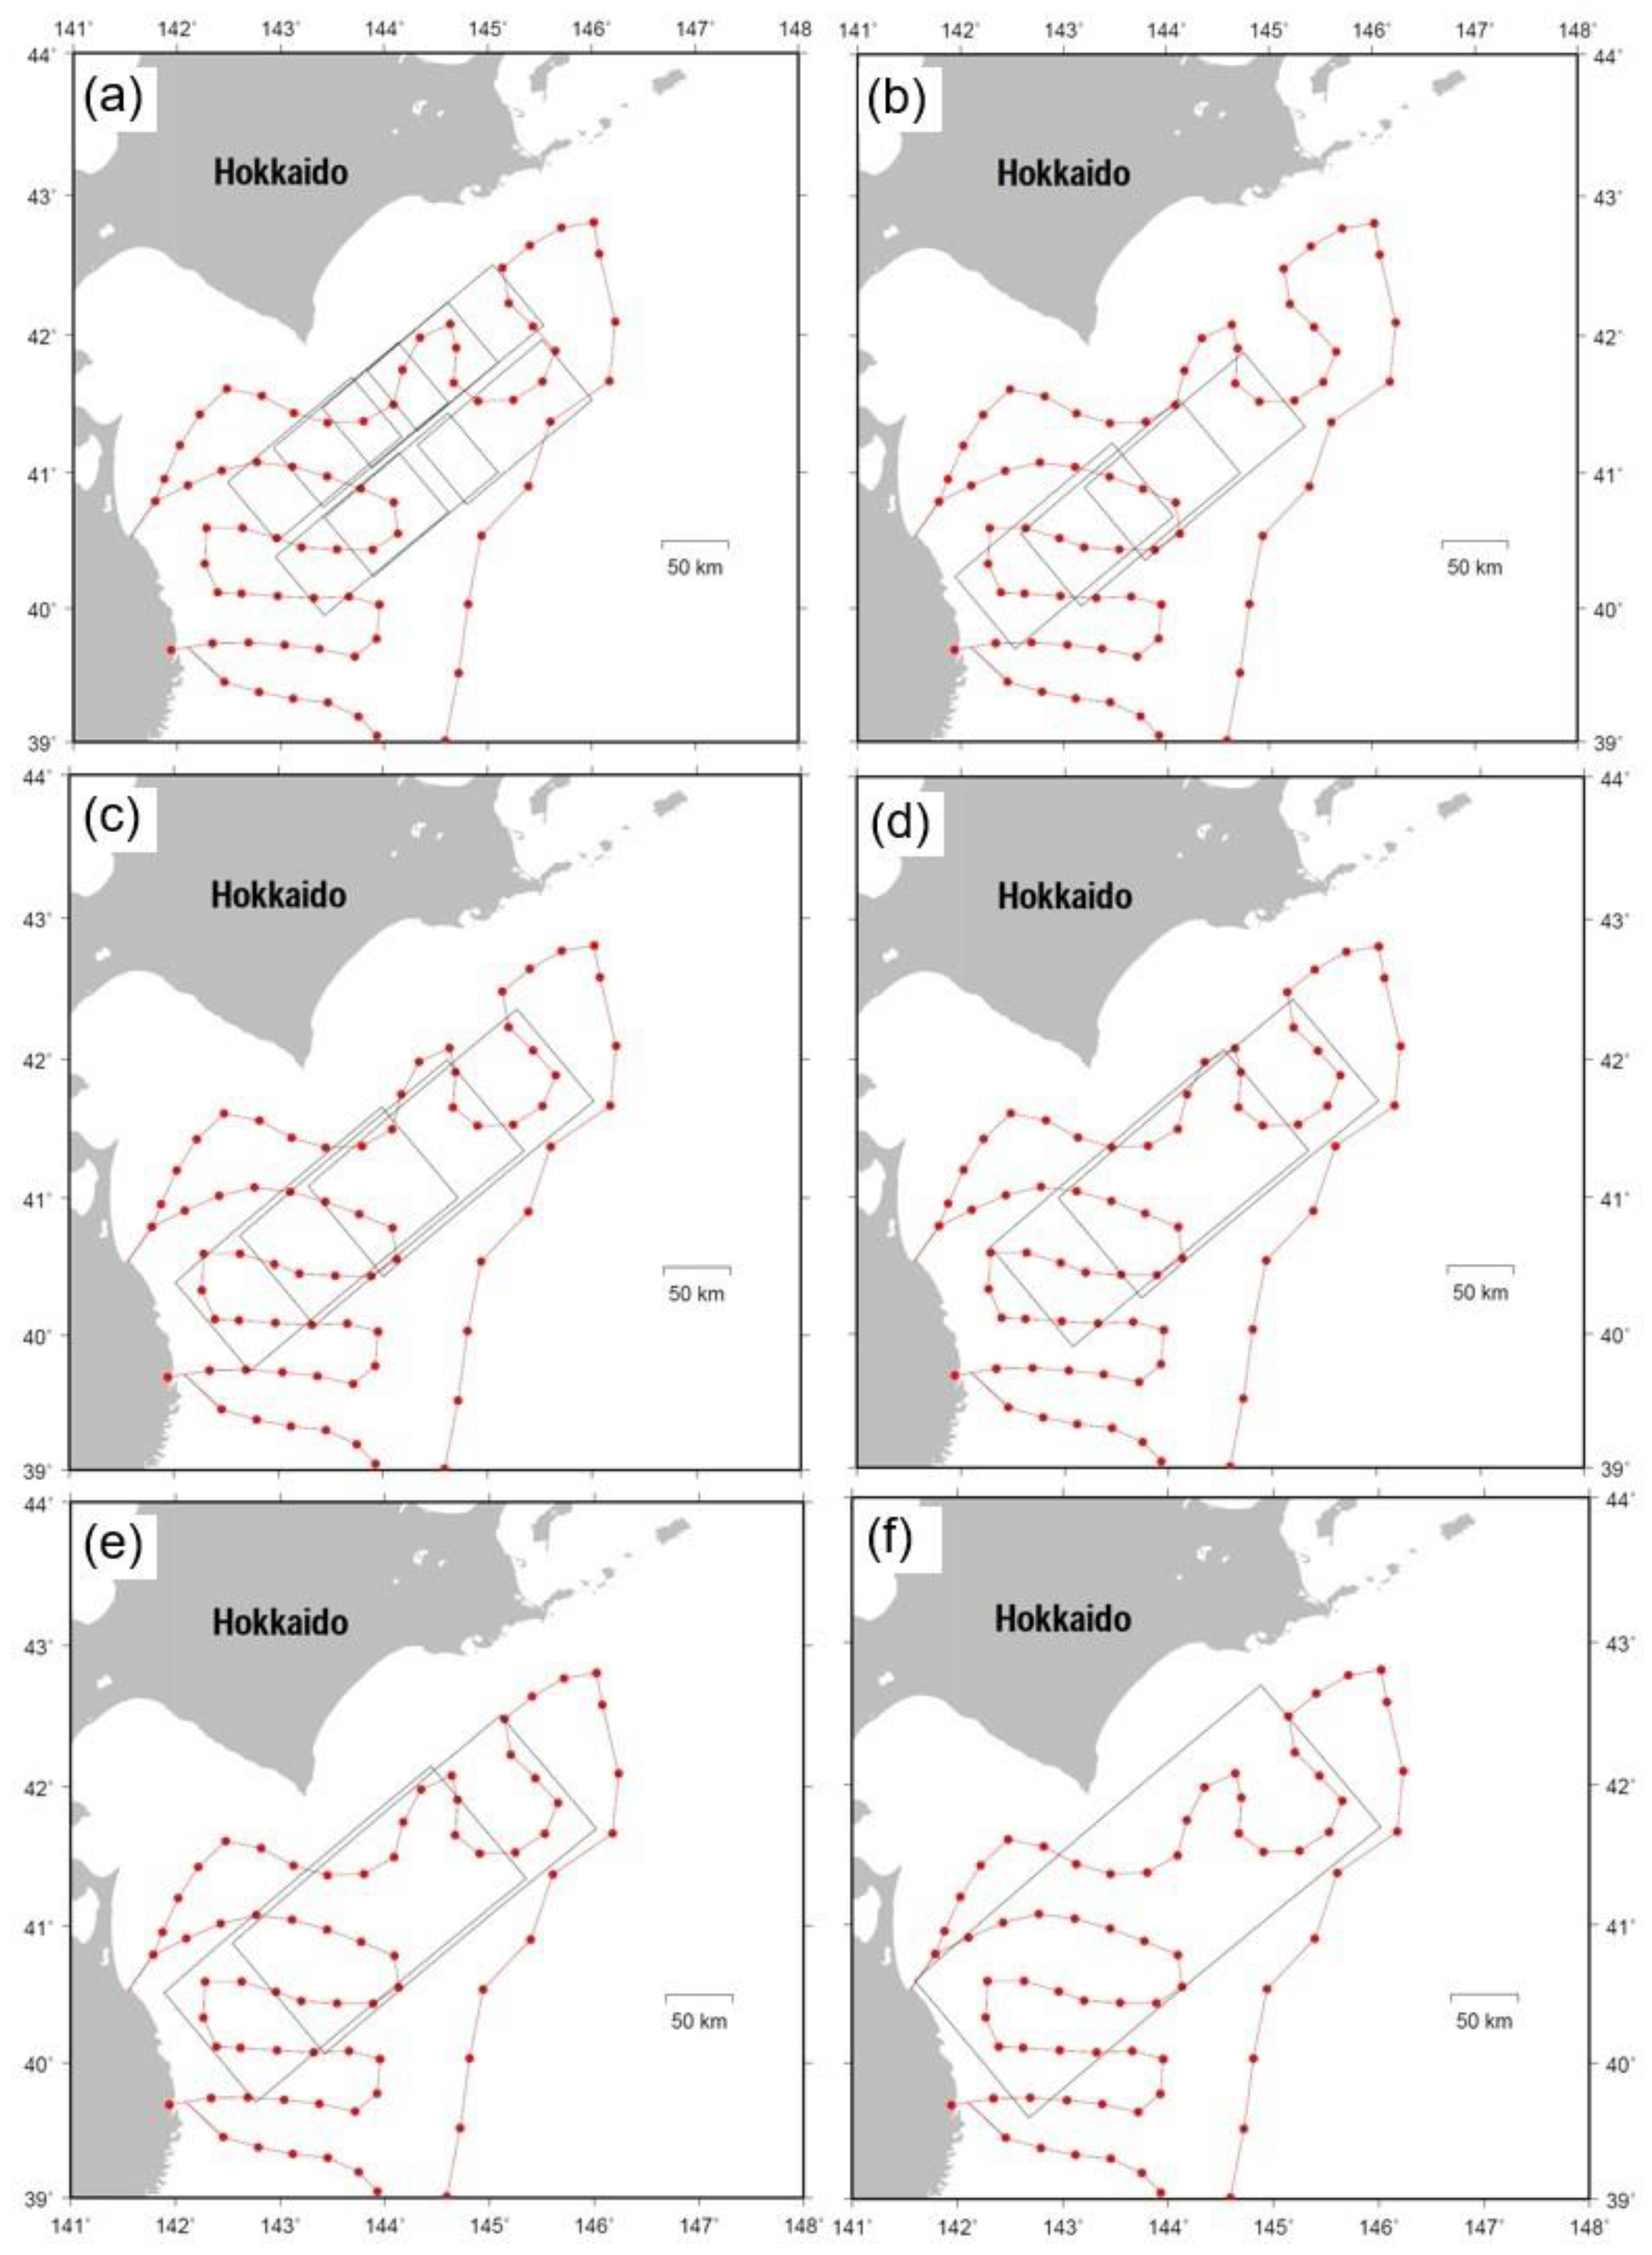
We assigned rectangular fault models to the plate interface by varying the magnitudes, i.e., M8.0, M8.2, M8.4, M8.5, M8.6, and M8.8. Figure 3 shows the locations of various fault models using the empirical relationship of Blaser et al. [27], i.e., Equations (4) and (5). Table 1, Table 2, Table 3 and Table 4 show the locations and fault parameters of the assumed fault models using the four empirical relationships by Ustu and Seki [24], Wells and Coppersmith [25], Somerville et al. [26], and Blaser et al. [27], respectively. The fault model for M8.8 is used only in the empirical relationship by Blaser et al. [27] because the size of the other fault models for M8.8 by the other three empirical relationships becomes much larger than the area where the sensors in S-net are distributed. In those cases, it is difficult to estimate the sizes of tsunami sources using waveforms observed at sensors in S-net by the method described in the following sections.

4. Tsunami Numerical Simulation

An initial tsunami deformation, i.e., ocean surface deformation due to an earthquake, is a vertical co-seismic displacement computed from the fault models shown in Table 1, Table 2, Table 3 and Table 4 (64 scenarios) using Okada’s [30] equation. Tsunami propagations are numerically computed using the finite difference method with a staggered grid system by solving the linear longwave equations (e.g., [31]) from the above initial condition. The grid space is 30 arc-seconds. The time step is 1 s to satisfy the stability condition. Here, rupture velocity, earthquake duration, and rise time are not considered. Subsequently, the computed tsunami waveforms at the locations of sensors in S-net shown in Figure 2 are determined as waveforms of the ocean bottom pressure change, assuming that the pressure, P, is described as P = ρgd where ρ is a water density, g is a gravitational acceleration, and d is total thickness of water. Those ocean bottom pressure data are stored in a database and used to develop a method to estimate the tsunami source.

5. Development of Near-Real Time Tsunami Source Estimation Technique

5.1. Classification Method for Pressure Waveforms Observed at the Ocean Bottom

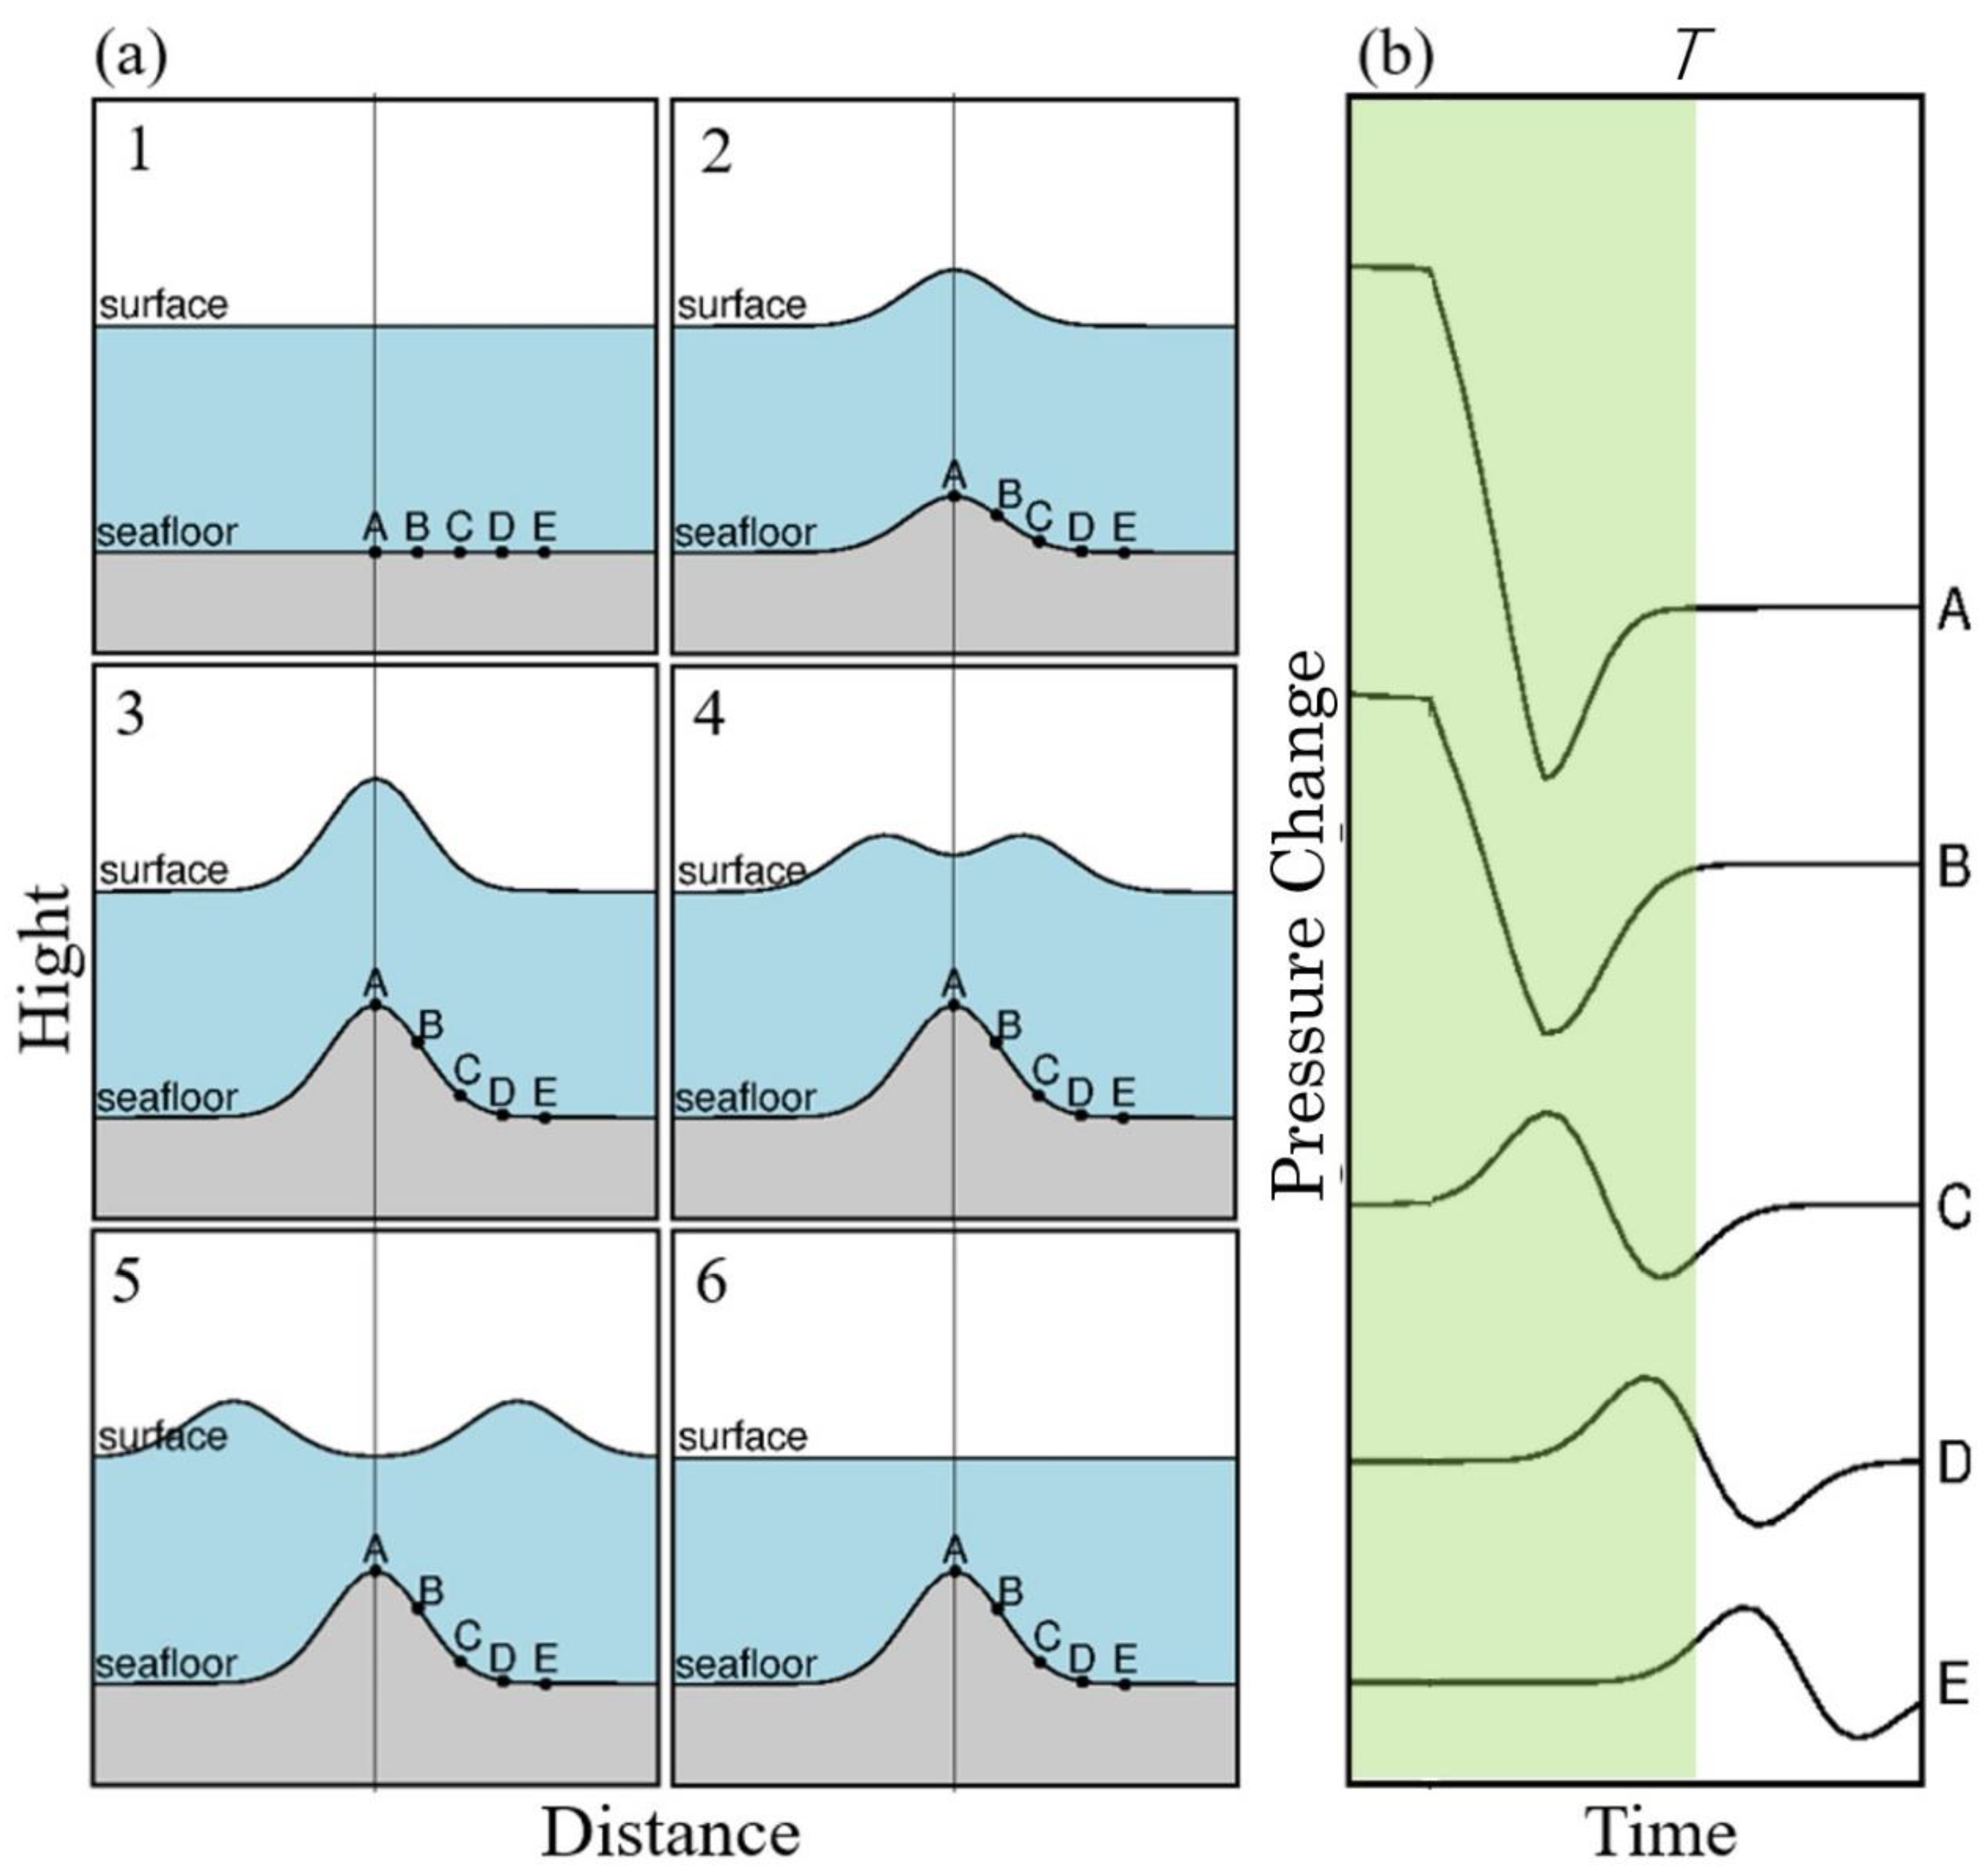
Tsushima et al. [8] calculated the ocean bottom pressure waveform near an uplift region due to the faulting of a large earthquake based on the schematic description shown in Figure 4. During an earthquake, the ocean bottom uplifts continuously, as shown in Figure 4a (2,3). At that time, the ocean surface is uplifted because of the ocean bottom uplift as the ocean bottom deformation is of a larger wavelength compared with the ocean depth because the earthquake provides the same deformation to the sea surface. Therefore, almost no significant pressure changes are expected to be observed at the ocean bottom during the earthquake. As the duration of the large earthquake is within approximately several tens of seconds, a propagation distance of the tsunami during the earthquake would be less than several kilometers or a few tens of kilometers, which is much shorter than the wavelength of the ocean surface uplift. After the co-seismic uplift is completed, the tsunami propagates as shown in Figure 4a (4,5). Pressure changes will then be observed at the ocean bottom, as shown in Figure 4b.
Subsequently, we introduced a time window, T, from the occurrence of earthquake, as shown by the shaded zone in Figure 4b. The waveforms of the pressure change observed at the uplift region, i.e., at A and B in Figure 4a, correspond to A and B in Figure 4b, respectively. A general characteristic of those pressure waveforms within the time window is that pressure decreases and remains low. We name this pressure waveform characteristic as Type 1. Waveforms observed at the edge of the uplift region, i.e., at C and D located close and outside the uplift region in Figure 4a, correspond to waveforms of C and D in Figure 4b, respectively. A characteristic of those pressure waveforms is that one up-pulse of a wave is contained in the time window. We name this pressure waveform characteristic as Type 2. The other pressure waveforms observed at the ocean bottom away from the uplift region, such as E in Figure 4a, are determined as Type 3.
We decided to use those three classifications (Types 1, 2, and 3) of pressure waveforms observed at sensors in S-net (Figure 2) within the time window, T, for the tsunami source estimation of a near- real time tsunami forecast. To classify the actual pressure waveforms, we found that three criteria must be set. The first criterion is for the Type-2 waveform, i.e., a waveform is classified into the type if the maximum positive pressure change is twice larger or more than the minimum positive pressure change observed after a time when the maximum pressure is observed. This criterion is necessary when the waveform of pressure change is positive and is not zero-down crossing within the time window, as described in waveform D in Figure 4b. The second criterion to classify a waveform into Type 1 is that the absolute amplitude at the end of time window should be more than 1/10 of the maximum absolute amplitude at the end of the time window among those Type-1 waveforms observed at sensors in S-net. This criterion is necessary because the small negative amplitude can be observed continuously within the time window even away from the co-seismic uplift region. The third criterion to allow a small positive wave in the beginning of Type 1 is that the absolute amplitude of the positive wave in the time window should be less than the absolute amplitude of the negative wave at the end of the time window, to be classified as Type 1. This criterion is particularly important for tsunamis generated from a complicated slip distribution such as the 1952 Tokachi-oki earthquake that we tested in our method, as will be described in a later section.

5.2. Classification Results of Pressure Waveforms

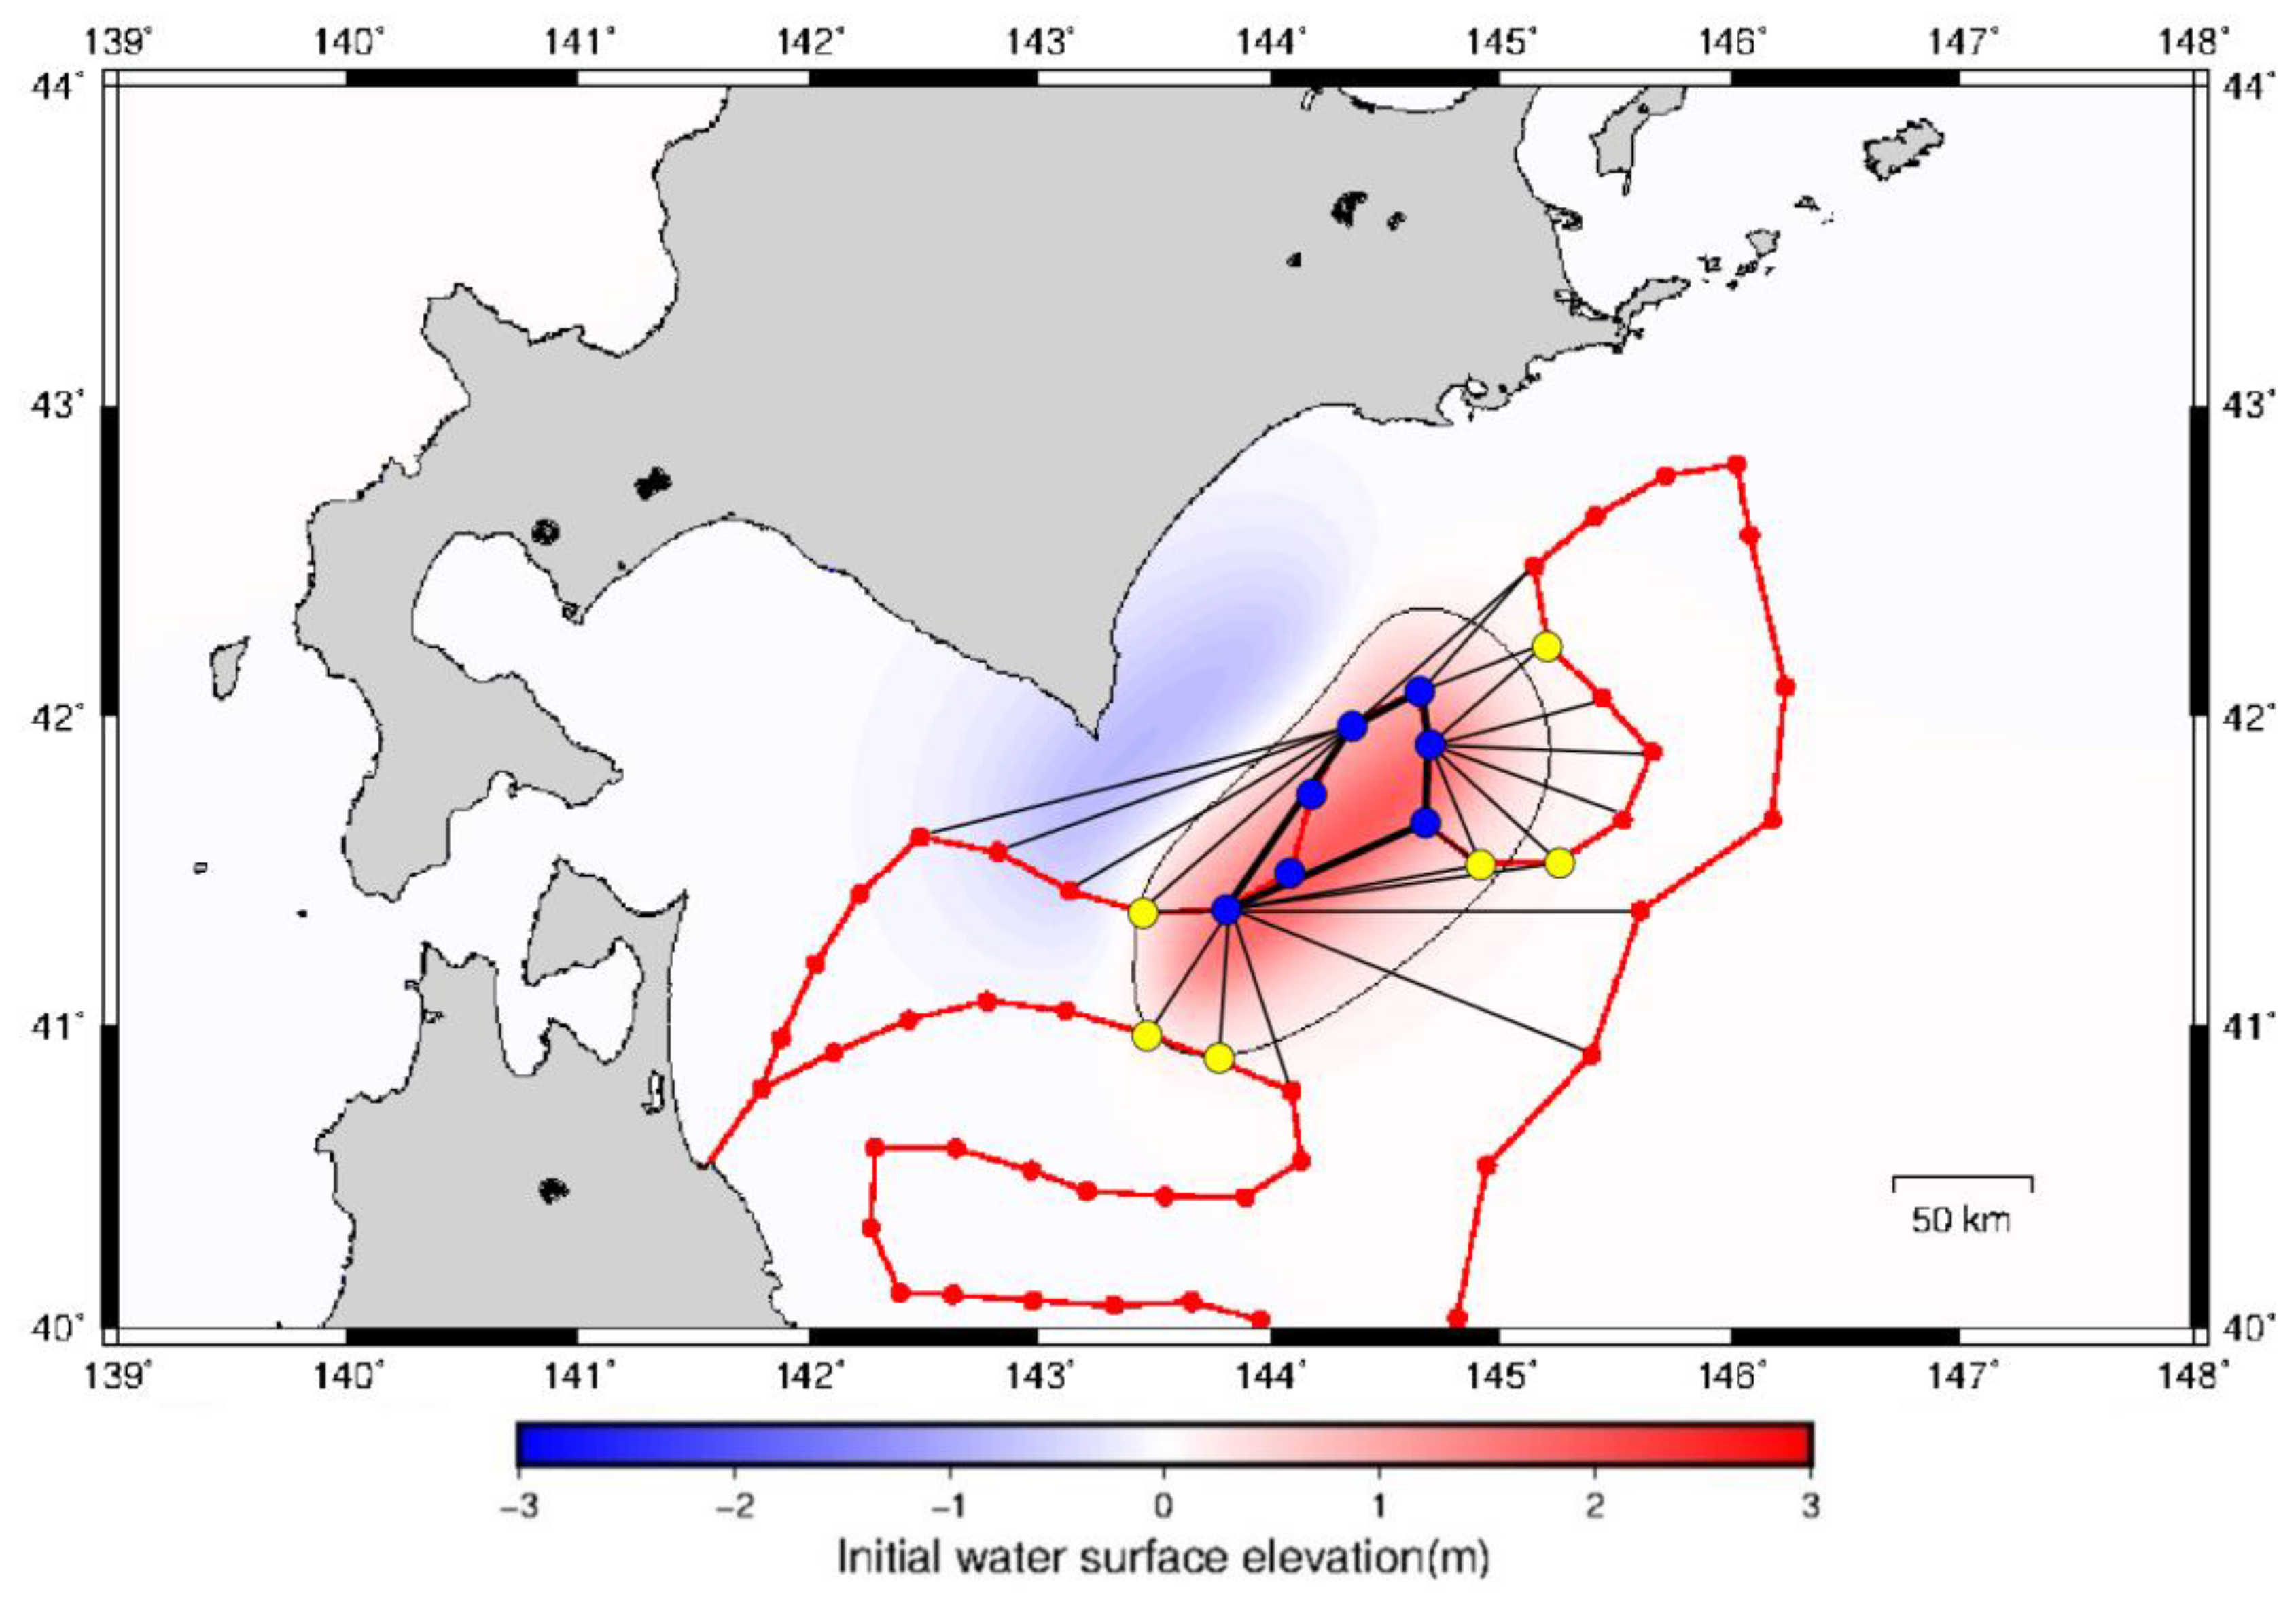
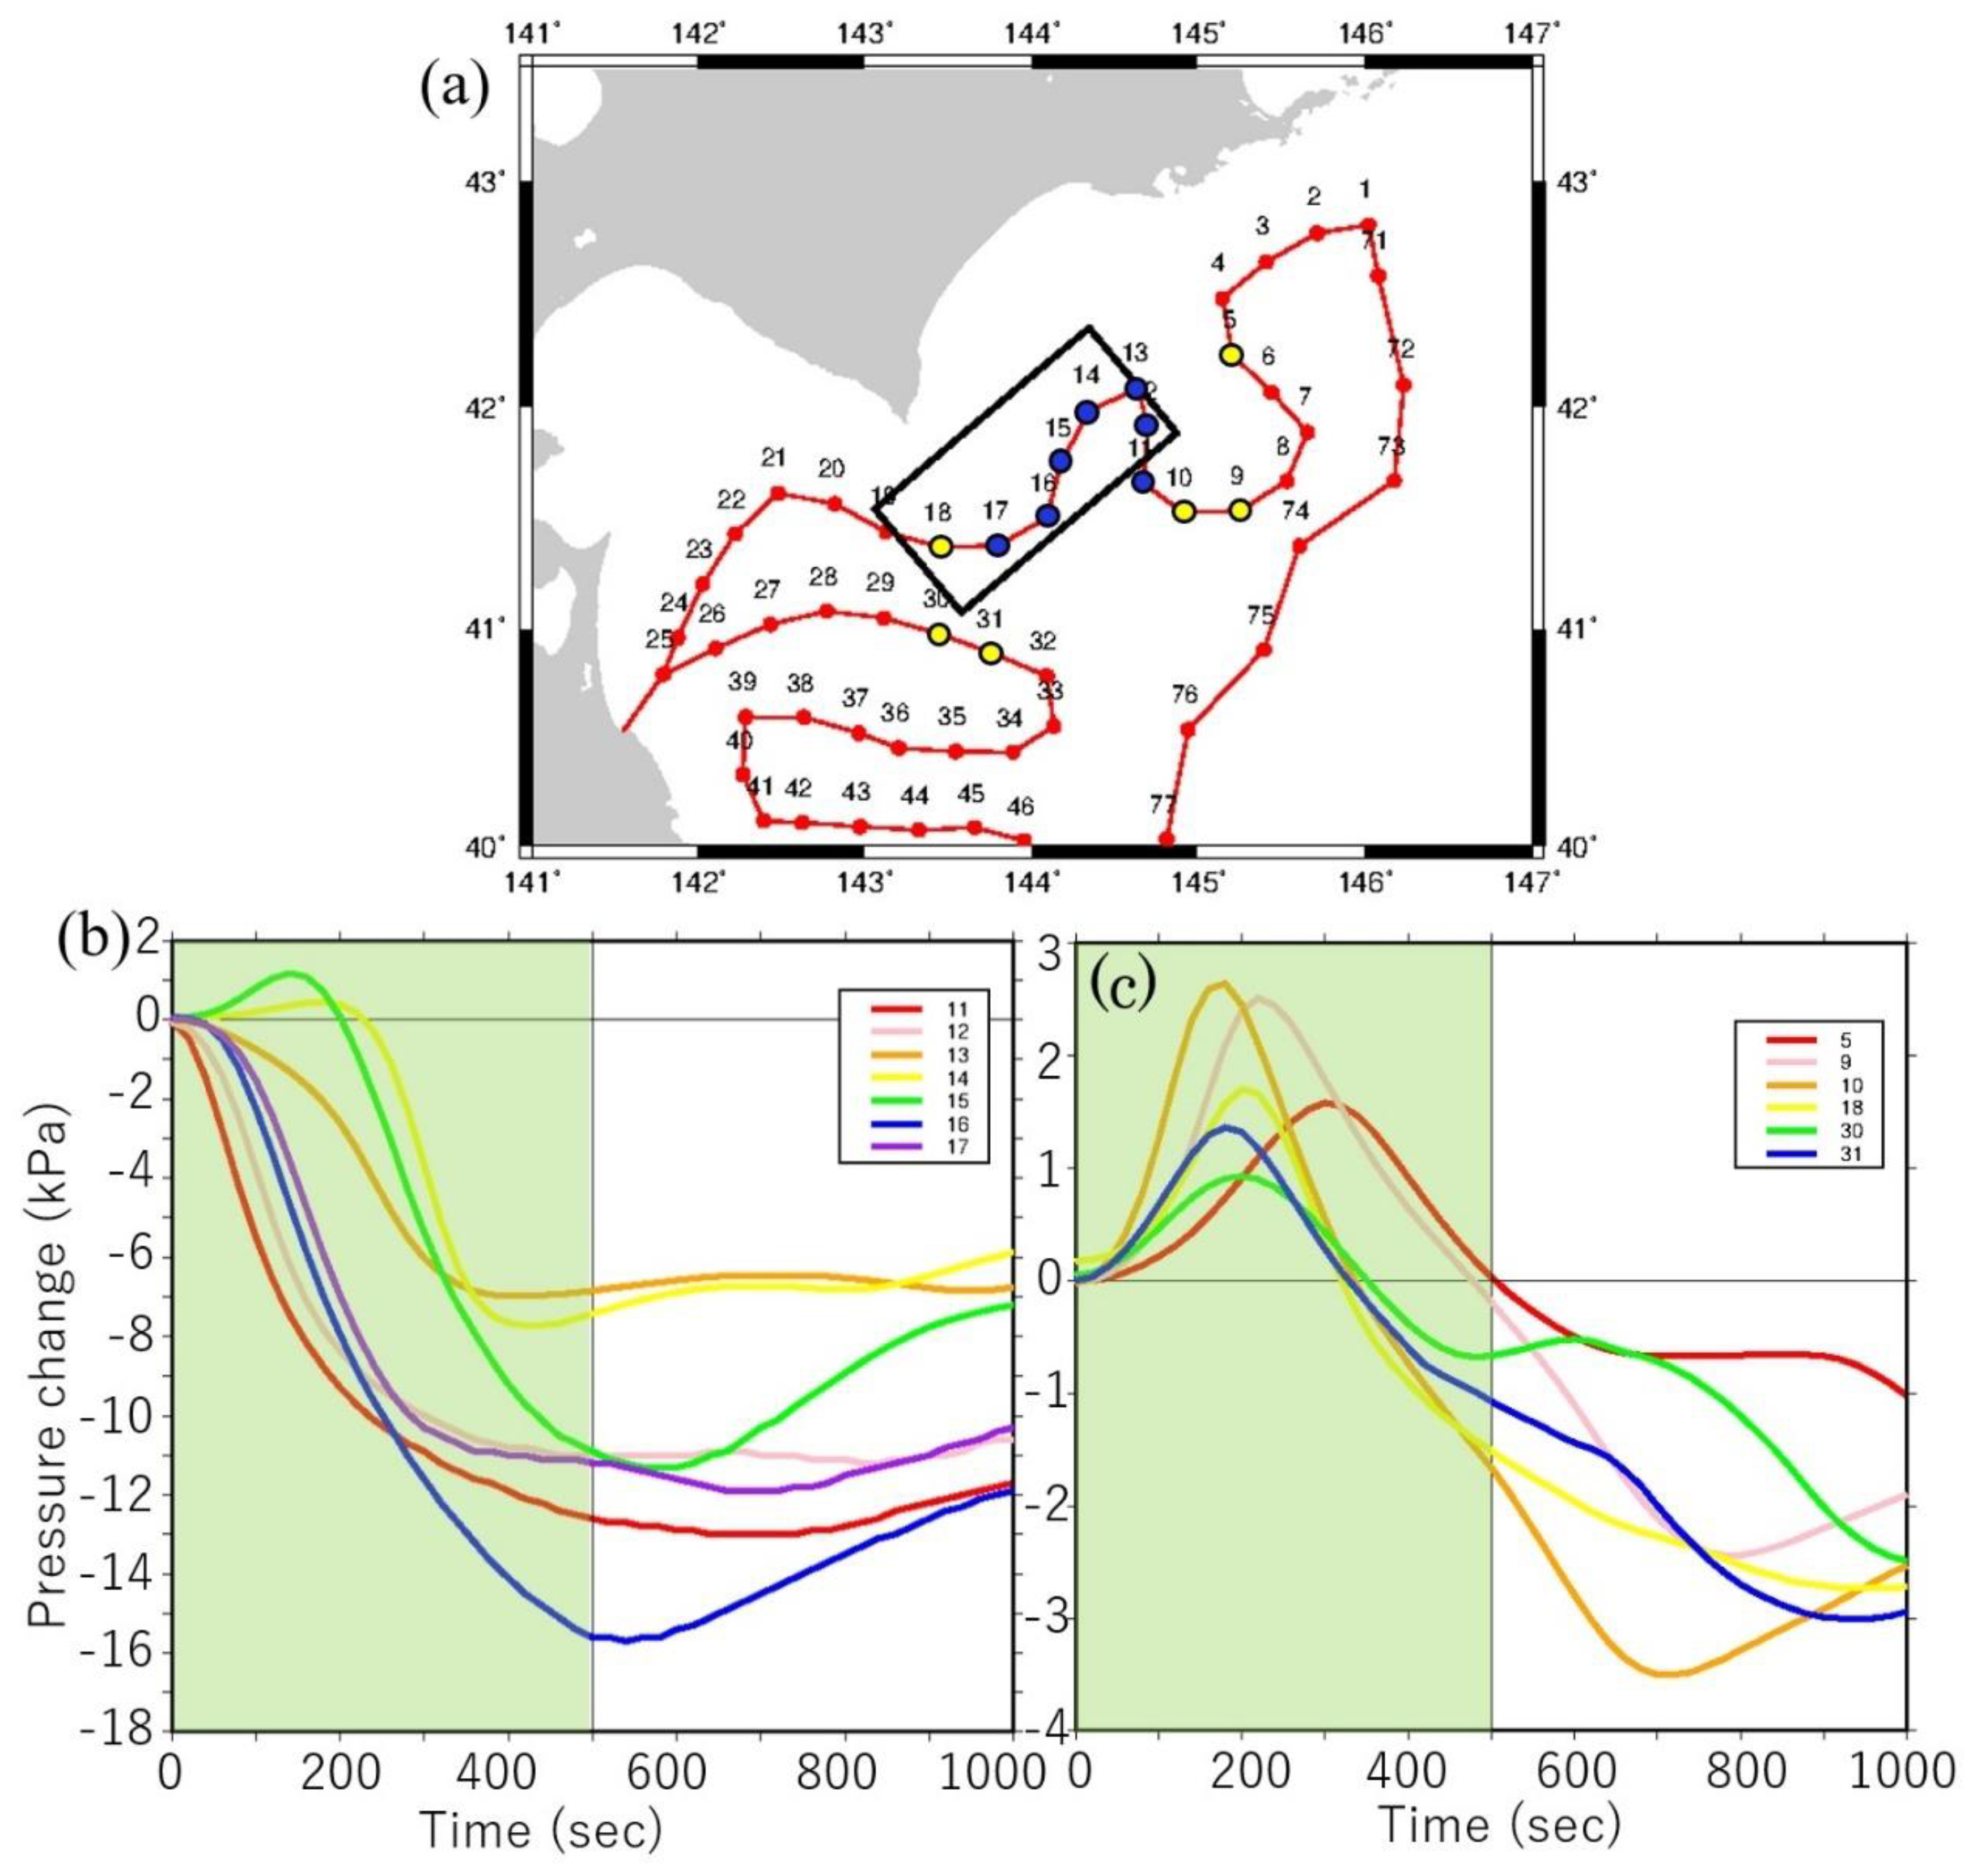
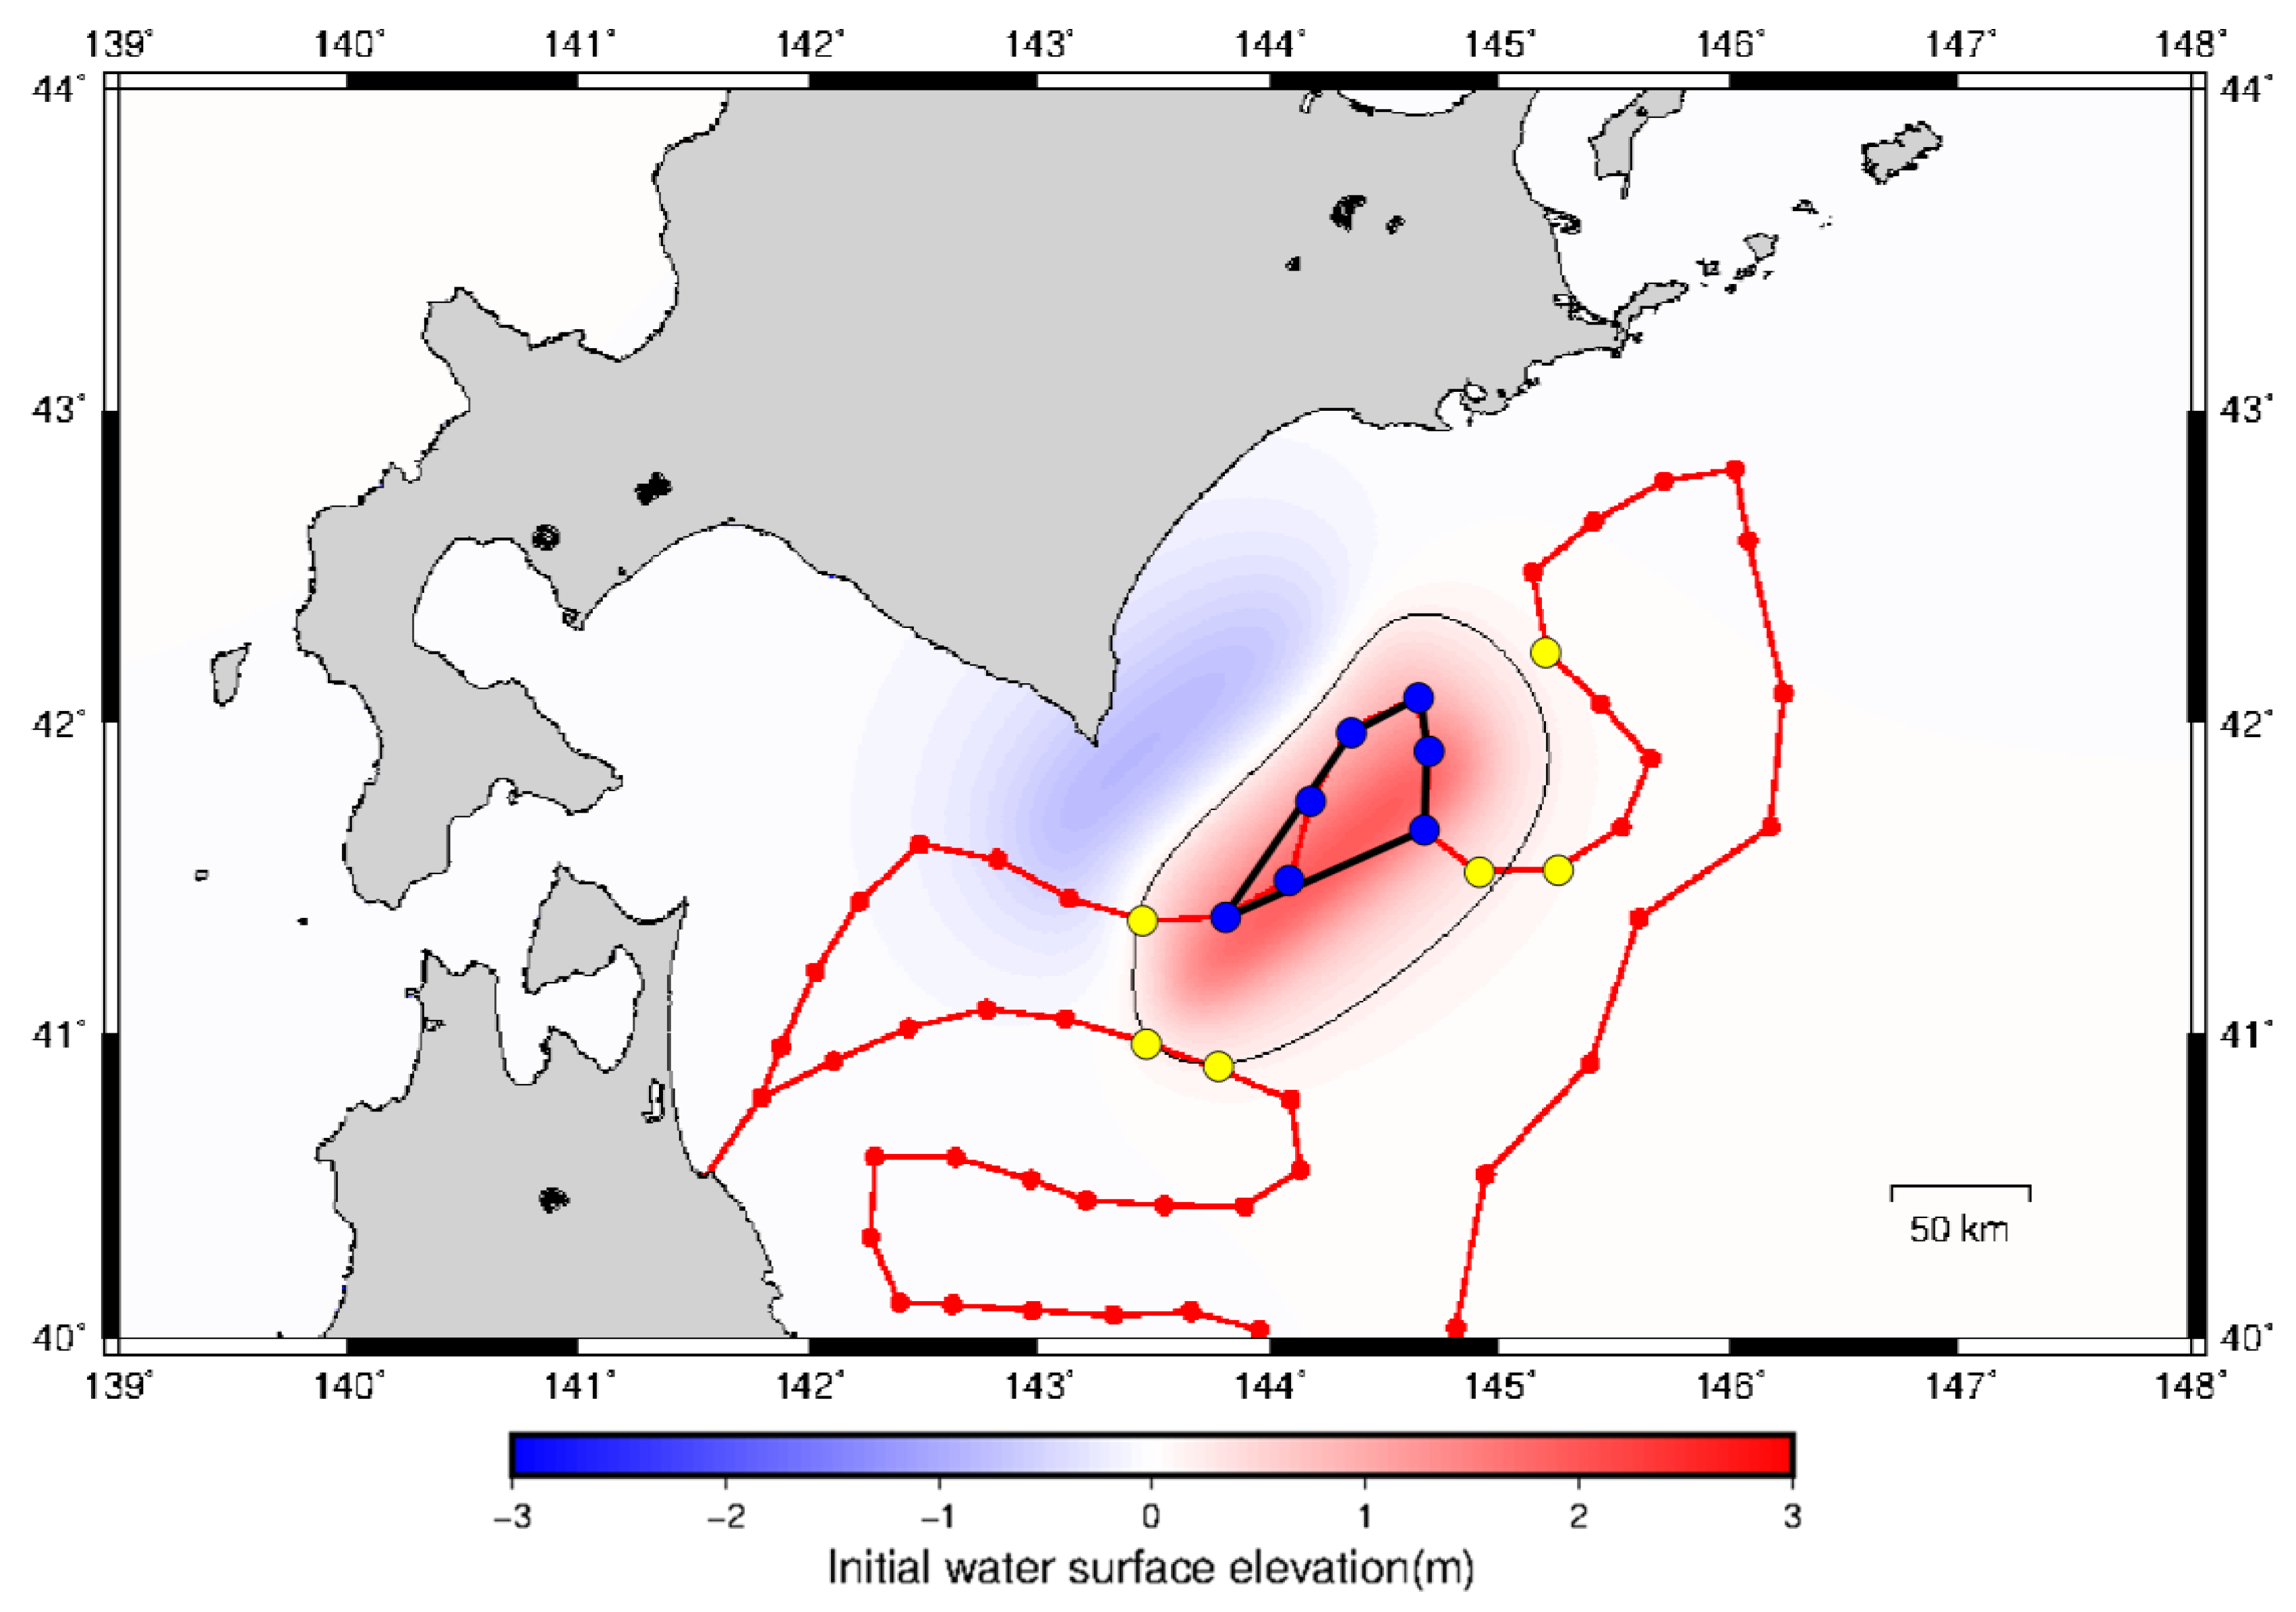
All the computed waveforms of pressure change for the 64 scenarios were classified into three types: Types 1, 2, and 3, by the classification technique described in the previous section. The time window for the classification is set as 500 s (approximately 8 min). At the end of the time window, i.e., at 500 s, several minutes may elapse before large tsunamis arrive at the Hokkaido coast. One example of the classification results for the fault model, M8.0, is shown in Figure 5. Pressure waveforms classified into Types 1 and 2 are shown in Figure 5b,c, respectively. In Figure 6, the computed ocean surface deformation is shown with the classification type: Types 1, 2, and 3 for the sensors in S-net. Sensors observing Type-1 waveforms, shown as blue dots, are located within the uplifted area shown in red in Figure 6, as expected. Sensors observing Type-2 waveforms, shown as yellow dots in Figure 6, are located at the edge of the uplifted area or immediately outside the uplifted area. The other sensors are located away from the uplifted area. The classification results of 64 fault models indicated that the classification of pressure waveforms within the time window of 500 s can reveal co-seismic uplift areas.

5.3. Estimation of Uplift Areas from Three Classification Types

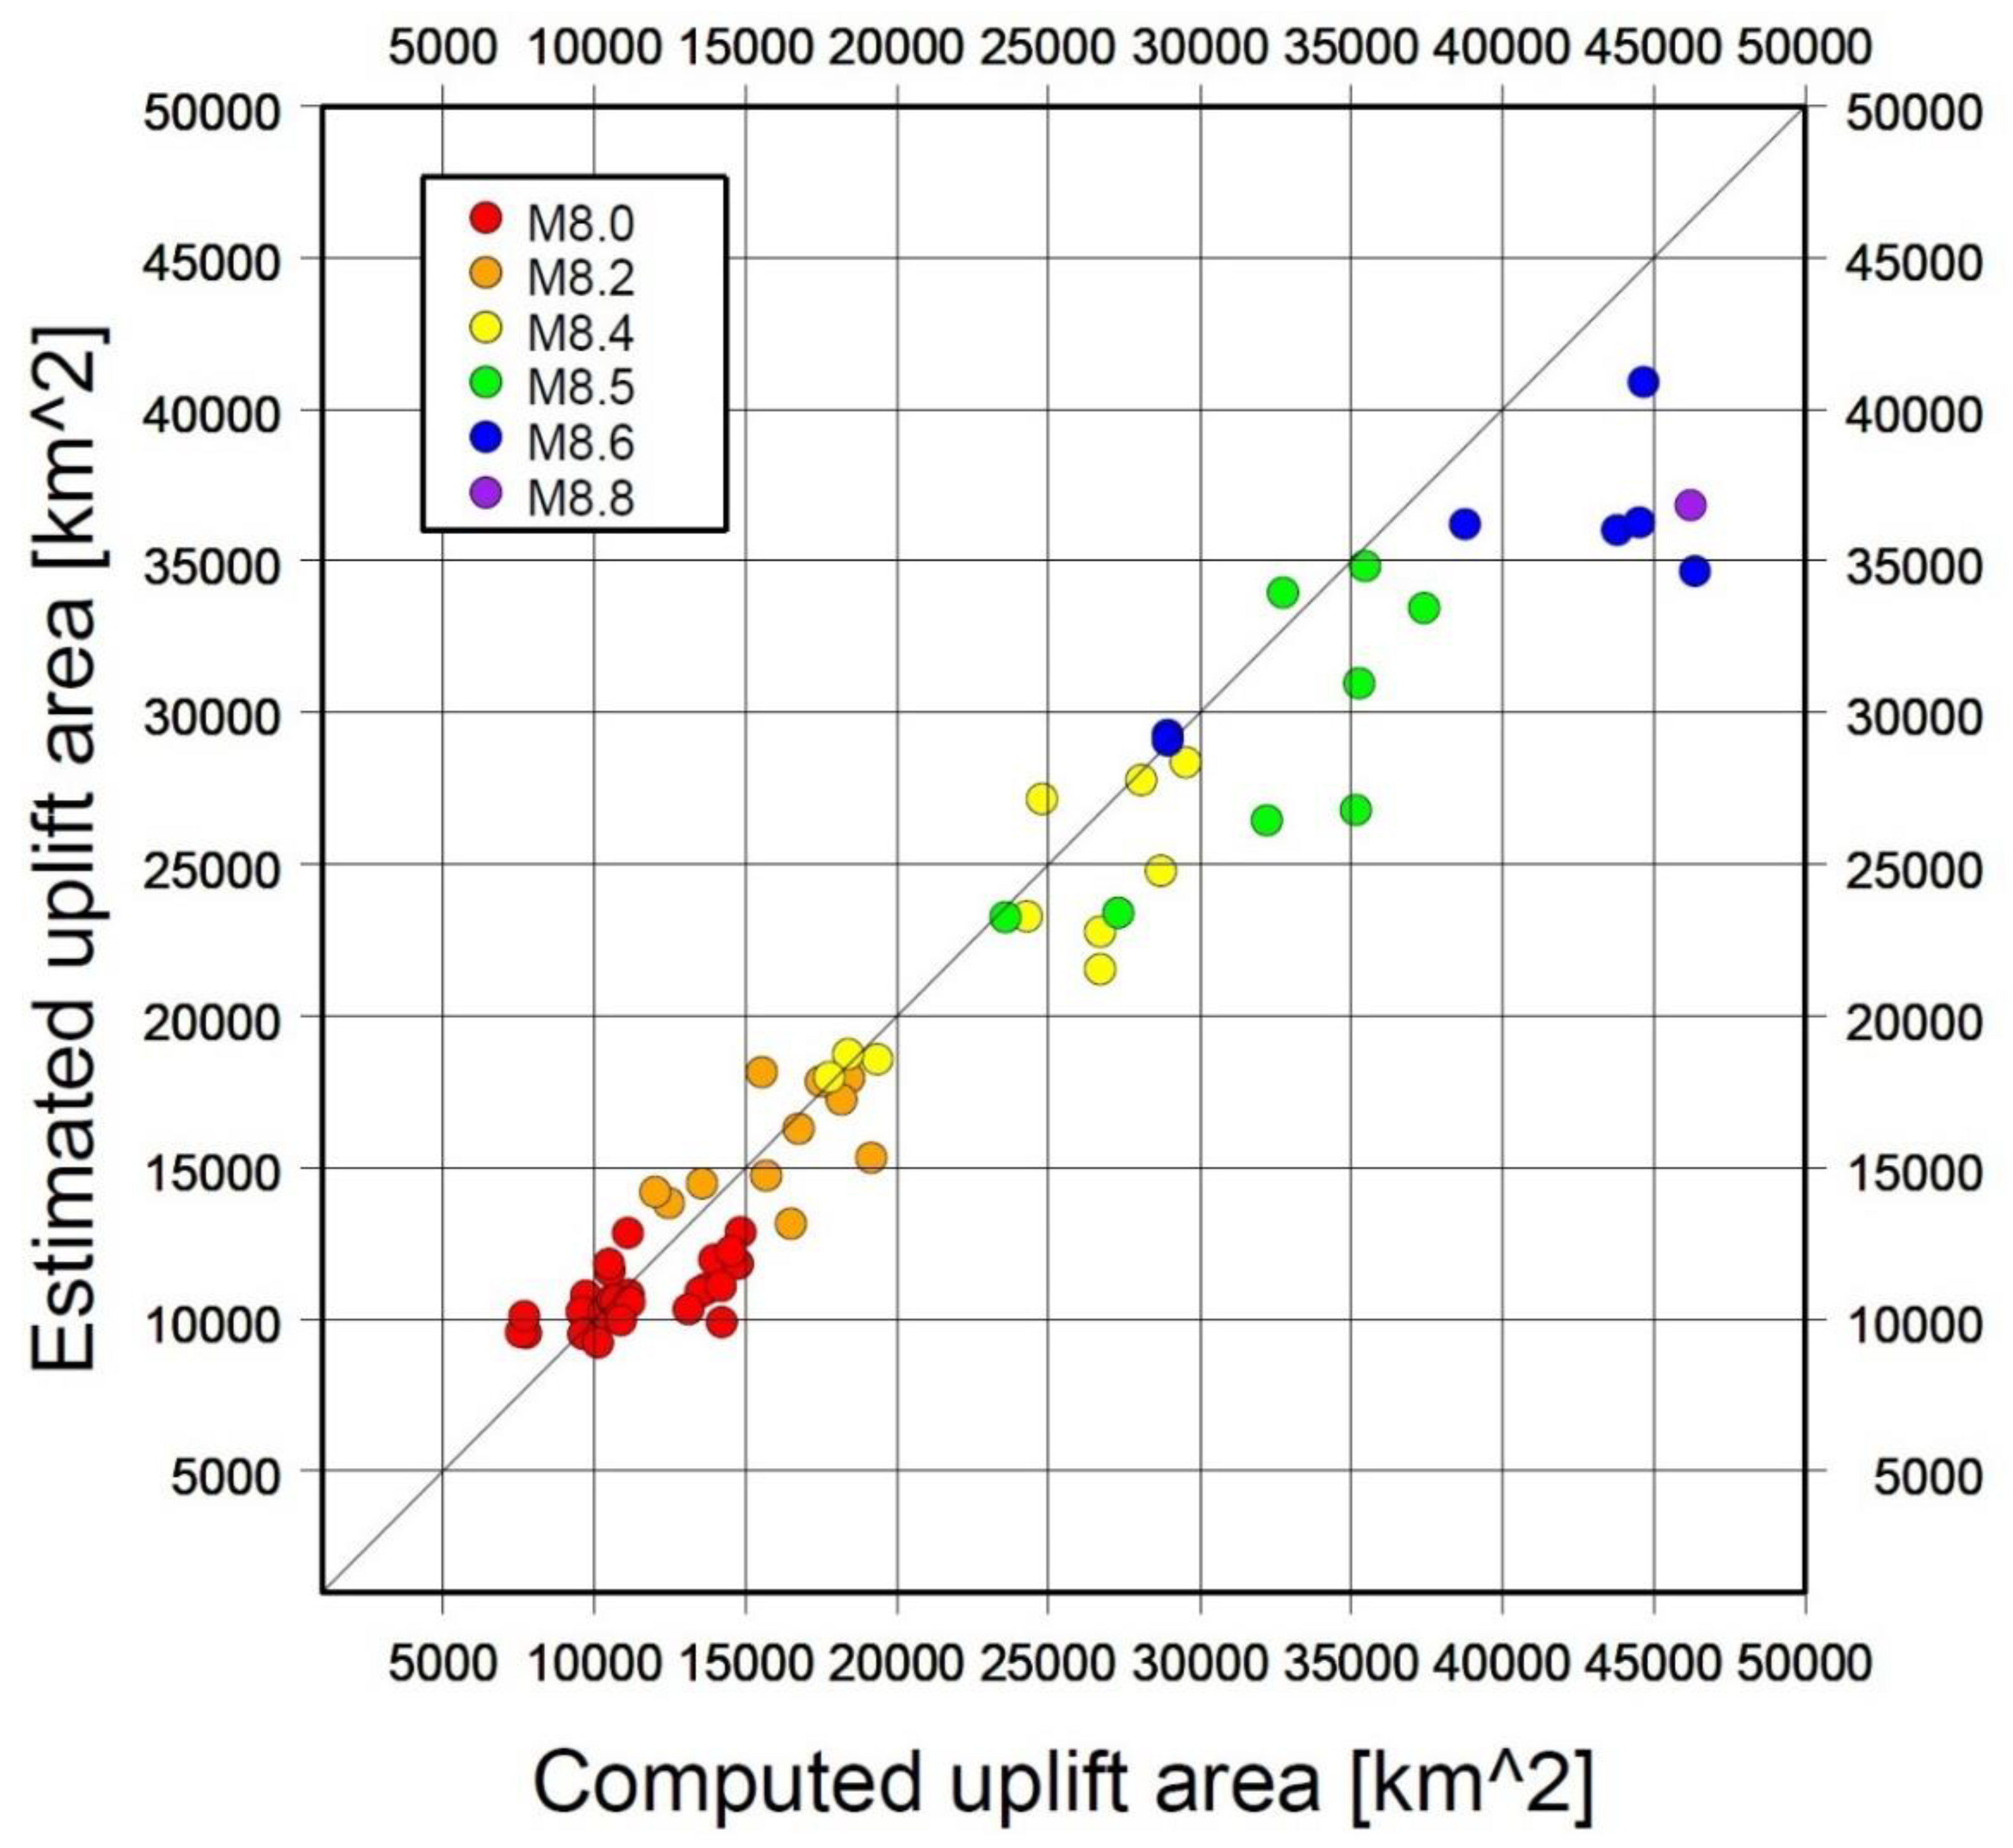
The uplifted area of the initial surface deformation of 64 fault models shown in Table 1, Table 2, Table 3 and Table 4 were estimated from the procedures described in Appendix A using the classification data of computed pressure waveforms at the S-net sensors shown in Figure 2. The estimated uplift areas are compared with the computed areas in Figure 7 and Table 1, Table 2, Table 3 and Table 4. For this comparison, the region where the computed uplift amount is more than 1/10 of the maximum uplift is defined as the computed uplift area, such as that shown by the black solid line in Figure 6. Figure 7 shows that the estimated uplift areas represent the computed areas well; however, the estimated uplift areas for large earthquakes slightly underestimated the computed areas.

5.4. Estimation of Magnitudes from Uplift Areas

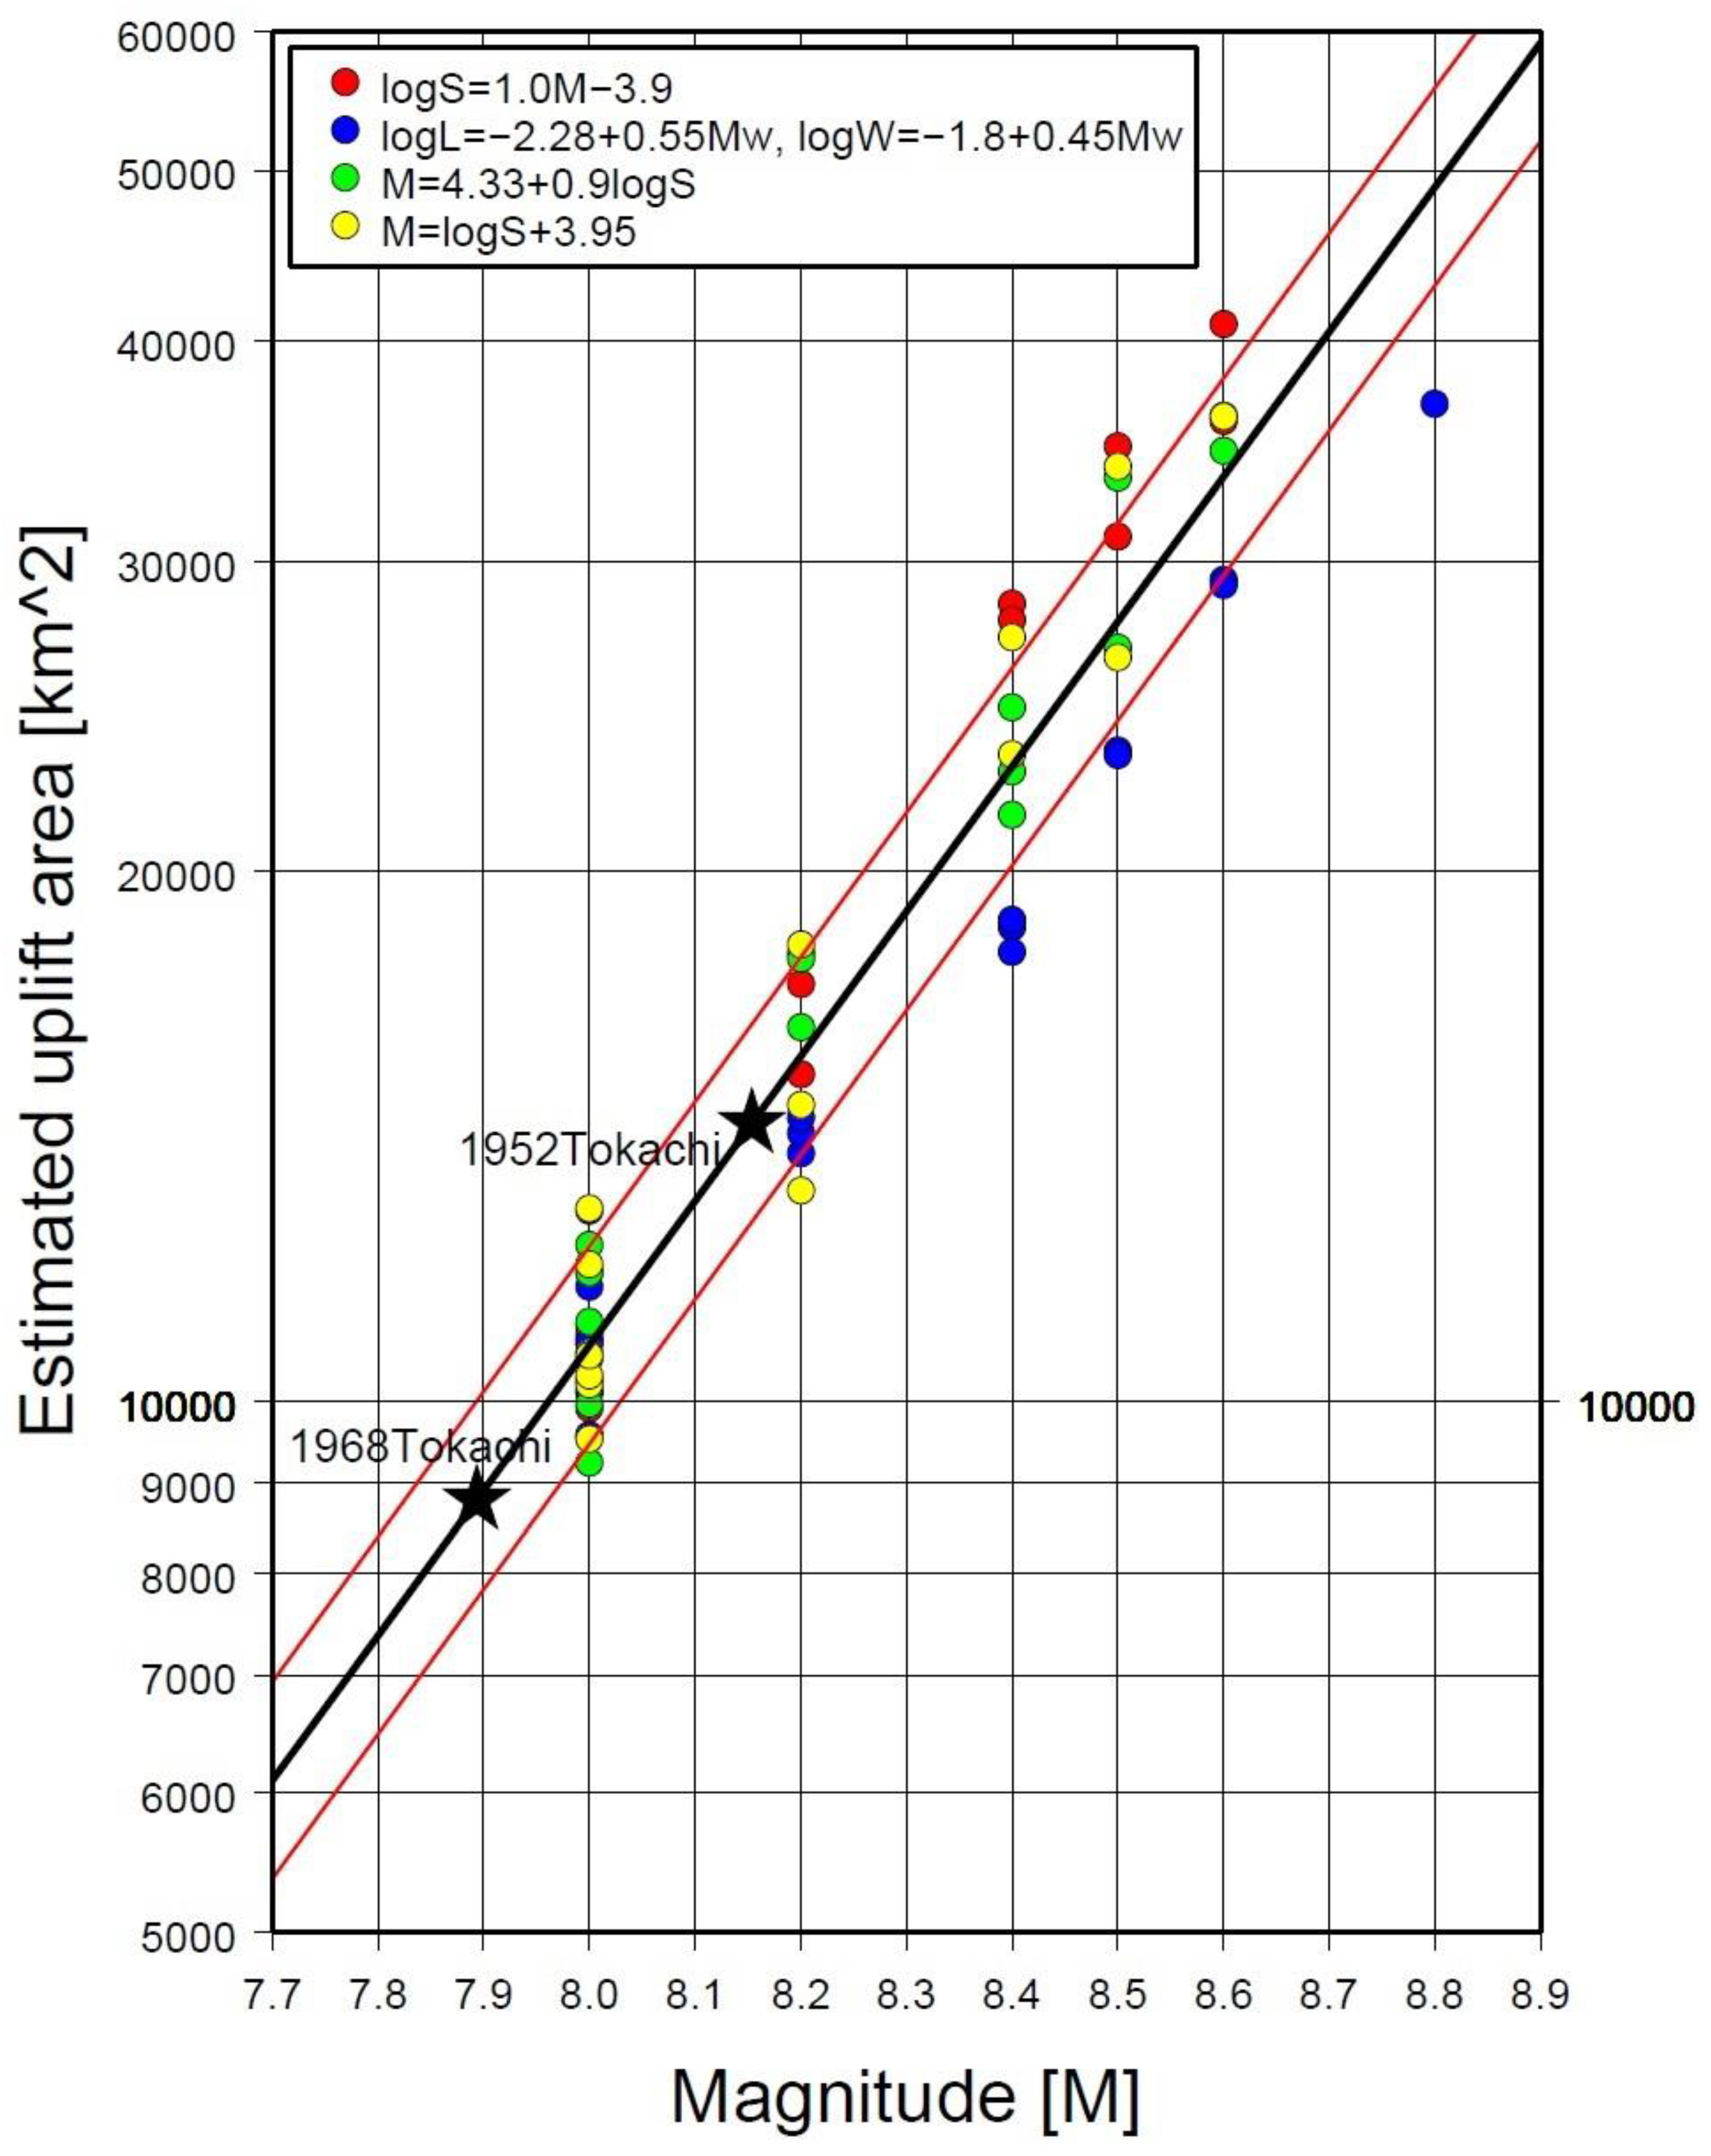
The uplift areas were estimated for the 64 fault models along the plate interface by varying the magnitudes, i.e., M8.0, M8.2, M8.4, M8.5, M8.6, and M8.8. Therefore, a relationship between the estimated uplift area and magnitude exists. Figure 8 shows a plot of the estimated areas in a log scale with the earthquake magnitudes. A linear regression analysis of the data using the least-squares method yielded the following relationship:
log S u p = 0.822 M 2.543 ,
where S u p is the estimated uplift area (km2) and M is the earthquake magnitude. The solid black line in Figure 8 shows the linear regression line. The standard deviation of the magnitude from the linear regression line was calculated to be 0.07.
Using pressure data at sensors in S-net within 500 s after the earthquake occurs, the pressure data are classified into three types, as described in Section 5.1. The uplift area of the ocean surface is estimated from the classified types of data from the sensors using the procedures described in Section 5.3. Subsequently, the earthquake magnitude is estimated from Equation (7). This technique can be tested to estimate the source area of tsunami and the earthquake magnitude for the previous great earthquakes.

6. Validation of Tsunami Source Estimation for Previous Large Earthquakes

We applied the tsunami source estimation technique shown in the section above to the previous two great earthquakes, the 1952 Tokachi-oki earthquake (Mw8.2) and the 1968 Tokachi-oki earthquake (Mw8.1). Those two earthquakes were chosen because large co-seismic uplift areas were within the station distribution of S-net. Those earthquakes also generated tsunamis that caused damages along the Pacific coast of Hokkaido.

6.1. Case Study for the 1952 Tokachi-Oki Earthquake (Mw8.2)

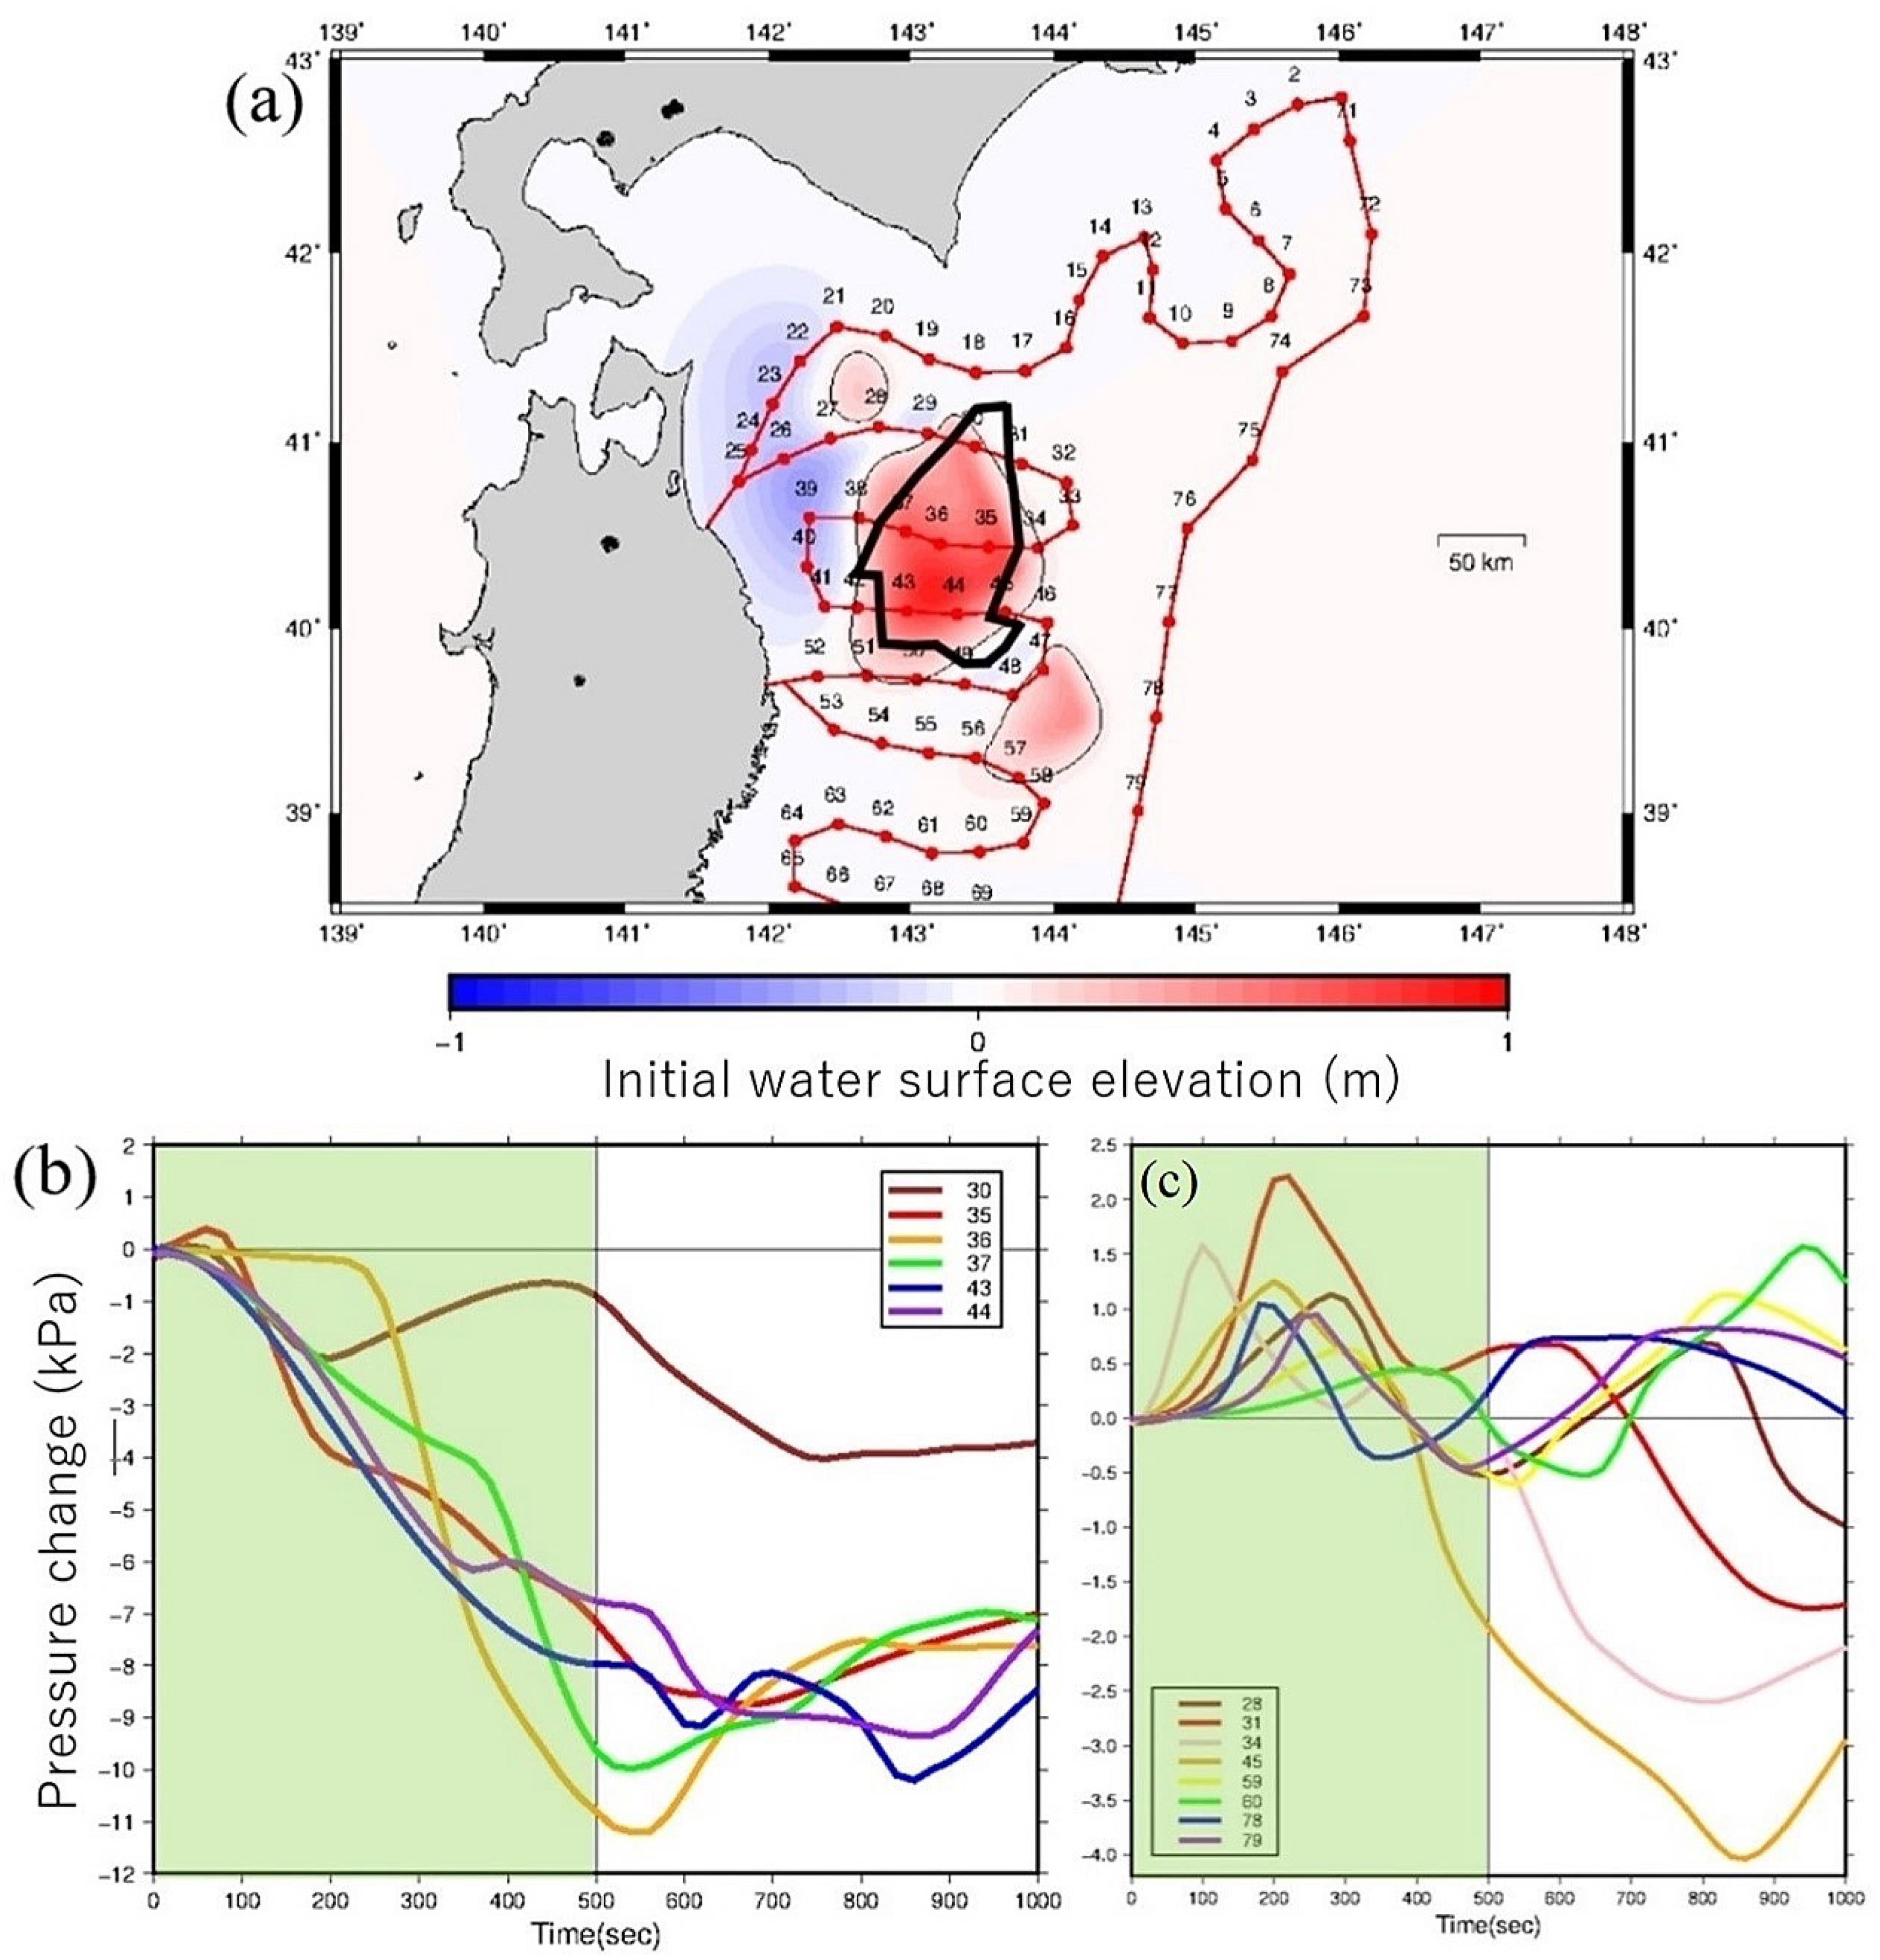
The great Tokachi-oki earthquake occurred on March 4, 1952, with a moment magnitude of Mw8.2 (Figure 2). The slip distribution of the 1952 earthquake was estimated from the observed tsunami waveforms at tide gauges using the inversion technique by Hirata et al. [13]. We numerically computed pressure waveforms at the ocean bottom sensors in S-net using the slip distribution estimated by Hirata et al. [13]. Figure 9a shows the comparison of computed uplift area from the slip distribution with the estimated uplift area from our classification method of the pressure waveforms at the sensors in S-net. The estimated uplift area is consistent with the computed uplifted area although the Northwest part of the computed uplift area is not estimated by our technique because no sensor is available in that area. Figure 9b shows the pressure waveforms classified into Type 1. Figure 9c shows the pressure waveforms classified into Type 2. The estimated uplift area is calculated to be 14.4 × 10 3   km 2 . The magnitude calculated using Equation (7) from the estimated uplift area is M8.2, which is consistent with the moment magnitude of Mw8.2.

6.2. Case Study for the 1968 Tokachi-Oki Earthquake (Mw8.1)

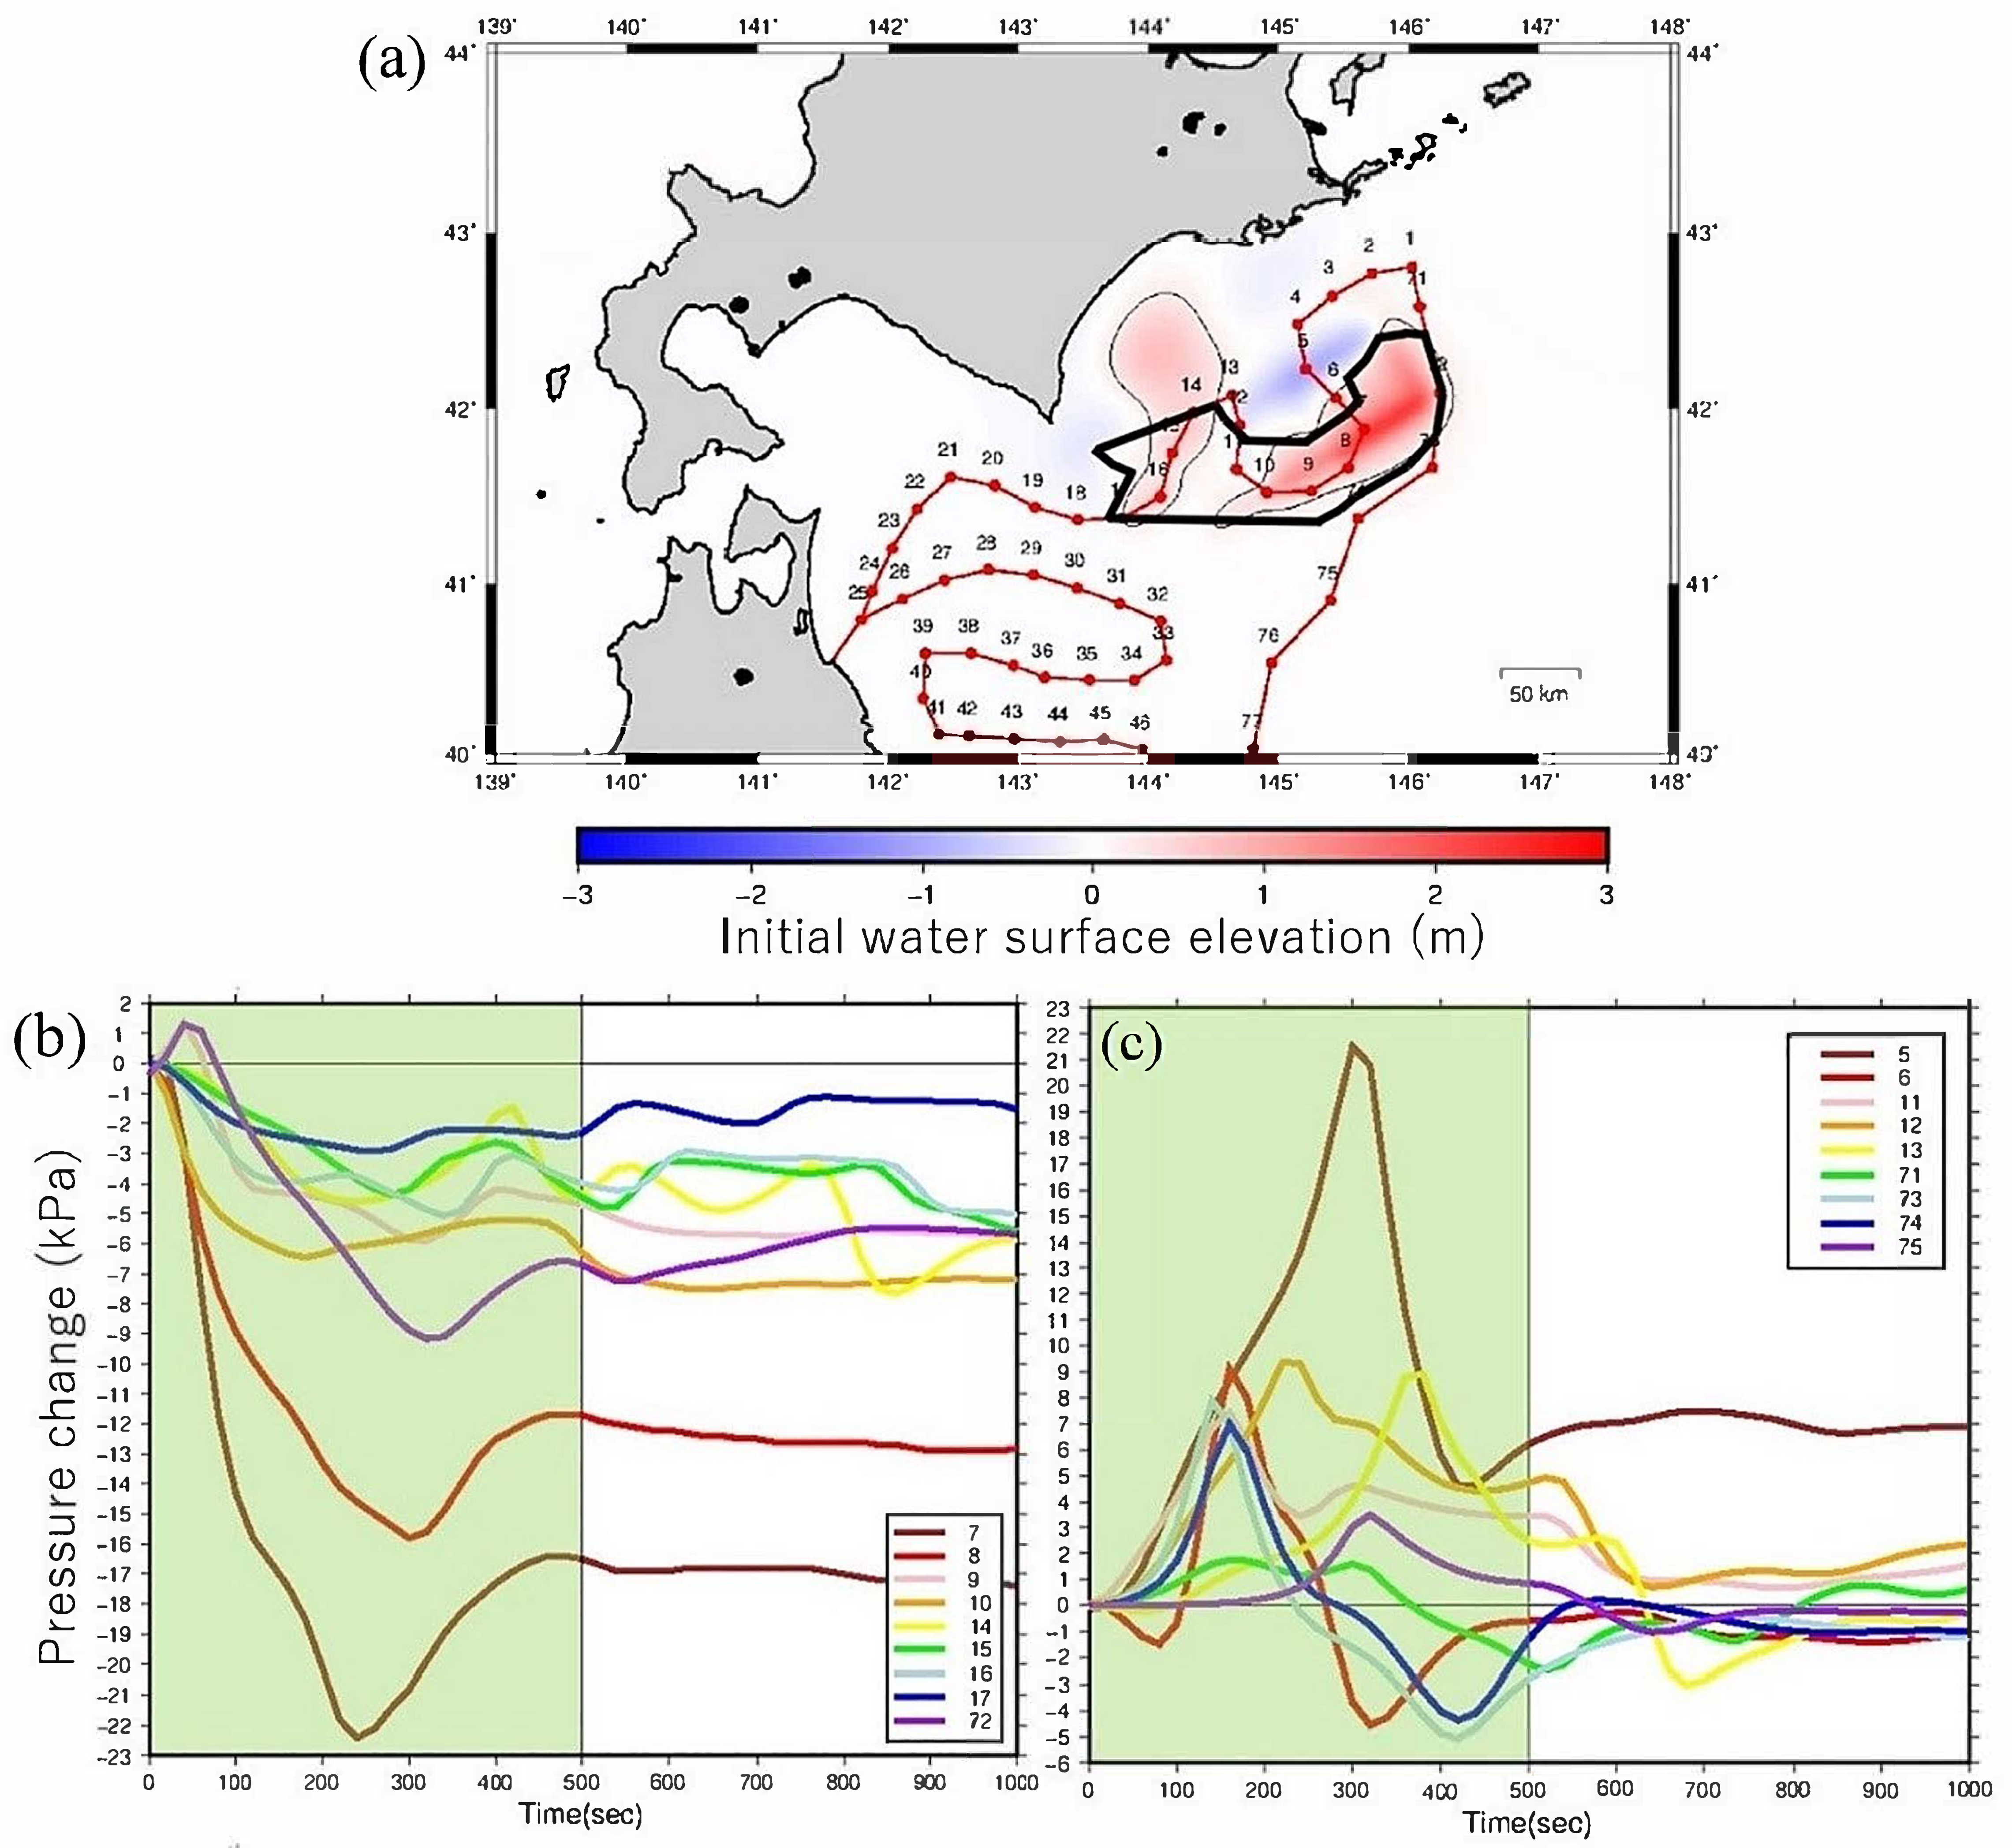
The great Tokachi-oki earthquake occurred on May 16, 1968 with a moment magnitude of Mw8.1 (Figure 2). The slip distribution of the 1968 Tokachi-oki earthquake has been estimated from the inversion of the observed tsunami waveforms at tide gauges by Satake [14]. In this study, we only used subfaults that exhibited a positive slip amount from the slip distribution estimated by Satake [14] to compute the pressure waveforms of the sensors in S-net. Figure 10a shows a comparison of the computed uplift and subsidence from the slip distribution with the estimated uplift area, as shown by a thick black line, from the classification of pressure waveforms of the sensors into three types. The estimated uplift area is slightly smaller than the computed uplifted area because the Southern part of the computed uplift area and the small Northern part of that are not estimated by our technique because both North and South uplift areas are located between the sensors. Figure 10b shows the pressure waveforms classified into Type 1. Figure 10c shows the pressure waveforms classified into Type 2. The estimated uplift area is calculated to be 8.8 × 10 3   km 2 . The magnitude calculated using Equation (7) from the estimated uplift area is M7.9, which is slightly smaller than the moment magnitude of Mw 8.1. This is because the Northern and Southern part of the uplift areas are not estimated by our technique.
The complicated slip distribution of the earthquake yielded the complicated pattern of the uplift area including small patches, as shown in Figure 10. To identify those small patches, denser sensors are required in the network. However, by realizing the limitation of our technique, we can use the tsunami source area estimation method presented in this study for a tsunami forecast.

7. Discussion

For the tsunami numerical simulation in this study, we did not include the horizonal displacement of a sloping seafloor during the earthquake [32]. The effect of the horizonal displacement to tsunami amplitudes is significant, especially for the earthquake that occurred near the trench. However, the effect of that on our classification in this study is insignificant because a large horizontal displacement typically occurred within the uplifted area. We confirmed that the horizontal displacement of a sloping seafloor did not change three classifications of pressure changes at sensors in S-Net computed from the fault model near the Kurile trench. Nonetheless, we should notice that this horizontal displacement of a sloping seafloor becomes important when the tsunami heights and inundations along the coast are numerically computed.
Real observation of pressure at ocean bottom sensors in the earthquake source area includes dynamic pressure changes associated with seismic and hydro-acoustic waves [33,34]. Therefore, we need to filter those waves from the original observed pressure data. In 2016, the Off-Mie earthquake (Mw 6.0) occurred at the plate interface along the Nankai trough where the Dense Oceanfloor Network System for Earthquakes and Tsunamis (DONET) was installed. Several sensors in DONET were located above the source area and observed pressure changes due to the earthquake. The seismic, hydro-acoustic, and tidal waves were successfully eliminated from the original data to produce the pressure changes due to the tsunami and co-seismic displacement [35,36]. When the NIED opens observed pressure data at sensors in the S-net, filtered pressure data will hopefully be provided in real-time. Otherwise, we need to eliminate those perturbations, which are not related to tsunami and co-seismic displacement, from the original data to use our technique.
Once the filtered pressure data at sensors in S-net are available in real time, we can estimate the source area (the uplifted area) and the magnitude of the earthquake using a time window of 500 s after the earthquake. As the classification of observed pressure data does not need more than 1 min, it takes about 600 s (10 min) after the earthquake to estimate them. We do not need a numerical tsunami simulation or other sophisticated techniques but only the classification of observed pressure data into three types. Although our technique is easy to operate, we still need several steps, such as dissemination, to use those results for actual tsunami disaster mitigation.

8. Conclusions

We developed a near-real time tsunami source estimation technique using ocean bottom pressure data observed from the sensors in S-net. The pressure waveforms of the sensors in S-net were computed for 64 fault models with a magnitude ranging between M8.0 and M8.8. The pressure waveforms within a time window of 500 s were classified into three types. Type 1 pressure waveforms were characterized by decreased pressure that remained low. Sensors exhibiting characteristic waveforms of Type 1 were located inside the co-seismic uplift area or the tsunami source area. For Type 2, a pressure waveform characteristic was that one up-pulse of wave was within the time window. Sensors exhibiting characteristic waveforms of Type 2 were located at the edge of the co-seismic uplift area or immediately outside the area. The other pressure waveforms were classified into Type 3. Sensors exhibiting waveforms of Type 3 were located away from the uplift area. Subsequently, we developed a method to estimate the uplift area using those three classifications of pressure waveforms from the sensors in S-net. Based on this technique, we developed a method to estimate earthquake magnitude from the estimated uplift area using the regression line between the magnitude and the logarithm of the uplift area, i.e., Equation (7).
We applied those methods for two cases of previous large earthquakes, i.e., the 1952 Tokachi-oki earthquake (Mw8.2) and the 1968 Tokachi-oki earthquake (Mw8.1). The locations of the large computed uplift areas of the two earthquakes were well defined by the estimated ones. The magnitude of the 1952 Tokachi-oki earthquake from the estimated uplift area was 8.2, which was consistent with the moment magnitude of Mw8.2. The estimated magnitude of the 1968 Tokachi-oki earthquake was 7.9, which was slightly smaller than Mw8.1. Those results validated the near-real time tsunami source estimation developed in this study; therefore, it and can be used for near-real time tsunami forecasts.

Author Contributions

Y.T. designed the concept of the study, supervised it, edited and revised the manuscript. M.I. conducted investigation and computation, analyzed data, and wrote the original draft of the manuscript. Y.Y. provided software, supervised the study, and edited the manuscript. Y.T. also got research funds. All authors read and approved the manuscript.

Funding

This study was supported by the Ministry of Education, Culture, Sports, Science and Technology (MEXT) of Japan, under its Earthquake and Volcano Hazards Observation and Research Program and JSPS KAKENHI Grant Number 18H03819.

Acknowledgments

We thank three anonymous reviewers for helpful comments to improve the manuscript. We also thank Editage (www.editage.jp) for English language editing.

Conflicts of Interest

The authors declare no conflict of interest.

Appendix A

Estimation procedures for uplifted areas.
To determine the uplifted area systematically from the three classification types, we performed the following five procedures.
(1) Sensors observing Type-1 waveforms were connected to create a polygon where some Type-1 sensors may be located within (as shown in Figure A1).
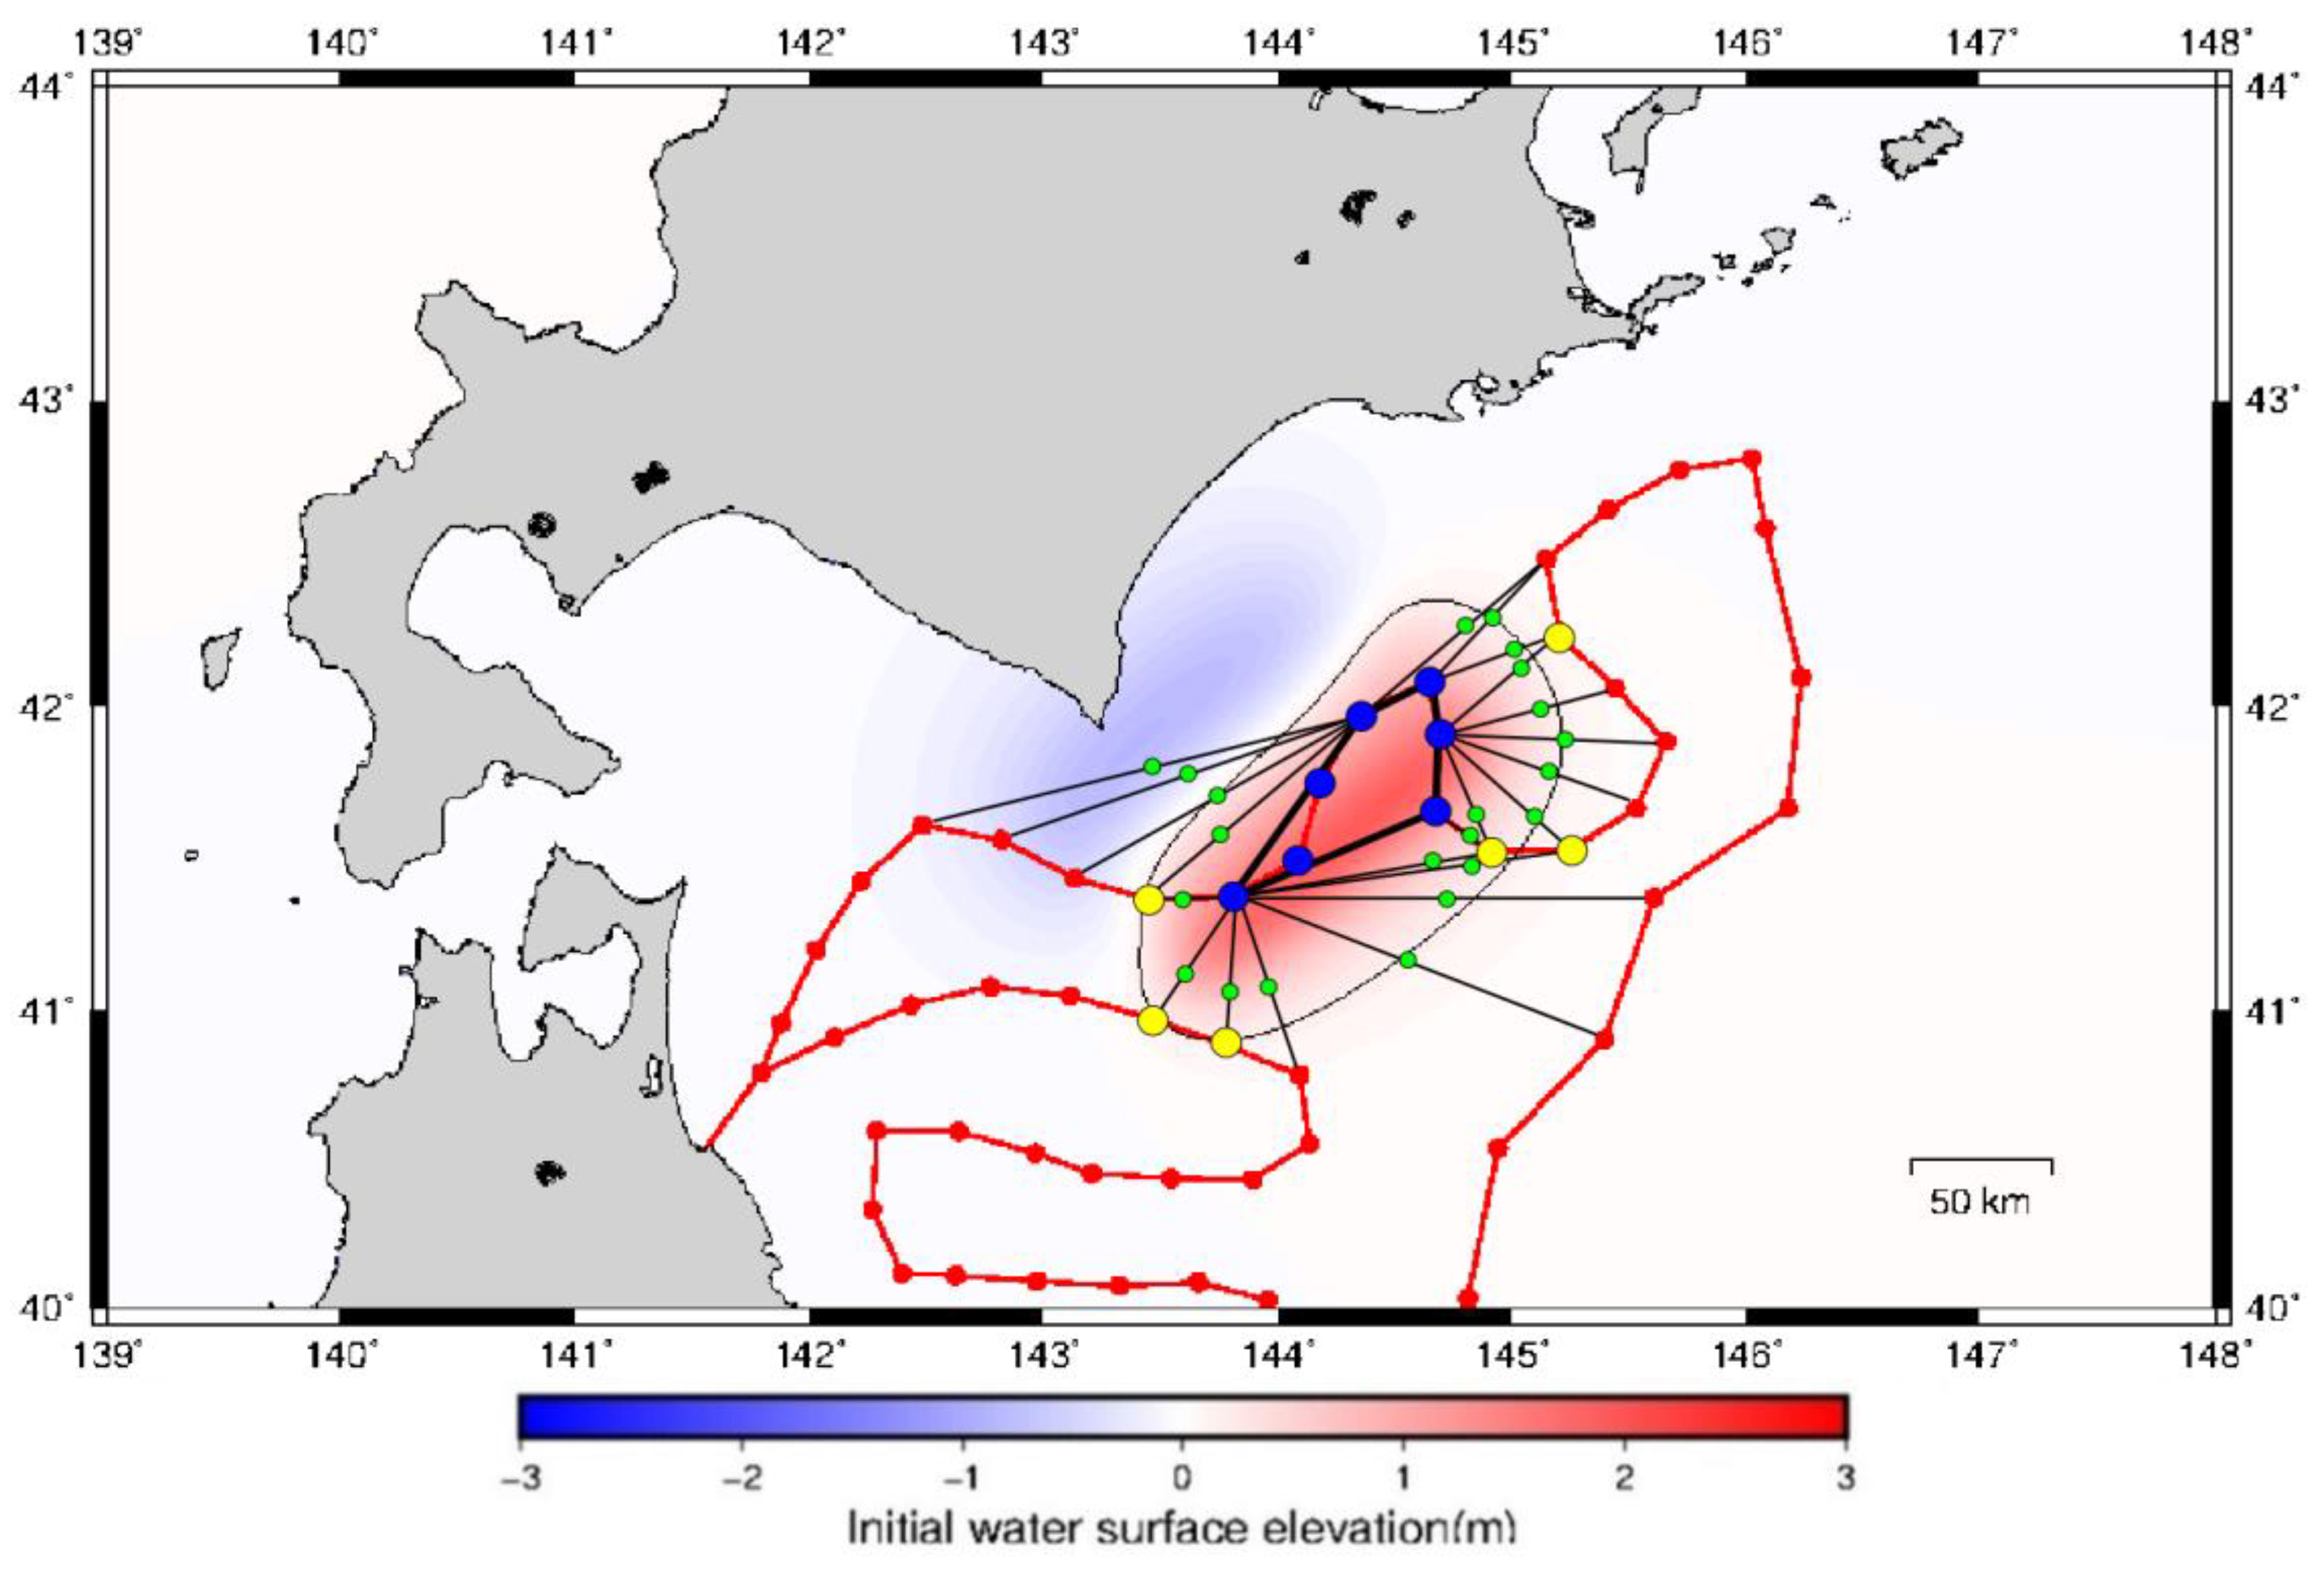
(2) For each segment of the polygon, the closest sensor was chosen and connected to the two sensors at the edge of the segment to create a triangle (as shown in Figure A2).
(3) The other sensor that is closest to the sensors at the edges of the polygon (blue dots) was chosen and connected to create a triangle without crossing the segments of the other triangles and polygon. This was performed repeatedly until the sensors at the edges of the polygon (blue dots) were surrounded by the triangles completely (as shown in Figure A2).
(4) For segments connected to Type-2 sensors (yellow dots), green dots were placed at 2/3 the distance from the edge of the polygon (see Figure A3). For segments connected to Type-3 sensors (red dots), green dots were placed at the center of the segment.
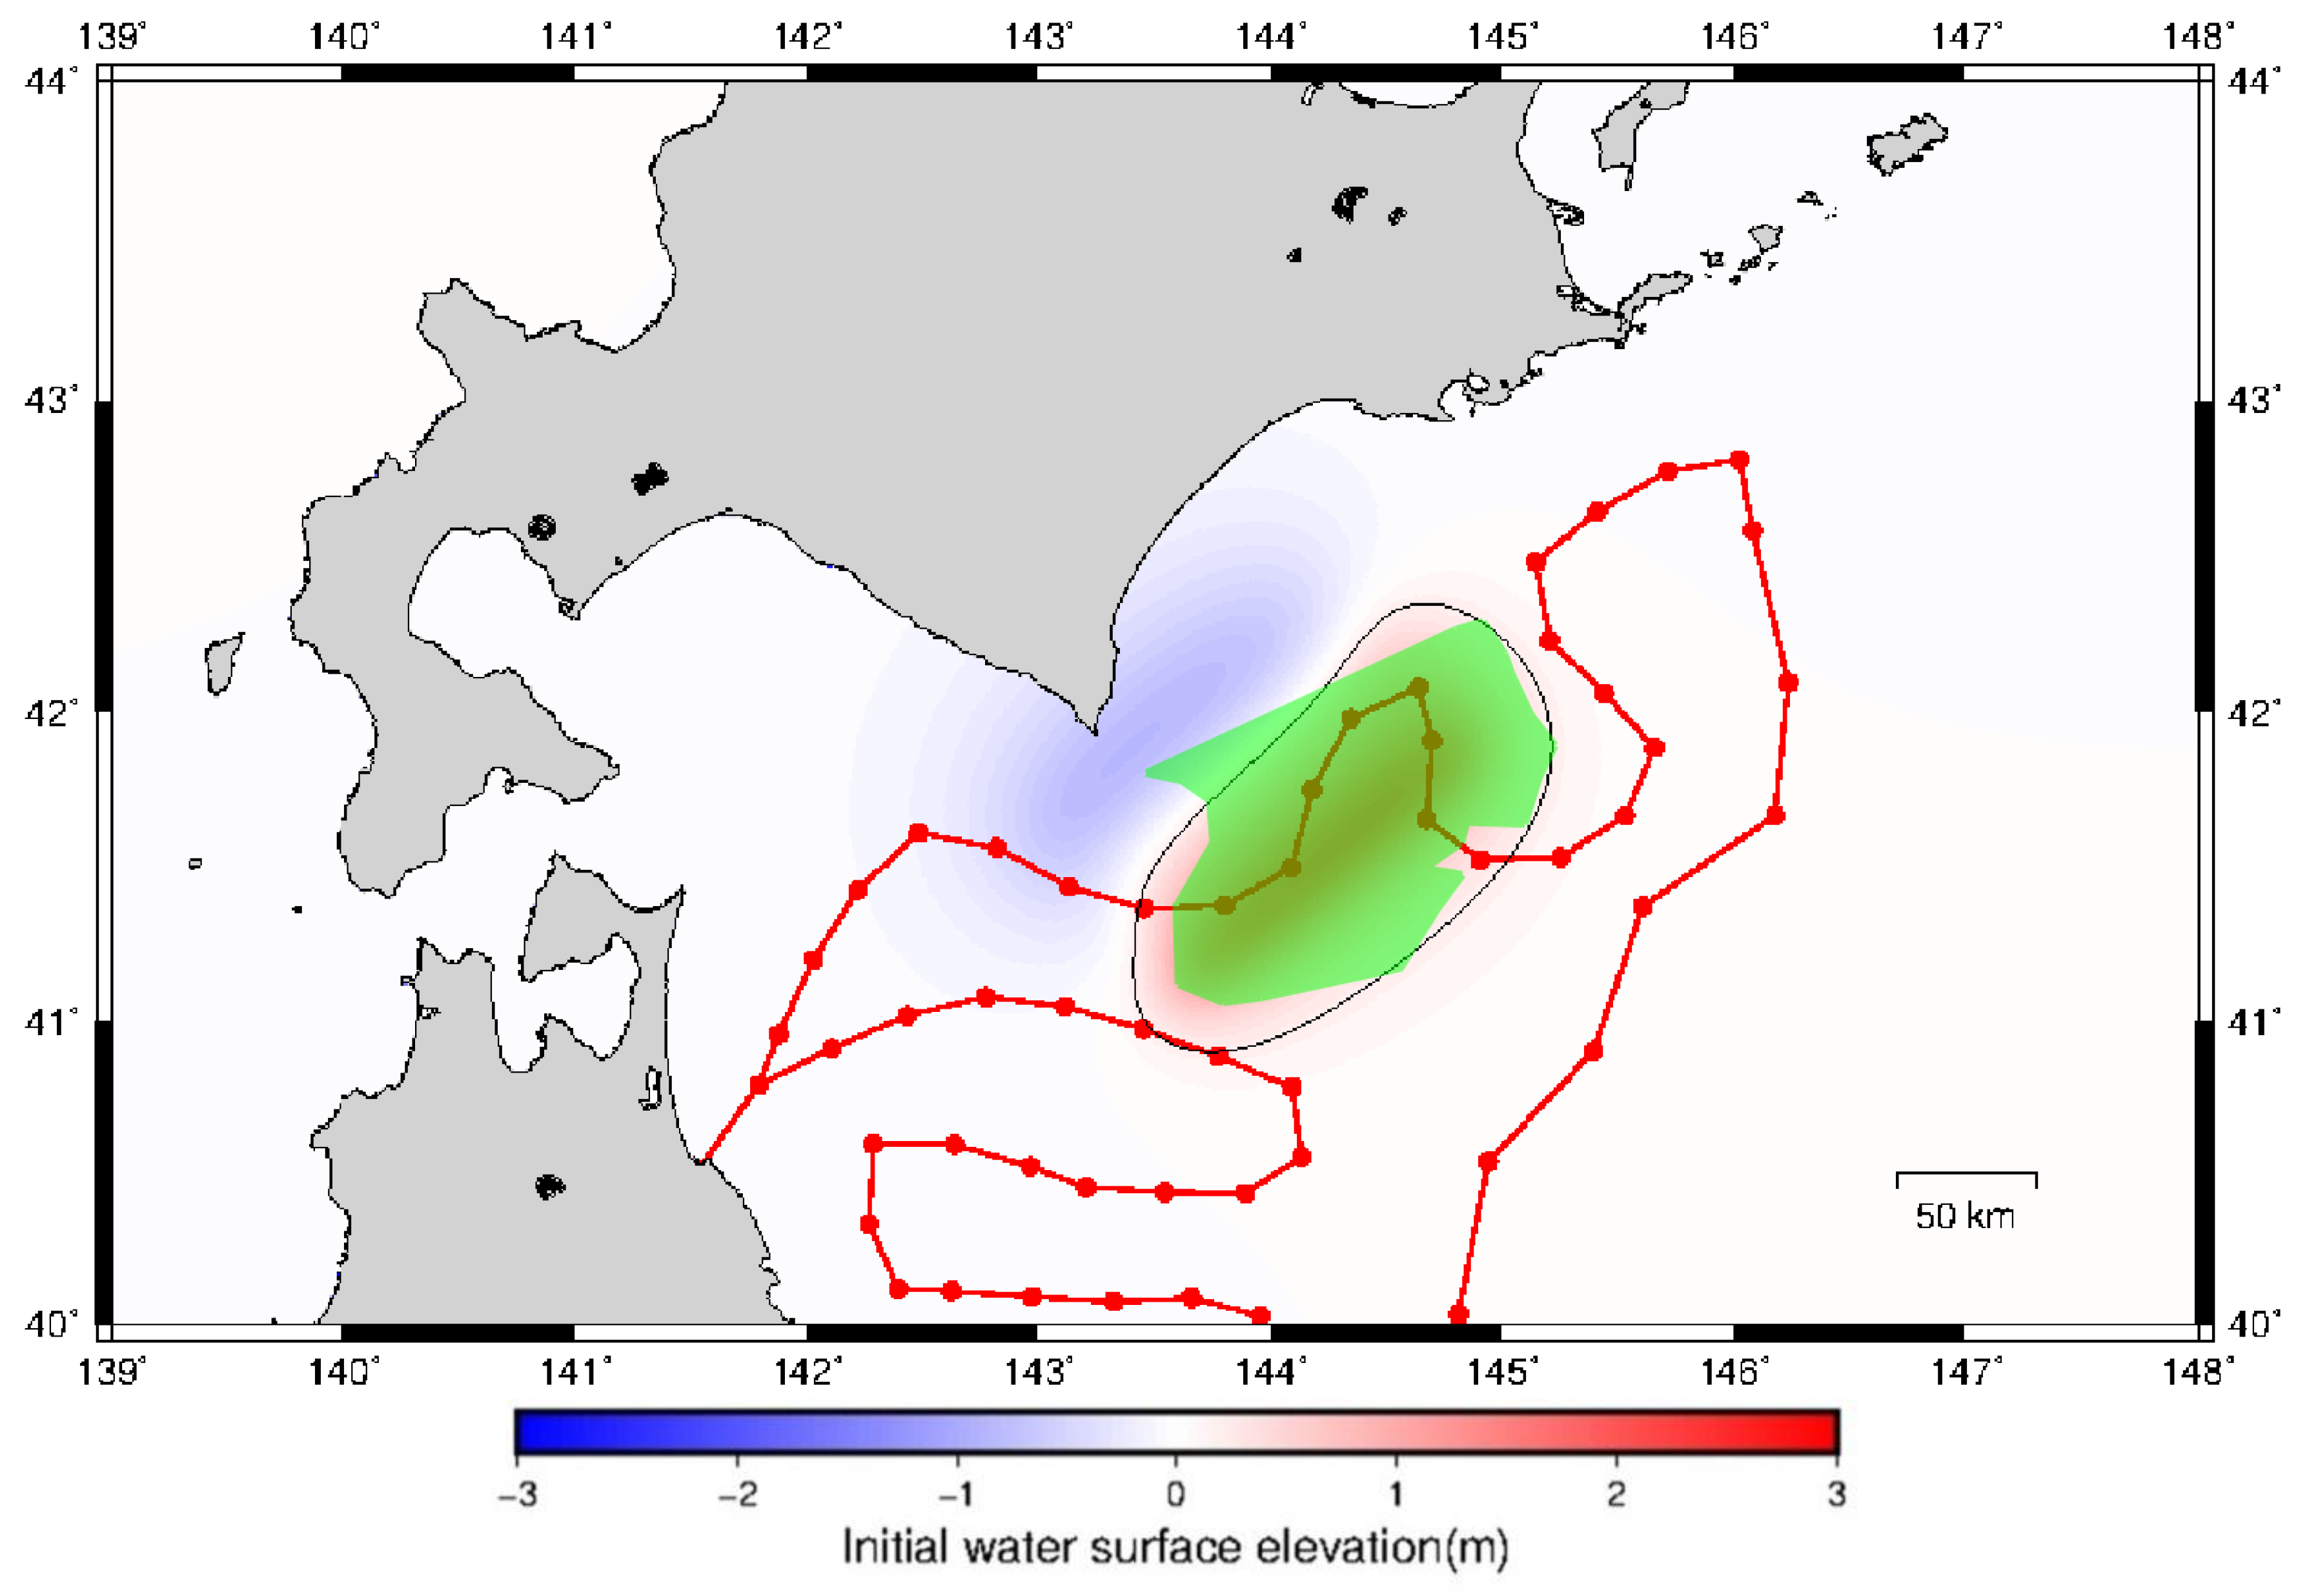
(5) Finally, the green dots were connected to determine the uplift area of the initial surface deformation due to a large earthquake (as shown in Figure A4).
Figure A1. First step of the uplift area estimation using the classification results in Figure 5. Blue dots, representing sensors exhibiting Type-1 waveforms, are connected to create a polygon. Colors red and blue indicate the initial surface elevation computed from the fault model.
Geosciences 09 00310 g0a1
Figure A2. Second step of the uplift area estimation using the classification results in Figure 5. Sensors surrounding the polygon in Figure 6 are connected to create many triangles, as described in Section 5.3. Colors red and blue indicate the initial surface elevation computed from the fault model.
Geosciences 09 00310 g0a2
Figure A3. Third step of the uplift area estimation using the classification results in Figure 5. Green dots, representing edges of the uplift area, are defined in each segment between the sensors at the polygon and the surrounding sensors. Colors red and blue indicate the initial surface elevation computed from the fault model.
Geosciences 09 00310 g0a3
Figure A4. Estimated uplift area using the classification results in Figure 5. Green dots in Figure A3, representing edges of the uplift area, are connected to define the uplift area, i.e., the shaded green area. Colors red and blue indicate the initial surface elevation computed from the fault model.
Geosciences 09 00310 g0a4

References

  1. Mori, N.; Takahashi, T. The 2011 Tohoku earthquake tsunami joint survey group Nationwide post event survey and analysis of the 2011 Tohoku earthquake tsunami. Coast. Eng. J. 2012, 54, 1250001. [Google Scholar] [CrossRef]
  2. Ozaki, T. Outline of the 2011 off the Pacific coast of Tohoku earthquake (Mw 9.0)—Tsunami warnings/advisories and observations. Earth Planets Space 2011, 63, 827–830. [Google Scholar] [CrossRef]
  3. The Fire and Disaster Management Agency. Damage Status of the 2011 off the Pacific Coast of Tohoku Earthquake (as of 7 March 2014). 2014. Available online: https://www.fdma.go.jp/disaster/higashinihon/assets/jishin149.pdf (accessed on 7 March 2014). (In Japanese).
  4. Kamigaichi, O. Tsunami forecasting and warning, in Extreme Environmental Events. In Complexity in Forecasting and Early Warning; Meyers, R.A., Ed.; Springer: New York, NY, USA, 2001. [Google Scholar]
  5. Uehira, K. Ocean Bottom Seismic and Tsunami Network along the Japan Trench. J. Soc. Instrum. Control Eng. 2014, 53, 477–481. (In Japanese) [Google Scholar] [CrossRef]
  6. Kanazawa, T. Japan Trench earthquake and tsunami monitoring network of cable-linked 150 ocean bottom observatories and its impact to earth disaster science. In Proceedings of the 2013 IEEE International Underwater Technology Symposium (UT), Tokyo, Japan, 5–8 March 2013; pp. 1–5. [Google Scholar]
  7. Tsushima, H.; Hino, R.; Fujimoto, H.; Tanioka, Y.; Imamura, F. Near-field tsunami forecasting from cabled ocean bottom pressure data. J. Geophys. Res. Space Phys. 2009, 114, 06309. [Google Scholar] [CrossRef]
  8. Tsushima, H.; Hino, R.; Tanioka, Y.; Imamura, F.; Fujimoto, H. Tsunami waveform inversion incorporating permanent seafloor deformation and its application to tsunami forecasting. J. Geophys. Res. Space Phys. 2012, 117. [Google Scholar] [CrossRef]
  9. Yamamoto, N.; Aoi, S.; Hirata, K.; Suzuki, W.; Kunugi, T.; Nakamura, H. Multi-index method using offshore ocean-bottom pressure data for real-time tsunami forecast. Earth Planets Space 2016, 68, 57. [Google Scholar] [CrossRef]
  10. Maeda, T.; Obara, K.; Shinohara, M.; Kanazawa, T.; Uehira, K. Successive estimation of a tsunami wavefield without earthquake source data: A data assimilation approach toward real-time tsunami forecasting. Geophys. Res. Lett. 2015, 42, 7923–7932. [Google Scholar] [CrossRef]
  11. Tanioka, Y. Tsunami Simulation Method Assimilating Ocean Bottom Pressure Data near a Tsunami Source Region. Pageoph. Top. Vol. 2018, 175, 197–205. [Google Scholar] [CrossRef]
  12. Tanioka, Y.; Gusman, A.R. Near-field tsunami inundation forecast method assimilating ocean bottom pressure data: A synthetic test for the 2011 Tohoku-oki tsunami. Phys. Earth Planet. Inter. 2018, 283, 82–91. [Google Scholar] [CrossRef]
  13. Hirata, K.; Geist, E.; Satake, K.; Tanioka, Y.; Yamaki, S. Slip distribution of the 1952 Tokachi-Oki earthquake (M8.1) along the Kuril Trench deduced from tsunami waveform inversion. J. Geophys. Res. Space Phys. 2003, 108, 2196. [Google Scholar] [CrossRef]
  14. Satake, K. Inversion of tsunami waveforms for the estimation of heterogeneous fault motion of large submarine earthquakes: The 1968 Tokachi-oki and 1983 Japan Sea earthquakes. J. Geophys. Res. Space Phys. 1989, 94, 5627. [Google Scholar] [CrossRef]
  15. Tanioka, Y.; Satake, K.; Hirata, K. Recurrence of recent large earthquakes along the southernmost Kurile-Kamchatka subduction zone. In Volcanism and Subduction: The Kamchatka Region; Eichelberger, J., Gordeev, E., Izbekov, P., Kasahara, M., Lees, J., Eds.; American Geophysical Union: Washington, DC, USA, 2007; Volume 172, pp. 145–152. [Google Scholar]
  16. Tanioka, Y.; Ruff, L.; Satake, K. The Sanriku-Oki, Japan, Earthquake of 28 December, 1994 (Mw7.7): Rupture of a different asperity from a previous earthquake. Geophys. Res. Lett. 1996, 23, 1465–1468. [Google Scholar] [CrossRef]
  17. Tanioka, Y.; Hirata, K.; Hino, R.; Kanazawa, T. Slip distribution of the 2003 Tokachi-oki earthquake estimated from tsunami waveform inversion. Earth Planets Space 2004, 56, 373–376. [Google Scholar] [CrossRef] [Green Version]
  18. Tanioka, Y.; Nishimura, Y.; Hirakawa, K.; Imamura, F.; Abe, I.; Abe, Y.; Shindou, K.; Matsutomi, H.; Takahashi, T.; Imai, K.; et al. Tsunami run-up heights of the 2003 Tokachi-oki earthquake. Earth Planets Space 2004, 56, 359–365. [Google Scholar] [CrossRef] [Green Version]
  19. Nanayama, F.; Satake, K.; Furukawa, R.; Shimokawa, K.; Atwater, B.F.; Shigeno, K.; Yamaki, S. Unusually large earthquakes inferred from tsunami deposits along the Kuril trench. Nature 2003, 424, 660–663. [Google Scholar] [CrossRef] [PubMed]
  20. Hirakawa, K.; Nakamura, Y. Mega-Tsunamis since last 6500 years along the Pacific Coast of Hokkaido, Special Issue. Chikyu Mon. 2005, 49, 173–180. (In Japanese) [Google Scholar]
  21. Sawai, Y.; Kamataki, T.; Shishikura, M.; Nasu, H.; Okamura, Y.; Satake, K.; Thomson, K.H.; Matsumoto, D.; Fujii, Y.; Komatsubara, J.; et al. Aperiodic recurrence of geologically recorded tsunamis during the past 5500 years in eastern Hokkaido, Japan. J. Geophys. Res. 2009, 114, B01319. [Google Scholar] [CrossRef]
  22. Satake, K.; Nanayama, F.; Yamaki, S. Fault models of unusual tsunami in the 17th century along the Kuril trench. Earth Planets Space 2008, 60, 925–935. [Google Scholar] [CrossRef] [Green Version]
  23. Ioki, K.; Tanioka, Y. Re-estimated fault model of the 17th century great earthquake off Hokkaido using tsunami deposit data. Earth Planet. Sci. Lett. 2016, 433, 133–138. [Google Scholar] [CrossRef]
  24. Utsu, T.; Seki, A. Relation between the area of aftershock region and the energy of the Main Shock (in Japanese). Zisin J. Seismol. Soc. Japan 2nd Ser. 1955, 7, 233–240. [Google Scholar]
  25. Wells, L.; Coppersmith, K.J. New empirical relationships among magnitude, rupture length, rupture width, rupture area, and surface displacement. Bull. Seismol. Soc. Am. 1994, 84, 974–1002. [Google Scholar]
  26. Somerville, P.; Irikura, K.; Graves, R.; Sawada, S.; Wald, D.; Abrahamson, N.; Iwasaki, Y.; Kagawa, T.; Smith, N.; Kowada, A. Characterizing Crustal Earthquake Slip Models for the Prediction of Strong Ground Motion. Seism. Res. Lett. 1999, 70, 59–80. [Google Scholar] [CrossRef]
  27. Blaser, L.; Krüger, F.; Ohrnberger, M.; Scherbaum, F. Scaling Relations of Earthquake Source Parameter Estimates with Special Focus on Subduction Environment Scaling Relations of Earthquake Source Parameter Estimates with Focus on Subduction Environment. Bull. Seismol. Soc. Am. 2010, 100, 2914–2926. [Google Scholar] [CrossRef]
  28. Satake, K.; Hirata, K.; Yamaki, S.; Tanioka, Y. Re-estimation of tsunami source of the 1952 Tokachi-oki earthquake. Earth Planets Space 2006, 58, 535–542. [Google Scholar] [CrossRef] [Green Version]
  29. Kita, S.; Okada, T.; Hasegawa, A.; Nakajima, J.; Matsuzawa, T. Anomalous deepening of a seismic belt in the upper-plane of the double seismic zone in the Pacific slab beneath the Hokkaido corner: Possible evidence for thermal shielding caused by subducted forearc crust materials. Earth Planet. Sci. Lett. 2010, 290, 415–426. [Google Scholar] [CrossRef]
  30. Okada, Y. Surface deformation due to shear and tensile faults in a half-space. Bull. Seismol. Soc. Am. 1985, 75, 1135–1154. [Google Scholar]
  31. Satake, K. Linear and nonlinear computations of the 1992 Nicaragua earthquake tsunami. Pure Appl. Geophys. 1995, 144, 455–470. [Google Scholar] [CrossRef] [Green Version]
  32. Tanioka, Y.; Satake, K. Tsunami generation by horizontal displacement of ocean bottom. Geophys. Res. Lett. 1996, 23, 861–864. [Google Scholar] [CrossRef] [Green Version]
  33. Saito, T.; Tsushima, H. Synthesizing ocean bottom pressure records including seismic wave and tsunami contributions: Toward realistic tests of monitoring systems. J. Geophys. Res. Solid Earth 2016, 121, 8175–8195. [Google Scholar] [CrossRef]
  34. Nosov, M.; Karpov, V.; Kolesov, S.; Sementsov, K.; Matsumoto, H.; Kaneda, Y. Relationship between pressure variations at the ocean bottom and the acceleration of its motion during a submarine earthquake. Earth Planets Space 2018, 70, 100. [Google Scholar] [CrossRef]
  35. Wallace, L.M.; Araki, E.; Saffer, D.; Wang, X.; Roesner, A.; Kopf, A.; Nakanishi, A.; Power, W.; Kobayashi, R.; Kinoshita, C.; et al. Near-field observations of an offshore M w 6.0 earthquake from an integrated seafloor and subseafloor monitoring network at the Nankai Trough, southwest Japan. J. Geophys. Res. Solid Earth 2016, 121, 8338–8351. [Google Scholar] [CrossRef]
  36. Kubota, T.; Suzuki, W.; Nakamura, T.; Chikasada, N.Y.; Aoi, S.; Takahashi, N.; Hino, R. Tsunami source inversion using time-derivative waveform of offshore pressure records to reduce effects of non-tsunami components. Geophys. J. Int. 2018, 215, 1200–1214. [Google Scholar] [CrossRef]
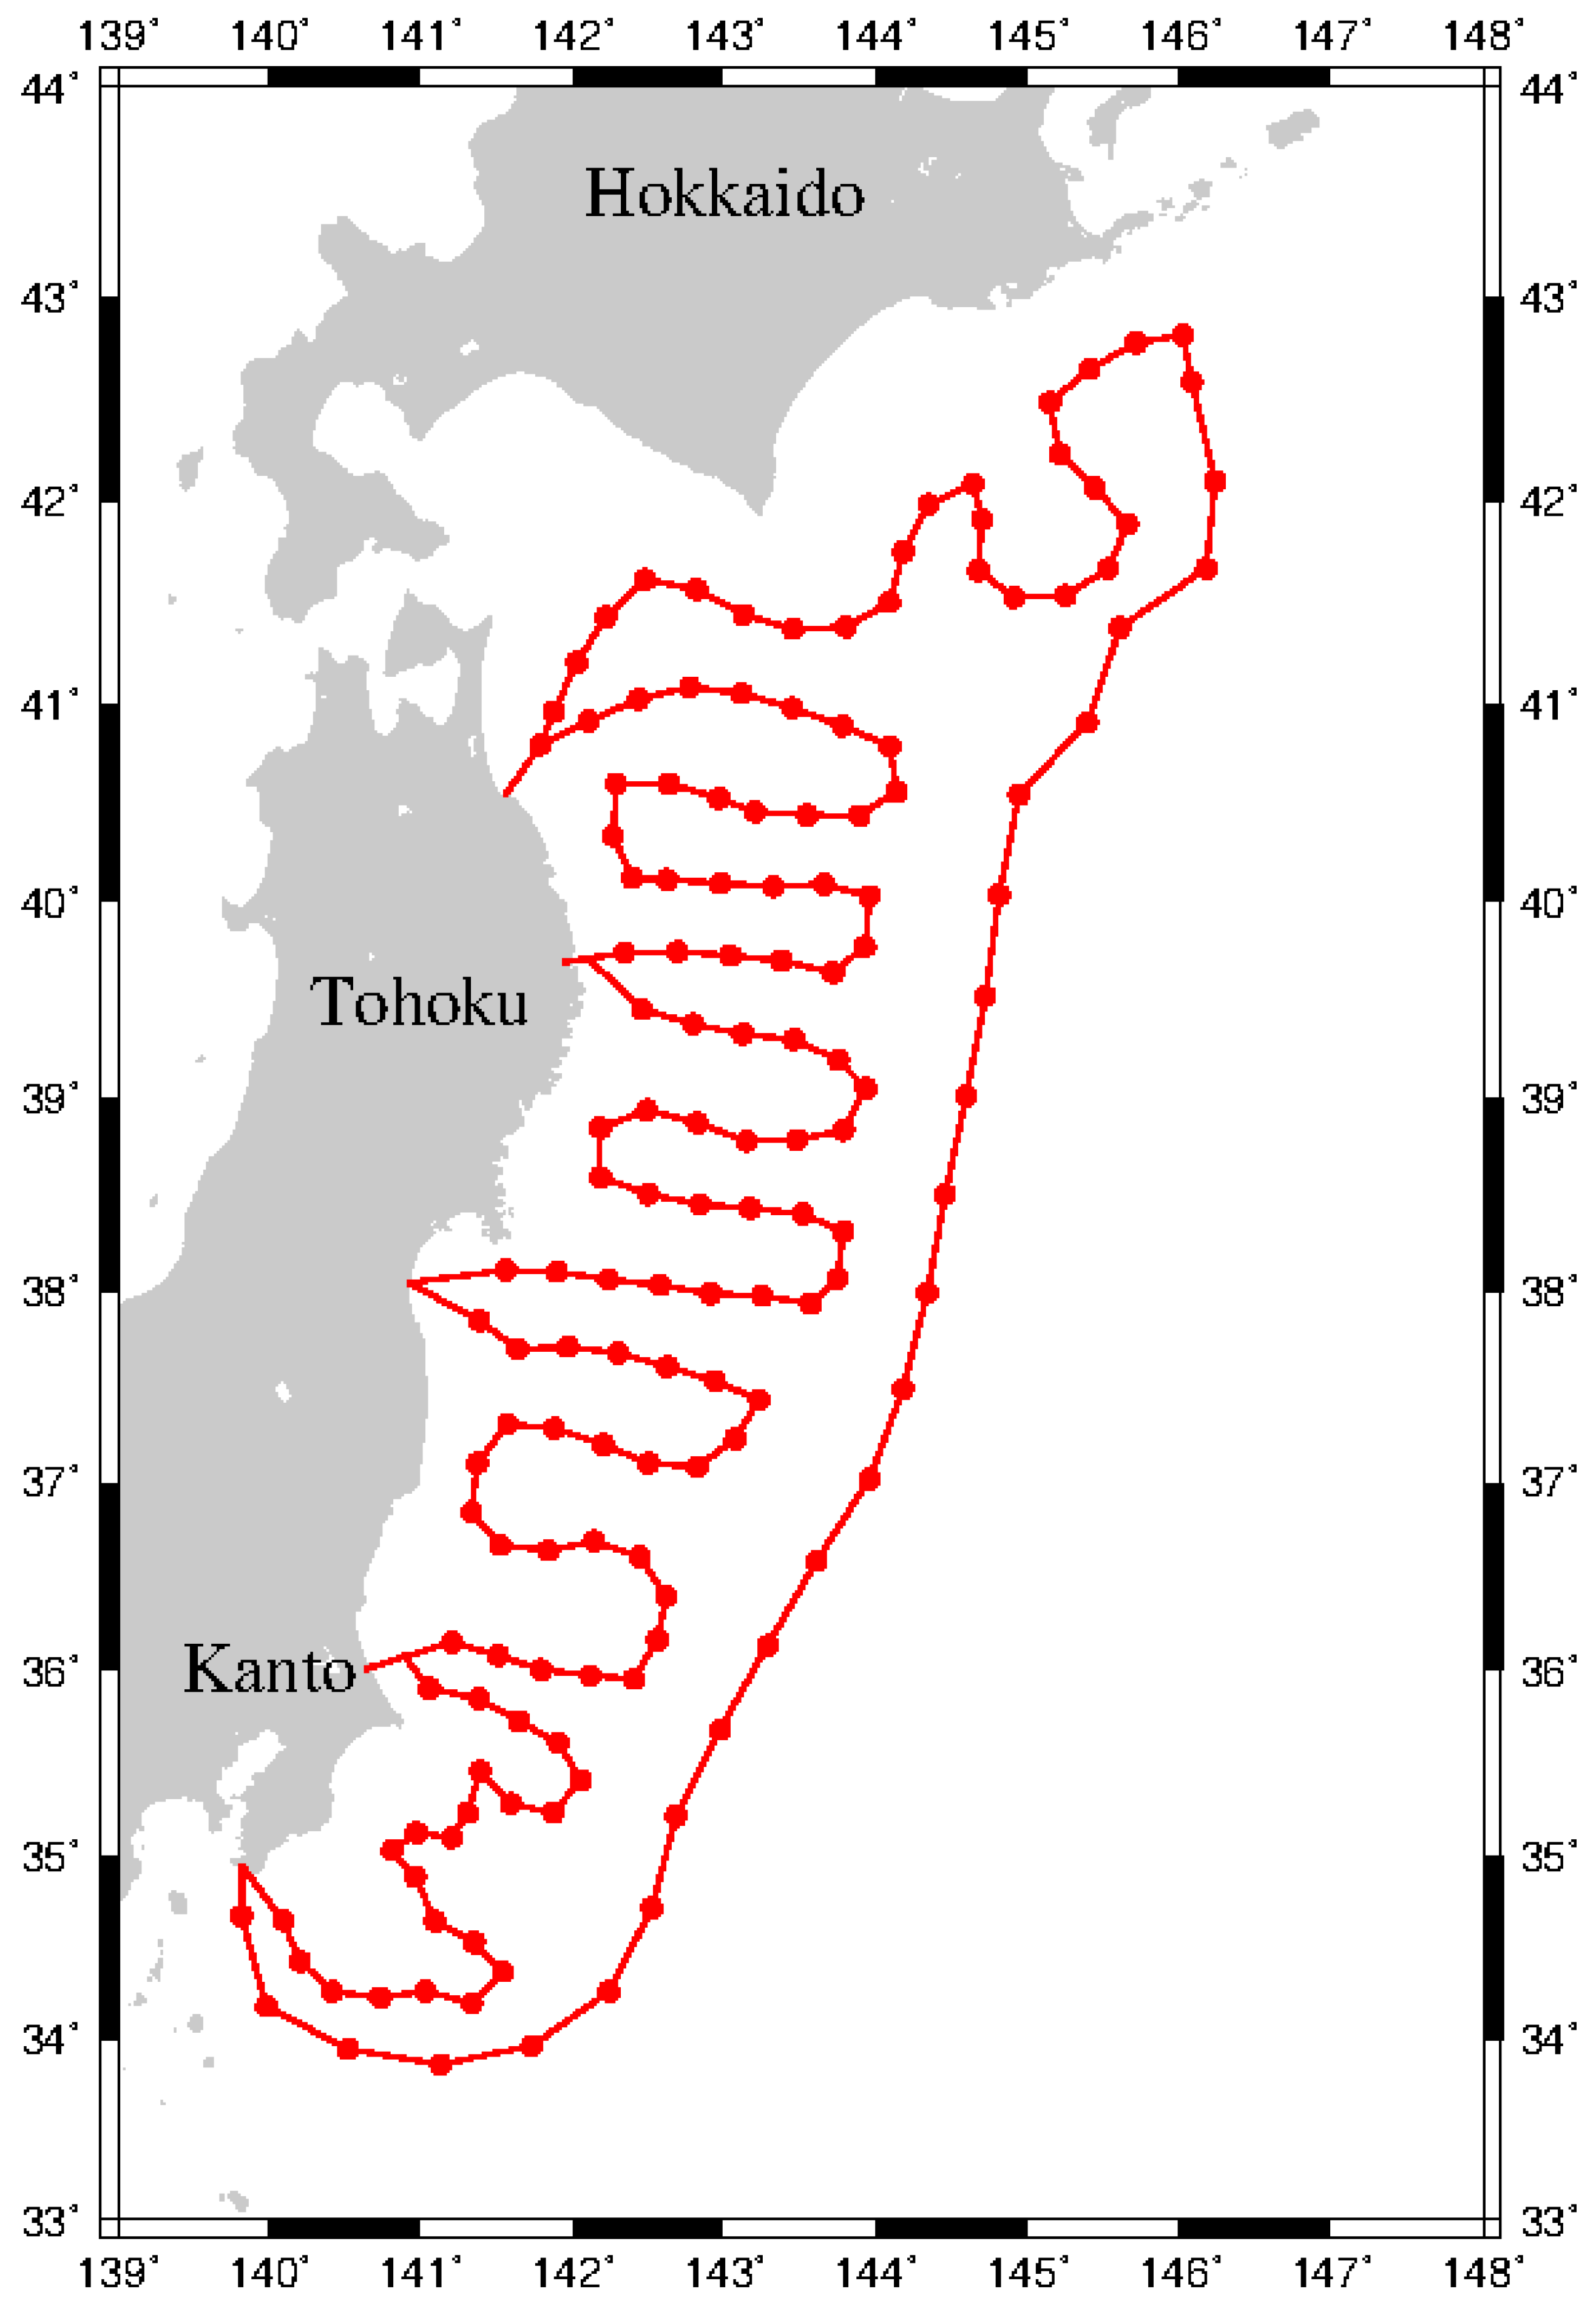
Figure 1. Map showing the locations of ocean bottom pressure sensors (red dots) in S-net. Red lines represent cables connecting the sensors.
Geosciences 09 00310 g001
Figure 2. Source areas of the great interplate earthquakes, the 17th century great earthquake (green), the 1952 Tokachi-oki earthquake (blue), the 1968 Tokachi-oki earthquake (blue), the 1973 Nemuro-oki earthquake (blue), the 1998 Sanriku-oki earthquake (black), and the 2003 Tokachi-oki earthquake (black). Red dots represent sensors in S-net.
Geosciences 09 00310 g002
Figure 3. Locations of various fault models defined using two empirical relationships, i.e., Equations (4) and (5), suggested by Blaser et al. [27]. Rectangular faults for magnitudes (a) M8.0, (b) M8.2, (c) M8.4, (d) M8.5, (e) M8.6, and (f) M8.8.
Geosciences 09 00310 g003
Figure 4. Schematic illustrations of (a) tsunami generation and propagation (modified from Tsushima et al. [8]) and (b) the observed pressure waveforms at A, B, C, D, E in the left figure. The green shaded part is the time window, T, to estimate the source area. The waveforms at A and B are classified as Type 1. Those at C and D are classified as Type 2. The waveform at E is classified as Type 3.
Geosciences 09 00310 g004
Figure 5. Example of classification results for the fault model, M8.0. (a) Map showing the classification results. Blue dots represent sensors with pressure waveforms classified as Type 1. Yellow dots represent sensors classified as Type 2. Red dots are classified as Type 3. The rectangle represents the fault model of M8.8. (b) Pressure waveforms classified as Type 1. (c) Pressure waveforms classified as Type 2. Green shaded parts represent the time window of the near-real time source estimation, i.e., 500 s.
Geosciences 09 00310 g005
Figure 6. Comparison of computed initial surface elevation and the classification results in Figure 5. Blue dots, representing sensors exhibiting Type-1 waveforms, are connected to create a polygon. Colors red and blue indicate the initial surface elevation computed from the fault model in Figure 5.
Geosciences 09 00310 g006
Figure 7. Comparison of computed uplift areas from 64 fault models and estimated uplift areas from the classification of pressure waveforms observed from the sensors in S-net.
Geosciences 09 00310 g007
Figure 8. Relationship between the estimated uplift areas for 64 fault models and the earthquake magnitudes. The black line is a regression line (Equation (7)). The two red lines indicate the standard deviation from the regression line. The two stars indicate the results of case studies for the 1952 and 1968 Tokachi-oki earthquakes.
Geosciences 09 00310 g008
Figure 9. Result of case study for the 1952 Tokachi-oki earthquake. (a) Comparison of the estimated uplift area in this study (a solid black line) and the computed initial surface elevation, red (uplift) and blue (subsidence). (b) Pressure waveforms classified as Type 1. (c) Pressure waveforms classified as Type 2. Shaded green parts represent the time window of the near-real time source estimation, i.e., 500 s.
Geosciences 09 00310 g009
Figure 10. Result of case study for the 1968 Tokachi-oki earthquake. (a) Comparison of the estimated uplift area in this study (a solid black line) and the computed initial surface elevation, red (uplift) and blue (subsidence). (b) Pressure waveforms classified as Type 1. (c) Pressure waveforms classified as Type 2. Shaded green parts represent the time window of the near-real time source estimation, i.e., 500 s.
Geosciences 09 00310 g010
Table 1. Fault parameters, computed uplift areas, and estimated uplift areas for fault models defined using the empirical relationship between magnitude and aftershock area suggested by Utsu and Seki [24].
Magnitude (M)Length (km)Width (km)Latitude (°)Longitude (°)Depth (km)Dip (°)Slip (m)Computed × 103 (km2)Estimate × 103 (km2)
8.01407042.22145.5617.15213.614.29.9
8.01407041.70146.027.321113.69.710.8
8.01407041.88144.8720.55143.613.711.0
8.01407041.34145.356.849113.69.610.2
8.01407041.50144.1620.83133.613.510.9
8.01407041.00144.726.70773.610.310.2
8.220010041.70146.027.32112.123.5919.115.3
8.220010041.34145.356.8498.463.5918.418.0
8.220010041.00144.726.7077.443.5918.217.3
8.425012541.70146.027.32111.974.629.528.4
8.425012541.34145.356.8498.894.628.127.8
8.528014041.70146.027.32110.815.1635.534.9
8.528014041.34145.356.8499.265.1635.331.0
8.631015541.70146.027.3219.765.943.836.0
8.631015541.34145.356.8499.655.944.740.9
Table 2. Fault parameters, computed uplift areas, and estimated uplift areas for fault models defined using the empirical relationship of magnitude and rupture area suggested by Wells and Coppersmith [25].
Magnitude (M)Length (km)Width (km)Latitude (°)Longitude (°)Depth (km)Dip (°)Slip (m)Computed × 103 (km2)Estimate × 103 (km2)
8.01547741.53146.014.7769.803.011.210.6
8.01547741.80145.1015.93313.393.014.811.8
8.01547741.26145.543.8718.633.010.910.0
8.01547741.51144.6216.04117.673.014.512.3
8.01547741.00145.104.13510.733.010.19.2
8.01547741.26144.1715.70010.733.014.211.1
8.01547740.70144.626.8455.903.010.511.8
8.220010041.34145.356.8498.83.617.517.8
8.220010041.00144.726.7077.13.616.716.3
8.425812941.70146.027.32112.14.328.724.8
8.425812941.34145.356.8498.454.326.722.8
8.425812941.00144.726.7078.184.326.721.5
8.529414741.70146.027.32111.34.737.433.4
8.529414741.34145.356.8498.774.735.226.8
8.633416741.70146.027.3219.995.144.536.3
8.633416741.34145.356.8499.595.146.334.7
Table 3. Fault parameters, computed uplift areas, and estimated uplift areas for fault models defined using the empirical relationship of magnitude and rupture area suggested by Somerville et al. [26].
Magnitude (M)Length (km)Width (km)Latitude (°)Longitude (°)Depth (km)Dip (°)Slip (m)Computed × 103 (km2)Estimate × 103 (km2)
8.01507541.53146.014.7769.803.29.69.5
8.01507541.80145.1015.93313.393.214.812.9
8.01507541.26145.543.8718.633.210.310.2
8.01507541.51144.6216.04117.673.213.912.0
8.01507541.00145.104.13510.733.210.610.6
8.01507541.26144.1715.70010.733.213.110.3
8.01507540.70144.626.8455.903.210.710.6
8.21889441.70146.027.32111.84.116.513.2
8.21889441.34145.356.8498.84.115.714.7
8.21889441.00144.726.7077.14.115.518.2
8.423811941.70146.027.32112.15.124.827.1
8.423811941.34145.356.8498.455.124.323.3
8.526613341.70146.027.32111.35.732.834.0
8.526613341.34145.356.8498.775.732.226.4
8.629814941.34145.356.8499.596.438.836.2
Table 4. Fault parameters, computed uplift areas, and estimated uplift areas for fault models defined using two empirical relationships: one between magnitude and rupture length and the other between magnitude and rupture width, suggested by Blaser et al. [27].
Magnitude (M)Length (km)Width (km)Latitude (°)Longitude (°)Depth (km)Dip (°)Slip (m)Computed × 103 (km2)Estimate × 103 (km2)
8.01326342.07145.5415.22917.104.311.110.8
8.01326341.53146.014.7769.804.37.79.6
8.01326341.80145.1015.93313.394.310.511.6
8.01326341.51144.6216.04117.674.311.112.8
8.01326341.00145.104.13510.734.37.69.6
8.01326341.26144.1715.70010.734.310.510.1
8.01326340.70144.626.8455.904.37.710.1
8.21707841.34145.356.8498.905.412.513.8
8.21707841.00144.726.7076.825.412.014.2
8.21707840.68144.0711.6147.975.413.614.5
8.42199541.70146.027.32111.626.919.318.6
8.42199541.34145.356.8498.126.918.418.8
8.42199541.00144.726.7076.756.917.818.0
8.524810641.70146.027.32111.707.727.323.4
8.524810641.34145.356.8498.117.723.623.3
8.628211741.70146.027.32110.568.728.929.3
8.628211741.34145.356.8499.808.728.929.1
8.836314541.70146.027.32112.3710.846.236.9