Article

Site Effect Assessment in Ulaanbaatar, Mongolia through Inversion Analysis of Microtremor H/V Spectral Ratios

by
Zorigt Tumurbaatar
1,*,
Hiroyuki Miura
1 and
Tsoggerel Tsamba
2
1
Department of Architecture, Hiroshima University, 1-4-1 Kagamiyama, Higashi-Hiroshima, Hiroshima 739-8527, Japan
2
Department of Civil Engineering, Mongolian University of Science and Technology, 8th khoroo, Baga toiruu 34, Ulaanbaatar 14191, Mongolia
*
Author to whom correspondence should be addressed.
Geosciences 2019, 9(5), 228; https://doi.org/10.3390/geosciences9050228
Submission received: 11 April 2019 / Revised: 13 May 2019 / Accepted: 14 May 2019 / Published: 17 May 2019

Abstract

:
Due to the population growth and urban sprawl in Ulaanbaatar city (UB), Mongolia, hazard and risk analysis for future earthquakes have become an important issue for disaster mitigation planning. Evaluation of a site effect is one of the essential parts of the earthquake hazard estimation in this area. The site effect can be evaluated by site amplifications calculated from shear-wave velocity (VS) models including from bedrock to surface layers. However, it is difficult to assess the pattern of the site effects in UB because shallow mostly up to 15 m and a small number of investigated VS models are available in previous studies. In this study, the VS models are estimated using microtremor data at 50 sites and inversion analysis is applied to the observed data in order to evaluate site amplifications in UB. In particular, the joint inversion technique based on a diffuse field approach is applied to estimate the VS structures at three sites using the observed horizontal-to-vertical (H/V) spectral ratios and surface wave phase velocities obtained by Odonbaatar (2011). The rest of the sites are estimated by the single inversion technique using the observed microtremor H/V spectral ratios considering the results of the joint inversions. The seismic microzoning in UB is performed based on the site amplifications computed from the inverted VS models to characterize the pattern of seismic hazard. The result shows the largest site amplification zone is computed along the Tuul river in the southeastern part of UB.

1. Introduction

Mongolia has been one of the most seismically active intracontinental regions in the world with four large earthquakes with the magnitudes of around 8 along with their active faults in the western part of the country during the last century [1]. Compared with western Mongolia, central Mongolia including Ulaanbaatar’s region (UB) is considered a relatively low seismically active zone. However, according to the previous investigation [1], there are several active faults such as Hustai, Gunj, and Emeelt faults. In particular, the Emeelt fault earthquake with the estimated maximum magnitude of 7 [2] has been expected to produce great impact on the UB region because the fault is located at only around 20 km from UB to the west–southwest direction (see Figure 1).
In order to consider the disaster mitigation planning for such large earthquakes, the assessments of ground shaking intensities and building damage for scenario earthquakes are indispensable. Generally, the ground shaking intensity is determined by evaluating the source effect, path effect and site effect. The evaluation of site effects is especially essential because the effect of surface soil can generate large ground motion amplification during the earthquakes. The increase of the amplitude of seismic shaking can produce severe damage to buildings and infrastructures accompanying a loss of lives. The UB basin located at the valley of Tuul river has 30 km length and 4 to 10 km width and is filled with alluvial deposits. According to borehole data and the geological map, the deposit thicknesses are around 10 to 80 m in most of the area, and the maximum depth is 120 m expected around the Tuul riverside [3,4]. Since the population of UB city has grown around three times in the last two decades, the number of building constructions and densities are highly increased, and new construction districts have been expanded to everywhere in the city area. Especially in the last six years, moderate and high-rise buildings have been constructed near the Tuul Riverside such as the Zaisan, Yarmagiin Guur, and Shine Yarmag areas (see Figure 1).
Odonbaatar [3] performed microtremor array observations at three sites in UB in order to identify the deep underground structures and estimated the three-dimensional (3D) UB basin model. He also simulated ground motions using the basin model to discuss the 3D effect on the surface ground motions. However, the detailed VS structures in UB have not been validated since he developed two layer models with surface and bedrock layers. Due to the recent project of the Japan International Cooperation Agency (JICA) in UB city [5], the results of downhole seismic method (PS-logging) investigations and Spectral Analysis of Surface Wave (SASW) surveys at around 40 sites were reported. Since the explorations were up to 30 m depth at the maximum, the intermediate and deeper VS structures have not been elucidated.
Microtremors (ambient noise of ground) analysis are a low-cost and convenient method to estimate site characterizations. For example, while horizontal motions are larger than vertical motion on the soft ground, both horizontal and vertical motions are similar to each other on the stiff ground. In particular, the Horizontal-to-Vertical (H/V) spectral ratio technique firstly proposed by Nakamura [6] has been utilized to evaluate the fundamental resonant frequency of grounds [7,8]. The microtremor H/V spectral ratio (MHVR) has also been used to estimate VS profiles by assuming that the microtremors are mainly composed of surface waves [9,10]. Recently, diffuse field assumption (DFA) has been proposed to understand MHVR by assuming a diffuse wavefield containing all types of elastic waves [11,12]. In this theory, MHVR can be numerically computed as the imaginary parts of Green’s functions, and the theoretical H/V ratio depends on underground layer thickness and elastic properties of soil. Hence the theory allowed for inverting VS profiles from MHVR [13,14,15,16]. One of the authors also examined the applicability of the DFA for the MHVR-based VS profiling and presented the validity of the technique for the site characterizations [17].
In this paper, we observe the microtremors at multiple sites in UB areas and apply the inversion technique to the MHVR in order to reveal the patterns of the VS profiles considering the observations in the previous studies such as Odonbaatar [3] and JICA’s report [5]. The estimated VS profiles and the site characteristics are discussed by comparing the existing borehole data, geological and terrain maps. Finally, the site amplification characteristics obtained from the estimated VS profiles are assessed by zoning the UB area.

2. Previous Studies for Site Characterizations in UB

In the UB area, around 5000 boreholes were explored by Russian and Mongolian research expeditions for geotechnical purpose before 1990. Although these data include some geotechnical information with laboratory tests, those data were surveyed at less than 10 m depth in most of the sites [18], and they did not include seismic velocity information.
In the previous study by Odonbaatar [3], this study hereafter is referred to as OD, the microtremor array observations were performed at three sites in UB (Site-1, -2 and -3 in Figure 1) to estimate the deep underground structures. Since the estimated profiles were developed to create the UB basin model, the shallow VS structures in the basin were not discussed in detail. Bedrock depth with the VS of 1600 to 1800 m/s was determined at 40 m to more than 100 m depending on the location.
In the JICA report, on the other hand, the VS profiles were determined by PS-loggings at four sites (UB_Bo_01 to 04 in Figure 1) and the SASW method at 37 sites (UB_01 to 36 in Figure 1) in the central UB area [5]. Since the depths of the VS profiles are less than 30 m and around 10 m at most sites, deeper VS structures have not been explored. They were never validated by other data sources such as MHVR. Furthermore, significant discrepancies between the VS profiles derived by these two techniques were found even at the same site, indicating the uncertainty of the techniques. For those reasons, we conduct the microtremor observations at UB and apply the inversion technique to the observed MHVRs to derive the VS profiles and evaluate the site amplification characteristics.

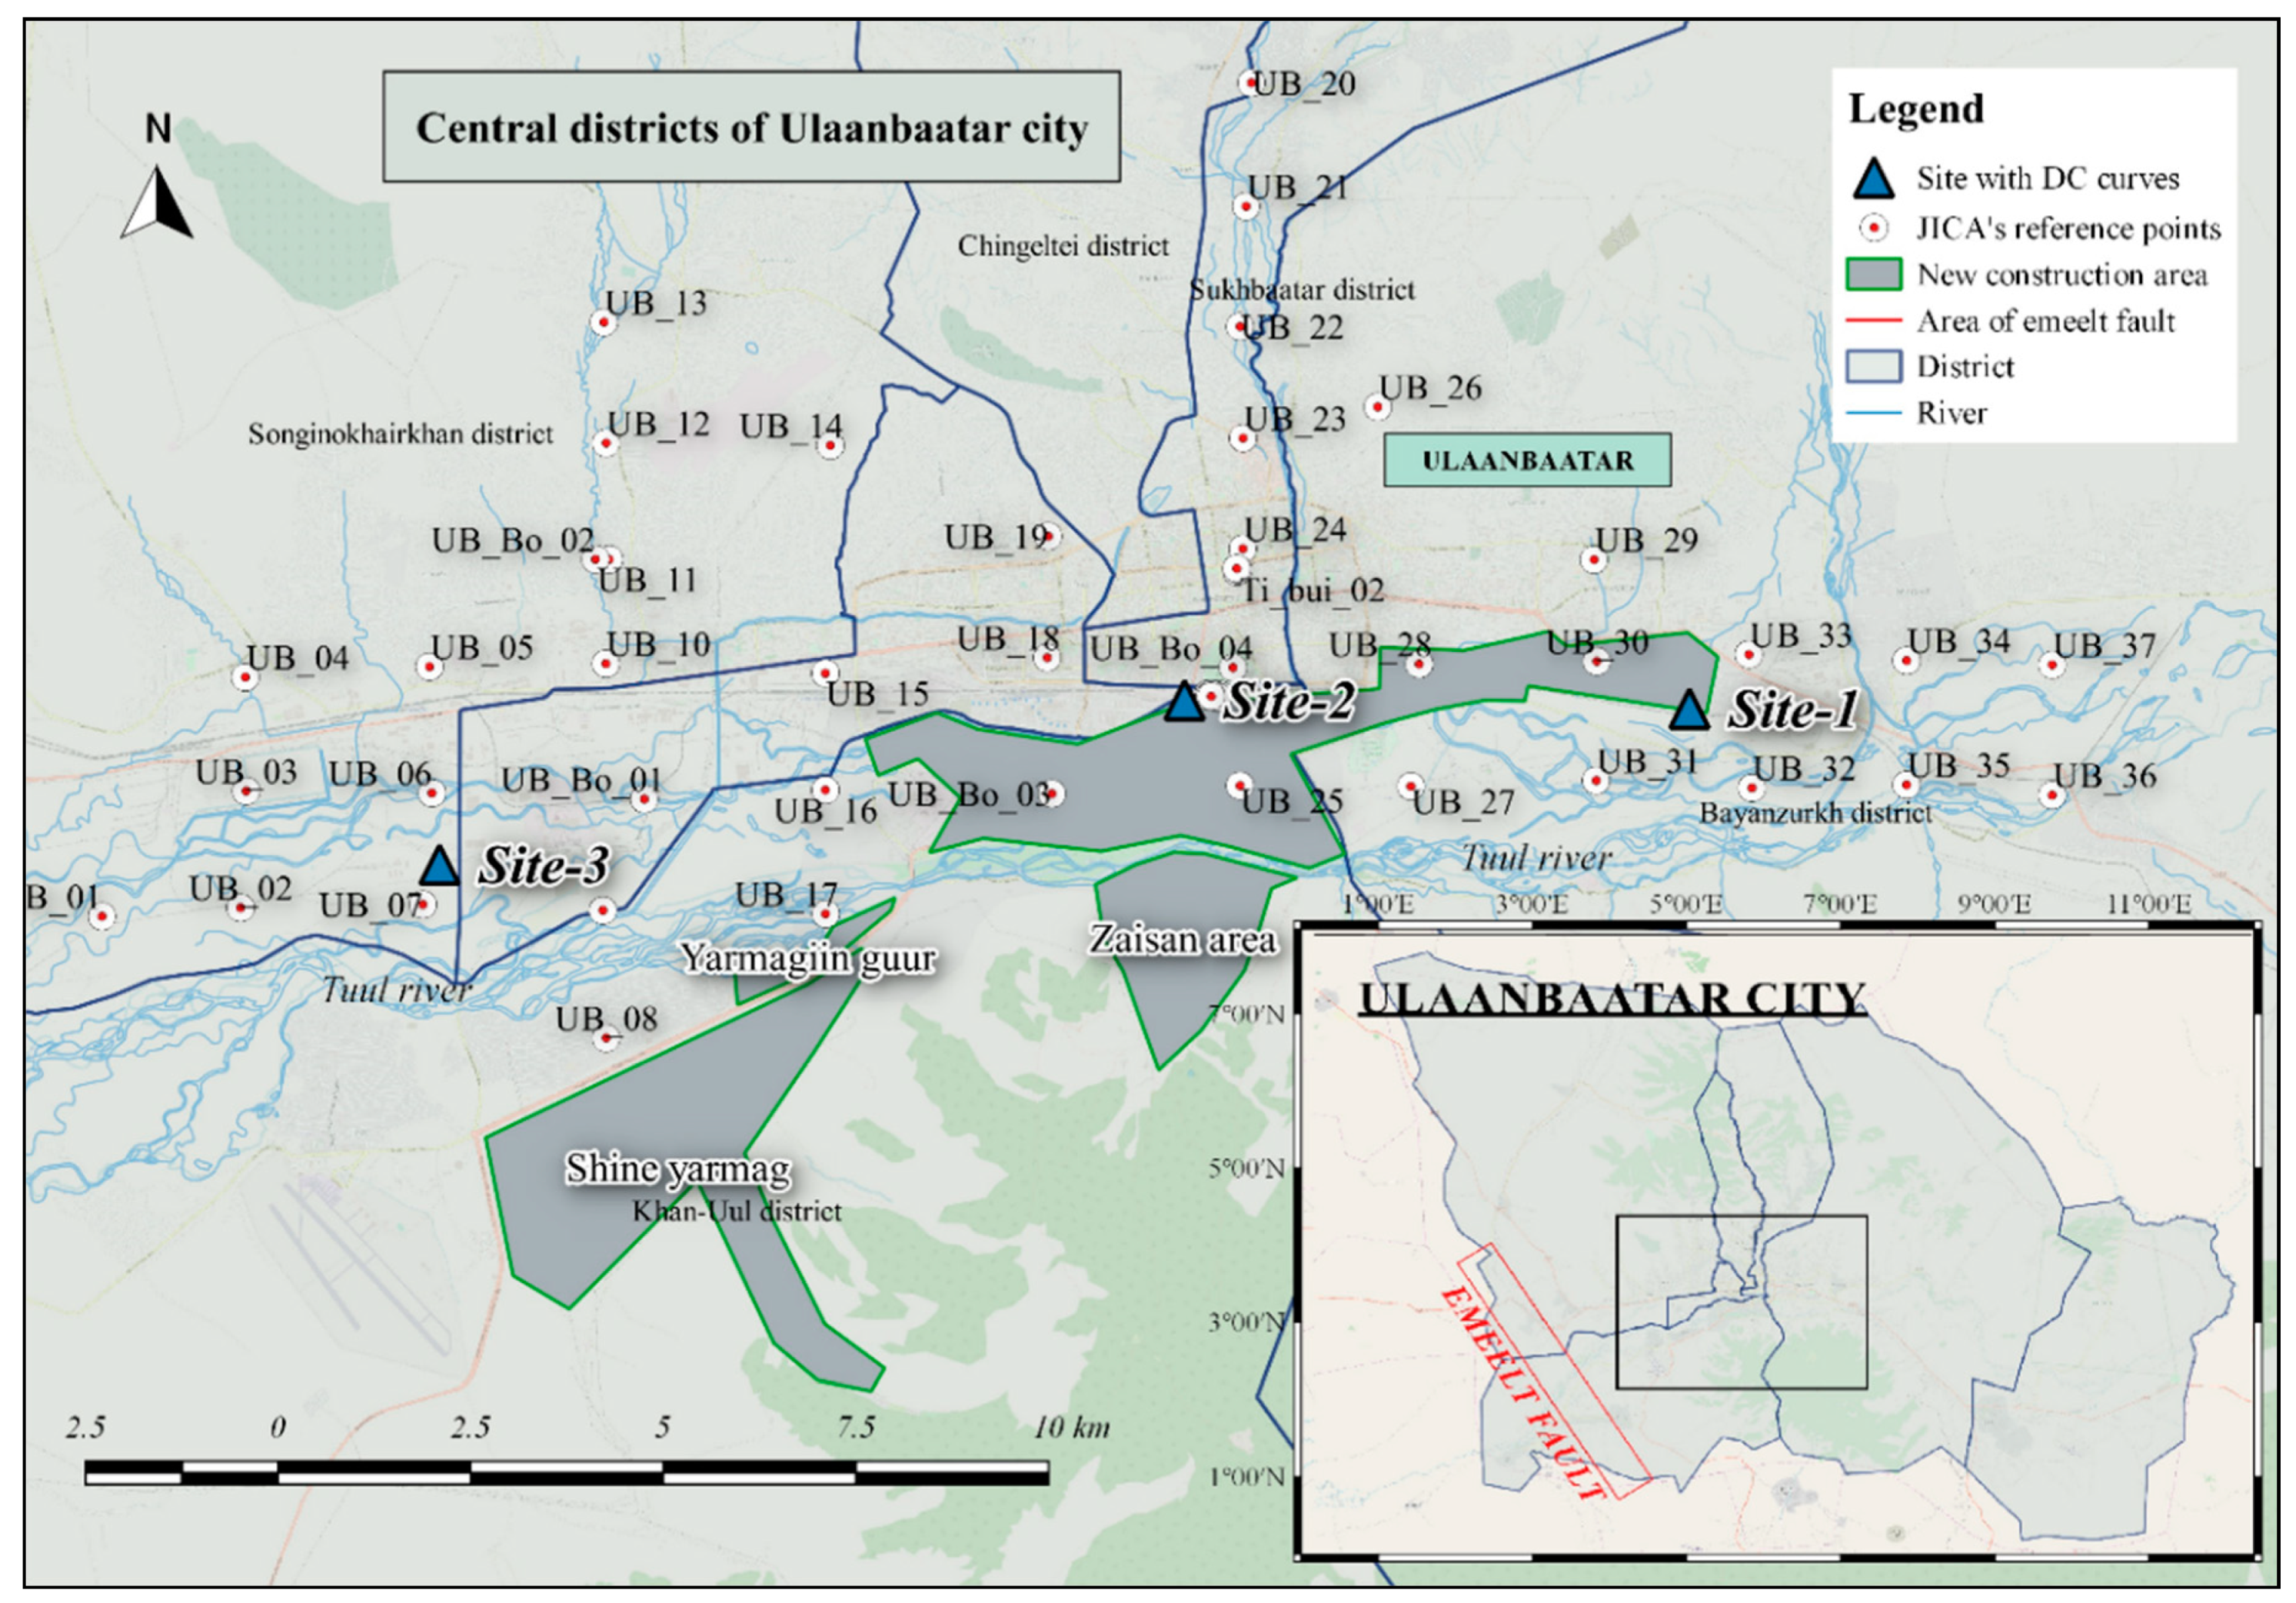
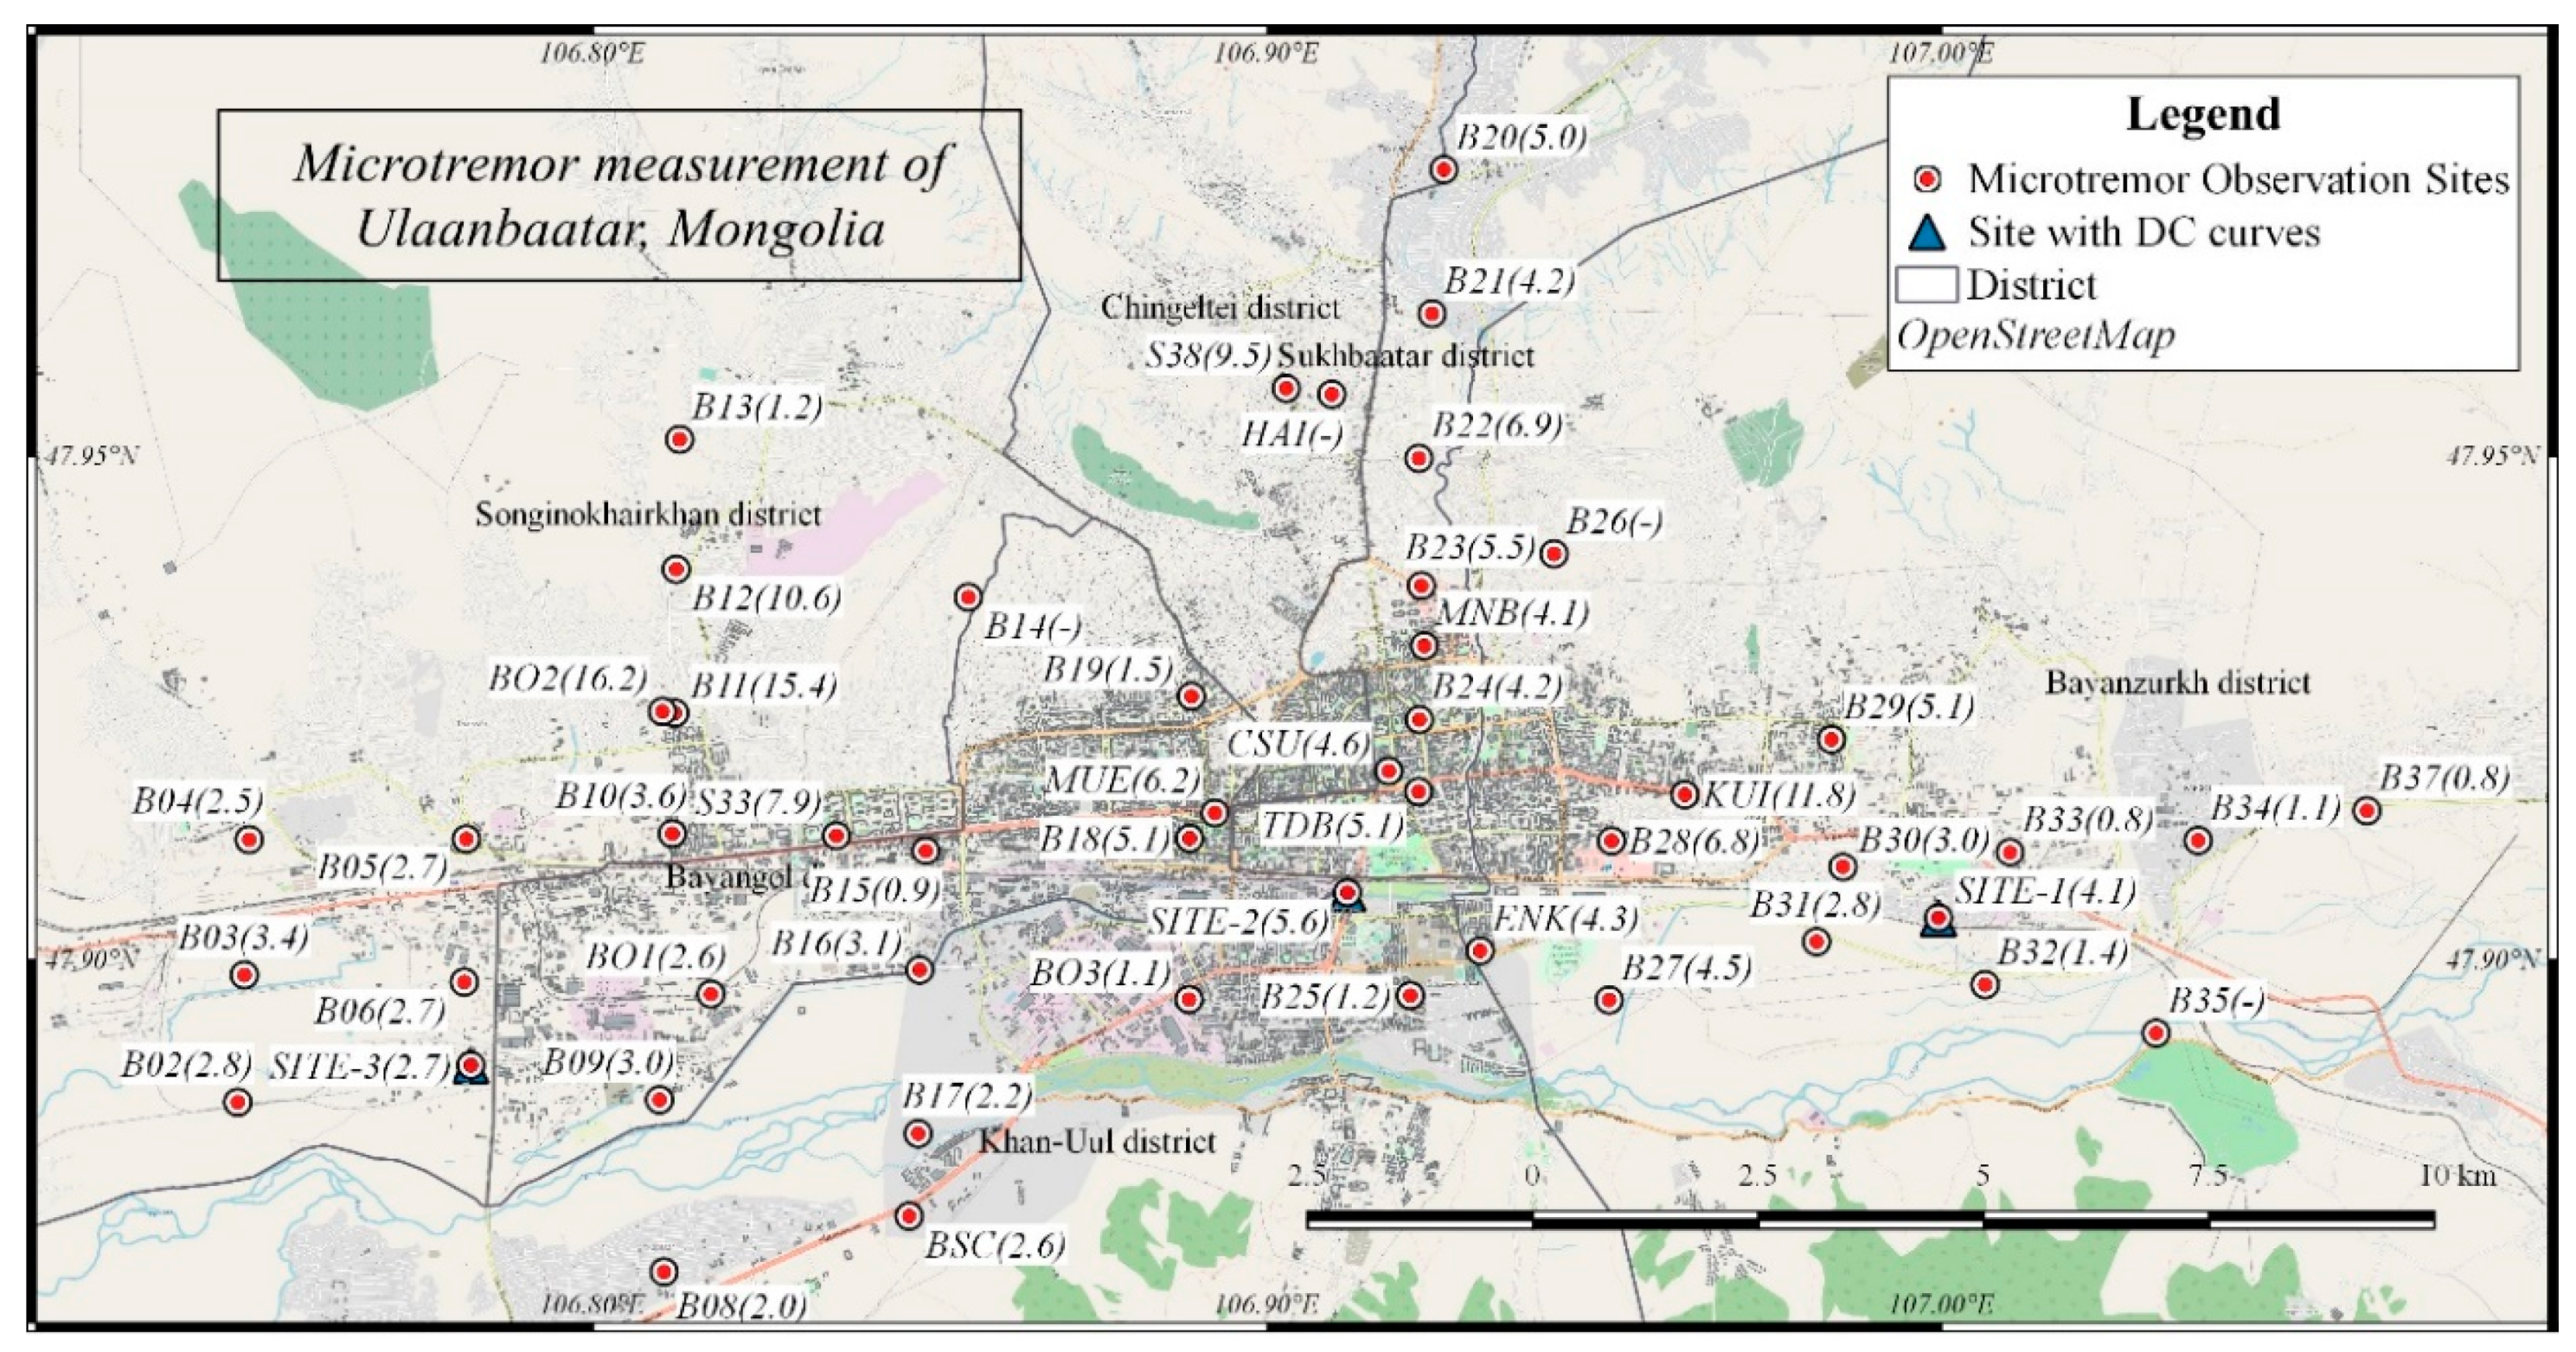
3. Microtremor Observations

The microtremors at more than 50 sites are measured by single-site observations in the city from 25 March 2018 to 15 April 2018. The locations of the observation sites are shown in Figure 2. The coordinates of the array observation sites in OD’s study and the JICA report sites are used for the observations, and we measure at the same locations in the most sites. Only a few sites are located in a special prohibited zone such as a pure water collecting zone of UB city. It was forbidden to enter that zone, so the microtremors are measured as close to the target sites as possible.
In the observations, we use the portable handheld microtremor sensor of GEODAQS-2S3D developed by ANET Inc., Ueda-shi, Japan. The sensor can measure the ambient ground motions in velocity with the lower limit of the frequency of 0.5 Hz (period of 2.0 s). The sampling of 100 Hz is applied during the observation, indicating the frequency coverage from 0.5 Hz to 50 Hz. We have measured the microtremor at the surface of the ground and recorded for three to ten minutes. Due to the heavy traffic, the measurements are basically conducted in the early morning.
The MHVRs (HVobs) are calculated from Equation (1) shown below:
H V o b s ( f ) = N S ( f ) 2 + E W ( f ) 2 U D ( f )
where the scripts NS and EW represent the Fourier spectra for north–south (NS) and east–west (EW) components, respectively, while the UD corresponds to the up-down (UD) component in frequency f in Hz. The Parzen window with a bandwidth of 0.3 Hz is applied for the Fourier spectrum. Three 20.48 s duration parts with less traffic and artificial noises are extracted from the records, and mean values of the three MHVRs are calculated.
The observation conditions and the observed MHVRs at the typical three sites are shown in Figure 3. The red number with an arrow indicates peak frequencies of the MVHRs. The peak frequencies vary from 0.8 to 16.2 Hz, showing different site conditions in the city. The identified peak frequencies of the MHVRs are shown in the values in brackets in Figure 2. The peak frequencies are different site by site. The northern locations such as BO2, B12, S38, KUI and B26 near the mountain have a higher frequency (9.5 to 16.2 Hz) or no peak. These results indicate shallow sedimentary depth or rock sites. On the other hand, lowest peak frequencies (0.8 to 5.0 Hz) are observed in the most sites around the Tuul river basin such as BO3, B25, B32, and B37 probably due to the thick sediment.
In addition, the peak amplitudes of MHVRs near the mountain sites are much lower than those at the Tuul riverside area. This result suggests that large site amplifications are expected in the Tuul riverside area.

4. Inversion Analysis of Microtremor Data

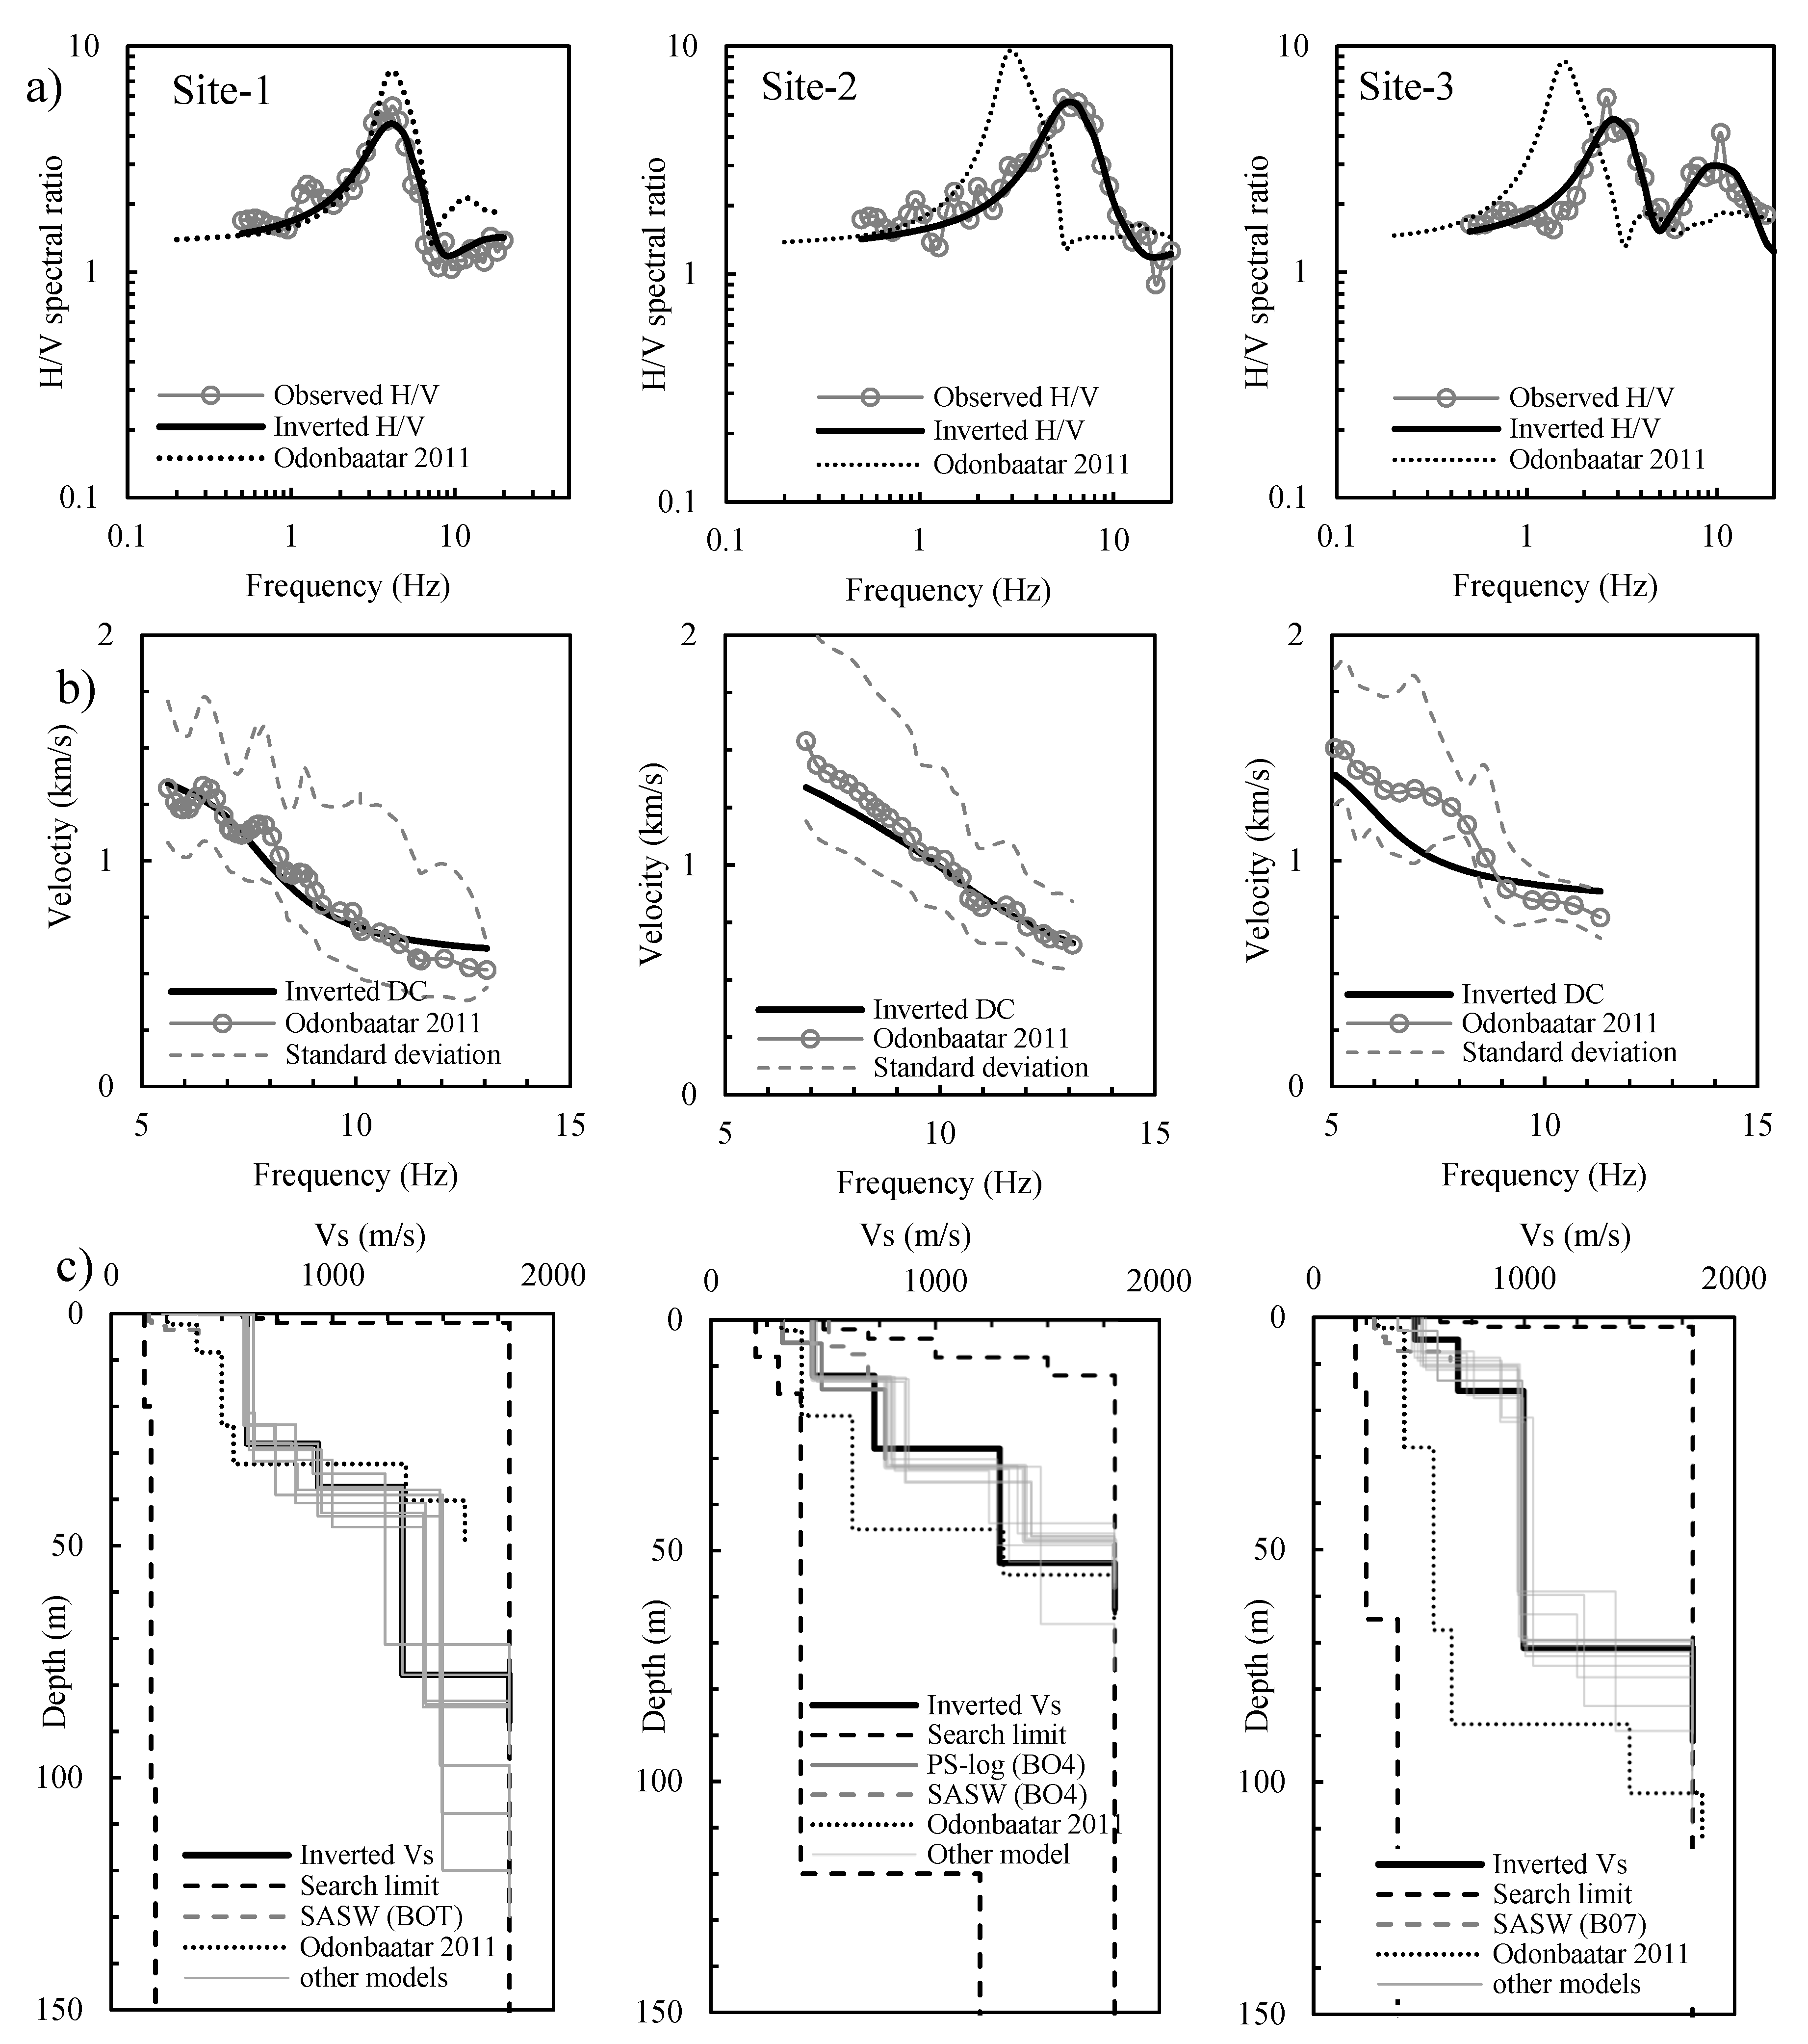
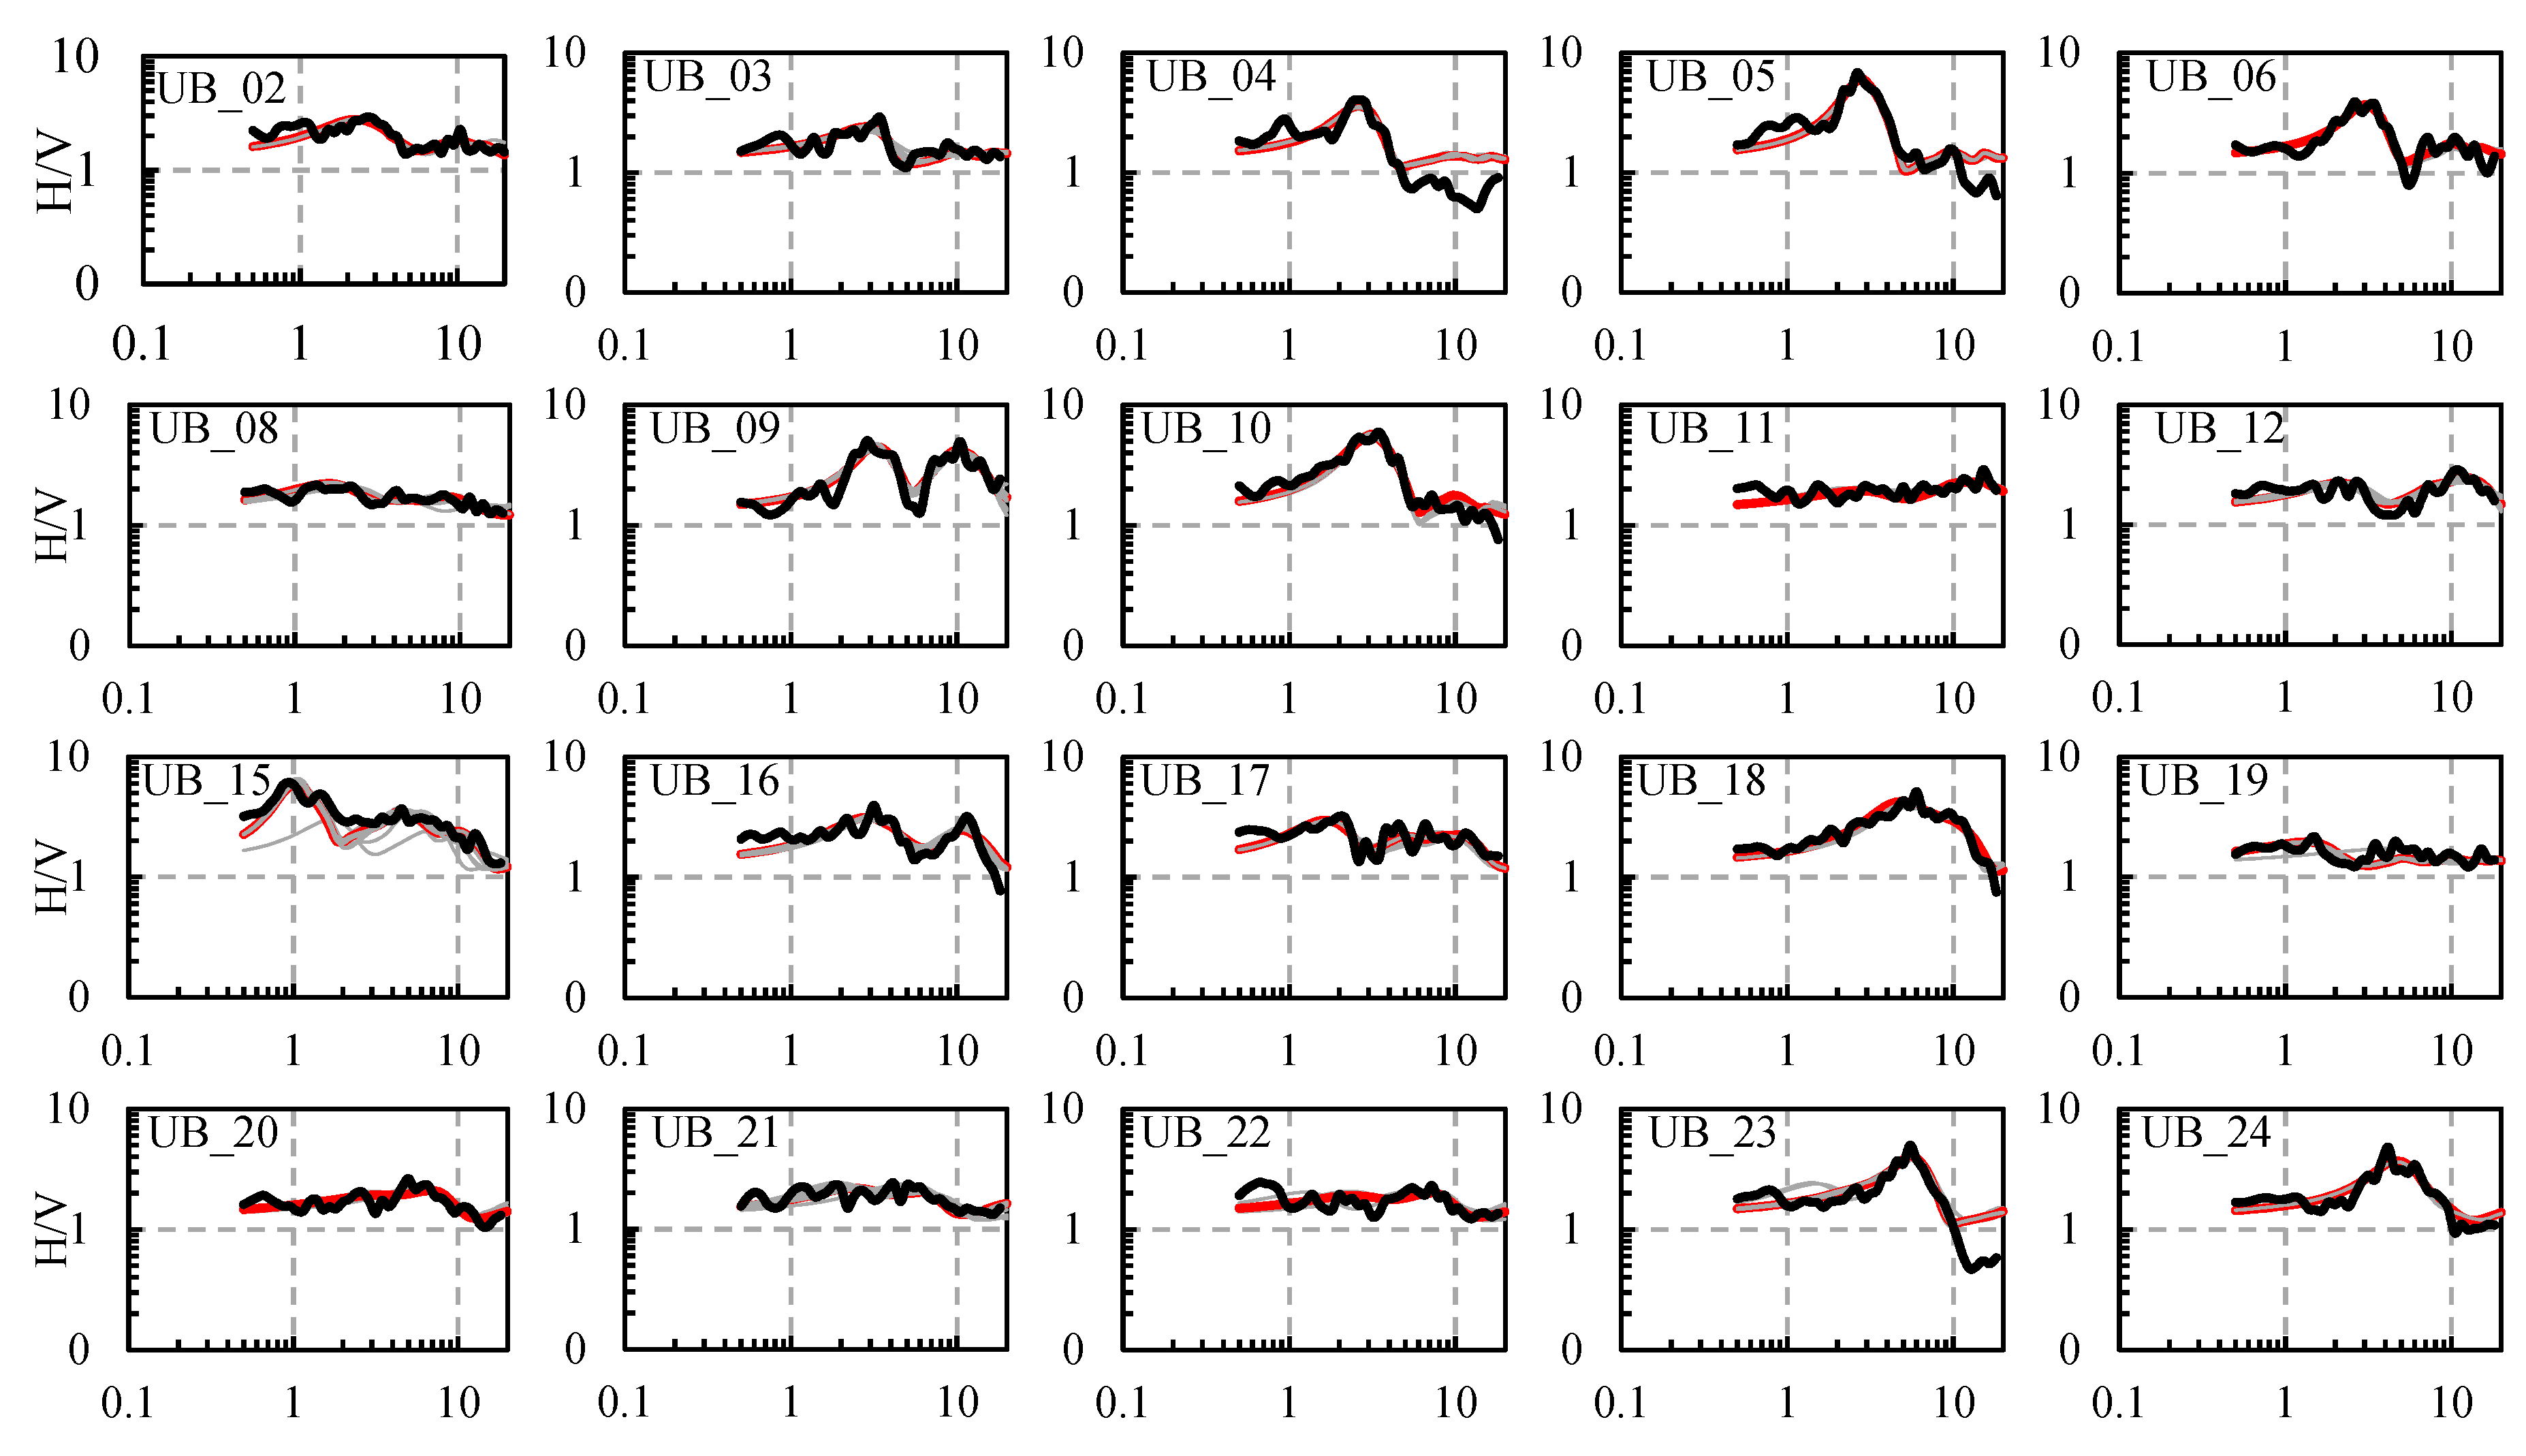
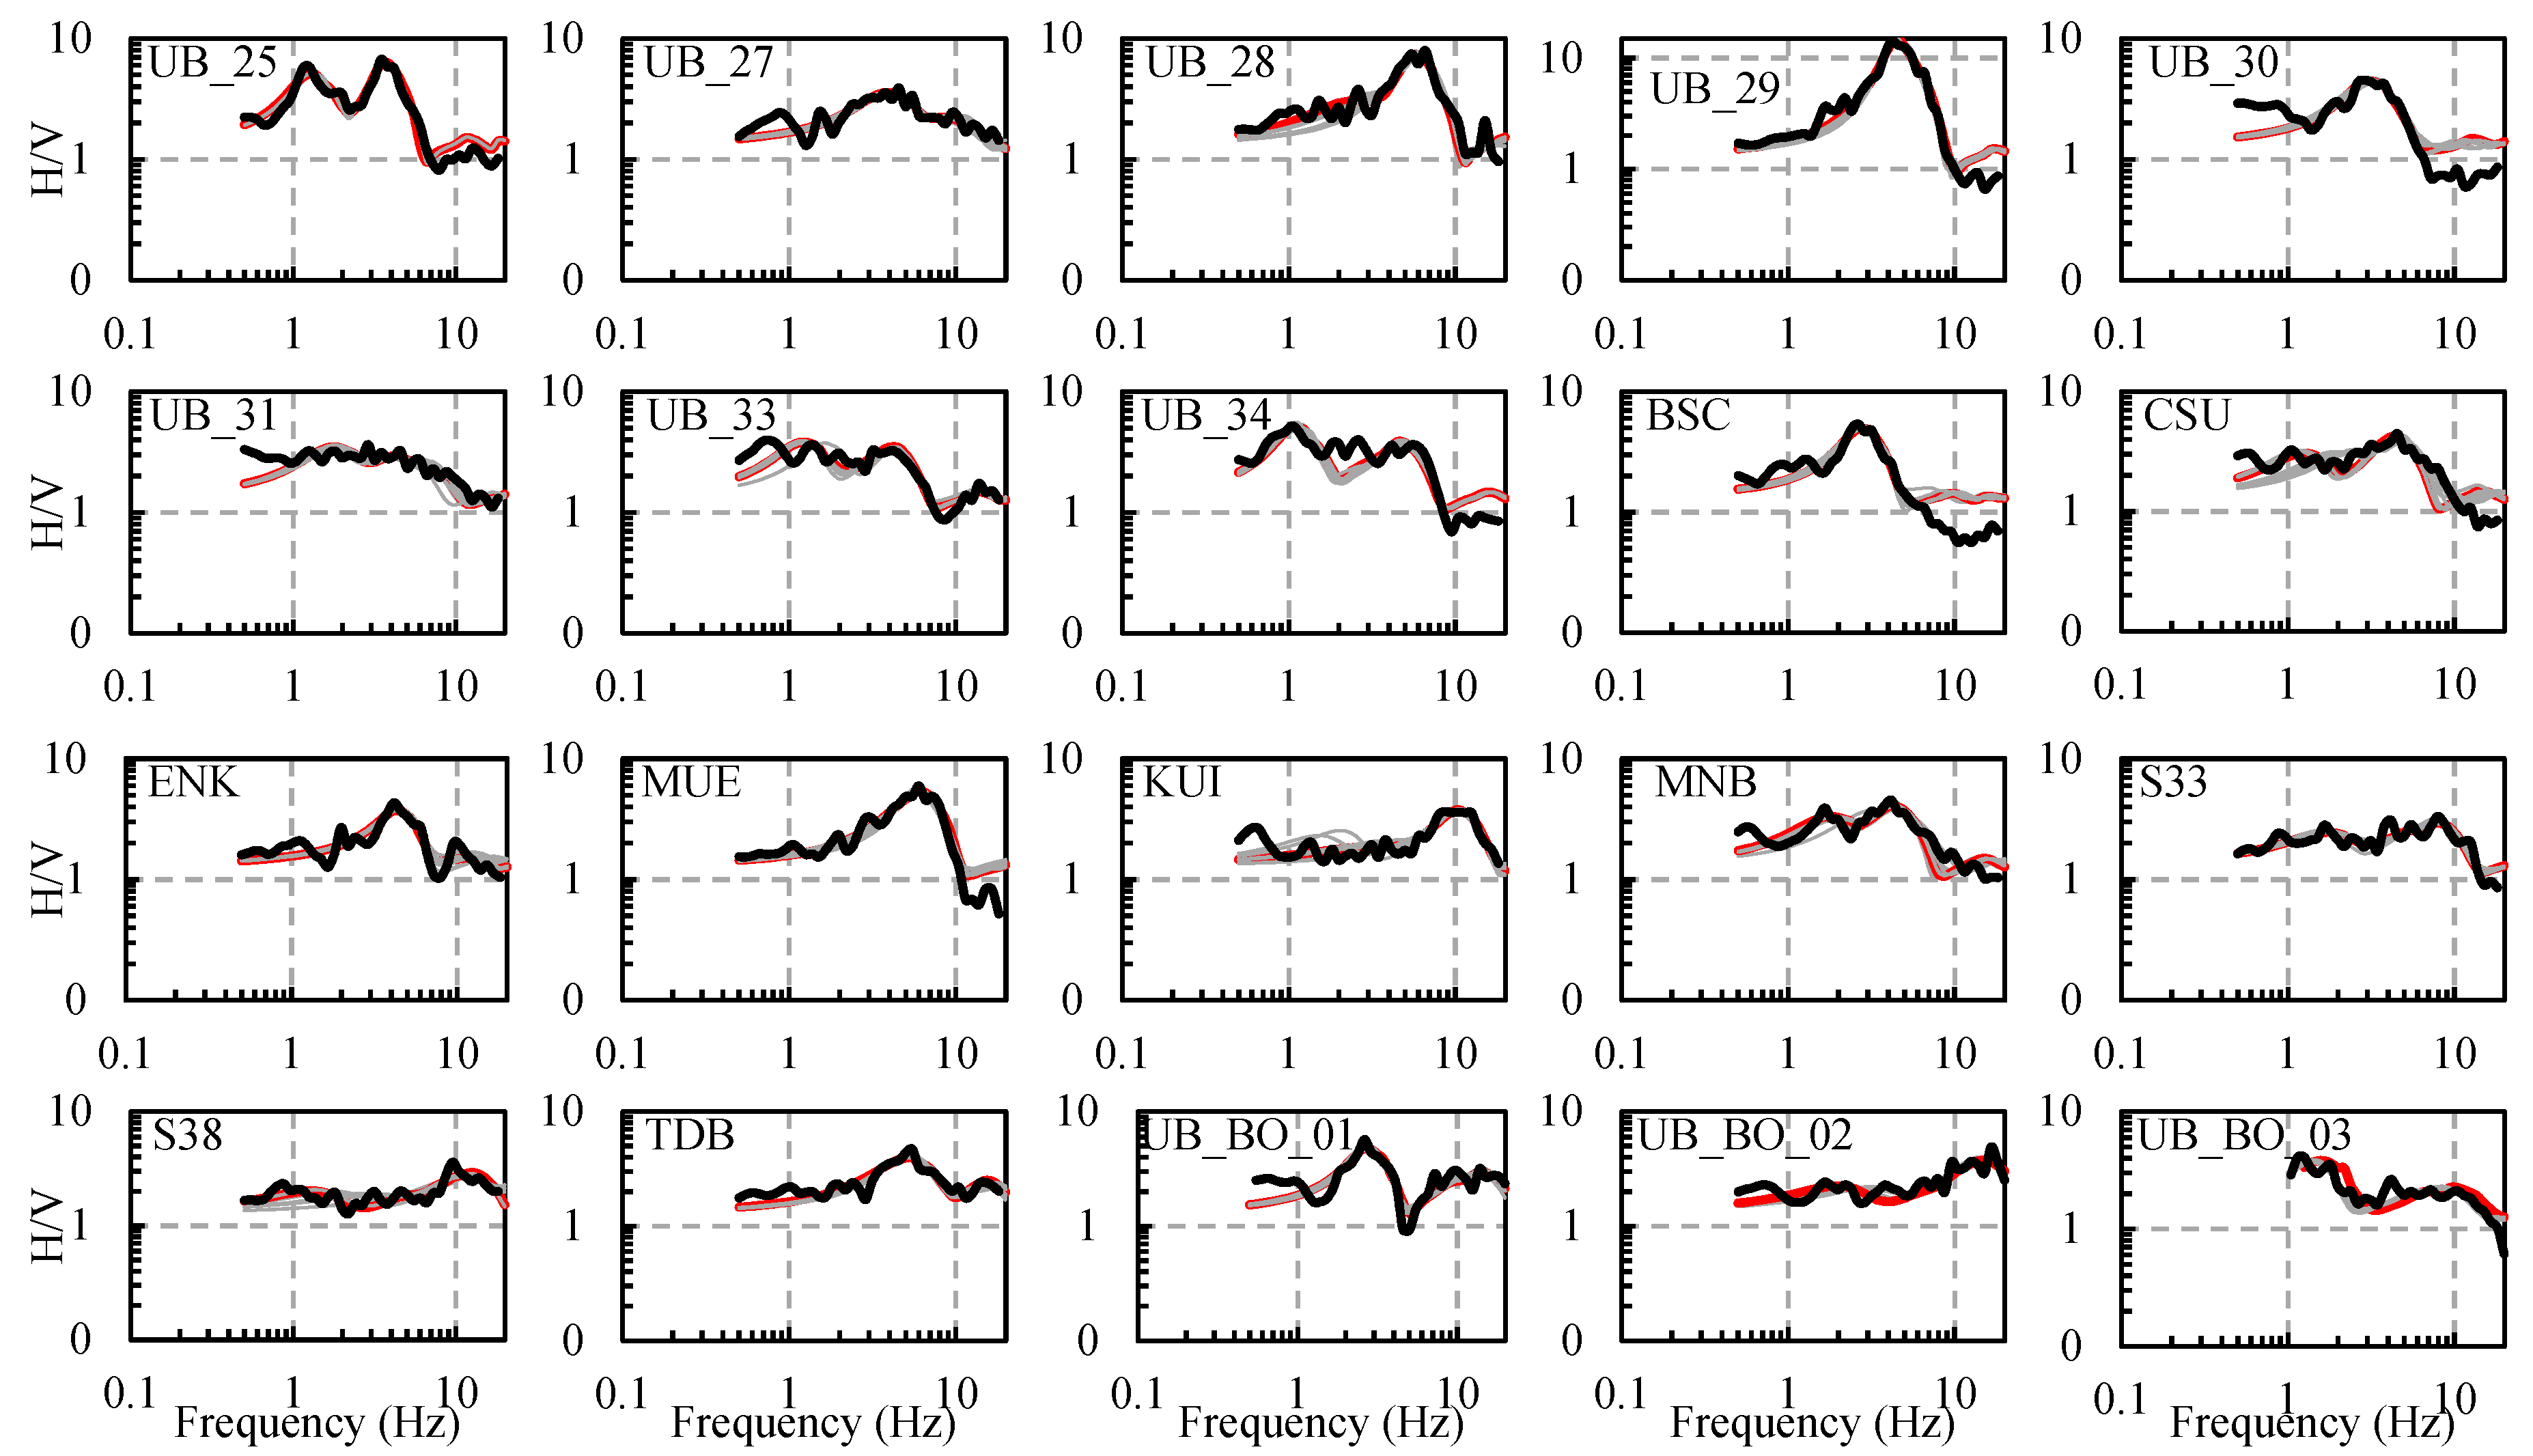
4.1. Joint Inversion of H/V Spectral Ratio and Surface Wave Dispersion Curve

According to the previous inversion studies of MHVR [10,15], joint inversion of MHVR and surface wave dispersion curve is more effective than a single inversion of MHVR to avoid the non-uniqueness of VS and thickness during the VS profile estimation. Therefore, the joint inversion of the MHVRs with dispersion curve obtained in the OD’s microtremor array observations [3] are applied at Sites 1, 2 and 3.
First, we evaluate the estimated VS profiles in the OD’s study (OD models) by comparing theoretical H/V spectral ratio (HVR) with the observed MHVRs. The circles in Figure 4a indicate the observed MHVRs. The data is resampled at the equal intervals in the common logarithm scale for the following inversion analysis. The dotted lines in Figure 4a show the theoretical HVRs computed from the OD models by the diffuse field theory at Site-1, 2 and 3. The observed phase velocities and VS profiles of the OD models [3] are shown by circles in Figure 4b and dotted lines in Figure 4c, respectively. The dotted lines in Figure 4b show the standard deviations of the phase velocities obtained from the array observations. As shown in Figure 4a, the theoretical values by the OD models do not match the observed MHVRs especially at Site-2 and Site-3, suggesting that the OD models need to be modified using not only the dispersion curves but also the MHVRs.
The inversion technique requires search limits for the thickness and VS for each soil layer generally based on geology, borehole, and geophysical test results. In this study, search limits are assumed for each site considering the OD model for deeper structures and JICA’s report at the closest sites for shallower structures. The search limits for Site-1, 2, and 3 are shown in Table 1, Table 2 and Table 3. The search limits are set to cover the existing models. The VS of the lowest layers are fixed at 1800 m/s because the VS of the bedrock was defined at around 1800 m/s in the OD models [3], and the phase velocities were obtained up to about 1500 m/s in the dispersion curves as shown in Figure 4b.
In addition, VP and soil density for each layer requires calculating theoretical HVR. Based on the previous PS-loggings in the JICA’s report [5], the relationship between VS and VP is modeled by linear regression analysis as shown in Equation (2):
V P = 0.00162 V S 2 + 1.403 V S + 14.9 .
Equation (2) is used to set the search limit for VP in the inversion analysis for the layer of VS of less than 800 m/s because the shallow VS structures up to the VS of around 800 m/s were obtained in JICA’s report. If the VS is higher than 800 m/s, the relationship developed by Kitsunezaki et al. [19] shown in Equation (3) is applied:
V p = 1.11 V S + 1290
Soil density for each layer is assumed at general values as shown in Table 1, Table 2 and Table 3.
In this study, the Simulated Annealing method [20] is applied during the inversion analysis because it was already successfully used in the inversion of dispersion curves and MHVR [15]. We performed 10 inversions per site with different initial sets of randomly-generated models and selected the best structure with the smallest misfit (best fit model).
Misfit between the theoretical values and observed values in MHVR and dispersion curve is minimized in the joint inversion process. Misfit Γ is defined in Equation (4) as shown below:
Γ = 2 ( 1 ξ ) n i = 1 n ( H V o b s ( f i ) H V t h ( f i ) ) 2 H V o b s 2 ( f i ) + 2 ξ m i = 1 m ( D C o b s ( f i ) D C t h ( f i ) ) 2 D C o b s 2 ( f i )
where ξ = n/(n + m) is cost function, n number of data with H/V spectral ratio is 41 at each site, and m number of data with dispersion curves is different for each location. Because the amount of data in the obtained dispersion curves varied, m = 42 at Site-1, m = 27 at Site-2 and m = 16 at Site-3 are used. Even if the amount of data of both observables is not the same, the cost function does not change [13]. H/Vobs and H/Vth represent the target measurements and calculated MHVRs for the current model in a frequency fi. DCobs and DCth are the experimental measurements and the estimated dispersion curve for the current model. In the preliminary analysis with the cost function of 0.5, the observed and inverted MHVRs showed a significant difference. Therefore, the cost is changed to 0.8 to increase the weight for the MHVR than for the dispersion curve. The results of the inversions are shown in solid thick lines in Figure 4. The solid lines in Figure 4a,b indicate the theoretical values obtained from the inverted VS profiles shown in Figure 4c. Gray lines in Figure 4c indicate variations of the inverted models, Site-2 and Site-3’s other models are almost identical to each other. However, a shallow part of the models is the same; a deeper part has around 50-meter difference in Site-1. It means that variabilities of the deeper structure are much smaller in the joint inversion. The theoretical values show good agreement with the observed values, especially better agreement for the MHVRs than those by the OD models. On the other hand, the theoretical dispersion curves show less agreement with the observed values than those by the OD models, especially at Site-3. This difference indicates that it is difficult to find a model that accurately reproduces both types of observation data. Considering the variability of the dispersion curve at Site-3, we accepted the inversion result since the theoretical values are within the standard error (mean plus minus one standard deviation).
The estimated bedrock depths vary 50 to 80 m showing larger depths at Site-1 and 3 than at Site-2. Since the Site-1 and Site-3 are located near the Tuul river as shown in Figure 1, thicker sediments are expected in the riverside area than in the central UB such as Site-2.

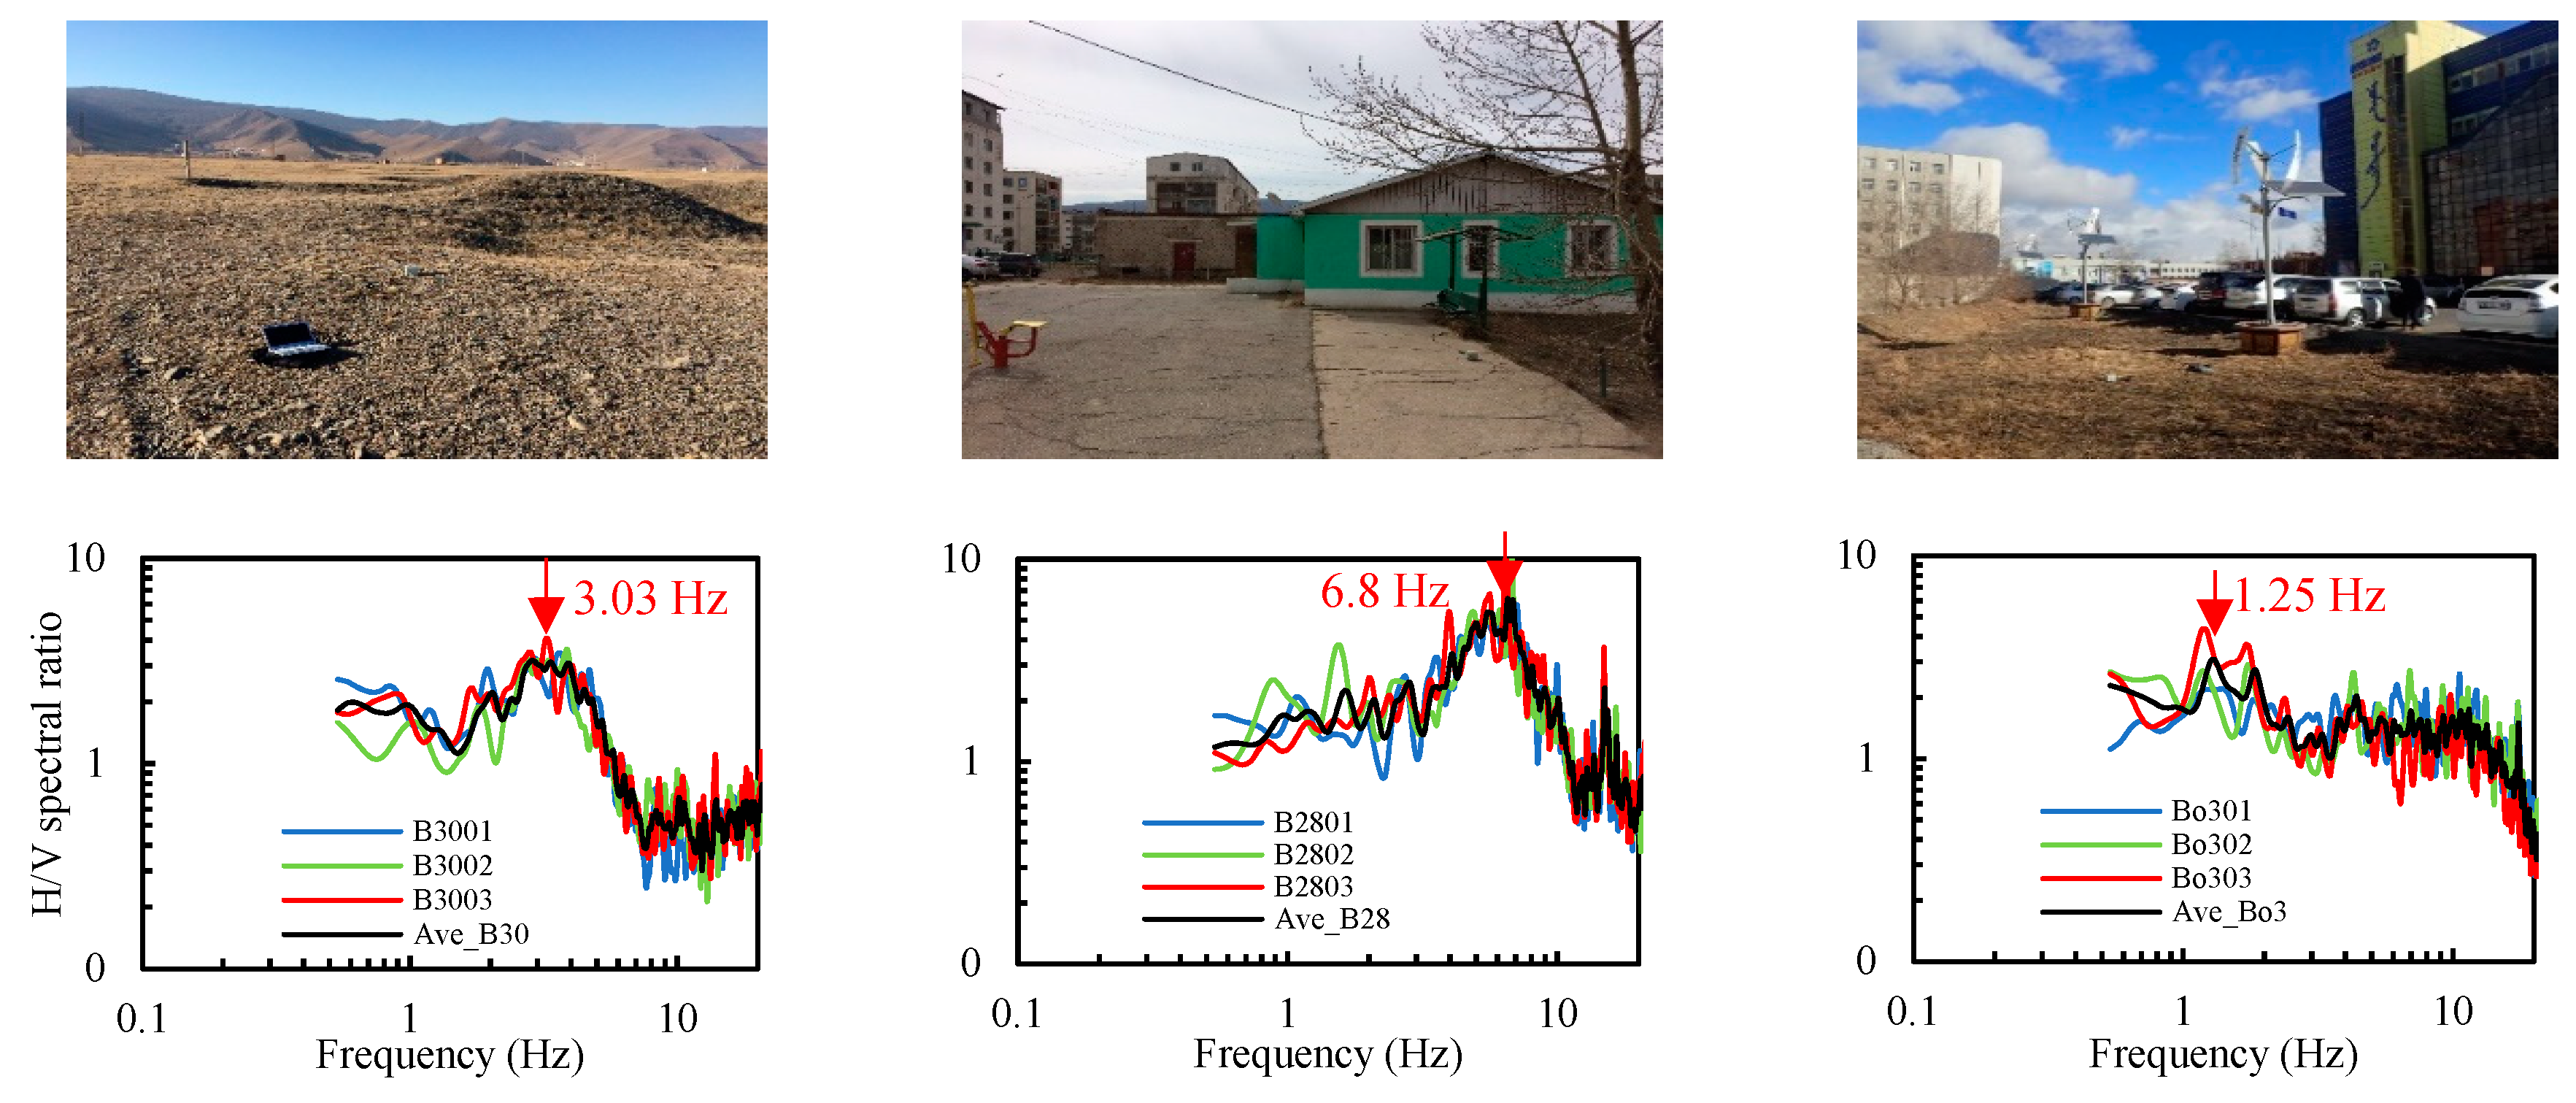
4.2. Single Inversion of H/V Spectral Ratio

In this part, single inversion analysis is applied to the observed MHVRs to estimate VS profiles at the observation sites except for Site-1, 2 and 3. Blind single inversion can be quite costly because it may imply a huge search within the parameter space and the convergence can require a long time or even not be reached. In order to sharpen the search of solutions, we define search limits of target values using existing shallow VS profiles [5] with the previous joint inverted results for deep underground structures. For example, a typical site search limit comparing with JICA’s report is shown in Table 4.
In the single inversion, the misfit ΓHV was defined in Equation (5) as below:
Γ H V = i = 1 n ( H V o b s ( f i ) H V t h ( f i ) ) 2 H V o b s 2 ( f i )
where HVobs and HVth represent target measurements and calculated MHVR for a current model at frequencies fi [15].
The H/V spectral amplitudes have no peak or are smaller than a factor of 2 at a few sites located in the mountain areas. These sites are eliminated in the inversion process because it would be difficult to accurately estimate VS profiles due to the uncertainties during the inversion analysis. Figure 5 shows the observed and inverted MHVRs of 40 sites. The black line indicates the observed MHVRs, the red line indicates inverted best results of MHVRs, and gray lines show the results of other inverted models. At most of the sites, the misfits of the inversion process are small. It is considered that the difference between the observed and inverted MHVRs are similar in shape and amplitude. Figure 6 shows the inverted VS profiles of the sites in UB. The VS profiles are up to 160 m depth in most of the sites. In some sites such as UB_08, UB_33, UB_34, and UB_Bo_03, the bedrock depths are estimated at around 200 m depth, which is slightly deeper than those expected in the previous research [3,4] because the predominant frequencies are found at approximately 1 Hz or less. Since the information for the deeper underground structures in UB is very limited, further detailed observations such as much larger-scale microtremor array observations would be required to justify the deeper parts of the estimated VS profiles. The main objective of this study is to evaluate the site effects in UB area. In order to discuss the effect of the bedrock depth on site amplifications, sensitivity analysis is performed by using the estimated VS profile in UB33 where the estimated bedrock depth is 203 m. Table 5 shows the VS profile calculated in UB33. We prepare three other models (Model-1, 2 and 3) by changing the thickness of the third layer from 98 m to 80 m, 60 m, and 40 m. The bedrock depths of the three models correspond to 185 m, 165 m, and 145 m, respectively. The site amplifications are calculated from the four models by one-dimensional elastic wave propagation theory of SH-wave [21]. The damping factor of 0.03 is given to all the layers. Figure 7 shows the calculated site amplifications for the models. The amplification factors around 1.0 Hz are slightly shifted to a higher frequency by reducing the thickness of the third layer. However, the change of the site amplification factors among the models are quite small and negligible. This indicates that the thickness of the deep layers does not largely influence the site amplifications.

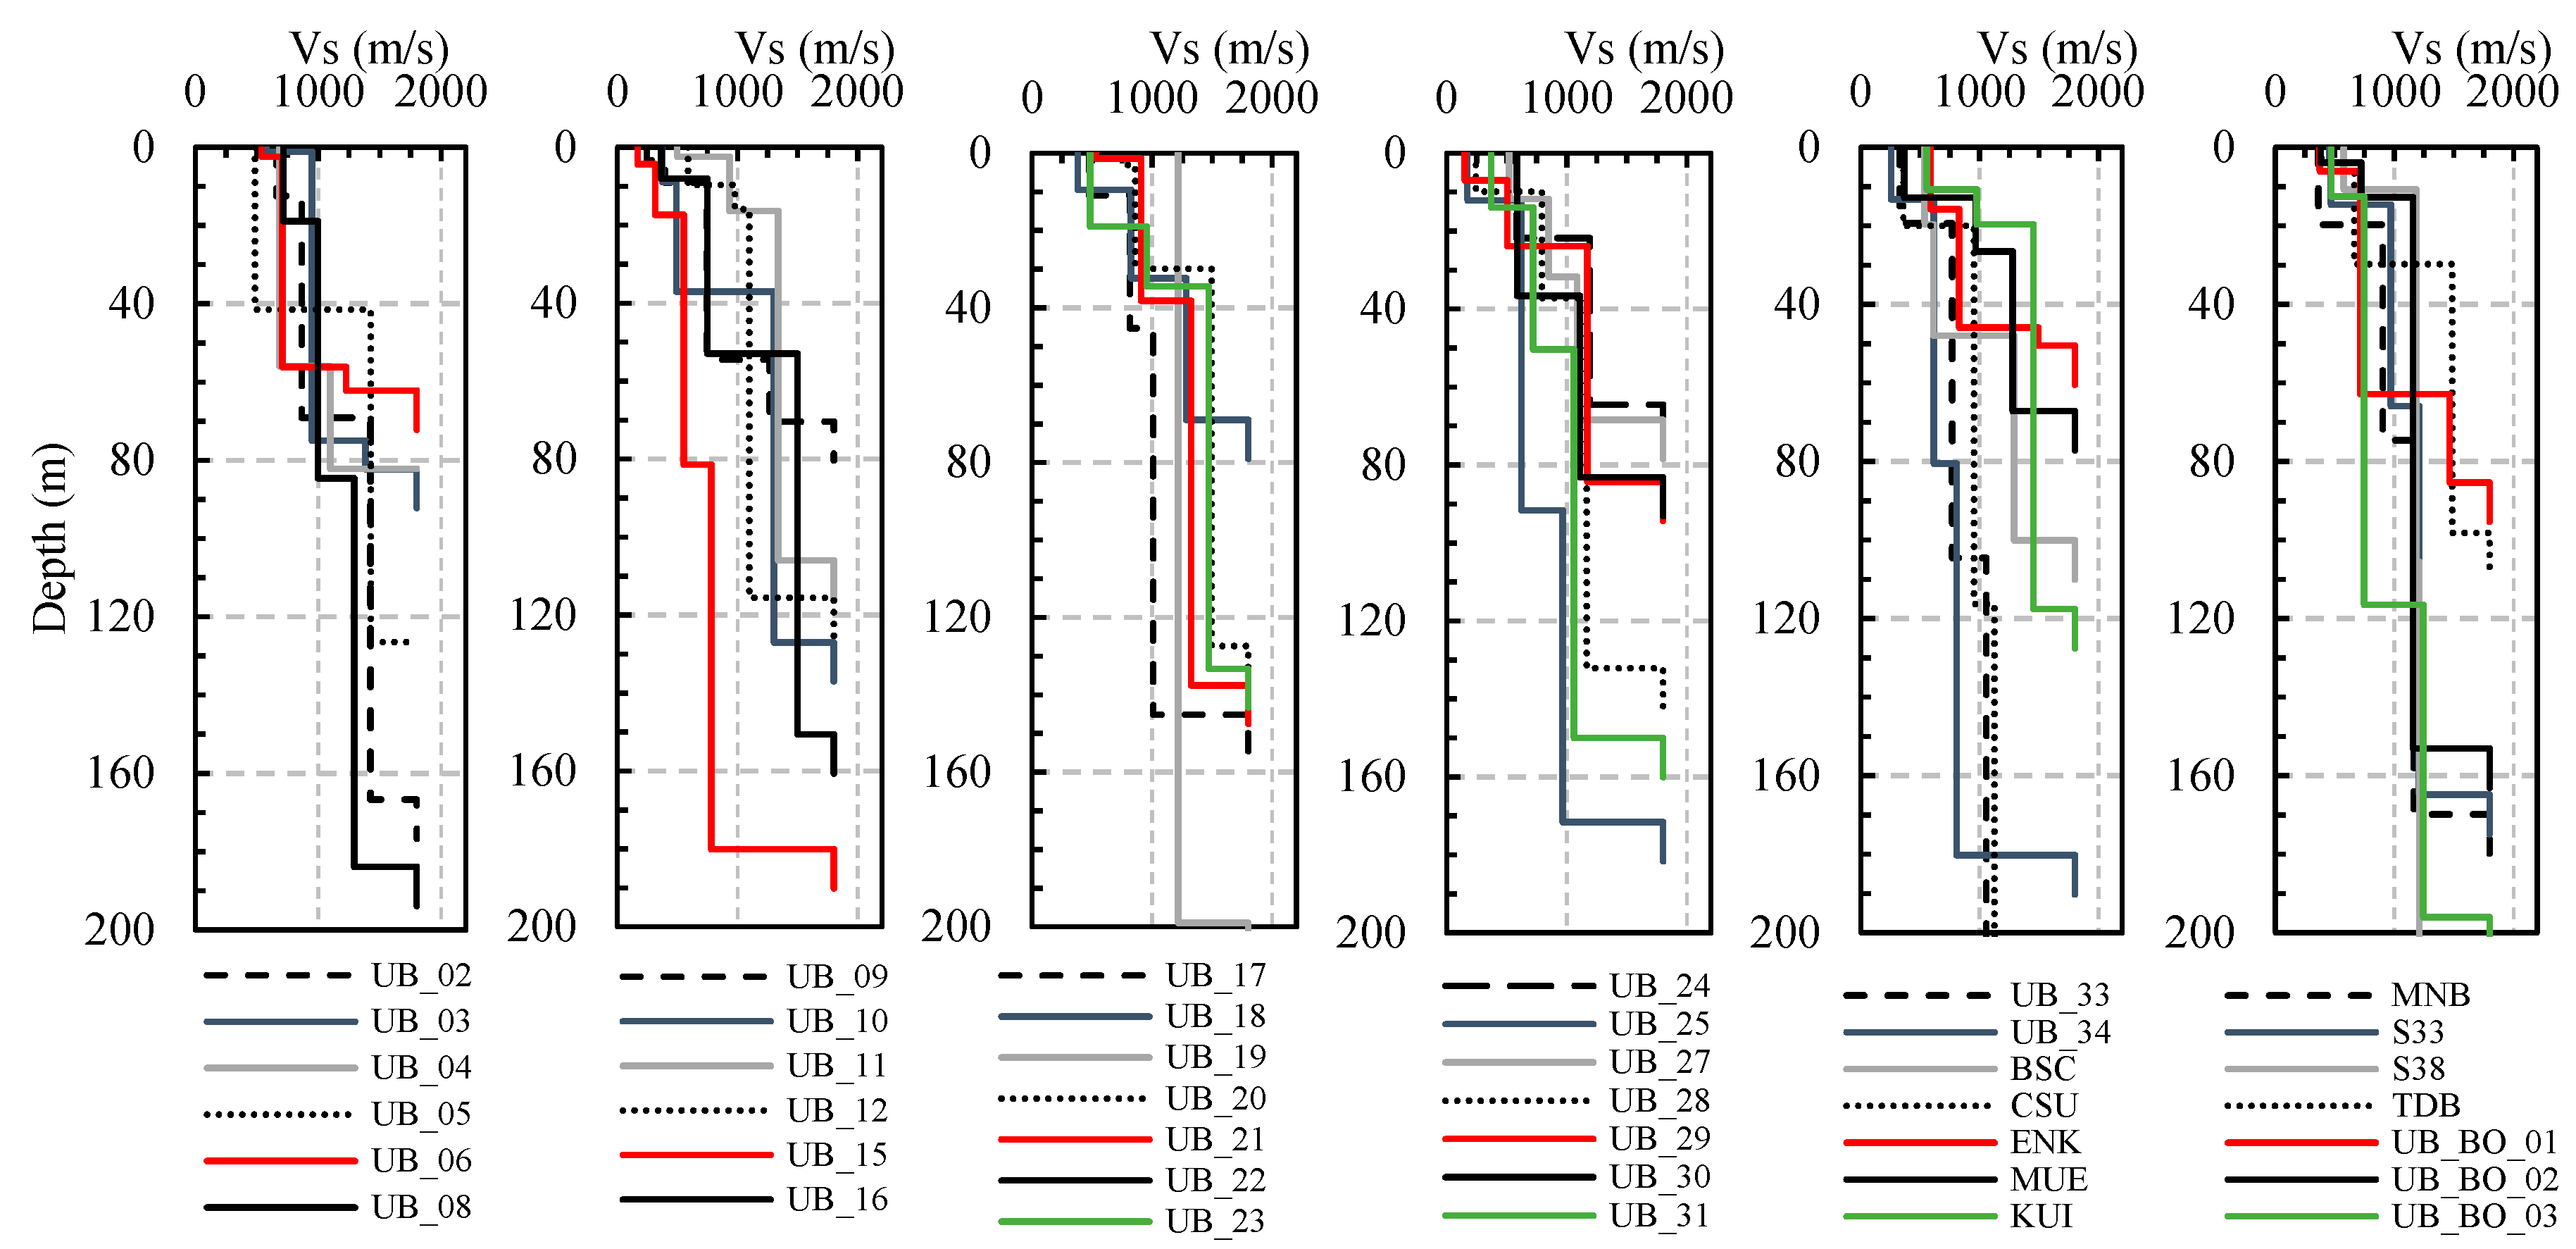
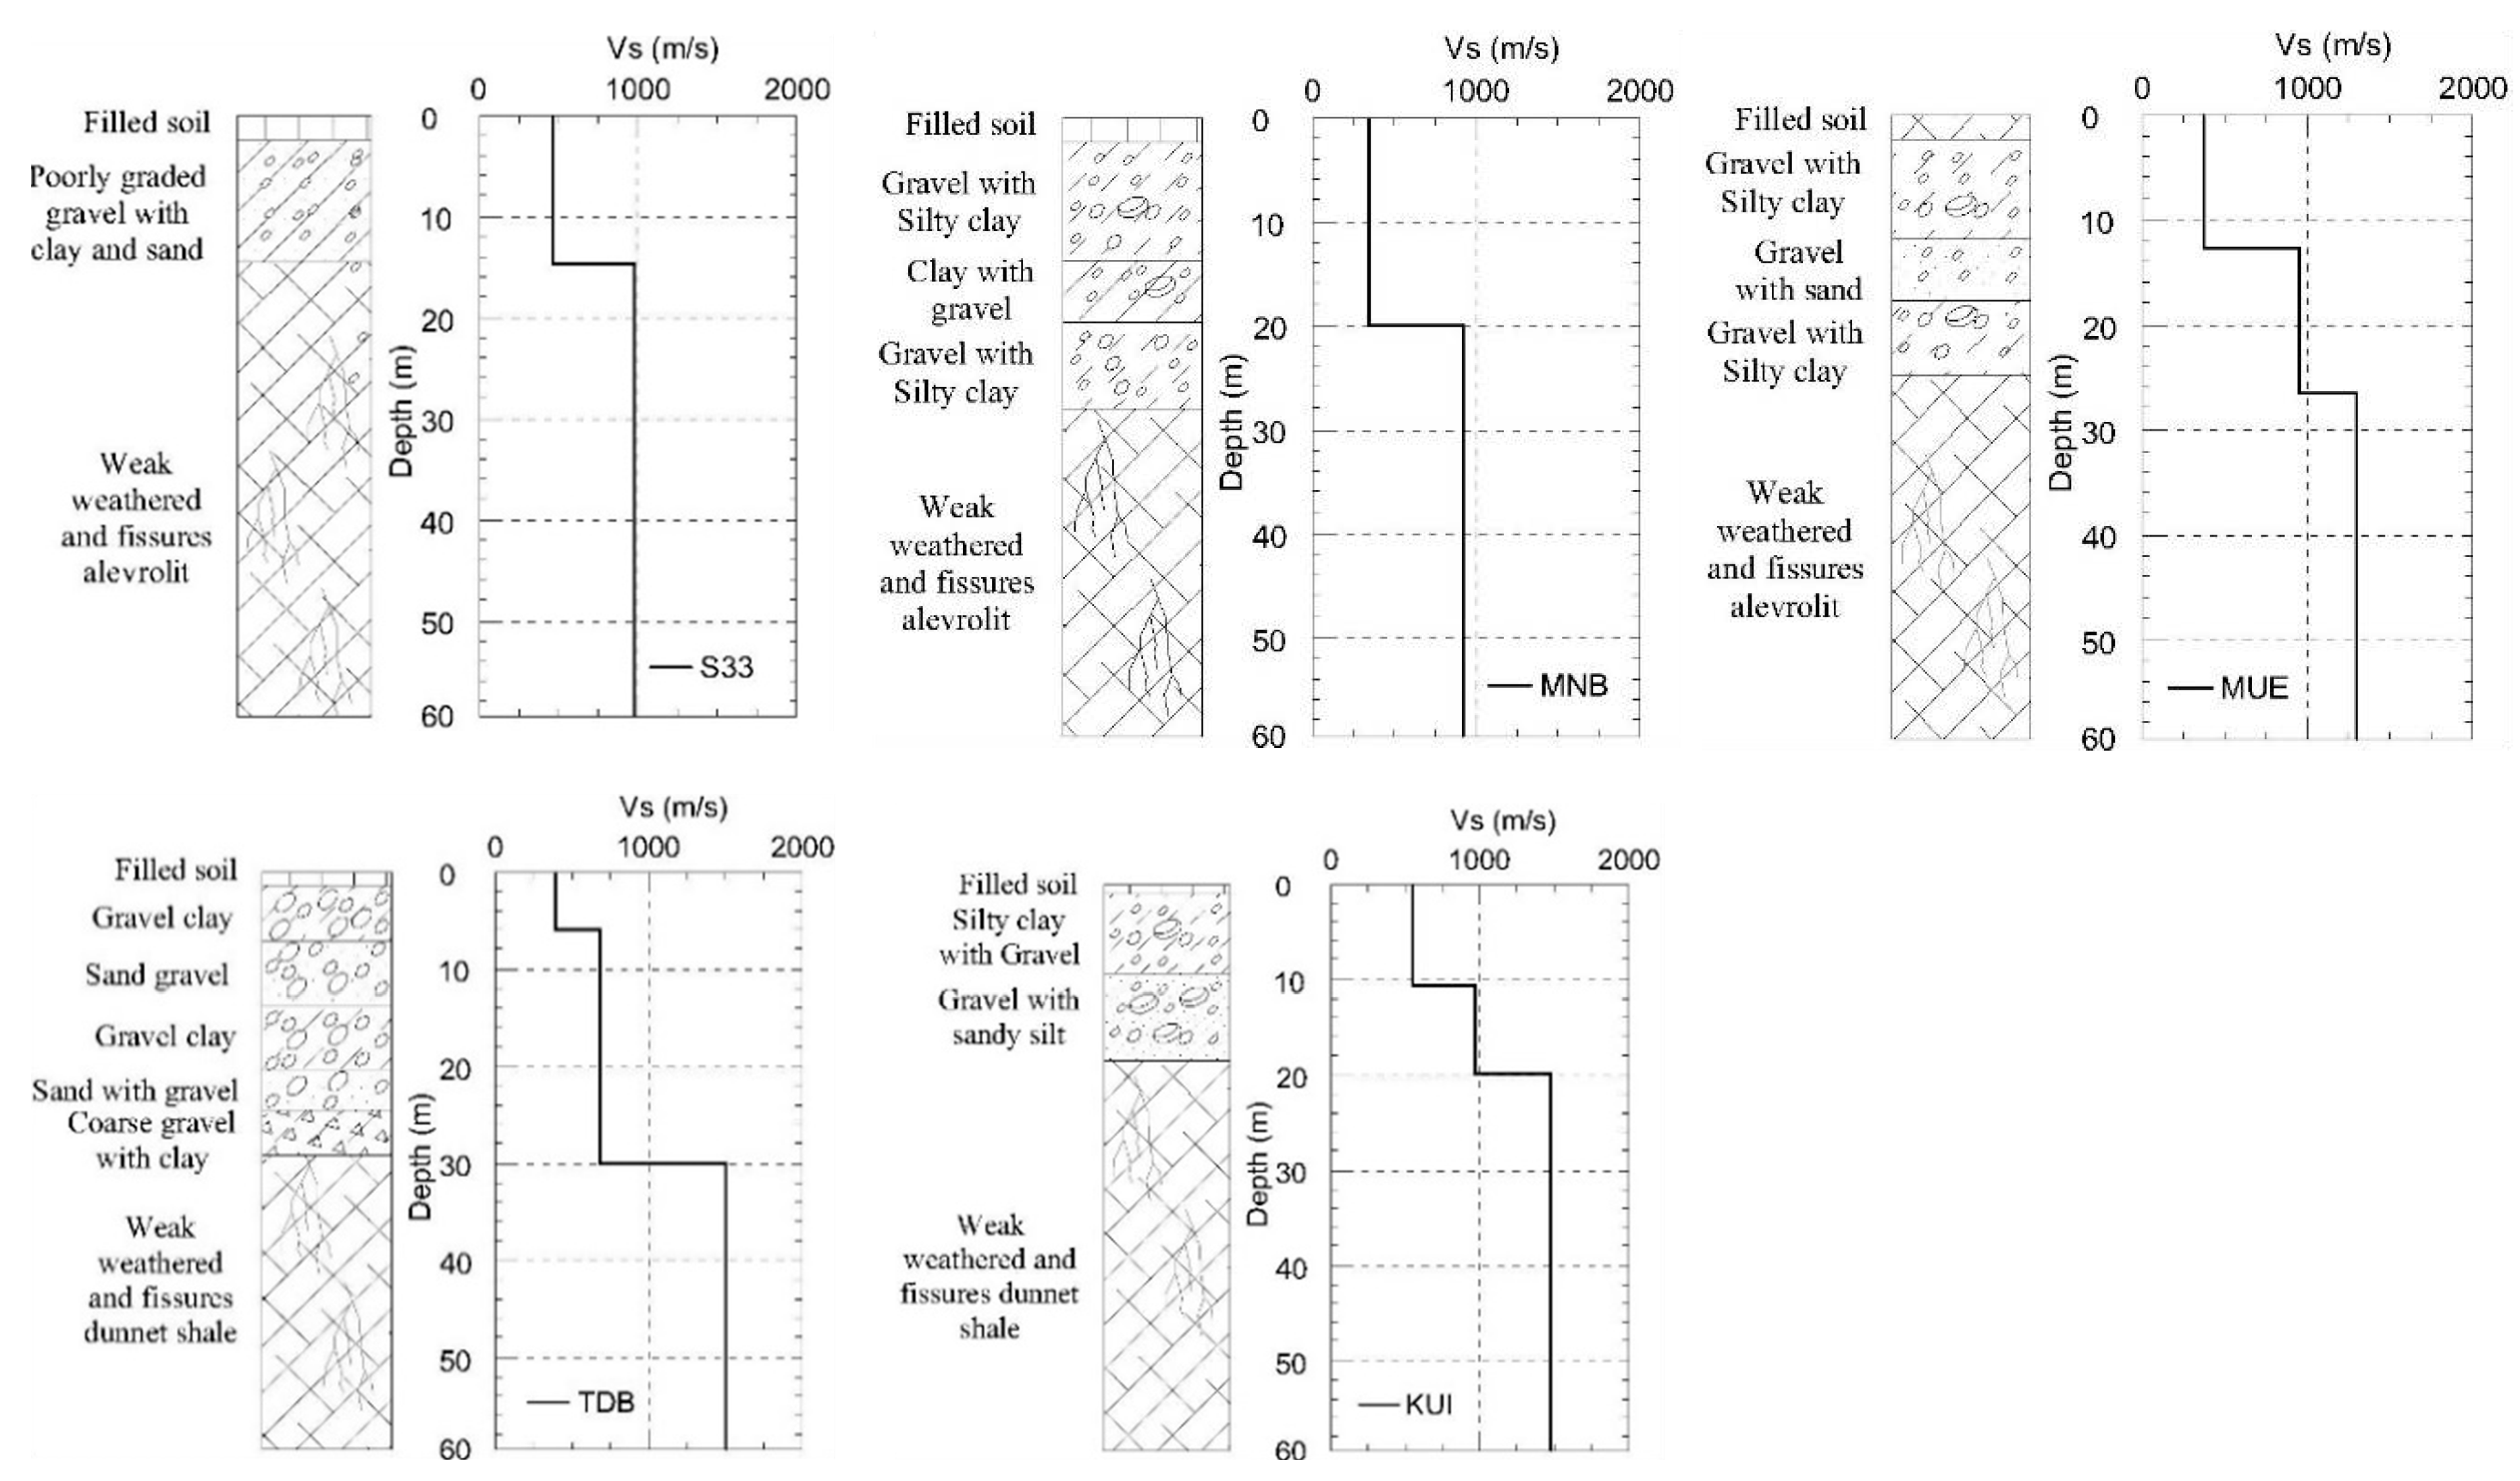
4.3. Comparison with Borehole Data

In order to validate the shallow VS profiles, we compare the estimated profiles with the existing borehole data. In the geotechnical map in UB [18], cross-sections of geological profiles were included. Based on the map, the profiles are compared at five sites located close to the cross-sections with the borehole information. Figure 8 shows the comparison of the borehole data and the inverted VS profiles. Depths of the cross-sections are up to 60 m in the sites. According to the borehole data, the soil consists of gravel with clay or sand in upper layers and weathered shale or rocks in lower layers at most of the sites. The thickness of the inverted layers almost corresponds to the boundaries of the soil types in the borehole.
The VS corresponding to the gravel with clay and sand layers are 400 to 1000 m/s while the VS corresponding to the weathered shale and rock are 1000 to 1500 m/s. The results show some justification for the inverted shallow VS structures.

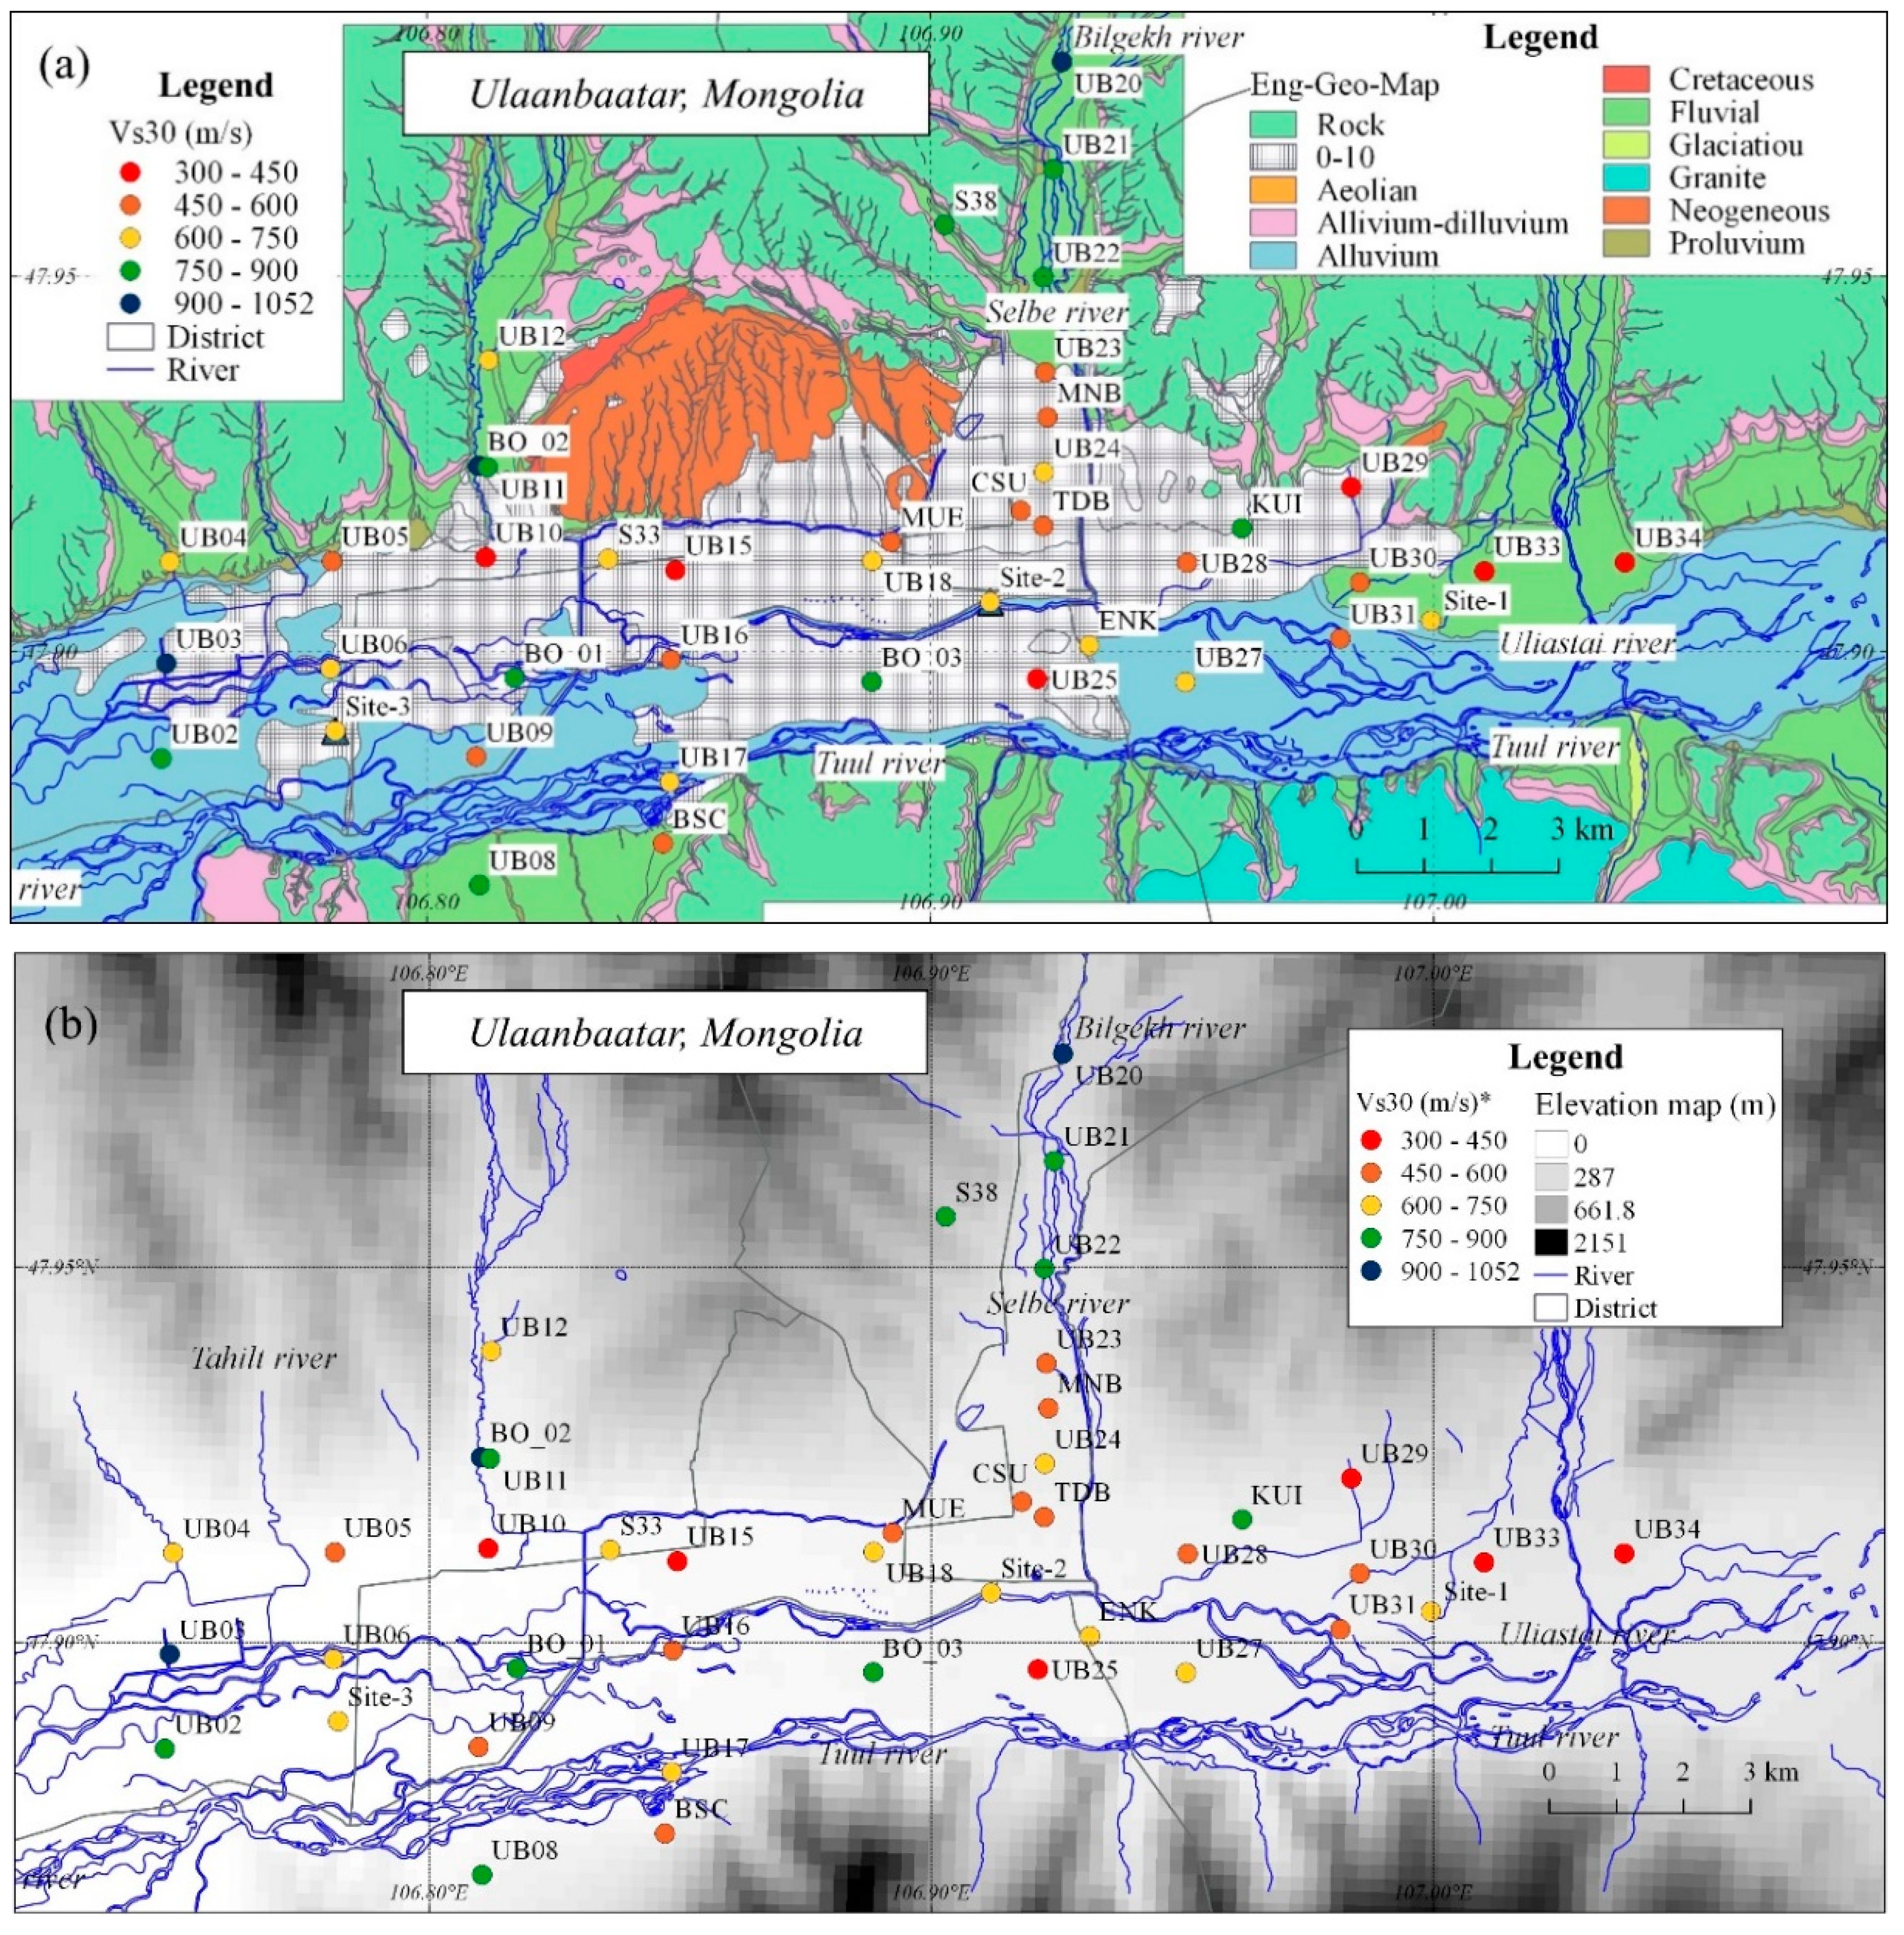
4.4. VS30 Distribution in UB.

Time-averaged shear-wave velocity in upper 30 m depth (VS30) has been used as an index of site characteristics in many applications such as ground motion prediction equations, building codes and earthquake hazard maps. In order to evaluate the pattern of VS30s in UB, the VS30s are calculated from the VS profiles inverted in the previous section.
Figure 9a shows VS30 distribution with the geotechnical map of UB [18]. According to this map, the UB basin has consisted mostly of Alluvium, Alluvium-Diluvium, Fluvial deposits, and the northern part has included of Neogene. The geological period of deposits is mostly Quaternary; an epoch is Holocene to Pleistocene. Bedrocks are mainly comprised of carboniferous shallow marine sedimentary rocks and Devonian to Carboniferous accretionary complex. Along the Tuul river, it is covered by sediments of sand, gravel, and mud, which is transported by the rivers. In addition, Selbe, Uliastai, Bilgekh, and Tahilt rivers are located around Ulaanbaatar city. All of these rivers are affected by the boundary of deposits and geotechnical conditions of the UB basin.
Figure 9b shows the map of VS30 distribution in UB paired with the 7.5-arcsecond resolution digital elevation model (DEM) of the Global multi-resolution terrain elevation data 2010 [22]. The elevation in Ulaanbaatar’s central area is 1280 to 1350 m above the sea level, and those in northern and southern mountains are higher than 2100 m.
Larger VS30 sites (larger than 750 m/s) are located near the mountain area such as UB20, UB22, KUI, and UB11. Smaller VS30 sites (less than 450 m/s) are distributed in the lower elevation area. In addition, the VS30s smaller than 450 m/s are expected near the Uliastai river such as UB34, UB33 and UB29 located in the eastern part of UB. In the central part of UB, the VS30 with 450 to 600 m/s are distributed such as CSU and TDB sites. Most of the sites in UB are classified to class C or B in the VS30 categories of the National Earthquake Hazards Reduction Program (NEHRP) [23], indicating that the site conditions are basically stiff and almost no very soft soils are expected in UB.

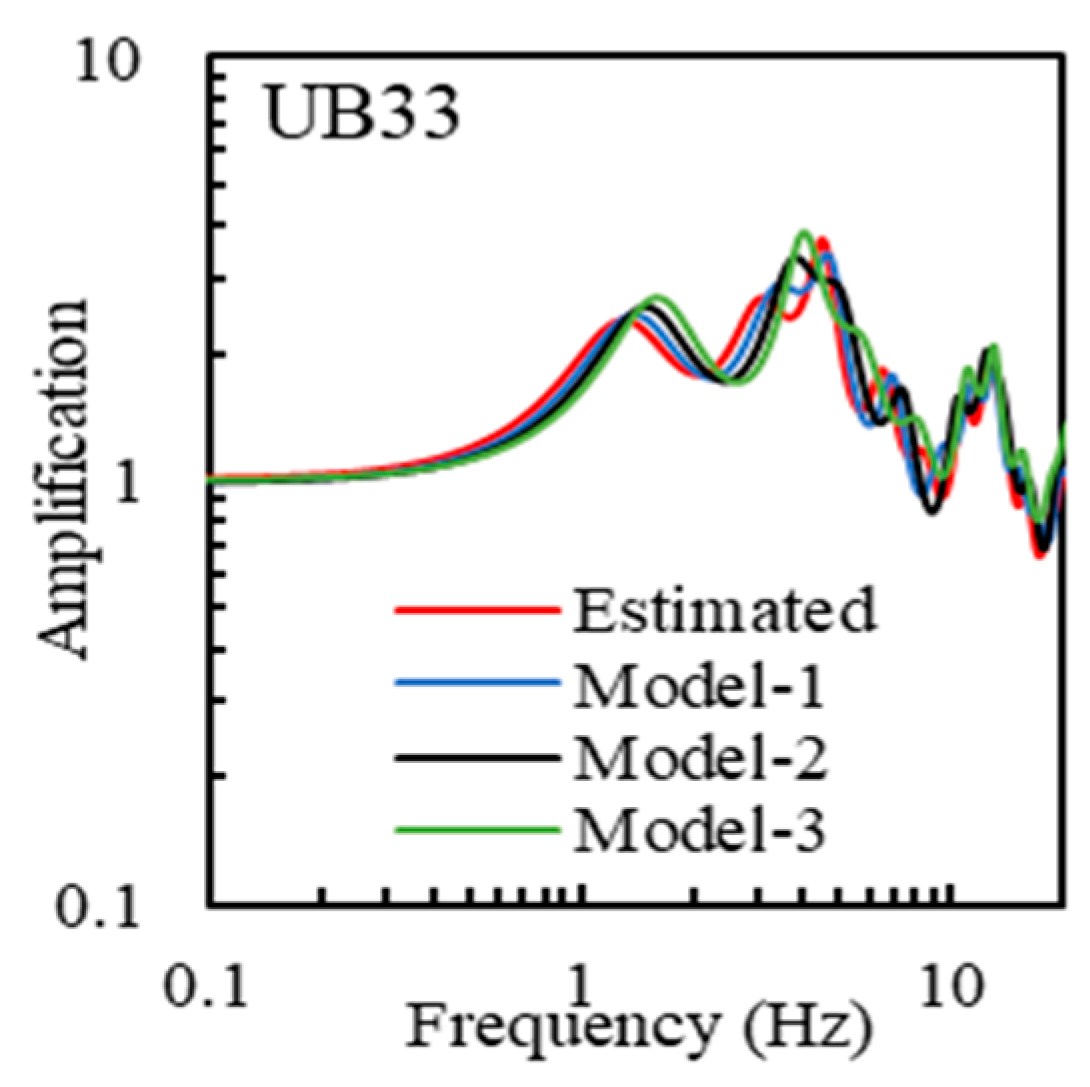
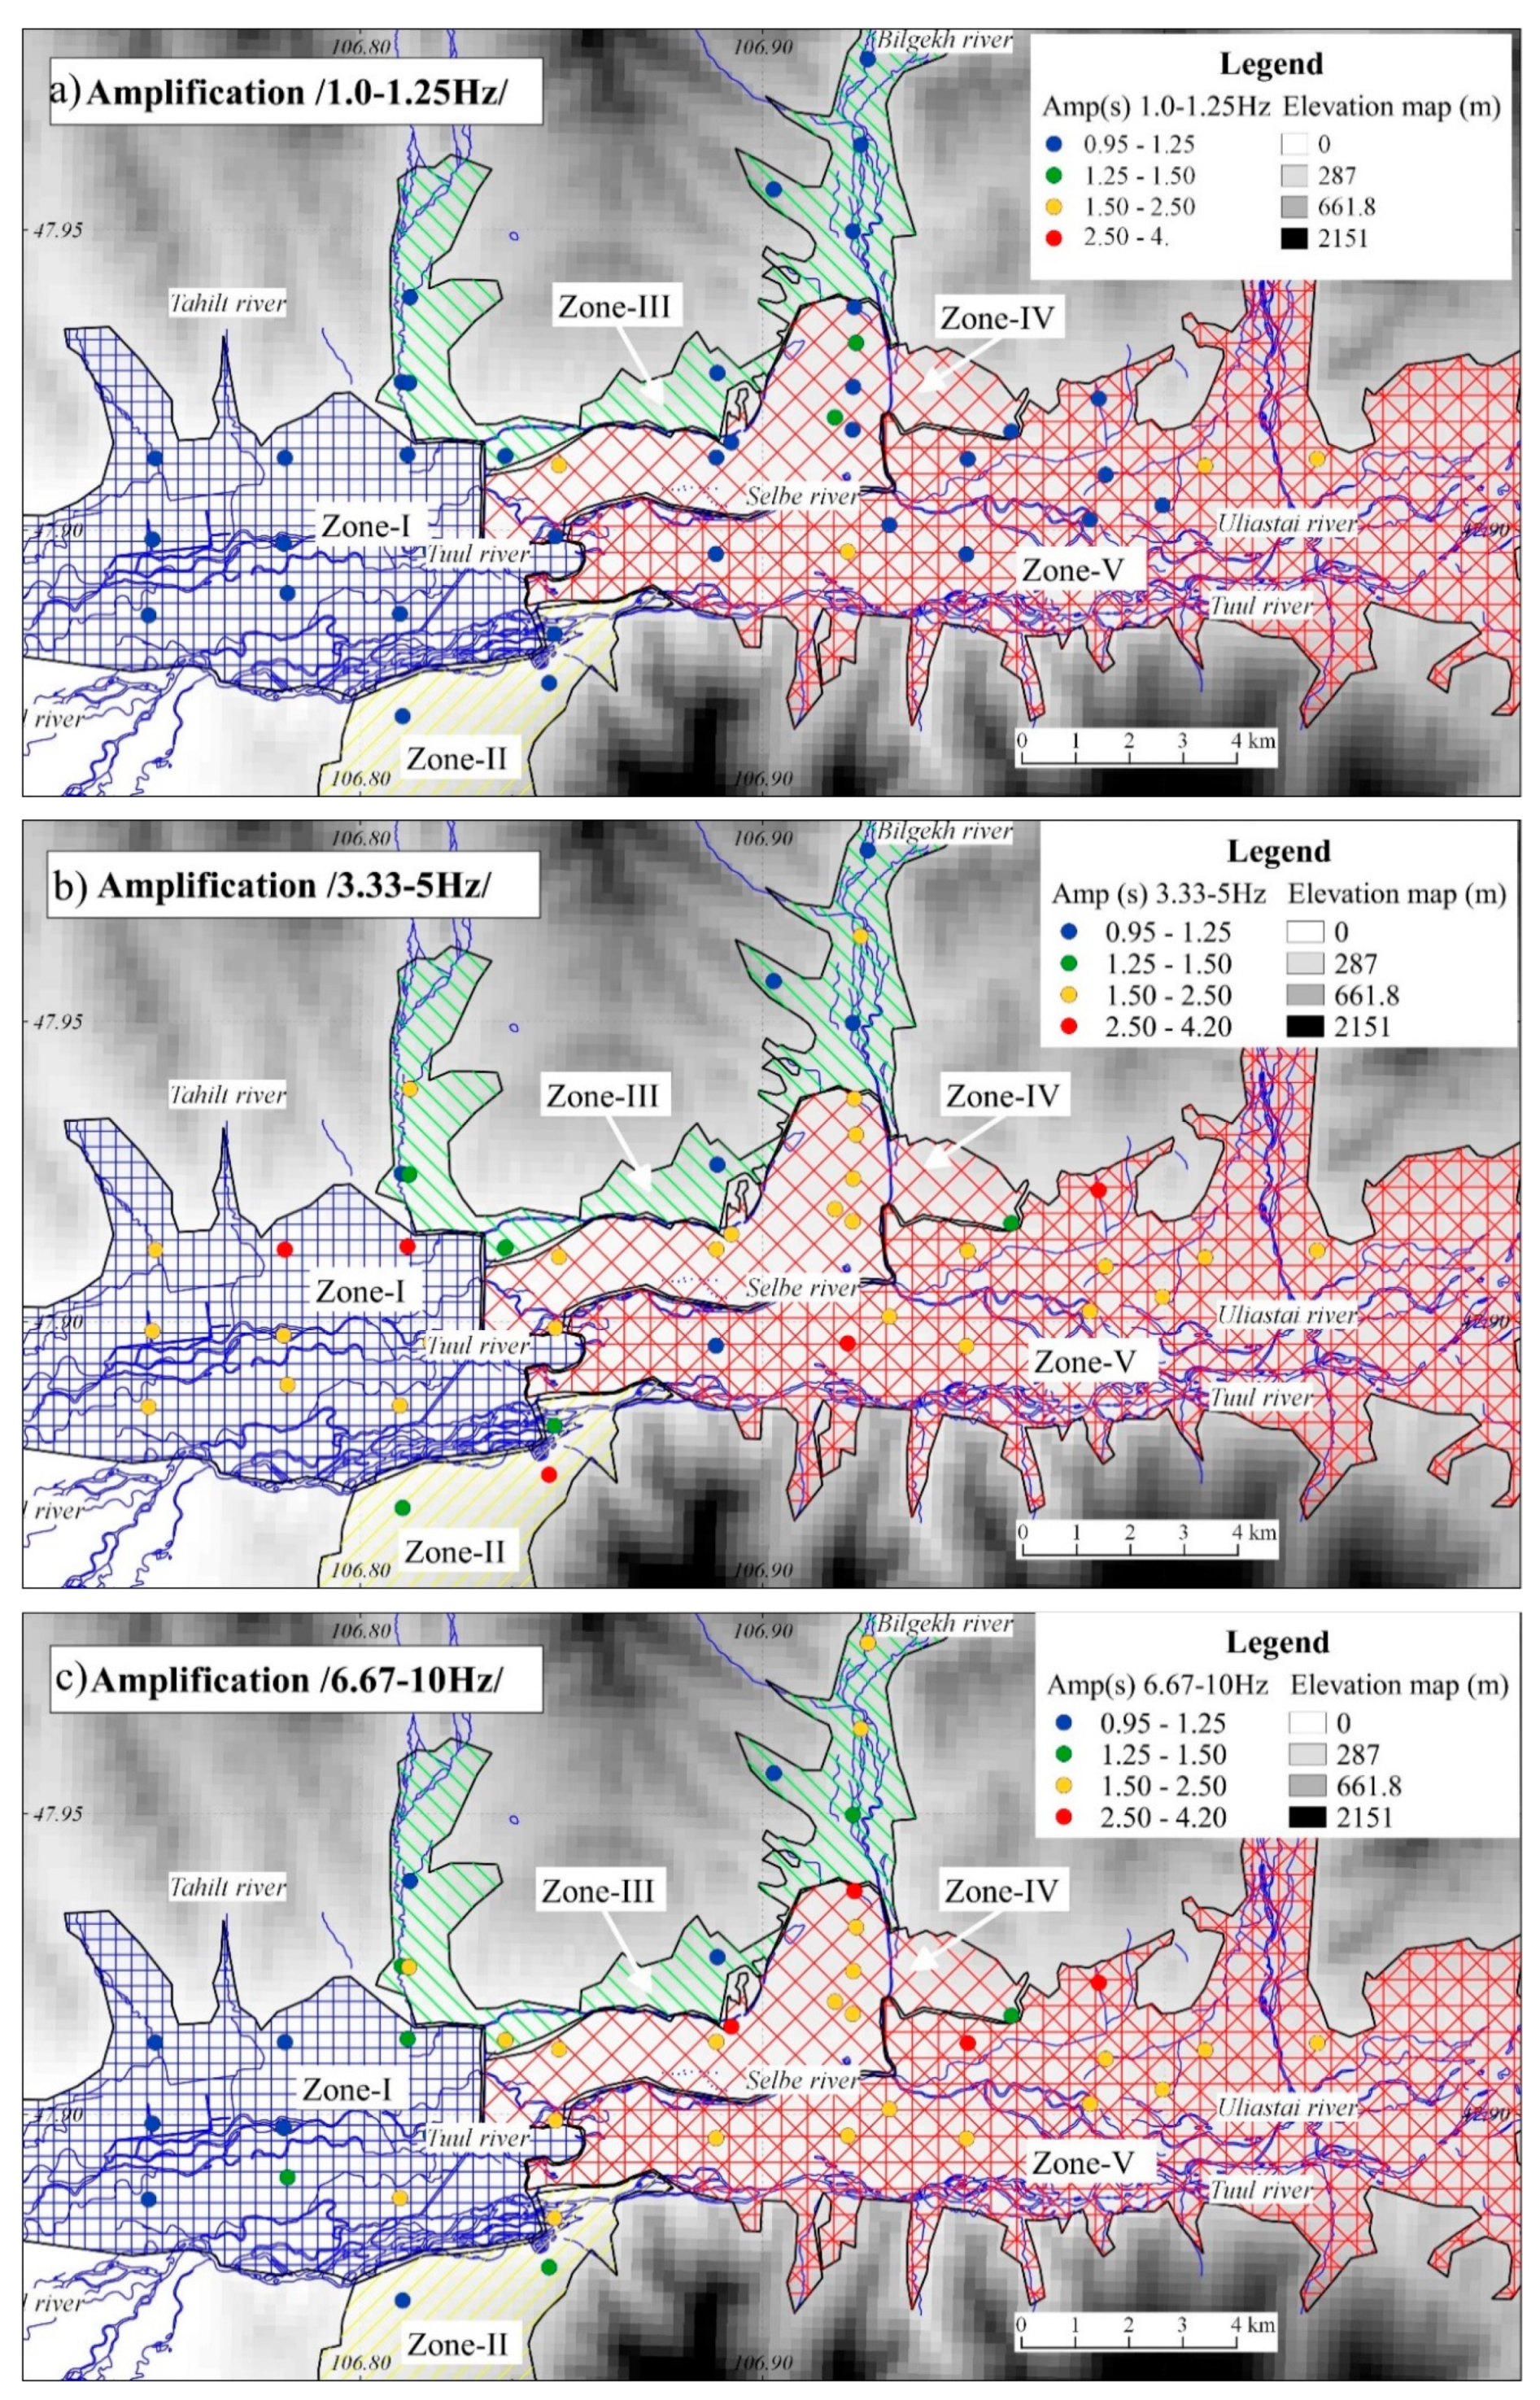
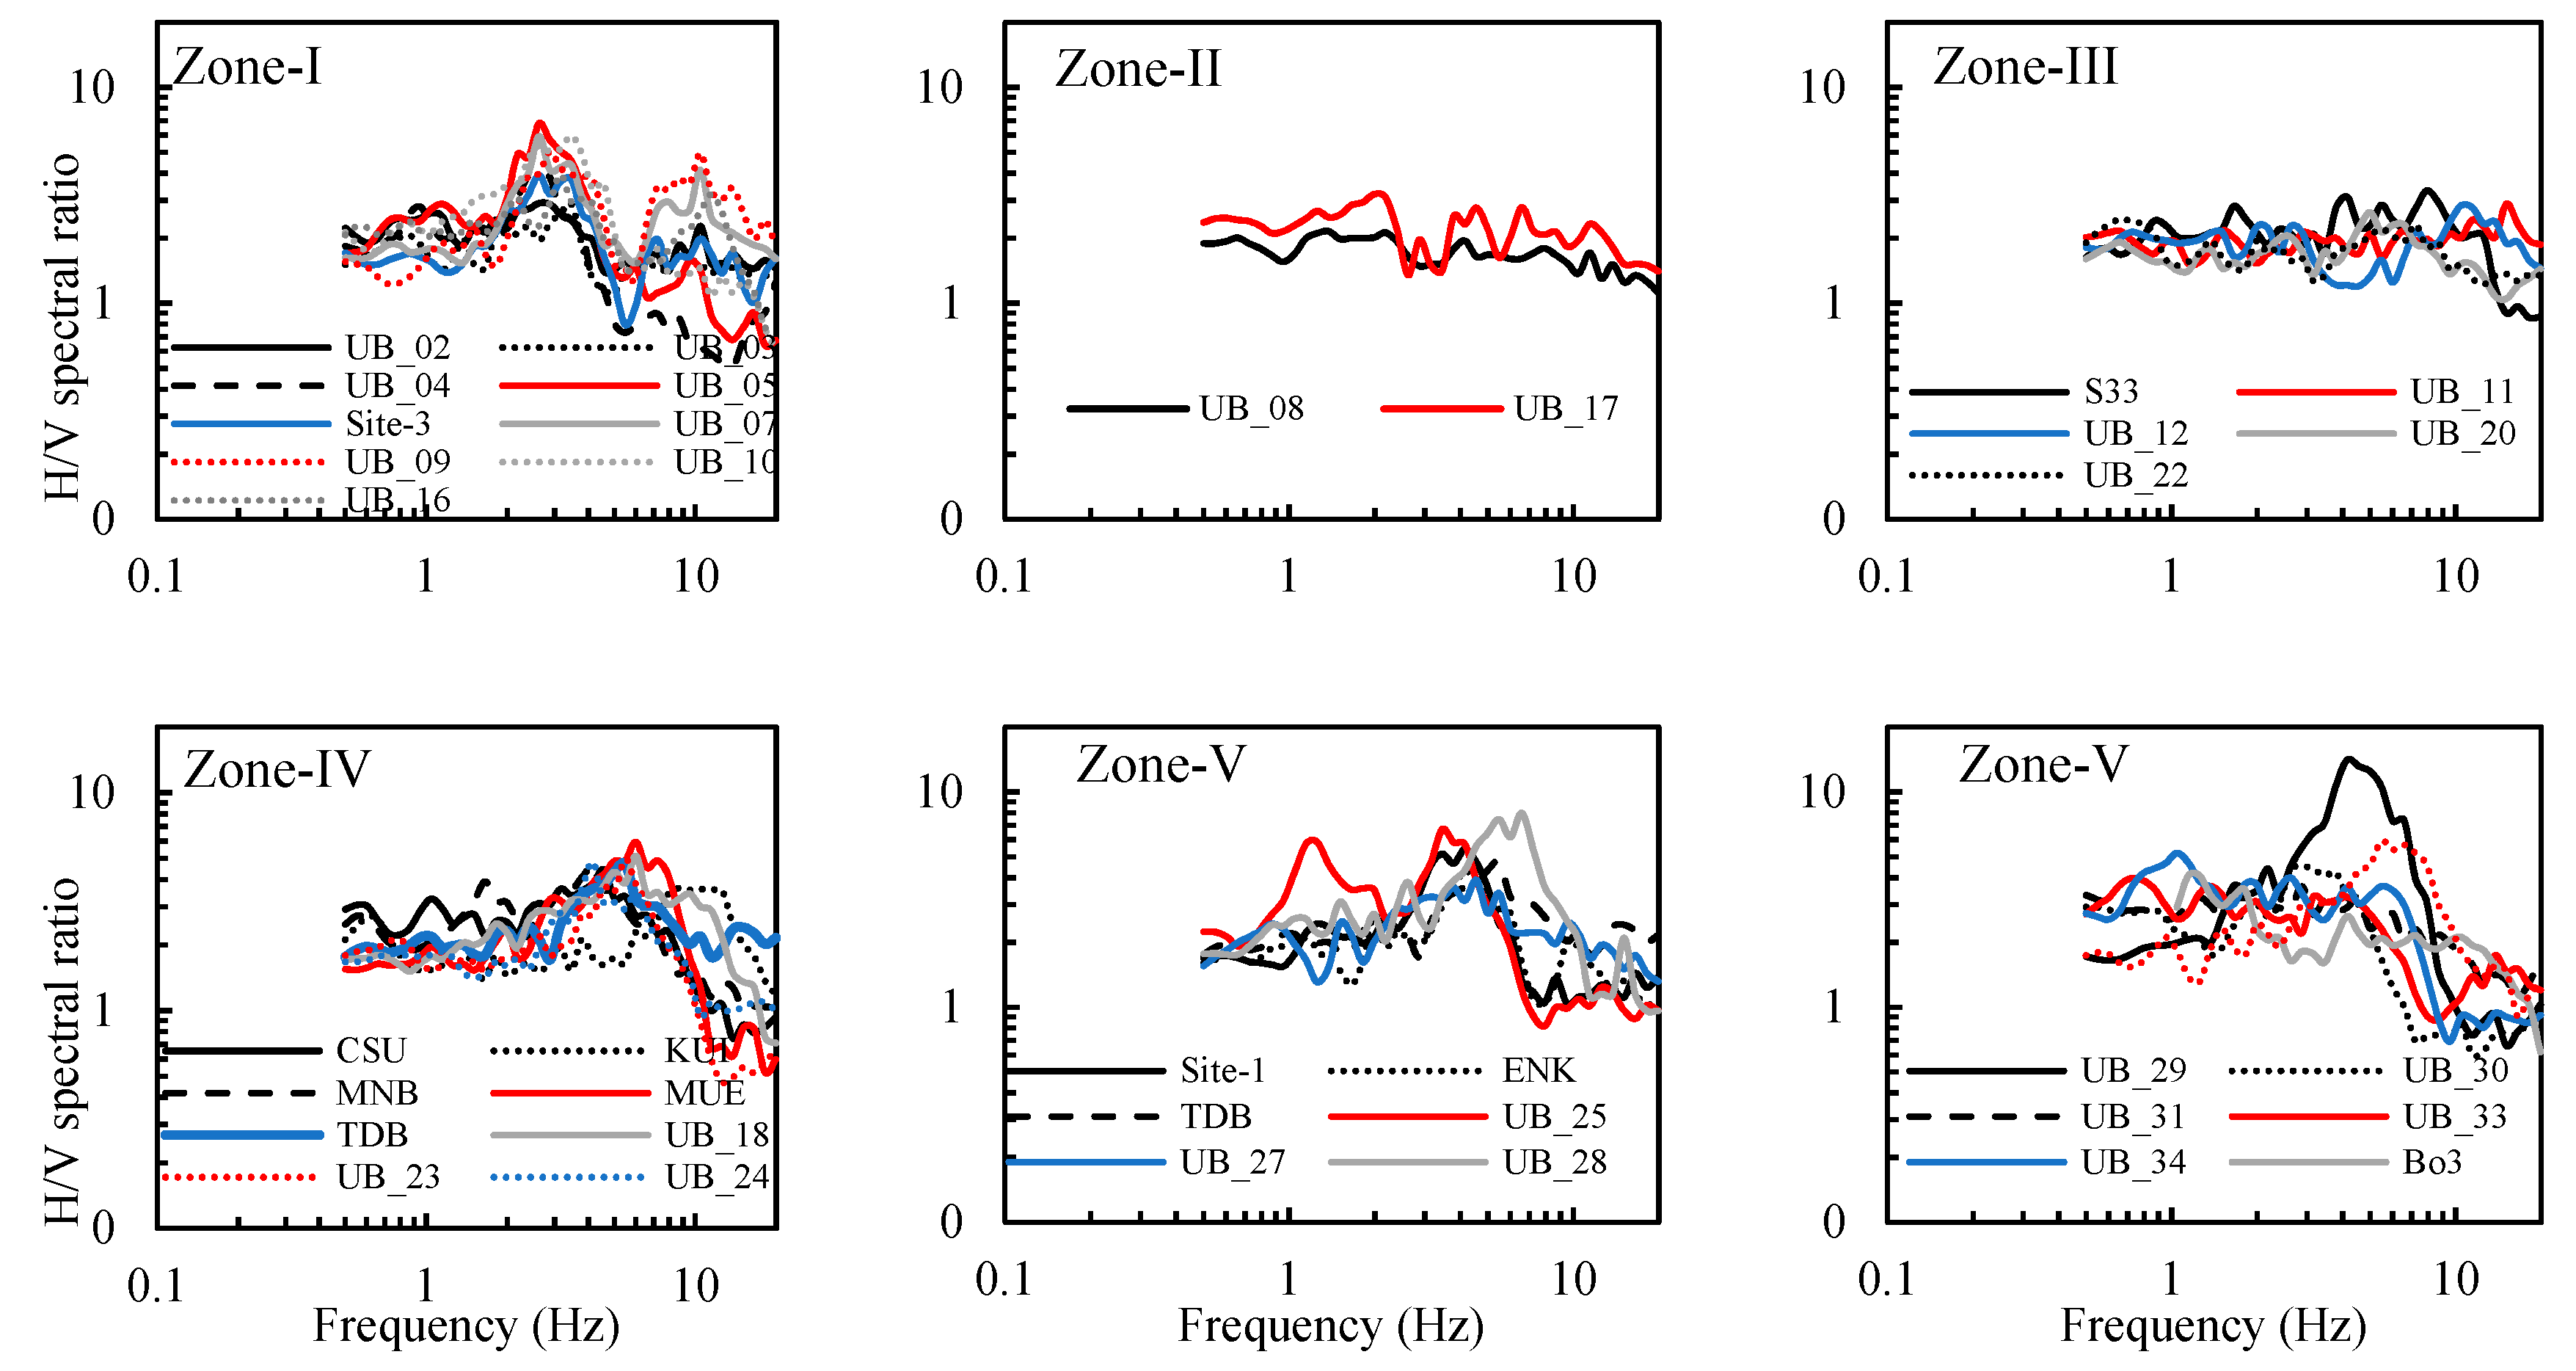
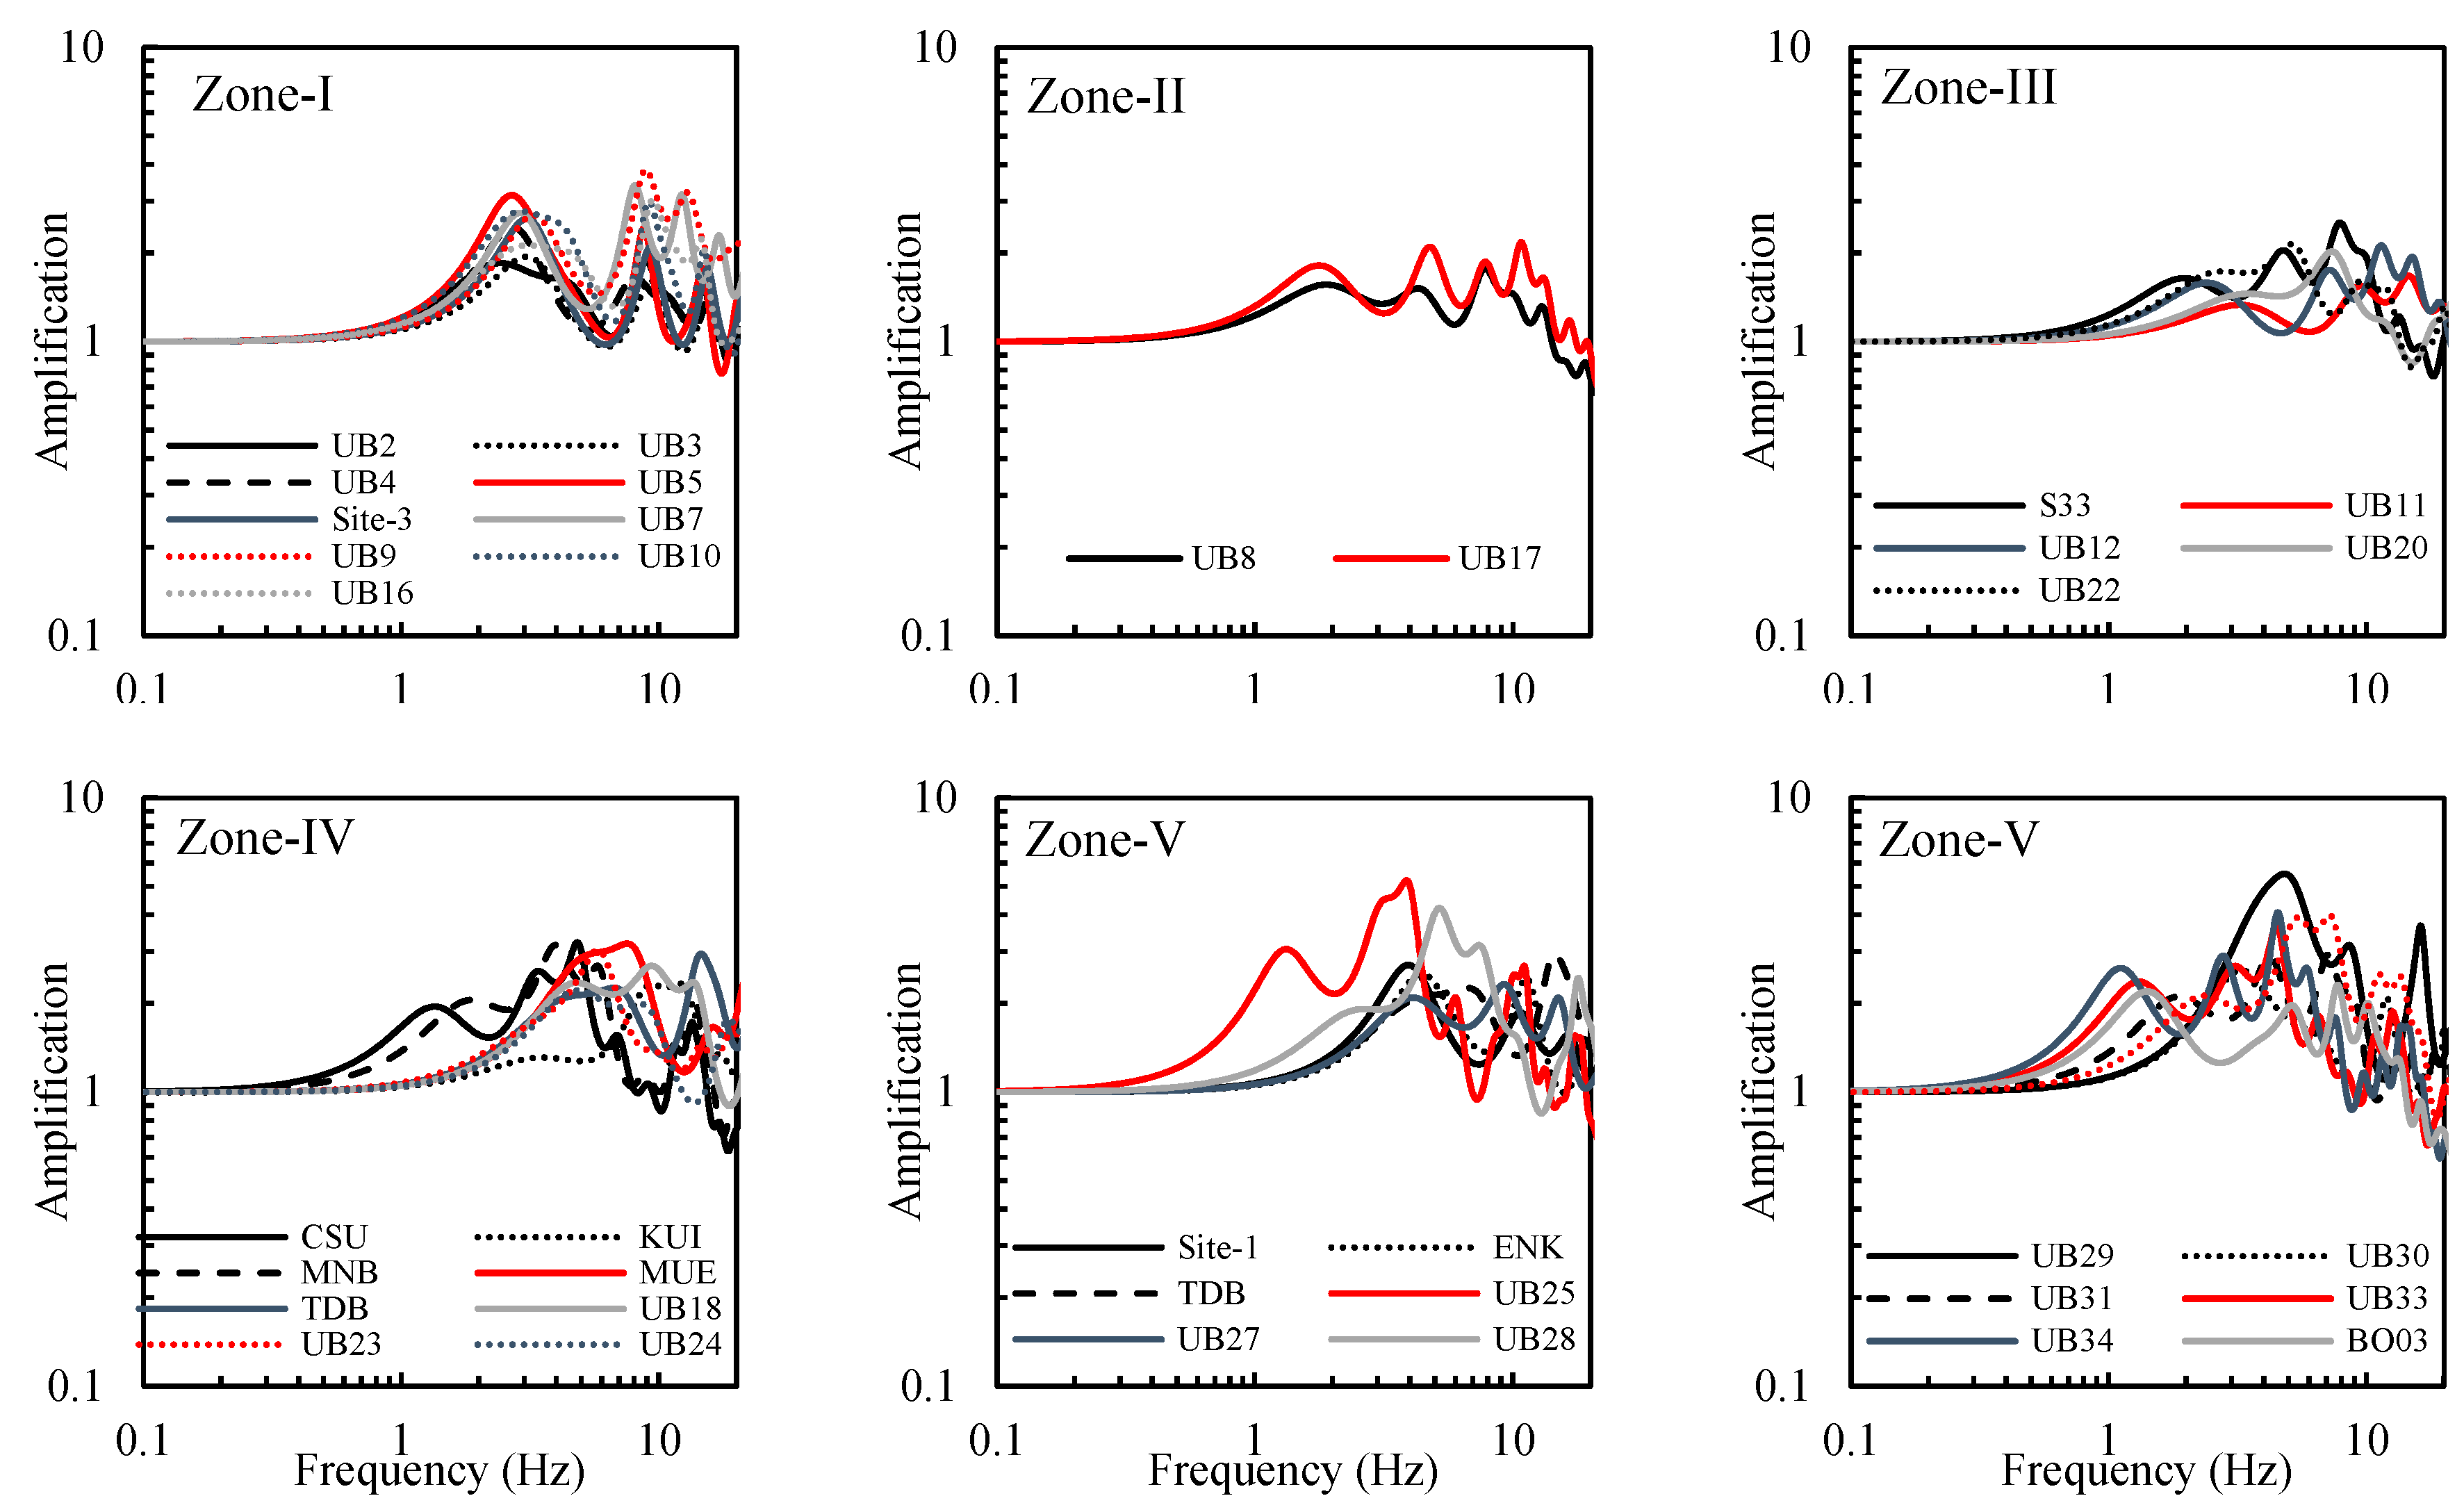
5. Site Effect Assessment

Concerning seismic hazards, key questions are whether high seismicity rate is representative of what we may expect in the future and what the hazard assessment is with smaller, but more frequent events. Site effects characterized by site amplifications would be necessary for seismic hazard mapping and microzoning would also convenient for understanding the patterns of the site amplification. In this study, the microzonation in UB is evaluated based on the site amplifications calculated from the inverted VS profiles.
At first, when we consider the geotechnical map [18] and the terrain map, the total area of UB is divided into three zones, such as the northern part mountain area, the central part along the Tuul river and the southern part. Then, we consider the site amplification characteristic at each site; almost the same amplitude and amplified frequency (around 2 to 3 Hz) are observed at sites in the western side of the central part. Finally, if we carefully look at the site amplifications at the rest of sites in the central part, largest amplitude and amplified frequency (around 5 to 6 Hz) sites are located in the southeastern zone along the Tuul river. Finally, we can divide all the sites into five amplification zones as shown in Figure 10. The distribution of the average site amplifications for 1.0–1.25 Hz, 3.33–5.0 Hz, and 6.67–10.0 Hz in the sites are displayed in Figure 10. The H/V spectral ratios for each zone and theoretically calculated site amplification in the zones are shown in Figure 11 and Figure 12. In addition, if we look at the H/V spectral ratios, predominant frequency and amplitude of each site’s H/V spectral ratios are also similar to each other in the same zone. Zone-I is located in the western part of the UB basin and north of the Tuul river, showing larger amplifications in around 2 to 3 Hz. Zone-II is in the southwestern part of UB and south of the Tuul river. Recently, newly developed built-up areas have been expanded to this zone. Moderate to small amplifications are expected in the zone. Zone-III is in the northern part of UB along the Bilgekh and Selbe rivers. As described above, these sites are located in higher elevation zones, and the VS30s are also larger than other areas. Small amplifications are expected for all frequency ranges in the zone. Zone-IV includes the central part of UB located in north of the Selbe river. Intermediate to large amplifications are calculated. Zone-V covers the eastern and southern parts of UB. This zone contains the major rivers such as Uliastai and Tuul rivers. Since the smaller VS30s are estimated in the region, the highest amplifications are obtained in UB, especially for the frequencies higher than 3 Hz as shown in Figure 12. Since thick sediments are determined in the zone as discussed above, stronger ground shaking would be excited in future earthquakes than other zones. In particular, newly urbanized areas have been expanded to the area of Zone-V as shown in Figure 13, indicating that it might be a higher risk in such new construction districts.

6. Conclusions

In this research, the shear-wave velocity model of UB is computed using microtremor data and the previous investigations for evaluating site amplifications and assessing seismic zoning in Ulaanbaatar city (UB). At first, the shear-wave velocity (VS) profiles in UB are estimated from the inversion analysis of the observed microtremor H/V spectral ratios (MHVRs) based on the diffuse field assumption. The joint inversions of the MHVRs and the surface wave dispersion curves obtained in the previous study are applied to the three sites in UB. In addition, the single inversion of the MHVRs estimates the VS profiles for the rest of the sites. A comparison between the inverted shallow VS profiles and the geological borehole information has shown that reliable results within the capabilities and the resolution of the methods could be achieved.
Finally, the seismic microzoning is performed based on the site amplifications obtained from the inverted VS profiles to characterize the patterns of seismic hazards. The UB areas are divided into five zones considering the site characterizations. Most significant site amplifications are expected around the Tuul river area, which consists of the deepest sedimentary deposit. In particular, Zone-V is the largest site amplified area, which means considerable risk for a newly constructed building district. Strong ground motion predictions and building damage estimation for scenario earthquakes based on the site characterization of this study will be performed in future works.

Author Contributions

Z.T. and H.M. conceived, designed the experiments and performed the field measurements. Z.T. analyzed the data and wrote the manuscript. T.T. supervised the field measurements. H.M. and T.T. also provided the corrections of the manuscript.

Funding

This research received no external funding.

Acknowledgments

The authors thank MJEED (Mongol-Japan Higher Engineering Education Development Project) for supporting this study and the Environmental and Earthquake Engineering project unit for helping the microtremor site observations.

Conflicts of Interest

The authors declare no conflict of interest.

References

  1. Adiya, M. Seismic Activity Near Ulaanbaatar: Implication for Seismic Hazard Assessment. Ph.D. Thesis, University of Strasbourg, Strasbourg, France, 2016. [Google Scholar]
  2. Oyun-Erdene, M.; Odonbaatar, C.; Ganzorig, D. Predicting strong ground motion of Emeelt fault. Sci. Acad. News 2014, 2, 48–56. (In Mongolian) [Google Scholar]
  3. Odonbaatar, C. Site effects characterization in the basin of Ulaanbaatar. Ph.D. Thesis, University of Strasbourg, Strasbourg, France, 2011. [Google Scholar]
  4. Dzurick, V.I.; Kluchevskii, A.I.; Serebnikov, S.P.; Demiyanovich, B.M.; Batsaikhan, T.; Bayaraa, G. Seismicity and Seismic Hazard Zoning of Mongolian Region; Earth’s Crust Institute: Irkutsk, Russia, 2009. [Google Scholar]
  5. The Government of Ulaanbaatar City, Japan International Cooperation Agency (JICA) and Emergency Management Department of the Capital City. Report of Mongolia “The Project for Strengthening the Capacity of Seismic Disaster Risk Management in Ulaanbaatar City”. Available online: http://open_jicareport.jica.go.jp/pdf/12129110_01.pdf (accessed on 11 April 2019).
  6. Nakamura, Y. A method for dynamic characteristics estimation of the subsurface using microtremor on the ground surface. Q. Rep. RTRI 1989, 30, 25–33. [Google Scholar]
  7. Lermo, J.; Chavez-Garcia, F.J. Are microtremors useful in site response evaluation? Bull. Seismol. Soc. Am. 1994, 84, 1350–1364. [Google Scholar]
  8. Lachet, C.; Bard, P.-Y. Numerical and theoretical investigations of the possibilities and limitations of Nakamura’s technique. J. Phys. Earth 1994, 42, 377–397. [Google Scholar] [CrossRef]
  9. Arai, H.; Tokimatsu, K. S-wave velocity profiling by inversion of microtremor H/V spectrum. Bull. Seismol. Soc. Am. 2004, 94, 53–63. [Google Scholar] [CrossRef]
  10. Arai, H.; Tokimatsu, K. S-wave velocity profiling by joint inversion of microtremor dispersion curve and horizontal-to-vertical (H/V) spectrum. Bull. Seismol. Soc. Am. 2005, 95, 1766–1778. [Google Scholar] [CrossRef]
  11. Sánchez-Sesma, F.J.; Weaver, R.L.; Kawase, H.; Matsushima, S.; Luzon, F.; Campillo, M. Energy partitions among elastic waves for dynamic surface loads in a semi-infinite solid. Bull. Seismol. Soc. Am. 2011, 101, 1704–1709. [Google Scholar] [CrossRef]
  12. Sánchez-Sesma, F.J.; Rodríguez, M.; Iturrarán-Viveros, U.; Luzón, F.; Campillo, M.; Margerin, L.; Rodríguez-Castellanos, A. A theory for microtremor H/V spectral ratio: Application for a layered medium. Geophys. J. Int. 2011, 186, 221–225. [Google Scholar] [CrossRef]
  13. García-Jerez, A.; Piña-Flores, J.; Sánchez-Sesma, F.J.; Luzón, F.; Perton, M. A computer code for forward calculation and inversion of the H/V spectral ratio under the diffuse field assumption. Comput. Geosci. 2016, 97, 67–78. [Google Scholar] [CrossRef] [Green Version]
  14. Piña-Flores, J.; Perton, M.; García-Jerez, A.; Carmona, E.; Luzón, F.; Molina-Villegas, J.C.; Sánchez-Sesma, F.J. The inversion of spectral ratio H/V in a layered system using the diffuse field assumption (DFA). Geophys. J. Int. 2017, 208, 577–588. [Google Scholar] [CrossRef]
  15. Sánchez-Sesma, F.J. Modeling and inversion of the microtremor H/V spectral ratio: Physical basis behind the diffuse field approach. Earth Planets Space 2017, 69, 92. [Google Scholar] [CrossRef]
  16. Kawase, H.; Mori, Y.; Nagashima, F. Difference of horizontal-to-vertical spectral ratios of observed earthquakes and microtremors and its application to S-wave velocity inversion based on the diffuse field concept. Earth Planet Space 2018, 70, 1. [Google Scholar] [CrossRef] [Green Version]
  17. Fujishima, D.; Miura, H.; Kanno, T.; Shigefuji, M.; Abiru, T.; Nakamura, H.; Aoi, S. Estimation accuracy of shear wave velocity profiles inverted from earthquake and microtremor H/V spectral ratios. In Proceedings of the 15th Japan Earthquake Engineering Symposium, Sendai, Japan, 6–8 December 2018; pp. 2141–2149, (In Japanese with English abstract). [Google Scholar]
  18. Orkhon Hydrogeology Co. Ltd. Engineering geological map of Ulaanbaatar; Ministry of Construction of Mongolia: Ulaanbaatar, Mongolia, 2014.
  19. Kitsunezaki, C.; Goto, N.; Kobayashi, Y.; Ikawa, T.; Horike, M.; Saito, T.; Kurota, T.; Yamane, K.; Okuzumi, K. Estimation of P and S-wave velocities in deep soil deposits for evaluating ground vibrations in earthquake. J. Nat. Dis. Sci. 1990, 9, 1–17, (In Japanese with English abstract). [Google Scholar]
  20. Kirkpatricks, S.; Gelatt, C.D., Jr.; Vecchi, M.P. Optimization by simulated annealing. Science 1983, 220, 671–680. [Google Scholar] [CrossRef] [PubMed]
  21. Haskell, N.A. Crustal reflection of plane SH-waves. J. Geophys. Res. 1960, 65, 4147–4150. [Google Scholar] [CrossRef]
  22. Danielson, J.J.; Gesch, D.B. Global Multi-Resolution Terrain Elevation Data 2010 (GMTED2010). Available online: https://pubs.usgs.gov/of/2011/1073/pdf/of2011-1073.pdf (accessed on 11 April 2019).
  23. Building Seismic Safety Council (BSSC). NEHRP Recommended Seismic Provisions for New Buildings and other Structures, Part 1 (Provisions) and Part 2 (Commentary to ASCE/SEI 7); Federal Emergency Management Agency: Washington, DC, USA, 2009.
Figure 1. Location map of the study area with Japan International Cooperation Agency’s (JICA) report reference sites and the location of the Emeelt fault.
Geosciences 09 00228 g001
Figure 2. Microtremor observation sites in Ulaanbaatar city. Values in brackets indicate peak frequencies identified from microtremor horizontal-to-vertical ratios (MHVRs).
Geosciences 09 00228 g002
Figure 3. Typical site observation photos and observed H/V spectral ratios at B30, B28, and BO3.
Geosciences 09 00228 g003
Figure 4. (a) Comparison of observed and theoretical and observed H/V spectral ratios; (b) Comparison of observed and theoretical surface wave dispersion curves and (c) Shear-wave velocity profiles obtained by joint inversion at Site-1, 2, and 3.
Geosciences 09 00228 g004
Figure 5. Observed and theoretical MHVRs obtained by single inversion; the black line indicates observed MHVR; the red line indicates inverted best MHVR; the gray lines indicate inverted models.
Geosciences 09 00228 g005aGeosciences 09 00228 g005b
Figure 6. Estimated shear-wave velocity profiles of all sites obtained from microtremor single inversions.
Geosciences 09 00228 g006
Figure 7. Variations of theoretical site amplification analysis.
Geosciences 09 00228 g007
Figure 8. Comparison of estimated shear-wave velocity profiles and existing borehole data.
Geosciences 09 00228 g008
Figure 9. (a) VS30 distribution map with geotechnical map [18]; (b) VS30 distribution map with a digital elevation model (DEM).
Geosciences 09 00228 g009
Figure 10. Distribution of site amplifications with the zoning map for (a) 1.0–1.25 Hz, (b) 3.33–5.0 Hz, and (c) 6.67–10 Hz.
Geosciences 09 00228 g010
Figure 11. Observed H/V spectral ratios for each zone in Ulaanbaatar city (UB).
Geosciences 09 00228 g011
Figure 12. Theoretical site amplifications for each zone in Ulaanbaatar (UB).
Geosciences 09 00228 g012
Figure 13. Photographs of newly constructed high-rise buildings in Zone-V. (Left: taken by authors on 20 March 2018, Right: taken on 14 March 2019).
Geosciences 09 00228 g013
Table 1. Initial inversion parameter ranges for Site-1.
LayerThickness (m)VS (m/s)VP (m/s)Density (kg/m3)
10–20200–600350–14001600–1800
20–80250–800450–24001700–1900
30–100400–1200830–26001800–2000
40–1001200–15002600–29501900–2100
5-180032802000–2200
Table 2. Initial inversion parameter ranges for Site-2.
LayerThickness (m)VS (m/s)VP (m/s)Density (kg/m3)
12–8200–500360v11201600–1800
22–8300–700580–17901700–1900
34–104400–1000830–24001800–2000
44–1001200–15002620–29501900–2100
5-180032802000-2200
Table 3. Initial inversion parameter ranges for Site-3.
LayerThickness (m)VS (m/s)VP (m/s)Density (kg/m3)
12–8160–600280–14001600–1800
22–8300–700580–17901700–1900
34–104400–1000830–24001800–2000
44–1001200–15002600–29501900–2100
5-180032802000–2200
Table 4. Initial inversion parameter of the typical site (UB25).
JICA’s ReportThis Study
LayerThickness (m)VS (m/s)Thickness (m)VS (m/s)
10–4207–3230–20150–500
20–6436–7030–50180–1000
3--0–100600–1500
4---1800
Table 5. The parameters for sensitivity analysis (UB33).
EstimatedModel-1Model-2Model-3
VS (m/s)Thickness (m)Thickness (m)Thickness (m)Thickness (m)
1327.719.419.419.419.4
2769.285.285.285.285.2
31054.0298.580.060.040.0
41800.0----

