Article

U–Pb Geochronology of Hydrothermal Monazite from Uraniferous Greisen Veins Associated with the High Heat Production Mount Douglas Granite, New Brunswick, Canada

by
Nadia Mohammadi
*,
Christopher R. M. McFarlane
and
David R. Lentz
Department of Earth Sciences, University of New Brunswick, 2 Bailey Drive, Fredericton, NB E3B5A3, Canada
*
Author to whom correspondence should be addressed.
Geosciences 2019, 9(5), 224; https://doi.org/10.3390/geosciences9050224
Submission received: 9 January 2019 / Revised: 1 May 2019 / Accepted: 7 May 2019 / Published: 15 May 2019

Abstract

:
A combination of in situ laser ablation inductively coupled plasma–mass spectrometry (LA ICP–MS) analyses guided by Scanning Electron Microscope–Back-Scattered Electron imaging (SEM–BSE) was applied to hydrothermal monazite from greisen veins of the Late Devonian, highly evolved, uraniferous Mount Douglas Granite, New Brunswick, Canada. Understanding the uraniferous nature of the suite and characterizing the hydrothermal system that produced the associated mineralized greisen veins were the main goals of this study. The uraniferous nature of the Mount Douglas Granite is evident from previous airborne radiometric surveys, whole-rock geochemical data indicating high U and Th (2–22 ppm U; 19–71 ppm Th), the presence of monazite, zircon, xenotime, thorite, bastnaesite, and uraninite within the pluton and the associated hydrothermal greisen veins, as well as anomalous levels of U and Th in wolframite, hematite, and martite within greisen veins. New U–Pb geochronology of hydrothermal monazite coexisting with sulfide and oxide minerals yielded mineralization ages ranging from 344 to 368 Ma, with most of them (90%) younger than the crystallization age of the pluton (368 ± 3 Ma). The younger mineralization age indicates post-magmatic hydrothermal activities within the Mount Douglas system that was responsible for the mineralization. The production of uraniferous greisen veins by this process is probably associated with the High Heat Production (HHP) nature of this pluton, resulting from the radioactive decay of U, Th, and K. This heat prolongs post-crystallization hydrothermal fluid circulation and promotes the generation of hydrothermal ore deposits that are younger than the pluton. Assuming a density of 2.61 g/cm3, the average weighted mean radiogenic heat production of the Mount Douglas granites is 5.9 µW/m3 (14.1 HGU; Heat Generation Unit), in which it ranges from 2.2 µW/m3 in the least evolved unit, Dmd1, up to 10.1 µW/m3 in the most fractionated unit, Dmd3. They are all significantly higher than the average upper continental crust (1.65 µW/m3). The high radiogenic heat production of the Mount Douglas Granite, accompanied by a high estimated heat flow of 70 mW/m2, supports the assignment of the granite to a ‘hot crust’ (>7 HGU) HHP granite and highlights its potential for geothermal energy exploration.

Graphical Abstract

1. Introduction

The highly fractionated peraluminous Mount Douglas Granite (MDG), composed of three units (Dmd1, Dmd2, and Dmd3; Figure 1 and Figure 2), has characteristic features of High Heat Production (HHP) Granites, in which the granites have elevated concentrations of K2O, Rb, LREE, U, and Th. They produce anomalous heat generated by the radioactive decay of unstable isotopes, such as 238U, 232Th, and 40K, that makes such shallow high-heat producing intrusions potentially important geothermal sources. The uraniferous nature of the MDG has been reported previously by Chandra [1], Hassan [2], Hassan and Hale [3], and Hassan et al. [4] and was confirmed in this study as well (e.g., see Table 1). Their investigations followed up on airborne radiometric (Airborne Gamma-Ray Spectrometer survey) anomalies in New Brunswick that demonstrated a high potential for U-enrichment in the eastern part of the Saint George Batholith, i.e., the area underlain by the MDG. There are other places in New Brunswick that are associated with high U anomalies, such as the Late Devonian Mount Pleasant Volcanic Complex, Late Devonian Harvey Group [5], as well as the North Pole Granitic Suite in north-central New Brunswick, which is considered a high-heat producing granite [6,7]. Demonstrating the effects of the pluton on any associated hydrothermal systems and elucidating the association of hydrothermal veins with specific hydrothermal events or a single magmatic phase are critical to understand in such a geologically complex system. The radiogenic heat production of the MDG was also examined to determine any potential Hot Dry Rock (HDR) geothermal resources in this area.
Monazite, a light rare-earth element (LREE)-rich phosphate (LREEPO4), that has a closure temperature of Pb diffusion >800 °C due to slow diffusivity of Pb [8,9,10], is a desirable geochronometer for dating hydrothermal ore deposits. Although there are some difficulties in distinguishing between hydrothermal and igneous monazite, in situ analytical techniques [11,12,13,14] were applied to hydrothermal monazite to determine the evolution and chronology of ore deposits and the associated hydrothermal systems.
Greisen/sheeted veins associated with the MDG contain various endogranitic Sn, W, Mo, Bi, and Zn occurrences that are hosted by two highly differentiated units of the pluton, i.e., Dmd2 and Dmd3 (Figure 1 and Figure 2). Complex hydrothermal parageneses include a number of oxide and sulfide minerals, e.g., pyrite, arsenopyrite, hematite, martite/magnetite, wolframite, sphalerite, chalcopyrite, galena, cassiterite, and native bismuth with locally U-, Th-, and REE-bearing minerals, including monazite, zircon, xenotime, thorite, bastnaesite, and uraninite. Thus, these veins provide an excellent opportunity to determine the timing of greisenization relative to magma crystallization. For this study, hydrothermal monazite was considered for further examination and was analyzed using an in situ laser ablation quadrupole inductively coupled plasma–mass spectrometry (LA ICP–MS) to better understand the complex hydrothermal system in the MDG.

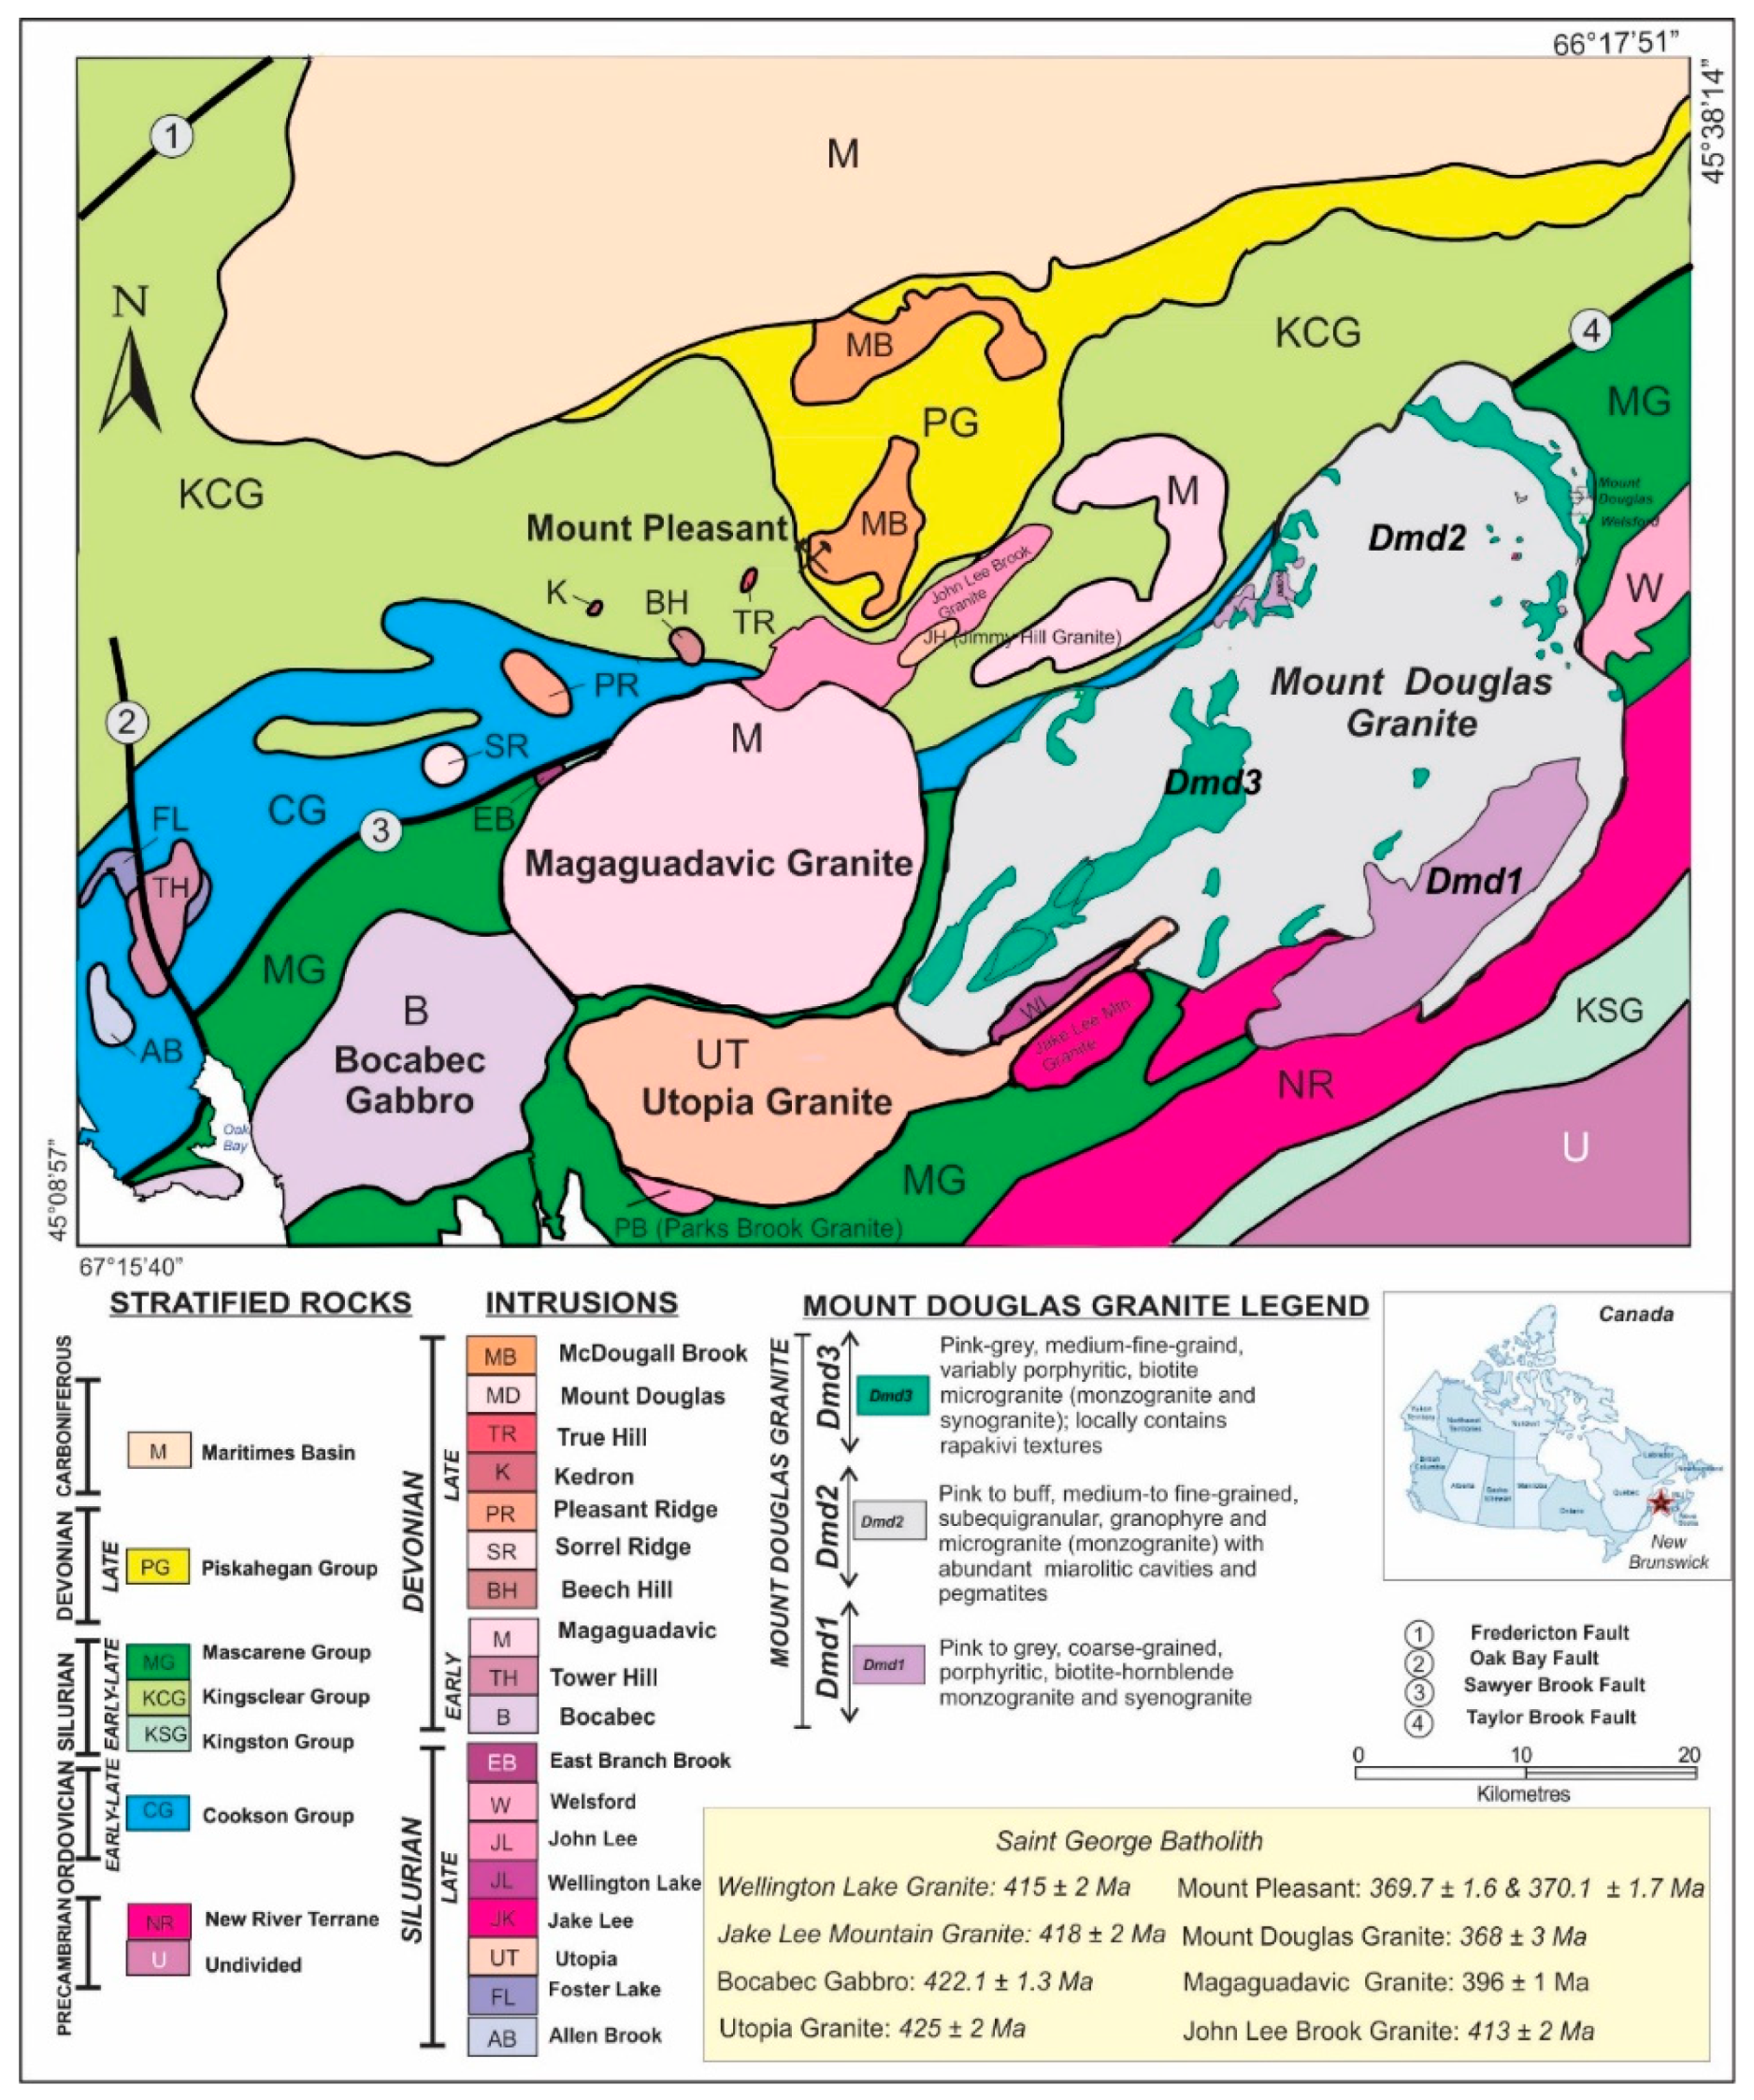
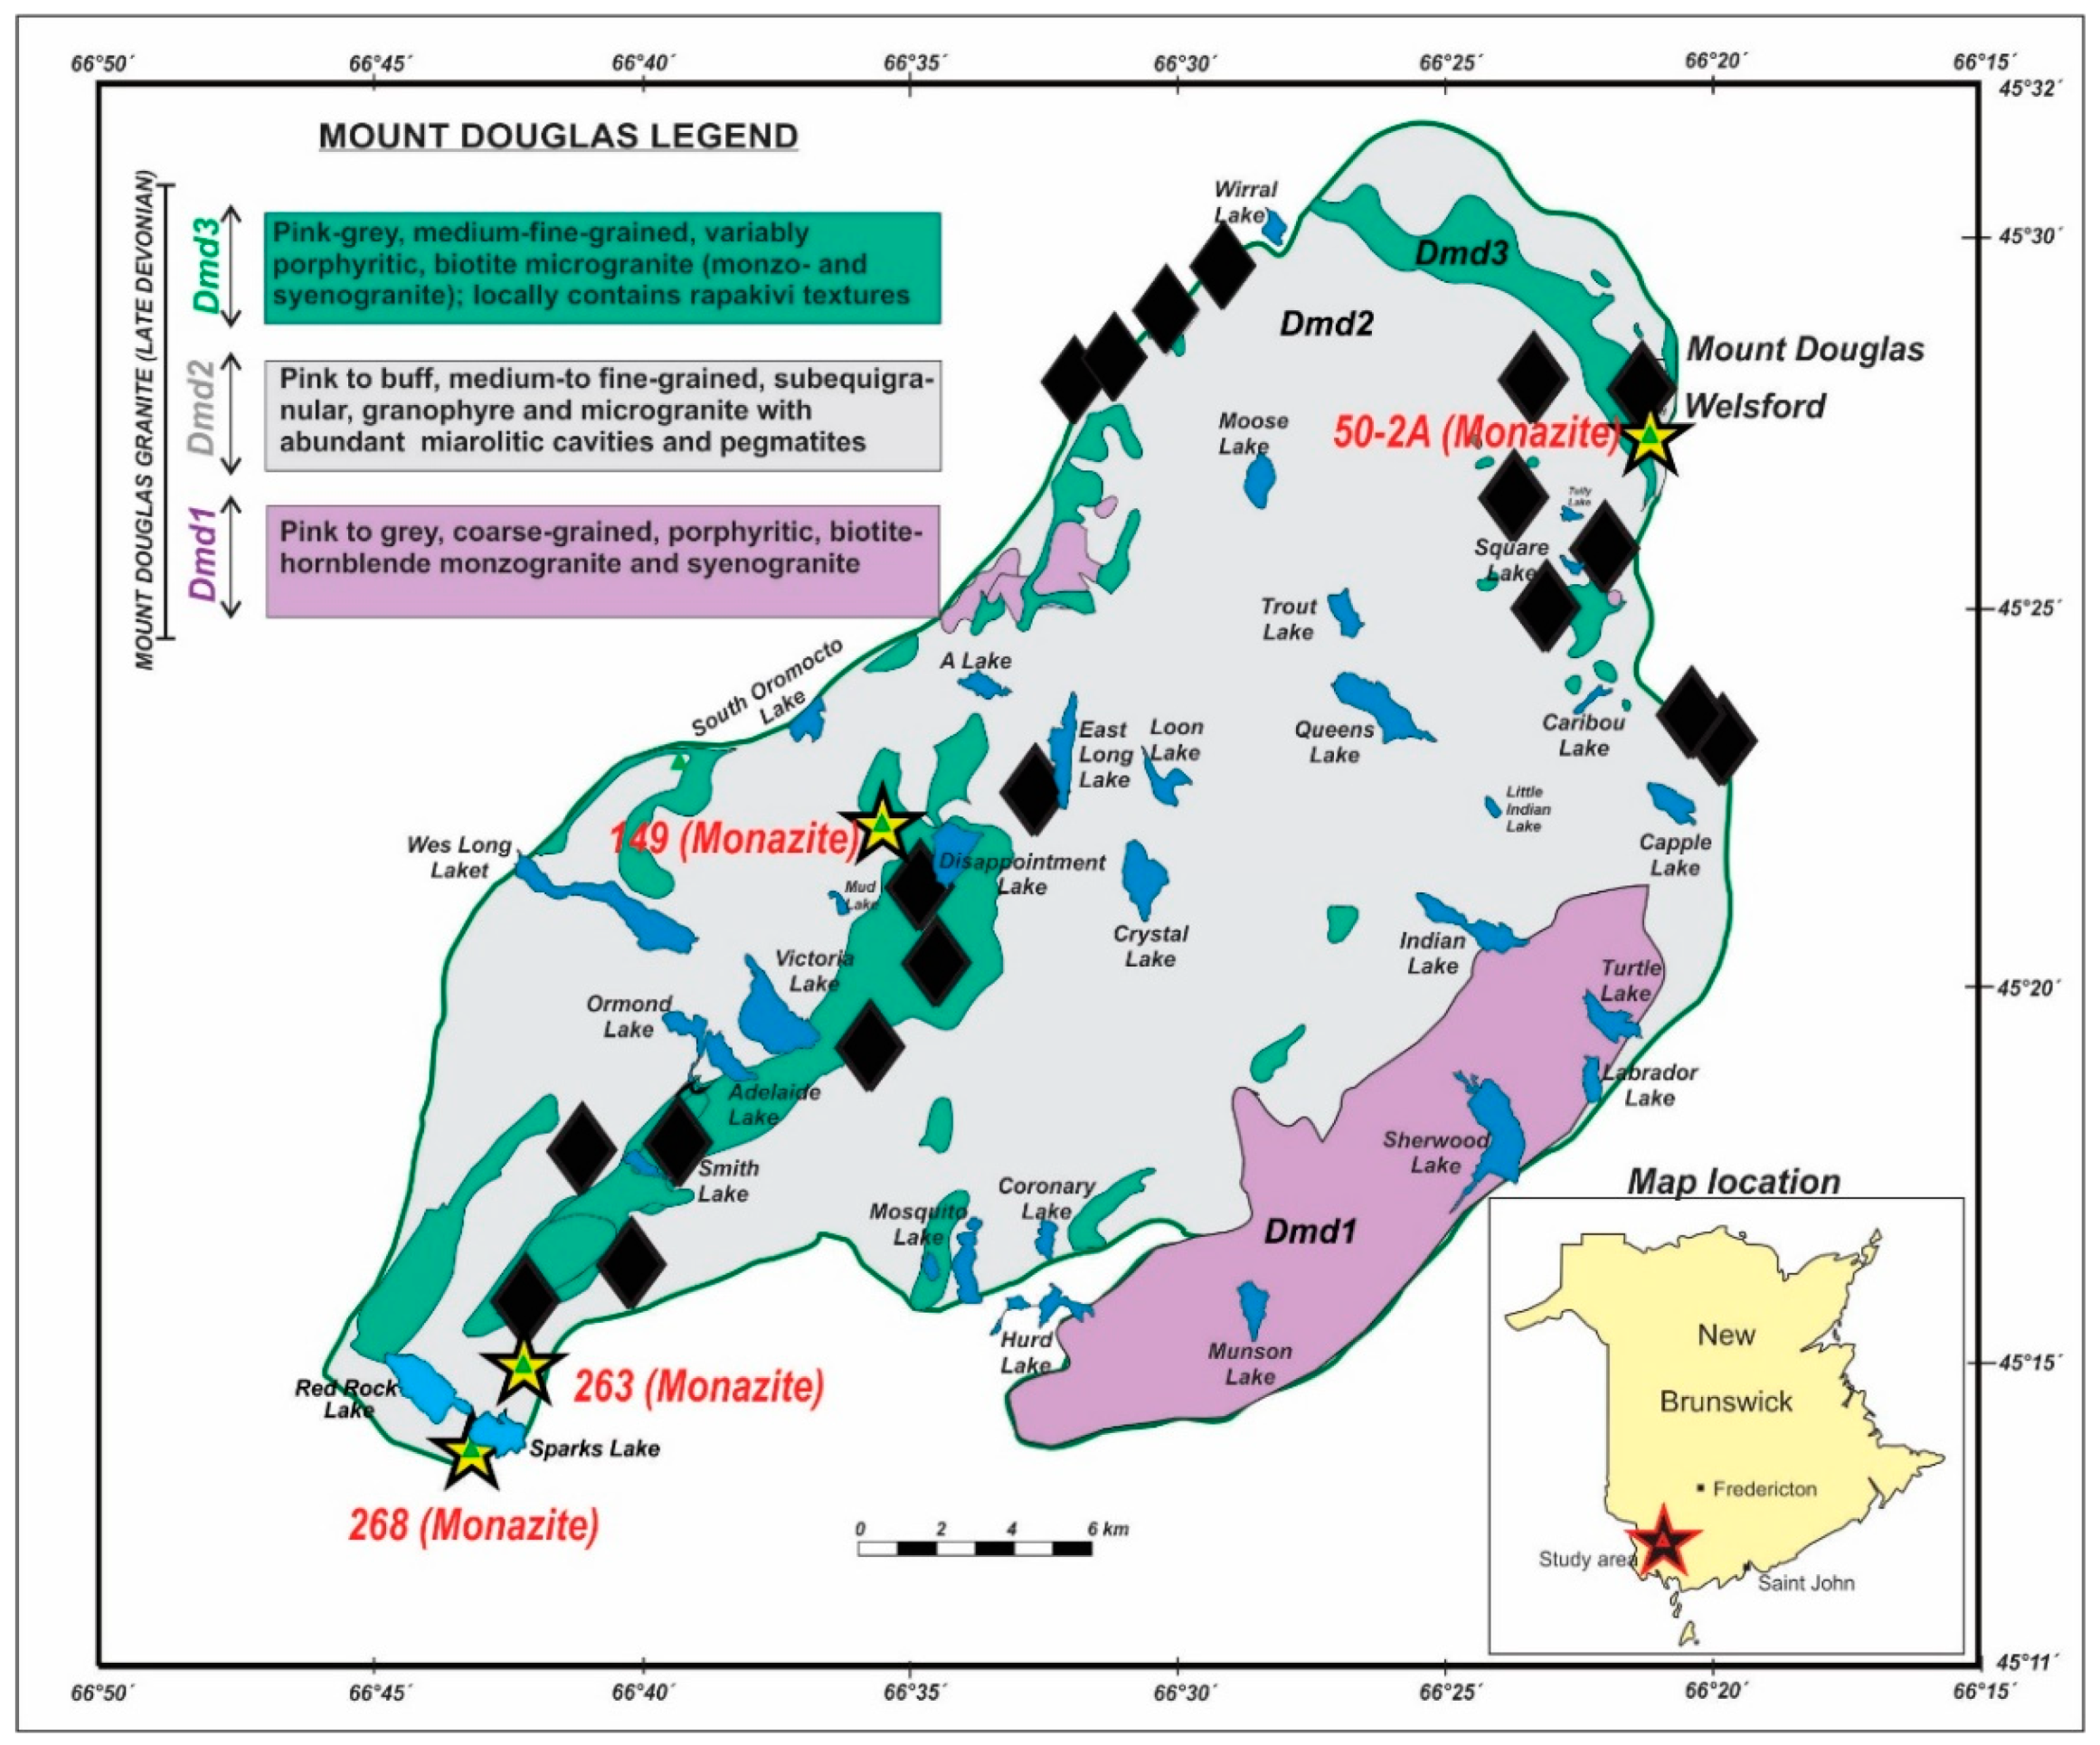
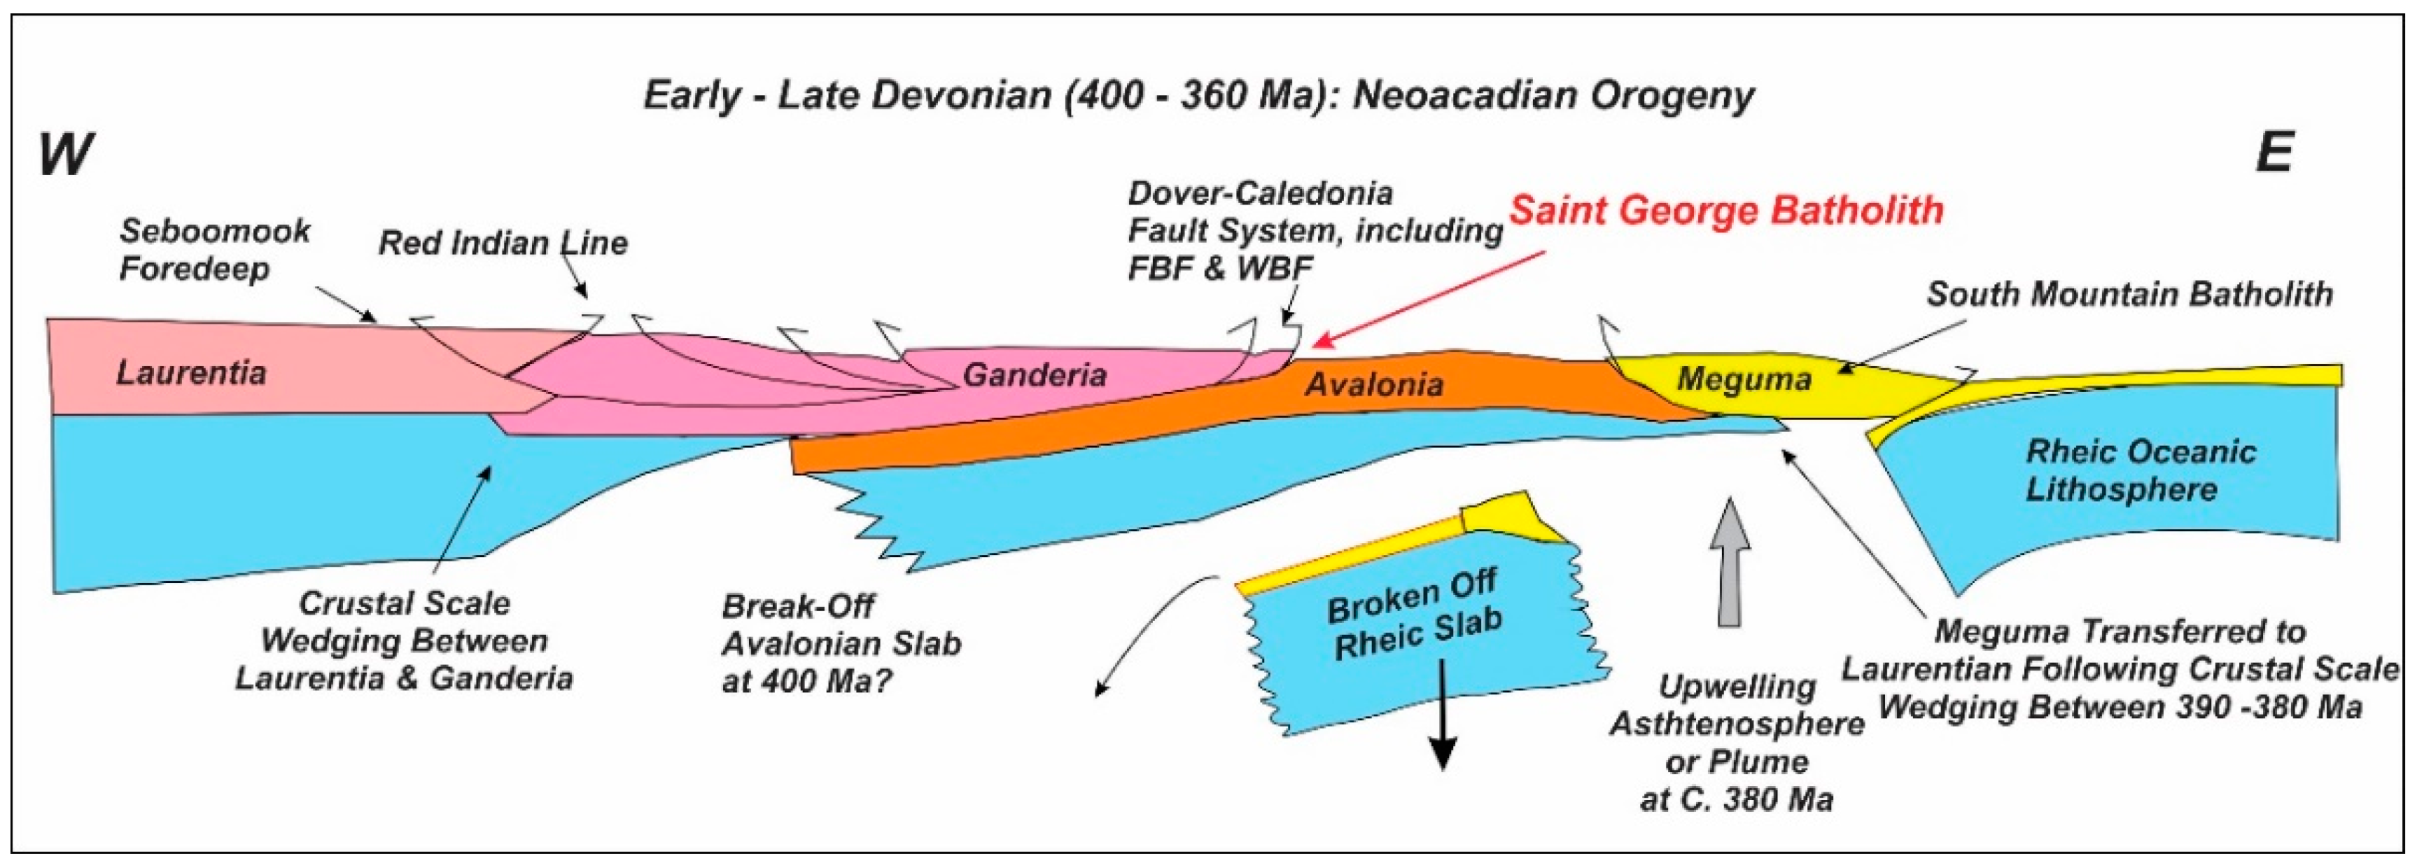
2. Geological Setting

The Late Devonian Mount Douglas Granite (368 ± 3 Ma, U–Pb monazite and zircon geochronology [15]), located in Southwestern New Brunswick, ~40 km east of the well-known Mount Pleasant W–Mo–Bi and Sn–Zn–Cu–In deposits, forms the eastern part of the Late Silurian to Late Devonian Saint George Batholith (Figure 1 and Figure 2). The MDG, along with other intrusions of the Saint George Batholith was emplaced at the junction of the Avalon and Gander terranes following the accretion of the Gander and Avalon zones (Figure 3). The batholith emplacement occurred after assembly of these terranes during the waning stages of the Acadian Orogeny (continent–continent collision) [16,17]. Accretion of the Meguma terrane to the upper plate (Laurentia) between 390–380 Ma is believed to have been accompanied by wedging and breakoff of the down-going Rheic slab (Figure 3, [18]). Subsequent magmatism led to the formation of the Saint George Batholith at the boundary between the Avalon and Gander zones (Figure 3; modified after [18,19,20]). The MDG marks the last stage of magmatism in the Saint George Batholith that coincided with reactivation of the Falls Brook Fault (FBF, Figure 3).
It is believed that the MDG is the deeper-level equivalent of shallower-level granites responsible for mineralization at Mount Pleasant (Figure 1) [17,21,22]. The intrusion is composed of a suite of metaluminous to peraluminous leucogranitic rocks that apparently evolved from a zoned magma chamber in a three-stage process, resulting in compositionally and chronologically distinct units (Figure 2), i.e., units Dmd1, Dmd2, and Dmd3 [17]. The peraluminous MDG displays characteristics of hybrid S- and A-type (within-plate: WPG) granites; however, a syn-collisional granite setting (SCG, S-type, due to closure of the Acadian seaway between composite Ganderia and Avalonia [23]) is also possible as extreme fractionation may shift the geochemical data into the WPG field in the discrimination diagrams of Pearce et al. [24] and Christiansen and Keith [25]. Petrochemical studies (whole-rock geochemical data, Table S2) suggest that a single genetic group originating from a homogeneous parental magma (Dmd1) underwent varying degrees of fractionation, leading to the generation of units Dmd2 and Dmd3 [15,17,26]. Metallic mineral occurrences of Sn and W (Zn, Bi), locally with base-metals and U, are primarily associated with the most highly differentiated intrusive unit, Dmd3, and, to a lesser degree, unit Dmd2 [15,17]. Previous TIMS U–Pb monazite geochronology [17,27,28] suggests a Late Devonian age for the MDG. The ages are 366 ± 1 and 367 ± 1 Ma for units Dmd2 and Dmd3, respectively [28]. The reported crystallization ages are verified by recent U–Pb zircon and monazite geochronology of this granite (368 ± 3 Ma; [15]).

3. Analytical Procedures

Mineralized greisen veins associated with units Dmd2 and Dmd3 were examined in order to determine the mineralization ages of the complex hydrothermal system of the MDG. More than forty samples taken from different greisen veins distributed throughout the pluton were examined in terms of petrography and mineralogy. Polished slabs and standard polished thin sections (thickness of 30 µm) were prepared at the Department of Earth Sciences, University of New Brunswick (UNB). Four monazite-bearing greisen veins with monazite grains large enough to accommodate a typical laser ablation crater (i.e., a 17 µm diameter in this study) were chosen for U–Pb geochronology.
The ages of mineralization of U–Pb were determined from hydrothermal monazite using in situ laser ablation inductively coupled plasma–mass spectrometry (LA ICP–MS) supported by a JEOL6400 Scanning Electron Microscope–Back-Scattered Electron imaging (SEM–BSE). SEM–BSE images of monazite-bearing specimens were collected using the dPict32 software application (developed by Geller Microanalytical Laboratories) at UNB. This method was applied to monazite-bearing greisen veins taken from the northeast (sample #50-2A), west (sample #149), and southern (sample #263 and #268) parts of the pluton (Figure 2). The detailed analytical procedures are as follows.
Monazite grains were analyzed using a Resonetics S-155-LR 193 nm ArF Excimer laser ablation (LA) system coupled to an Agilent 7700X quadrupole inductively coupled plasma–mass spectrometer (ICP–MS) (see [29,32,33,34,35]) using a laser beam with a diameter of 17 µm (a few microns depth). Measurements were performed on monazite grains following SEM–BSE imaging to determine any internal textural variations of the grains. Masses of 89Y, 202Hg, 204Pb, 206Pb, 207Pb, and 208Pb, 232Th, and 238U were determined using 31P as a guide mass and internal standardization (assuming ~13 wt.% P in monazite) for calculating Y, Pb, Th, and U concentrations.
A total of eight analyses of monazite grains from sample #50-2A, 10 from sample #149, and 21 and 11 spots from samples #263 and #268, respectively, were ablated for U–Pb geochronology. U–Pb isotope data were standardized using GSC-8153 monazite (a monazite sample provided by the Geological Survey of Canada; 507 Ma; [36]) and the accuracy of the results was confirmed using the 44069 monazite standard (424.9 ± 0.4 Ma [37]). The long-term reproducibility of the 44069 standard was assessed in [38] and analyses showed that expansion of 2σ errors to 1% on 207Pb/235U and 0.5% on 206Pb/238U were required to overlap the ‘true’ age of 424.9 ± 0.4 Ma [37] for 44069 monazite analyzed by TIMS and SHRIMP. The data related to the 44069 monazite standard are presented in the Supplementary Materials. The data were reduced using the VizualAge U–Pb geochronology data reduction scheme utilizing the Iolite software v. 2.5. Concordia ages and weighted mean 206Pb/238U ages were calculated using Isoplot version 3.75 [39] and a data subset that was <5% discordant was considered to calculate the concordia ages. The data were plotted on either conventional concordia plots (Wetherill concordia plot; 206Pb/238U versus 207Pb/235U) or the inverse concordia plot (Tera–Wasserburg concordia plot; 207Pb/206Pb versus 238U/206Pb). The concordia age of 423 ± 3 Ma (MSWD = 1.6; Probability = 0.21) obtained for the 44069 monazite standard matches the accepted age of the grain (~424.9 ± 0.4 Ma, [37], refer to Supplementary Materials; Table S1, Figure S1). Weighted mean 208Pb/232Th ages were also calculated for each sample; however, only sample 263 had a sufficient number of high-precision Pb/Th ages to calculate a reasonable weighted mean 208Pb/232Th age. Part of the problem with this approach is that there is no accepted 208Pb/232Th age for the 44069 monazite standard that was used in this study. The weighted mean 208Pb/232Th age obtained for the 44069 monazite standard in this study was 414 ± 3 Ma (n = 5; MSWD = 0.65) which is ~10 million years younger than its Pb/U age (i.e., 424 Ma; [37]).

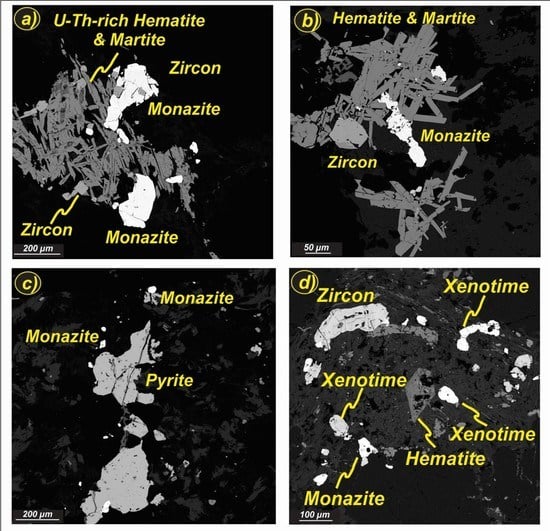
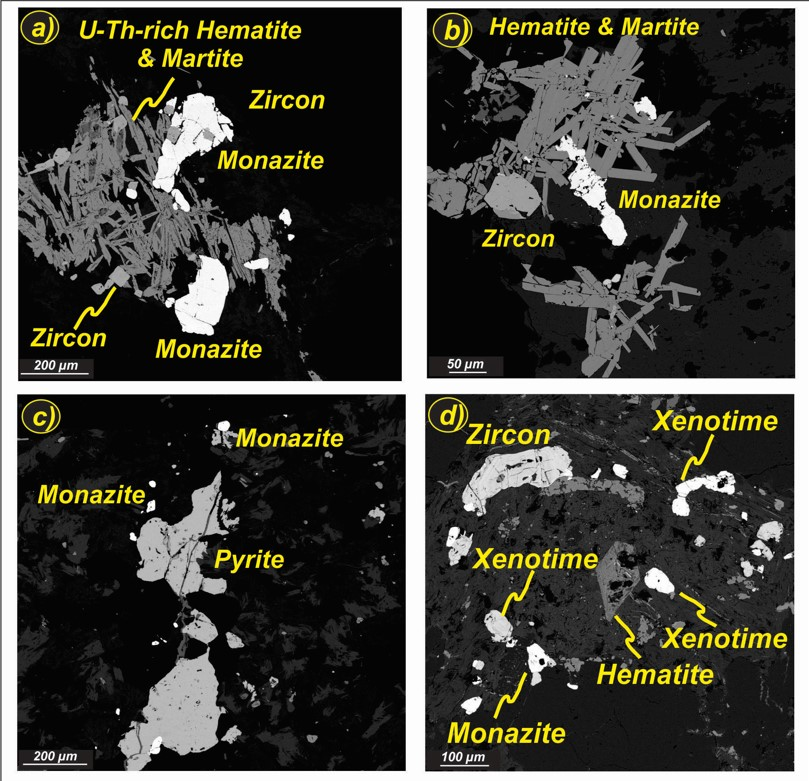
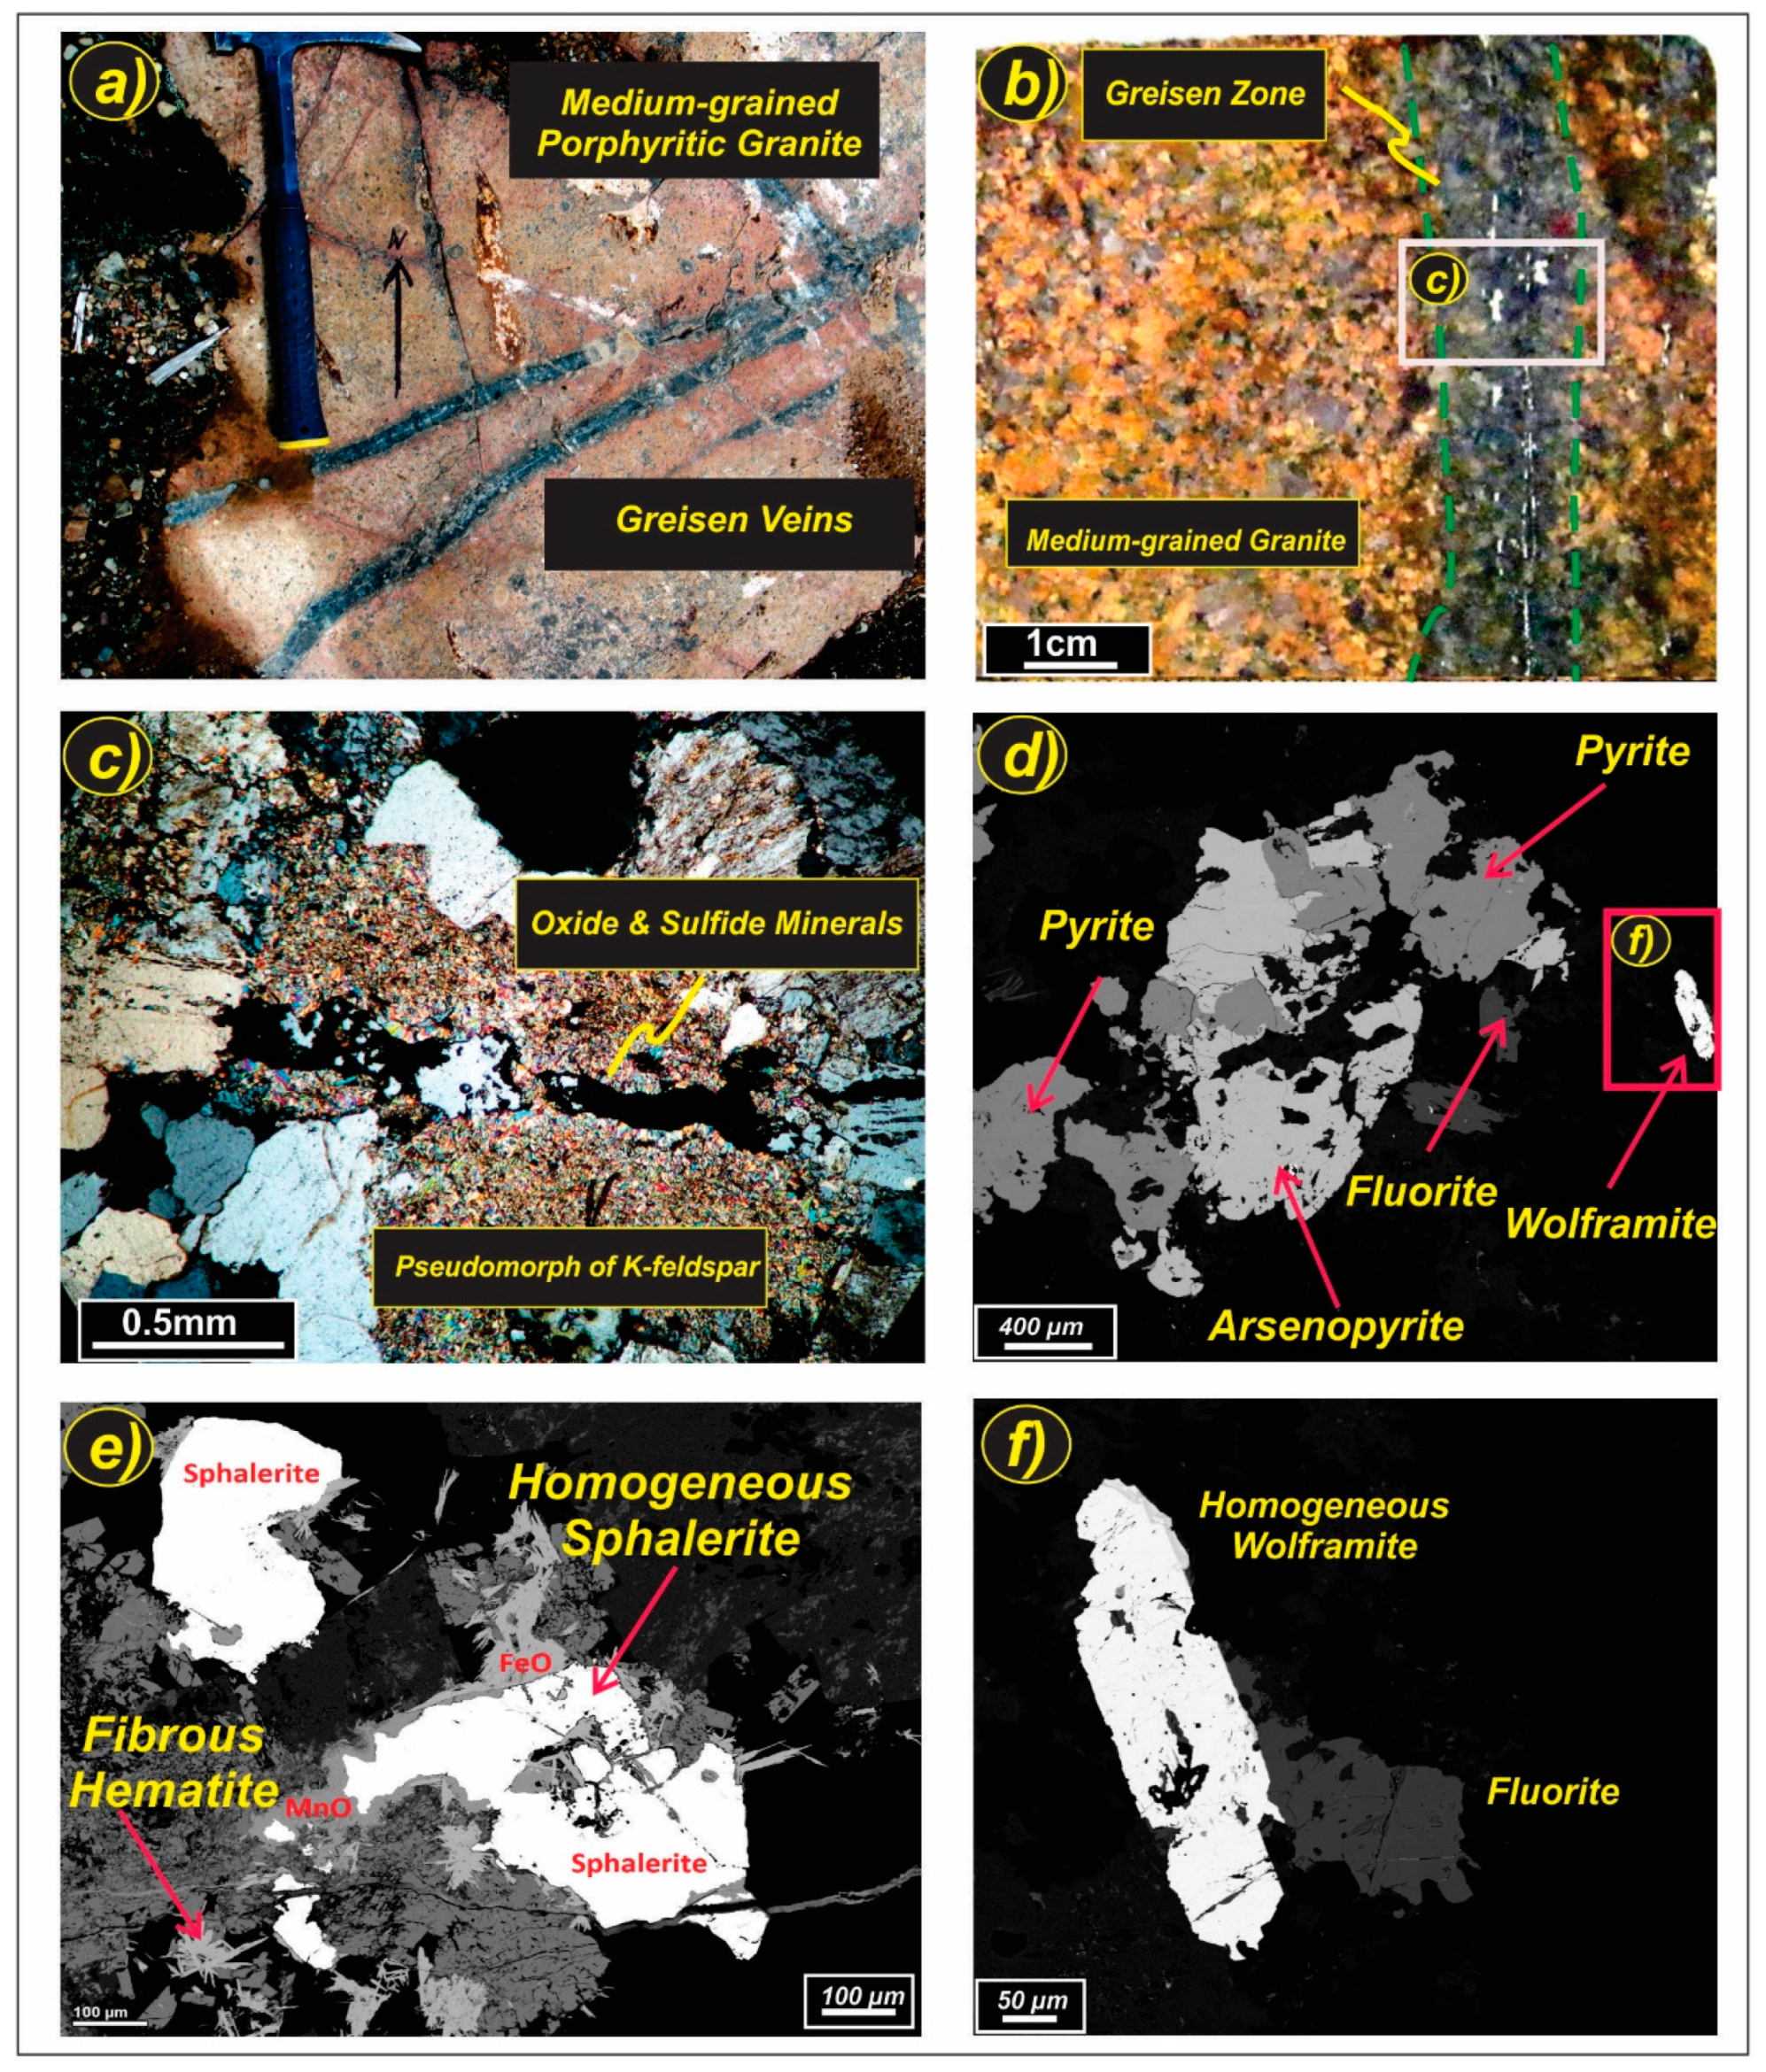
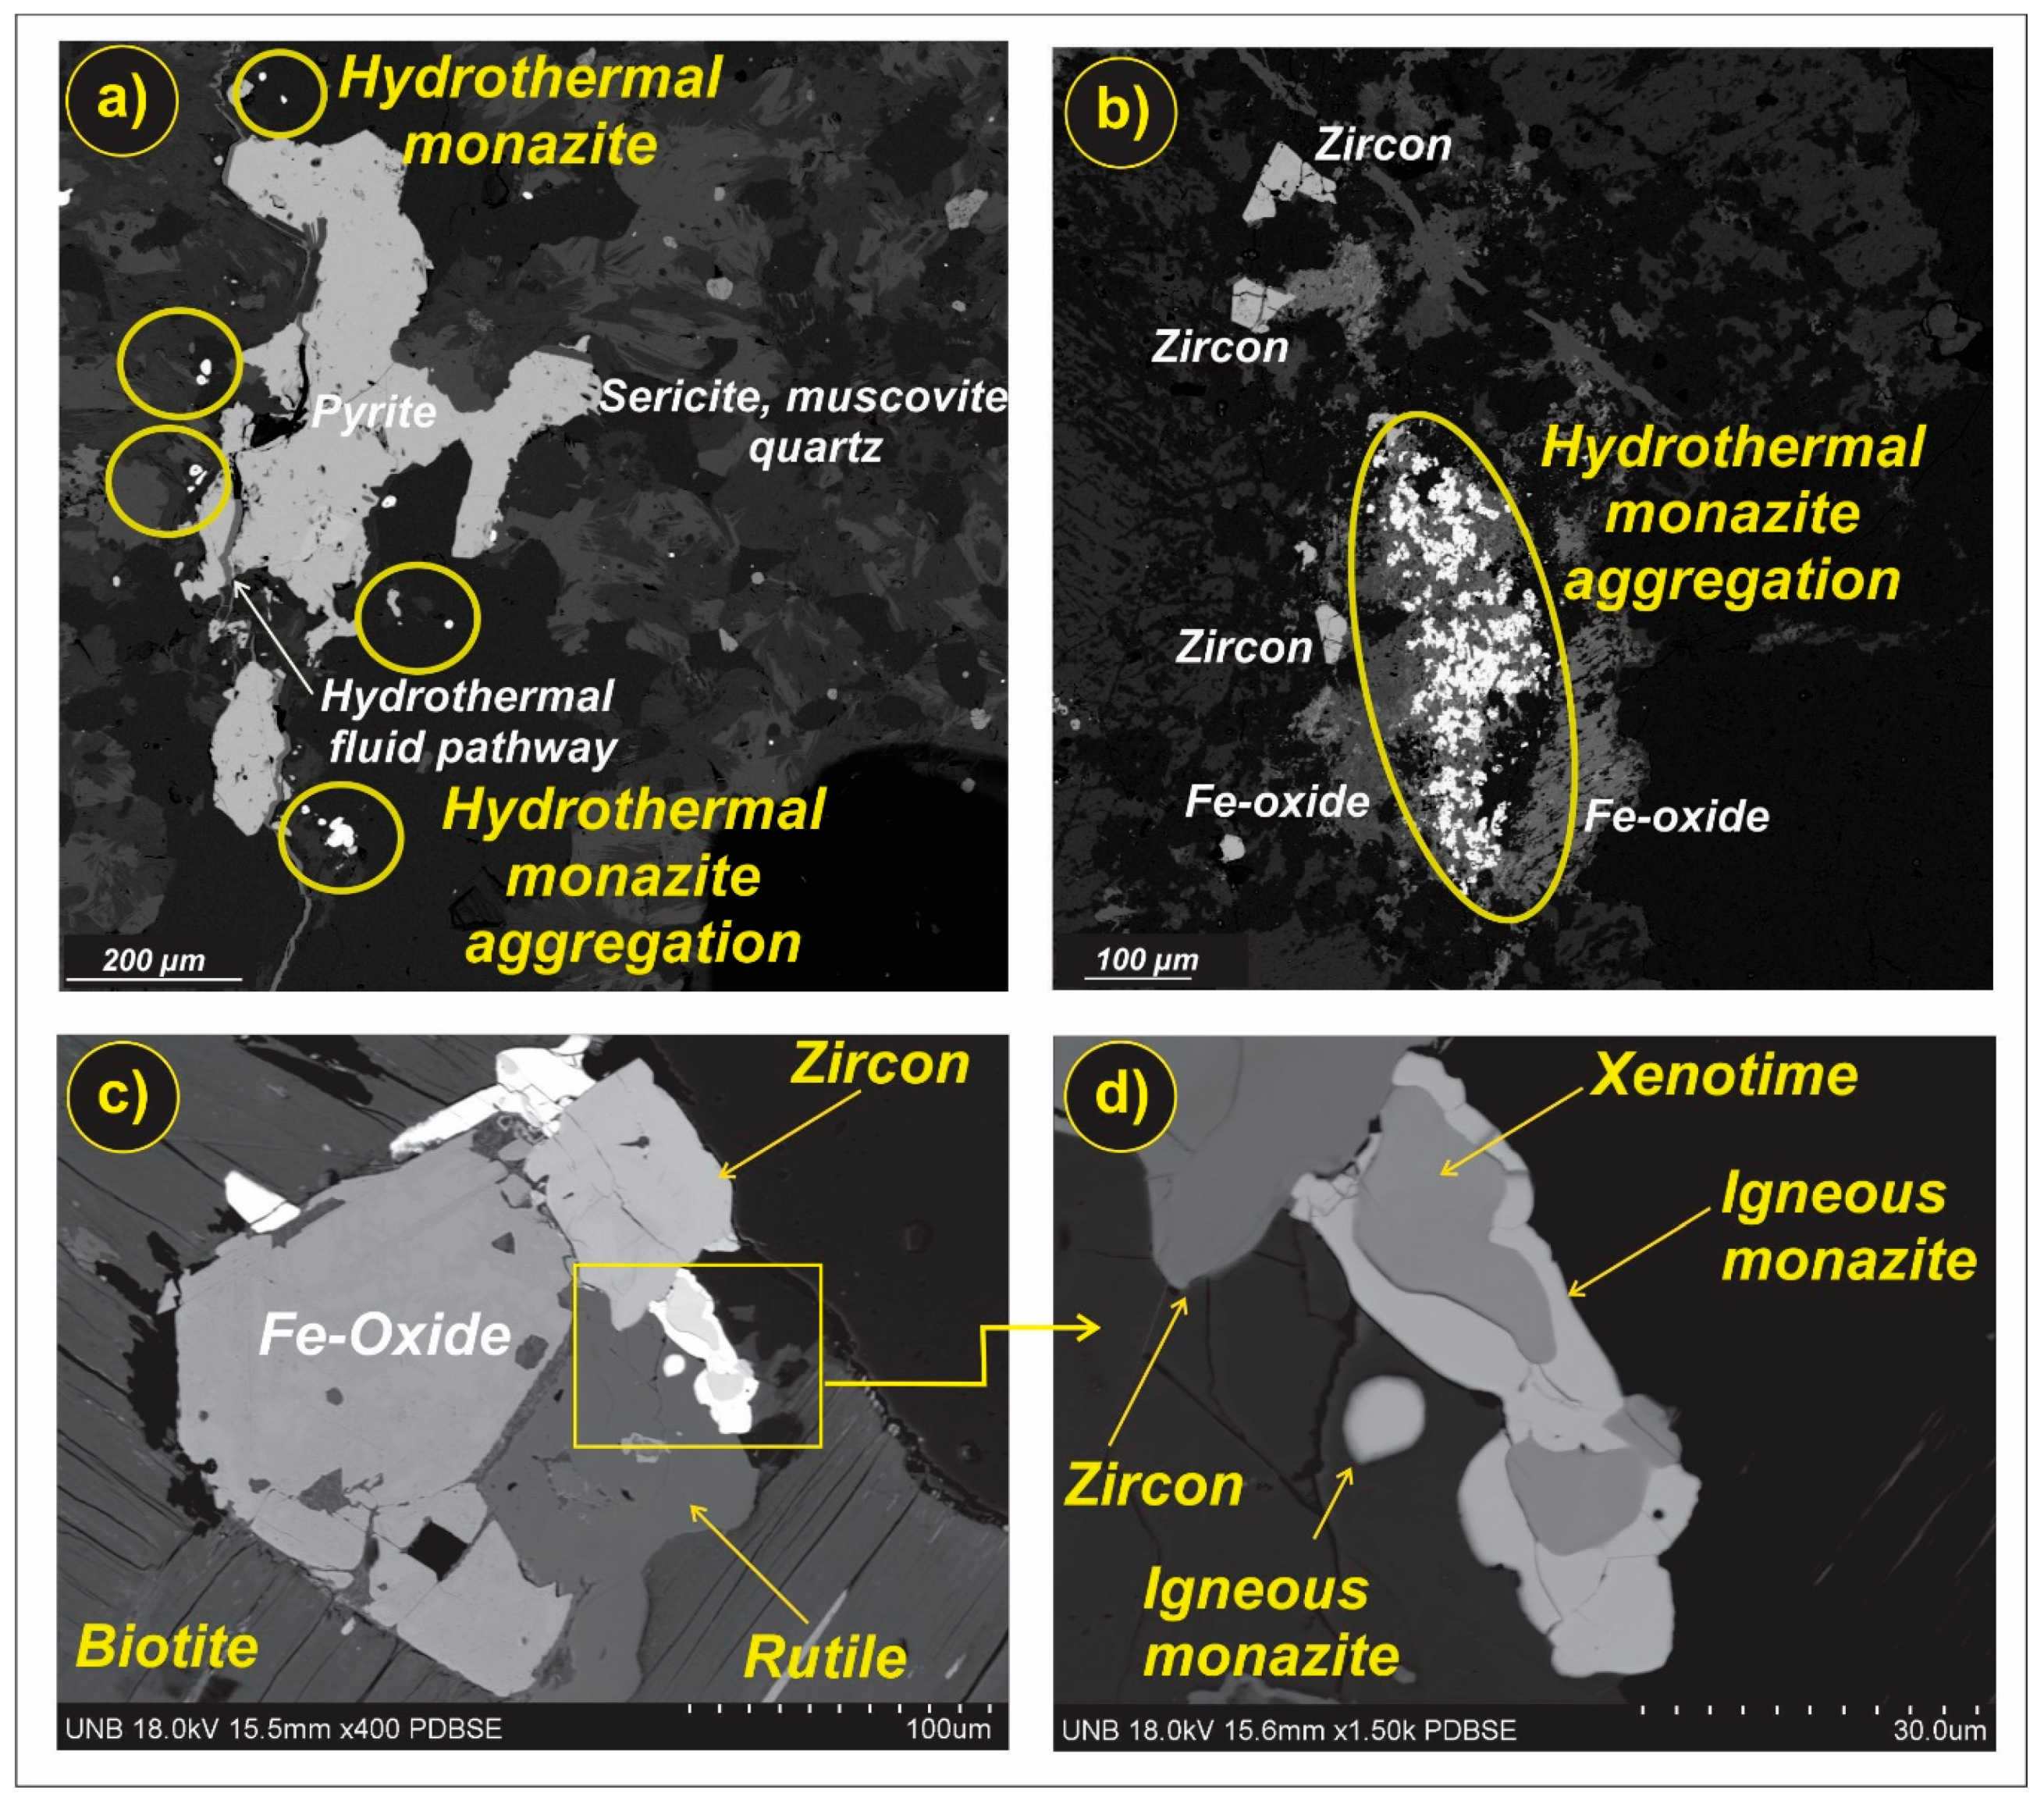
4. Greisen Veins: Petrographical Observations and Mineralogy

Extreme fractional crystallization of the parental and least-evolved magma of the Mount Douglas system, unit Dmd1, produced the fertile magmas of units Dmd2 and Dmd3 [15,17,26] with economically interesting endogranitic Sn, W (Mo), Bi, and Zn (U) occurrences (the black diamonds in Figure 2). Oxide and sulfide mineralized zones are typically associated with greisen and sheeted veins that originated from or are hosted within the two highly evolved units, Dmd2 and Dmd3. The endogranitic granophile mineralization (Sn, W, Mo, Zn, Bi, and U intra-granite mineralization) is structurally controlled by reactivation of two fault systems in this area, including Fall Brook Fault (FBF) and Wheaton Brook Fault (WBF), and emplacement of the granite occurred in three stages [15]. Greisen mineralization typically develops near the roof zone, near cupolas, along margins of an intrusion or beneath internal contacts within granitic rocks. During this process, metals, such as Sn and W, become concentrated in late-stage melts and exsolving hydrothermal fluids [40]. Pressure release and quenching of silica-rich melts results in the liberation of metalliferous fluids [41]. These fluids can migrate along pre-existing structures, such as joints/fracture cleavage within the pluton and generate endogranitic mineral deposits associated with greisen veins, greisen alteration, stockwork veinlets, breccia fillings, quartz-vein systems, and disseminated mineralization [40].
Dark greisen veins (ranging from a few mm to ~20 cm wide; Figure 4a,b), represent parts of the host granite that have interacted with hydrothermal fluids during later stages of crystallization (auto-metasomatism). They are dominated by assemblages of extensively sericitized pseudomorphed K-feldspar and plagioclase, quartz, with fluorite and muscovite that are accompanied by a diverse assemblage of sulfide and oxide minerals (Figure 4c). It seems that the breakdown of the biotite lattices and conversion to muscovite or sericite during magmatic-hydrothermal processes, i.e., greisenization, was one of the most important processes in forming mineralized greisen veins [15]. Biotite, as the principal carriers of metals, exhibit a considerable enrichment of metals and metalloids such as Zn (≤879 ppm), Sn (≤164 ppm), Sc (≤150 ppm), and Pb (≤248 ppm) followed by Ga, Ta, and W. The concentrations of these elements in biotite increases with the degree of fractionation from lower values in Dmd1 to higher values in the highly fractionated units, Dmd2 and Dmd3 [15]. Sulfide and oxide minerals primarily occur along the margins of inner veins situated in the center of greisen veins that represent probable hydrothermal fluid pathways or disseminated grains distributed along greisenized zones and commonly include pyrite, arsenopyrite, hematite, martite/magnetite, Ta-rich wolframite (Figure 4d–f), Cd- and In-rich sphalerite, chalcopyrite, galena, W-rich cassiterite, and native bismuth [15,42,43].
Locally, some greisen veins are uraniferous and contain U-, Th-, and REE-bearing minerals. The common U- and Th-bearing minerals are monazite, zircon, xenotime, thorite, and uraninite (Figure 5), and are accompanied by other sulfide and oxide minerals that also have notably high concentrations of U and Th [15]. These common oxide minerals include wolframite (9–143 ppm U; 1–83 ppm Th; Figure 4f), hematite, and martite (pseudomorphed magnetite). Radiating fibrous to platelet-shaped hematite and martite contain up to 41 ppm U and 6 ppm Th [44]. Uranium is incorporated into the hematite lattice as U6+ in a distorted, octahedrally coordinated site, replacing Fe3+ [45]. These types of veins provide an ideal opportunity to test the potential of hematite, cassiterite, wolframite, and uraninite as U–Th–Pb geochronometers in comparison to well-known geochronometers, i.e., monazite and zircon.

5. Results

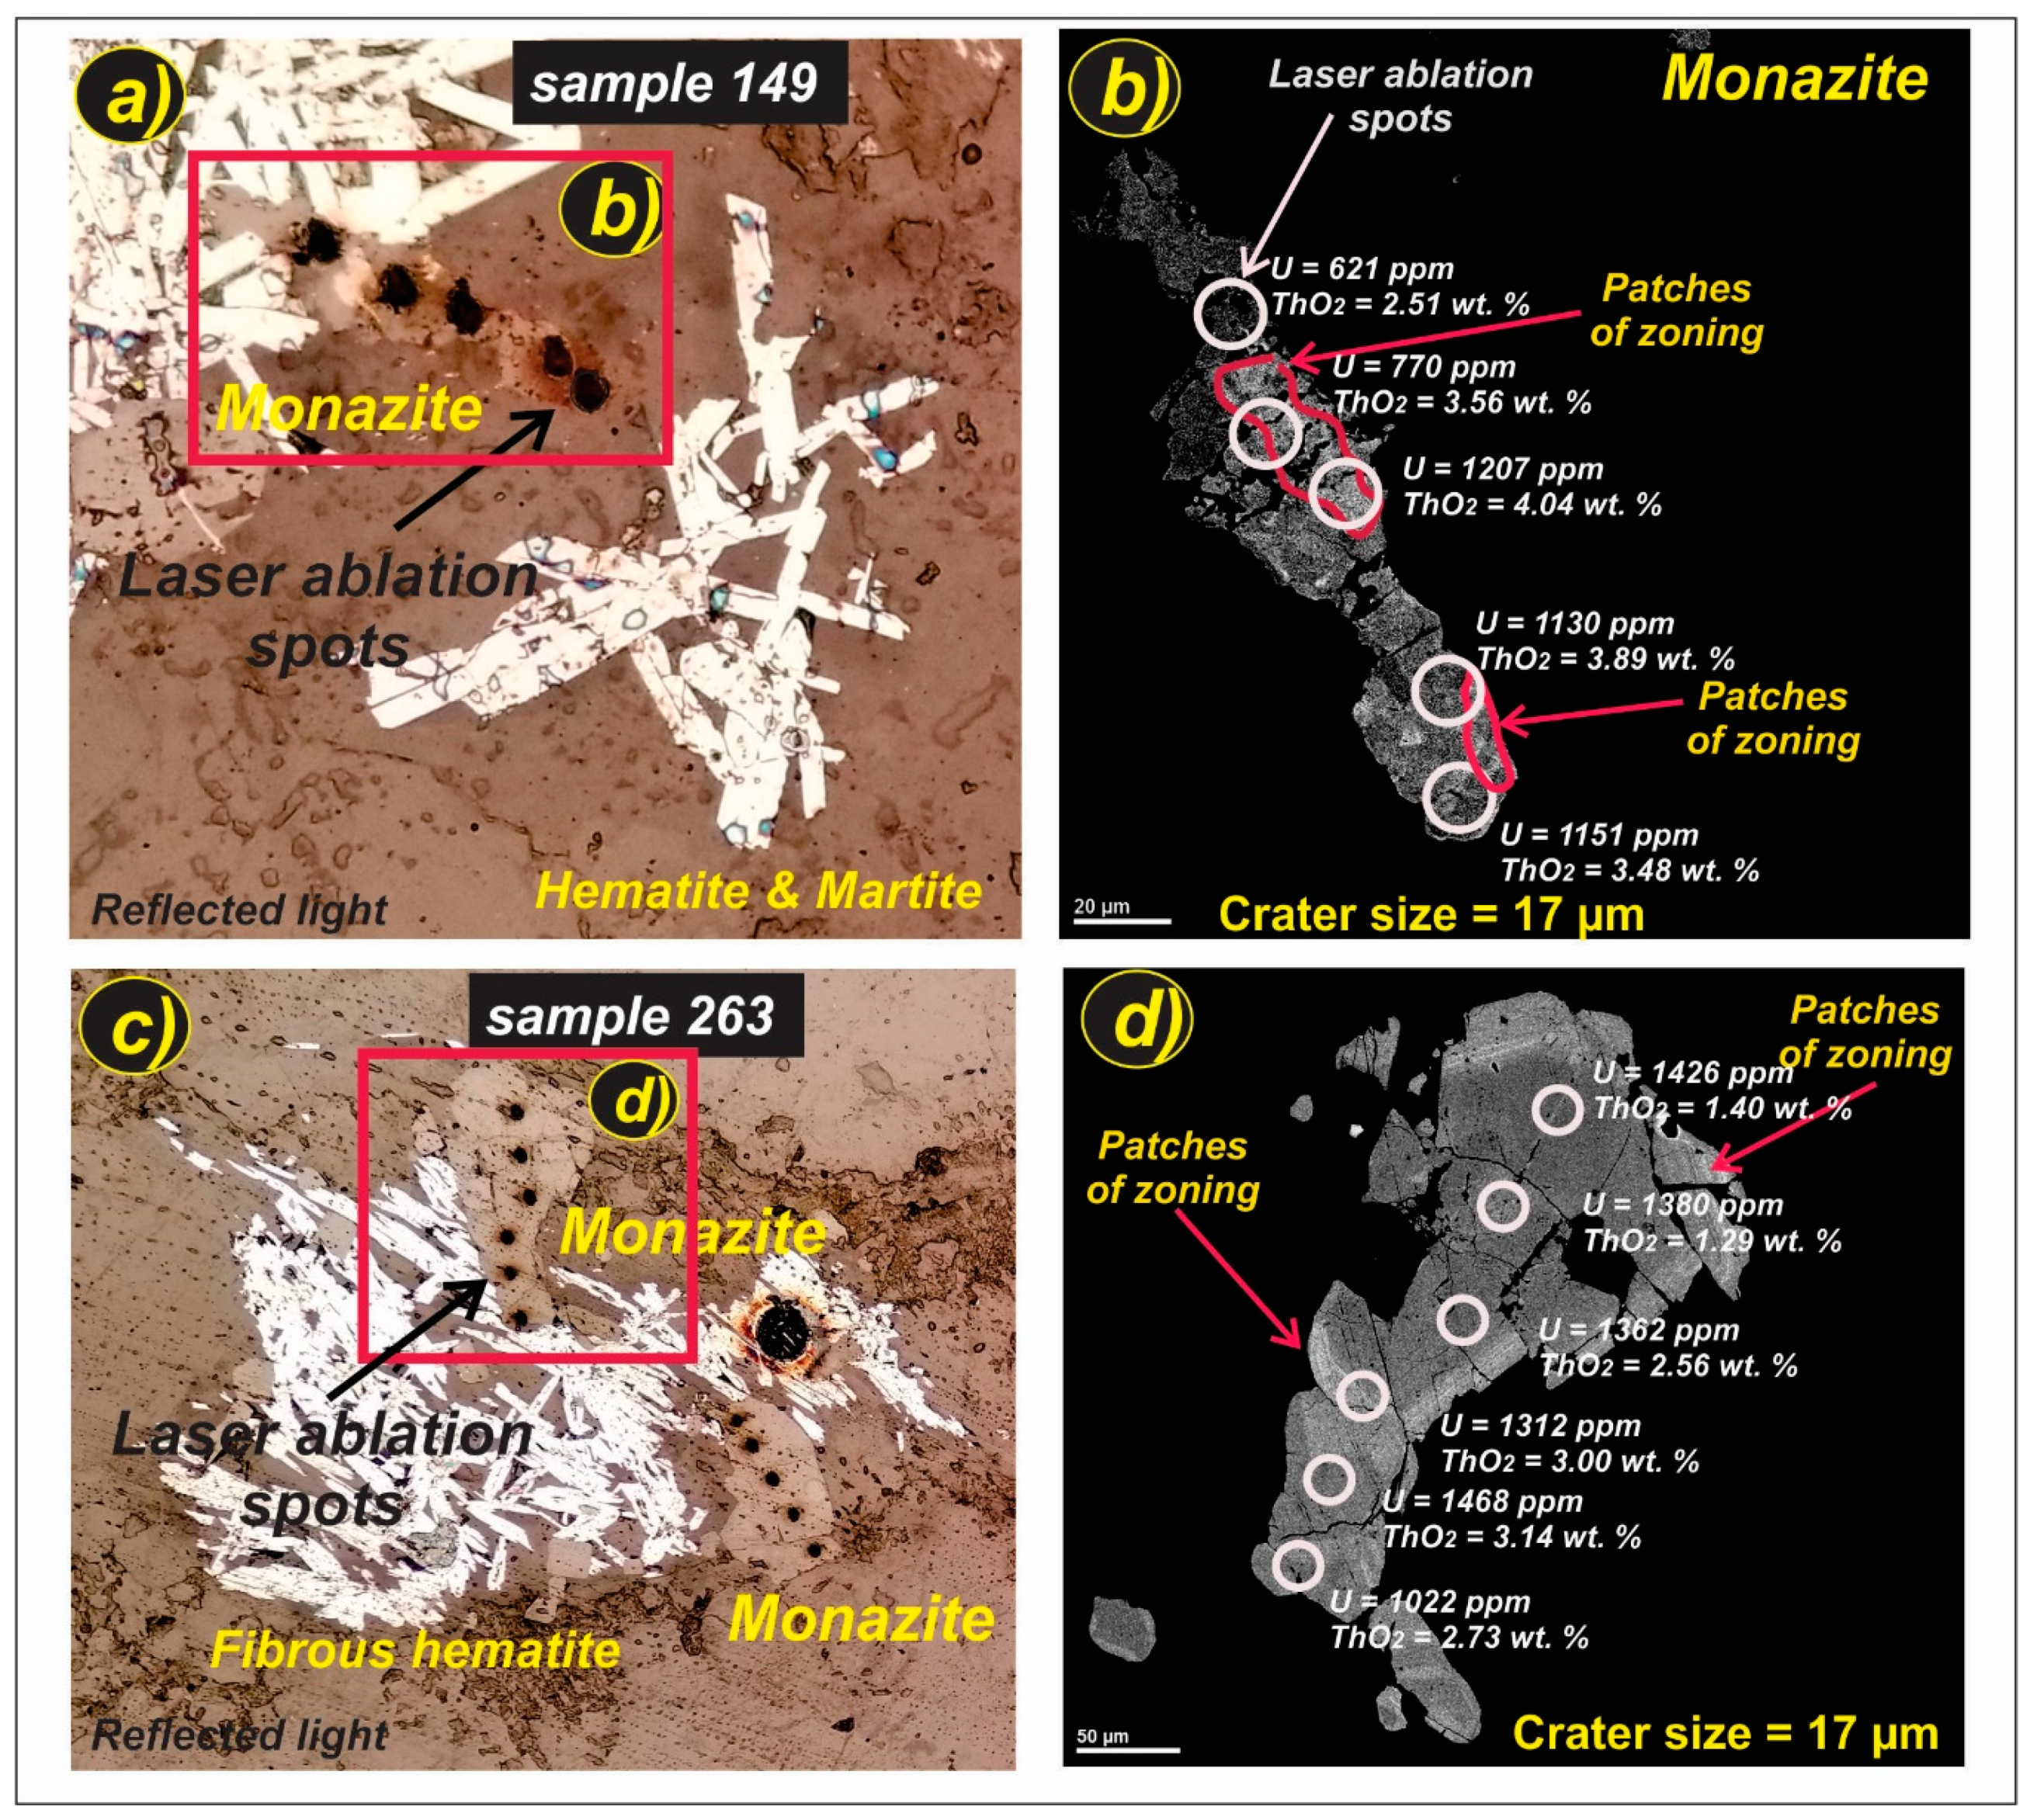
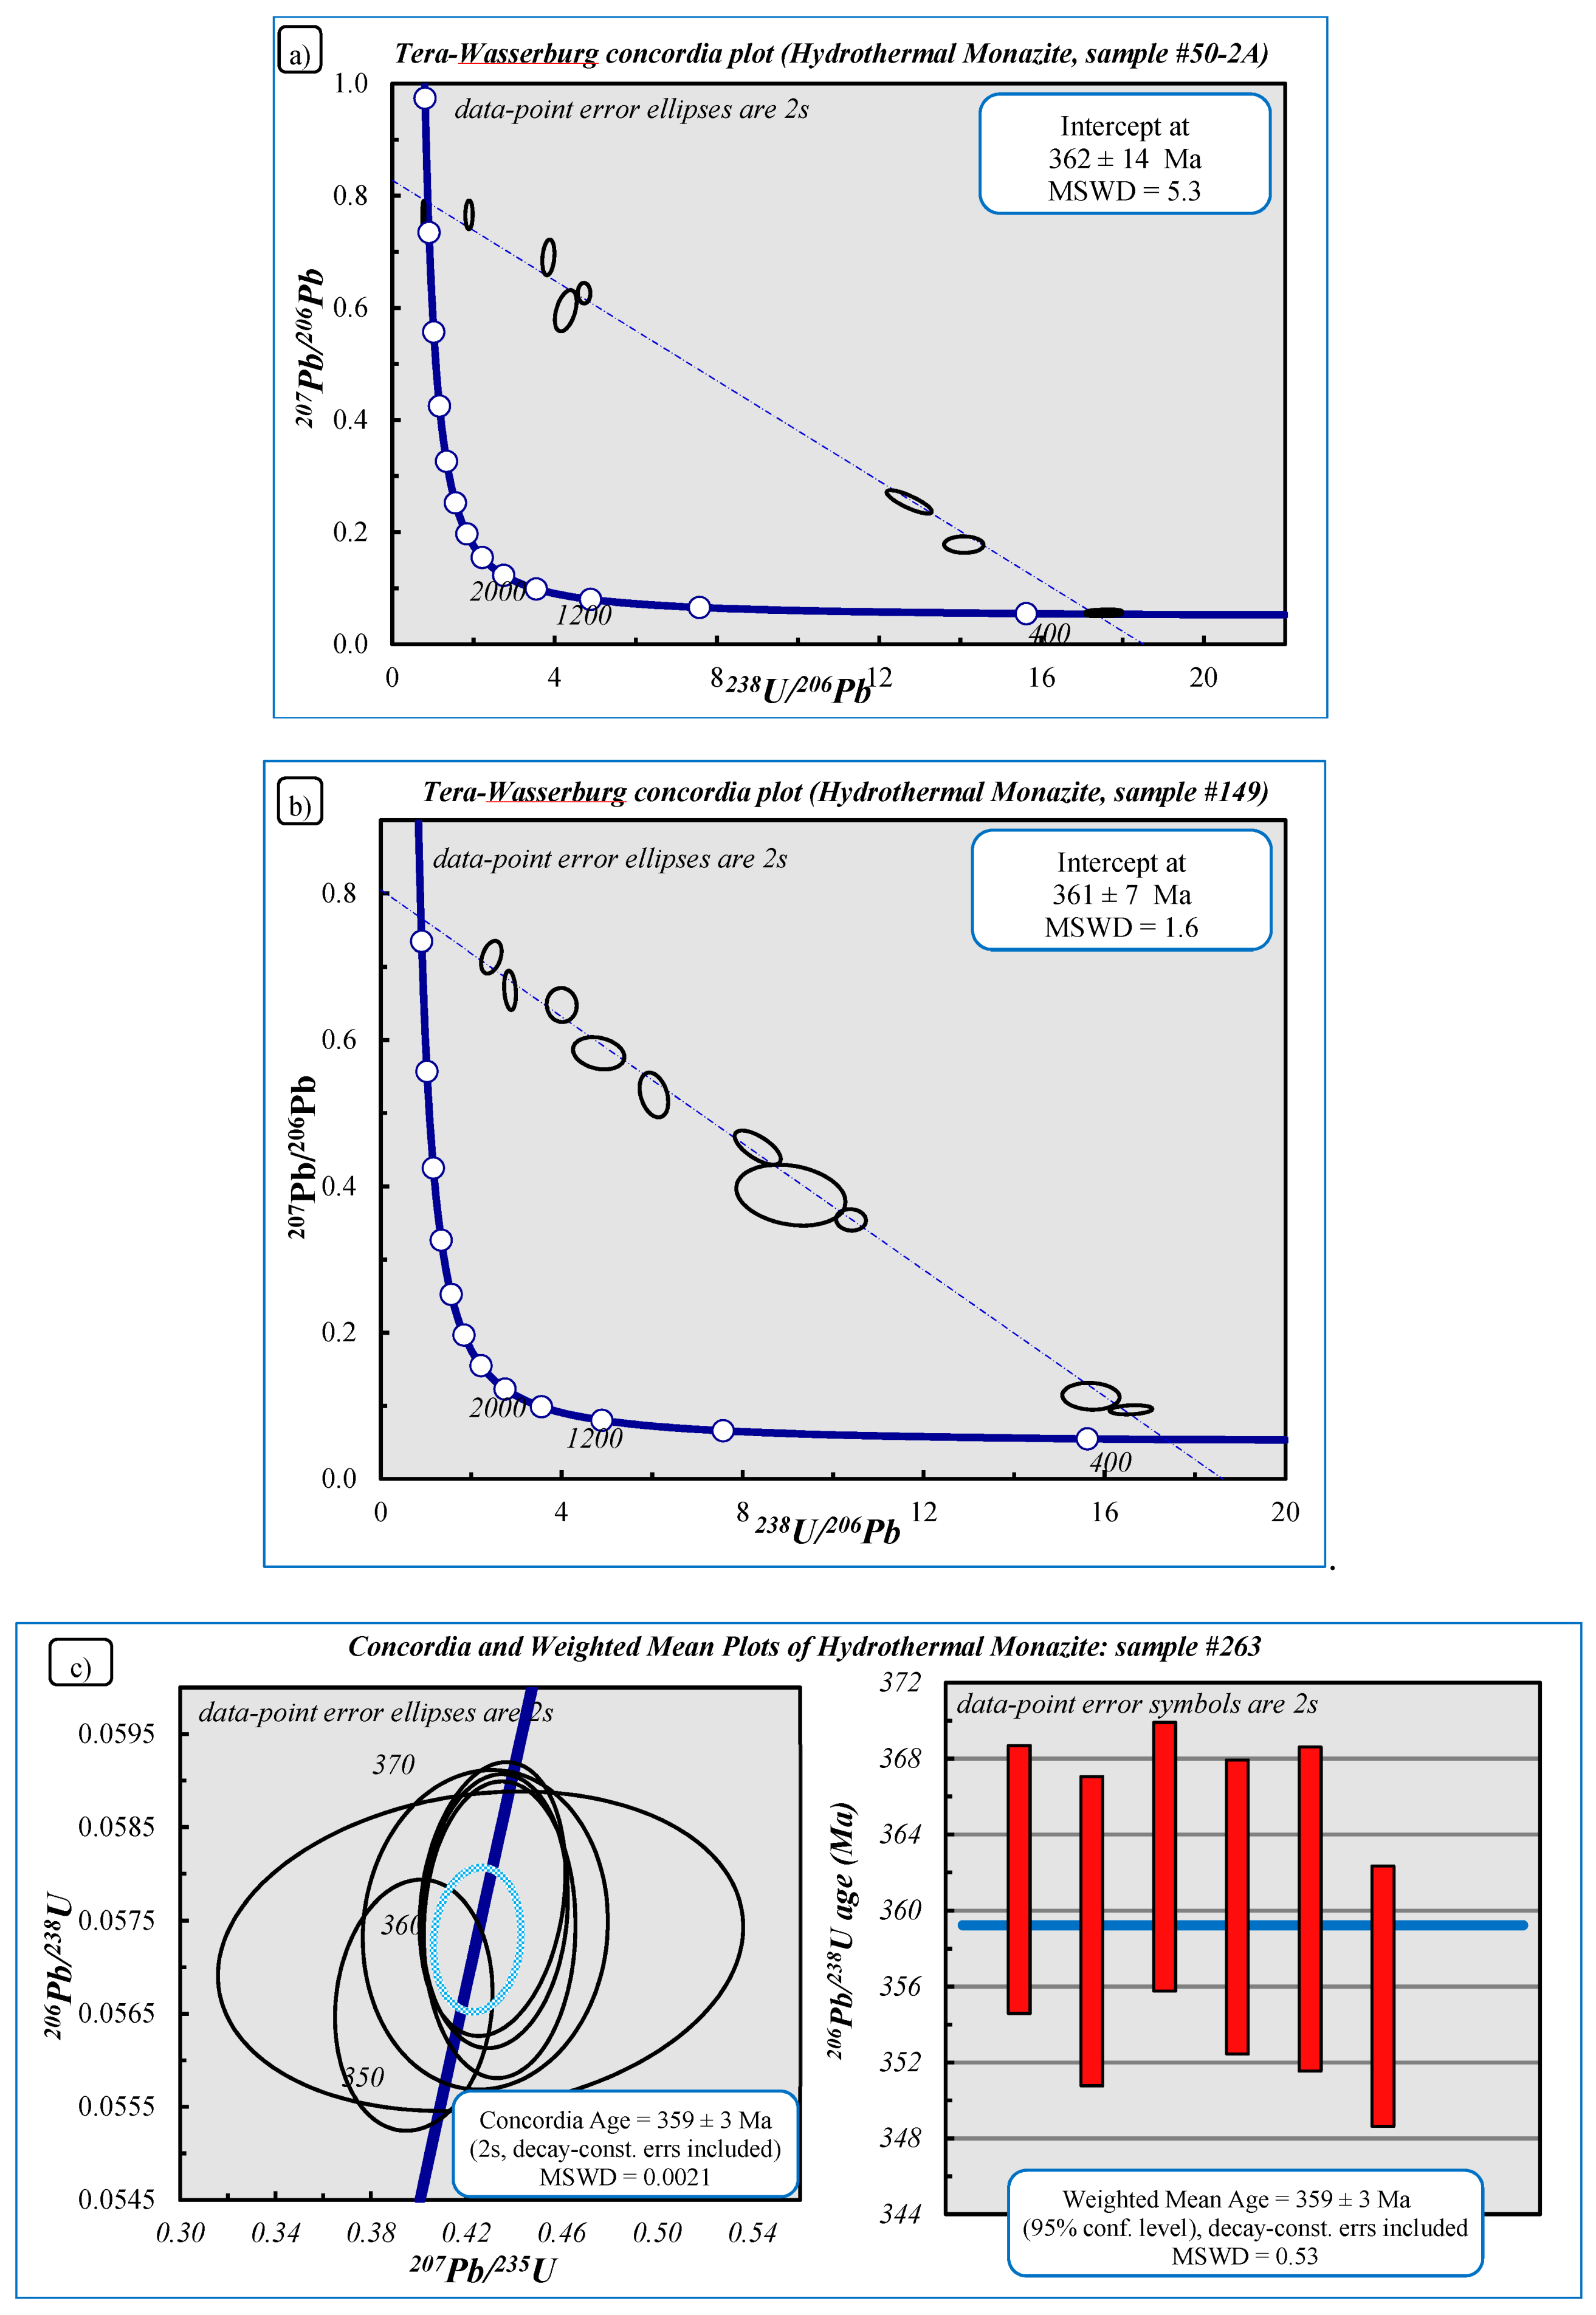
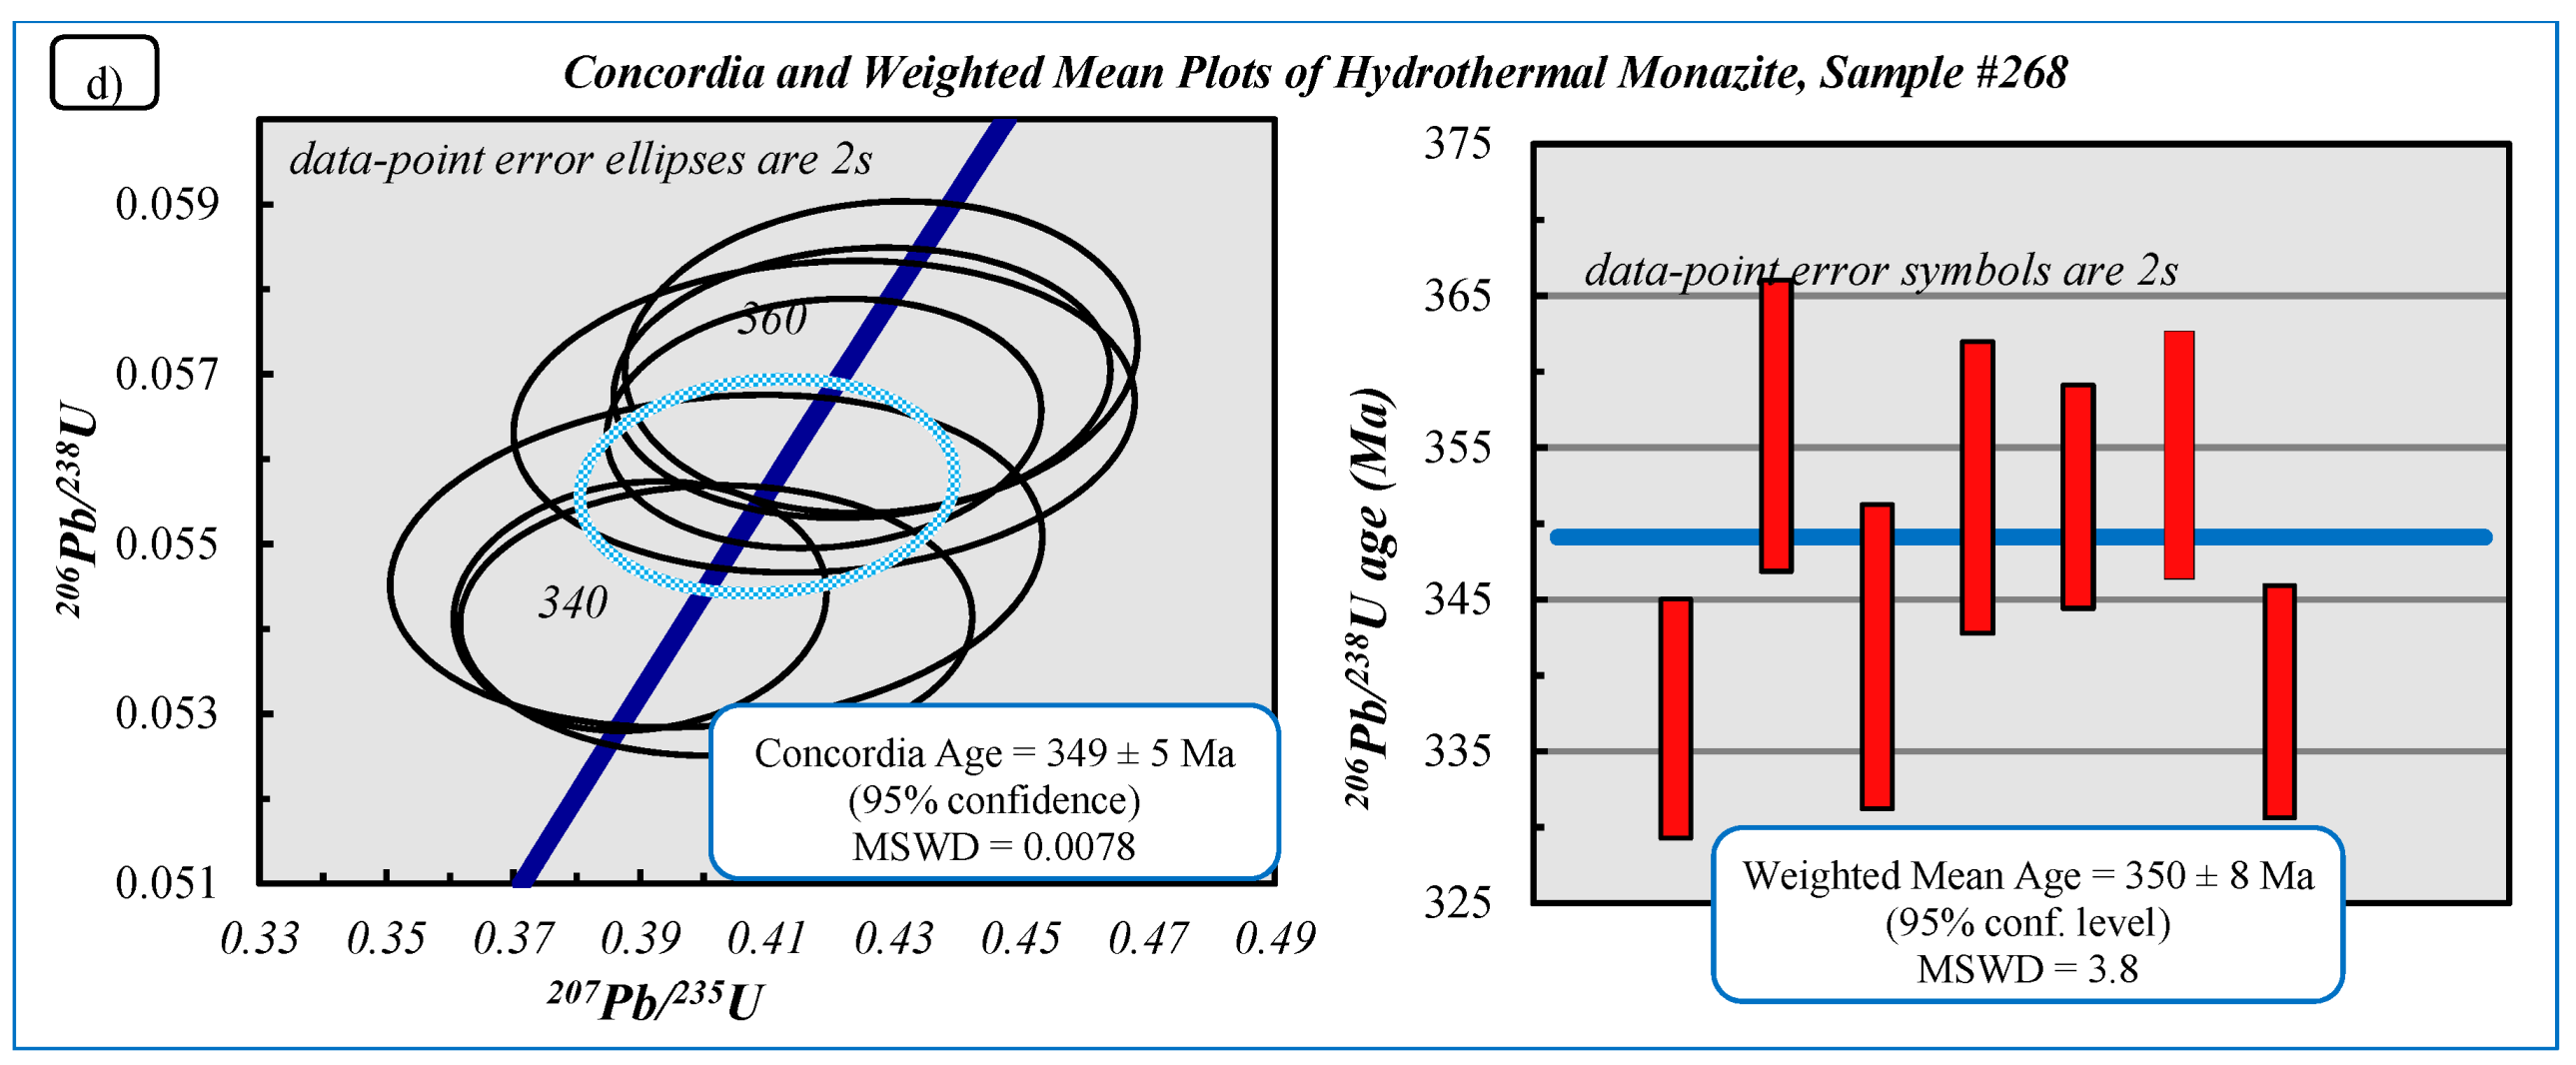
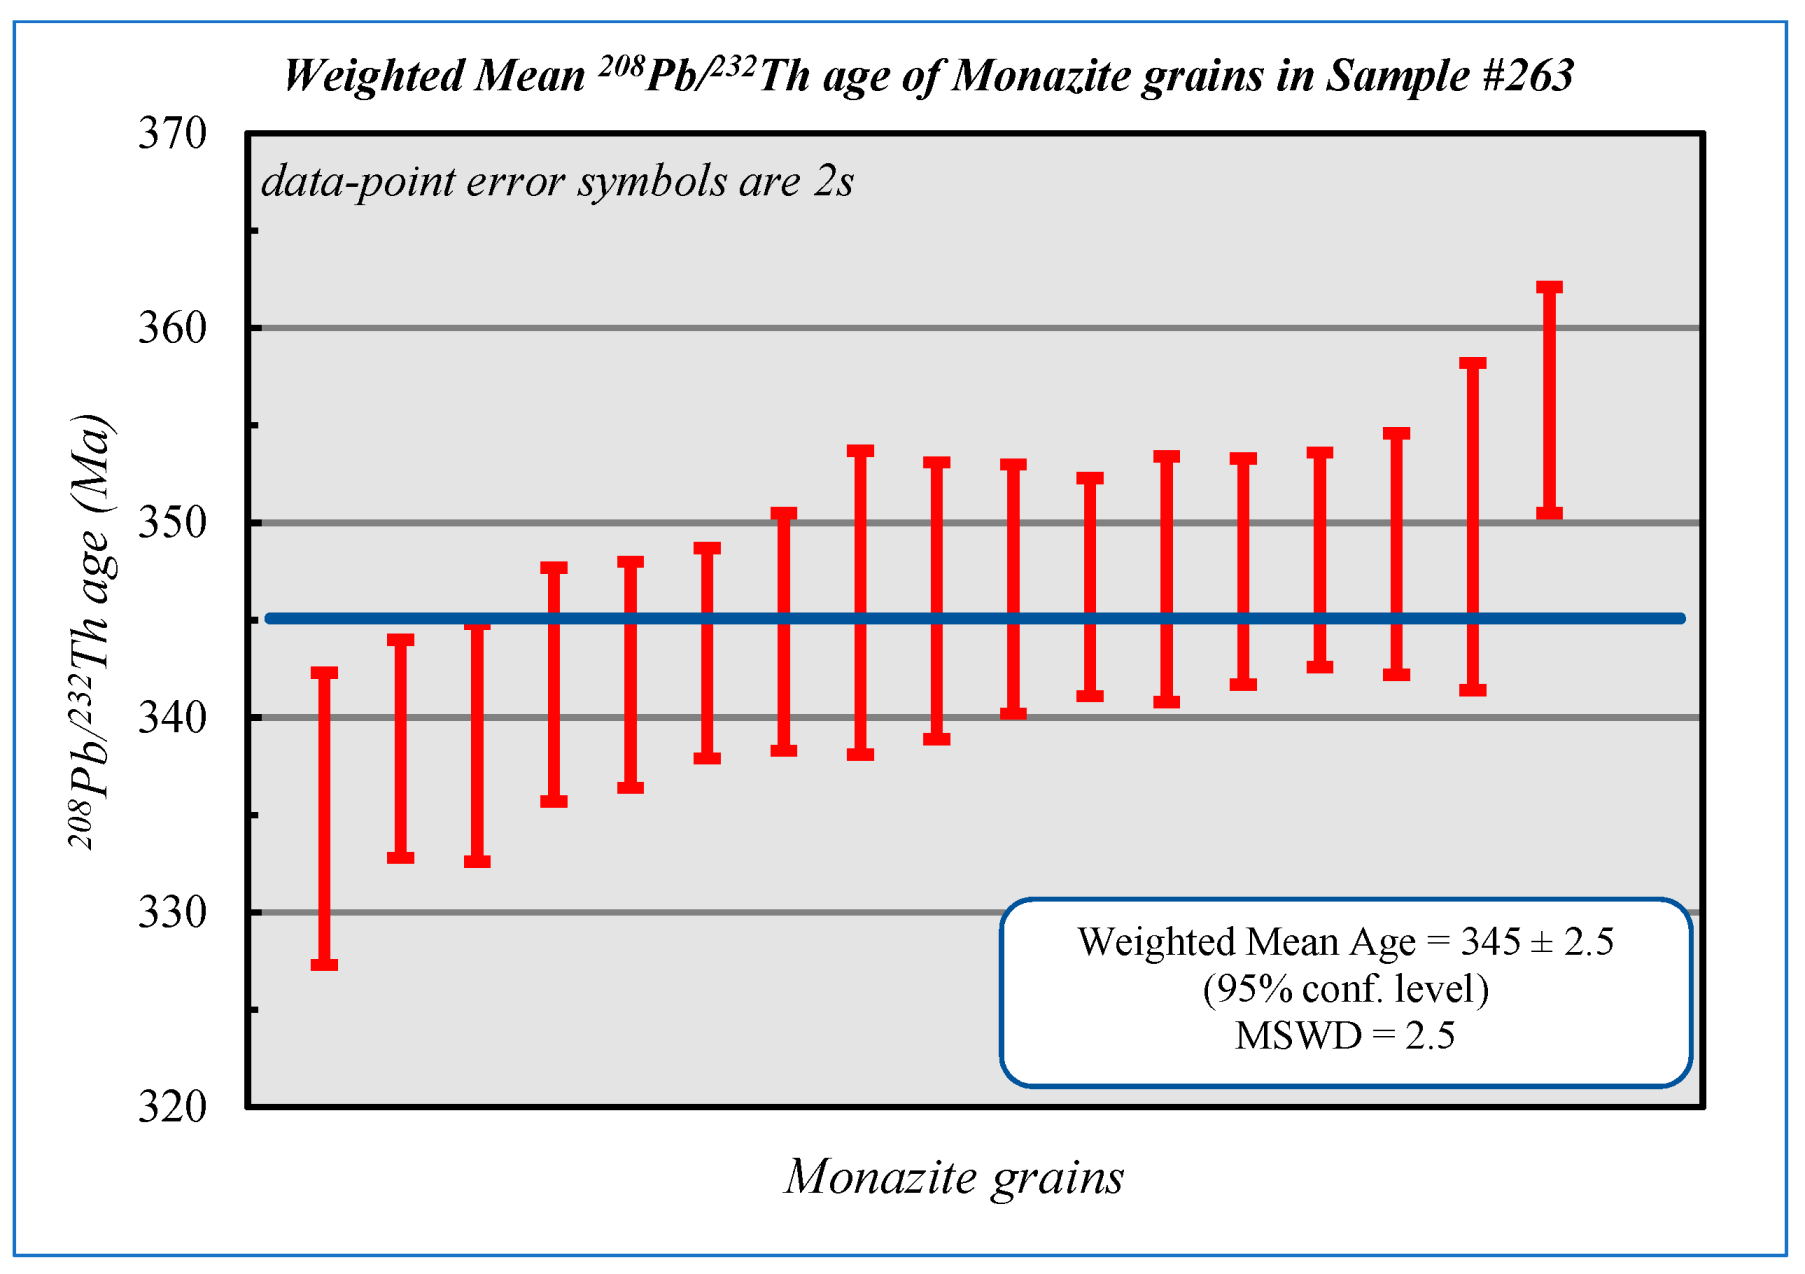
5.1. U–Pb Monazite Geochronology of the Greisen Veins

Hydrothermal monazite grains selected for U–Pb geochronology are part of complex uraniferous greisens, and coexist with other U-, Th-, and REE-bearing minerals, (e.g., zircon, xenotime, and bastnasite, and U- and Th-rich hematite and martite, rarely thorite, and pyrite; Figure 5). Monazite occurs as subhedral to anhedral from very fine grains up to 200 µm in size. Rounded irregular monazite is locally heterogeneous and exhibits faint patchy zoning, demonstrating successive growth episodes.
Monazite grains from sample 50-2A are associated with a greisenized granite that consists of assemblages of severely sericitized feldspars, quartz, fluorite, and muscovite. They are accompanied by a diverse assemblage of sulfide and oxide minerals, such as pyrite, chalcopyrite, wolframite, hematite, and REE, U, and Th-bearing minerals, including monazite, zircon, and xenotime (Figure 5d). Monazite grains occur as clusters of very small grains (Figure 6b) to subhedral grains of up to 40 µm in diameter. Compared to monazite grains from the other samples, they have higher ThO2, ranging from 2.5 wt.% to 11.0 wt.% with a weighted mean of 6.0 wt.%. The U contents vary from 88 ppm to 2911 ppm (weighted mean = 1203 ppm).
Sample 149 is a greisenized granite that is overprinted by many different veins (e.g., quartz veins, breccia veins) with ambiguous crosscutting relationships. They contain a complex hydrothermal paragenesis of quartz, muscovite, sericite, and fluorite accompanied by fibrous iron-oxide (hematite and martite), pyrite, chalcopyrite, monazite, and zircon. The monazite grains are subhedral to rounded and irregular and vary from very small grains to 80 µm in diameter (Figure 5b and Figure 7a,b). The larger grains display complex patchy zoning, in which the brighter BSE domains have higher U and Th contents (Figure 7b). The ThO2 and U contents range from 1.1 to 5.7 wt.% (weighted mean = 3.6 wt.%) and 307 to 1207 ppm (weighted mean = 900 ppm), respectively.
Analyzed monazite in sample 263-7B is associated with a thin hydrothermal vein that is hosted by a severely greisenized granite. The granite consists of assemblages of highly sericitized feldspar, quartz, muscovite, and fluorite in which the original texture of the granite is retained. The vein includes radiating fibrous and needle-shaped to tabular crystals of hematite and martite (pseudomorphed magnetite, distinguished via Raman spectroscopy) sphalerite, pyrite, with monazite and, locally, zircon (Figure 5a and Figure 7c,d). Occasionally, pre-existing quartz grains from greisenized zones are surrounded by the mentioned assemblage (fibrous iron-oxide + monazite ± zircon), demonstrating the formation of the vein after the first greisenization. The same pattern, quartz being surrounded by the assemblage, is present in different places throughout the vein. The monazite grains vary from a few microns up to ~180 µm in diameter. The U content in the monazite grains ranges from 533 to 1824 ppm (weighted mean = 1287 ppm) and ThO2 varies from 1.3 to 5.1 wt.% with a weighted mean of 3.3 wt.%. Some grains show complex patchy zoning with a compositionally heterogeneous rim with higher Th concentrations (brighter BSE domain in Figure 7c,d).
Monazite grains associated with sample #268 are related to a large greisen, in which no original texture of the granite is preserved. The greisen is composed of very fine-grained assemblages of quartz, sericite, muscovite, chlorite, and fluorite, in which monazite occurs as small rounded and irregular grains (up to 50 µm) in clusters or in association with pyrite (Figure 5c and Figure 6a) and re-crystallized quartz. The data related to monazite grains of this sample are associated with 11 individual monazite grains. The U content ranges from 285 to 2535 ppm (weighted mean = 1050 ppm) and ThO2 values are from 0.1 to 3.12 wt.% (weighted mean = 0.88 wt.%).
Only those monazite grains that are large enough to accommodate a 17 µm diameter crater are measurable using laser ablation. The results of the U–Pb hydrothermal monazite geochronology are summarized in Table 2, and all the data are represented in Table 3. Plotting the data on Wetherill and Tera–Wasserburg concordia plots produced a range of ages with a total spread (considering 2σ errors) from 344 Ma to a maximum of 376 Ma. The inverse concordia plots are used to calculate concordia-intercept ages by regressing a suite of discordant analyses [39] when the data exhibit variable distributions of common Pb or U/Pb ratios. In LA ICP–MS measurements, it is inevitable that some spots will display mixed signals as a result of inadvertent sampling of non-target phases (e.g., inclusions or slight overlapping with neighboring grains). Some spots may record differential Pb loss and variations in standard unknown matrix mismatch can also contribute to the scatter. Thus, semi-total Pb/U (i.e., Tera–Wasserburg isochron) regression lines are typically refined to obtain the lowest MSWD while using the largest number of data points. In most cases, the final refined age overlaps within error with the ‘raw’ age but has a much better precision owing the lower degree of ‘real’ scatter in the data.
The ages derived from hydrothermal monazite on the conventional concordia diagram range from 349 ± 5 to 359 ± 3 Ma, whereas the Tera–Wasserburg concordia diagrams yielded intercept ages between 361 ± 7 and 362 ± 14 Ma (Figure 8). The Tera–Wasserburg concordia diagram of 207Pb/206Pb versus 238U/206Pb yielded ages of 362 ± 14 Ma (MSWD = 5.3; n = 6) for sample #50-2A (Figure 8a). The same diagram was used for sample #149 (Figure 8b) and the data yielded a mineralization age of 361 ± 7 Ma (MSWD = 1.6; n = 10). The upper intercept records the common-Pb composition and only the lower-intercept is an acceptable age. The percentage of radiogenic Pb (%Pb*) was calculated using Andersen’s method [46] and the results are presented in Table 3.
The most concordant data in sample 263 yielded an age of 359 ± 3 Ma (MSWD = 0.0021; n = 6), which overlaps the regression age for this sample at 358 ± 3 Ma (MSWD = 0.7; n = 17) (Table 2). The conventional concordia diagram depicts a mineralization age of 349 ± 5 Ma (MSWD = 0.0078; n = 7) for sample 268# (Figure 8d).
The weighted mean 208Pb/232Th age calculated for sample 263# (the only sample with a sufficient number of high precision Pb/Th) is 345 ± 2.5 (Figure 9; MSWD = 2.5; n = 17), which is much younger than and outside of the error of the magmatic age (368 ± 3 Ma).

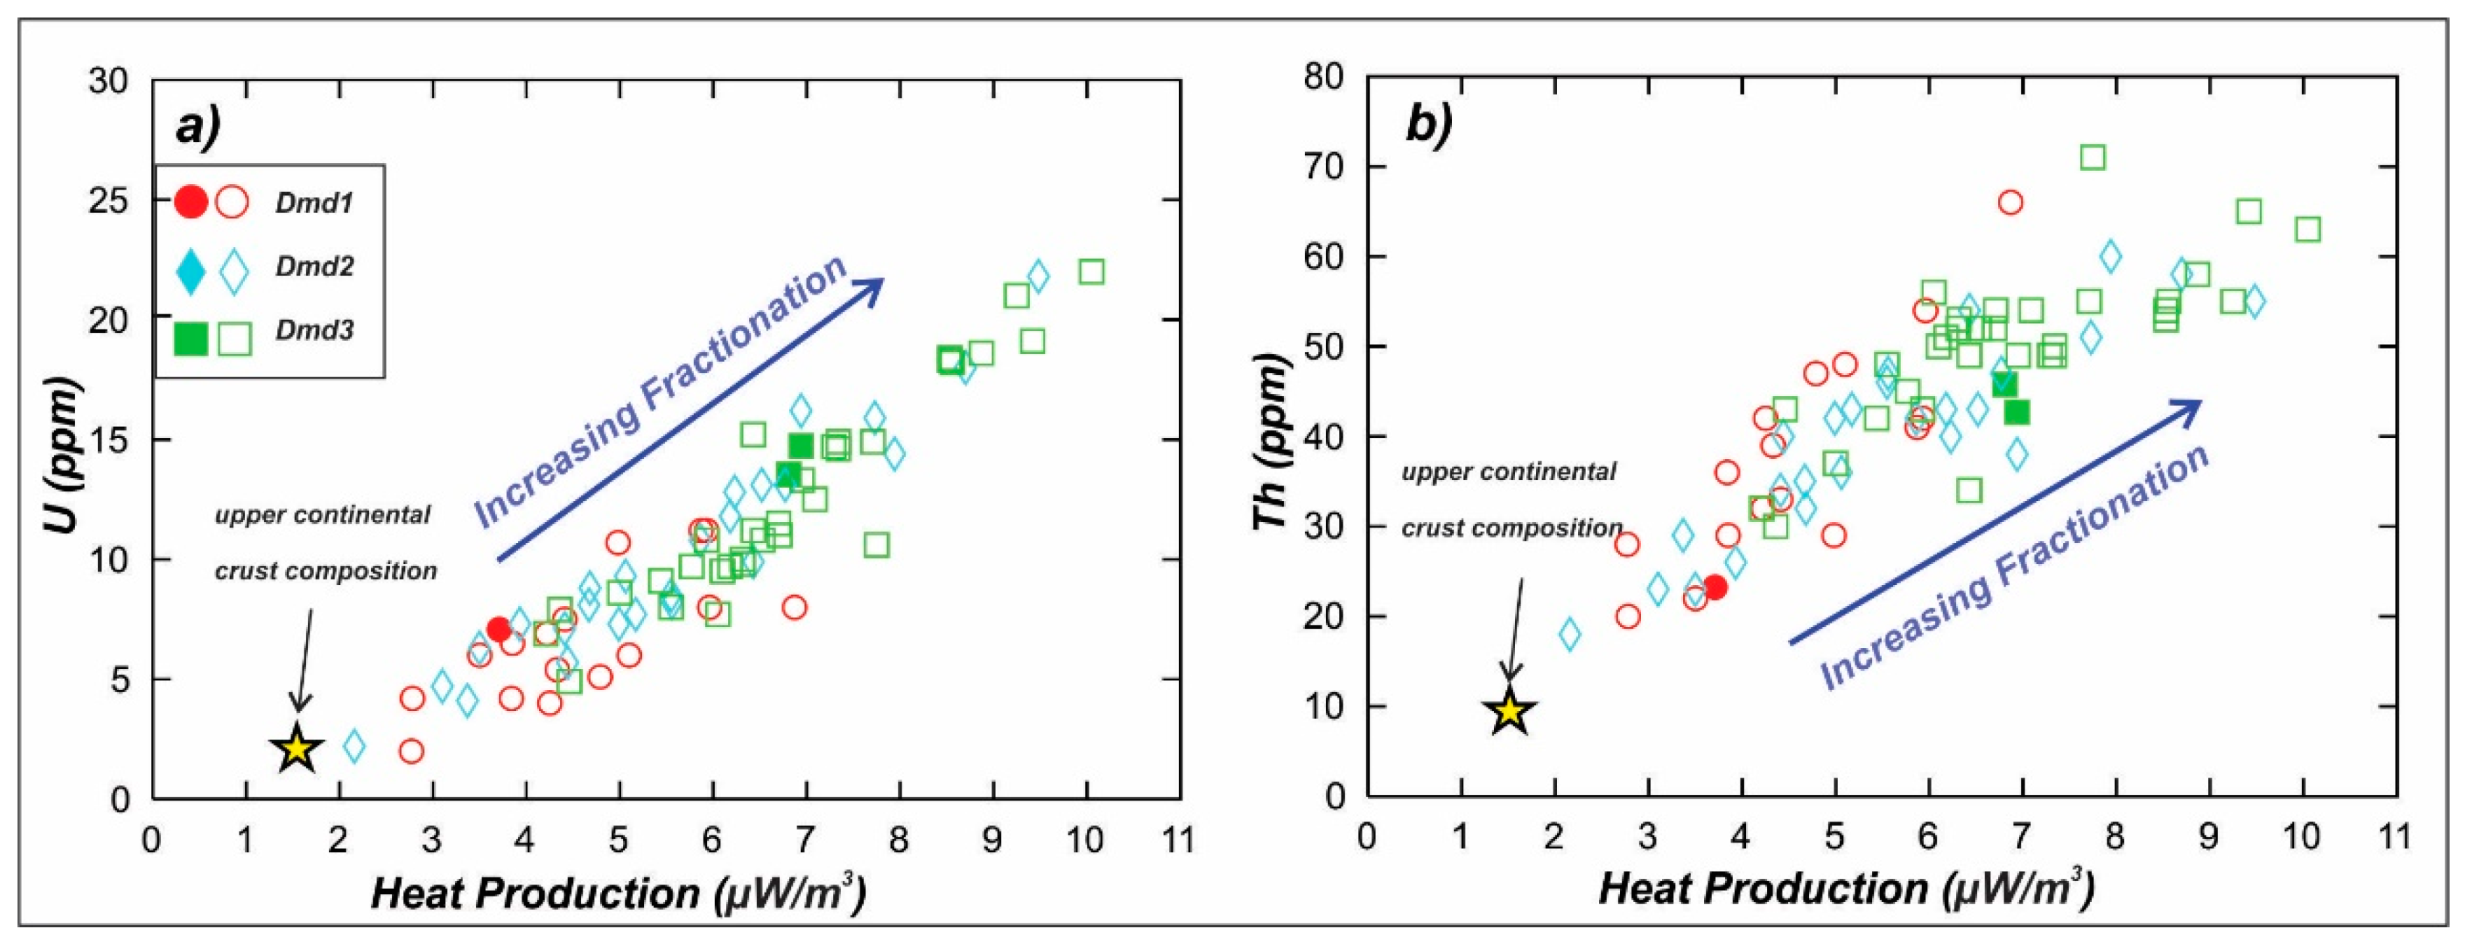
5.2. High Heat Production Nature of the Mount Douglas Granite

The radiogenic heat production of the MDG was examined to determine if there is any potential for a Hot Dry Rock (HDR) geothermal resource. This would be a local, renewable, and clean energy source associated with deep hot crystalline rocks with temperatures generally higher than 150 °C [47]. HHP granites have elevated concentrations of K2O, Rb, LREE, U, and Th and produce high values of heat production above the average crustal heat production generated by radioactive decay of unstable isotopes, such as 238U, 232Th, and 40K [48]. Previous studies confirm that granites, especially young S-type granites, are commonly suitable for HDR geothermal development [47,48,49].
The radiogenic heat production rates of the units Dmd1, Dmd2, and Dmd3 were calculated using the following equation developed by Rybach [50] (Equation (1)):
A [µW/m3] = 10−5 × ρ [kg/m3] × (2.56 × CTh [ppm] + 9.52 × CU [ppm] + 3.48 × CK [%])
where A is heat production and ρ is density. The CU and CTh are the concentrations of U and Th (in ppm), respectively, and CK is the concentration of K in wt.%. The related values (Table 4) are taken from whole-rock geochemical data of Mohammadi (Table 1 and Table S2) [15] and McLeod [17]. A density of 2.61 g/cm3 has been considered for all samples based on a representative granite from the Mount Douglas pluton [51]. The estimated radiogenic heat production rates (µW/m3) for the MDG ranged from 2.8 to 6.9 in Dmd1 (weighted mean = 4.67), from 2.2 to 9.5 in Dmd2 (weighted mean = 5.65), and from 4.2 to 10.1 in Dmd3 (weighted mean = 6.92), and were calculated based on the whole-rock weighted mean Th, U, and K2O of each unit (Table 1 and Table S2). These values are significantly higher than the average upper continental crust, which is 1.65 µW/m3 [52].
Figure 10 displays a plot of the calculated heat production values versus whole-rock U and Th abundances. The data demonstrate that the heat production values increase with the degree of fractional crystallization, i.e., from Dmd1 to Dmd3. Unit Dmd3 has the highest concentration of U and Th, and the greatest potential for geothermal energy resources. The blue arrows denote the fractional crystallization trend, whereas the yellow stars depict the average upper continental crust composition (Th = 10.5 ppm; U = 2.7 ppm; A = 1.65 µW/m3; [52,53]).

6. Discussion

6.1. Mineralization Ages of Greisen Veins

The term “hydrothermal monazite” is used here to distinguish primary monazite hosted by granite (igneous monazite) from secondary hydrothermal monazite that formed in greisen veins in association with other hydrothermal minerals, such as hematite, magnetite, pyrite, etc. Monazite, with a high blocking temperature (>800 °C), is one of the most reliable U–Th–Pb geochronometers for hydrothermal ore systems [11,12]. The commonly similar morphology of igneous and hydrothermal monazite prevents discrimination of these two types on the basis of petrographic analysis alone; however, hydrothermal monazite can generally be distinguished from the igneous grains by lower ThO2 contents that typically range between 0 and 1 wt.%, whereas igneous monazite typically contains from 3 to >12 wt.% ThO2 [12]. This difference is due to the very low solubility of Th in hydrothermal fluids relative to felsic igneous melts [12]. In addition to its low Th content, textural evidence for co-precipitation of monazite with other common minerals present in the greisen veins and, in some cases, its distinct morphology (Figure 5), allow for the unequivocal recognition of hydrothermal monazite. A characteristic feature of hydrothermal monazite in the Mount Douglas system is its intergrowth with oxide (Figure 5a,b) and sulfide minerals (Figure 5c) and its occurrence in clusters with other U-, Th-, and REE-rich minerals (Figure 5d).
Compared to hydrothermal-type monazite, disseminated igneous-type monazite is primarily hosted by biotite and occasionally exhibits faint patchy zoning, occurs as subhedral to anhedral, rounded irregular grains up to 150 µm in diameter, and is commonly in contact with accessory minerals, such as Fe–Ti oxides, apatite, xenotime, and thorite (Figure 6c,d).
A characteristic feature of hydrothermal monazite in the MDG is that it generally occurs as rounded or anhedral and irregular grains that are distributed along veins (Figure 5c and Figure 6a). In most cases, they are accompanied by oxide (mostly hematite, Figure 5a,b) and sulfide minerals, such as pyrite (Figure 5c). Another characteristic feature of the hydrothermal monazite grains is that they occur as clusters of very small grains (~5µm to 20µm) sometimes with more than 100 grains. In these cases, they are distinguished from more sparsely distributed igneous monazite, which is included in primary minerals (mainly biotite, Figure 6c,d) or is interstitial or intergrown with other igneous minerals, such as xenotime and apatite (Figure 6c,d) in the groundmass. In addition, hydrothermal monazite occurs dispersed with other neoform hydrothermal minerals such as hematite, xenotime, and even zircon in which the assemblage is distributed along margins of veins (Figure 5d).
Geochemically, the ThO2 contents of igneous monazite from the host granite ranges from 1.02 to 15.82 wt.% with a weighted mean of 6.72 wt.% [15], which is considerably higher than the hydrothermal monazite collected from greisen veins where the ThO2 content ranges from 0.10 to maximum 4.77 wt.% (weighted mean = 2.47 wt.%). Additionally, the U/Th ratio of the hydrothermal monazite ranges from 0.01 to 0.45 (mean = 0.09), and the U content ranges from 43 to 1824 ppm (weighted mean = 867 ppm), which is considerably lower than the U content of the igneous monazite [15].
Wetherill concordia and Tera–Wasserburg concordia plots accompanied by weighted mean 206Pb/238U ages (Ma) and 208Pb/232Th ages (Ma) of monazite grains suggest mineralization ages ranging from 344 Ma to 376 Ma (Table 2, Figure 8 and Figure 9). Considering the high ThO2 content of monazite from sample 50-2A and its association with primary biotite and zircon, it is probably not hydrothermal and, rather, it is most likely an igneous monazite. The age obtained for this sample (362 ± 14 Ma) cannot be used to reliably assess the age of mineralization. The estimated age for sample 268 was calculated using the weighted mean 206Pb/238U age as well for the main cluster of 7 of 11 spots that fall between 340 and 360 Ma, giving a weighted mean age of 350 ± 7 Ma (Figure 8d). The three older spots on this sample could represent mixing between hydrothermal and older inherited (e.g., 420 Ma) components, whereas the youngest spot outside the main cluster may have experienced minor Pb loss.

6.2. Time Gap Between Mineralization and Intrusion: Implication for High Heat Production Granite in Metallogenesis

Mineralization ages derived from in situ laser ablation ICP–MS U–Pb dating of hydrothermal monazite using the conventional Wetherill and Tera–Wasserburg concordia diagrams (excluding sample 50-2A) yielded lower intercept ages, ranging from 344 to 368 Ma (Figure 8; Table 2). Figure 11 depicts the mineralization ages accompanied by crystallization ages of the MDG (368 ± 3 Ma, data from Mohammadi [15]) to illustrate any relationships between emplacement timing of the granite and post-magmatic activities in this system. The data demonstrate that the mineralization ages are mainly younger than the crystallization age of the MDG (365 to 371 Ma; [15]); there is a small window between 365 and 368 Ma that mineralization and crystallization ages overlap (Figure 11). However, there is a time gap between emplacement of the granite and the timing of the mineralization, that is between 365 Ma (the youngest crystallization age) and 344 Ma (the youngest mineralization age), suggesting post-magmatic hydrothermal activities occur during this time. Mineralization occurring millions of years after emplacement of the pluton suggests another source of heat that was involved in the post-magmatic hydrothermal activity associated with greisen formation. The heat could be associated with thermal anomalies within and near plutons that are produced by the radioactive decay of K, U, and Th [54].
HHP granites are evolved granites with anomalously high Th, U, K, and total REE [37,54,57,58,59] and are responsible for parts of the crustal heat flow due to radiogenic decay of Th, U, and K [60,61] and have been reported from different places (e.g., [45,62,63,64,65,66,67,68,69,70,71]). Granites with approximately four times or more uranium than the average crustal abundance (3.5 ppm U [72]; 4 ppm U [73]) are considered to be HHP granites. This is consistent with previous investigations which show that the Mount Douglas pluton lies within an area of present High Heat Production [2,3,4] attributed to its enrichment in U and Th (2–22 ppm U; 19–71 ppm Th; [15]). HHP intrusions act as a ‘heat engine’ to prolong hydrothermal fluid activity [74,75] and produce mineral deposits that are not related directly to the initial heat generated by the pluton [54].
Gravity modeling in the eastern part of the Saint George Batholith, near the Welsford heat-flow site (northeastern part of the Mount Douglas Granite, Figure 2) indicates a thickness of about 6.5 km for the granite, considerably thicker than the thickness estimated by Drury et al. [76] who used a heat-flow-heat-generation relationship (1.4–3.3 km radiogenic thickness). The difference between estimated geothermal and gravity depth may be attributed to the enrichment of the intrusion with radiogenic minerals [52]. Drury et al. [76] noted that the lower thickness estimated from the radiogenic thickness model may be attributed to a high degree of alteration (greisenization) in the borehole that was used for that study. In this hypothesis, large-scale movement of groundwater led to redistribution and concentration of radioactive elements near the surface, implying depletion of the radioactive elements in the deeper levels and enrichment in the upper levels of granites, thereby yielding a shallower modeled depth in terms of geothermal modeling [51]. The higher concentration of radioactive materials in the near surface indicates that radioactive element-rich water might have been carried up from a great depth by hydrothermal convection generated by the decay of the radioactive elements themselves [51]. The Conway Granite of New Hampshire is a well-known example of such a long-lived hydrothermal convective system [75]. Here, attempts were made to demonstrate that heat generated by uranium-rich granites (granites with > 10 ppm uranium) can produce fluid convection that develops hydrothermal uranium deposits. Fehn et al. [75] established that the permeability of the pluton and the adjacent country rock exerts a critical control on flow rates. They also demonstrated that hydrothermal uranium deposits associated with granites with high contents of radioactive elements could be produced by convection-driven cells, in which the required heat is generated by radioactive decay within a few million years post-pluton-crystallization. The St. Austell Granite of Southwest England is another example of long-lived hydrothermal convective systems, in which the hydrothermal fluid cells were periodically rejuvenated by tectonic activity, generating multiple fracture fillings of uranium mineralization and yielding a range of ages from 224 to 45 Ma [77]. The theory described above can be applied to the Mount Douglas system, i.e., a high uranium content (2–22 ppm), long-lived hydrothermal activities, and the time gap between pluton emplacement and the associated mineralization. The most evolved granites with the highest silica contents and the lowest density are associated with the highest concentrations of heat-producing elements, such as U, Th, and K [2,3,4,51,75].
In addition to radioactive decay, later intrusions or multi-episodic intrusions could yield thermal pulses, thereby producing a long-lived hydrothermal system. Intrusions cool very rapidly in terms of the geological time scale [75], particularly when heat is lost through a combination of conductive and convective fluid flow [78]. In a thermal model developed by Cathles [79], for a small intrusion (1–2 km wide) to cool to 25% of its initial temperature by conduction alone, the magmatic-hydrothermal fluid circulation is effectively over in about 105–106 years; however, if cooling is accompanied by convective heat loss, this time is reduced to 104 years. In a geothermal two-dimensional conductive cooling model developed for granitic intrusions [80], the top of the pluton cools rapidly; however, internal heat generation causes the base of the pluton to remain hot. In some cases, this high basal temperature leads to increasing temperatures below and around the base of the pluton and may locally generate partial melts in the country rock, which eventually produces smaller intrusions within the pluton. This case can be investigated in the Mount Douglas system by documenting the crystallization ages of the aplitic dikes to demonstrate if they are younger than the pluton. In addition, geochemical data can be used to determine if the dikes are more fractionated than the main pluton as younger intrusions formed by crustal anatexis should have higher 87Sr/86Sr than the “mother” pluton.
To summarize, hydrothermal convection cells are initiated in the pluton immediately, following emplacement. In granitic systems, the convective cells are prolonged by high internal heat generation [80]. Radioactive decay and later intrusions, or combinations of the two, are the factors affecting the time span of hydrothermal activity in the Mount Douglas system.

6.3. Mount Douglas Granite: High Potential for Geothermal Energy Resources

Results obtained from this study demonstrate that the Mount Douglas granitic rocks may have great potential for dry geothermal energy sources; however, surface heat flow, which is a function of radioactive element contents below the continents, the latest thermal event, and the intensity of tectonic activities [47] are important parameters that should be considered when evaluating potential geothermal resources. In addition, Nisbet and Fowler [81] established that the geothermal gradient is controlled by some internal and external parameters of the rock column. The internal parameters are the conductivity, heat capacity of the rock, and the radioactive heat generation from K, U, and Th decay, whereas external factors are heat flow into the column from below and the erosion rate at which material is removed from the top of the column. As an example, increasing the radioactive heat generation to 6 HGU (Heat Generation Unit; 2.51 × 10⁻³ mWm−3) raises the equilibrium geotherm from 30 °C/km to over 50 °C/km [81].
The MDG’s heat production values (weighted mean = 5.9 µW/m3) and heat flow rates (70 mW/m2; [1]) are comparable to values in other locations that have been classified as HHP granites (e.g., [52,82,83,84,85]) which have the potential to host geothermal energy resources. As an example, estimated heat production values from 207 samples taken from granites in Southern China have been considered as having great potential for developing an HDR geothermal resource [47]. These granites are characterized by high heat flow values (>80 mW/m2) and a weighted mean radiogenic heat production rate of 4.11 µW/m3 [47,86,87]. In addition, the radiogenic heat production rates estimated for the Jurassic weakly peraluminous A-type HHP granites associated with the Weddell Sea rift system, Antarctica, have high Th (60.7 ppm) and U (28.6 ppm), and a high mean heat production of 5.35 µW/m3 and predicted heat flow of 70–95 mW/m2 [52].
These examinations suggest that the MDG with a High Heat Production of 5.9 µW/m3 (14.1 HGU), which is higher than the average total heat generation of the continental crust (3.8 HGU; [56]), can be considered as ‘hot crust’. In a discrimination definition, the heat generation value of 7 HGU (2.91 µW/m3) is taken as the boundary between the ‘hot crust’ and ‘cold crust’ [54]. Such High Heat Production values are expected to result in local heat flow anomalies for the area, although further investigation, such as airborne radiometric surveys, seismic data, and satellite magnetic data, are required.

7. Conclusions

U–Pb geochronology of hydrothermal monazite coexisting with sulfide and oxide minerals in greisen veins from the Mount Douglas Granite yielded mineralization ages ranging from 344 to 368 Ma, with most of the ages being younger than the crystallization age of the pluton (368 ± 3 Ma). The younger ages that was calculated for hydrothermal monazite indicate post-magmatic hydrothermal activity within the Mount Douglas pluton that resulted in the formation of uraniferous greisen veins. This indicates its HHP nature, i.e., this pluton produced additional heat via radioactive decay of U, Th, and K during prolonged/protracted hydrothermal activity, ultimately, generating hydrothermal ore-deposits that were younger than the pluton.
The uraniferous nature of the MDG is well-established by a number of criteria, including high U and Th contents (2–22 ppm U; 19–71 ppm Th), previous airborne radiometric survey, whole-rock geochemical data, the presence of U-, Th-, and REE-bearing minerals (e.g., monazite, zircon, xenotime, thorite, and uraninite) and significant anomalies of U and Th in some oxide and sulfide minerals, (e.g., wolframite, hematite, and martite). On the basis of the above, it is hypothesized that a combination of radioactive decay and, later blind intrusions are the likely heat-generators that prolonged the hydrothermal activity responsible for greisen mineralization long after pluton emplacement.
Assuming a density of 2.61 g/cm3, the calculated average weighted mean radiogenic heat production of the MDGs is 5.9 µW/m3, and ranges from 2.2 µW/m3 in unit Dmd1 to 10.1 µW/m3 in unit Dmd3, i.e., heat production increases with the degree of fractional crystallization. The average heat production, 5.9 µW/m3 (14.1 HGU), is significantly higher than the average upper continental crust (1.65 µW/m3), and is accompanied by a high heat flow of 70 mW/m2, which supports the classification of MDGs as a ‘hot crust’ regime (>7 HGU). This classification suggests the pluton has significant potential for geothermal energy resource development.

Supplementary Materials

The following are available online at https://www.mdpi.com/2076-3263/9/5/224/s1, Figure S1: Results of U-Pb geochronology of the 44069 monazite standard that was used to check the accuracy of the data. Table S1: Results of in-situ LA-ICP-MS U-Pb geochronology of 44069 monazite standard. Table S2: Laser ablation ICP-MS whole-rock geochemical analyses of selected granites from the Mount Douglas Granite.

Author Contributions

Conceptualization, N.M., C.R.M.M. and D.R.L.; Formal analysis, N.M. and C.R.M.M.; Funding acquisition, C.R.M.M. and D.R.L.; Investigation, N.M., C.R.M.M. and D.R.L.; Methodology, N.M., C.R.M.M. and D.R.L.; Software, N.M. and C.R.M.M.; Supervision, C.R.M.M. and D.R.L.; Validation, C.R.M.M. and D.R.L.; Visualization, N.M., C.R.M.M. and D.R.L.; Writing—original draft, N.M.; Writing—review&editing, C.R.M.M. and D.R.L.

Funding

This work was supported by New Brunswick Energy and Resource Development, President’s Doctoral scholarship (UNB), New Brunswick Innovation Foundation (NBIF), and W.J. Wright Graduate Fellowship (UNB).

Acknowledgments

The authors are grateful to Joseph Whalen (Geological Survey of Canada, Natural Resources Canada, Ottawa), Kay Thorne and Jim Walker (Geological Surveys Branch of the New Brunswick Department of Energy and Resource Development) for thoughtful review that improved the manuscript substantially. Douglas Hall (UNB Microscopy and Microanalyses Facility) is also thanked for help with SEM-BSE imaging. The authors are also grateful to the anonymous reviewers for constructive reviews of the manuscript.

Conflicts of Interest

The authors declare no conflict of interest.

References

  1. Chandra, J.J. New Brunswick Radioactive Heat Product; Open File 80-92; New Brunswick Department of Natural Resources, Mineral Resources Branch: Fredericton, NB, Canada, 1980. [Google Scholar]
  2. Hassan, H.H. Uranium and Thorium Distribution in the Rocks of Southwestern New Brunswick, Canada. Ph.D. Thesis, University of New Brunswick, Fredericton, NB, Canada, 1984. [Google Scholar]
  3. Hassan, H.H.; Hale, W.E. Uranium and Thorium Distribution in the Rocks of Southwestern New Brunswick, Canada; Open File Report 86-10; New Brunswick Department of Natural Resources and Energy, Minerals and Energy Division: Fredericton, NB, Canada, 1987; 100p. [Google Scholar]
  4. Hassan, H.H.; Hale, W.E.; Chrzanowski, M. Geology of Uranium and Associated Elements in New Brunswick; Geological Survey of Canada, Open File 1769; Natural Resources and Energy: Fredericton, NB, Canada, 1987; ISBN 0662438116. [Google Scholar]
  5. McLeod, M.J.; Smith, E.A. Uranium; Profile No. 6; New Brunswick Department of Natural Resources; Lands, Minerals and Petroleum Division, Mineral Commodity: Fredericton, NB, Canada, 2010. [Google Scholar]
  6. Shinkle, D.; Lentz, D.R. Long Lake uranium deposit, north-central New Brunswick: A granite-hosted uraniferous polymetallic vein system in the Canadian Appalachians. In Proceedings of the AGS Abstracts—2007 Annual General Meeting, Moncton, NB, USA, 2–3 February 2007; pp. 28–29. [Google Scholar]
  7. Shinkle, D.; Lentz, D.R.; McCutcheon, S. The Early to Late Devonian North Pole Stream granitic suite: A strongly peraluminous granitic complex hosting a intragranitic vein-type uranium deposit, New Brunswick. In Proceedings of the Atlantic Geoscience Society 37th Colloquium and Annual General Meeting; Atlantic Geology, Fredericton, NB, Canada, 12–13 February 2011. [Google Scholar]
  8. McFarlane, C.R.M.; Harrison, M.T. Pb-diffusion in monazite: Constraints from a high-T contact aureole setting. Earth Planet. Sci. Lett. 2006, 250, 376–384. [Google Scholar] [CrossRef]
  9. Gardés, E.; Jaoul, O.; Montel, J.-M.; Seydoux-Guillaume, A.-M.; Wirth, R. Pb diffusion in monazite: An experimental study of Pb2+ + Th4+⇔2Nd3+ interdiffusion. Geochim. Cosmochim. Acta 2006, 70, 2325–2336. [Google Scholar] [CrossRef]
  10. Gardés, E.; Montel, J.-M.; Seydoux-Guillaume, A.-M.; Wirth, R. Pb diffusion in monazite: New constraints from the experimental study of Pb2+⇔Ca2+ interdiffusion. Geochim. Cosmochim. Acta 2007, 71, 4036–4043. [Google Scholar] [CrossRef]
  11. Vielreicher, M.N. Hydrothermal monazite and xenotime geochronology: A new direction for precise dating of orogenic gold mineralization. Soc. Econ. Geol. Newsl. 2003, 53, 9–16. [Google Scholar]
  12. Schandl, E.S.; Gorton, M.P. A textural and geochemical guide to the identification of hydrothermal monazite: Criteria for selection of samples for dating epigenetic hydrothermal ore deposits. Econ. Geol. 2004, 99, 1027–1035. [Google Scholar] [CrossRef]
  13. Grand’Homme, A.; Janots, E.; Bosse, V.; Seydoux-Guillaume, A.M.; De Ascenção Guedes, R. Interpretation of U-Th-Pb in-situ ages of hydrothermal monazite-(Ce) and xenotime-(Y): Evidence from a large-scale regional study in clefts from the western Alps. Miner. Pet. 2016, 110, 787–807. [Google Scholar] [CrossRef]
  14. Charnley, B.; Lentz, D.R.; McFarlane, C.R.M. Hydrothermal monazite and xenotime related to granites associated with the North Zone Mount Pleasant Sn-Zn-Cu-In (& W) deposits, NB, Canada: Preliminary studies. In Proceedings of the 14th Biennial Society for Geology Applied to Mineral Deposits (SGA) Meeting, Mineral Resources to Discover, Québec City, QC, Canada, 20–23 August 2017; pp. 369–372. [Google Scholar]
  15. Mohammadi, N. Petrogenesis of Tin-Tungsten-Molybdenum Mineralized Intragranitic Systems within the Highly Evolved Mount Douglas Polyphase Intrusive Complex, Southwestern New Brunswick, Canada. Ph.D. Thesis, University of New Brunswick, Fredericton, NB, Canada, 2018. [Google Scholar]
  16. McCutcheon, S.R.; Robinson, P.T. Geological Constraints on the Genesis of the Maritimes Basin, Atlantic Canada. In Sedimentary Basin and Basin-Forming Mechanisms; Beaumont, C., Tankard, A.J., Eds.; Canada Society of Petroleum Geologists: Calgary, AB, USA, 1987; Memoir 12; pp. 287–297. [Google Scholar]
  17. McLeod, M.J. Geology, Geochemistry and Related Mineral Deposits of the Saint George Batholith; Charlotte, Queens and Kings Counties, New Brunswick; Mineral Resources Report 5; New Brunswick, Natural Resources and Energy: Fredericton, NB, USA, 1990; 169p. [Google Scholar]
  18. Van Staal, C.R.; Whalen, J.B.; Valverde-Vaquero, P.; Zagorevski, A.; Rogers, N. Pre-Carboniferous, episodic accretion-related, orogenesis along the Laurentian margin of the northern Appalachians. Geol. Soc. Lond. Spec. Publ. 2009, 327, 271–316. [Google Scholar] [CrossRef]
  19. Whalen, J.B. Geology, Petrography, and Geochemistry of Appalachian Granites in New Brunswick and Gaspésie, Québec. Geol. Surv. Can. Bull. 1993, 436, 130. [Google Scholar]
  20. Whalen, J.B.; Fyffe, L.R.; Longstaffe, F.J.; Jenner, G.A. The position and nature of the Gander–Avalon boundary, southern New Brunswick, based on geochemical and isotopic data from granitoid rocks. Can. J. Earth Sci. 1996, 33, 129–139. [Google Scholar] [CrossRef]
  21. Yang, X.-M.; Lentz, D.R.; McCutcheon, S.R. Petrochemical evolution of subvolcanic granitoid intrusions within the Late Devonian Mount Pleasant Caldera, southwestern New Brunswick, Canada: Comparison of Au versus Sn-W-Mo-polymetallic mineralization systems. Atl. Geol. 2003, 39, 97–121. [Google Scholar] [CrossRef]
  22. Thorne, K.G.; Fyffe, L.R.; Creaser, R.A. Re-Os geochronological constraints on the mineralizing events within the Mount Pleasant Caldera: Implications for the timing of sub-volcanic magmatism. Atl. Geol. 2013, 49, 131–150. [Google Scholar] [CrossRef]
  23. Van Staal, C.R.; Barr, S.M. Lithospheric architecture and tectonic evolution of the Canadian Appalachians and associated Atlantic margin. Chapter 2. In Proceedings of the Tectonic Style in Canada: The Lithoprobe Perspective, St. John’s, NL, Canada, 31 October 2012; Percival, J.A., Cook, F.A., Clowes, R.M., Eds.; Special Paper 49. Geological Association of Canada: St. John’s, NL, Canada, 2012; pp. 41–95. [Google Scholar]
  24. Pearce, J.A.; Harris, N.B.W.; Tindle, A.G. Trace element discrimination diagrams for the tectonic interpretation of granitic rocks. J. Pet. 1984, 25, 956–983. [Google Scholar] [CrossRef]
  25. Christiansen, E.H.; Keith, J.D. Trace element systematics in silicic magmas: A metallogeneic prospective. In Proceedings of the Trace Element Geochemistry of Volcanic Rocks: Applications for Massive Sulfide Exploration, Winnipeg, MB, Canada, 24–26 May 2016; Wyman, D.A., Ed.; Short Course Notes. Geological Association of Canada: St. John’s, NL, Canada, 1996; Volume 12, pp. 115–151. [Google Scholar]
  26. Lentz, D.R.; Mohammadi, N. Petrogenesis and evolution of peraluminous Mount Douglas leucogranites, southwestern New Brunswick, Canada: Extreme fractionation linked to Sn-W-Mo-polymetallic mineralization. Acta Geol. Sin. Engl. Ed. 2014, 88, 1518–1520. [Google Scholar] [CrossRef]
  27. McLeod, M.J.; Taylor, R.P.; Lux, D.R. Geology, 40Ar/39Ar geochronology and Sn-W-Mo-bearing sheeted veins of the Mount Douglas Granite, southwestern New Brunswick. Can. Inst. Min. Met. Bull. 1988, 81, 70–77. [Google Scholar]
  28. Bevier, M.L. U-Pb geochronologic studies of igneous rocks in N.B. In Proceedings of the Thirteenth Annual Review of Activities, Project Resumes, Fredericton, NB, Canada, January 1988; Abbott, S., Ed.; Information Circular 88. New Brunswick Department of Natural Resources and Energy, Minerals and Energy Division: Fredericton, NB, Canada, 1988; pp. 134–140. [Google Scholar]
  29. Mohammadi, N.; Fyffe, L.; McFarlane, C.R.M.; Thorne, K.G.; Lentz, D.R.; Charnley, B.; Branscombe, L.; Butler, S. Geological relationships and laser ablation ICP-MS U-Pb geochronology of the Saint George Batholith, southwestern New Brunswick, Canada: Implications for its tectonomagmatic evolution. Atl. Geol. 2017, 53, 207–240. [Google Scholar] [CrossRef]
  30. Clarke, D.B.; McFarlane, C.R.M.; Hamilton, D.; Stevens, D. Forensic igneous petrology: Locating the source quarry for the “Black Granite” Titanic Headstones in Halifax, Nova Scotia, Canada. Can. Miner. 2017, 55, 145–177. [Google Scholar] [CrossRef]
  31. NR-7 Metallogenic Map of New Brunswick; New Brunswick Department of Natural Resources and Energy: Fredericton, NB, USA, 2002.
  32. McFarlane, C.R.M.; Luo, Y. U-Pb geochronology using 193 nm excimer LA-ICP-MS optimized for in-situ accessory mineral dating in thin sections. Geosci. Can. 2012, 39, 158–172. [Google Scholar]
  33. McFarlane, C.R.M. Allanite U-Pb geochronology by 193 nm LA ICP-MS using NIST610 glass for external calibration. Chem. Geol. 2016, 438, 91–102. [Google Scholar] [CrossRef]
  34. McFarlane, C.R.M. A geochronological framework for sedimentation and Mesoproterozoic tectono-magmatic activity in lower Belt–Purcell rocks exposed west of Kimberley, British Columbia. Can. J. Earth Sci. 2015, 52, 444–465. [Google Scholar] [CrossRef]
  35. Azadbakht, Z.; McFarlane, C.E.M.; Lentz, D.R. Precise U-Pb ages for the cogenetic alkaline Mount LaTour and peraluminous Mount Elizabeth granites of the South Nepisiguit River Plutonic Suite, northern New Brunswick, Canada. Atl. Geol. 2016, 52, 189. [Google Scholar] [CrossRef]
  36. Williams, M.L.; Jercinovic, M.J.; Goncalves, P.; Mahan, K. Format and philosophy for collecting, compiling, and reporting microprobe monazite ages. Chem. Geol. 2006, 225, 1–15. [Google Scholar] [CrossRef]
  37. Aleinikoff, J.N.; Schenck, W.S.; Plank, M.O.; Srogi, L.; Fanning, C.M.; Kamo, S.L.; Bosbyshell, H. Deciphering igneous and metamorphic events in high-grade rocks of the Wilmington Complex, Delaware: Morphology, cathodoluminescence and backscattered electron zoning, and SHRIMP U-Pb geochronology of zircon and monazite. Geol. Soc. Am. Bull. 2006, 118, 39–64. [Google Scholar] [CrossRef]
  38. Hetherington, C.J.; Backus, E.L.; McFarlane, C.R.M.; Fisher, C.M.; Pearson, D.G. Origins of textural, compositional, and isotopic complexity in monazite and its petrochronological analysis. In AGU Geophysical Monograph Series “Microstructural Geochronology: Planetary Records Down to Atom Scale; Moser, D., Fernando, C., Darling, J., Reddy, S., Kimberly, T., Eds.; American Geophysical Union (AGU): Washington, DC, USA, 2017; pp. 63–90. [Google Scholar]
  39. Ludwig, K.R. Isoplot 3.75: A Geochronological Toolkit for Microsoft Excel; Spec. Publ. 5; BGC Berkeley Geochronology Center: Berkeley, CA, USA, 2012; p. 75. [Google Scholar]
  40. Thorne, K.G.; Fyffe, L.R.; Seaman, A.A.; Parkhill, M.A.; Pronk, A.G.; McClenaghan, S.H. Granite-Related Mineralization at the Sisson W-Mo Deposit and the Zealand Station Be-Mo-W Prospect, New Brunswick; New Brunswick Department of Energy and Mines, Exploration, Mining and Petroleum Conference Field Trip: Fredericton, NB, USA, 2014. [Google Scholar]
  41. Strong, D.F. Ore deposit models-5. A model for granophile mineral deposits. Geosci. Can. 1981, 8, 155–161. [Google Scholar]
  42. Mohammadi, N.; McFarlane, C.R.M.; Lentz, D.R.; Thorne, K.G. Ta-rich wolframite from the Sn-W-Mo-bearing Mount Douglas leucogranite, southwestern New Brunswick, Canada: A SEM and laser ablation ICP-MS study. In Proceedings of the GAC-MAC Annual Meeting, Whitehorse, YT, Canada, 1–3 June 2016. [Google Scholar]
  43. Mohammadi, N.; Lentz, D.R.; McFarlane, C.R.M. Geochemistry of Cd-rich Sphalerite of Greisen Veins from the Sn-W-Mo-Bearing Mt. Douglas Leucogranite, NB, Canada. In Proceedings of the Exploration, Mining and Petroleum New Brunswick Conference (EMP), Fredericton, NB, Canada, 6–8 November 2016. [Google Scholar]
  44. Mohammadi, N.; Mcfarlane, C.R.M.; Lentz, D.R. Raman spectroscopy and laser ablation ICP MS of hematite and martite from uraniferous greisen veins, Mt. Douglas Granite, NB, Canada. In Proceedings of the 26th Anniversary Goldschmidt, Yokohama, Japan, 26 June–1 July 2016. [Google Scholar]
  45. Marshall, T.A.; Morris, K.; Law, G.T.W.; Livens, F.R.; Mosselmans, J.F.W.; Bots, P.; Shaw, S. Incorporation of uranium into hematite during crystallization from ferrihydrite. Environ. Sci. Technol. 2014, 48, 3724–3731. [Google Scholar] [CrossRef] [PubMed]
  46. Andersen, T. Correction of common lead in U–Pb analyses that do not report 204Pb. Chem. Geol. 2002, 192, 59–79. [Google Scholar] [CrossRef]
  47. Sun, Z.; Wang, A.; Liu, J.; Hu, B.; Chen, G. Radiogenic heat production of granites and potential for hot dry rock geothermal resource in Guangdong Province, Southern China. World Geotherm. Congr. 2015, 2015, 2–6. [Google Scholar]
  48. Rybach, L.; Bodmer, P.; Pavoni, N.; Mueller, S. Siting criteria for heat extraction from hot dry rock; Application to Switzerland. Pure Appl. Geophys. Pageoph 1978, 116, 1211–1224. [Google Scholar] [CrossRef]
  49. Wang, A.D.; Sun, Z.X.; Hu, B.Q.; Liu, J.H.; Liu, C.D. Guangdong, a potential province for developing hot dry rock geothermal resource. Appl. Mech. Mater. 2014, 492, 583–585. [Google Scholar] [CrossRef]
  50. Rybach, L. Determination of heat production rate. In Proceedings of the Handbook of Terrestrial Heat Flow Density Determination; Hänel, R., Rybach, L.L., Stegena, Eds.; Kluwer: Dordrecht, The Netherlands, 1988; pp. 125–142. [Google Scholar]
  51. Thomas, M.D.; Willis, C. Gravity modelling of the Saint George Batholith and adjacent terrane within the Appalachian Orogen, southern New Brunswick. Can. J. Earth Sci. 1989, 26, 561–576. [Google Scholar] [CrossRef]
  52. Leat, P.T.; Jordan, T.A.; Flowerdew, M.J.; Riley, T.R.; Ferraccioli, F.; Whitehouse, M.J. Jurassic high heat production granites associated with the Weddell Sea rift system, Antarctica. Tectonophysics 2018, 722, 249–264. [Google Scholar] [CrossRef]
  53. Rudnick, R.L.; Gao, S. Composition of the continental crust. Treatise Geochem. 2003, 3, 1–64. [Google Scholar]
  54. Shrivastava, K.L.; Ram, D.; Gaur, V. High heat producing radioactive granites of Malani igneous suite at northeast of Jodhpur, northwestern India. J. Geol. Soc. India 2017, 89, 291–294. [Google Scholar] [CrossRef]
  55. Taylor, S.R.; McLennan, S.M. The Continental Crust: Its Composition and Evolution; Blackwell: Oxford, UK, 1985. [Google Scholar]
  56. Taylor, S.R. Trace element abundances and the chondritic Earth model. Geochim. Cosmochim. Acta 1964, 28, 1989–1998. [Google Scholar] [CrossRef]
  57. Sharma, R.S. High heat production granites of Jhunjhunu area, Rajasthan, India. Bull. Indian Geolo. Assoc 1994, 27, 55–61. [Google Scholar]
  58. Srivastava, P.K. High heat producing granites of Degana, Rajasthan. Indian J. Geochem. 2003, 18, 149–155. [Google Scholar]
  59. Kochhar, N. The Malani supercontinent: Siberia, Mongolia, Kazakhstan connection during Late-Proterozoic. In Proceedings of the 34th International Geological Congress, Brisbane, Australia, 5–10 August 2012. [Google Scholar]
  60. Morgan, P.; Sass, J.H. Thermal regime of the continental lithosphere. J. Geodyn. 1984, 1, 143–166. [Google Scholar] [CrossRef]
  61. Morgan, P. Crustal radiogenic heat production and the selective survival of ancient continental crust. J. Geophys. Res. 1985, 90, C561. [Google Scholar] [CrossRef]
  62. Simpson, P.R.; Plant, J.A. Role of high heat production granites in uranium province formation. In Uranium Geochemistry, Mineralogy, Geology, Exploration and Resources; Springer: Dordrecht, The Netherlands, 1984; pp. 167–178. [Google Scholar]
  63. Vigneresse, J.L.; Jolivet, J.; Cuney, M.; Bienfait, G. Heat flow, heat production and granite depth in western France. Geophys. Res. Lett. 1987, 14, 275–278. [Google Scholar] [CrossRef]
  64. Webb, P.C.; Lee, M.K.; Brown, G.C. Heat flow–heat production relationships in the UK and the vertical distribution of heat production in granite batholiths. Geophys. Res. Lett. 1987, 14, 279–282. [Google Scholar] [CrossRef]
  65. Jolivet, J.; Bienfait, G.; Vigneresse, J.L.; Cuney, M. Heat flow and heat production in Brittany (Western France). Tectonophysics 1989, 159, 61–72. [Google Scholar] [CrossRef]
  66. Louden, K.E.; Mareschal, J.-C. Measurements of radiogenic heat production on basement samples from sites 897 and 900. In Proceedings of the Ocean Drilling Program, Scientific Results; Whitmarsh, R.B., Sawyer, D.S., Klaus, A., Masson, D.G., Eds.; Ocean Drilling Program: College Station, TX, USA, 1996; pp. 675–682. [Google Scholar]
  67. Kromkhun, K. Petrogenesis of High Heat Producing Granite: Implication for Mt Painter Province, South Australia. Ph.D. Thesis, University of Adelaide, Adelaide, Australia, 2010. [Google Scholar]
  68. Marshall, V.; Van Zyl, J.; Bryan, S.; Uysal, T.; Gasparon, M. Comparative petrology and geochemistry of high heat-producing granites in Australia and Europe. In Proceedings of the 2010 Australian Geothermal Energy Conference, Adelaide, Australia, 16–19 November 2010; pp. 41–47. [Google Scholar]
  69. Singh, H.K.; Kumar, Y.; Chandrasekharam, D.; Gurav, T.; Singh, B. High-heat-producing granites of East Dharwar Craton around Gugi, Karnataka, and their possible influence on the evolution of Rajapur thermal springs, Deccan Volcanic Province, India. Geotherm. Energy 2014, 2, 2. [Google Scholar] [CrossRef]
  70. Beamish, D.; Busby, J. The Cornubian geothermal province: Heat production and flow in SW England: Estimates from boreholes and airborne gamma-ray measurements. Geotherm. Energy 2016, 4, 4. [Google Scholar] [CrossRef]
  71. England, P.C.; Oxburgh, E.R.; Richardson, S.W. Heat refraction and heat production in and around granite plutons in north-east England. Geophys. J. Int. 1980, 62, 439–455. [Google Scholar] [CrossRef] [Green Version]
  72. Clark, A.H.; Farrar, E.; Kontak, D.J.; Langridge, R.J.; Arenas, F.M.J.; France, L.J.; McBride, S.L.; Woodman, P.L.; Wasteneys, H.A.; Sandeman, H.A.; et al. Geological and geochronological constructions on the metallogenic evolution of the Andes of southeastern Peru. Econ. Geol. 1990, 85, 1520–1583. [Google Scholar] [CrossRef]
  73. Rogers, J.J.W.; Adams, J.A.S. Thorium. In Proceedings of the Handbook of Geochemistry; Wedepohl, K.H., Ed.; Springer: Berlin, Germany, 1969; pp. 11–14. [Google Scholar]
  74. Kimberley, S.J. Uranium deposits, their mineralogy and origin: A short course. Miner. Assoc. Can. Short Course Handb. 1978, 3, 521. [Google Scholar]
  75. Fehn, U.; Cathles, L.M.; Holland, H.D. Hydrothermal convection and uranium deposits in abnormally radioactive pluton. Econ. Geol. 1978, 73, 1556–1566. [Google Scholar] [CrossRef]
  76. Drury, M.J.; Jessop, A.M.; Lewis, T.J. The thermal nature of the Canadian Appalachian crust. Tectonophysics 1987, 133, 1–14. [Google Scholar] [CrossRef]
  77. Allman-Ward, P. Distribution of uranium and thorium in the western lobe of the St. Austell granite and the effects of alteration processes. In Proceedings of the High Heat Production (HHP) Granites, Hydrothermal Circulation and Ore Genesis. Conference, Institution of Mining and Metallurgy, St. Austell, UK, 22–25 September 1985; pp. 437–458. [Google Scholar]
  78. Robb, L. Introduction to Ore-Forming Processes; John Wiley and Sons Ltd.: Oxford, UK, 2005; ISBN 0632063785. [Google Scholar]
  79. Cathles, L.M. Fluid flow and genesis of hydrothermal ore deposits. Econ. Geol. 1981, 75, 424–457. [Google Scholar]
  80. Fowler, C.M.R.; Nisbet, E.G. The thermal background to metamorphism—II: Simple two-dimensional conductive models. Geosci. Can. 1982, 9, 208–214. [Google Scholar]
  81. Nisbet, E.G.; Fowler, C.M.R. The thermal background to metamorphism -1. Simple one-dimensional conductive models. Geosci. Can. 1982, 9, 161–164. [Google Scholar]
  82. Richardson, S.W.; Oxburgh, E.R. Heat flow, radiogenic heat production and crustal temperatures in England and Wales. J. Geol. Soc. Lond. 1978, 135, 323–337. [Google Scholar] [CrossRef]
  83. Lee, M.K.; Brown, G.C.; Webb, P.C.; Wheildon, J.; Rollin, K.E. Heat flow, heat production and thermo-tectonic setting in mainland UK. J. Geol. Soc. Lond. 1987, 144, 35–42. [Google Scholar] [CrossRef]
  84. Förster, A.; Förster, H.-J. Crustal composition and mantle heat flow: Implications from surface heat flow and radiogenic heat production in the Variscan Erzgebirge (Germany). J. Geophys. Res. Solid Earth 2000, 105, 27917–27938. [Google Scholar] [CrossRef] [Green Version]
  85. Bea, F. The sources of energy for crustal melting and the geochemistry of heat-producing elements. Lithos 2012, 153, 278–291. [Google Scholar] [CrossRef]
  86. Hu, S.; He, L.; Wang, J. Heat flow in the continental area of China: A new data set. Earth Planet. Sci. Lett. 2000, 179, 407–419. [Google Scholar] [CrossRef]
  87. Wang, J.; Hu, S.; Pang, Z.; He, L.; Zhao, P.; Zhu, C.; Rao, S.; Tang, X.; Kong, Y.; Luo, L.; et al. Estimate of geothermal resources potential for hot dry rock in the continental area of China. Sci. Technol. Rev. 2012, 30, 25–31. [Google Scholar]
Figure 1. Regional geological map of the Saint George Batholith and location of the Mount Douglas Granite (MDG; modified after Thorne et al. [22] and Mohammadi et al. [29]). The MDG is divided into units Dmd1, Dmd2, and Dmd3 (modified after McLeod [17]). The yellow shaded box in the lower right corner of the figure lists crystallization ages of the various intrusions associated with the Saint George Batholith. The crystallization age of the Bocabec Gabbro was taken from Clarke et al. [30]. Mount Pleasant’s molybdenite Re–Os geochronology was taken from Thorne et al. [22]. LA ICP-MS U–Pb zircon and monazite geochronology of the Utopia Granite, Jake Lee Mountain Granite, Wellington Lake Granite, John Lee Brook Granite, and Magaguadavic Granite were taken from Mohammadi et al. [29]. LA ICP-MS U–Pb zircon and monazite crystallization ages of the MDG were taken from Mohammadi [15].
Geosciences 09 00224 g001
Figure 2. Geology of the Mount Douglas Granite with units Dmd1, Dmd2, and Dmd3 (modified after McLeod [17] and Mohammadi et al. [29]). Yellow stars show the location of samples taken from greisen veins for U–Pb hydrothermal monazite geochronology. Black diamonds are mineral occurrences associated with the MDG compiled from the Metallogenic Map of New Brunswick, NR-7 [31]. The mineral occurrences consist of endogranitic Sn, W, Mo, Zn, and Bi-bearing greisen and sheeted veins.
Geosciences 09 00224 g002
Figure 3. Schematic diagram illustrating the position of the Saint George Batholith with respect to the paleotectonic setting of Early-Late Devonian (400–360 Ma) intrusions related to the Neoacadian Orogeny (modified after Whalen [19], Whalen et al. [20], and van Staal et al. [18]). FBF = Falls Brook Fault; WBF = Wheaton Brook Fault.
Geosciences 09 00224 g003
Figure 4. Mineralized greisen veins in the Mount Douglas Granite. (a) Outcrop of greisen veins hosted by a fine- to medium-grained granite with porphyritic texture (Dmd3). (b) Polished slab of a representative medium-grained granite of unit Dmd2 with a greisen vein with a dark color. (c) Photomicrograph in crossed-polarized light of the greisen zone containing K-feldspar, quartz, sericite, fluorite, and oxide/sulfide minerals that formed marginal to an inner vein in the center of the greisen zone. Area of thin section is outlined in (b). (d) SEM–BSE image of part of the greisen vein in figure (c). The oxide and sulfide minerals are pyrite, arsenopyrite, and wolframite with fluorite. (e) SEM–BSE image of a greisen vein with homogeneous sphalerite overgrown by Mn-Oxide (MnO) and Fe-Oxide (FeO). (f) A closer view of the homogeneous tabular wolframite in figure (d) that occurs in clots with fluorite.
Geosciences 09 00224 g004
Figure 5. Representative SEM–BSE imaging of uraniferous greisen veins from the Mount Douglas Granite with hydrothermal monazite that was used for U–Pb geochronology. (a,b) Coexisting radiating fibrous and needle-shaped to tabular crystals of hematite and martite (pseudomorphed magnetite) with monazite and zircon (sample #263 and #149, respectively). The hematite and martite have high concentrations of U (3–41 ppm) and Th (1–6 ppm Th). (c) Co-precipitation of pyrite and monazite along a vein within a greisen vein hosted by fine-grained granite of unit Dmd3 (sample #268). (d) Aggregates of monazite with other U, Th, and REE-bearing minerals, including zircon, monazite, xenotime, and a euhedral hematite. The entire assemblage is part of a greisen vein from the medium-grained granite Dmd2 (sample #50-2A).
Geosciences 09 00224 g005
Figure 6. Scanning electron microscope–back-scatter electron imaging (SEM–BSE) of hydrothermal (a,b) and igneous monazite (c,d) from the Mount Douglas Granite. (a) An assemblage of very small monazite grains with pyrite that formed along an inner vein within a massive greisen (sample 268). The greisen zone consists of assemblages of fine-grained quartz, muscovite, sericite, and occasionally, fluorite. Yellow circles denote aggregates of monazite grains (up to 20 µm). The white arrow shows the probable fluid pathway. (b) Fine-grained anhedral hydrothermal monazite aggregates associated with iron-oxide (sample 50-2A). These are formed along a vein and hosted by a severely greisenized granite. (c) Assemblage of accessory minerals, including iron-oxide, rutile, zircon, monazite, apatite, and xenotime in a granitic sample of unit Dmd2 that are enclosed in a primary biotite. (d) Close up of the area outlined in (c), showing intergrowth of igneous monazite and xenotime.
Geosciences 09 00224 g006
Figure 7. Reflected light and SEM–BSE imaging of two representative monazite grains from sample 149 (a,b) and sample 263 (c,d). (a) A photomicrograph of a monazite grain from sample 149 (Figure 5b) that was ablated for U–Pb geochronology. The black dots are laser ablation spots with a beam diameter of 17 µm (reflected light). (b) SEM–BSE image of monazite in figure (a) displaying brighter patches indicating the heterogeneous nature of the grain (solid red lines). The white circles denote laser ablation spots. The concentration of U (ppm) and ThO2 (wt.%) is displayed for each ablated spot. The brighter parts have higher U and Th contents. (c) A photomicrograph of two representative monazite grains from sample 263 (Figure 5a) that were ablated for U-Pb geochronology. (d) SEM–BSE image of one of the monazite grains in figure (c) exhibiting patches of zoning.
Geosciences 09 00224 g007
Figure 8. Results of U-Pb geochronology of hydrothermal monazite from greisen veins in the Mount Douglas Granite. Sample locations are provided in Figure 2. Data acquired via laser ablation ICP–MS analyses (Figure 5 and Figure 7). (a) Tera–Wasserburg concordia diagram of 207Pb/206Pb versus 238U/206Pb for samples #50-2A. Monazite grains from this sample are possibly of igneous origin (see Discussion, Section 6.1). (b) Tera–Wasserburg concordia diagrams for sample #149 (361 ± 7 Ma). (c) Concordia diagram (206Pb/238U versus 207Pb/235U) and weighted mean 206Pb/238U age (Ma) for sample #263. (d) Concordia diagram and weighted mean 206Pb/238U age (Ma) for sample #268. Data point error ellipses are 2σ; the blue ellipse in the concordia diagrams of “c” and “d” is the weighted-mean error ellipse and the blue lines in the weighted mean plots of “c” and “d” show the inferred ages.
Geosciences 09 00224 g008aGeosciences 09 00224 g008b
Figure 9. Results of weighted mean 208Pb/232Th age (Ma) of hydrothermal monazite from greisen veins of the Mount Douglas Granite (sample 263#). The sample location is shown in Figure 2. Data acquired via laser ablation ICP–MS analyses (Figure 5a and Figure 7c,d). Weighted Mean Age = 345 ± 2.5 Ma; MSWD = 2.5; n = 17. Common Pb was corrected using the measured 204Pb.
Geosciences 09 00224 g009
Figure 10. Plots of estimated heat production rates (µW/m3) of the Mount Douglas Granite versus whole-rock U (a) and Th (b) concentrations. The yellow star denotes the average upper continental crust composition [53]. The blue arrows are the trend of fractional crystallization.
Geosciences 09 00224 g010
Figure 11. U–Pb hydrothermal monazite geochronological results from greisen veins of the Mount Douglas Granite (hydrothermal ages; this study) versus U–Pb igneous monazite and zircon geochronological results from representative granitic samples of the MDG (crystallization ages; [15]). Data related to monazite grains from sample 50-2A were excluded from this diagram. The hydrothermal and crystallization ages overlap each other in a small window between 365 to 368 Ma.
Geosciences 09 00224 g011
Table 1. A summary of whole rock U and Th concentrations of the Mount Douglas Granite (units Dmd1, Dmd2, and Dmd3). The data are from McLeod [17] and Mohammadi [15]. Analytical methods (laser ablation inductively coupled plasma–mass spectrometry, LA ICP–MS) on fused glass beads) and geochemical data are available in the 37], refer to supplementary data of the journal (Table S2).
UnitU (ppm)
Range
U (ppm)
Mean
U (ppm)
Median
Th (ppm)
Range
Th (ppm)
Mean
Th (ppm)
Median
n*
Dmd12-1176.819–66374015
Dmd22-22108.818–60404224
Dmd35-221311.130–71515231
“n*” is the number of data for each unit. Mean values are “weighted mean”.
Table 2. U–Pb conventional Wetherill and Tera–Wasserburg concordia ages obtained by Laser Ablation ICP–MS for monazite from greisen veins of the Mount Douglas Granite *.
SampleMaterialTypeThO2 (wt.%) RangeThO2 (wt.%) Weighted
Mean
ThO2 (wt.%)
Median
U (ppm)
Range
U (ppm)
Weighted Mean
U (ppm)
Median
U/ThAge (Ma)ErrorAge (Ma)
Range
MSWDConc./InverseSpotn
50-2AMonazite *igneous2.49–10.566.026.288–291112039200.01–0.0336214347–3765.3inverse86
149#Monazitehydrothermal1.09–5.683.603.7307–120789910310.02–0.043617354–3681.6inverse1010
263#Monazitehydrothermal1.29–5.123.33.3533–1824 128713710.02–0.123593356–3620.0021concordia226
268#Monazitehydrothermal0.1–3.120.880.4285–253510509680.04–0.453495344–3540.0075concordia117
* Note: The location of each sample is shown in Figure 2. Age (Ma) = conventional Wetherill or Tera–Wasserburg concordia ages (Ma) of samples; Error = two standard deviations; MSWD = Mean Squares of Weighted Deviates; Conc./inverse = conventional concordia ages (206Pb/238U versus 207Pb/235U) or inverse concordia ages (Tera–Wasserburg concordia plot 207Pb/206Pb versus 238U/206Pb). Spot = total number of analyzed spots of monazite grains; n = number of analyzed points that were used to calculated concordia or inverse concordia ages. All data related to monazite grains from sample 50-2A were excluded for further interpretation as they seem to be igneous monazite rather than hydrothermal monazite (refer to Section 6.1).
Table 3. Results of in-situ LA ICP–MS U–Pb hydrothermal monazite geochronology of samples 50-2A, 149, 263, and 268 from greisen veins of the Mount Douglas Granite *.
SpotApprox. conc.U/Th204Pb
(Cps)
206PbCps/
204PbCps
%Pb*Final Isotope Ratios (Used for Tera-Wasserburg Concordia Diagrams)err.
corr.
Ages (Ma)%conc.Final Isotope Ratios (Used for Conventional Concordia Diagram)err.
corr.
U
(ppm)
Th
(ppm)
238U/
206Pb
207Pb/
206Pb
207Pb/
235U
206Pb/
238U
207Pb/
235U
206Pb/
238U
50-2A-11977614000.037910883.1314.080.400.1780.012−0.021011504421243.71.7250.1600.0710.0020.479
50-2A-288243000.00582053.604.270.220.5950.0300.4430336113476444.418.9001.2000.2340.0120.686
50-2A-3178218500.011372149.103.850.120.6900.0260.2332595014934345.823.8001.2000.2600.0080.608
50-2A-41330552000.026002453.974.730.130.6260.015−0.0129733712363041.617.8200.6800.2120.0060.886
50-2A-5191357800.015962299.020.770.020.7670.0190.194986405389110108.1134.8005.5001.3060.0400.851
50-2A-6509533000.013962054.501.890.080.7660.0210.0440625227328967.353.5002.7000.5290.0210.871
50-2A-72436788000.031816873.9012.740.450.2540.017−0.821313724871737.12.7900.2700.0790.0030.944
50-2A-82911928000.033357399.0117.530.340.0560.0020.2636514358798.00.4350.0200.0570.0010.064
149-11151305500.041115560.2010.400.270.3540.012−0.061796365921433.04.8200.2000.0960.0030.560
149-21080473000.022064155.408.330.420.4530.019−0.672152787283533.87.7300.6400.1200.0060.938
149-3667334000.021213158.709.070.990.3880.034−0.2219861306736633.96.0701.7000.1100.0120.778
149-430795800.03982852.606.040.260.5250.025−0.322585719853938.112.4000.9600.1660.0070.610
149-51207355000.034452756.104.820.460.5820.018−0.2329168512159741.716.6902.1000.2080.0200.839
149-6770312700.025262452.904.000.270.6480.019−0.0431866314368045.122.1902.4000.2500.0170.869
149-71073499000.025822255.502.860.110.6680.022−0.2135545419306054.332.1001.7000.3500.0130.840
149-8988224000.042615291.6015.700.520.1130.015−0.08690693981357.71.0000.1700.0640.0020.389
149-9621220900.037292353.602.440.190.7130.0180.37378763220913058.340.6003.4000.4090.0310.547
149-101130342200.032617793.8816.580.390.0950.0050.1958225377964.80.7830.0440.0600.0010.158
263-11227388200.031524558.9013.060.260.3670.0110.42161228476929.53.9010.1400.0770.0020.214
263-21022239900.041804153.109.830.210.4070.0120.391944326241332.15.8000.2100.1020.0020.395
263-31513420000.041465566.5012.790.440.3070.0170.161483624851632.73.2600.3300.0780.0030.596
263-41285223200.061844861.0010.590.360.3470.0160.751757615811933.14.6400.3500.0940.0030.892
263-51416340000.04938973.0013.180.300.2550.012−0.341314444721035.92.6800.1600.0760.0020.679
263-61287349000.04739874.7013.110.340.2420.010−0.201288434741236.82.5600.1500.0760.0020.625
263-71560275900.061226975.3013.190.280.2410.010−0.371264394711037.32.4800.1300.0760.0020.672
263-81482224300.07849878.6014.120.320.2110.012−0.441134504411038.92.1300.1500.0710.0020.641
263-9619375700.023482552.305.100.230.6230.018−0.4829116611504839.516.7301.0000.1960.0090.947
263-101312263300.057942453.005.150.230.6030.017−0.6228866411454639.716.4501.1000.1940.0090.960
263-111567310000.055513187.3215.430.310.1450.0060.3185026405847.61.3160.0570.0650.0010.109
263-121316374800.043914791.2116.300.350.1130.0050.1469425384855.30.9810.0490.0610.0010.194
263-131362224800.0619362152.032.530.060.7230.0160.1537643521484157.139.9201.4000.3960.0090.862
263-141380113000.123916494.6516.980.350.0880.0040.1454322369767.90.7100.0370.0590.0010.262
263-15533327300.02−13−17497.6715.900.530.0650.0120.08469683931383.80.5730.1300.0630.0020.194
263-161468275700.05−4−157099.0917.360.360.0550.0030.1936917361797.90.4320.0250.0580.0010.096
263-171824246800.07−23−34299.2017.490.430.0540.0100.2236348358898.70.4260.0900.0570.0010.152
263-181490449800.03−6−102599.1517.320.360.0530.0030.1036618362799.00.4310.0250.0580.0010.192
263-191426123200.12−18−35399.0717.420.390.0550.0030.2736318360899.10.4340.0260.0570.0010.032
263-211117345100.03−8−56599.1417.420.420.0530.0050.2736027360999.90.4280.0420.0570.0010.053
263-221466212800.07−16−40499.4317.670.340.0510.0030.43339193557104.70.3980.0270.0570.0010.096
268-134417210.20−11−5887.3037.173.040.1470.0230.61368381711446.50.4560.0550.0270.0020.101
268-2118726250.45−9−45899.2616.840.600.0660.0070.3334423340898.70.4020.0330.0540.0010.025
268-373422530.33741199.0818.480.440.0530.0040.4636123358999.30.4280.0330.0570.0020.091
268-491528700.32−13−15499.2017.480.460.0560.0040.21345293441099.60.4020.0420.0550.0020.146
268-51123274000.04−3−129399.0115.850.500.0550.006−0.0235527354999.80.4190.0400.0570.0020.104
268-6121143350.28−14−33999.2518.250.530.0530.0060.0335420354799.90.4190.0280.0560.0010.105
268-7161672500.22664099.2317.700.470.0560.0050.36356233578100.10.4250.0320.0570.0010.094
268-855221670.25459299.0317.720.380.0530.0040.283743037911101.30.4590.0430.0610.0020.021
268-92535258900.102247599.3317.570.400.0550.0040.32335173418101.70.3900.0240.0540.0010.106
268-1045542100.11−4−46199.0616.530.490.0540.0050.303743338110101.90.4570.0520.0610.0020.179
268-112016185000.11748799.6018.430.410.0520.0030.21312203308105.70.3660.0270.0530.0010.129
* Note: Approx. conc. = Approximate concentrations; Cps: Count per second; %Pb*: percentage of radiogenic Pb calculated from Andersen’s method [46]; 2σ = two standard deviations; err. corr. = error correlation; %conc. = degree of discordance calculated as 100 × [(206Pb/238U)age (Ma)/(207Pb/235U)age (Ma) − 1]. Samples numbers with grey cells (data subset that is <5% discordant) are used in final concordia age calculations.
Table 4. Weighted mean Th, U, K2O contents for the Mount Douglas Granite, units Dmd1, Dmd2, and Dmd3 and their radiogenic heat production rates (A) *.
UnitDensity (kg/m3)Th (ppm)U (ppm)Th/UK2O (%)A (µW/m3)
Dmd1261038.006.686.55.194.59
Dmd2261040.2010.124.54.955.58
Dmd3261050.0912.614.44.896.85
Antarctica2600≤60.7≤28.6≤3.8-5.35
Zhuguang Granite260040114.835.435.98
Malani Igneous
Suite
-54.638.977.414.696.69
Continental Crust-3.50.913.851.11.60
Upper Continental Crust-10.52.7--1.65
* Note: The data related to granites in Antarctica are from Leat et al. [52]. The data related to Zhuguang Granite (representative of one of the granites from Southern China) are from Sun et al. [47]. The data for Malani igneous suite, Northwestern India are from Shrivastva et al. [54]. Continental crust values are from Taylor and McLennan [55]. The average of 3.8 HGU (Heat Generation Unit) for the continental crust (1 HGU = 0.418 µW/m3) is from Taylor [56]. The average upper continental crust values are from Rudnick and Gao [53]. A density of 2661 kg/m3 was assumed for all samples from the Mount Douglas Granite [51]. The U, Th, and K2O values of the MDG are from Mohammadi [15] (Table 1 and Table S2) and McLeod [17].

