Article

Landslides in the Mountain Region of Rio de Janeiro: A Proposal for the Semi-Automated Definition of Multiple Rainfall Thresholds

1
Department of Earth Sciences, University of Florence, Via Giorgio La Pira, 4, 50121 Florence, Italy
2
National Center for Monitoring and Early Warning of Natural Disasters (CEMADEN), Estrada Doutor Altino Bondensan, 500-Distrito de Eugênio de Melo, São José dos Campos 12209, SP, Brazil
*
Author to whom correspondence should be addressed.
Geosciences 2019, 9(5), 203; https://doi.org/10.3390/geosciences9050203
Submission received: 21 March 2019 / Revised: 29 April 2019 / Accepted: 5 May 2019 / Published: 8 May 2019

Abstract

:
In 2011 Brazil experienced the worst disaster in the country’s history. There were 918 deaths and thousands made homeless in the mountainous region of Rio de Janeiro State due to several landslides triggered by heavy rainfalls. This area constantly suffers high volumes of rain and episodes of landslides. Due to these experiences, we used the MaCumBa (Massive CUMulative Brisk Analyser) software to identify rainfall intensity–duration thresholds capable of triggering landslides in the most affected municipalities of this region. More than 3000 landslides and rain data from a 10-year long dataset were used to define the thresholds and one year was used to validate the results. In this work, a set of three thresholds capable of defining increasing alert levels (moderate, high and very high) has been defined for each municipality. Results show that such thresholds may be used for early alerts. In the future, the same methodology can be replicated to other Brazilian municipalities with different datasets, leading to more accurate warning systems.

Graphical Abstract

1. Introduction

In Brazil mass movements associated with periods of intense precipitation are recurrent and cause great human and economic losses [1]. The conditions of high humidity and high rainfall intensity are triggering factors for gravitational processes such as shallow landslides and debris flows, resulting in large displacements of soil and rocks, as occurred in January 2011 in the mountainous region of Rio de Janeiro (Figure 1).
Between January 11 and 12, significant rainfall, caused by the entrance of air masses from the Convergence Zone of the South Atlantic in the Serrana Region, triggered what would be considered the worst natural disaster in Brazil. The twelve municipalities of the mountain region of Rio de Janeiro were the most affected and experienced a catastrophe (Table 1). According to the UN, it was the 8th worst landslide event in world history, being considered the greatest natural disaster in the history of Brazil [2]. Nova Friburgo, Petrópolis and Teresópolis were the cities most severely struck (Table 1), with the highest number of deaths and affected, resulting in a direct impact on the lives of more than 32 thousand inhabitants, and with seven municipalities decreeing a state of public calamity. In Nova Friburgo, for example, it rained 253 mm in 37 h according to the rain gauges of INEA—State Environmental Institute—Government of the State of Rio de Janeiro [3] and INMET—National Institute of Meteorology [4], while the average rainfall in January for these municipality is around 300 mm. After that, the Brazilian federal government created the National Center for Monitoring and Early Warning of Natural Disasters (Cemaden), which has as its main objective the issuance of natural disaster warnings (landslides, floods and flash floods) to about 1000 Brazilian municipalities [5].
Alert systems are an efficient non-structural measure for the reduction of material and human damage caused by disasters. To mitigate natural hazards and related risks, a set of occurrences, data, information, knowledge and application is necessary [6]. These principles can also be applied to an Early Warning System (EWS). In this study the possibility of setting up an Early Warning System (EWS) for rainfall-induced landslides is explored.
Several approaches, aimed at landslide forecasting and early warning, exist in the scientific literature and they can be roughly divided into two main categories: (i) Physically-based and (ii) empirical.
Physically-based models rely on a stronger and more complete conceptual basis, but they require a thorough knowledge of the geological and meteorological features of the study area, i.e., a high number of parameters must be assessed before implementing such models [7,8,9]. For this reason, they are applied mainly at the slope scale or to small areas [9,10], while their use in early warning system for large areas is still limited to prototypes or experimental case studies [8,11,12]. Empirical models are based on the analysis of the predisposing and triggering factors to assess the conditions that can be associated to landslide occurrence [13]. Even if empirical approaches neglect the physics of the problem, they can be robust and effective methodologies, especially when carried out by means of statistical techniques. Moreover, compared to physically-based approaches, the empirical techniques require few data, usually only the landslide occurrence dates and positions and the rainfall data. Therefore, one of the most used approaches for landslide forecasting is the one based on empirical or statistical rainfall thresholds [13,14,15,16,17,18,19,20,21,22,23,24,25,26,27]. A rainfall threshold for landslide occurrence (in short, rainfall threshold) is a mathematical equation that defines the rainfall conditions associated to the triggering of landslides. Rainfall thresholds equations are usually based on a couple of rainfall parameters, e.g., intensity and duration [14,17], total event rainfall and duration [28] or the rainfall amounts accumulated over two different reference periods [29,30]. They are defined with empirical or statistical analyses using a dataset of past events and, if the relationship can be considered valid also for the future, the threshold can be used for landslide forecasting and early warning.
A recent review of the literature on rainfall thresholds [31] highlighted that they can be used to forecast landslide occurrence at all scales and in a wide range of physical settings, but a proper application for early warning purposes should require: The gathering of reliable and as complete as possible rainfall and landslide datasets; the selection of the most appropriate threshold parameters, on the basis of landslide characteristics and available rainfall data; the setting up of objective and standardized analysis procedures; and the accomplishment of a quantitative validation.
In this work, rainfall and landslide data from the mountainous area surrounding Rio de Janeiro have been collected and analysed to define local rainfall thresholds for landslide occurrence, in the perspective of using them in an early warning system. Considering the landslide typologies affecting the area (mainly debris flows and shallow landslides), the thresholds were based on intensity and duration of the peak triggering rainfall [14,31,32,33,34]. The threshold analysis has been carried out with the MaCumBA software [21], which allows for a semi-automatic threshold analysis based on objective and standardized criteria and which has been tested into several case studies [35,36,37,38]. Furthermore, in this work, the possibility of defining multiple thresholds, instead of a single threshold, has been explored. The identification of multiple thresholds has been developed to provide a better agreement between the outcomes of this work and the Brazilian legislation in the field of landslide forecasting, which requires the identification of three alarm levels: moderate, high and very high, plus the no alarm level. To objectively define these thresholds, a statistical indicator, named Positive Predictive Value (PPV), has been used; PPV expresses the probability of correctly classifying a rainfall that triggered landslides and is defined as the ratio between the number of Correct Alarms (CA) and the number of total alarms (as the sum of Correct and False Alarms (FA): CA/(CA+FA)). The resulting thresholds and their predictive power have been validated using an independent dataset of landslide events, and the outcomes compared with the alerts issued by the local civil protection agencies. According to this double validation procedure, the results can be considered satisfying and a possible implementation of the proposed thresholds in an operational warning system is discussed.

2. Materials and Methods

2.1. Study Area

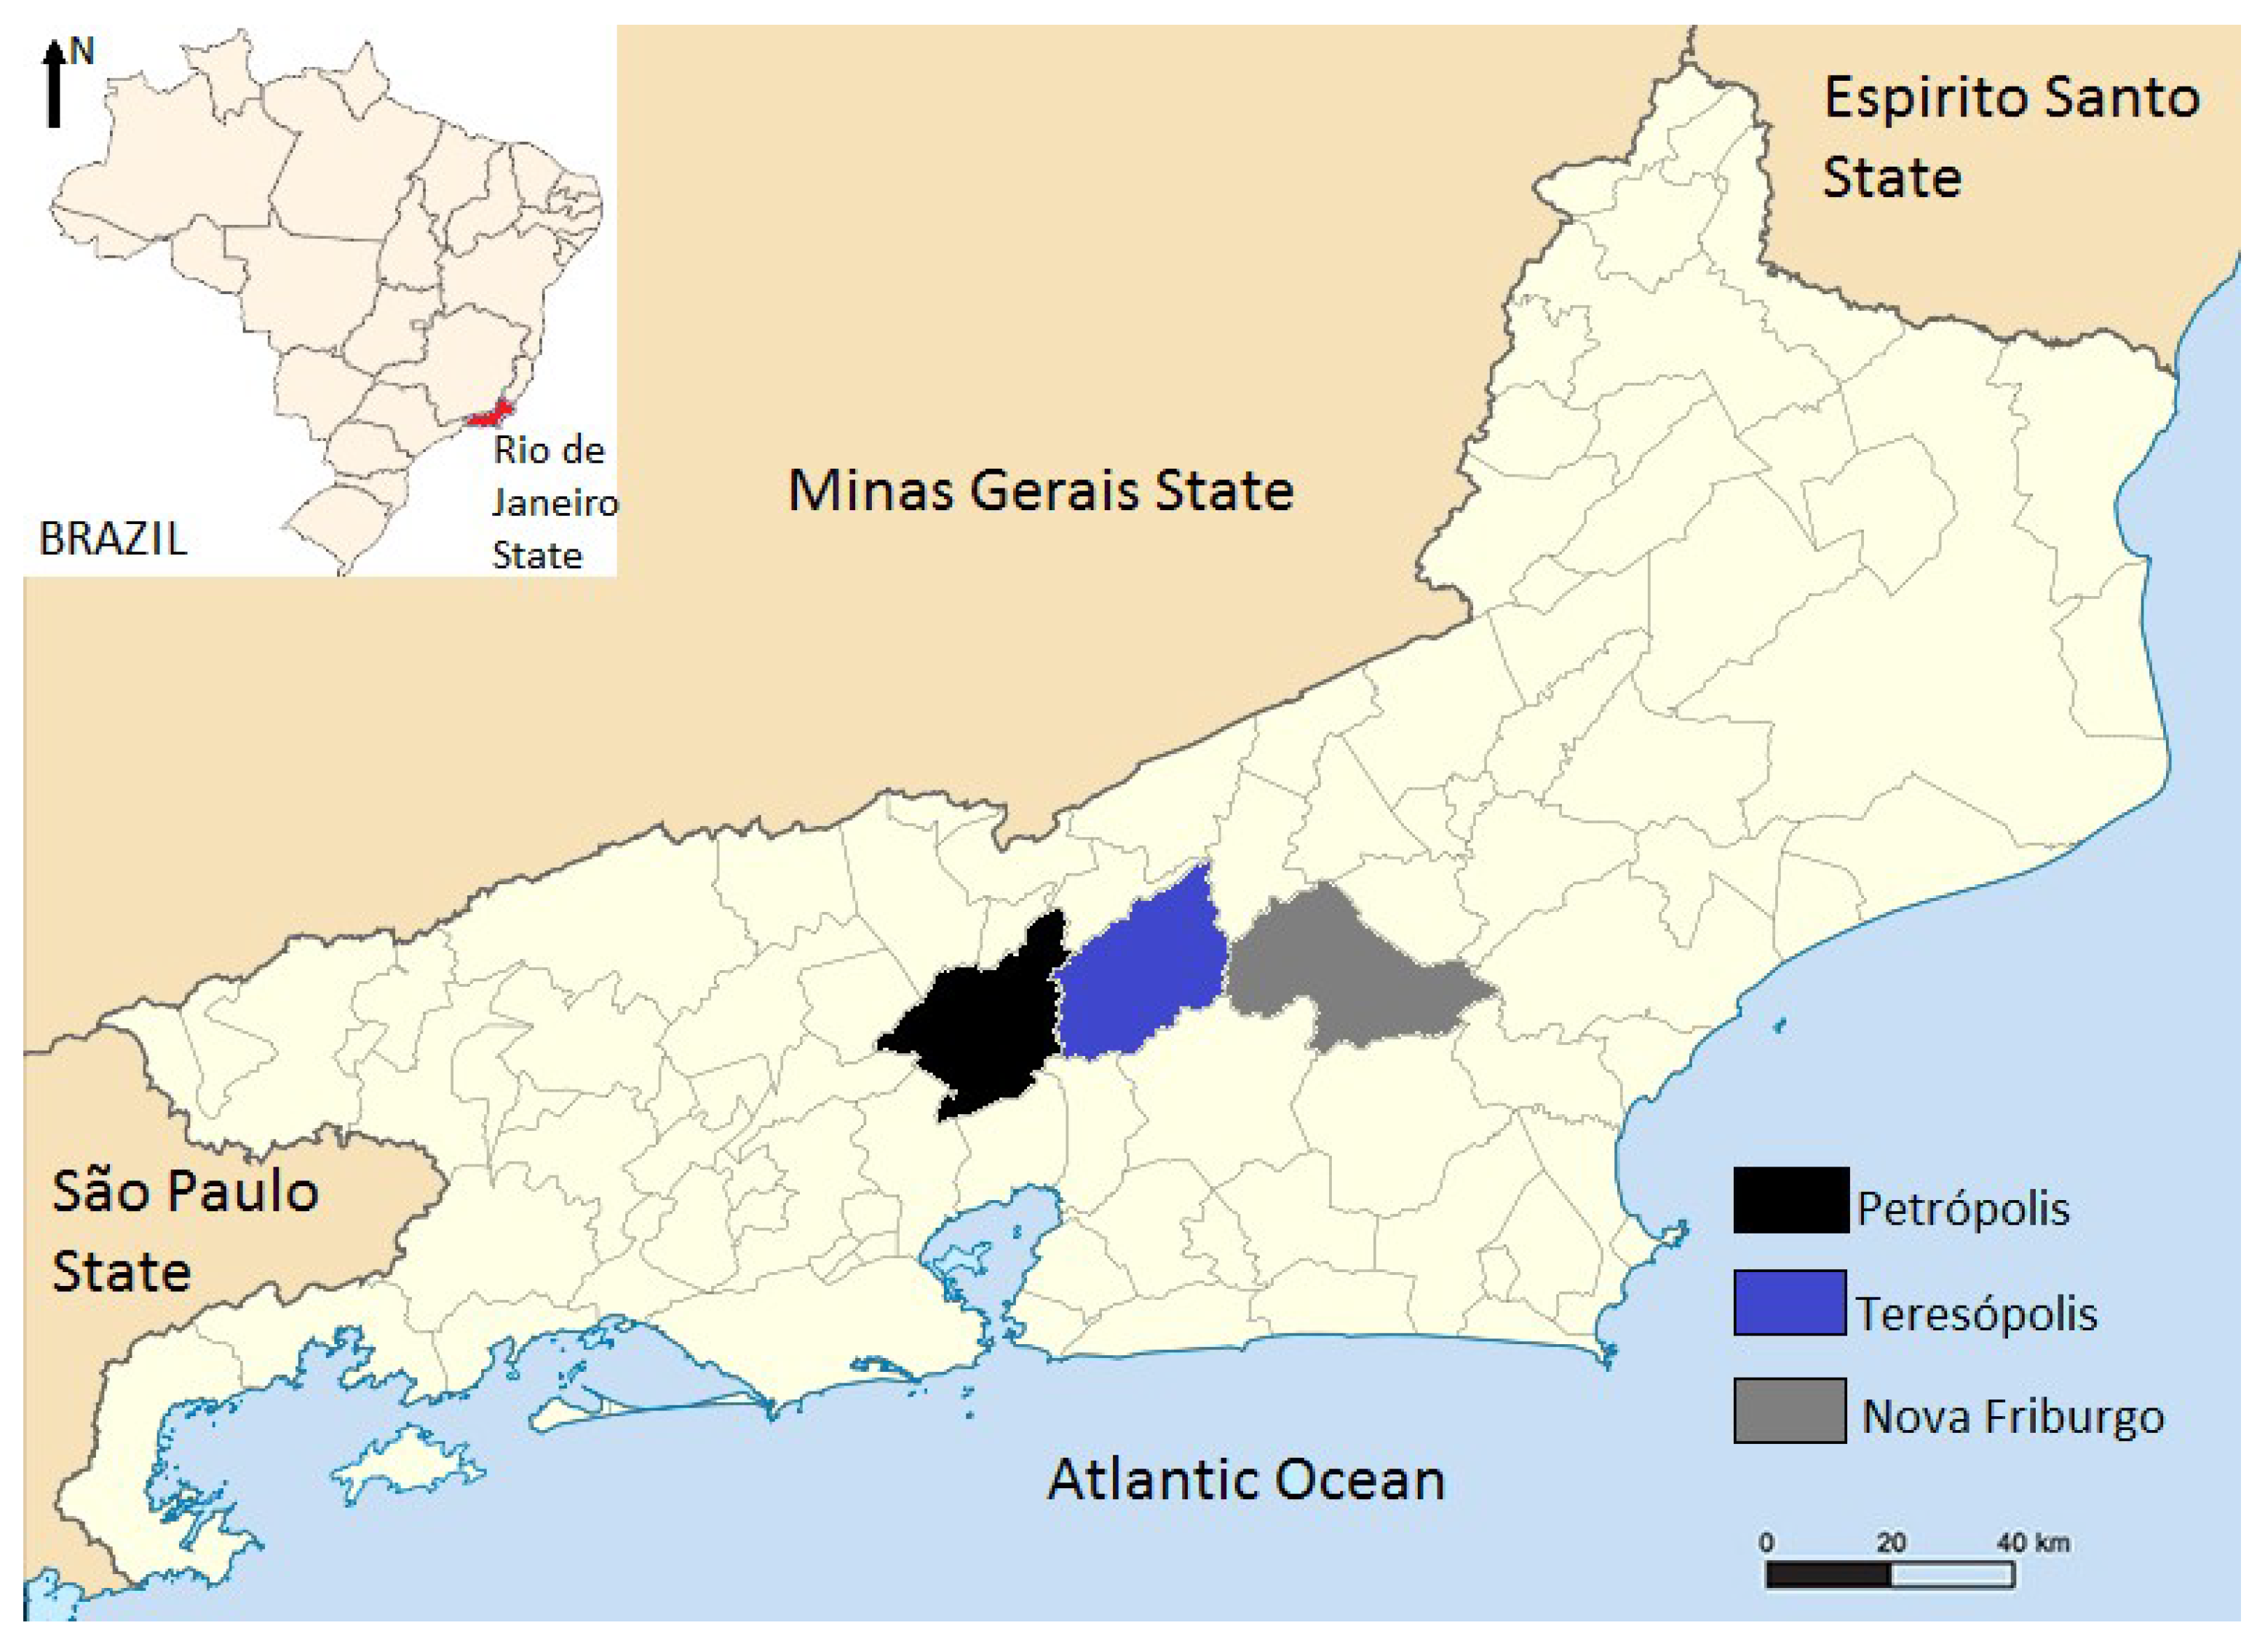
The studied municipalities are in the mountainous region of Rio de Janeiro (Figure 2), with an average altitude over 900 m and highest elevations above 2300 m. The relief of the region acts as an important factor in the increase of air turbulence, especially in the passage of cold fronts and lines of instability where the air rises and loses temperature, causing strong and prolonged rains [39].
The geographic position close to the tropics allows for strong solar radiation, and the proximity to the oceanic surface allows for the evaporation process, favouring the formation of clouds and subsequent rainfall on the mountainous areas. In addition, sudden and localized convections occur mainly in the summer, forming in a few hours due to the high heating and moisture availability.
The physiographic characteristics of the mountainous region contribute to the mass movement processes: Steep slopes, narrow valleys, rocks with a high degree of weathering, abrupt rock-soil contact, lithologies with fractures, etc. In addition, the most affected municipalities have a significant number of inhabitants concentrated in the urban area that spreads from the wider valley bottoms to the slopes. The urbanization process occurred in an irregular and disordered way causing considerable impacts on the controlling factors of natural processes [40]. The climate is generally high-altitude tropical (Cwb according to the Köppen-Geiger climate classification), with dry and cool winters and mild and humid summers, but in some parts of the mountain it can vary to subtropical, with average annual temperature of 18 °C.
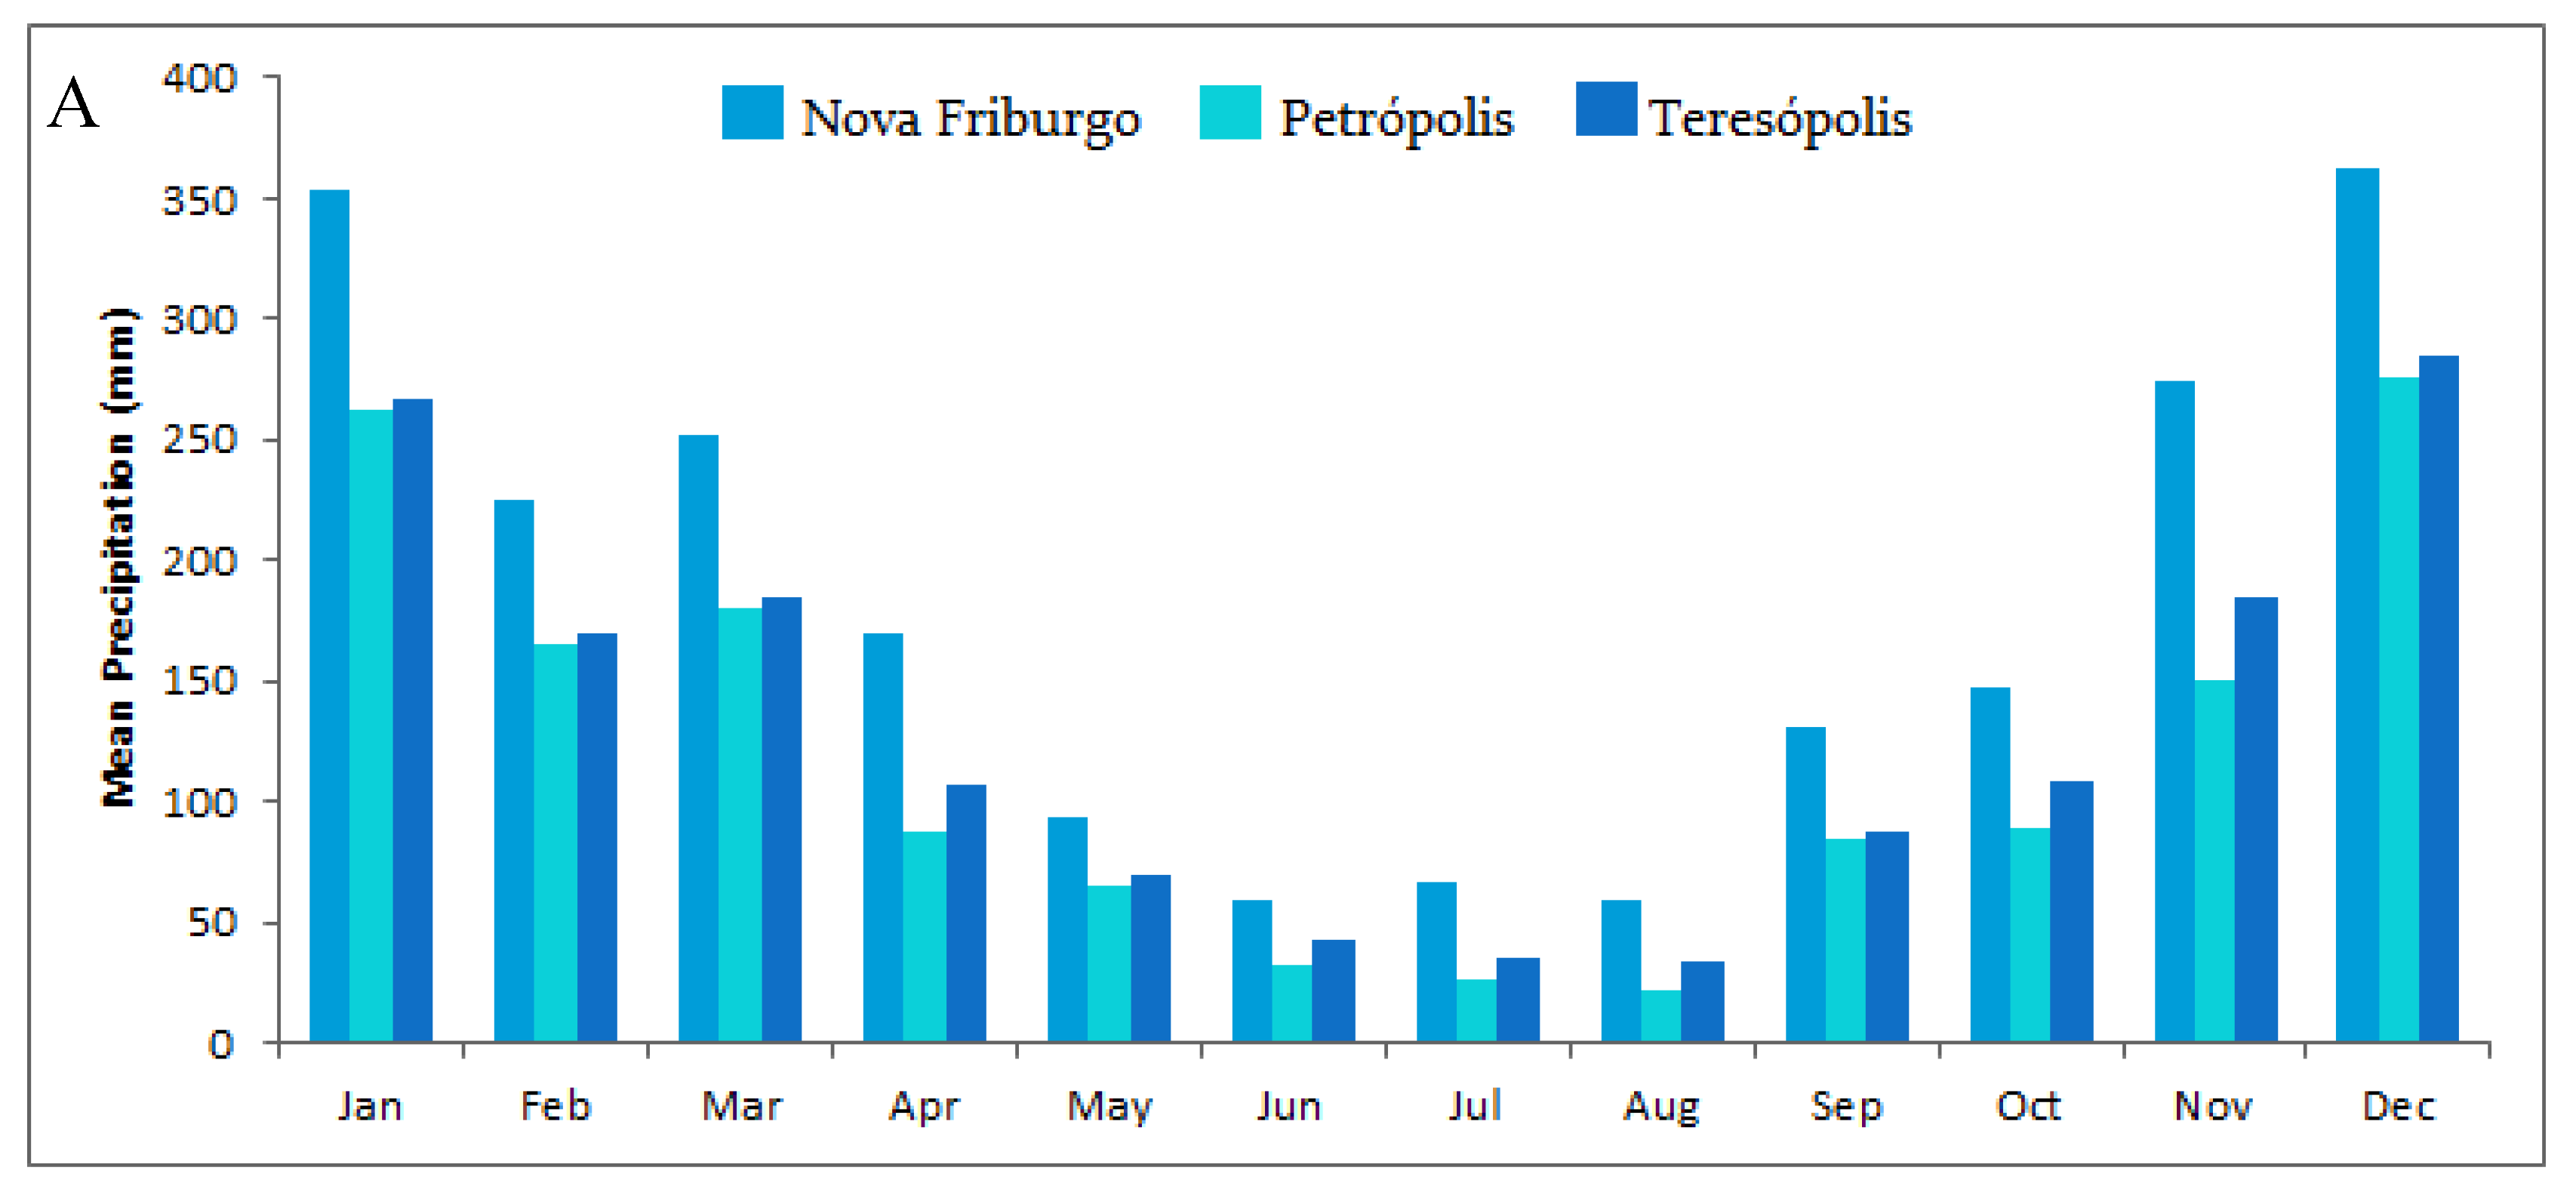
The region has a system of meteorological observation, managed by the State Environmental Institute (INEA) and the National Institute of Meteorology (INMET), which collect rainfall data systematically through automatic rain gauges. The rainy season mainly occurs from December to March (Figure 3) and concentrates in a few days, usually associated with the entrance of frontal systems, with rainfall exceeding 50 mm/day. On January 11, 2011, the rain gauges of INEA recorded that the total rainfall in 24 h in Nova Friburgo reached 249 mm. In Petrópolis, at Ypu, rain gauges of 273.8 mm in 24 h were recorded; the most critical period was from 2:00 on January 11th to 2:00 on January 12th [41]. In Teresópolis it rained more than 161.6 mm in 24 h. Usually on the days of January it rains on average 60 mm/day.

2.1.1. Nova Friburgo

Nova Friburgo had an estimated population in 2018 of 190,084 inhabitants. It is located in the center-north of the state, at an average altitude of 985 m. The rocky substratum consists essentially of intrusive and metamorphic Precambrian rocks, which outcrop in several parts of the area. Most of the rocky outcrops are composed of granites, forming “sugar loaves” or monadnocks, which are the result of the erosion by rainfall of the former granitic inselbergs [42]. The geomorphology is characterized by the fact that the dissection is marked by structural control, defined only by the deepening variable of the drainage [43].
The soils of the region result from a combination of lithology (gneiss/granite), highly dissected relief, climatic variations in the Holocene and dense forest cover, which exerts a strong influence through physical and hydrological processes (mechanical fixation, interception, infiltration, evapotranspiration), and ecological (organic matter production and nutrient cycling). They are highly leached soils with moderate fertility due to intense drainage, usually presenting low pH and nutrient content [44]. The main types of soils are: Red–Yellow Latosol, Argissols, Cambisols and Rocky Outcrop [45]. The Red-Yellow Latosol are well drained soils and are deep and porous, with enough resistance to erosion and favourable to root development. The Argissols are more susceptible to erosion processes when they occur in steep relieves. The Cambisols are poorly developed and have intermediate drainage. Shallow soils are present in correspondence with steep slopes and close to rocky outcrops.

2.1.2. Petrópolis

Petrópolis is situated at the top of Serra da Estrela, belonging to the mountain range of Serra dos Órgãos, subsector of Serra do Mar. The municipality of Petrópolis presents a rugged relief, with the presence of cliffs. Its population is estimated at 305,687 inhabitants [46], predominantly urban (95.1%).
Petropolis is geologically inserted in the Rio Negro Complex, of paleoproterozoic origin [47], formed mainly by migmatites and granitoids. These rocks are severely sectioned by fractures and faults of regional extension, with a strong reflection on topography, since the entire region of these units was submitted to tectonic events during the Precambrian period [48]. This set of characteristics generates consequences in the triggering of mass movements. The Petrópolis lands are the result of folding, reactivation of faults and remobilization of blocks [49]. Fault zones condition the directions of the valleys, producing a braided drainage pattern, with valleys separated by elongated hills.
The predominant soils in the region are clayey, well drained, acidic and of low natural fertility and high saturation of aluminium. According to Carvalho et al. [50] in the area the association of dystrophic Red–Yellow Latosol with medium to clayey texture and dystrophic Cambisol with clay or medium texture and association of Cambisol with medium or clayey texture and low shallow or non-textured Red–Yellow Latosol clay are predominant. The latosols are present in Petrópolis with a granular structure that, when mature and not presenting expansive clays and abrupt discontinuities between their horizons, are little susceptible to erosion, reinforcing the effect of urban occupation as responsible for the continuous catastrophic effects [51].

2.1.3. Teresópolis

Teresópolis is the highest city in the state of Rio de Janeiro and, therefore, one of those with cooler weather. Its population, according to estimates of the IBGE in 2018, was 180,886 inhabitants.
The area of the municipality consists of gneiss and granite deposits, dating from the Precambrian period, with a marked relief, with the presence of steep cliffs. The mountains and cliffs of this region have quite a lot of leached soils as Cambisols, Neosols and Red–Yellow Latosols, usually not very thick [45]. The Cambisols and Red–Yellow Latosols are found in the interfluvial areas, whereas in the floodplains the Gleysols, characterized by very low permeability, and the alluvial soils, which have a higher permeability, are predominant. In the landscape of the region, it is possible to observe that the Cambisol is mainly found in the hilly relief, while the Latosol is mainly associated to a flat or smooth relief [52]. The areas with the highest slopes are referred to subvertical rocky walls. With the gradual decrease of the slope, the development of incipient and thin layers of soil arises. In the basal part of the escarpment, the occurrence of talus deposits allows the formation of flat valleys where thicker soil develops.

2.2. Data Acquisition

For this work, landslide occurrences from 2008 to 2018 and the related hourly rainfall records were collected. This process was not straightforward, because there is no single database of natural disaster events in Brazil. The landslide information was retrieved from publications, local civil defense records and data found in the media. After the catastrophic event occurred in the mountainous region of Rio de Janeiro in January 2011 and the creation of Cemaden, disaster occurrence information began to be centralized in a single agency. Such information is provided by media news and feedback from municipal civil defenses.
The data from 2008 to 2017 were used for calibration processes. Data of the January 2011 landslide event for Nova Friburgo were provided by the municipal civil defense, landslide occurances during the same event in Petrópolis and Teresópolis have been mapped on Google Earth using the images of 04/11/2011 and 04/18/2011 respectively. Other events that occurred after January 2011 were obtained from Cemaden, which uses data provided by the local civil defense and media. For Nova Friburgo, landslide occurrences found in the work of Oliveira [53] were also used, which were provided by Nova Friburgo civil defense from November 2008 to December 2011.
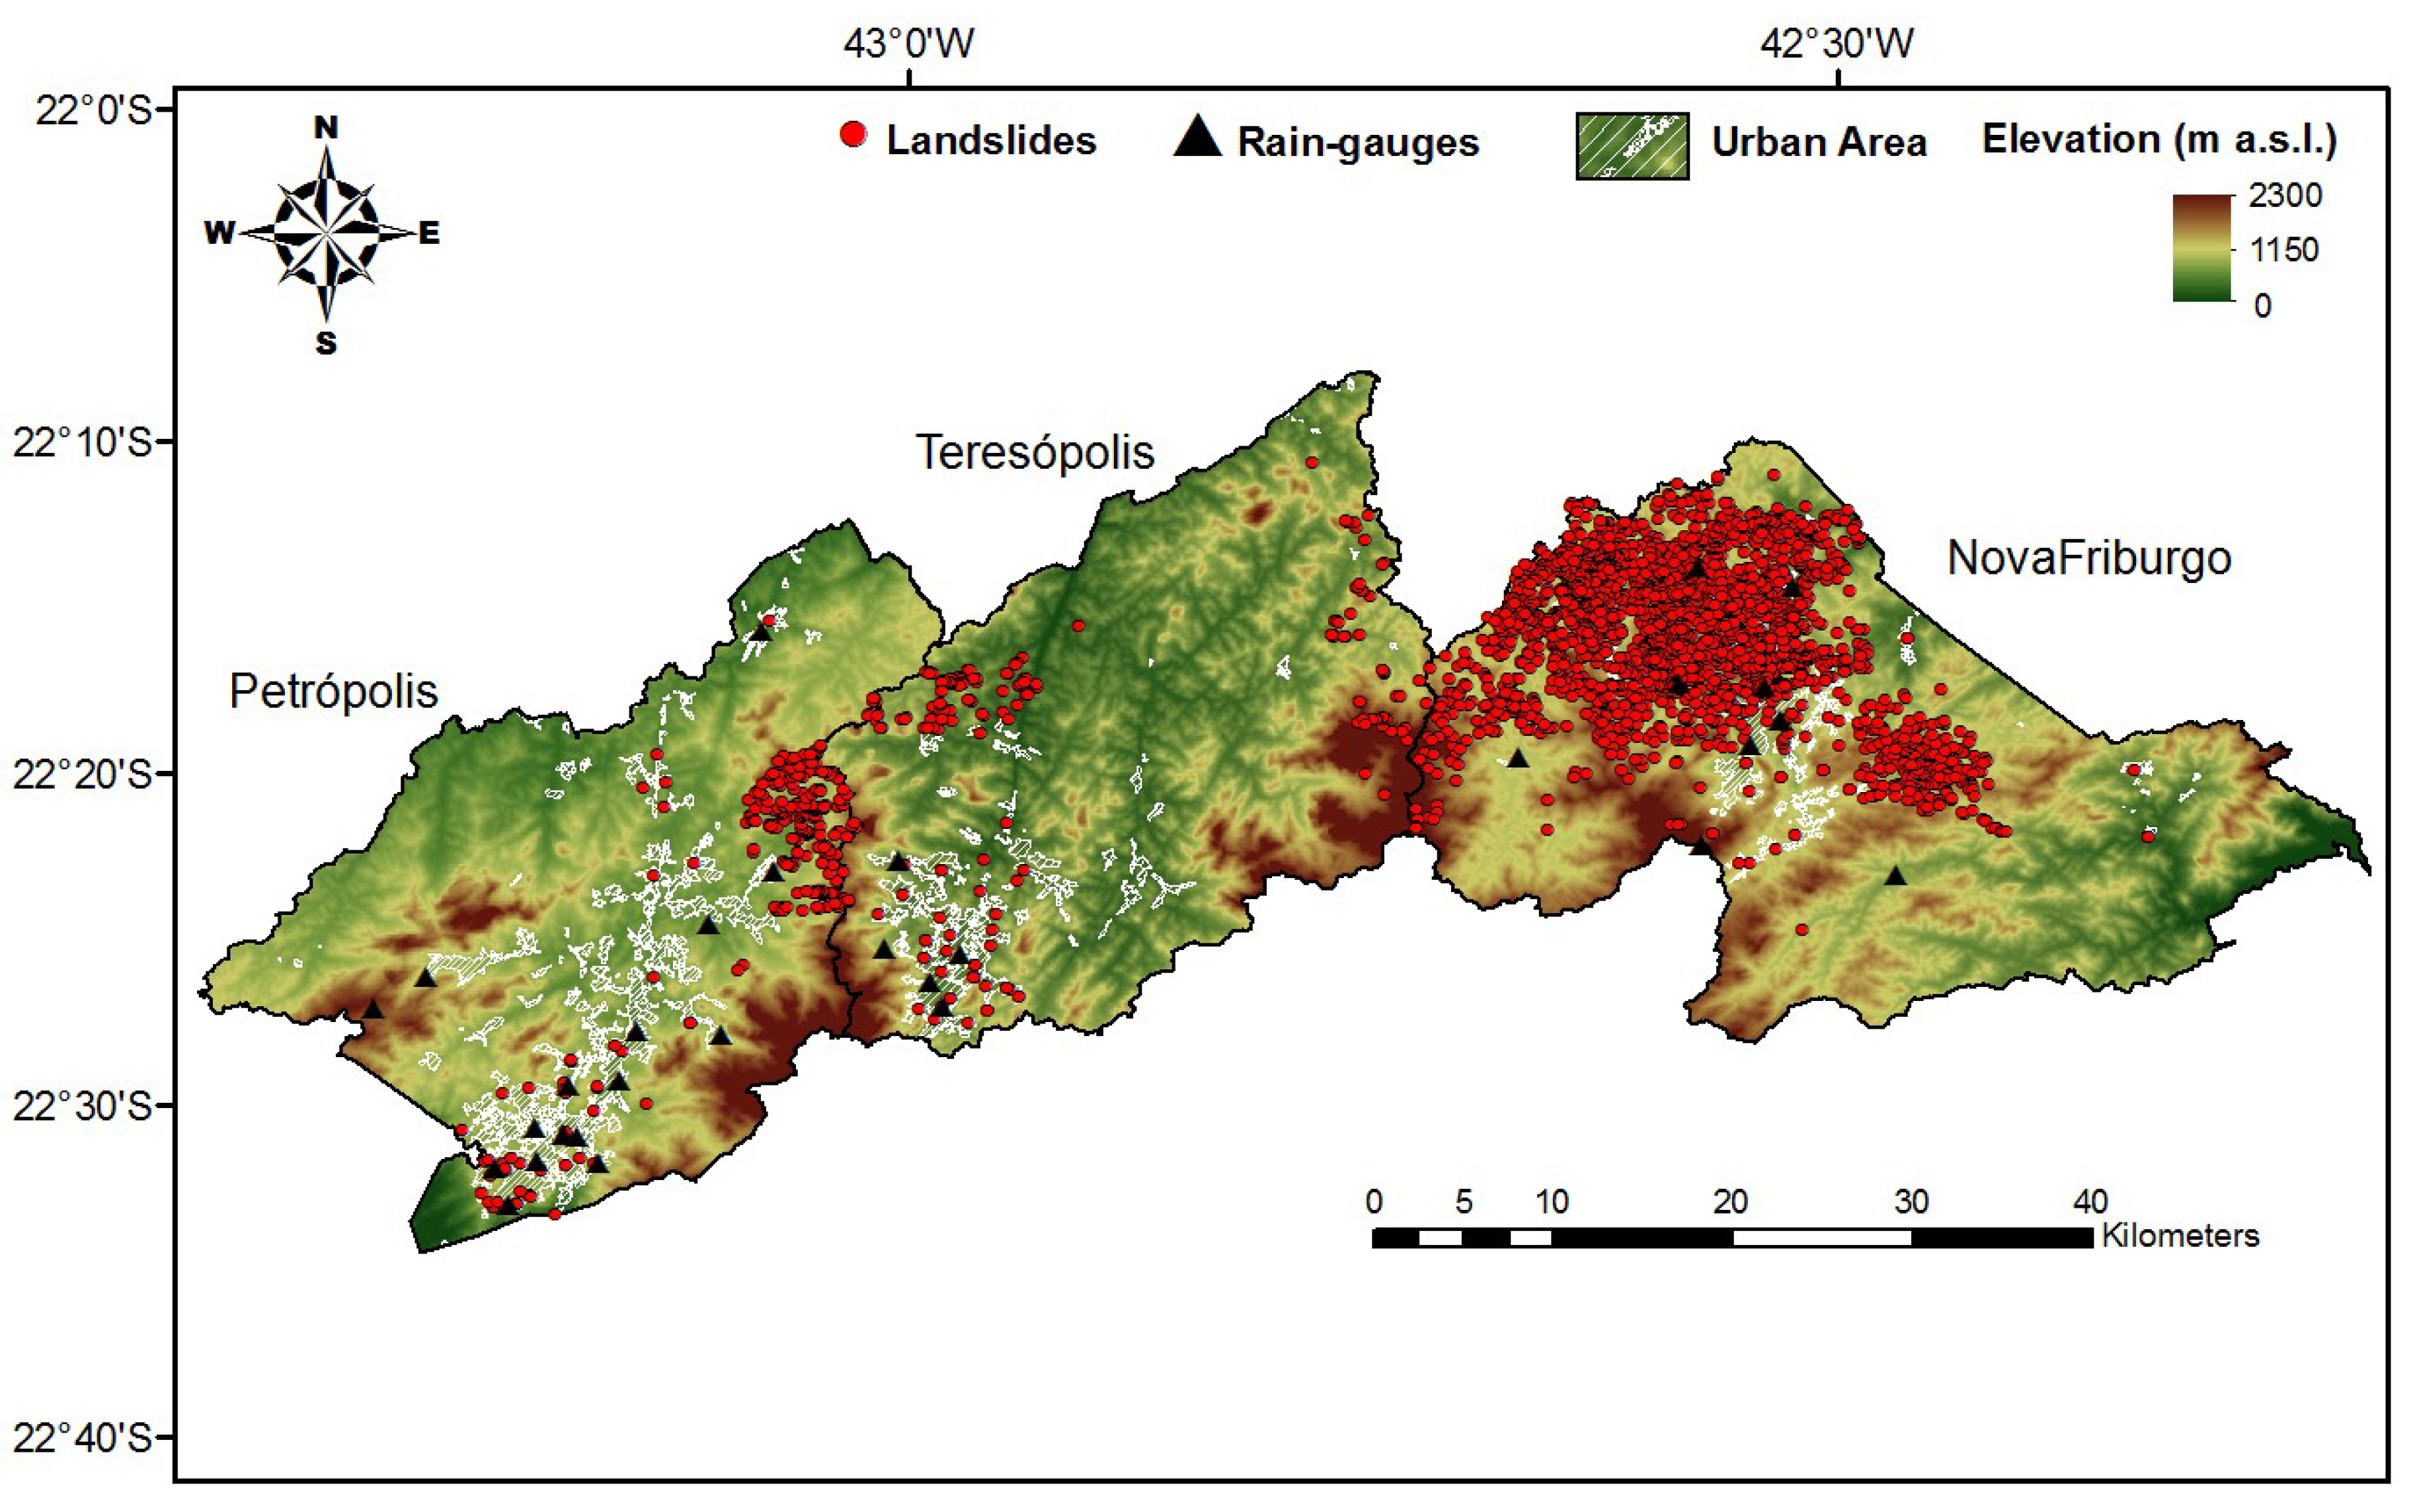
In the 10 years of data used for the present study, there were 2938 landslides in Nova Friburgo, 368 in Petrópolis and 205 in Teresópolis. Spatial distribution of the landslides and rain gauge positions are shown in Figure 4.
Hourly rain data were obtained from INMET and INEA. INMET has an automatic rainfall station in each municipality with hourly data from 2008 (Petrópolis and Teresópolis) and 2010 (Nova Friburgo). INEA has the latest time data (some only from 2011) but has a larger rain gauge network. For the present study, 8 rain gauges were used for Nova Friburgo, 15 for Petrópolis and 4 for Teresópolis.
For the model validation, data of landslides occurring in 2018, obtained from Cemaden [54], have been used. In Nova Friburgo, 13 landslides events occurred in 2018, 27 events in Petrópolis and 6 events in Teresópolis. The rain data were also collected from INEA and INMET rain gauges.

2.3. Methodology

To define the thresholds, the automatic semi-procedure described in [21,22] has been used; this procedure was firstly developed for Tuscany Region (Italy) and then applied in Slovenia [37].
The thresholds defined by this approach are based on the general equation firstly proposed by Caine [14] (Equation (1)):
I = αD,
where I (mm/h) is the rainfall intensity, D (h) is the rainfall duration and α and β are characteristic parameters of data distribution.
The adopted procedure can be divided into three main steps:
  • (i) Threshold individuation, which is carried out by software, so as the replicability of the analyses is guaranteed.
  • (ii) Threshold calibration, i.e., the verification of the performances of the threshold, in terms of correct predictions and missed or false alarms.
  • (iii) Threshold validation, i.e., the defined threshold is validated against an independent landslide dataset.
To perform the threshold individuation (step i), software named MaCumBA (fully described in Segoni et al. [21]) was used: this software requires as input data the location (coordinates) and the triggering date of the landslides, the location of rain gauges and the rainfall recorded by all rain gauges from 60 days before each landslide to the day after the landslide triggering. The software requires the setting of three additional parameters: (a) The NRG (No Rain Gap), i.e., the number of hours without rain necessary to consider a rain event as ended, (b) the search radius, i.e., the maximum distance allowed between each landslide and the rain gauges that are evaluated as potential reference rain gauges to characterize the triggering rainfall and (c) a minimum rainfall intensity (to filter off uninfluential rainfall events and reduce the computational load). Each NRG-search radius pair allows a different threshold to be defined, so the calibration process (step ii) is used to verify which parameter set has the best performance.
The MaCumBA software has the advantage of choosing the distance of the rain gauge landslide, minimum start rain, no rain gap to separate event and, minimum rain (mm/hour). These parameters can be changed several times until the best threshold for the study area is identified according to a quantitative criterion [21]. Most importantly, these parameters can be implemented in an algorithm to analyse rainfall data in real time; allowing the best consistency between the approach used to define the thresholds and the real time monitoring. To verify the quality of the defined thresholds, the number of correct alarms (CA), false alarms (FA) and missed alarms (MA) in the whole calibration period have been calculated. In this phase, the multiple warning levels definition, based on increasing thresholds, took place; to carry out this task, an objective parameter, the Positive Predictive Value (PPV) was used. PPV is calculated as the ratio between CA and the sum of CA and FA and allows the capability of each threshold to be quantified in order to identify landslide triggering events [55,56].
The final set-up of the multiple thresholds system is characterized by 3 thresholds, which define 4 warning levels: The “standby” threshold, which separates the “no alarm” and the “moderate” warning levels, the “caution” threshold, which separates the “moderate” and “high” warning levels and the “alarm” threshold, which separates the “high” and “very high” warning levels.
The standby threshold has been defined using MaCumBA, while caution and alarm thresholds using different PPV values as reference; in particular, the moderate warning level should have a PPV equal to or higher than 0.3, i.e., 30% of correct alarms have to be issued; the high warning level should have a PPV equal to or higher than 0.5 (i.e., 50% of correct alarms); and the very high warning level should have a PPV equal to or higher than 0.75 (i.e., 75% of correct alarms).
Caution and alarm thresholds have been identified by an empirical procedure, based on two assumptions: They had to reach the aforementioned PPV and be parallel to the standby threshold to avoid any intersection between thresholds; essentially 2 thresholds equal to the standby one are traced and “raised” parallel to it until the desired PPV is achieved.

3. Results

3.1. Threshold Calibration

The procedure summarized in the previous section allowed a set of 3 thresholds for each municipality to be defined, based on the landslides and rainfall of the calibration period. MACumBA was run with a confidence level of 95% and allowed 10 km as the maximum landslide–rain gauge distance to define the standby threshold, while the caution and alarm thresholds were empirically defined as previously described. The α and β values, no rain gap and minimum rainfall, as well as the standby threshold equation for each municipality are shown in Table 2.
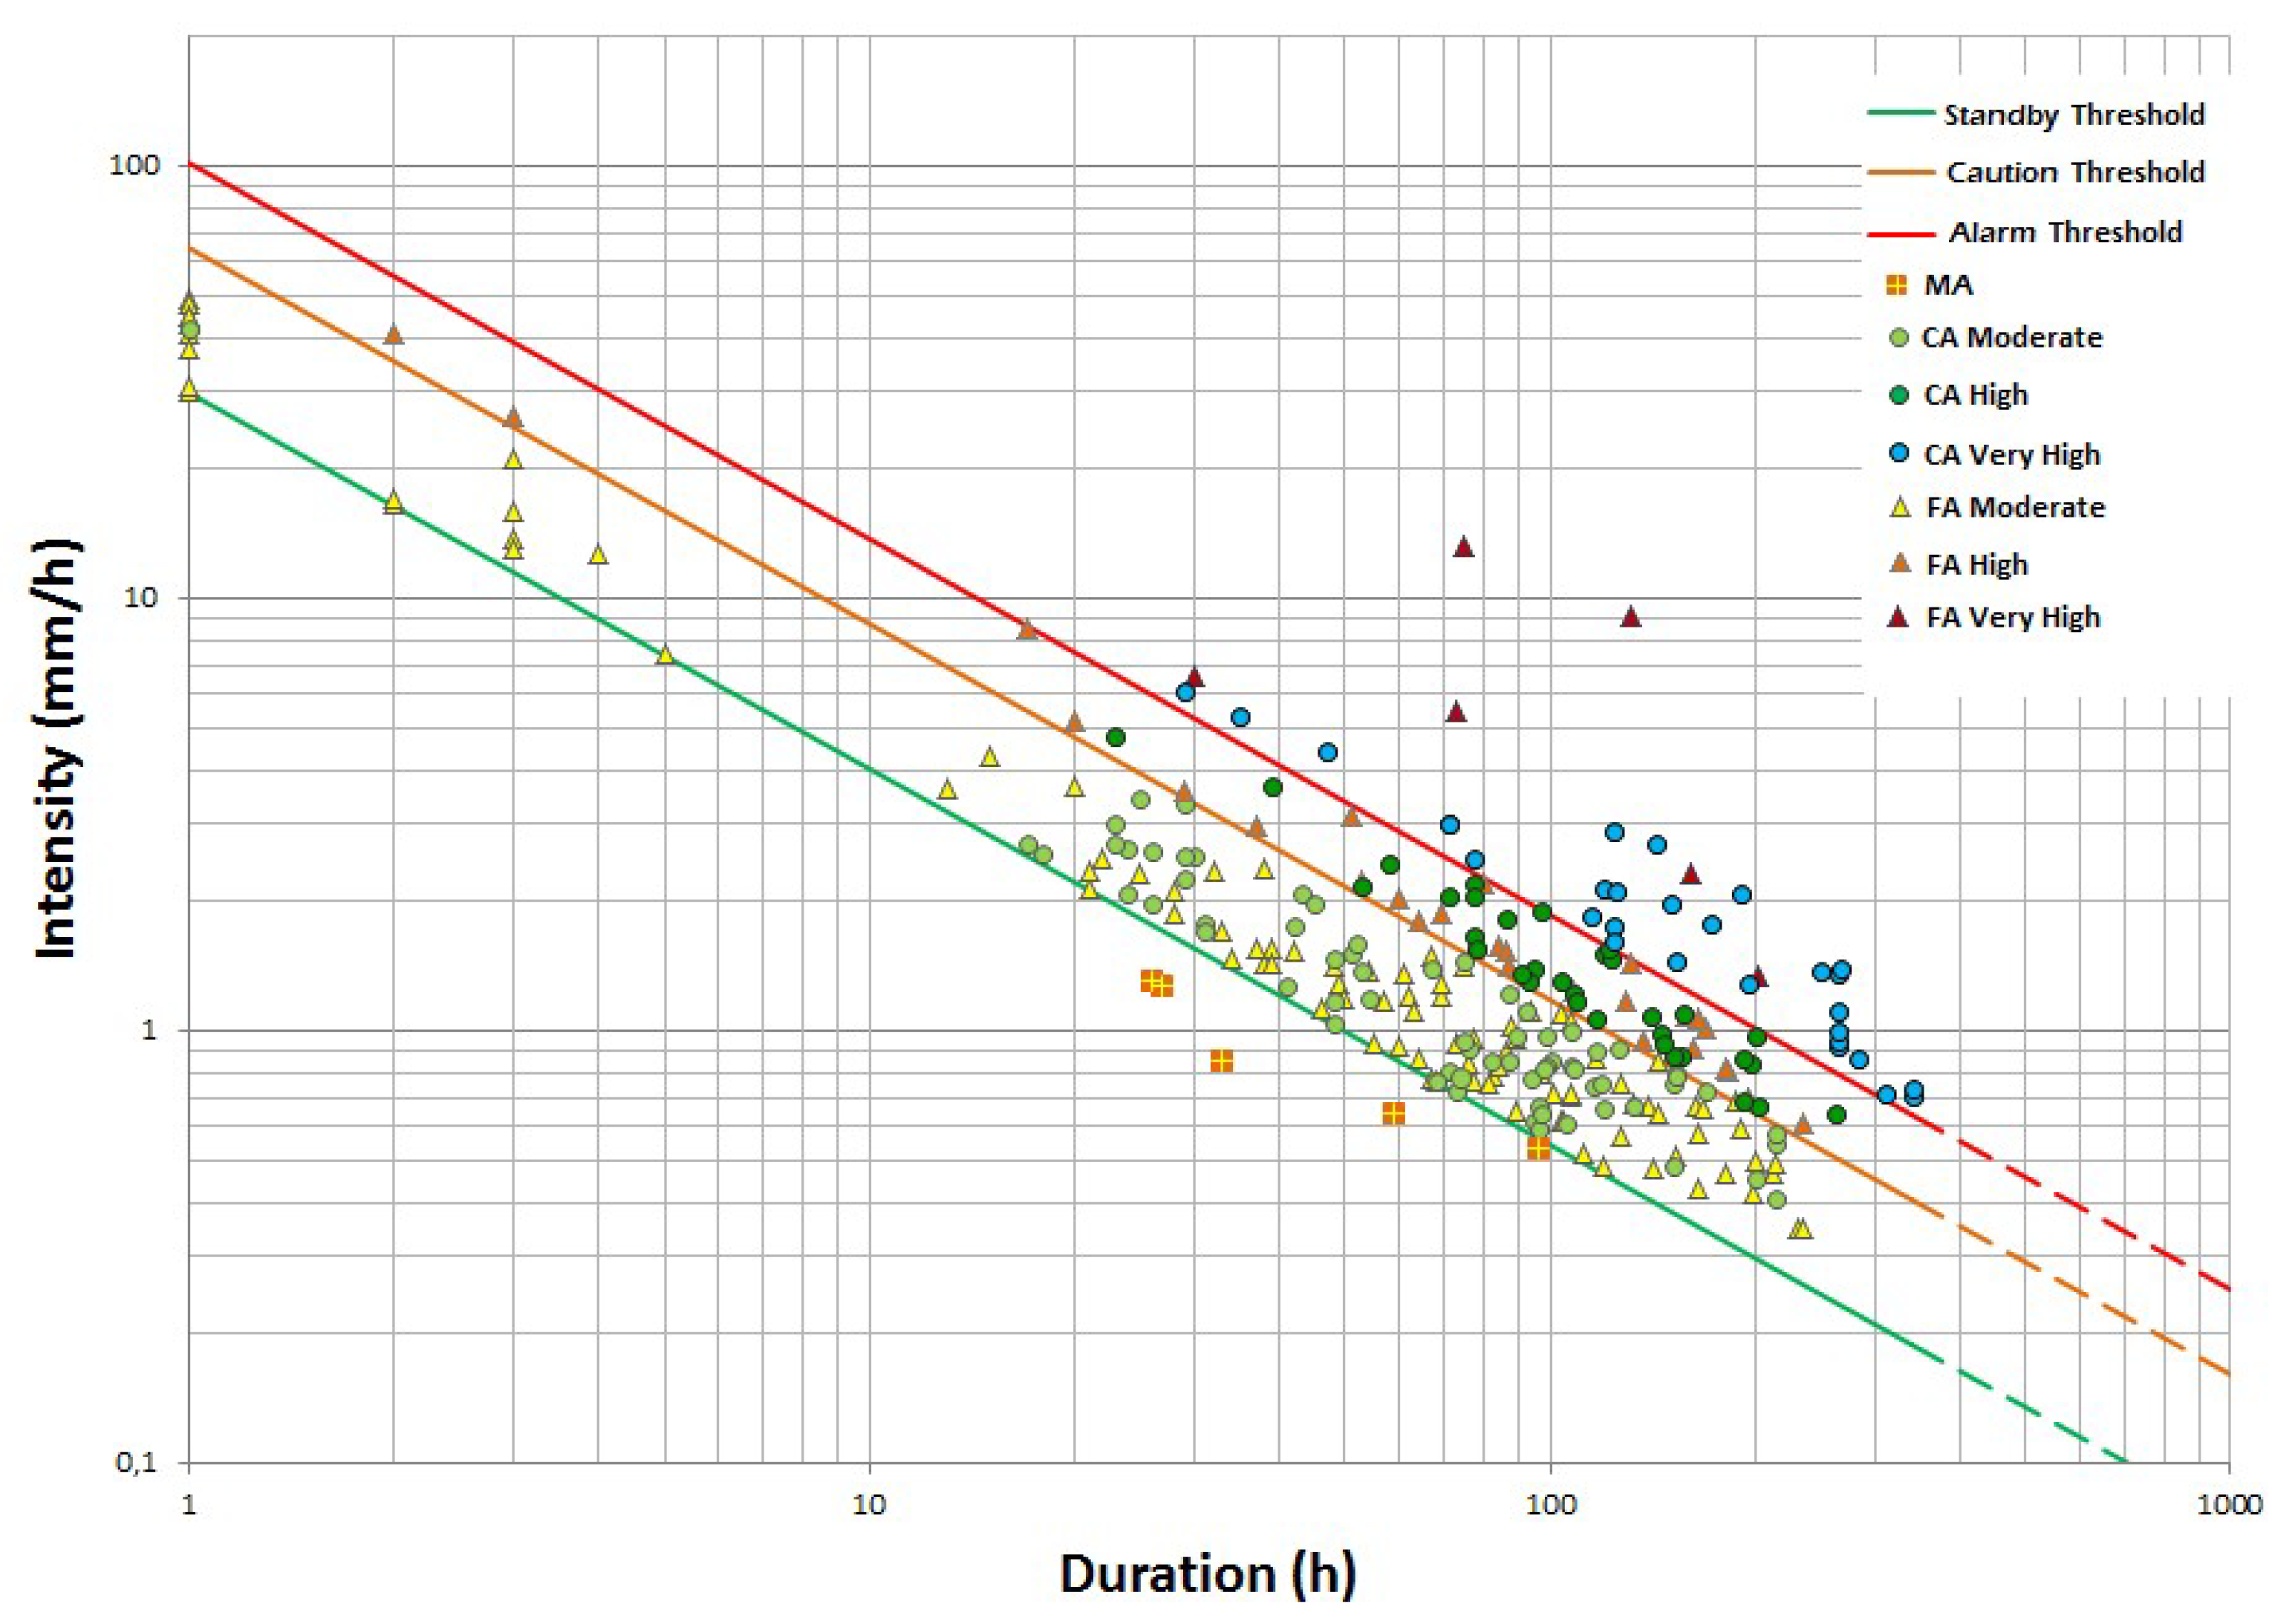
In the Nova Friburgo municipality, the best thresholds set allowed 132 landslide events to be correctly classified (correct alarms) (Figure 5), where each event can contain one or more landslides, while 5 landslide events were not correctly classified (missed alarms) and 131 false alarms were generated in 10 years. The moderate alarm threshold led to 69 CA, 97 FA and 5 MA, with a PPV equal to 0.42; the high alarm threshold lead to 34 CA and 28 FA, with a PPV equal to 0.55; and the very high alarm threshold lead to 29 CA and 6 FA, with a PPV equal to 0.83.
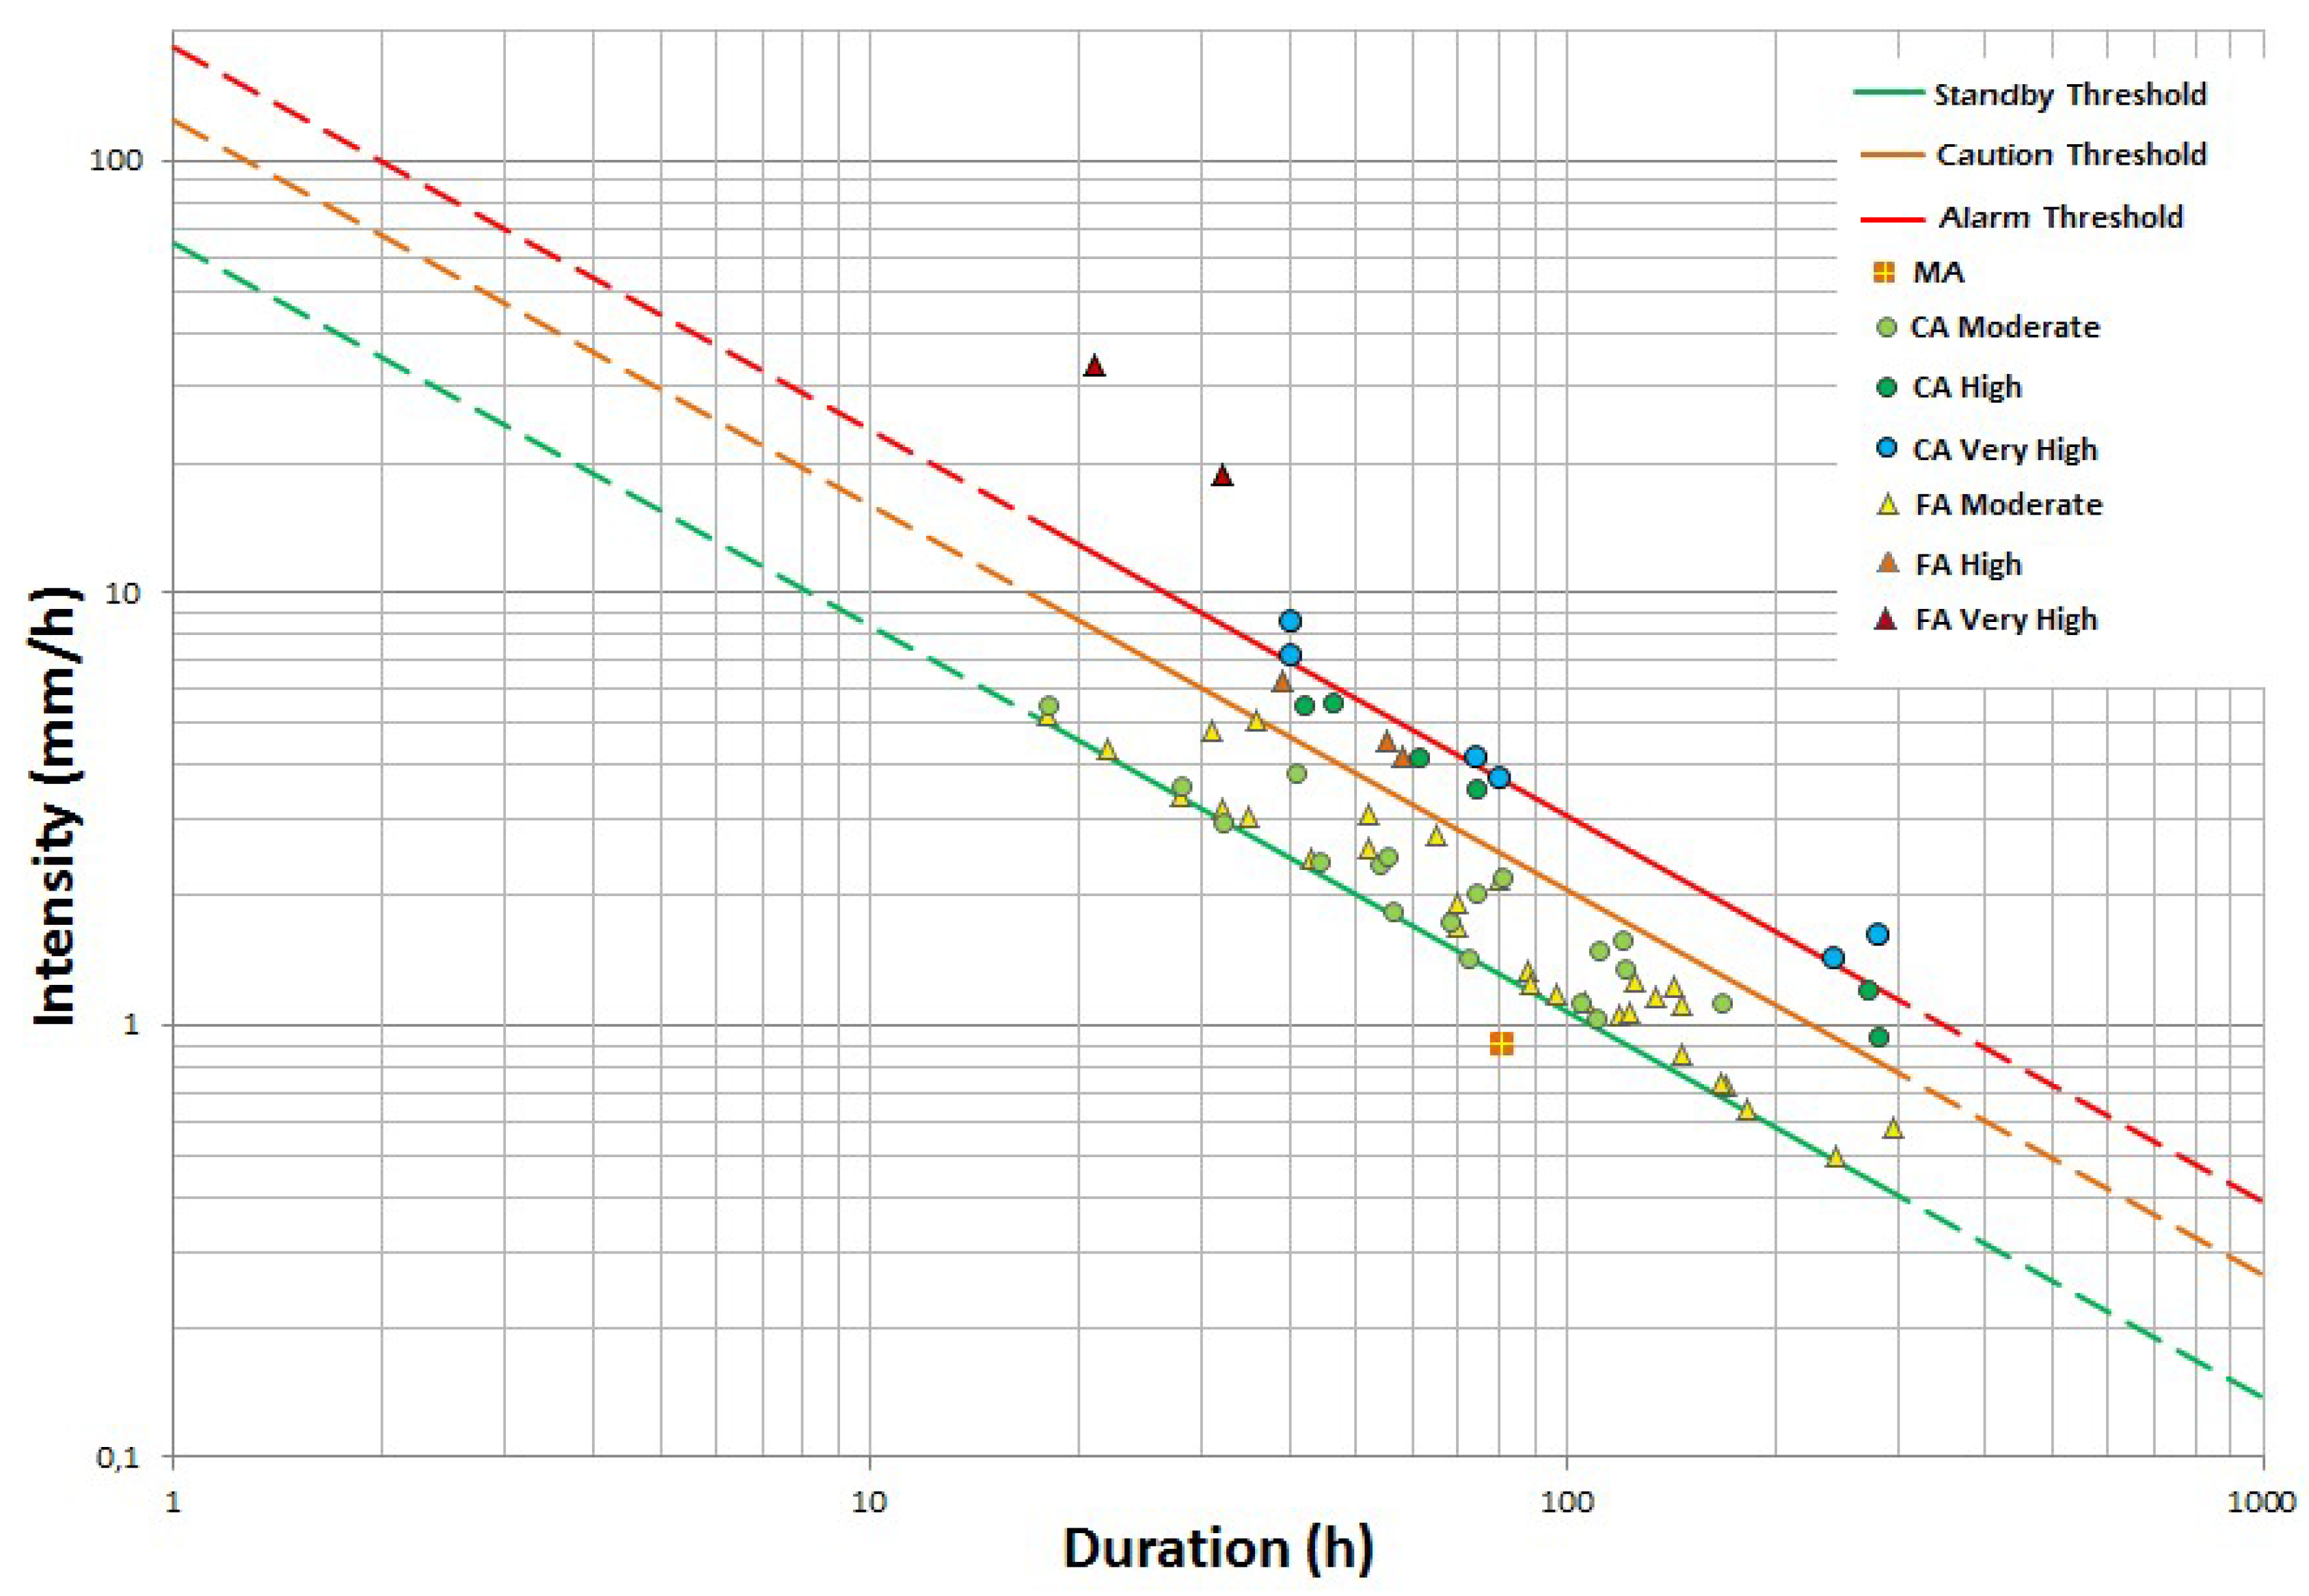
In Petropolis the best thresholds set allowed 269 landslide events to be correctly classified, while 176 false alarms were generated (Figure 6). The moderate alarm threshold led to 190 CA, 158 FA, with a PPV equal to 0.55; the high alarm threshold led to 59 CA and 14 FA, with a PPV equal to 0.81; and the very high alarm threshold led to 20 CA and 4 FA, with a PPV equal to 0.83.
For Teresópolis, the best thresholds set allowed 35 landslide events to be correctly classified, while only 1 landslide event was classified as missed alarms and 35 false alarms were generated (Figure 7). The moderate alarm threshold led to 18 CA, 30 FA and 1 MA, with a PPV equal to 0.38; the high alarm threshold lead to 6 CA and 3 FA, with a PPV equal to 0.67; and the very high alarm threshold lead to 6 CA and 2 FA, with a PPV equal to 0.75.
The equation and the statistics of each threshold for the 3 study areas are reported in Table 3.

3.2. Threshold Validation

Results of validation have been verified adopting the same approach as the calibration procedure to ensure a proper comparison of the results.
In Nova Friburgo, 5 landslide events were recorded in 2018, with 25 landslides triggered. 19 landslides were classified (CA) in the moderate alarm level along with 27 FA (PPV = 0.41), 5 CA resulted in the high alarm level, with 3 FA (PPV = 0.63), and 1 CA and 0 FA in the very high alarm level (PPV = 1). Missed alarms were not recorded.
In Petropolis, 11 events, triggering 39 landslides, were reported in 2018. Among them, 31 CA and 22 FA were present in the moderate alarm level (PPV = 0.53), 8 CA and 0 FA in high alarm level (PPV = 1). In the very high level, there are no events. Missed alarms were not recorded.
In the Teresópolis area, 4 events, triggering 5 landslides, were reported in 2018. In moderate alarm level 3 CA were present, with 6 FA and 1 MA (PPV = 0.33), in high alarm level, 1 CA and 1 FA were present (PPV = 0.5), while no events were classified in the very high alarm level. It is worth noticing that the missed alarm refers to a landslide reported on the same day as an event with 3 landslides.
Some recent works [36,57] suggested that a thorough demonstration of the effectiveness of a threshold would require also a quantitative comparison with another model or methodology. Consequently, a second validation step was performed and the results of the present work were compared with the alerts issued by the Cemaden in the year 2018.
At Cemaden, after an alert is sent, the Natural Disaster specialists’ team conduct research on events in the media and receive information from Local Civil Defense. All this information is filed in a database, which has been used to validate the thresholds.
In Nova Friburgo, 10 alerts were issued in 2018, among which there were 7 FA and 3 CA and in addition 2 alerts were missed (MA), while the proposed thresholds allowed all these events to be correctly identified.
Petrópolis received 14 alerts in 2018, of which 4 were FA, 10 CA and 1 MA; the proposed threshold set allowed all these events to be identified.
For Teresópolis, 13 alerts were issued in 2018: 9 FA, 3 CA and 1 MA; in this case, the proposed thresholds set showed similar performances to the existing landslide warning system.

4. Discussion and Conclusions

In this paper the possibility of defining multiple rainfall thresholds to forecast landslide occurrences in 3 different municipalities of Brazil was explored.
The results can be considered satisfactory, since it was possible to identify different threshold sets that could be realistically used in an EWS.
Even if some authors, such as Huang et al. [58], stated that statistical models are suitable to be used only for the areas where they were initially defined, in this work a state-of-art procedure, first developed in Italy and then applied in Slovenia [21,37], was satisfactory applied to define the standby threshold in Brazil. This study case demonstrates that the procedure can be applied with satisfactory results in very different climatic and geological settings to forecast rainfall-induced landslides with different characteristics. This outcome proves the exportability of the procedure, provided that landslide and rainfall data of sufficient quality and quantity are available.
However, some issues are still present, such as the high number of FA in the moderate alarm level; this problem is clear mainly in the Nova Friburgo and Teresópolis areas, where the number of FA in the moderate alarm level is higher than that of CA. This could be due to the bias of the landslide dataset used for calibration, since the majority of landslides are reported in only one rainfall event (landslides occurred from the 11th to the 12th of January, 2011), so the threshold definition is somehow overfitted because of these events. On the other hand, the validation showed better results than calibration and this could support the hypothesis of the bias in landslide distribution, since the validation dataset does not suffer any particular distribution, though very few landslides were available for validation and this could also contribute to getting better results for the validation procedure, since the used sample could not be considered representative enough of the ground truth.
This study was developed in three test areas and showed the potential of applying a semi-automatic method of establishing rain thresholds for landslide at four alert levels. Thresholds were defined on the basis of statistical analyses and proved to be efficient, especially at high and very high alert levels. The greatest difficulty in applying this methodology is the survey and organization of landslide events, since the information is decentralized and there is sometimes no detailed information (such as date of the event and precise location), which would be essential for an optimal application of the model. In addition, there is the difficulty of finding rainfall data from rain gauges close to the landslide occurrence, with reliable data and within the desired period [24]. In Brazil, only in recent years the systematic collection of hourly precipitation data has begun (INMET has hourly data from 2008 for Petrópolis and Teresópolis, and from 2010 for Nova Friburgo). INEA has the latest weather data (some only from 2011) but has a larger network of rain gauges. A maximum distance between landslide and rain gauge of 10 km was used for all municipalities: This distance allowed each landslide to be associated with at least one rain gauge and showed the best results. Vaz et al. [59] analysed the influence of the distance between rain gauge and landslide, and calculated rainfall thresholds considering the distances of 5, 10, 15, 20, 30, 40, 50 and 60 km. The ratio between the non-rainfall-triggered landslide events and the rainfall-triggered landslide events within each buffer was used to identify the area where the rain gauge is representative. Their studies concluded that distances greater than 50 km allowed better results to be obtained. However, the studies were carried out in Lisbon, where the rainfall regime is spatially consistent and the orographic effect on the rainfall distribution is low in the region. The mountainous region of Rio de Janeiro, on the other hand, has a high orographic influence due to the presence of Serra do Mar, with altitudes that exceed 2300 m, which can influence the distribution of rainfall in the studied municipalities, making it heterogeneous in a few kilometres. Regarding the number of pluviometres considered per municipality, a limited number of rain gauges was available (8 rain gauges for Nova Friburgo, 15 for Petrópolis and 4 for Teresópolis).
The no rain gap parameter refers to the number of hours without rain necessary to separate two distinct events. If this parameter is changed, the thresholds change. Segoni et al. [22] discussed the influence of soil on NRG values. Soils with high permeability support high NRG values, because the rainwater can penetrate the deeper layers of the soil, which take longer to become saturated. The reverse occurs with soils that have low permeability: The upper soil layer saturates more rapidly and favours shallow landslides. In our study, the NRG for Nova Friburgo was 36 h and 24 h for Petrópolis and Teresópolis. These values are not very different among the municipalities studied. In the region, Cambisols and Latosols prevail, both dystrophic and with certain degrees of weathering. The slope and land use would play a more important role in terms of susceptibility to landslides. In the mountainous region of Rio de Janeiro, the slope is accentuated, which prevents the formation of very deep soils. Moreover, the deforestation and expansion of the urban area to areas with higher slopes potentially increases susceptibility, exhibiting the population at risk.
It is worth noting that the optimal values found for NRG and minimum rainfall are higher than all other applications of MAcumBA in other parts of the world [22,25,37]. This probably reflects the different climatic settings, with the very high level of humidity and soil moisture of Brazil demanding a longer time to completely dissipate the transitory effect of pore water pressure increase after rainfall.
The methodology used in the present study can be applied in other municipalities monitored by Cemaden, establishing for each one four levels of alert, based on the intensity–duration thresholds. It should be emphasized that the methodology presented here allows the updating of the thresholds as new landslide events are incorporated, together with rainfall data at the time of occurrence. According to Rosi et al. [25] the updating and the increase of the number of landslides can improve the thresholds, generating a more representative sample. When data from new rain gauges are available, it can also increase the accuracy of the thresholds, since the difference in spatial distribution of rainfall can be captured. This may be interesting when the study area has a heterogeneous distribution of precipitation, as in the case of the municipalities used in the present study.

Author Contributions

A.R. and V.C. organised and analysed the data; A.R., V.C. and S.S. wrote the paper; T.D.N., F.C. and N.C. supervised the whole work.

Funding

The research activities described in this article were carried out in the framework of the project BrIta–Promotion of a Scientific collaboration agreement between Brazil (University of Sao Paolo and Cemanden) and Italy (University of Florence). This work was supported by the National Institute of Science and Technology for Climate Change Phase 2 under CNPq Grant 465501/2014-1, FAPESP Grant 2014/50848-9 and the National Coordination for High Level Education and Training (CAPES) Grant 16/2014.

Acknowledgments

Authors thank the Cemaden staff for providing landslide data and the IMET and INEA staff for providing the rainfall data.

Conflicts of Interest

The authors declare no conflict of interest. The funders had no role in the design of the study; in the collection, analyses, or interpretation of data; in the writing of the manuscript, or in the decision to publish the results.

References

  1. Marengo, J.A. Mudanças Climáticas e Eventos Extremos no Brasil, 1st ed.; FBDS: Rio de Janeiro, Brazil, 2009; pp. 6–9. [Google Scholar]
  2. Busch, A.; Amorim, S. A Tragédia da Região Serrana do Rio de Janeiro em 2011: Procurando Respostas; ENAP Casoteca da Gestão Pública: Brasilia, Brazil, 2011; 20p. [Google Scholar]
  3. INEA - State Environmental Institute. Flood Alert. Available online: http://www.alertadecheias.inea.rj.gov.br/dados/rio_dois_rios.php (accessed on 3 July 2008).
  4. INMET-National Institute of Meteorology. Hydro-Meteorological Information System (SIM). Available online: http://www.inmet.gov.br/portal/index.php?r=estacoes/estacoesautomaticas (accessed on 15 April 2018).
  5. Marchezini, V.; Trajber, R.; Olivato, D.; Muñoz, V.A.; Pereira, F.O.; Luz, A.E.O. Participatory Early Warning Systems: Youth, Citizen Science, and Intergenerational Dialogues on Disaster Risk Reduction in Brazil. Int. J. Disaster Risk Sci. 2017, 8, 390–401. [Google Scholar] [CrossRef] [Green Version]
  6. Weichselgartner, J.; Pigeon, P. The role of knowledge in disaster risk reduction. Int. J. Disaster Risk Sci. 2015, 6, 107–116. [Google Scholar] [CrossRef]
  7. Chae, B.G.; Park, H.J.; Catani, F.; Simoni, A.; Berti, M. Landslide prediction, monitoring and early warning: A concise review of state-of-the-art. Geosci. J. 2017, 21, 1033–1070. [Google Scholar] [CrossRef]
  8. Salvatici, T.; Tofani, V.; Rossi, G.; D’Ambrosio, M.; Tacconi Stefanelli, C.; Masi, E.B.; Rosi, A.; Pazzi, V.; Vannocci, P.; Petrolo, M.; et al. Application of a physically based model to forecast shallow landslides at a regional scale. Nat. Hazards Earth Syst. Sci. 2018, 18, 1919–1935. [Google Scholar] [CrossRef]
  9. Schmaltz, E.M.; Van Beek, L.P.H.; Bogaard, T.A.; Kraushaar, S.; Steger, S.; Glade, T. Strategies to improve the explanatory power of a dynamic slope stability model by enhancing land cover parameterisation and model complexity. Earth Surf. Process. Landf. 2019, 44, 1259–1273. [Google Scholar] [CrossRef]
  10. Canli, E.; Mergili, M.; Thiebes, B.; Glade, T. Probabilistic landslide ensemble prediction systems: Lessons to be learned from hydrology. Nat. Hazards Earth Syst. Sci. 2018, 18, 2183–2202. [Google Scholar] [CrossRef]
  11. Mercogliano, P.; Segoni, S.; Rossi, G.; Sikorsky, B.; Tofani, V.; Schiano, P.; Catani, F.; Casagli, N. Brief communication “A prototype forecasting chain for rainfall induced shallow landslides”. Nat. Hazards Earth Syst. Sci. 2013, 13, 771–777. [Google Scholar] [CrossRef]
  12. Rossi, G.; Catani, F.; Leoni, L.; Segoni, S.; Tofani, V. HIRESSS: A physically based slope stability simulator for HPC applications. Nat. Hazards Earth. Syst. Sci. 2013, 13, 151–166. [Google Scholar] [CrossRef]
  13. Guzzetti, F.; Peruccacci, S.; Rossi, M.; Stark, C.P. Rainfall thresholds for the initiation of landslides in central and southern Europe. Meteorol. Atmos. Phys. 2007, 98, 239–267. [Google Scholar] [CrossRef]
  14. Caine, N. The rainfall intensity-duration control of shallow landslides and debris flows. Geogr. Ann. Ser. A Phys. Geogr. 1980, 62, 23–27. [Google Scholar] [CrossRef]
  15. Aleotti, P. A warning system for rainfall-induced shallow failures. Eng. Geol. 2004, 73, 247–265. [Google Scholar] [CrossRef]
  16. Giannecchini, R. Relationship between rainfall and shallow landslides in the southern Apuan Alps (Italy). Nat. Hazards Earth. Syst. Sci. 2006, 6, 357–364. [Google Scholar] [CrossRef] [Green Version]
  17. Guzzetti, F.; Peruccacci, S.; Rossi, M.; Stark, C.P. The rainfall intensity-duration control of shallow landslides and debris flows: An update. Landslides 2008, 5, 3–17. [Google Scholar] [CrossRef]
  18. Brunetti, M.T.; Peruccacci, S.; Rossi, M.; Luciani, S.; Valigi, D.; Guzzetti, F. Rainfall thresholds for the possible occurrence of landslides in Italy. Nat. Hazards Earth. Syst. Sci. 2010, 10, 447–458. [Google Scholar] [CrossRef] [Green Version]
  19. Giannecchini, R.; D’Amato Avanzi, G. Historical research as a tool in estimating hydrogeological hazard in a typical small alpine-like area: The example of the Versilia River basin (Apuan Alps, Italy). Phys. Chem. Earth Parts A/B/C 2012, 49, 32–43. [Google Scholar] [CrossRef]
  20. Martelloni, G.; Segoni, S.; Fanti, R.; Catani, F. Rainfall thresholds for the forecasting of landslide occurrence at regional scale. Landslides 2012, 9, 485–495. [Google Scholar] [CrossRef]
  21. Segoni, S.; Rossi, G.; Rosi, A.; Catani, F. Landslides triggered by rainfall: A semiautomated procedure to define consistent intensity-duration thresholds. Comput. Geosci. 2014, 63, 123–131. [Google Scholar] [CrossRef]
  22. Segoni, S.; Rosi, A.; Rossi, G.; Catani, F.; Casagli, N. Analysing the relationship between rainfall and landslides to define a mosaic of triggering thresholds for regional-scale warning systems. Nat. Hazards Earth. Syst. Sci. 2014, 14, 2637–2648. [Google Scholar] [CrossRef]
  23. Vennari, C.; Gariano, S.L.; Antronico, L.; Brunetti, M.T.; Iovine, G.; Peruccacci, S.; Terranova, O.; Guzzetti, F. Rainfall thresholds for shallow landslide occurrence in Calabria, southern Italy. Nat. Hazards Earth. Syst. Sci. 2014, 14, 317–330. [Google Scholar] [CrossRef] [Green Version]
  24. Gariano, S.L.; Brunetti, M.T.; Iovine, G.; Melillo, M.; Peruccacci, S.; Terranova, O.; Vennari, C.; Guzzetti, F. Calibration and validation of rainfall thresholds for shallow landslide forecasting in Sicily, southern Italy. Geomorphology 2015, 228, 653–665. [Google Scholar] [CrossRef]
  25. Rosi, A.; Lagomarsino, D.; Rossi, G.; Segoni, S.; Battistini, A.; Casagli, N. Updating EWS rainfall thresholds for the triggering of landslides. Nat. Hazards 2015, 78, 297–308. [Google Scholar] [CrossRef]
  26. Melillo, M.; Brunetti, M.T.; Peruccacci, S.; Gariano, S.L.; Guzzetti, F. An algorithm for the objective reconstruction of rainfall events responsible for landslides. Landslides 2015, 12, 311–320. [Google Scholar] [CrossRef]
  27. Rossi, M.; Luciani, S.; Valigi, D.; Kirschbaum, D.; Brunetti, M.T.; Peruccacci, S.; Guzzetti, F. Statistical approaches for the definition of landslide rainfall thresholds and their uncertainty using rain gauge and satellite data. Geomorphology 2017, 285, 16–27. [Google Scholar] [CrossRef]
  28. Peruccacci, S.; Brunetti, M.T.; Luciani, S.; Vennari, C.; Guzzetti, F. Lithological and seasonal control of rainfall thresholds for the possible initiation of landslides in central Italy. Geomorphology 2012, 139–140, 79–90. [Google Scholar] [CrossRef]
  29. Tien Bui, D.; Pradhan, B.; Lofman, O.; Revhaug, I.; Dick, Ø.B. Regional prediction of landslide hazard using probability analysis of intense rainfall in the Hoa Binh province, Vietnam. Nat. Hazards 2013, 66, 707–730. [Google Scholar] [CrossRef]
  30. Lee, S.; Won, J.S.; Jeon, S.W.; Park, I.; Lee, M.J. Spatial landslide hazard prediction using rainfall probability and a logistic regression model. Math. Geosci. 2015, 47, 565–589. [Google Scholar] [CrossRef]
  31. Segoni, S.; Piciullo, L.; Gariano, S.L. A review of the recent literature on rainfall thresholds for landslide occurrence. Landslides 2018, 15, 1483–1501. [Google Scholar] [CrossRef]
  32. Chang, K.; Shou-Hao, C.; Feng, L. Analysing the Relationship Between Typhoon-Triggered Landslides and Critical Rainfall Conditions. Earth Surf. Process. Landf. 2008, 33, 1261–1271. [Google Scholar] [CrossRef]
  33. Ma, C.; Hu, K.H.; Zou, Q.; Tian, M. Characteristics of clustering debris flows in Wenchuan earthquake zone. J. Mt. Sci. 2013, 10, 953–961. [Google Scholar] [CrossRef]
  34. Ciervo, F.; Rianna, G.; Mercogliano, P.; Papa, M.N. Effects of climate change on shallow landslides in a small coastal catchment in southern Italy. Landslides 2017, 14, 1043–1055. [Google Scholar] [CrossRef]
  35. Segoni, S.; Battistini, A.; Rossi, G.; Rosi, A.; Lagomarsino, D.; Catani, F.; Moretti, S.; Casagli, N. Technical note: An operational landslide early warning system at regional scale based on space–time variable rainfall thresholds. Nat. Hazards Earth Syst. Sci. 2015, 15, 853–861. [Google Scholar] [CrossRef]
  36. Lagomarsino, D.; Segoni, S.; Rosi, A.; Battistini, A.; Catani, F.; Casagli, N. Quantitative comparison between two different methodologies to define rainfall thresholds for landslide forecasting. Earth Syst. Sci. 2015, 15, 2413–2423. [Google Scholar] [CrossRef] [Green Version]
  37. Rosi, A.; Peternel, T.; Jemec-Auflič, M.; Komac, M.; Segoni, S.; Casagli, N. Rainfall thresholds for rainfall-induced landslides in Slovenia. Landslides 2016, 13, 1571–1577. [Google Scholar] [CrossRef]
  38. Segoni, S.; Tofani, V.; Rosi, A.; Catani, F.; Casagli, N. Combination of rainfall thresholds and susceptibility maps for dynamic landslide hazard assessment at regional scale. Front. Earth Sci. 2018, 6, 85. [Google Scholar] [CrossRef]
  39. Waldherr, F.; Tupinambá, M.A. Dinâmica dos Depósitos Pretéritos na Deflagração de Corridas de Detritos em Eventos Catastróficos: A Bacia de Drenagem do Córrego do Príncipe, Teresópolis-RJ. In Proceedings of the VIII SLAGF Simpósio Latinoamericano de Geografia Física, IV SIAGF Simpósio Iberoamericano de Geografia Física, Santiago, Chile, 3–5 Dcember 2004; pp. 1185–1192. [Google Scholar] [CrossRef]
  40. Van Beek, R.; Cammeraat, E.; Andreu, V.; Mickovski, S.B.; Dorren, L. Hillslope Processes: Mass Wasting, Slope Stability and Erosion. In Slope Stability and Erosion Control: Ecotechnological Solutions; Norris, J.E., Stokes, A., Mickovski, S.B., Cammeraat, E., van Beek, R., Nicoll, B.C., Achim, A., Eds.; Springer: Dordrecht, The Netherlands, 2008; pp. 17–64. ISBN 978-1-4020-6676-4. [Google Scholar]
  41. Ottero, C.R.; Chargel, L.T.; Hora, M.A.G.M. Análise de frequência dos dados pluviométricos observados em 2011 e 2013 na Região Serrana, Estado do Rio de Janeiro. Revista Brasileira de Meteorologia 2018, 33, 131–139. [Google Scholar] [CrossRef]
  42. Ab’saber, A.N. A Serra do Japi, sua origem geomorfológica e a teoria dos refúgios. In História Natural da Serra do Japi: Ecologia e Preservação de Uma Área Florestal no Sudeste do Brasil; Morellato, L.P.C., Ed.; Unicamp/Fapesp: Campinas, Brazil, 1992; pp. 12–23. [Google Scholar]
  43. Dantas, M.E. Geomorfologia do Estado do Rio de Janeiro. In Estudo Geoambiental do Estado do Rio de Janeiro; CPRM-Serviço Geológico do Brasil: Brasília, Brazil, 2001; p. 19. [Google Scholar]
  44. Roderjan, C.V.; Kuniyoshi, Y.S. Macrozoneamento Florístico da Área de Proteção Ambiental de Guaraqueçaba: APA-Guaraqueçaba; IPARDES: Curitiba, Brasil, 2001; 150p. [Google Scholar]
  45. EMBRAPA. Centro Nacional de Pesquisa de Solos. Boletim de Pesquisa e Desenvolvimento. Zoneamento Agroecológico Do Estado Do Rio De Janeiro-ANO 2003. Available online: https://www.embrapa.br/solos/busca-de-publicacoes/-/publicacao/338523/zoneamento-agroecologico-do-estado-do-rio-de-janeiro---ano-2003 (accessed on 17 August 2018).
  46. IBGE-Instituto Brasileiro de Geografia e Estatística. Cidades. Available online: https://cidades.ibge.gov.br/brasil/rj/petropolis/panorama (accessed on 25 September 2018).
  47. Fonseca, M.J.G.; Derze, G.R.; Barreto, A.M.; Williams, G.H. Mapa Geológico do Estado do Rio de Janeiro; Departamento Nacional de Produção Mineral (DPMN): Rio de Janeiro, Brazil, 1998; 141p. [Google Scholar]
  48. Penha, M.M.; Ferrari, A.L.; Junho, M.C.B.; Souza, S.L.A.; Brennes, T.L. Projeto Carta Geológica do Estado do Rio de Janeiro: Folha Itaipava; v. 1; Convênio DRM/IG-UFRJ: Rio de Janeiro, Brazil, 1981. [Google Scholar]
  49. Gonçalves, L.F.H. Avaliação e Diagnóstico da Distribuição Espacial e Temporal dos Movimentos de Massa com a Expansão da Área Urbana em Petrópolis-RJ. Ph.D. Thesis, Universidade Federal do Rio de Janeiro-UFRJ, Rio de Janeiro, Brazil, 1998. [Google Scholar]
  50. Carvalho Filho, A.; Lumbreras, J.F.; Santos, R.D. Os Solos do Estado do Rio de Janeiro; CPRM: Brasília, Brazil, 2000; 36p. [Google Scholar]
  51. Goulart, D.R.; Monteiro, A.E.G.C.; Guerra, A.J.T. Mapeamento de risco para o município de Petrópolis-RJ. In 4° Encontro Nacional de Estudos Sobre o Meio Ambiente; UFMT: Cuiabá, Brazil, 1993; pp. 387–396. [Google Scholar]
  52. UERJ/IBGE. Estudo Ambiental Como Subsídio à Metodologia Para o Ordenamento Territorial Através de Análise de Caso: Município de Teresópolis, RJ; Projeto PADCT: Rio de Janeiro, Brazil, 1999. [Google Scholar]
  53. Oliveira, N.S. Relação entre chuva e deslizamento em Nova Friburgo/Rj. Master’s Thesis, Universidade Federal do Rio de Janeiro, Rio de Janeiro, Brazil, July 2014. [Google Scholar]
  54. CEMADEN-National Center for Monitoring and Warning of Natural Disasters. Available online: https://www.cemaden.gov.br/o-alerta/ (accessed on 18 February 2019).
  55. Fawcett, T. An introduction to ROC analysis. Pattern Recogn. Lett. 2006, 27, 861–874. [Google Scholar] [CrossRef]
  56. Baum, R.; Harp, E.; Hultman, W. Map Showing Recent and Historic Landslide Activity on Coastal Bluffs of Puget Sound between Shilshole Bay and Everett, Washington, US Geological Survey Miscellaneous Field Studies Map MF-2346, Scale 1:24.000, U.S. Geological Survey. 2000. [CrossRef]
  57. Segoni, S.; Rosi, A.; Fanti, R.; Gallucci, A.; Monni, A.; Casagli, N. A Regional-Scale Landslide Warning System Based on 20 Years of Operational Experience. Water 2018, 10, 1297. [Google Scholar] [CrossRef]
  58. Huang, J.; Ju, N.P.; Liao, Y.J.; Liu, D.D. Determination of rainfall thresholds for shallow landslides by a probabilistic and empirical method. Nat. Hazards Earth Syst. Sci. 2015, 15, 2715–2723. [Google Scholar] [CrossRef] [Green Version]
  59. Vaz, T.; Zezere, J.L.; Pereira, S. Regional rainfall thresholds for landslide occurrence using a centenary database. Nat. Hazard Earth Syst. Sci. 2018, 18, 1037–1054. [Google Scholar] [CrossRef] [Green Version]
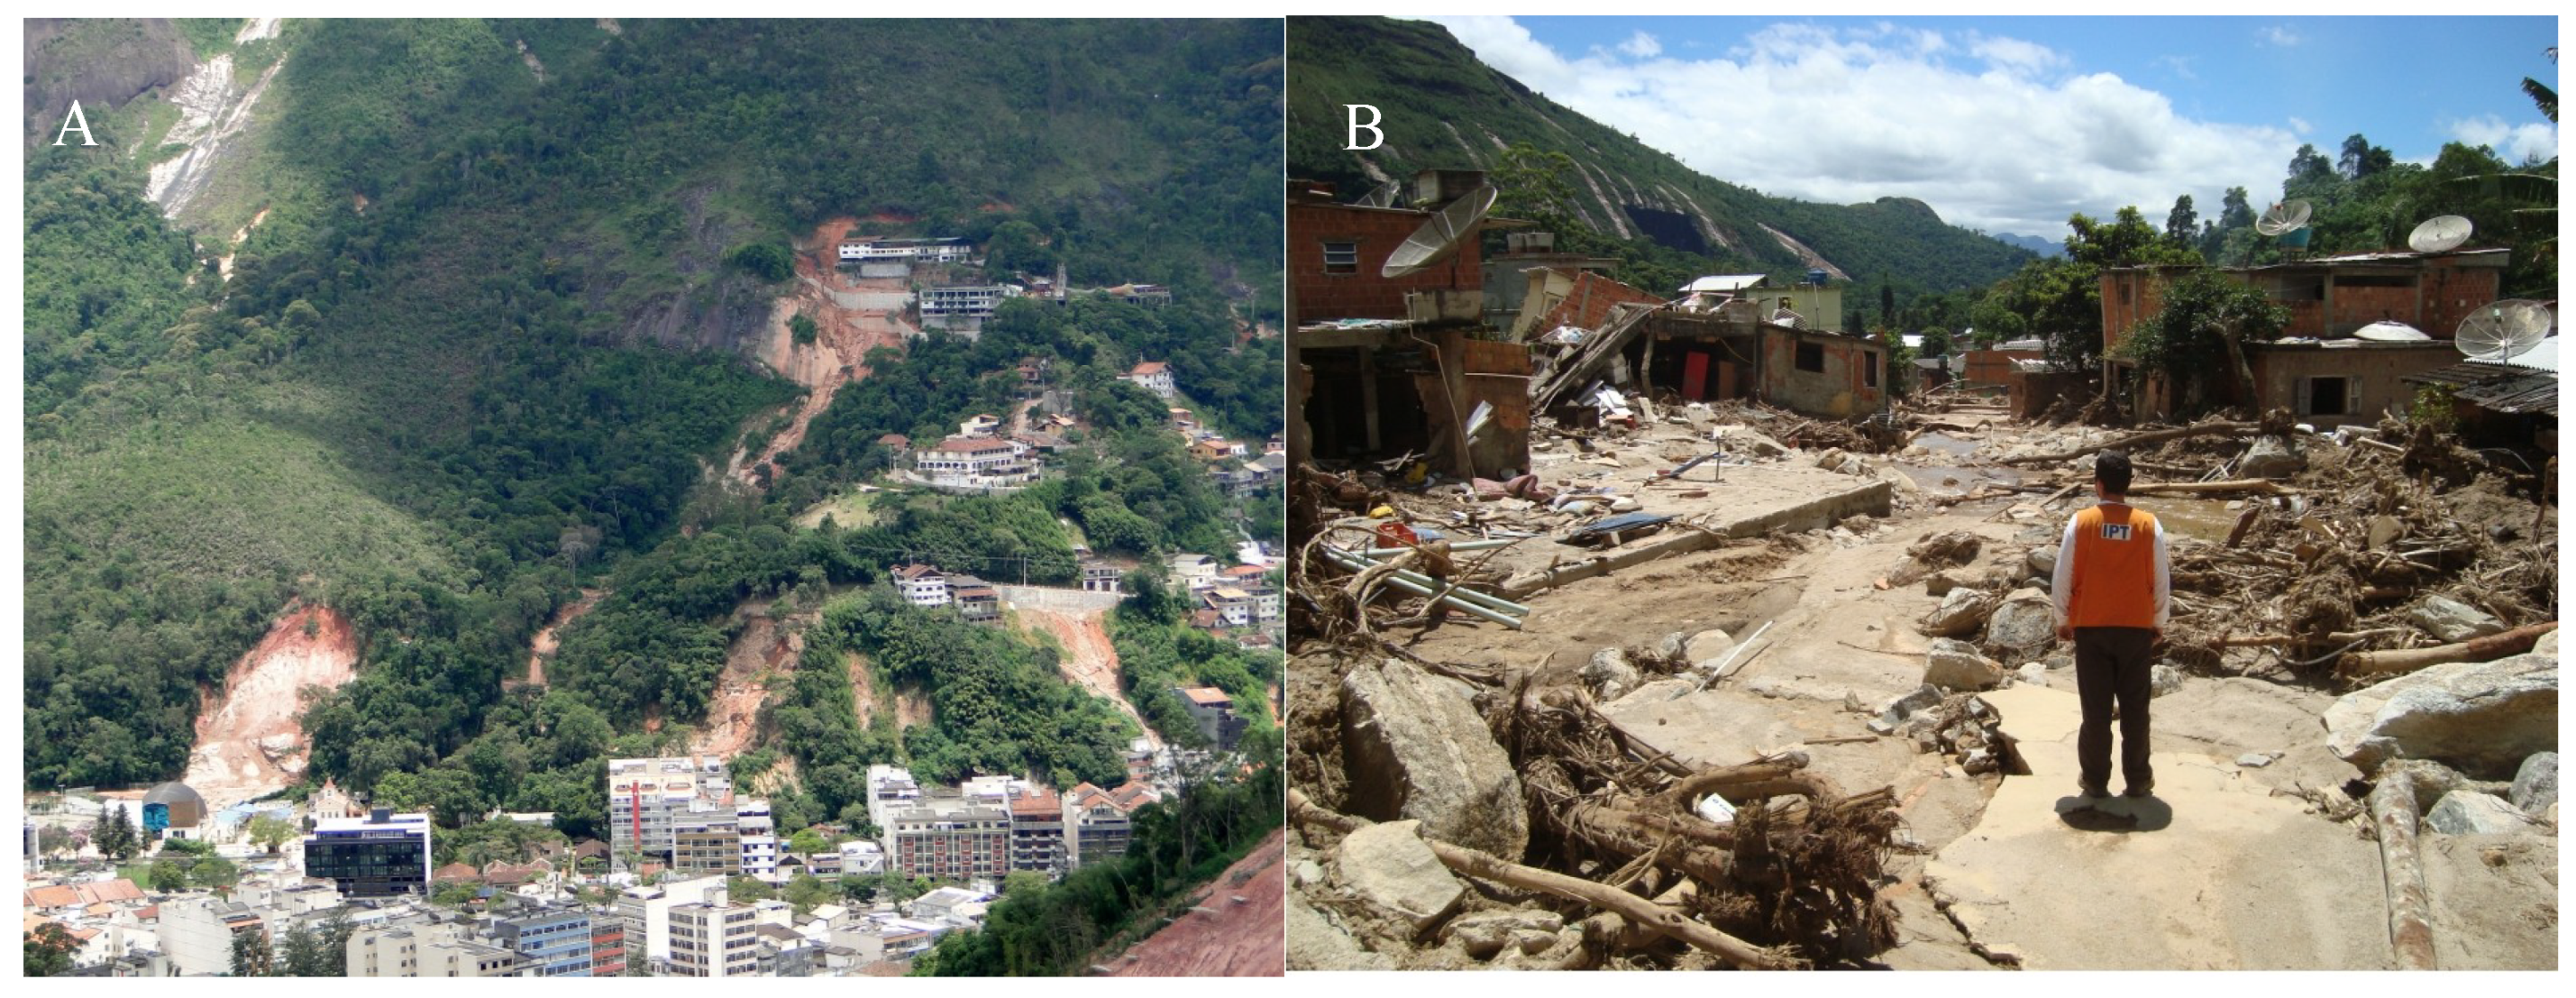
Figure 1. (A) Nova Friburgo 12/01/2011 (B) Teresópolis 12/01/2011photos: Instituto de Pesquisas Tecnológicas-IPT/RJ.
Geosciences 09 00203 g001
Figure 2. Study area location.
Geosciences 09 00203 g002
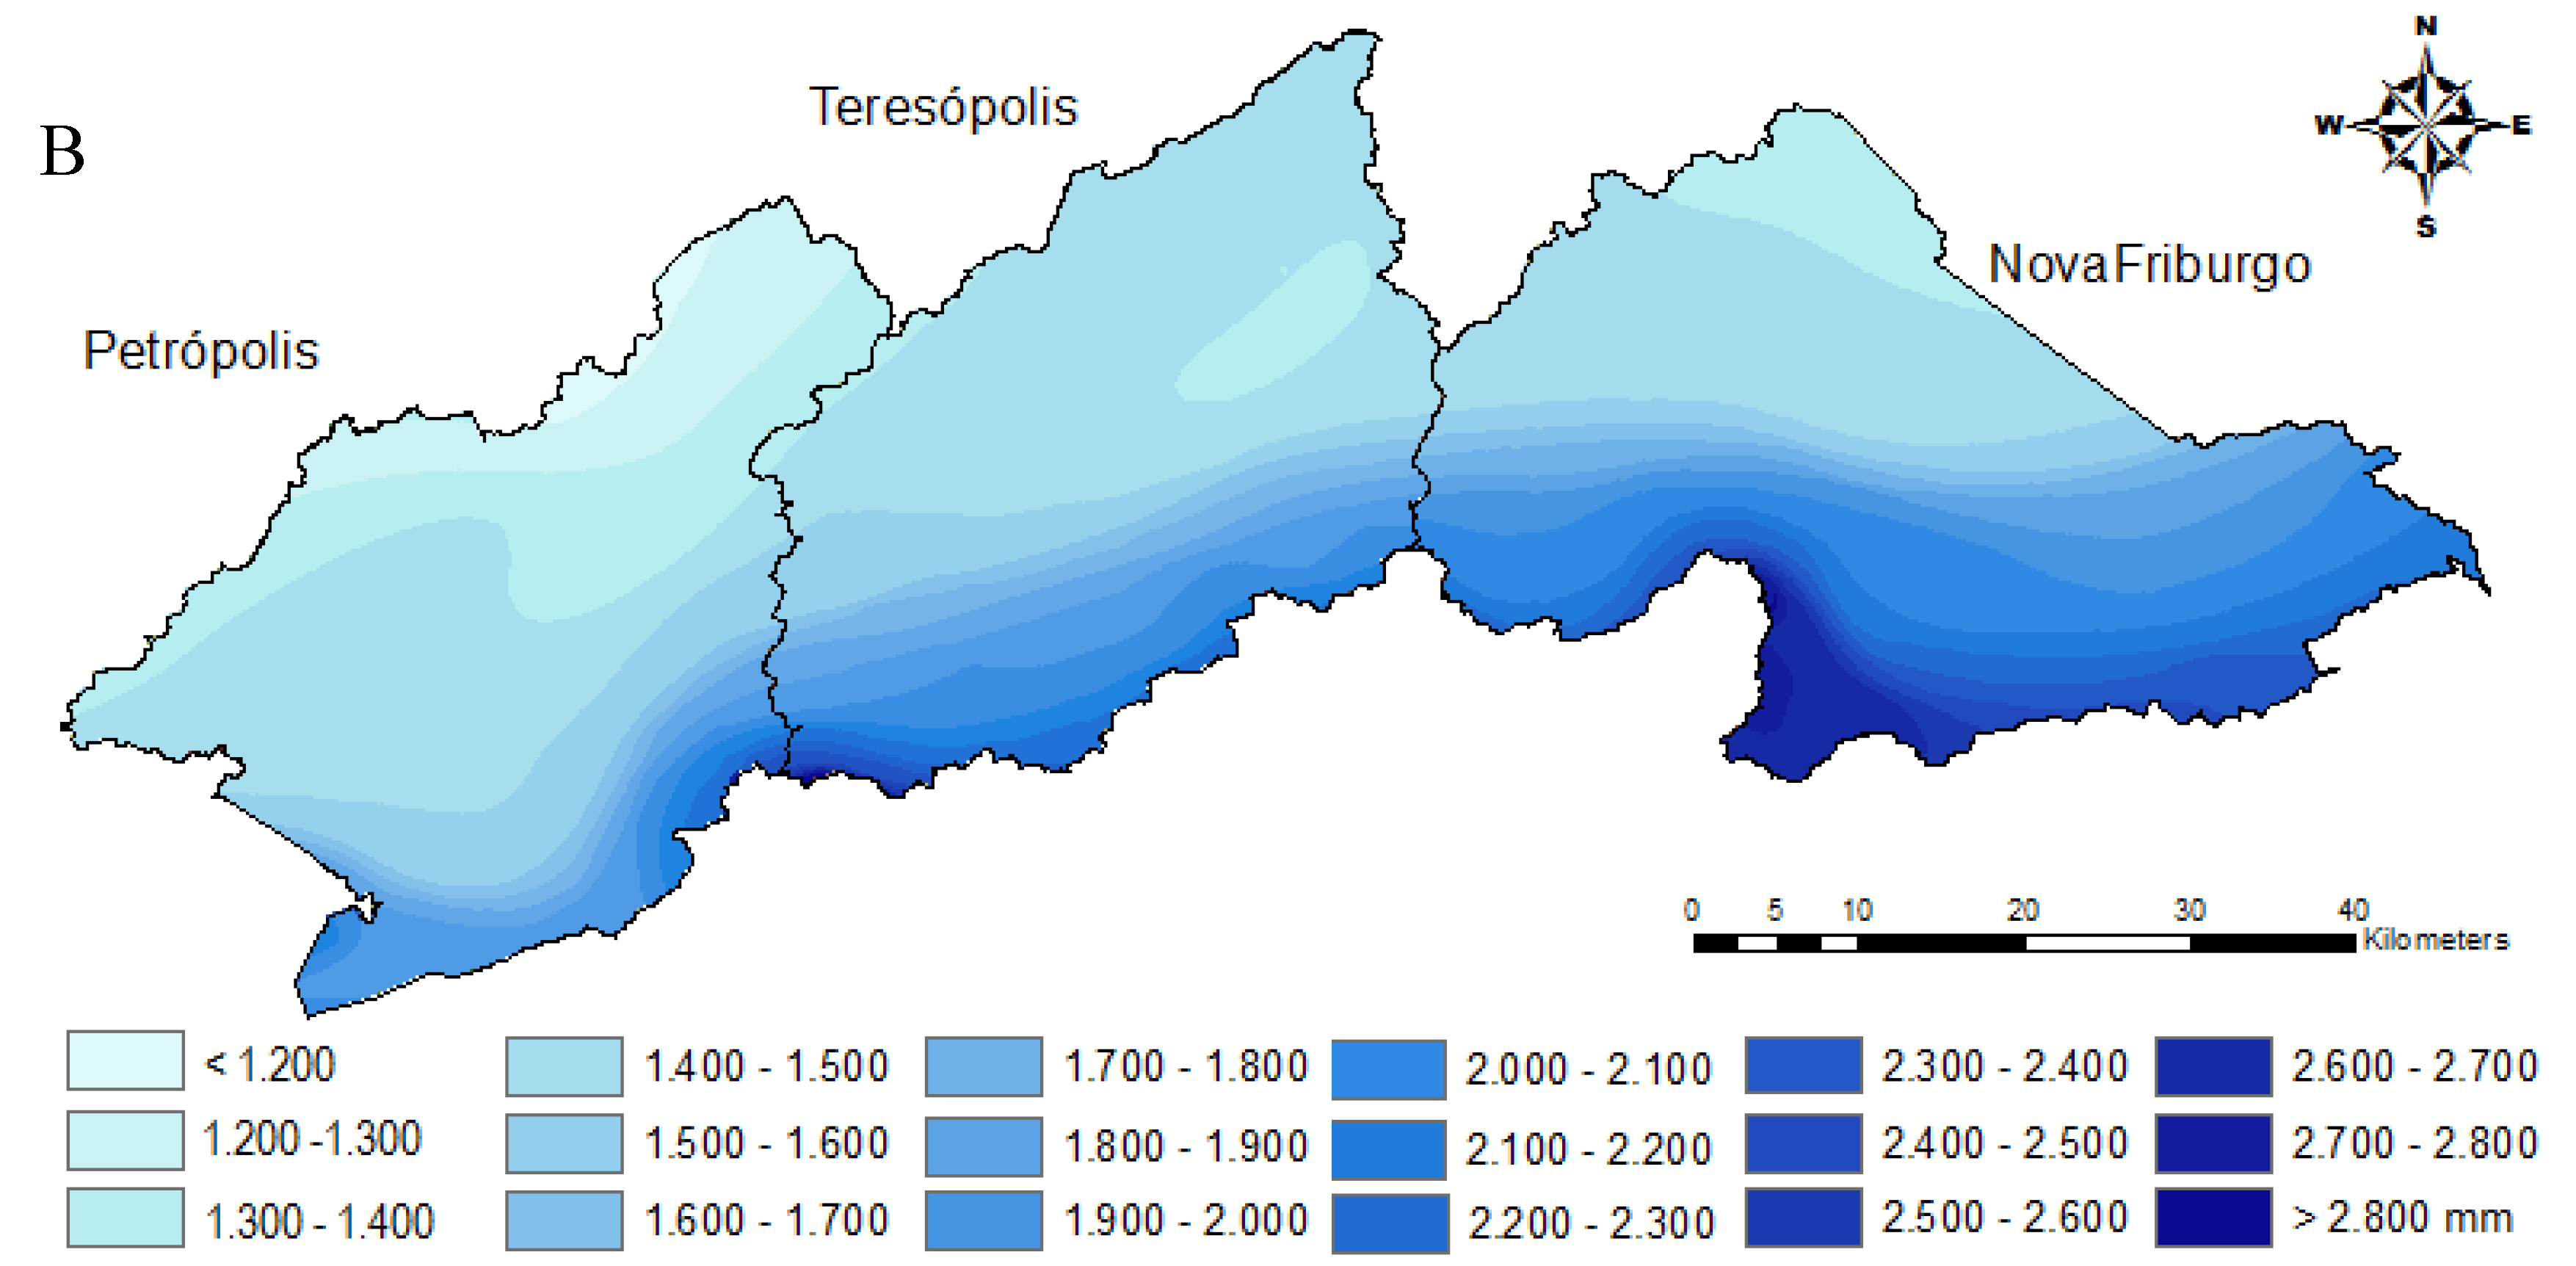
Figure 3. (A) Average monthly rainfall (from 2008 to 2018) for the studied municipalities. (B) Average annual rainfall from 1997 to 2006. Source: http://www.cprm.gov.br/publique/Hidrologia/Mapas-e-Publicacoes/Atlas-Pluviometrico-do-Brasil-1351.html.
Geosciences 09 00203 g003aGeosciences 09 00203 g003b
Figure 4. Landslide distribution and rain gauge positions in the study area.
Geosciences 09 00203 g004
Figure 5. The thresholds for Nova Friburgo municipality. CA = correct alarm, FA = false alarm, MA = missed alarm.
Geosciences 09 00203 g005
Figure 6. The thresholds for Petrópolis municipality. CA = correct alarm, FA = false alarm.
Geosciences 09 00203 g006
Figure 7. The thresholds for Teresópolis municipality. CA = correct alarm, FA = false alarm, MA = missed alarm.
Geosciences 09 00203 g007
Table 1. Human consequences in the 2011 disaster in Rio de Janeiro State, Brazil.
MunicipalityDisplaced PersonsHomeless PeopleDeadsTotal
Nova Friburgo45287894295476
Cordeiro1726-43
Macuco2824-52
Bom Jardim118663221820
São Sebastião do Alto3275-107
Santa Maria Madalena28444-328
Petrópolis6956187717214
São José do Vale do Rio Preto3001742474
Areal-8-8
Teresópolis9110672739216,229
Sumidouro16310922294
Total22,604879591832,317
Source: Data obtained by the Civil Defense of the State of Rio de Janeiro.
Table 2. Thresholds equations and parameters.
MunicipalityAβNo Rain Gap (h)Minimum Rainfall (mm/h)Equation
Nova Friburgo29.98−0.87362029.98D−0.87
Petrópolis17.95−0.68243017.95D−0.68
Teresópolis64.80−0.89243064.8D−0.89
Table 3. Thresholds equations and parameters.
ThresholdEquationCAFAPPV
Nova FriburgomoderateI = 29.98D−0.8769970.42
highI = 64.98D−0.8734280.55
very highI = 101.98D−0.872960.83
PetrópolismoderateI = 17.96D−0.681901580.55
highI = 34.96D−0.6859140.81
very highI = 55.80D−0.682040.83
TeresópolismoderateI = 64.80D−0.8918300.38
highI = 124.00−0.89630.67
very highI = 184.00D−0.89620.75