1. Introduction
The three-dimensional characterization of fracture networks in carbonate successions represents a primary approach to understanding the fluid flow migration processes in these globally important reservoirs. In petroleum exploration, the prediction of subsurface geological features is crucial to reducing the uncertainties by extrapolating unknown information from known data. Reservoir characterization represents a crucial step in a petroleum system analysis including the investigation of the petrophysical properties pattern, mainly related to porosity and permeability, of the potential reservoir units. In such a context, fractures play a primary role, providing discontinuities in the rock mass and having a crucial impact on fluid flow migration processes. The term “fracture” encompasses a broad range of deformation structures, defined as extension or shear fractures, according to their mechanism of deformation. Extension fractures include hydrofractures and tension fractures, also referred to as joints, opening-mode or “Mode I” fractures. Shear fractures are normally referred to as faults. These structures represent some of the most common geological features in the brittle Earth’s crust, occurring at all relevant scales, from the regional scale of a fault system to the micro-scale of a fracture network. The complete understanding of fractures evolution and the prediction of their spatial distribution still represent main scientific challenges. Since they play an important role in many areas of geosciences, facture processes are broadly studied with different methods and approaches. Wellbore and seismic analysis, among the most commonly applied in petroleum industry, although allowing an accurate characterization and mapping of geological structures in the subsurface, show some limitations: the former method is quite restricted in space and number, since well data provide linear information and are relatively expensive; the latter is a very common tool for subsurface structure analysis in exploration industry, but its data resolution is not always adequate for a proper meso-scale fracture analysis. Reservoir analogues can provide an important tool to integrate the abovementioned methods in the analysis of fractured carbonate reservoirs, allowing a detailed observation of some fracture system properties difficult or impossible to be quantified by means of subsurface data [
1,
2,
3]. Although the selected analogue shows similar depositional and geometric features with respect to the subsurface reservoir, the different burial history and boundary conditions, mainly temperature and pressure, need to be taken into account for a proper comparison of information related to the outcropping analogue and the buried reservoir.
The multi-scale approach represents an ideal solution to analyse the fracture system affecting an outcropping succession [
4,
5]. This method enables the definition of the outcrop fracture stratigraphy by identifying potential mechanical barriers or arresting surfaces throughout the analysed beds and by individuating the various fracture sets features at different observation scales [
6,
7], helping to reduce the uncertainties and the sampling errors thereby ensuring an utter definition of the fracture networks architecture [
8,
9,
10,
11,
12,
13,
14]. The results of this type of study are applicable to the characterization of fractured reservoirs not only in a classic petroleum and gas perspective but also for renewable energy sources (RES) such as geothermal fluids and their deep circulation and rising [
15]. The growing interest in RES includes the development of new technologies aimed to help the transition towards a reduction of greenhouse gas emissions and decarbonization of energy production. This is strongly supported by the European Union which has stimulated ambitious research programs in this direction (see Horizon 2020 Work Plans and SET plan, in particular).
In this study, multi-scale fracture modelling was performed after data collection at two different observation scales: (i) at the meso-scale (i.e., at the scale of field scan lines) with the scan line method and (ii) at the macro-scale (i.e., related to fractures taller than 5 m) by means of digital line-drawing. The analysed beds, belonging to the Upper Triassic–Lower Jurassic Kurra Chine, Sarki and Sehkaniyan Fms., are well exposed in the Lurestan region, NW Iran, and include the local petroleum plays reservoir units. The analysed Triassic–Jurassic succession represents an outcropping analogue to reservoir rocks of important oil fields discovered in the nearby Iraqi Kurdistan region of the Zagros mountain belt [
16]. The scan lines were performed on seven beds for a total length of approximately 19 m along the outcrop surfaces, focussing on the background fractures and, therefore, located away from major fault zones. Fracture arrays, ranging from a few millimetres to tens of centimetres of size, were measured analysing orientation (azimuth and dip), aperture (mm), height (cm), distance from the origin (cm), morphology, filling material, and crosscutting relationships. Among the several criteria for fractures classification, the relationship between fracture height and bed thickness allows one to define stratabound and non-stratabound fractures. The former are bed confined, abutting against the bedding surfaces, whereas the latter can either span across the bed, terminate within it or against other fractures. As defined by several studies [
9,
17,
18,
19,
20,
21,
22,
23,
24,
25,
26,
27,
28], stratabound fractures show a regular mean spacing, linearly related with mechanical layer thickness when fracture saturation conditions are met [
17], whereas this is not observed for non-stratabound fracture sets. The propagation of fractures through the layers is influenced by the rock’s mechanical properties, of which the spatial distribution defines the outcrop’s mechanical stratigraphy [
29]. This latter individuates different mechanical units or intervals, defined by the occurrence of a regular mechanical behaviour in a bed package, showing homogeneous response to an applied force [
18,
19,
30]. The mechanical boundaries can be provided by lithologic contacts or, in some cases, by pre-existing fractures dividing, therefore, the rock mass into different mechanical units [
18].
The macro-scale survey was focused on throughgoing fractures which have dimensions of tens of meters. As these crosscut several beds, they play an essential role in the linkage of the different fracture systems at the reservoir scale providing an important contribution to the rock permeability [
31]. They are interpreted to develop from a series of vertically aligned sub-parallel systematic fractures that, crosscutting many beds, may form a multilayer brittle structure [
32]. These earlier fractures may be reactivated and joined with each other by coalescence or through the generation of new fractures that accommodate the linkage of fractures, forming a zigzag structure [
31].
Following data sampling, fracture network modelling was performed by using the “Fracture Modelling” module in Move 2017 software. The produced models, based on the multi-scale surveys dataset, showed the petrophysical properties distribution of the analysed formation throughout the model, allowing to estimate their quality as reservoir units.
2. Geological Setting
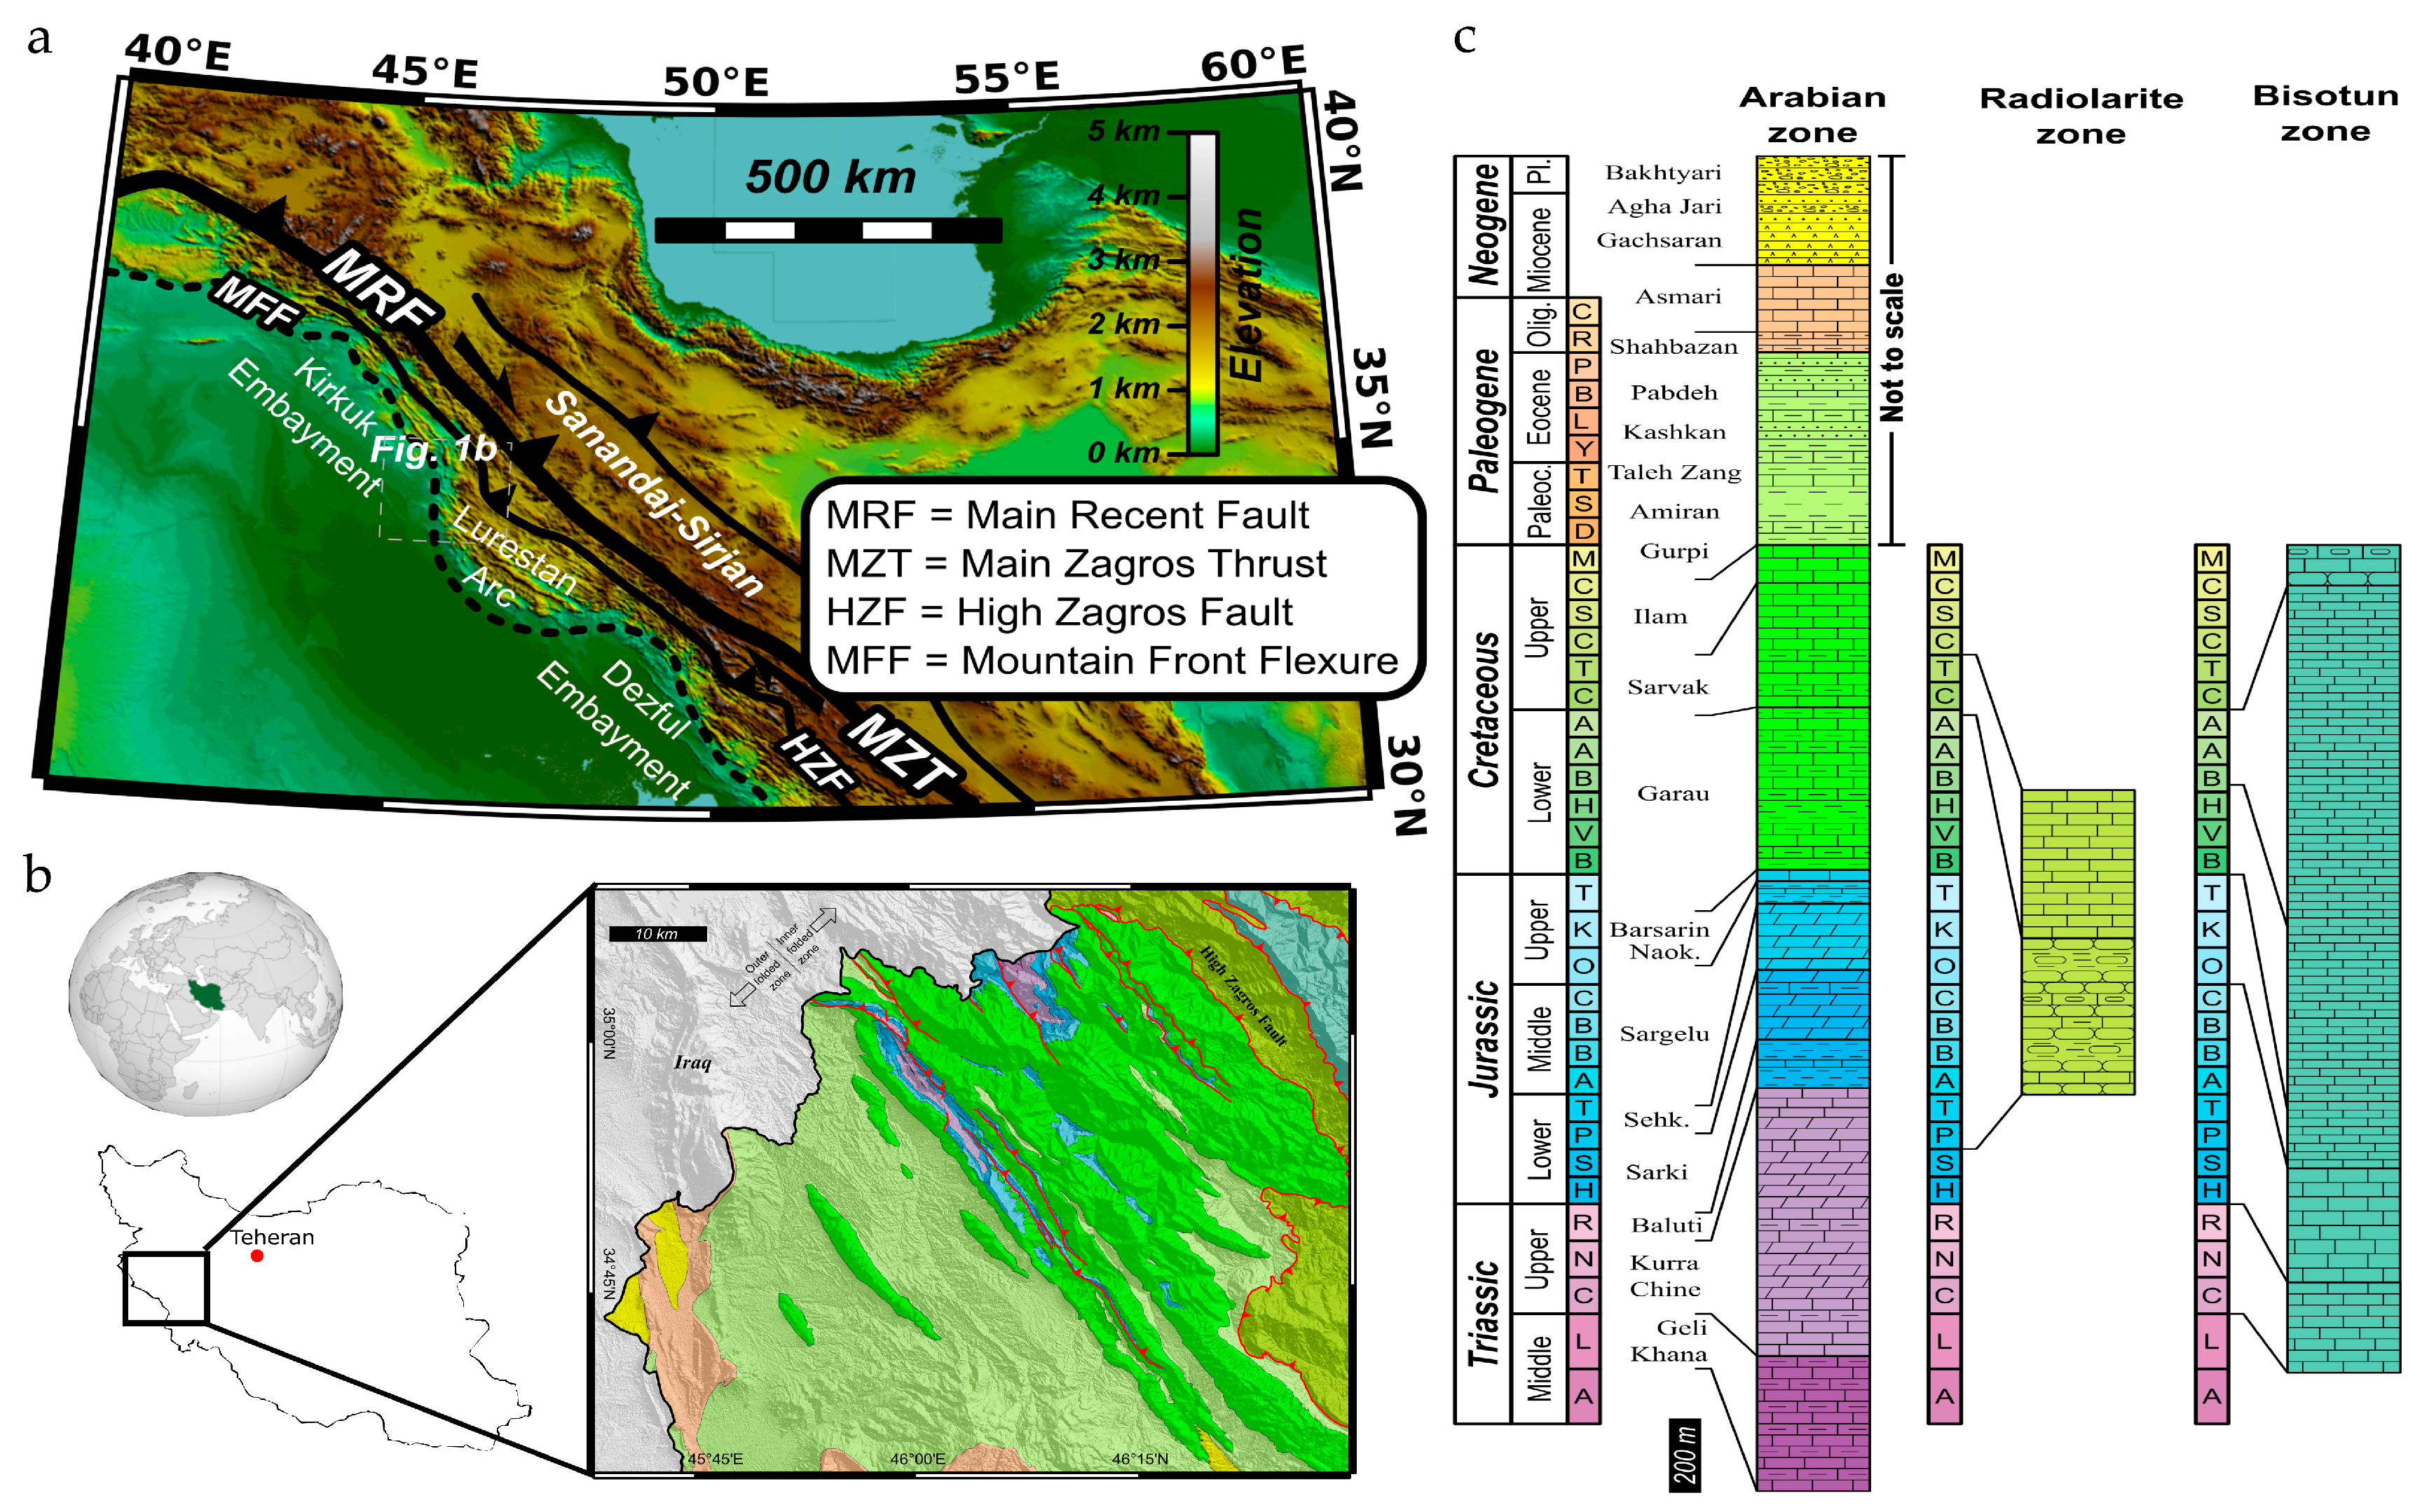
The Zagros belt (
Figure 1a) forms part of the Alpine–Himalayan orogenic system. It formed in Late Cretaceous to Cenozoic times, following the continental collision between the Arabian and the Eurasian plates which produced the closure of the Neo-Tethys Ocean [
33,
34,
35,
36,
37,
38,
39,
40,
41]. The architecture of this NW–SE elongated belt is strongly controlled by different kinds of sedimentary and structural inheritances. As a result, there is a frequent occurrence of (i) lateral facies changes, with consequent lateral variations of the mechanical layers properties, and (ii) pre-Cambrian to Mesozoic faults formed within the Arabian plate [
36,
42,
43,
44,
45,
46,
47,
48,
49,
50].
The Zagros belt is currently undergoing N–S oblique shortening [
51]. This is partitioned into NE–SW shortening, accommodated by NW–SE striking thrusts and folds, and right-lateral strike-slip along NW–SE striking faults located in the NE boundary of the belt (
Figure 1a) [
51,
52,
53,
54]. Folds and thrusts of the Lurestan region are generally NW–SE striking and SW-verging, turning to NNW–SSE, and E–W striking at the northwestern and southeastern boundary of the Lurestan arc, respectively [
55]. The deep structure of the area is characterized by crustal-scale reverse faults, many of which reactivated inherited normal faults, with partial decoupling between the Precambrian basement and the overlying sedimentary succession [
56,
57].
In detail, the belt is bounded to the NE by the Main Recent Fault and by the Main Zagros Fault (
Figure 1a). This transpressive suture separates the terrains of the former Arabian margin to the SW from those of the Sanandaj-Sirian block to the NE [
49,
51,
58,
59,
60]. Furthermore, to the SW of the suture zone, the NW–SE striking High Zagros Fault separates the Imbricate Zone, to the NE, from the Folded Belt, to the SW [
51,
56,
61]. The former is characterized by intensely folded and faulted units, whereas the latter is separated from its foreland basin by the Mountain Front Flexure [
62]. This flexure, showing a sinusoidal trace, represents a topographic step and defines embayments and salients along the strike of the fold and thrust belt.
The study area is located in the NW part of the Lurestan arc, which represents a salient bounded by the Kirkuk and the Dezful embayments to the NW and the SE, respectively. Three tectonic complexes, belonging to three different Mesozoic domains, are defined by two main tectonic contacts occurring in the northern portion of the study area (
Figure 1b) [
63,
64]: the (i) Arabian, (ii) Radiolarite, and (iii) Bisotun units [
61]. The Arabian complex represents the structurally lowermost tectonic unit including rocks of the former inner portion of the Arabian passive margin. On its top, the Radiolarite nappe is formed by Mesozoic sedimentary rocks and subordinate basalts originally hosted within the Radiolarite Basin [
65,
66,
67]. To the NE, the Radiolarite nappe is overthrust by the Mesozoic carbonates of the Bisotun unit [
68,
69]. Thrusts and folds of the area are mainly NW–SE striking, becoming NNW–SSE striking close to the Mountain Front Flexure. The High Zagros Fault includes two NW–SE striking segments, linked by an N–S striking bend, and represents the largest thrust of the area. To the SW of this fault zone, the sedimentary succession of the proximal part of the Arabian margin is exposed. Triassic to Cretaceous rocks crop out in the inner folded belt zone, which is uplifted by at least 2 km with respect to the outer folded belt zone, where only Upper Cretaceous to Cenozoic rocks are exposed [
57,
61,
64]. The Mesozoic successions of the two zones are similar, except for the Lower Cretaceous portion, represented by the Garau Fm., which shows remarkable thickness variations [
63].
The Lurestan Province in Iran is one of the few places of the Zagros mountain belt where Triassic and Jurassic rocks are largely exposed. The Middle Triassic (Anisian-Ladinian) Geli Khana Fm. represents the oldest exposed rocks. It consists of thin-bedded limestones, calcareous shales, and dolomites deposited in an epeiric carbonate platform environment. The Geli Khana Fm. is overlain by the Upper Triassic Kurra Chine Fm. which is mainly made of thick-bedded dolostones and limestones with some thin-bedded marly intervals. On top of this formation, the Norian-Rhaetian Baluti Shales Fm. consists mainly of shales, with thin intercalations of dolomitic limestones. It is overlain by the Upper Triassic–Lower Jurassic Sarki Fm. and by the Upper Pliensbachian-Toarcian Sehkaniyan Fm. Above this latter, the Toarcian-Collovian Sargelu Fm. is characterised by a recurring alternation of shales, marls, and marly limestones and is capped by the Upper Jurassic Naokelekan and Barsarin Fms., which comprise thin-bedded limestones, shales, and evaporites. On top of the Barsarin Fm. the Lower Cretaceous Garau Fm. is made of deep-water marls, shales, and limestones. It is overlain by the Upper Cretaceous Sarvak and Ilam Fms., which, in the Lurestan region, consist mainly of well-bedded pelagic limestones [
70,
71]. On top, a Maastrichtian to Eocene succession, evolving from deep-marine marls and limestones to a prograding wedge of deep-marine to continental clastic sediments, is represented by the Gurpi, Amiran, Taleh Zang, Kashkan and Pabdeh Fms. [
44,
61,
72,
73]. This first foredeep infill, developed following the Late Cretaceous closure of the Neo-Tethys Ocean, is overlain by the post-orogenic Shahbazan and Asmari Fms., consisting of Oligocene to lower Miocene shallow-water carbonates covered by the Lower Miocene evaporites of the Gachsaran Fm. A shortening pulse controlled the deposition of a late Miocene foreland basin infill, represented by the Agha Jari and the Bakhtyari Fms. [
44,
72,
74].
Outcrop-scale, shortening-related structures include dominantly NW–SE trending minor folds, pressure-solution cleavage surfaces and reverse faults. Outcrop-scale extensional structures, including joints, veins, and normal faults are also very common. Tavani et al. [
75] inferred that the development of such extensional structures in the Lurestan region was controlled by: (i) NE–SW-directed extension during both Early Jurassic rifting and early orogenic foreland extension; and (ii) WSW–ENE-directed stretching caused by differential compaction and related subsidence above NNW–SSE-elongated basement structures during tectonically quiescent periods. The latter authors discussed in detail the geometric arrangement and origin of the fracture sets that are analysed in this study.
3. Fracture Sampling
In order to analyse the architecture of the fracture network affecting the studied succession, statistical sampling was carried out with a multi-scale approach, gathering data at two different observation scales: at the macro-scale, with a digital line-drawing based on image acquisition by means of a camera and at the meso-scale, with the scan line method, recording fracture characteristics intersecting a given bed-parallel line along the outcrop surface.
As broadly discussed in the literature [
9,
10,
12,
76], a multi-scale approach can minimize the occurrence of biases related to a statistical DFN analysis. These uncertainties derive from artefacts of various nature and origin [
77]. For instance, the truncation error concerns small fractures, which, in some cases, depending on the limit of resolution of the observation tool, cannot be reliably measured. Therefore, fracture intensity estimates can be strictly dependent on the detecting instrument sensitivity such as naked eye, camera, hand lens, optical microscope and, thus, on the smallest fracture size measured. This error can be minimized by fixing a fracture-detection threshold size for fractures measurements [
12]. On the other hand, statistical sampling of large fractures can be affected by censoring artefacts. These occur because large fractures are typically characterized by higher spacing values influencing sampling probabilities and, consequently, require very long scan lines to collect an adequate number of fractures for a meaningful statistical sampling and, therefore, to avoid data undersampling [
78]. To bypass both errors and reduce uncertainties, a multi-scale approach is essential [
12]. In this work, a logarithmically graduated comparator, as described in Ortega et al. [
12], was used, along with a hand lens, to collect aperture measurements. In order to ensure an equal comparison of fracture intensities from different datasets, a common fracture-detection threshold was established at 0.2 mm for scan line sampling.
The data collected by means of these multi-scale surveys provided the input data needed to simulate the stochastic distribution of fractures sets in the DFN model for the analysed main reservoir units represented by the Kurra Chine, Sarki and Sehkaniyan Fms.
3.1. Large-Scale Analysis
A large-scale survey was carried out by means of the digital line-drawing of bedding surfaces and fractures, enabling the definition of the outcrops fracture stratigraphy, defined as the subdivision of the analysed outcrop based upon the observed fracture attributes variations [
29]. Data gathering was focussed on the so-called throughgoing fractures which can reach tens of meters of height, playing a crucial role in fluid flow processes in a fractured carbonate reservoir, by linking together different fracture systems, otherwise isolated to each other and guaranteeing the vertical linkage of the network [
79,
80]. In this contest, primary heterogeneities provided by bed interfaces can, potentially, act as mechanical boundaries, inhibiting the vertical propagation and forming mechanical units at different scales [
81]. Therefore, the definition of a detailed fracture stratigraphy relative to these seismic-scale structures (i.e., detectable at the seismic analysis resolution) can be fundamental to analysing the throughgoing fractures pattern and to individuate potential mechanical barriers.
The outcrop structural investigation at the macro-scale was based on camera-acquired images. The acquisition of images was limited by the paucity of proper observation points, restricting the field of view of certain studied outcrops. The study area is, in fact, located in an arduous area, characterized by large height differences and intense vegetation in a military-controlled area at the Iranian border with the Iraqi Kurdistan. The scarce angle of views with respect to outcrops is probably the most limiting factor of this survey. In fact, different angles of view can allow the creation of virtual outcrop models (VOMs), which are 3D digital reconstructions of outcrop topographies that allow the orthorectification of the outcrops with respect to the orientation of a cluster of fractures [
32]. Due to the impact of the large-scale fractures on the reservoir vertical connectivity, in this study, we focused on the digitization of several meters-long throughgoing fractures, by fixing a fracture-detection threshold at 5 meters of height. In a few instances, the occurrence of high-angle incipient faults was neglected, since the small displacements (less than 1 m) were below the analysis resolution. Also, the bedding surfaces were digitized to highlight potential mechanical barriers. Bedding-parallel digital scan lines were then performed based upon the resulting interpretations. Reference data concerning the macro-scale survey are presented in
Table 1.
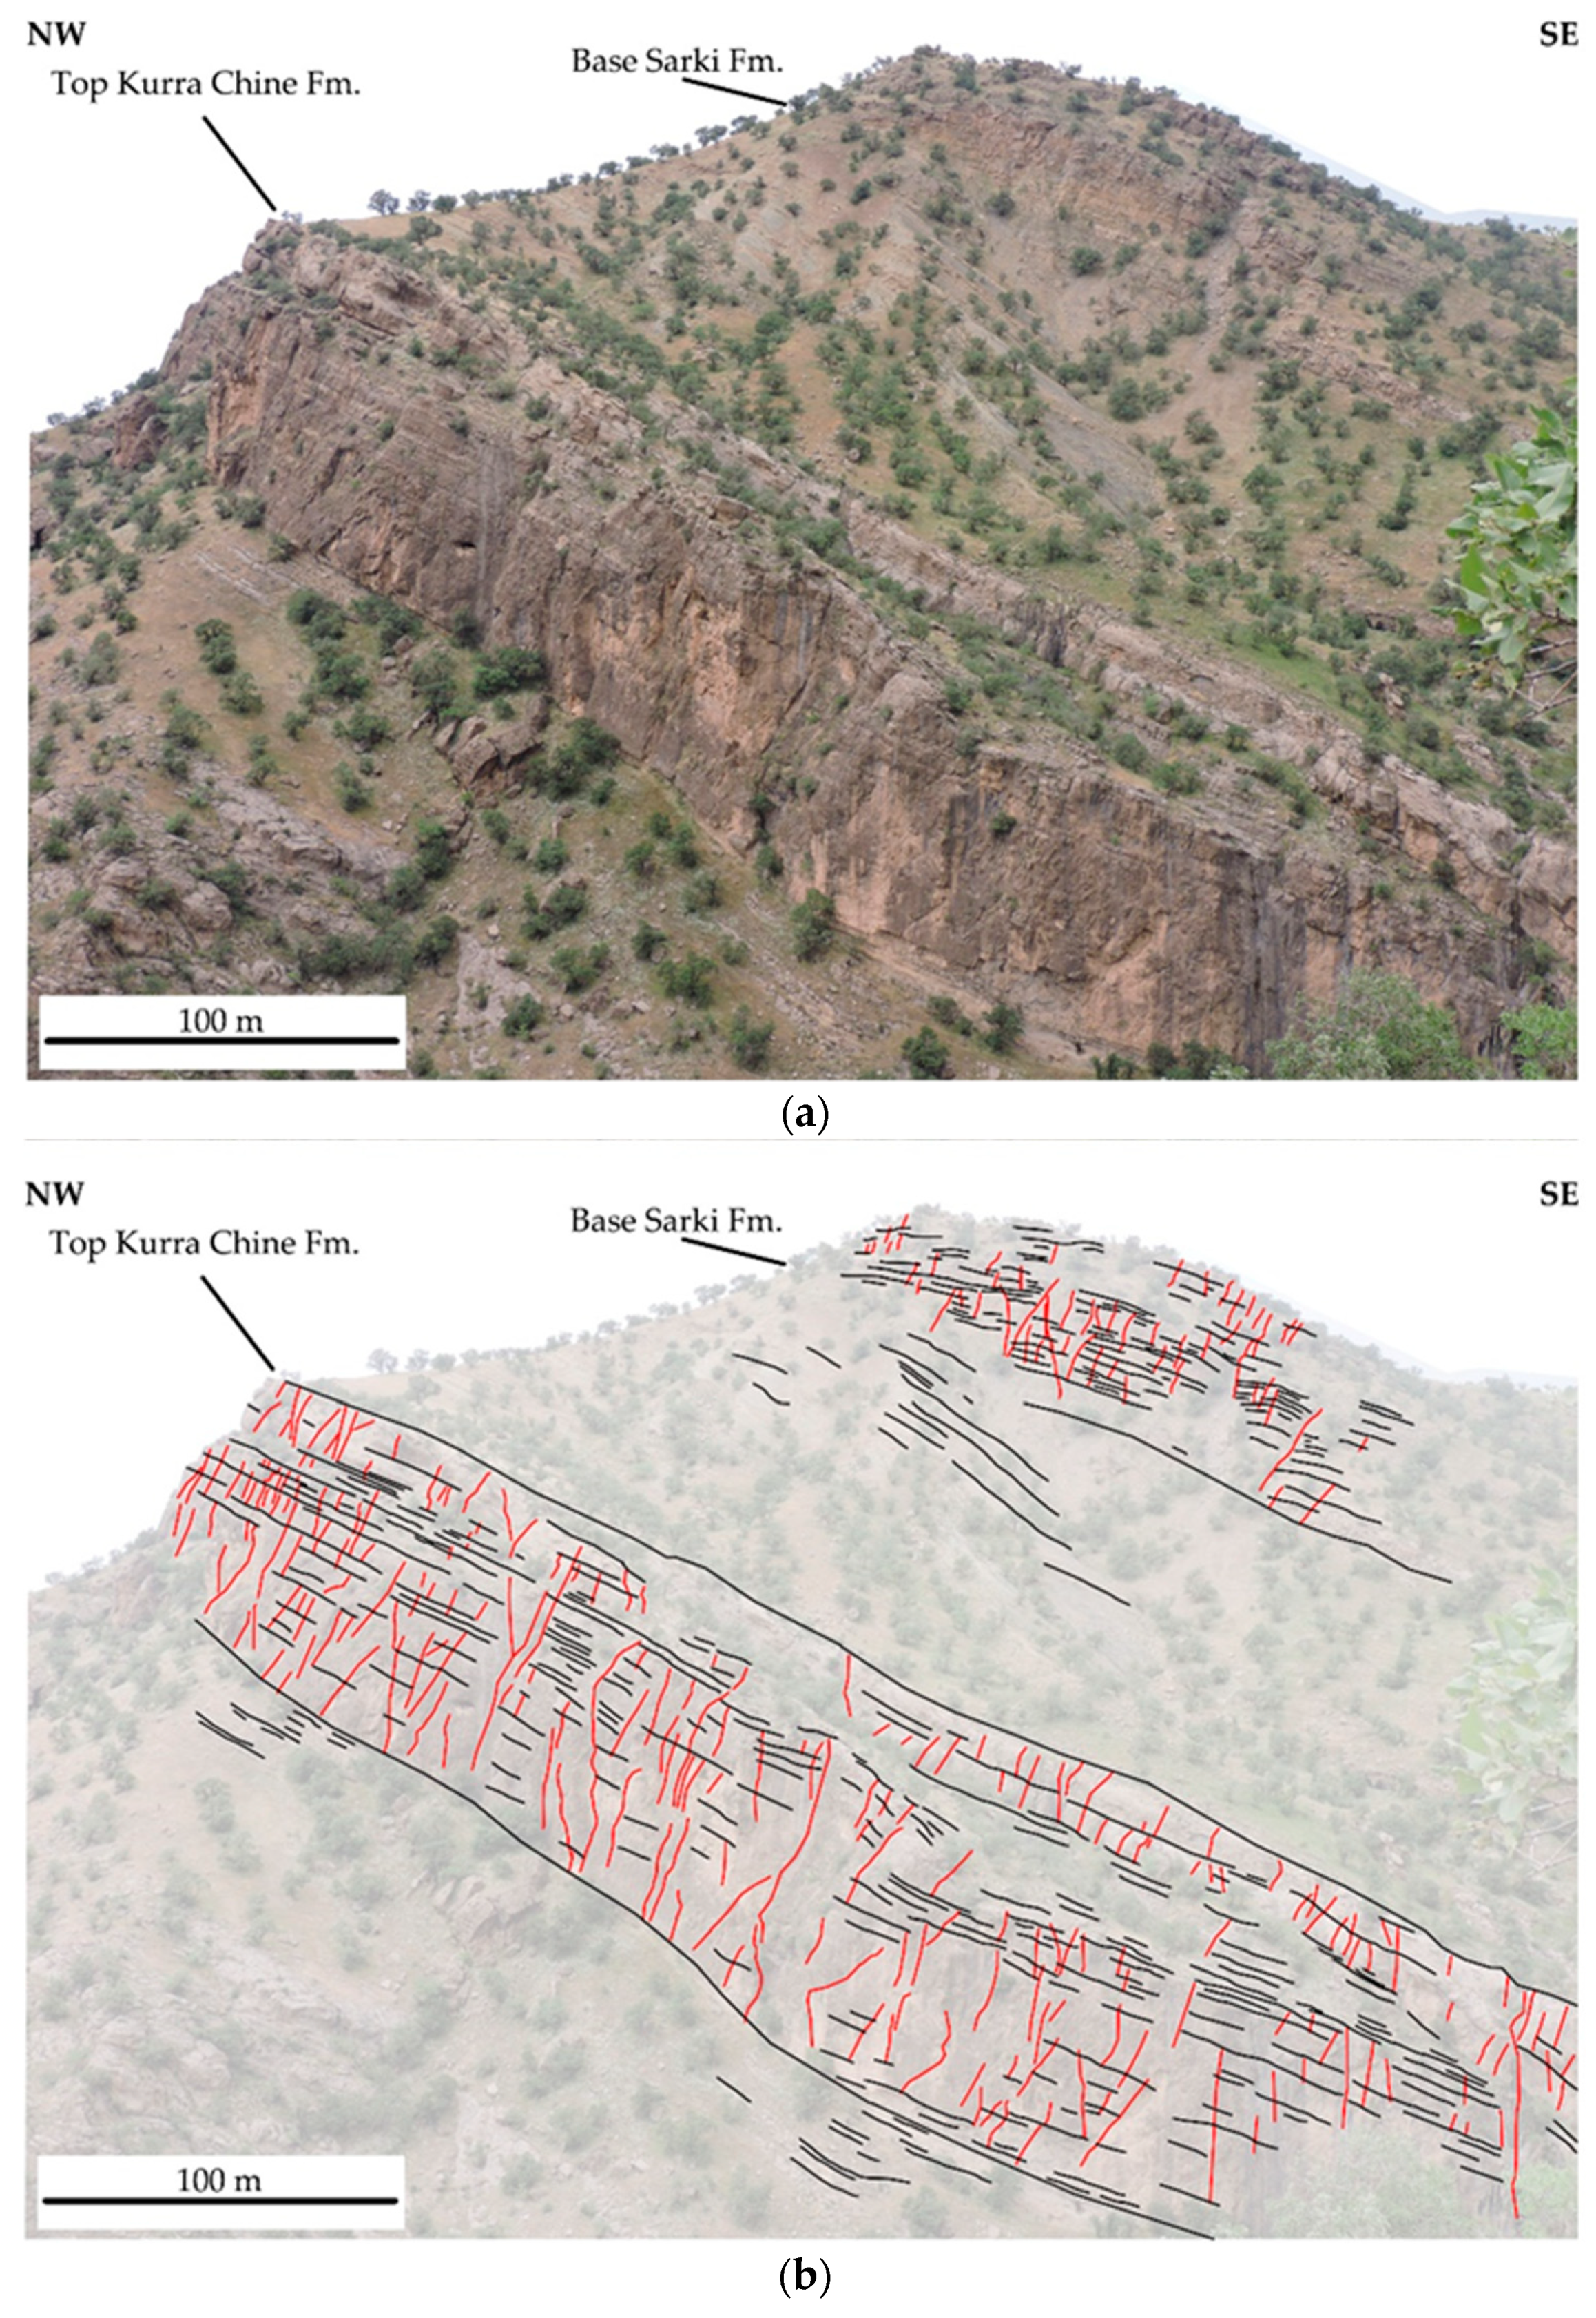
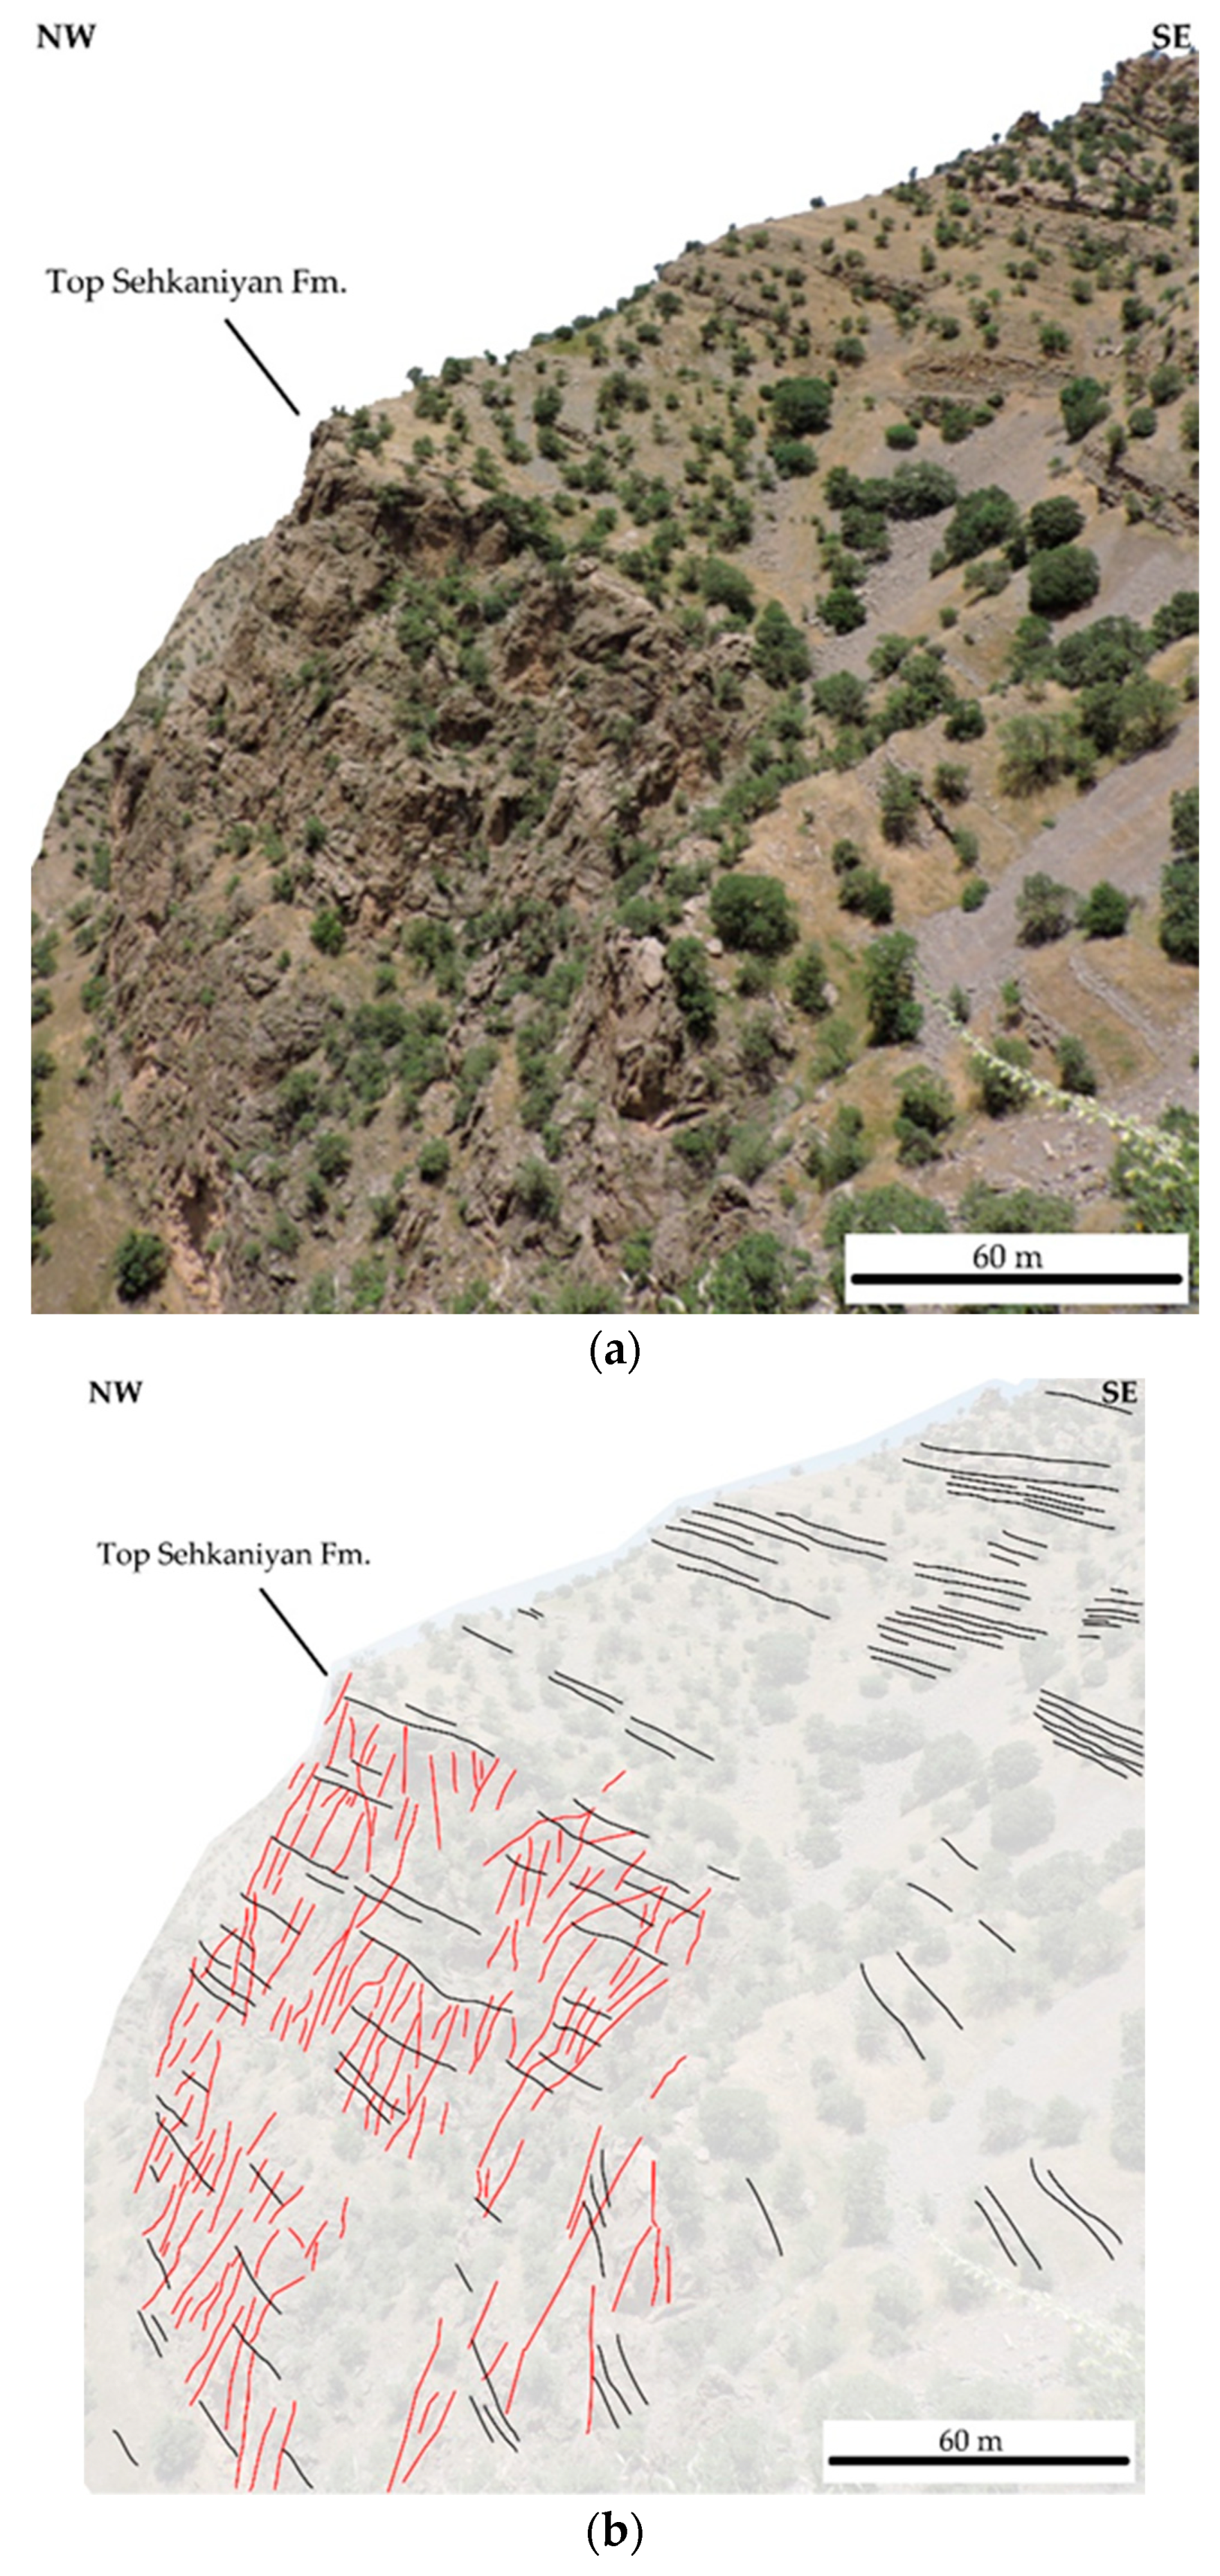
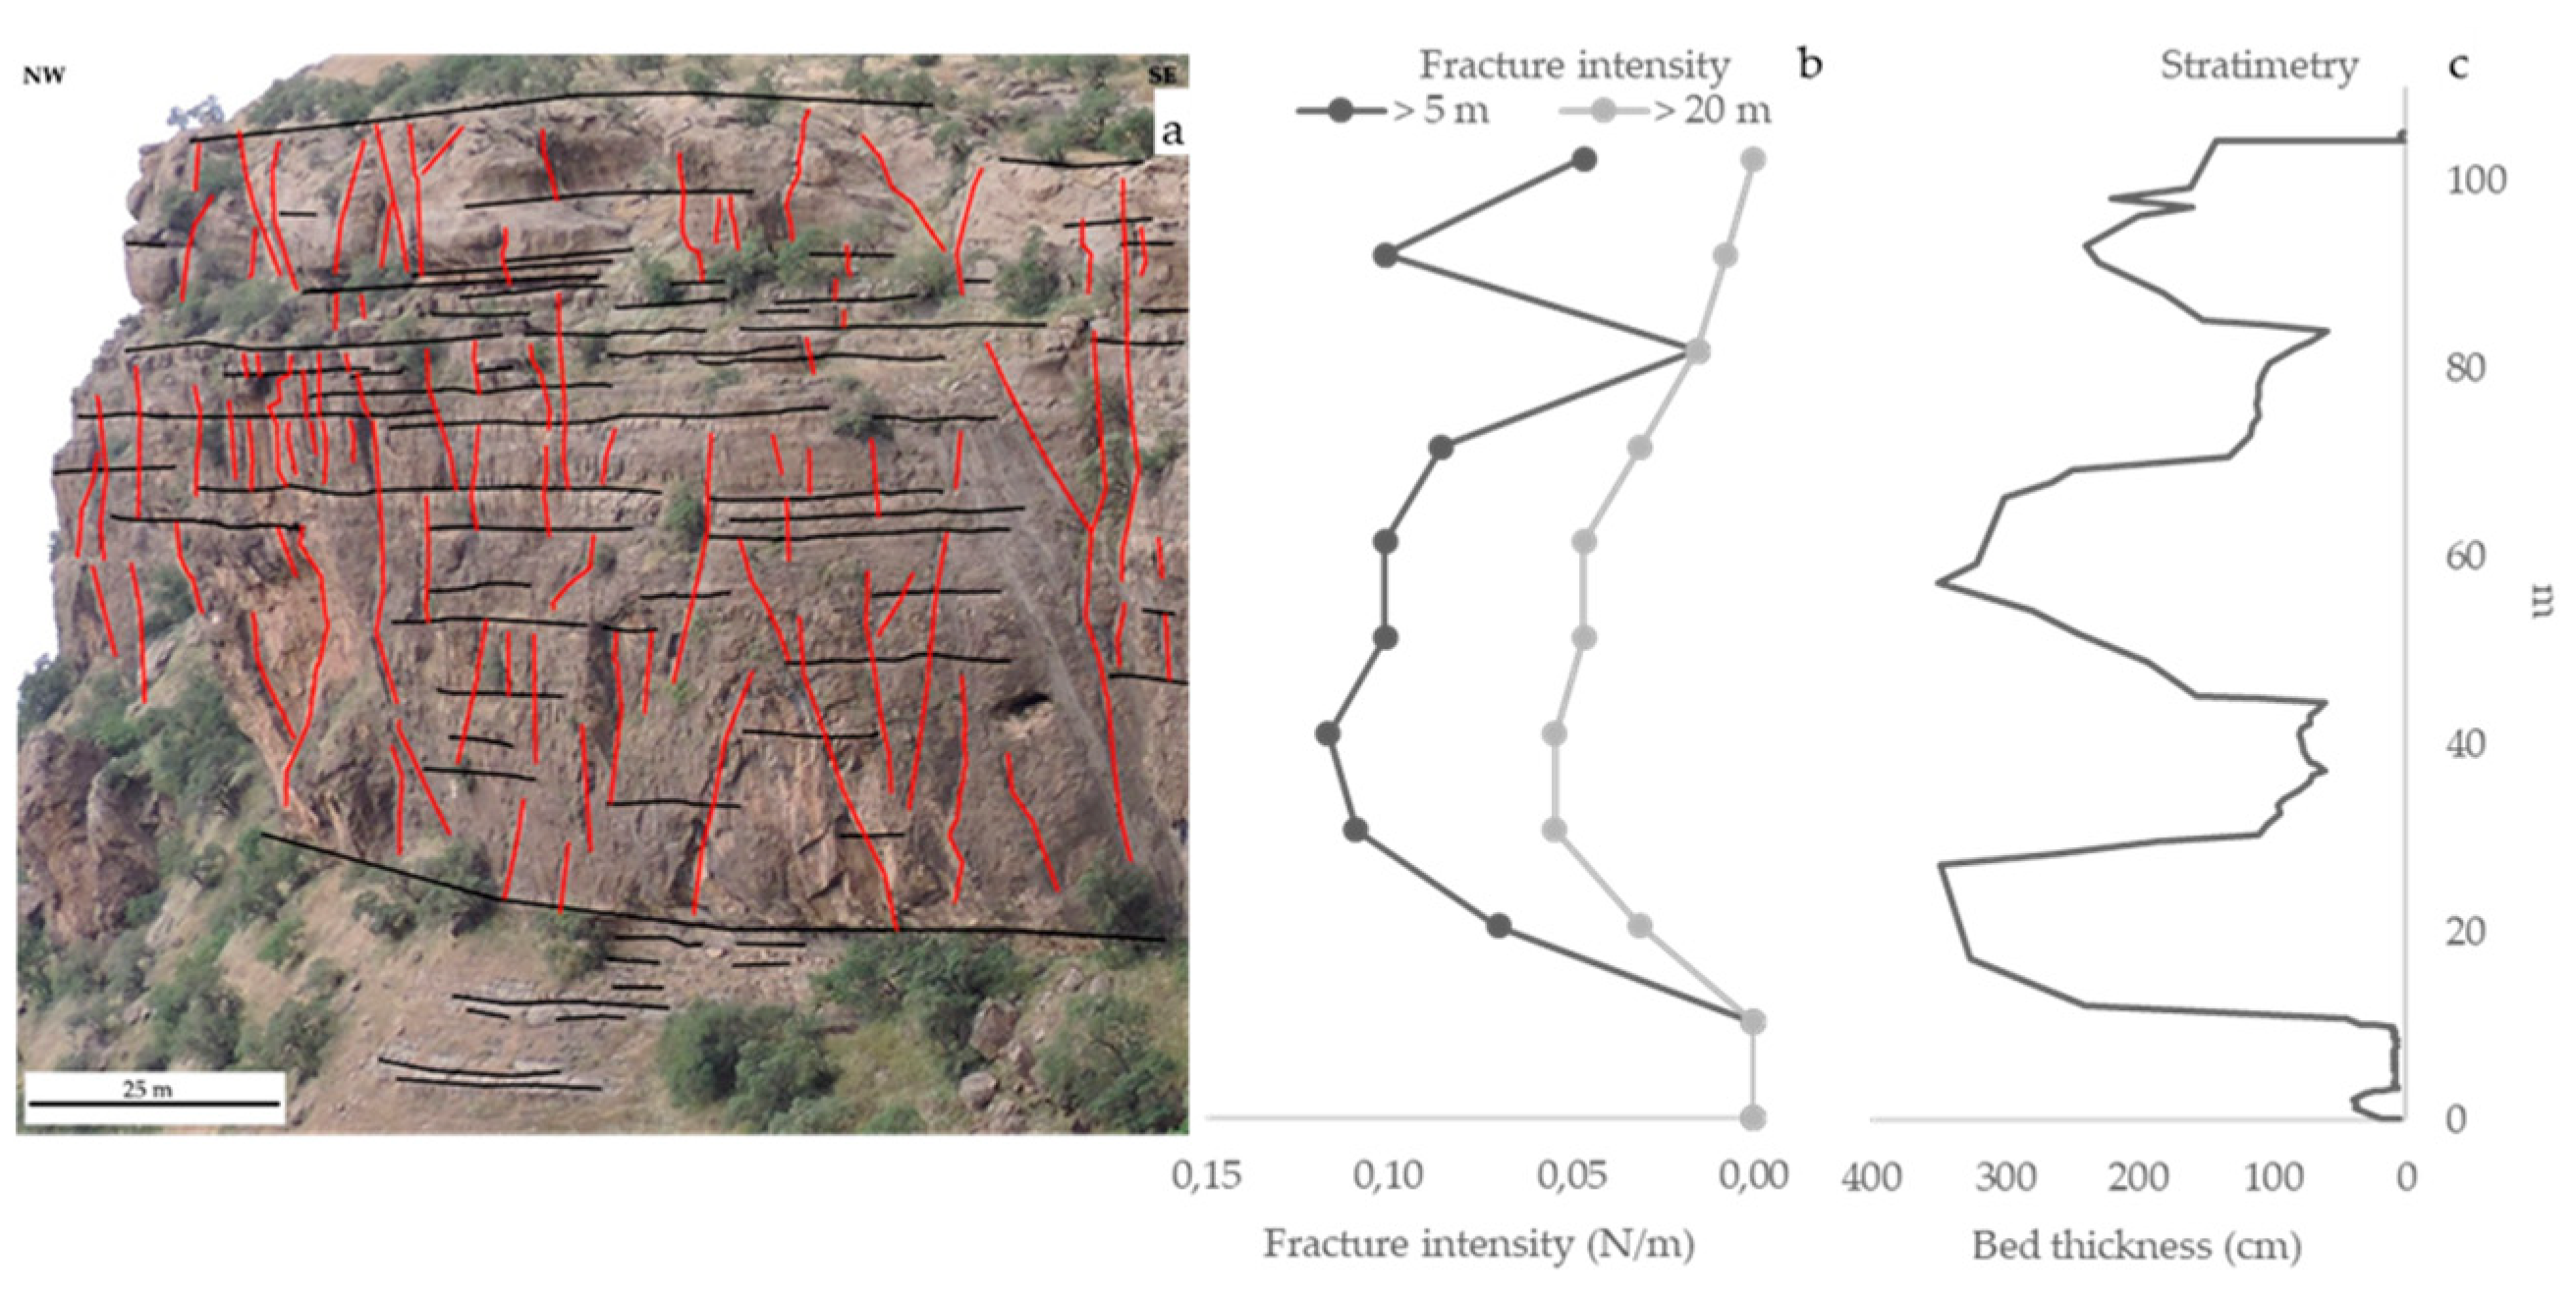
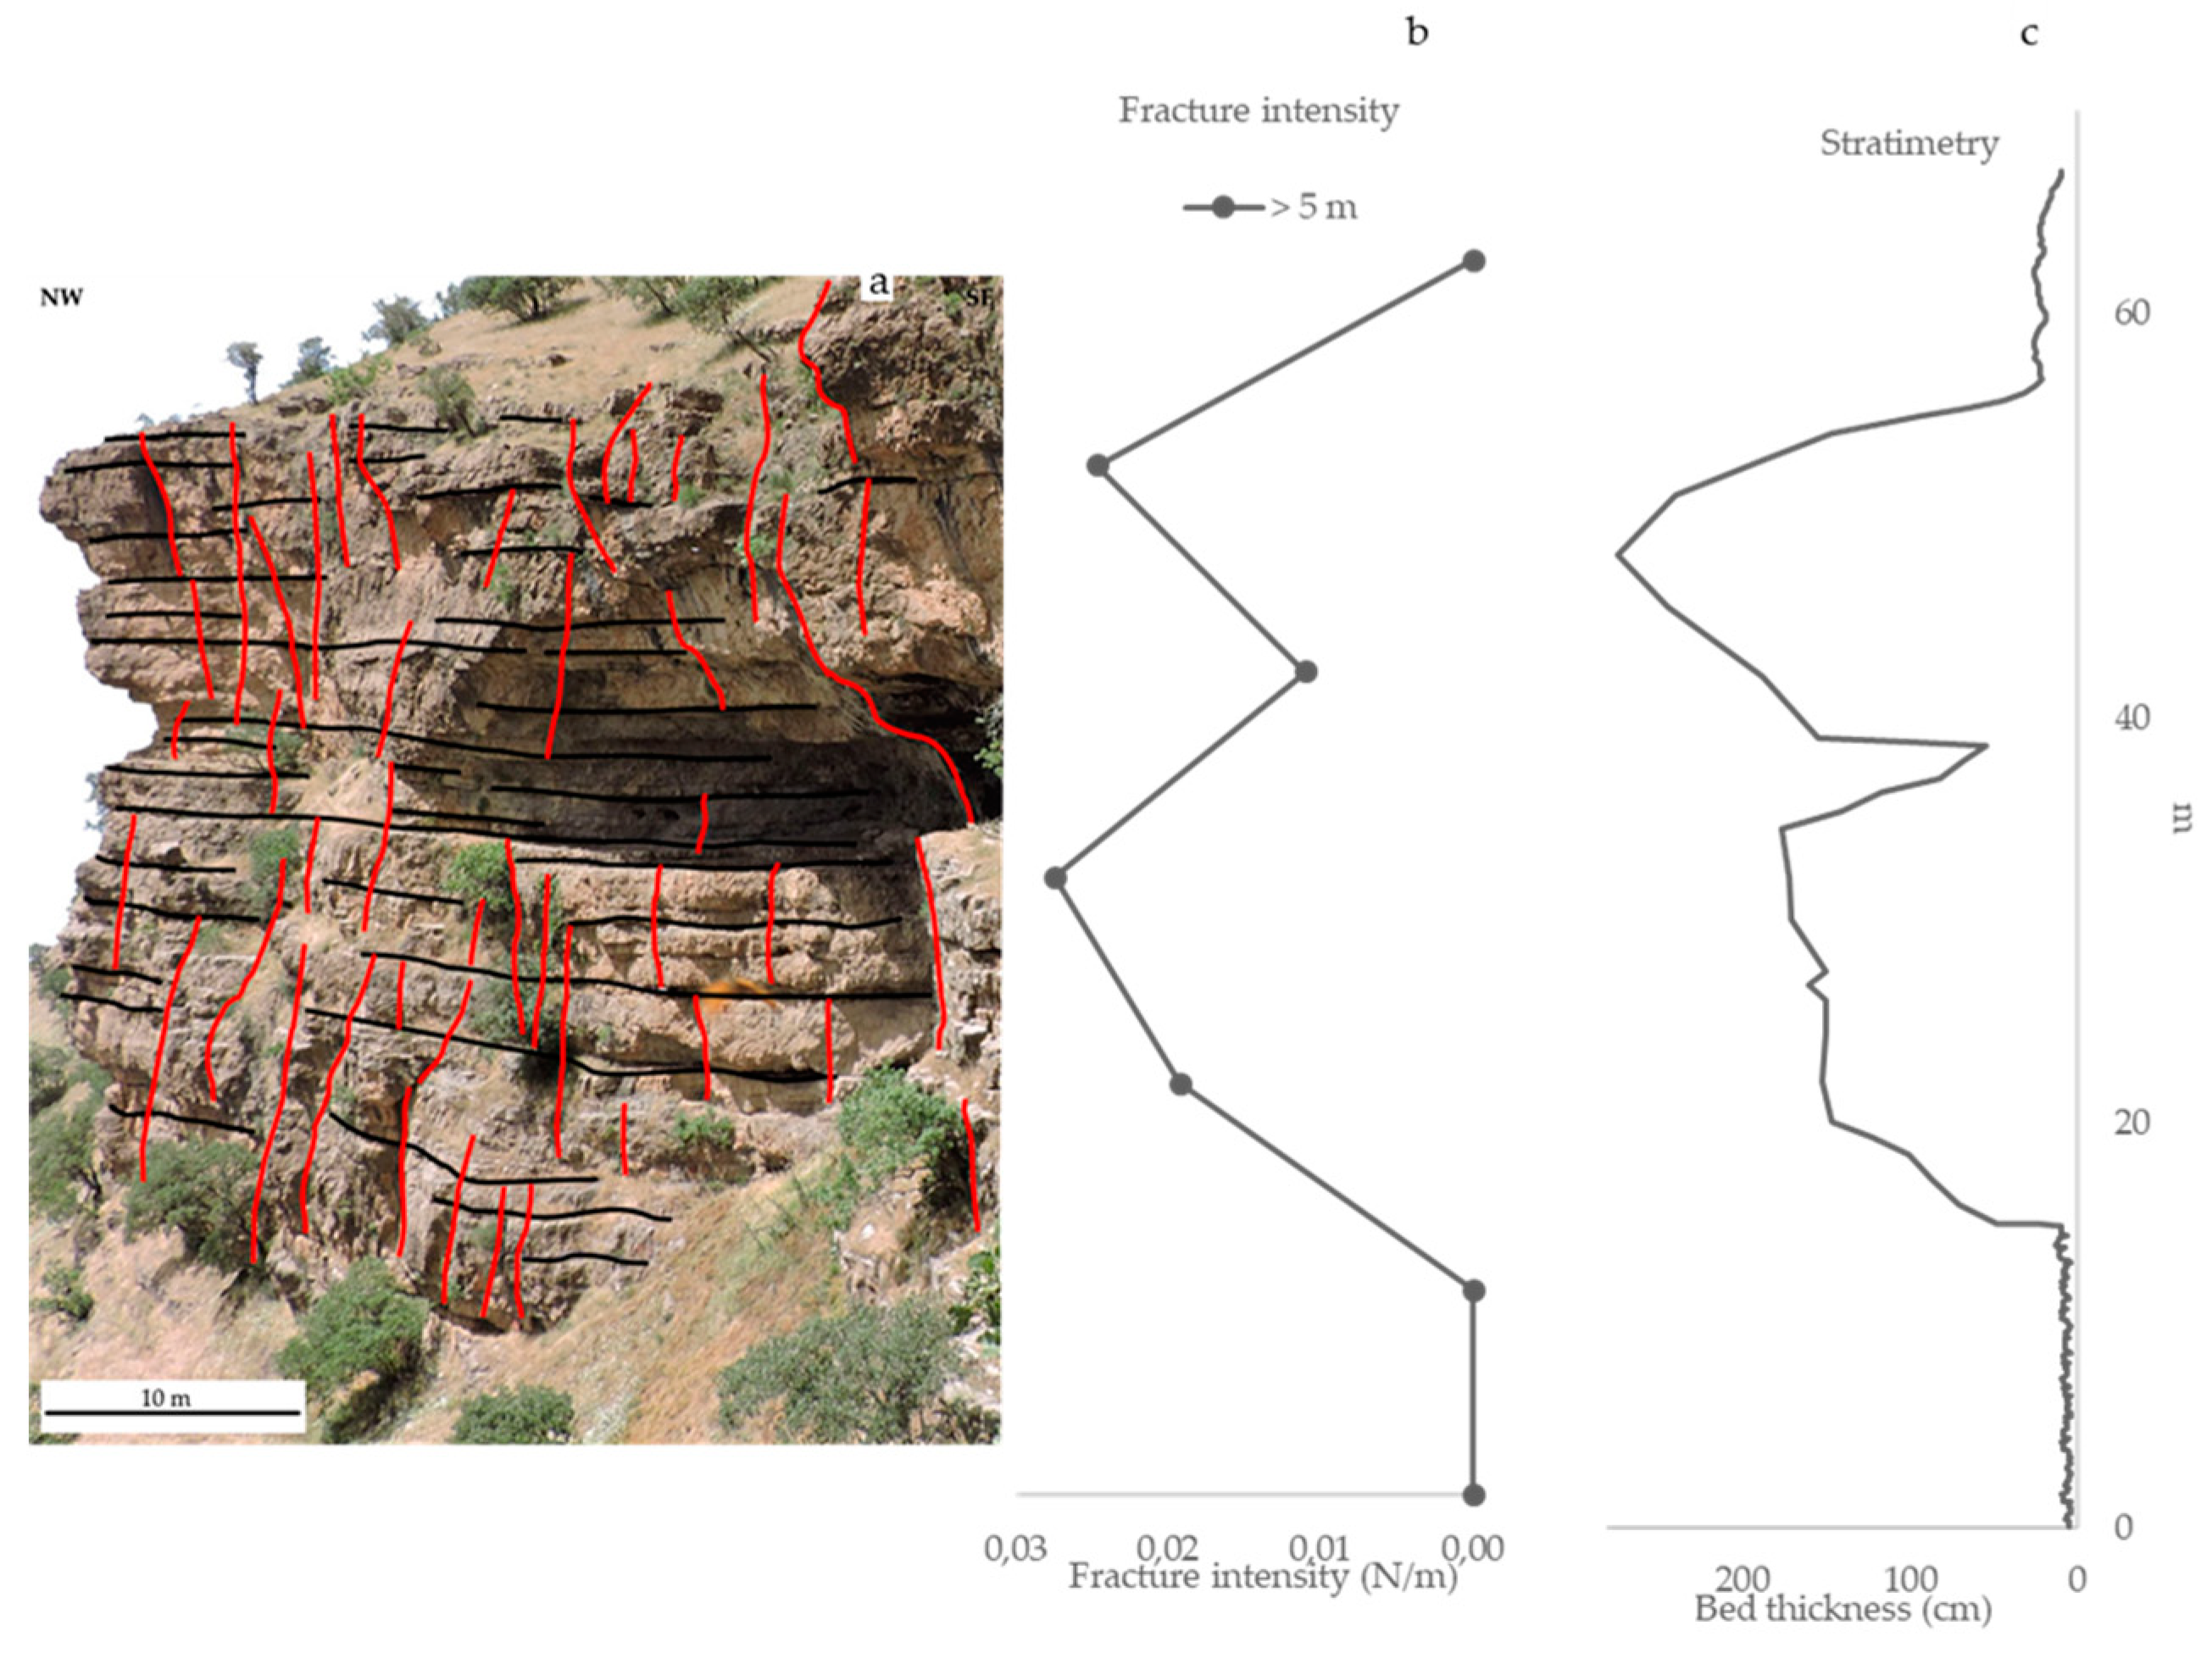
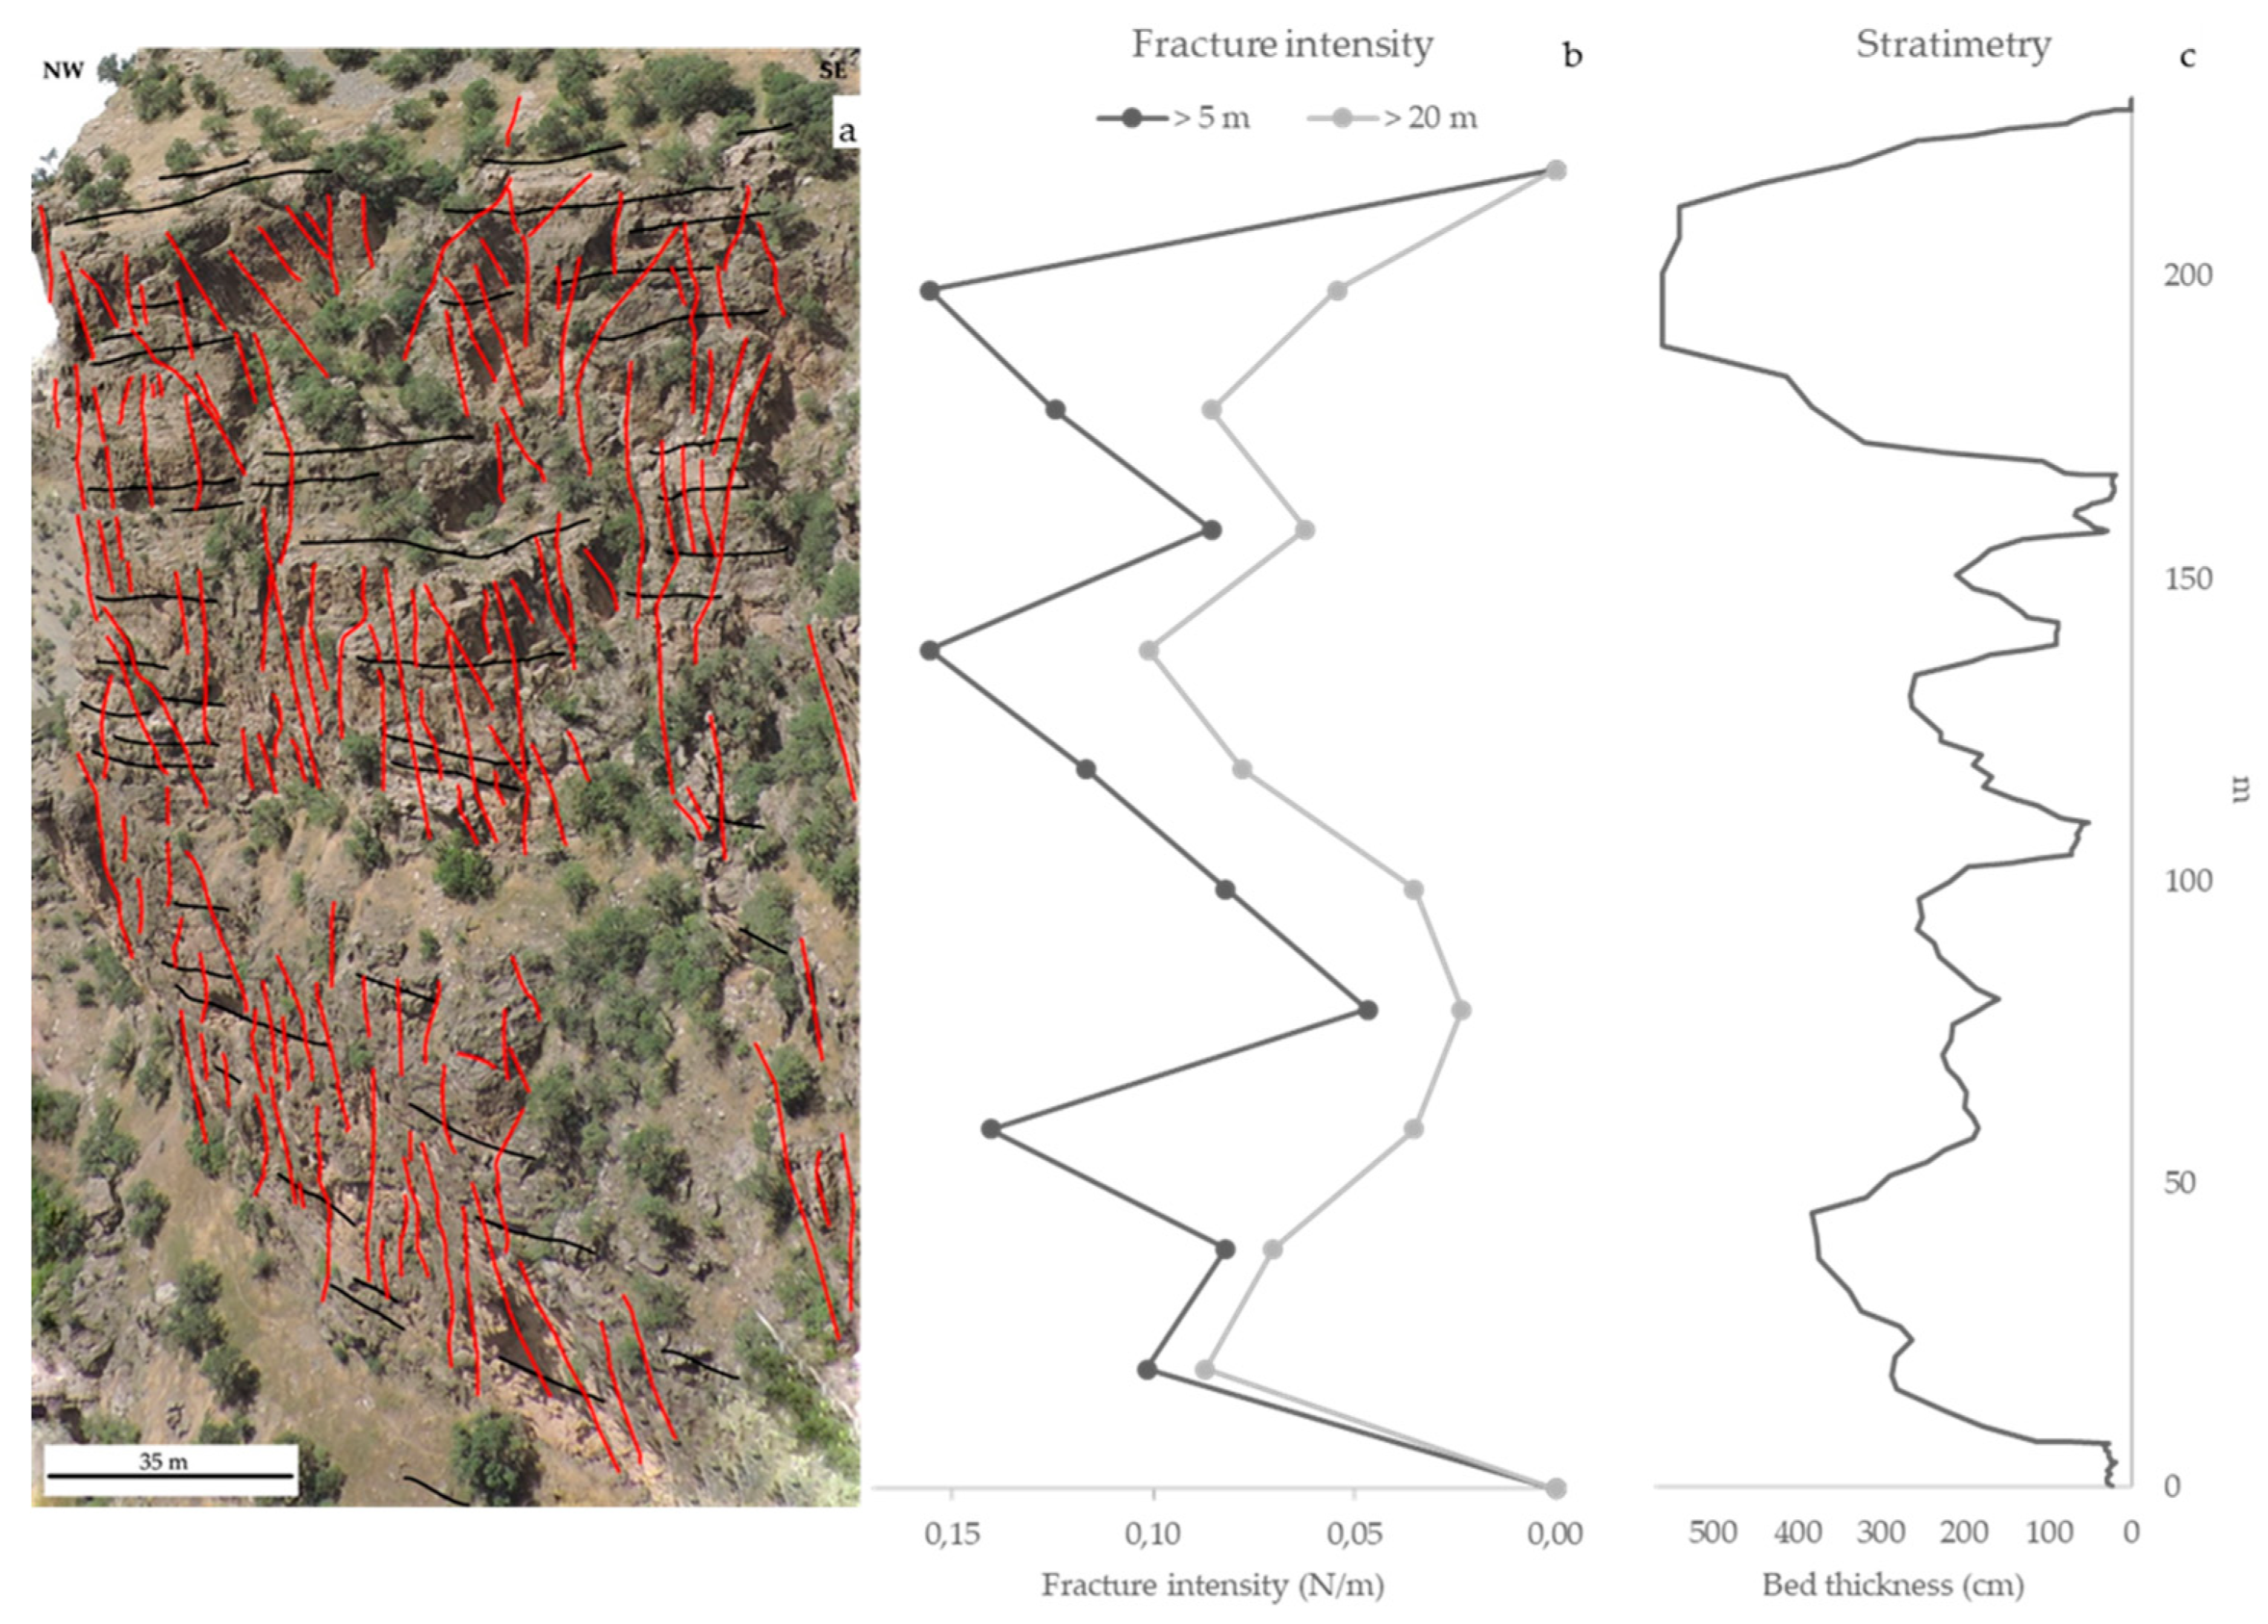
The data gathered were divided into two fracture groups: (i) taller than five meters and (ii) taller than twenty meters. These results were then compared with the stratimetric logs collected during dedicated field campaign. This analysis aimed to investigate the impact of bed thickness on the fracture system geometry in order to individuate potential abutting surfaces or mechanical barriers within the succession. Due to the exposures’ limitations derived by the accessibility problems as mentioned above, the sampling was focused on fractures belonging to set 2 (NE–SW striking). This also represents the most abundant cluster resulting from the meso-scale survey. The workflow here described allowed us to identify some hierarchical mechanical boundaries and to obtain a fracture stratigraphy of the best-exposed stratigraphic intervals of the Kurra Chine, Sarki, and Sehkaniyan Fms. (
Figure 2 and
Figure 3), as well as to define the throughgoing fracture sets occurrence within the analysed formations (
Figure 4,
Figure 5 and
Figure 6).
The large-scale survey led to the identification of 351 macro-scale fractures occurring in different outcrops belonging to the analysed Kurra Chine, Sarki and Sehkaniyan Fms. Following data collection, fracture intensity values related to each bedding-parallel digital scan line, were calculated for the surveyed outcrops (
Figure 4,
Figure 5 and
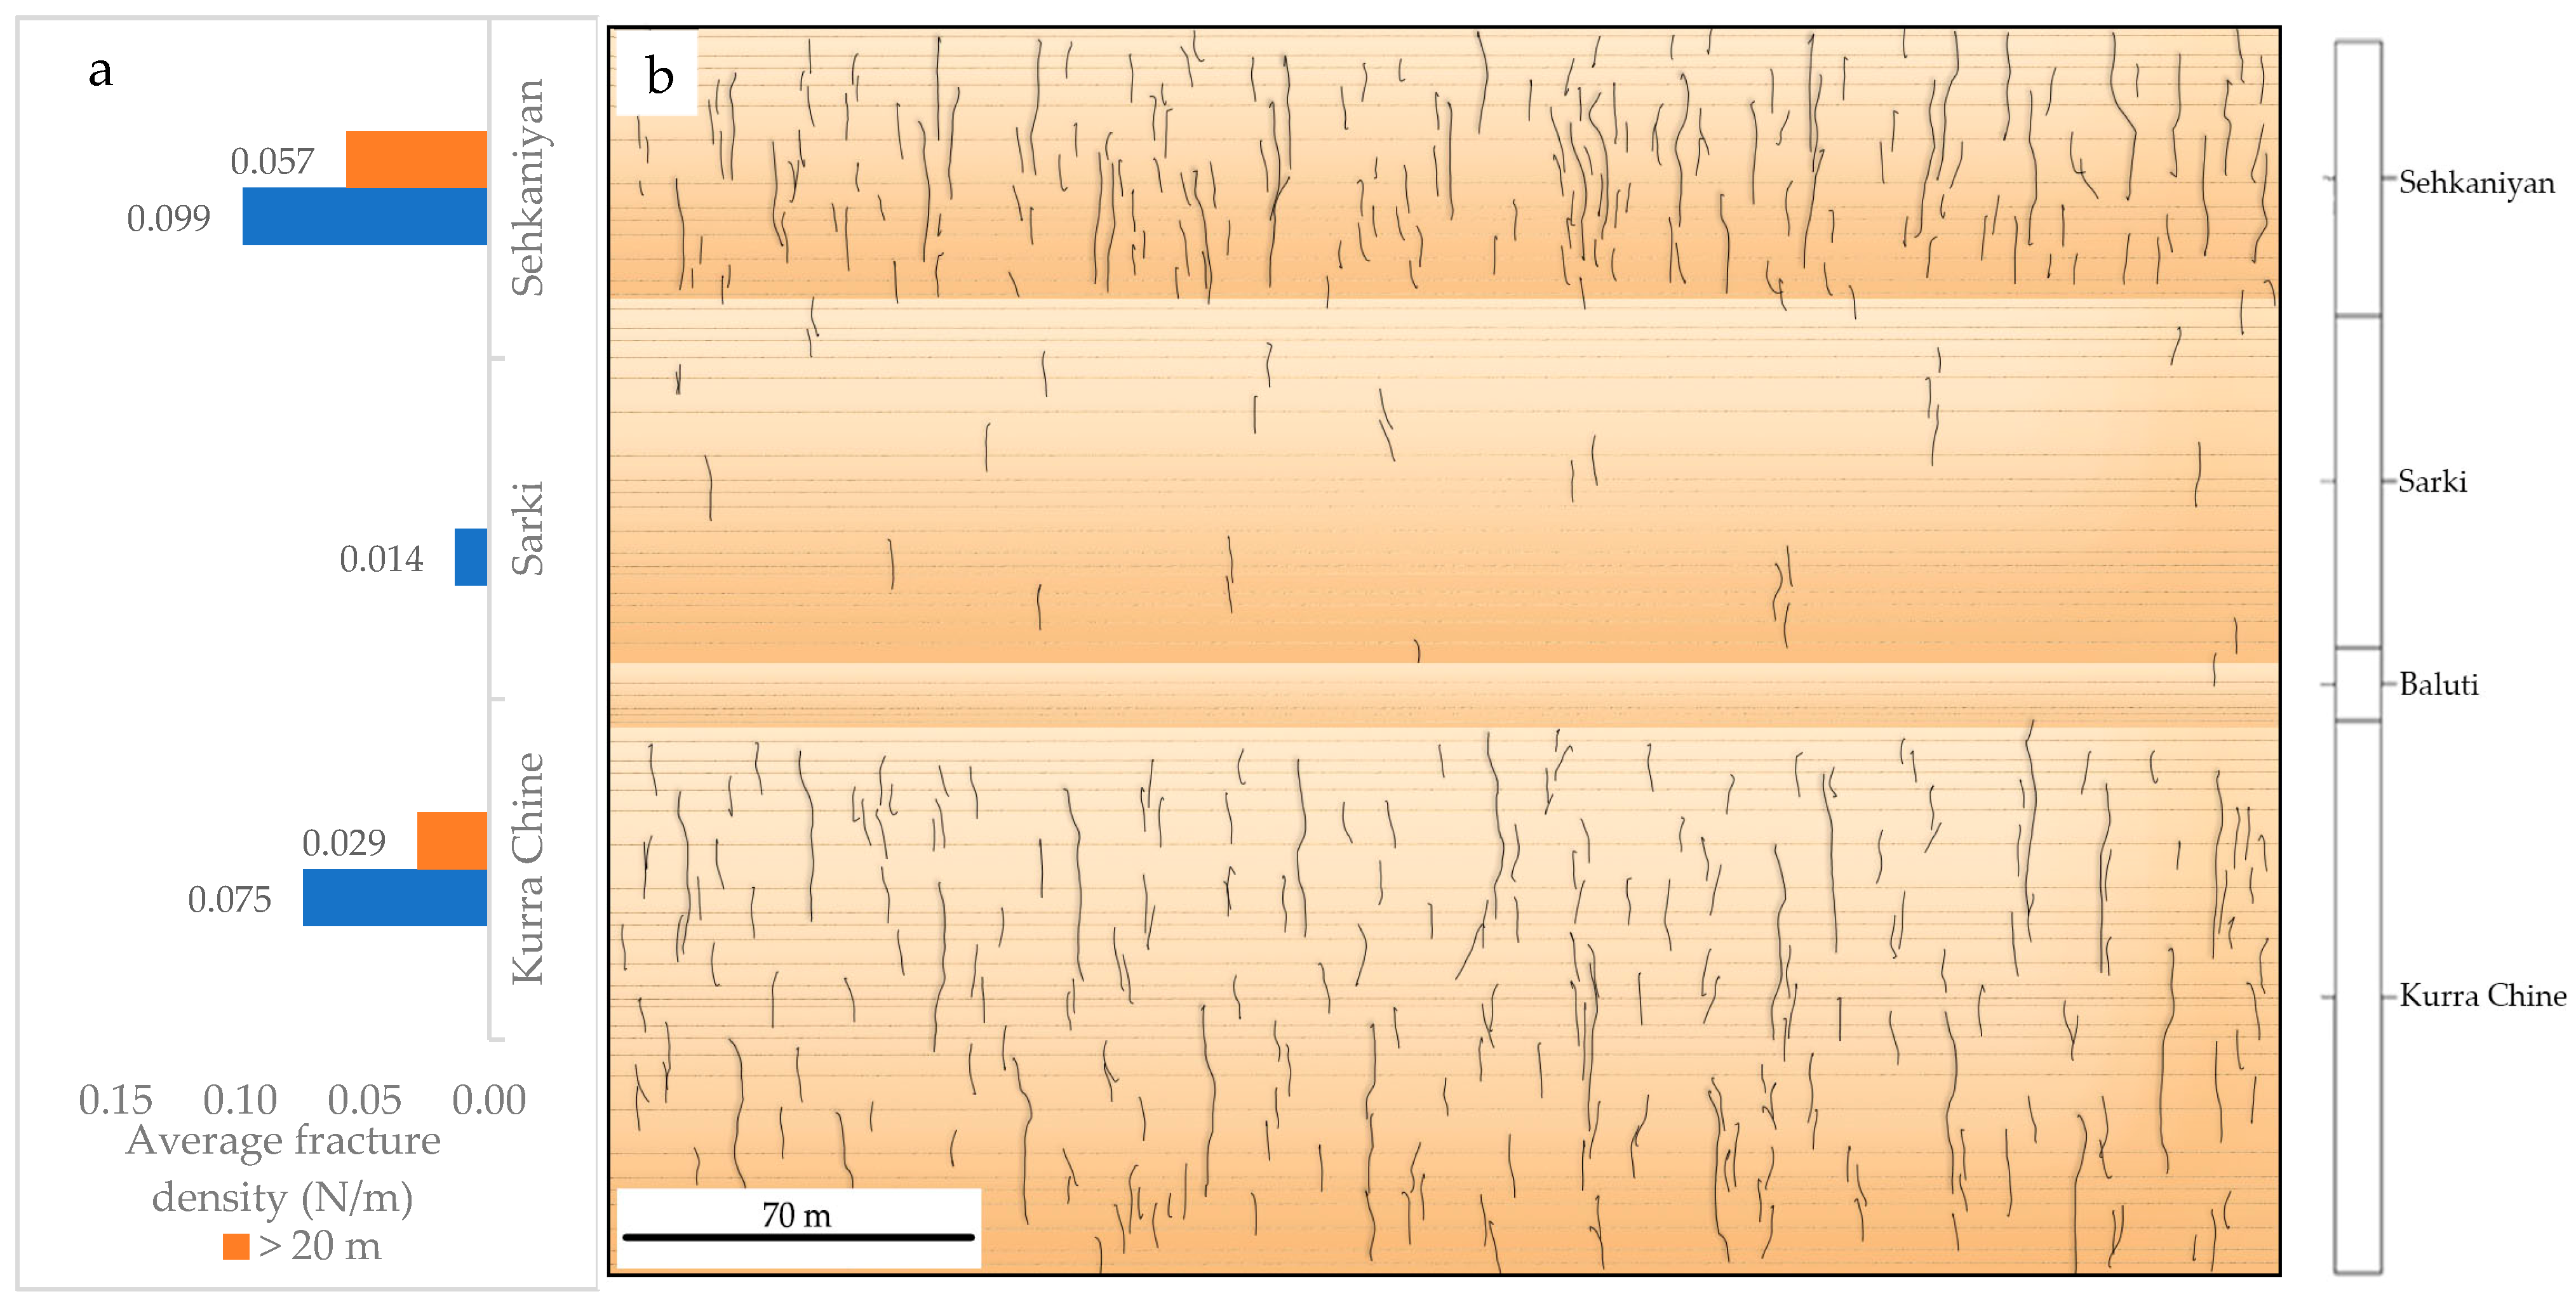
Figure 6). Fractures taller than 5 meters were overall more abundantly detected, showing an average fracture intensity (N/m) of 0.099 (Sehkaniyan Fm.), 0.075 (Kurra Chine Fm.) and 0.014 (Sarki Fm.). The computed values ranged from 0.016 to 0.117 regarding Kurra Chine Fm. (
Figure 4b), from 0.011 to 0.027 regarding Sarki Fm. (
Figure 5b) and from 0.047 to 0.156 regarding Sehkaniyan Fm. (
Figure 6b). Second group fractures, the ones taller than 20 meters, were not identified within the Sarki Fm. (
Figure 5b), whereas in Kurra Chine (
Figure 4b) and Sehkaniyan (
Figure 6b) Fms., they were regularly recognised. The average fracture density (N/m) ranged from 0.008 to 0.054 in Kurra Chine Fm. and from 0.023 to 0.101 in Sehkaniyan Fm. with average values of 0.029 and 0.057, respectively.
3.2. Scan Line Method
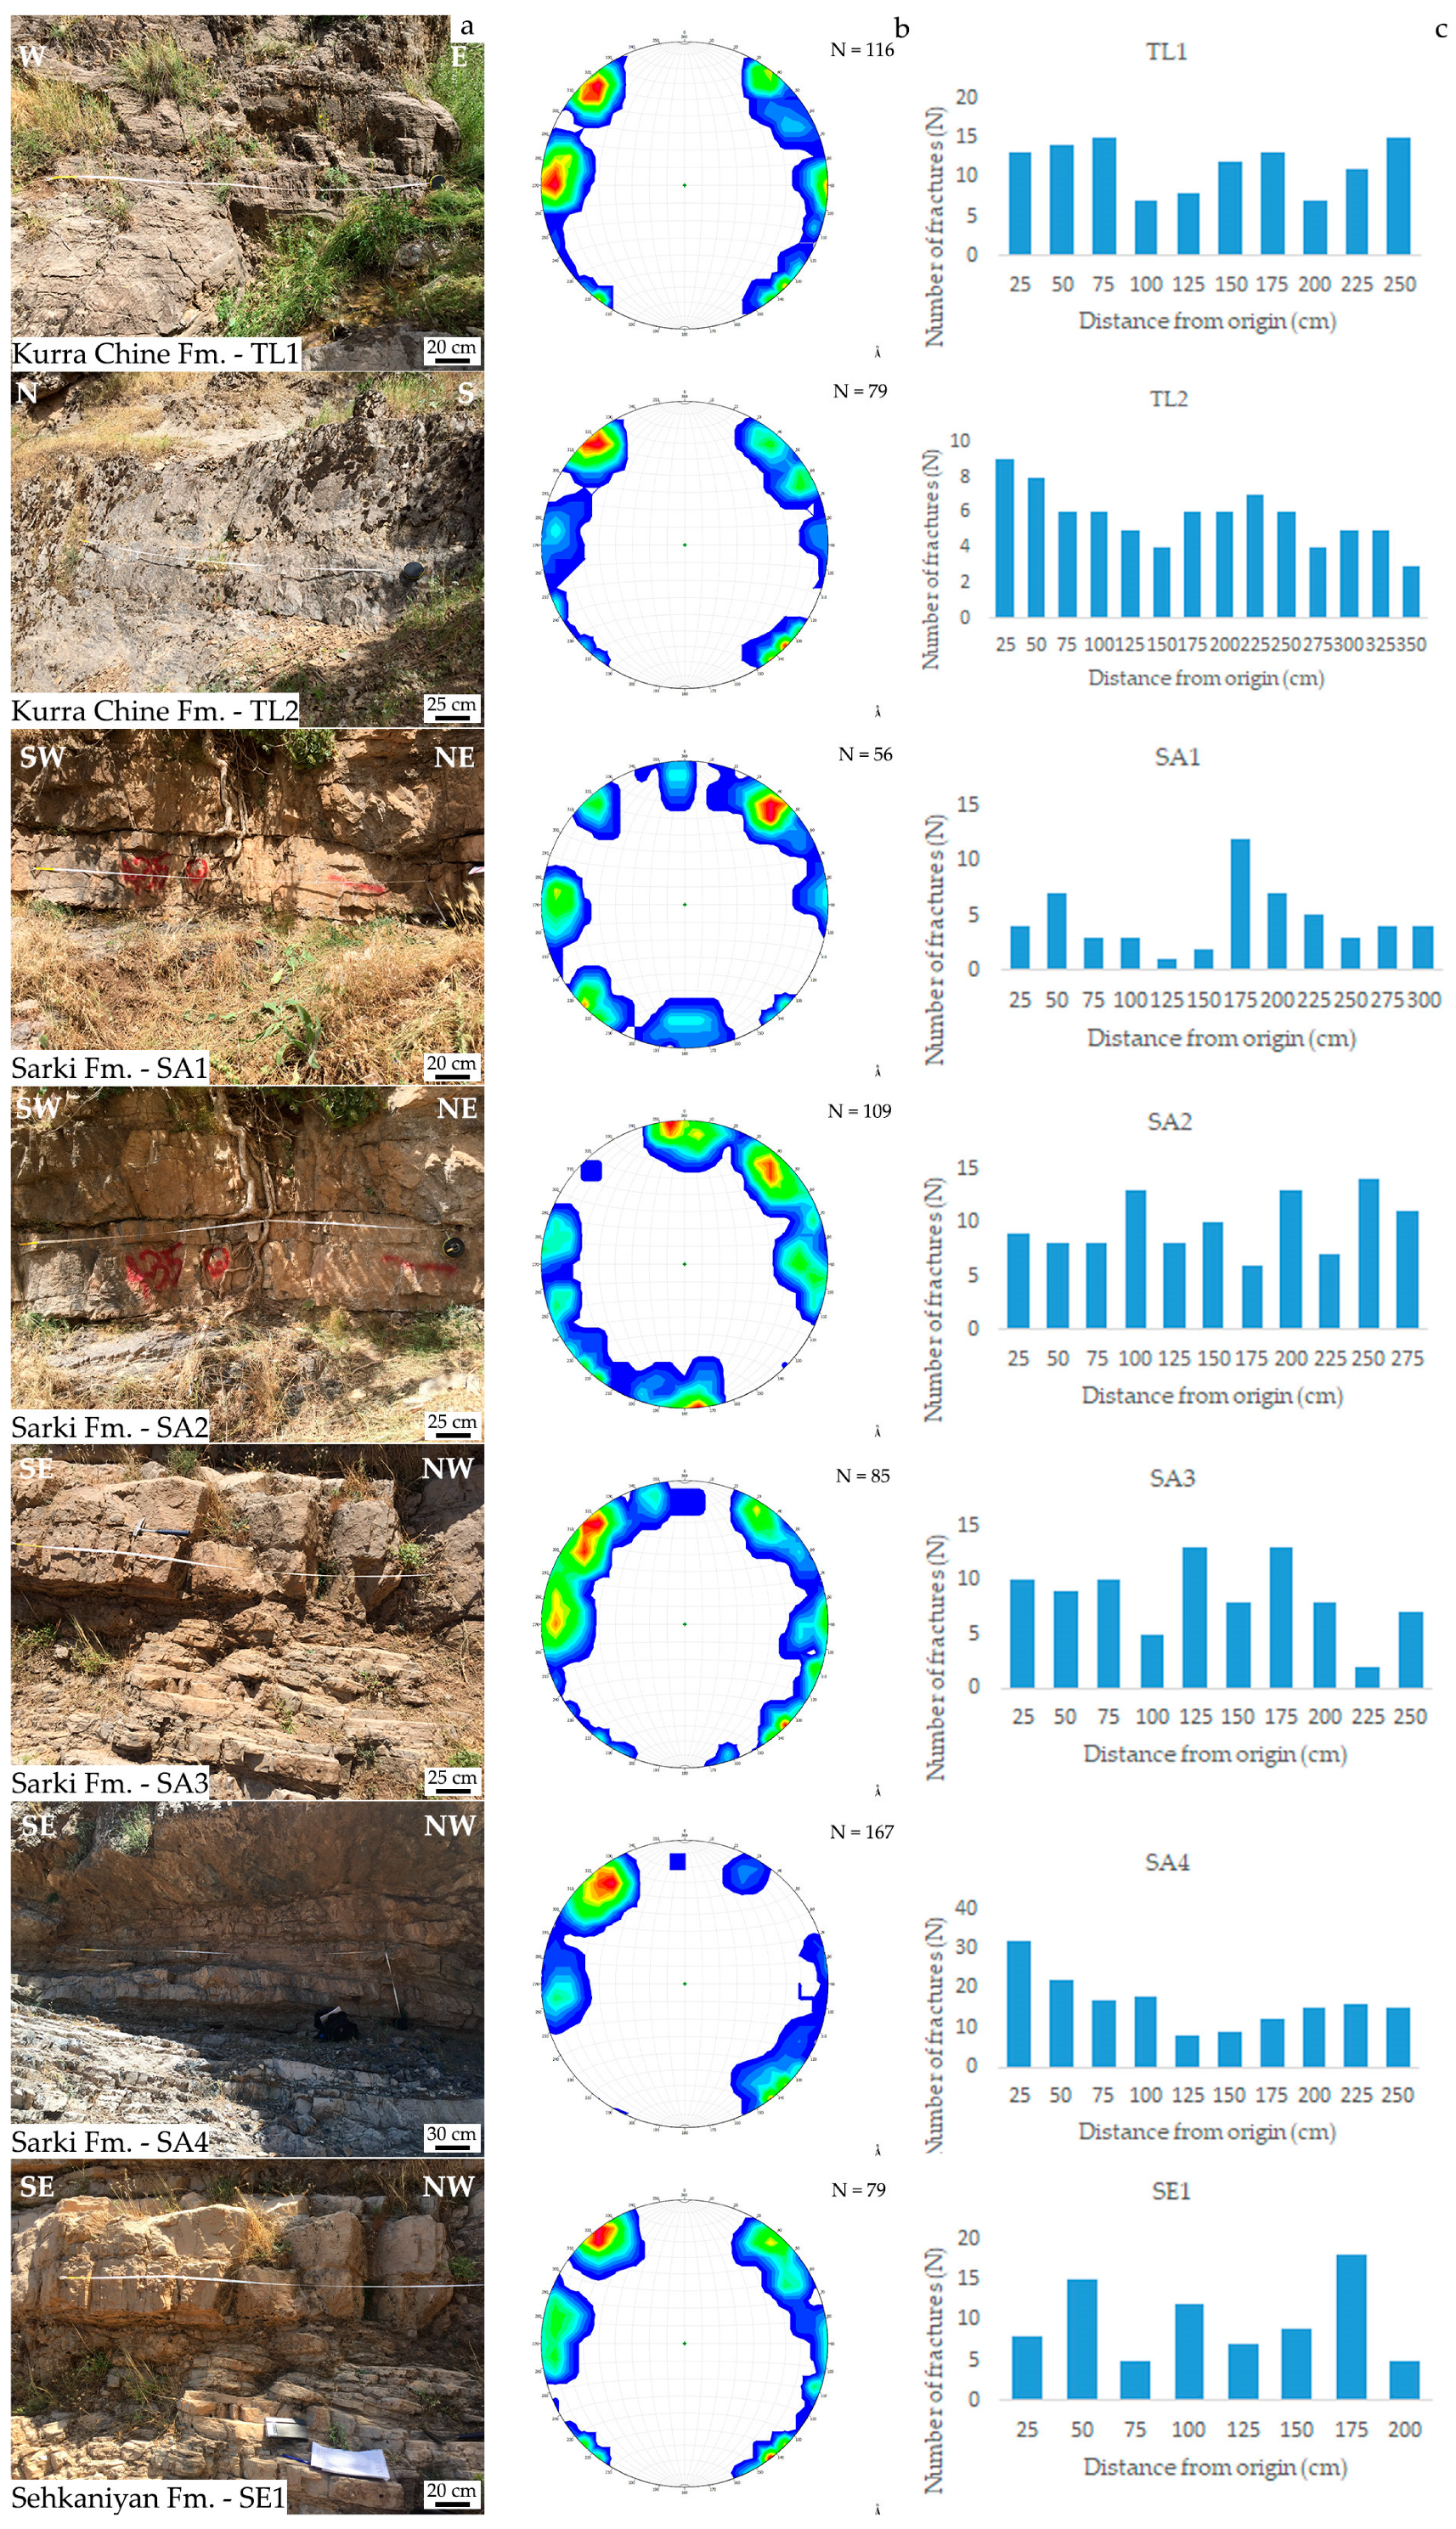
The meso-scale survey was performed by means of the scan line method, which consists of measuring the features of fractures intersecting an ideal line oriented parallel to the bedding. Seven scan lines, for a total length of about 19 meters, were carried out on seven carbonate beds belonging to the three examined formations (
Figure 7a). Fracture characteristics such as height (cm), aperture (mm), distance from the origin (cm), azimuth and dip (°) were collected along with the related information about fracture surface morphology, crosscutting relationships, and type of filling materials. When occurring, veins were also recorded, bearing in mind that these structures can have a negative impact on fluid migration pathways. Reference data concerning the scan lines survey such as location, length, bedding attitude and lithology, formation and thickness and number of recorded fractures are summarised in
Table 2.
A total of 691 fractures were collected by means of bedding-parallel scan lines performed perpendicularly to the main fracture sets, which were mostly at high angle with the bedding. Data orientation is presented in cumulative density contour plots, after bedding attitude correction, showing the occurrence of the following main fracture sets: striking NW–SE (set 1), NE–SW (set 2), N–S (set 3) and E–W (set 4) (
Figure 7b). The sampling was performed away from major fault zones, in order to focus on the background fractures, as confirmed by the regular fracture intensity trends along the performed scan lines (
Figure 7c). In
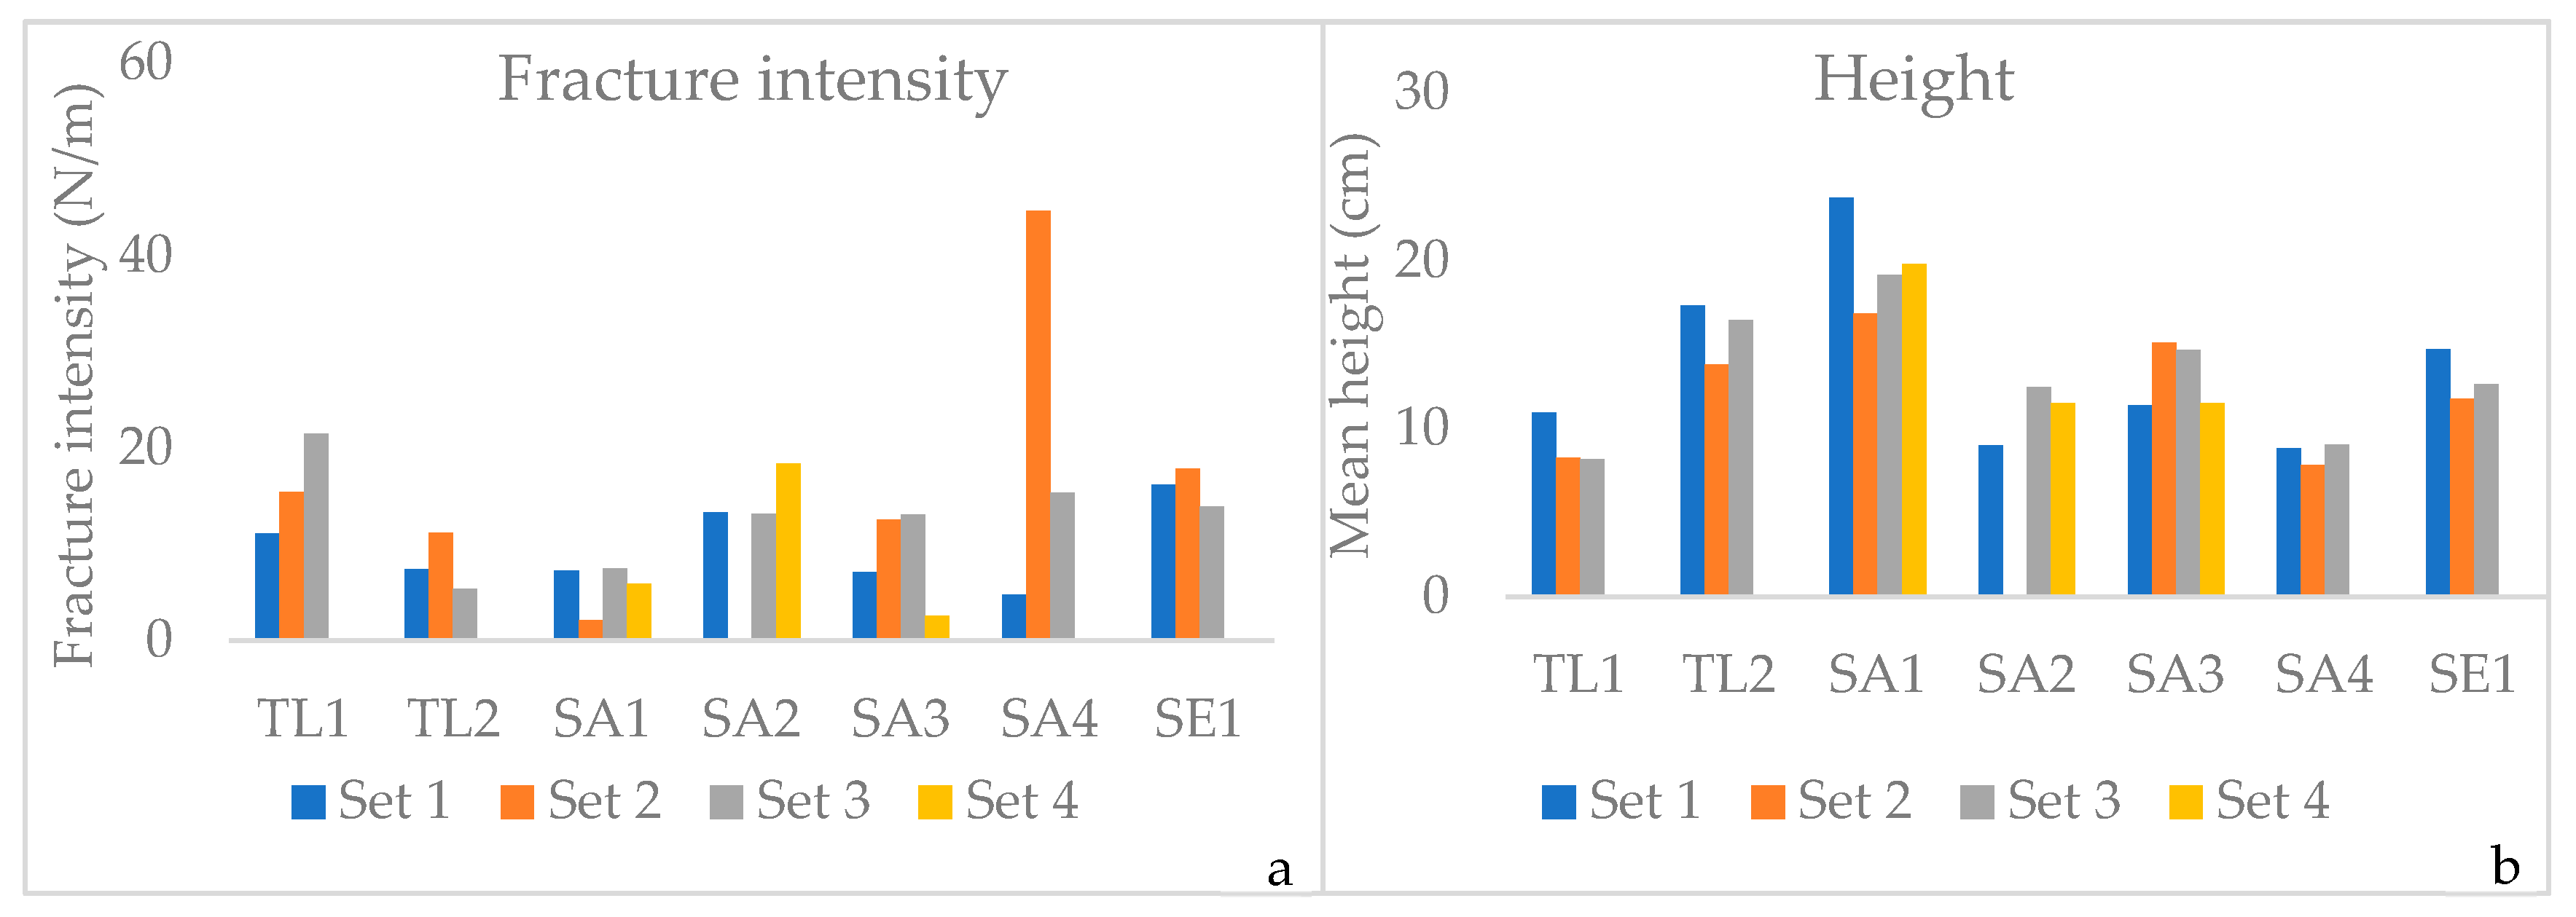
Figure 8a, the fracture intensity, number of fractures per meter (N/m) calculated by dividing the number of fractures by the scan line length, is shown for each analysed bed, pointing out the differences between the sets. These values were computed after a trigonometric correction (Terzaghi, 1965) based on the relationship between fracture set and scan line orientations. Set 4 was mainly observed in Sarki Fm., scan lines SA1, SA2, SA3, whereas set 1 and set 3 were always occurring. Set 2, the most abundant overall (
Figure 7b), was not observed along SA2 scan line. Fracture intensity values (N/m) ranged from 4.8 (SA4) to 16.2 (SE1) regarding set 1, from 2.1 (SA1) to 44.7 (SA4) regarding set 2, from 5.4 (TL2) to 21.5 (TL1) regarding set 3 and from 2.6 (SA3) to 18.3 (SA2) regarding set 4. The graph in
Figure 8b shows the mean height values (cm) computed for each scan lines, highlighting the differences among the sets. It can be noted a quite steady homogeneity for the individual fracture sets in each scan line, with set 1 and set 2 showing mostly the highest and the lowest values, respectively. Mean height values (cm) ranged from 8.8 (SA4) to 23.7 (SA1) regarding set 1, from 7.8 (SA4) to 16.8 (SA1) regarding set 2, from 8.15 (TL1) to 19.1 (SA1) regarding set 3 and from 11.5 (SA3) to 19.8 (SA1) regarding set 4.
4. Modelling
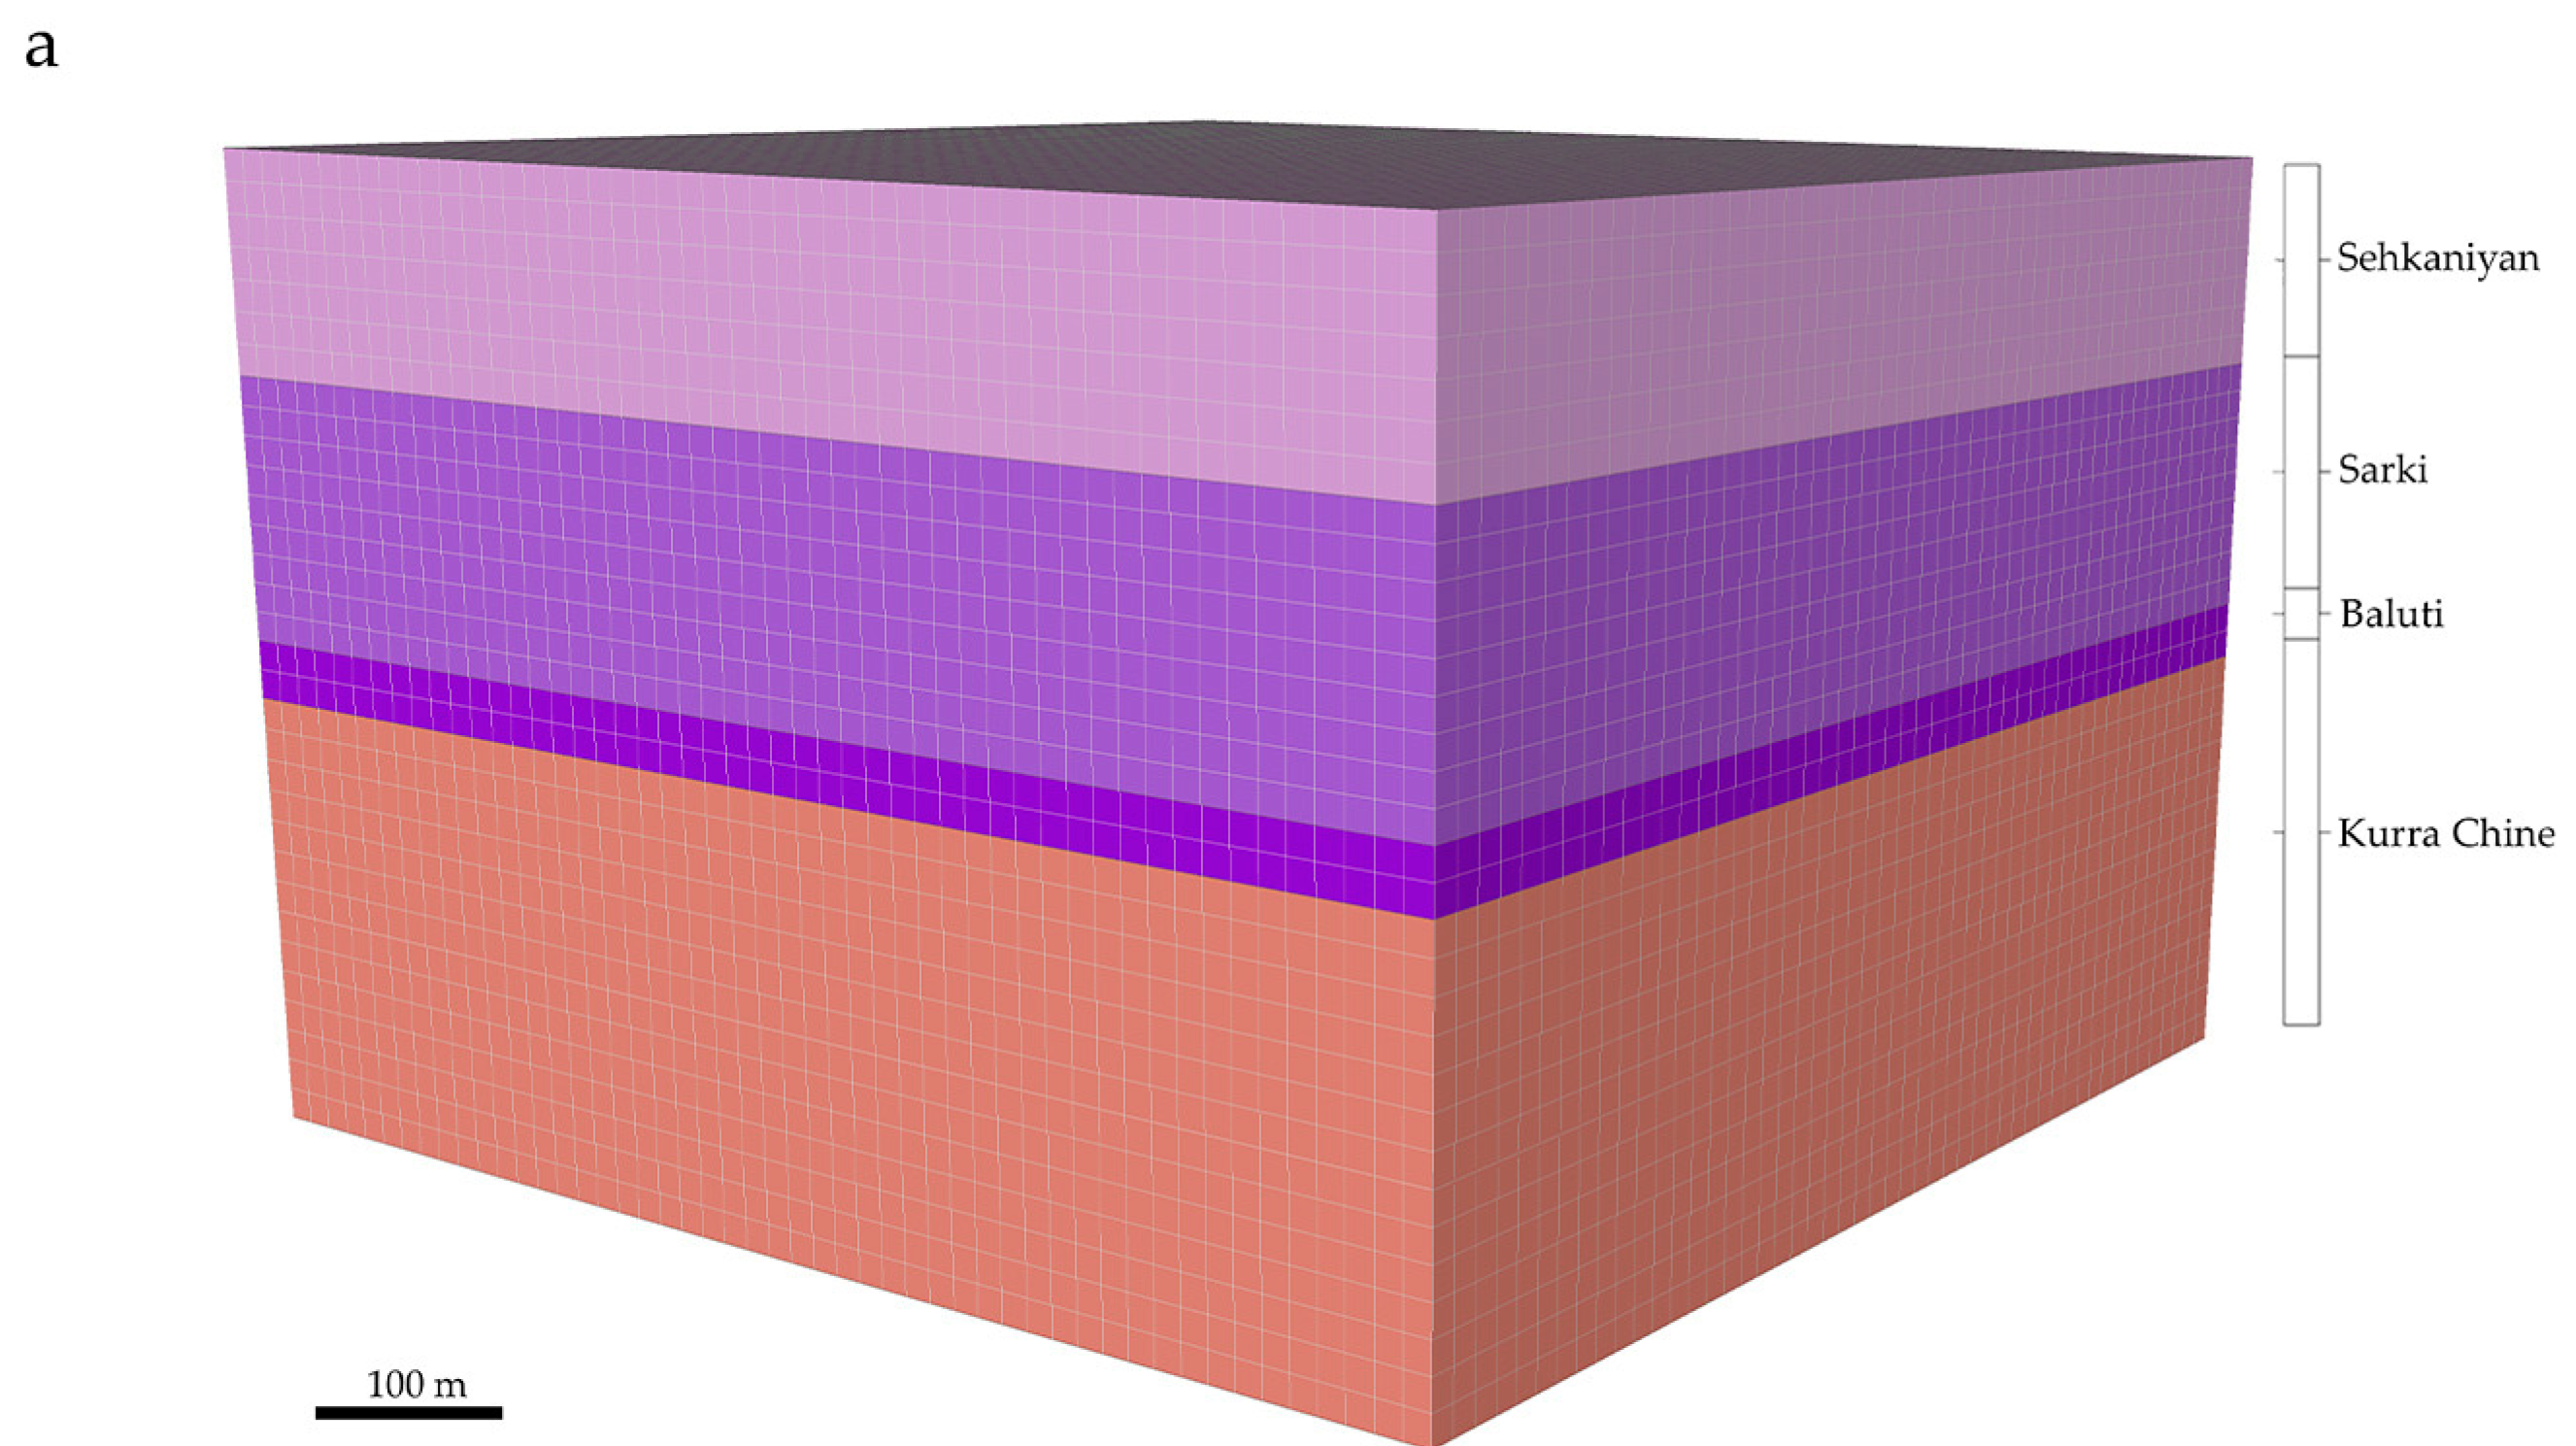
The DFN modelling was performed using the software Move 2017, a complete structural geology toolkit developed by the Scottish company Midland Valley Exploration Ltd. This study aim was to develop a DFN modelling for reservoir characterization, elaborating a stochastic distribution of the fracture sets affecting the analysed formations by means of the “Fracture Modelling” module, following a multi-scale data sampling. A basic “GeoCellular Volume”, formed by volume attributes cells, represents the analysed succession (
Figure 9a), to which some geological intrinsic parameters, based upon field and literature lithology data, were assigned in order to characterize it, such as lithology, porosity (%), mean density (g/cm
3), Young modulus (MPa) and Poisson ratio. The represented carbonate succession includes, from bottom to top, Kurra Chine Fm., Baluti Fm., Sarki Fm. and Sehkaniyan Fm. The Baluti Fm was not part of the analysis in this study, since it is formed by shales and, therefore, represents a seal in the petroleum system. The investigated formations were reproduced in this modelling without considering any inner stratification, giving to each of them a constant thickness according to their most representative stratigraphic records in literature, namely 300 m thickness for Kurra Chine Fm., 40 m thickness for Baluti Fm., 180 m thickness for Sarki Fm. and 150 m thickness for Sehkaniyan.
Subsequently, the gathered multi-scale dataset was used for DFN modelling, generating the individual fracture sets affecting each analysed formation. Based on data collected from field surveys, the software allows one to elaborate a stochastic distribution of the fracture network. As demonstrated by Panza et al. [
82], who performed seeding and sensitivity analysis testing multiple configurations of DFN models, the error associated with the modalities of stochastic fracture generation provided by the software Move can be considered negligible. The required input data were, per individual set, fracture intensity, length, azimuth, dip, K-fisher value, aspect ratio, and aperture. The fracture intensity is defined by the parameter “N”, number of fractures per volume unit, calculated for each set after a trigonometric correction relative to the outcropping surface orientation [
78]. The aspect ratio was defined as the standard setting of 1:2 for non-stratabound fractures, whereas it was set as 1:4 for stratabound fractures [
24,
81,
83]. Fracture length values were derived from the height and aspect ratio values. The orientation was referred to the main 4 sets individuated in the analysed area. The “K Fisher value” is a parameter generated from the stereographic distribution of the data for each fracture set and describes how regularly are oriented the fractures within the same set. Concerning fracture aperture, although this parameter is characterised by a power-law distribution, a mean value was used as required by the software for modelling. This is consistent with the fact that very small fractures, with aperture values below the observation threshold, play a negligible role in terms of fluid flow and may therefore not be considered in modelling.
Along with DFN distribution, the software allows one to analyse the network architecture and connectivity features by elaborating some related parameters such as secondary porosity (%), permeability (D), sigma factor, block size (m
3), P32 (m
2/m
3) and anisotropy (%). The computed petrophysical parameters are crucial in the understanding of fluid flow processes, porosity and permeability particularly, allowing one to individuate potential relative impermeable barriers or preferential flow migration pathways All these attributes can be visualised in a 3D distribution throughout the model, letting to individuate potential critical areas, surfaces or layers within the simulated reservoir. Porosity is computed for a basic individual cell as the ratio between cell total fracture volume and cell volume. Permeability calculation is based on the geometric methodology of Oda [
84] which itself is based on Darcy’s Law (Equation (1)) and laminar flow theory between parallel plates:
where Q is the total discharge, A is the cross-sectional area to flow, s is the fracture aperture, D is the spacing,
is the hydraulic gradient, ρ is the fluid density, and μ is the dynamic viscosity. Sigma factor can be considered as an index of fracture intensity. This value is computed for individual cells following the multi-directional algorithm described by LaPointe et al. [
85]. Three rays are generated from a source located in the centre of each cell faces terminating on the opposite face of the cell. The number of fractures intersecting the rays allows to calculate an average spacing value by means of the following equation [
85]:
Block size is a fracture spacing related index, showing the average intact rock volume of the individual cells. P32 (m2/m3) factor is a volumetric fracture intensity index, expressed as the ratio between total fractured area per unit volume.
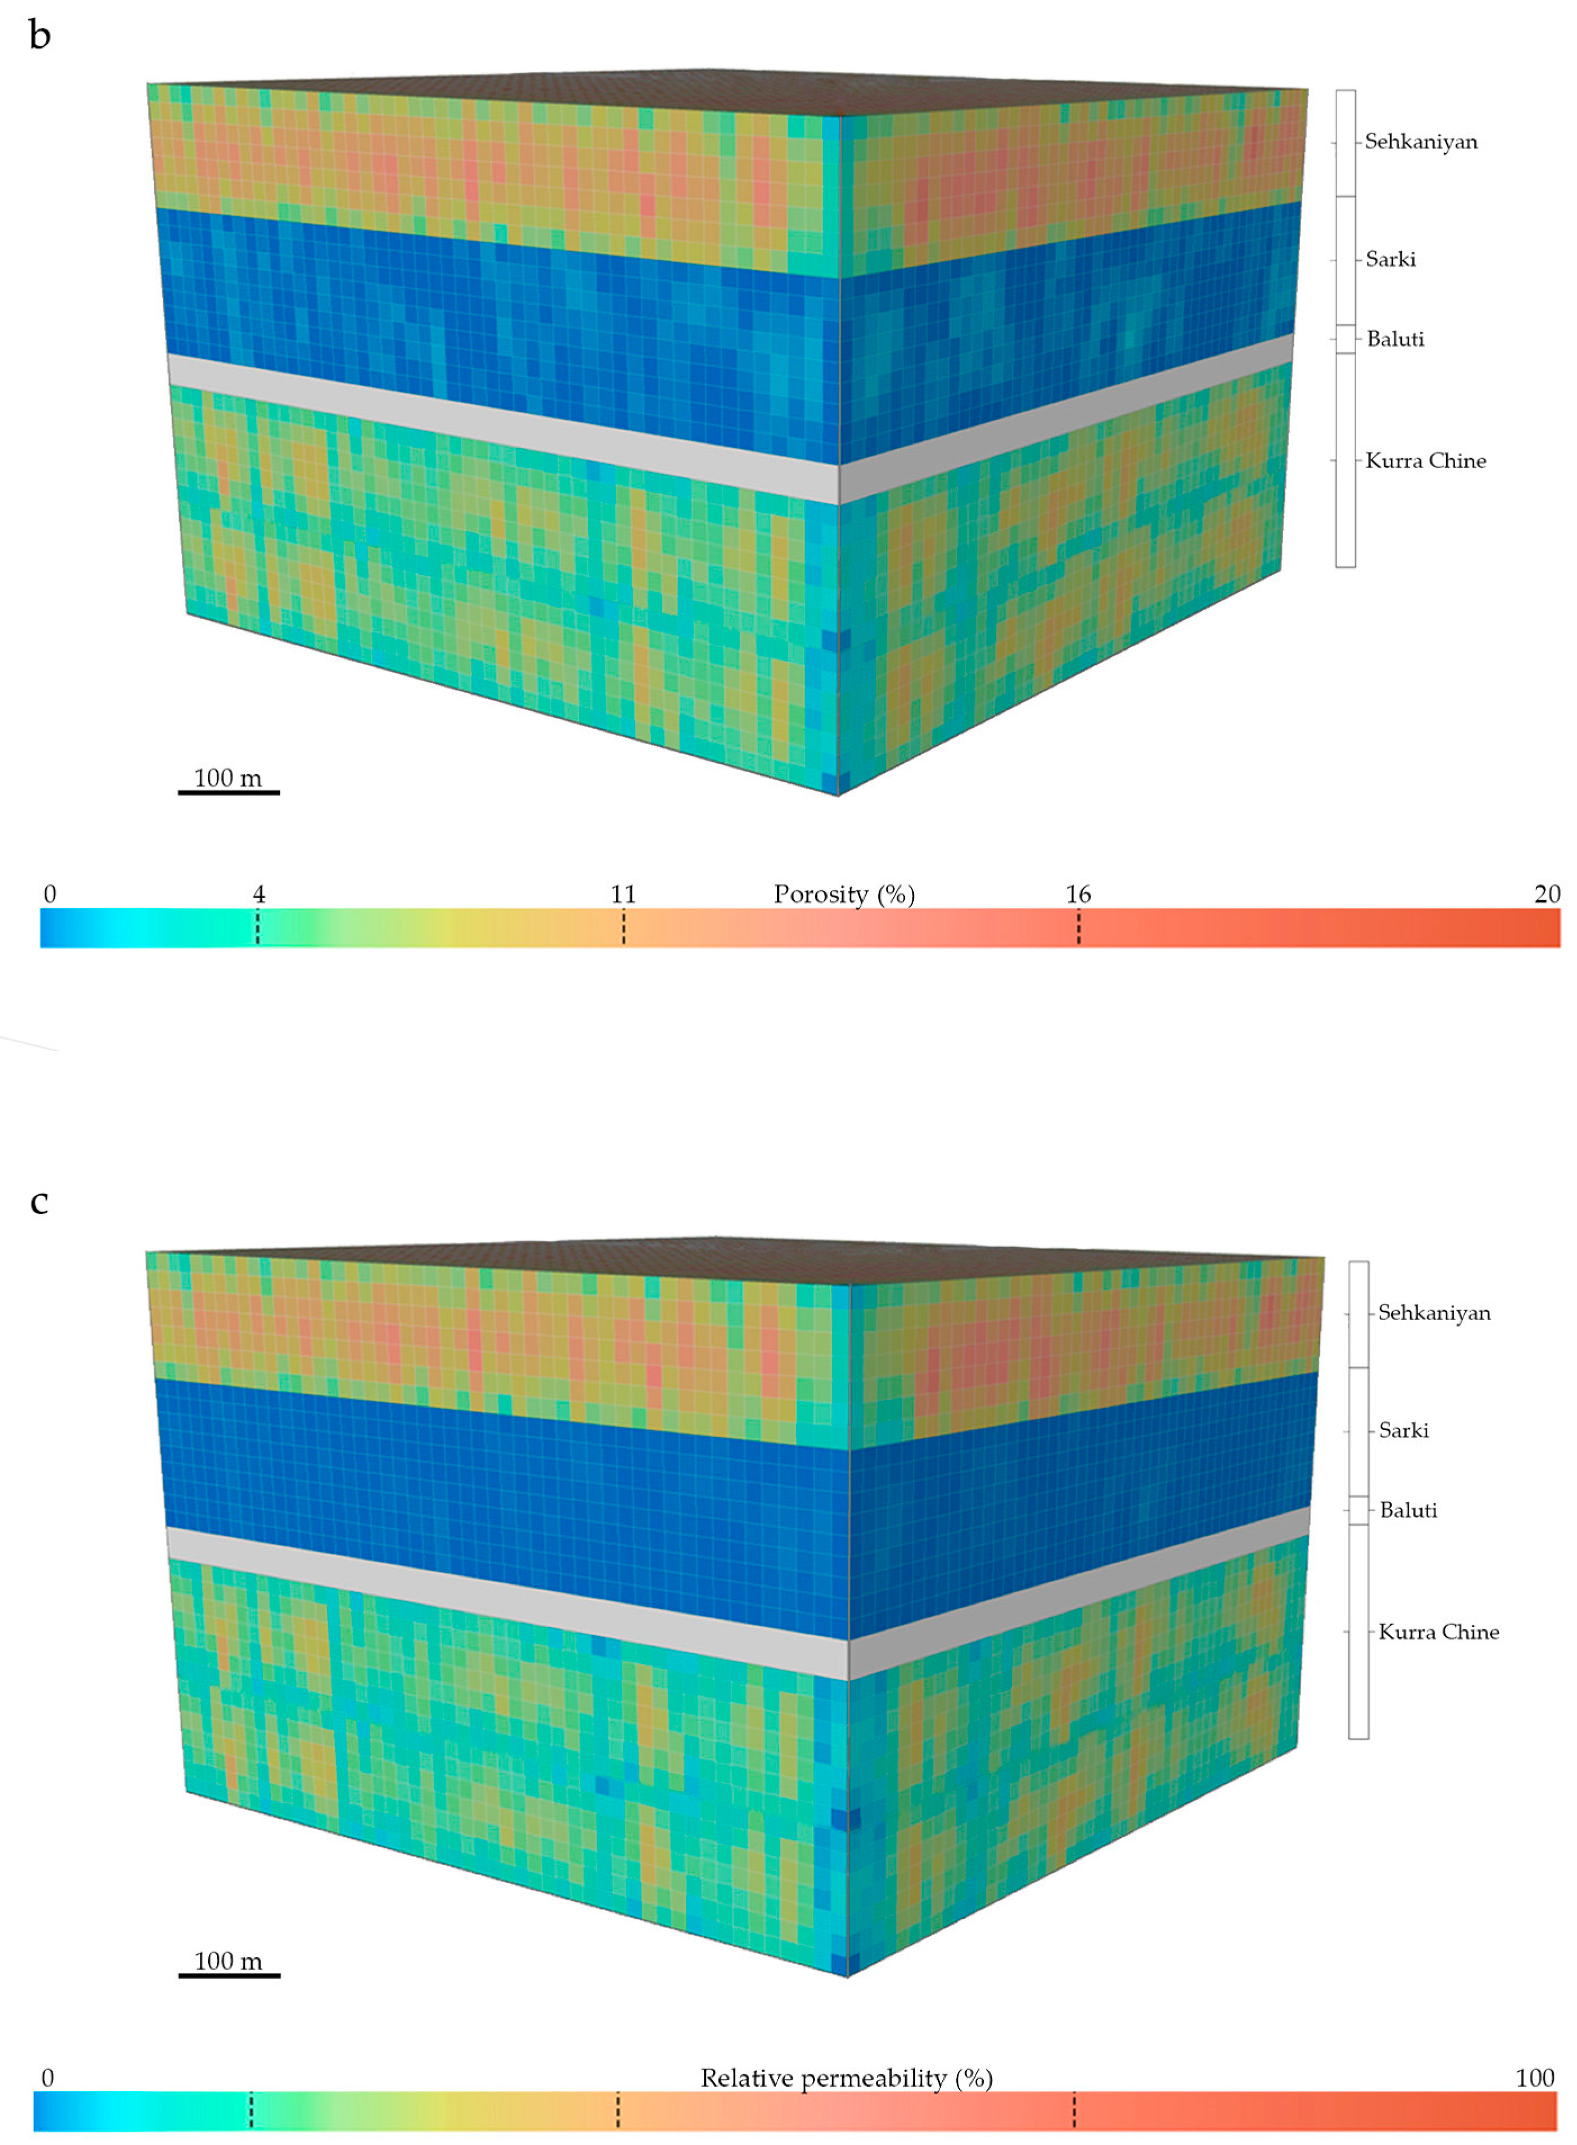
The resulting petrophysical parameters arrangement is shown in
Figure 9b,c. Porosity and permeability patterns are shown as relative values to the overall succession and expressed in percentage. These models showed, evidently, a clear connection among these two parameters, especially regarding Kurra Chine and Sehkaniyan Fms., whereas Sarki Fm. was characterised by relative permeability values lower than the porosity ones. These slightly different attribute values showed by Sarki Fm. can be explained by the different impact of the major throughgoing fractures on the related petrophysical properties. Sarki Fm. displayed no fractures taller than 20 m. These latter give a crucial contribution in terms of permeability, crosscutting several beds and linking together smaller fracture systems otherwise isolated to each other and, thus, reducing the internal reservoir compartmentalization. Therefore, the dearth of these major fractures in Sarki Fm. had a sharper impact on its permeability rather than on the porosity.
5. Data Analysis
In this work, DFN modelling was performed following a multi-scale fracture analysis of a Mesozoic carbonate succession. The multi-scale approach represents a complete method to investigate and fully understand the architecture and the geometries of a complex fracture system affecting a fractured carbonate reservoir. Subsequently, the collected dataset provided the input data needed to perform the DFN modelling. This latter allows one to obtain a stochastic distribution of fractures sets in each analysed unit, combining the intrinsic properties of the investigated units and the input data concerning fractures sets characteristics. Then, following the generated fractures sets stochastic distribution, the petrophysical properties were calculated and shown in the 3D models, allowing one to develop a comprehensive picture of the potential fluid flow related behaviour of the examined formations.
The macro-scale survey led to the definition of a detailed fracture stratigraphy for Kurra Chine, Sarki and Sehkaniyan Fms., by analysing the major fracture sets affecting the studied outcrops and highlighting the occurrence of potential mechanical boundaries. These latter were identified at (i) the top of the Kurra Chine Fm., (ii) the base of the Sarki Fm., and (iii) the top of the Sehkaniyan Fm. Minor mechanical boundaries were observed within these massive carbonate bodies, which, internally, appeared well connected by major throughgoing fractures that enhance vertical permeability, thus reducing internal compartmentalization. The computed fracture intensities showed some vertical variations across the analysed outcrops (
Figure 4b,
Figure 5b and
Figure 6b), defining a quite clear relationship with the beds thickness defined by the stratimetric logs (
Figure 4c,
Figure 5c and
Figure 6c). Higher fracture intensity values seemed to be corresponding with thicker beds occurrence. This trend can be explained because of the different propagation mechanism of the throughgoing fractures [
32]. These large-scale structures form by progressive linkage of pre-existing fractures [
31,
86]. These latter, in order to accommodate the stress propagation, can either be re-opened or link with each other across the beds by forming new fractures. According to the abovementioned (cf. Chapter 1) bed thickness-fracture density relationship observed for stratabound sets, thinner beds are usually characterised by higher fracture densities. Therefore, during the throughgoing fractures propagation process thinner beds have higher probability to provide a pre-existing stratabound fracture in the perturbation area respect to the thicker beds. Consequently, the formation of new segments for the linkage of pre-existing fractures is more likely to happen in thicker beds, developing single and nearly-straight throughgoing fractures, whereas in thinly bedded packages the deformation is possibly accommodated by the re-opening of the numerous pre-existing fractures.
Based on the macro-scale gathered data, computed average fracture intensities for each analysed formation, summarised in
Figure 10a, highlighted the lower occurrence of major fractures within the Sarki Fm. and, especially, the dearth of throughgoing fractures taller than 20 meters within, whereas these macro-scale structures were well detected in the Kurra Chine and Sehkaniyan Fms. showing, in this latter, a fracture intensity that is twice than in the former one. On the other hand, fractures taller than 5 meters occurred in all the analysed formations, with the highest fracture intensity values detected in Sehkaniyan Fm. and the lowest in Sarki Fm. The overall large-scale fractures architecture, following information carried out by means of this survey, is schematically represented in
Figure 10b.
The meso-scale survey led to the characterization of background fracture sets away from major fault zones. The data gathered, collected by means of the scan line method along different outcrop surfaces of the analysed formations, were then analysed individually for each formation, examining the relevant sets attribute for the related petrophysical properties and, therefore, the fluid flow migration processes. Based on the collected dataset, 2D fracture porosity was computed for each analysed bed [
87]. This parameter defines the ratio between the fractured area and the total surveyed area and is, therefore, expressed in percentage. The total area of the examined bed (A) was obtained by multiplying the scan line length (L) by the bed thickness (T):
The fractured area (
Af) was calculated by multiplying the height (l) and the aperture (a) of the fractures affecting the bed:
Successively, the 2D fracture porosity (
ϕf) was obtained by dividing the fractured area (
Af) by the total examined area (A):
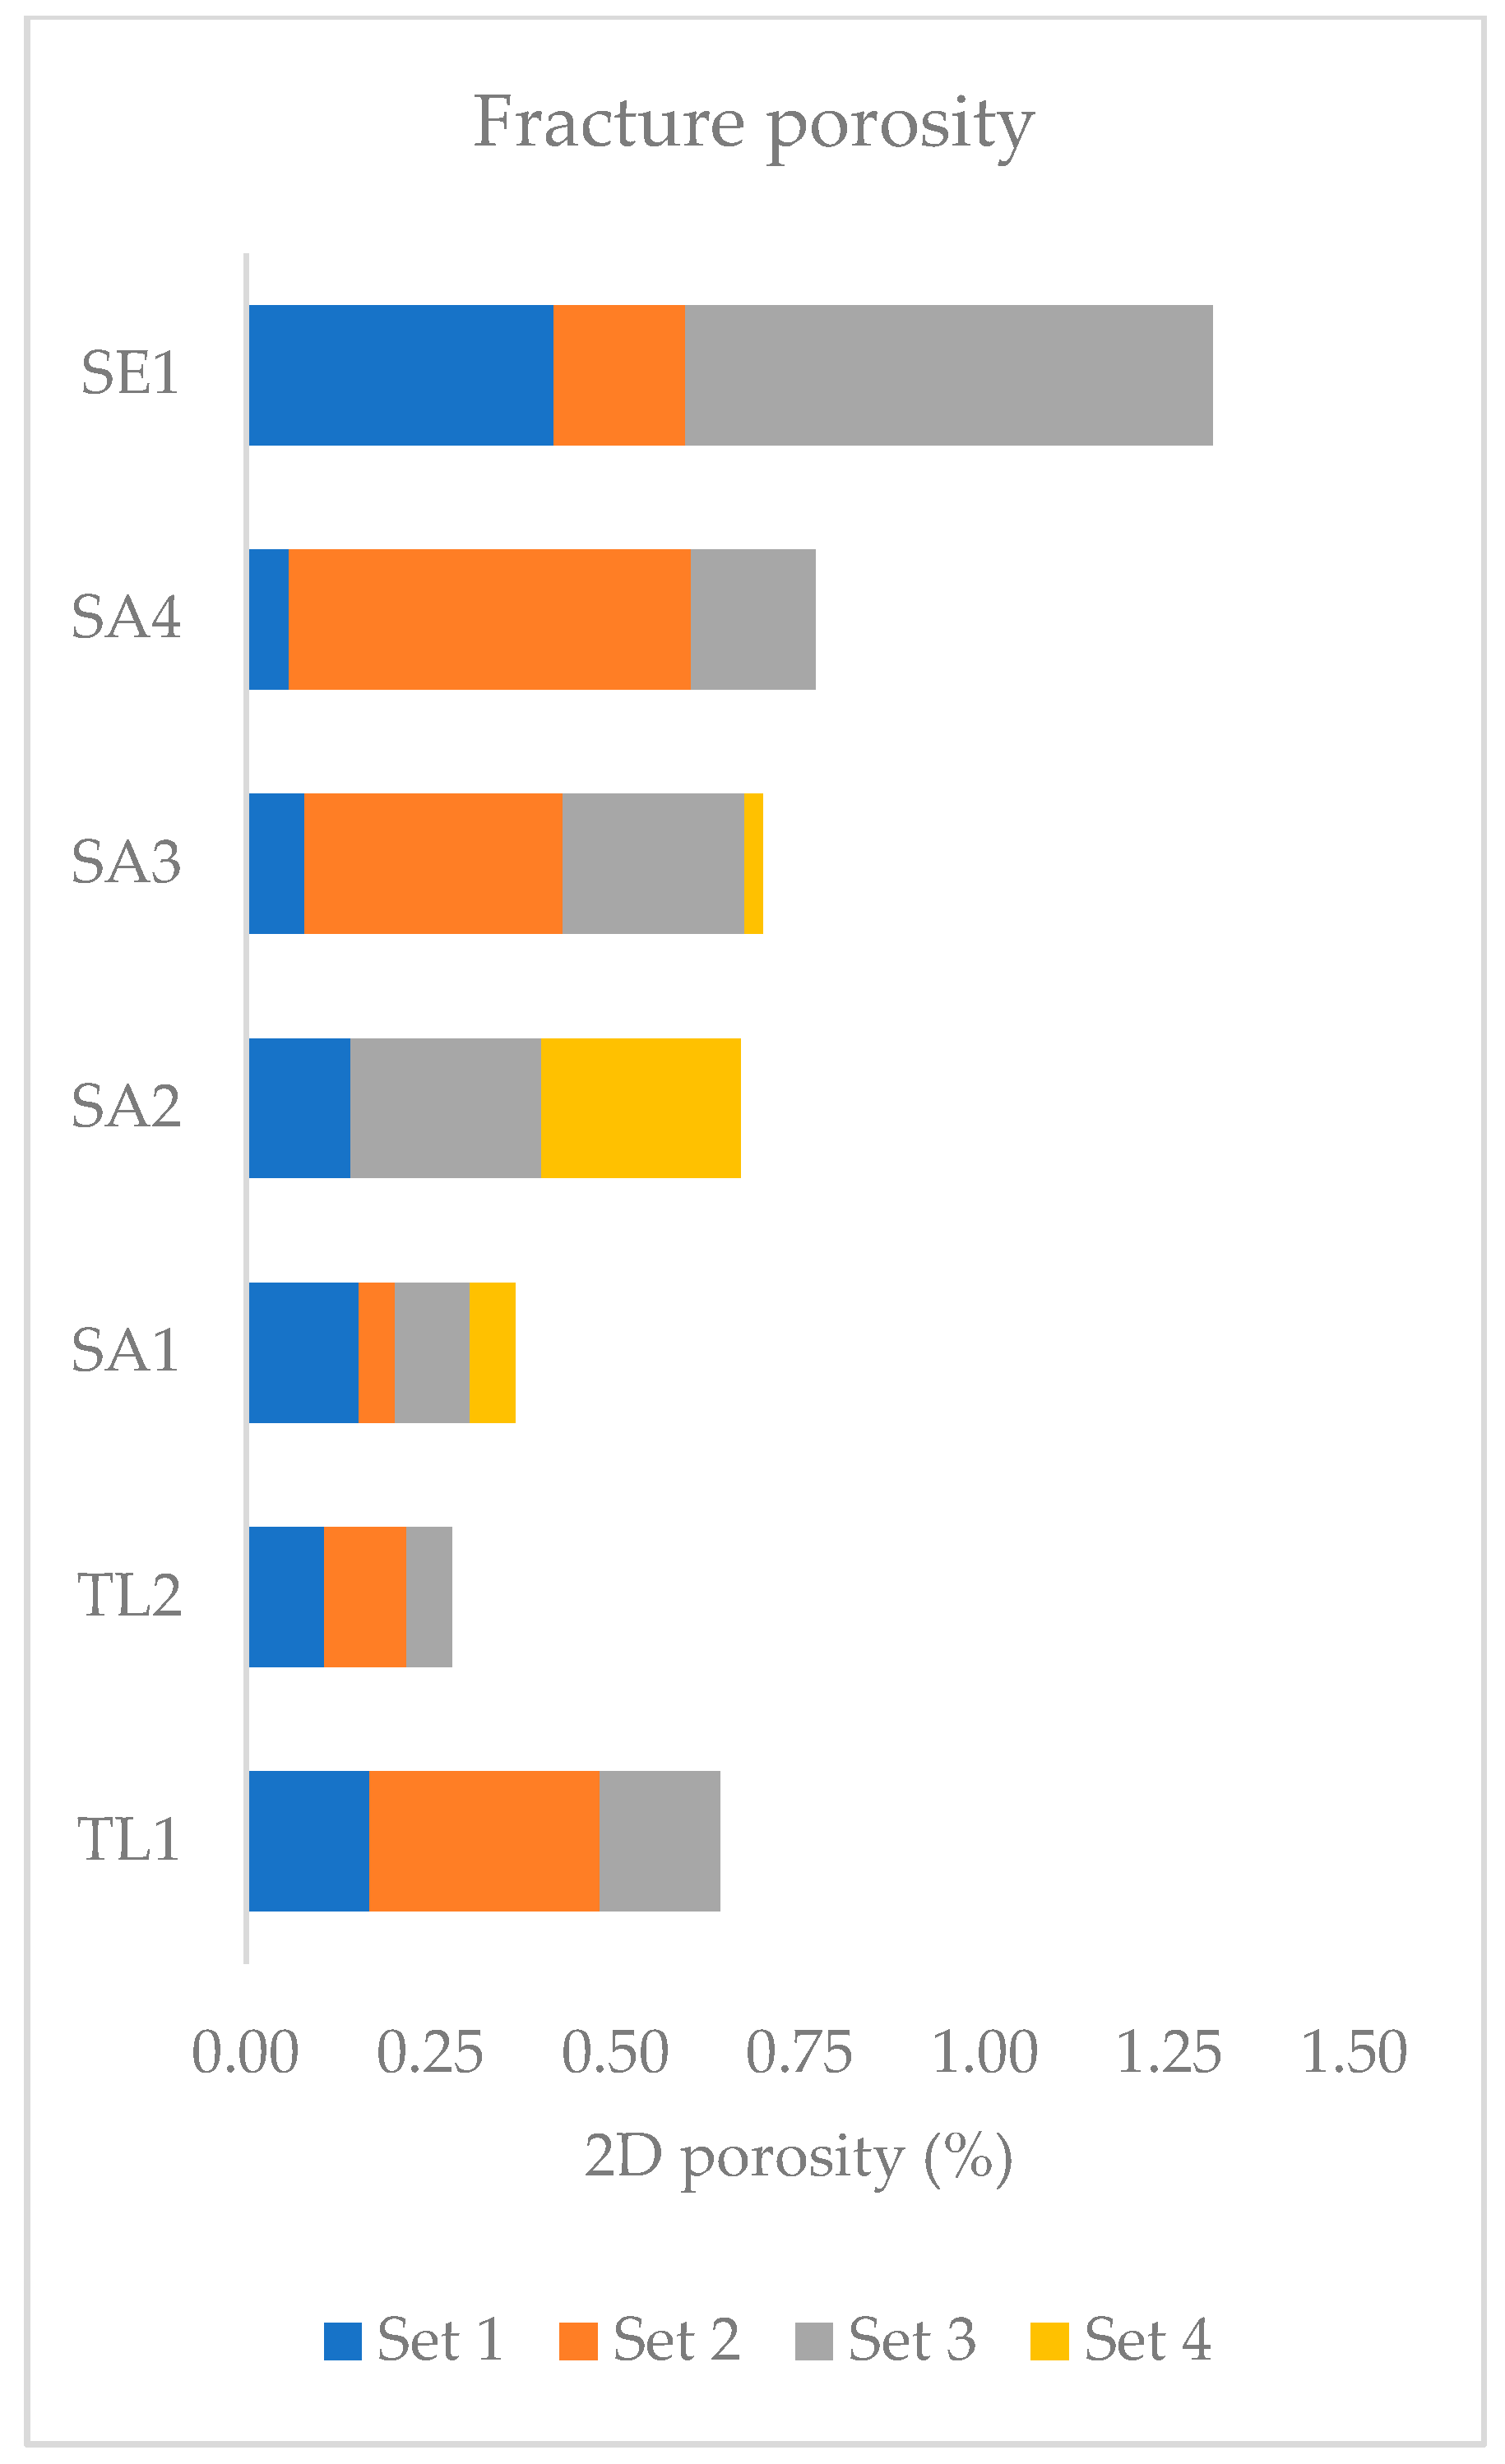
In
Figure 11, the 2D fracture porosity (%) values are shown for each analysed bed, highlighting the contribution of the individual sets. For this purpose, only the open fractures were taken into account, excluding the veins from this evaluation. The lowest percentages characterised the Kurra Chine and Sarki Fms., with the bed TL2 and SA1 showing 0.28% and 0.36% of fracture porosity, respectively, whereas the bed SE1, Sehkaniyan Fm., had exceptional 2D porosity, 1.31% representing the highest value. In terms of single set contribution, fracture porosity values (%) ranged from 0.06 (SA4) to 0.42 (SE1) regarding set 1, from 0.05 (SA1) to 0.54 (SA4) regarding set 2, from 0.06 (TL2) to 0.71 (SE1) regarding set 3 and from 0.02 (SA3) to 0.27 (SA2) regarding set 4.
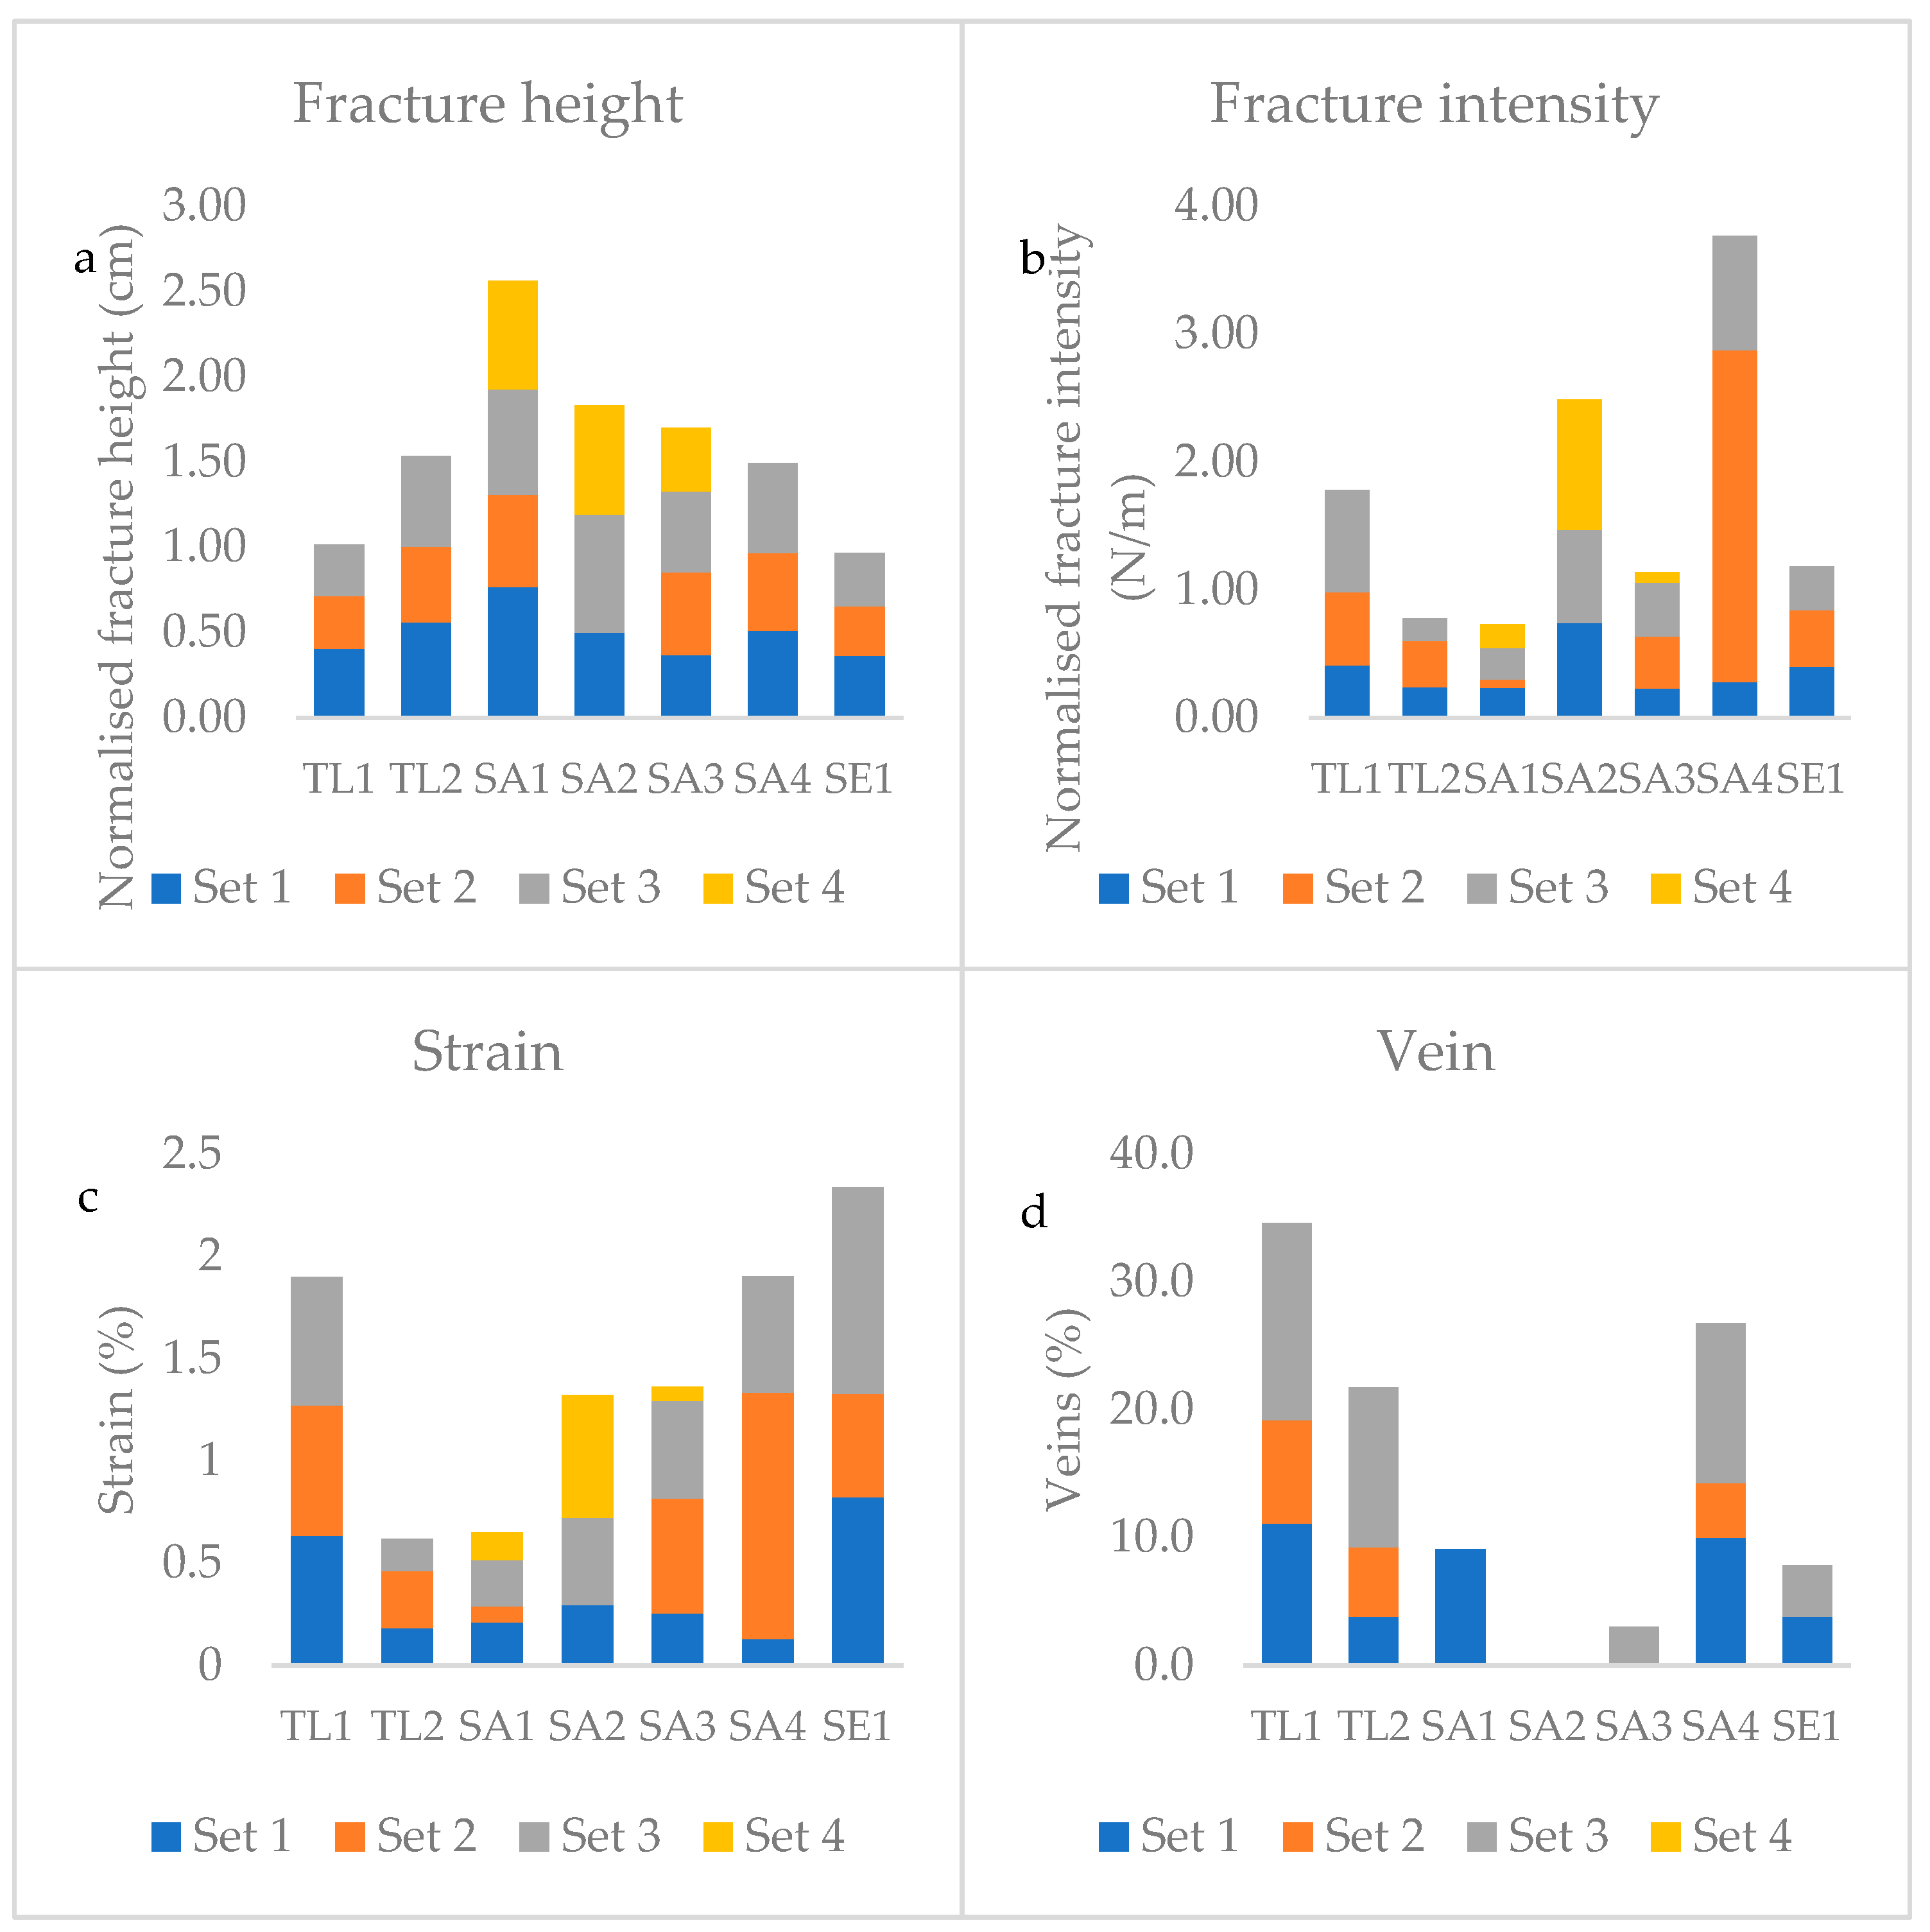
The computed 2D fracture porosity represents an index of the petrophysical properties of the analysed beds and their suitability for fluid flow migration processes. This parameter depends not only on fractures apertures and height but, also, on fracture intensity and percentage of veins or filled fractures characterising the bed. In order to discern the relationship between these features and the related bed fracture porosity, normalised fracture height (cm), normalised fracture intensity (N/m), strain (%) and veins (%) were calculated and shown in
Figure 12. According to the aforementioned stratabound fractures definition, the height and intensity of this type of fractures are strictly related to bed thickness. Therefore, to ensure a proper comparison among beds belonging to different outcrops, these two parameters were normalised with respect to the bed thickness (
Figure 12a,b). The computed strain (
ε) is shown in
Figure 12c, giving an idea of fracture sets apertures. It was meant as the one-dimensional stretching of the analysed layer, calculated by dividing the total apertures value (Σ
a) by the original surveyed bed length. This latter was obtained by subtracting the total apertures value (Σ
a) from the scan line length (
L), so that:
The highest strain value was 2.34% (SE1), whereas the lowest were 0.62% (TL2) and 0.65% (SA1). The graph in
Figure 12d showed the percentage of veins observed in each scan line. This is, evidently, an important parameter regarding fluid migration, since filled fractures cannot represent a suitable pathway. The most abundant presence of vein was observed in the bed TL1 (34.6%), whereas the bed SA2 showed no veins at all.
The relatively high 2D fracture porosity reached by SE1 bed (
Figure 11) was mainly due to the fact of its highest aperture values (
Figure 12c), despite its moderate height and fracture intensity values. The exceptionally high fracture intensity values shown by SA4 bed, along with medium to high heights and apertures values, were partly inhibited by a high percentage of veins resulting in a 2D fracture porosity value lower than SE1. Similarly, the bed TL1, showing high aperture and fracture intensity values, resulted in a fracture porosity downsized by the impact of the veins, the highest percentage observed overall. On the other hand, the lowest 2D fracture porosity values shown by TL2 and SA1 were an effect of their very low aperture values.
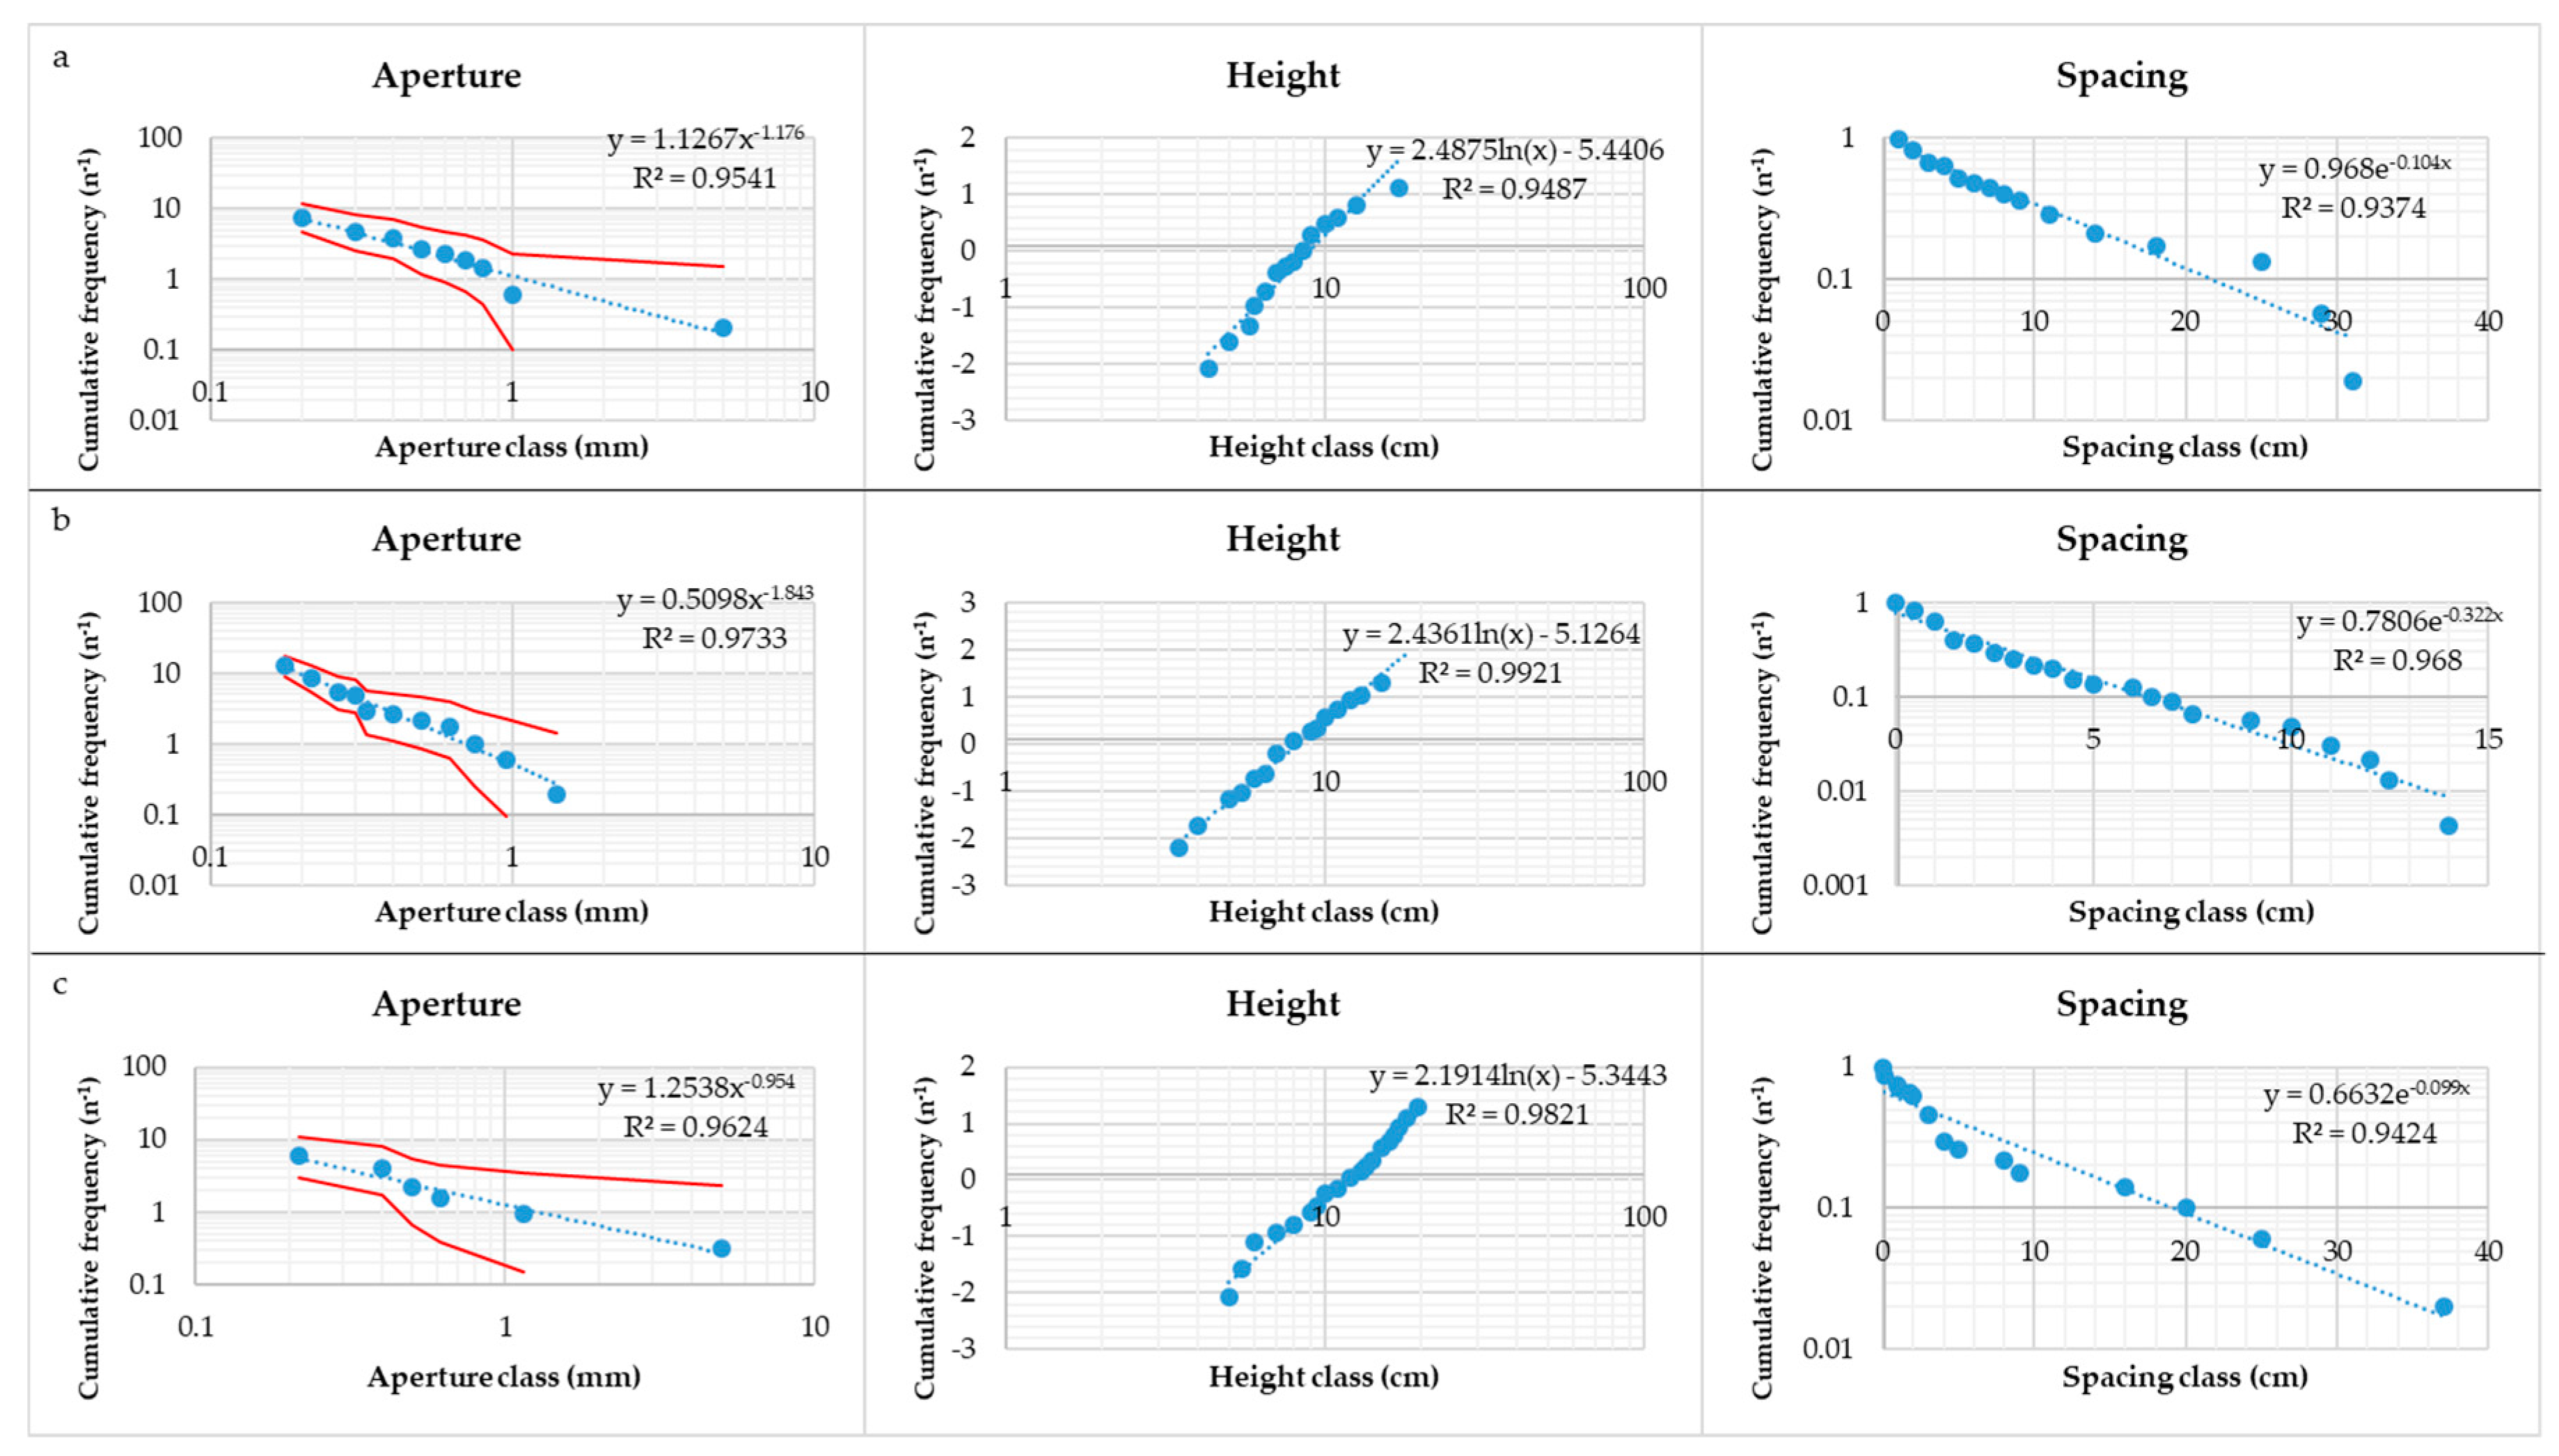
Following data sampling, aperture, height and spacing data of each fracture sets affecting the different beds and formations were statistically analysed in order to define the parameters of the laws describing their spatial distribution. Fractures were further grouped into two main classes: stratabound and non-stratabound, as defined before. The data gathered in the NW Lurestan region showed that fractures height, spacing and aperture cumulative frequency are well described by a log-normal, exponential and power law distribution, respectively (
Figure 13). For aperture data, the obtained best-fit model is a power law, represented by a straight line in a bi-logarithmic diagram, following the equation: Y = aX
b. For height data, the obtained best-fit model is a logarithmic law represented by a line in a semi-logarithmic diagram, according to the equation: Y = alnX + b. Finally, for spacing data, the best-fit model is an exponential law, represented by a line in a semi-logarithmic diagram, described by the equation: Y = ae
bX. It follows that the statistical distribution of aperture values shows a strong dependence on the observation scale: as the scale of observation is reduced, fracture intensity increases and apertures decreases; the statistical distribution of fracture height is log-normal, whereas the statistical distribution of spacing values is random [
9,
88].
The DFN modelling was performed by means of the software Move 2017. Based on multi-scale survey dataset, a stochastic distribution of the fracture sets affecting the investigated formations was elaborated, along with the petrophysical properties pattern throughout the examined carbonate succession. As shown in the final models regarding fracture porosity and permeability (
Figure 9b,c), the computed parameters were consistent with the observations carried out from the multi-scale surveys. From the meso-scale survey, the Sehkaniyan Fm. was defined as the best reservoir unit, whereas the Kurra Chine and Sarki Fms. appeared to be of lower quality. On the other hand, the macro-scale survey reported in the Sarki Fm. the lowest intensity values of fractures taller than 5 m and the absence of fractures taller than 20 m, whereas these major fractures were consistently observed in the Kurra Chine and, especially, in the Sehkaniyan Fms. This was reflected in the final models, where the Sehkaniyan Fm. was confirmed as the best quality reservoir. The Kurra Chine Fm. was considered a good quality reservoir, whereas the absence of major fractures in the Sarki Fm. had a crucial impact on its petrophysical properties and, therefore, this unit was defined as a poor-quality reservoir.
The different properties of the analysed formations can also be evaluated for the definition of potential geothermal reservoirs boundaries, where temperature conditions could be suitable for the system to become of economic interest by the application of modern technologies. Within this framework, the good reservoir characteristics of the Kurra Chine Fm. are of particular interest, as this stratigraphic unit is overlain by a potential cap rock represented by the Baluti shales. Taking into account the relatively limited porosity and permeability of the Sarki Fm. pointed out in this study, it may be envisaged that the Baluti-Sarki Fms. pair could play the role of a fluid flow barrier between a lower depth reservoir (Sehkaniyan Fm.) and a deeper and volumetrically larger reservoir consisting of the Kurra Chine Fm. This latter could represent the main regional reservoir for a potential geothermal field in the area. The presence of a seal formed by the Baluti shales and of the relatively low-porosity and low-permeability Sarki Fm. is likely to result in a compartmentalization of fluid circulation at depth, potentially giving rise to important differences in flow circuits.
6. Conclusions
In this work, we proposed a DFN modelling of an Upper Triassic–Lower Jurassic carbonate succession outcropping in the Lurestan region, NW Iran. The modelling was developed after statistical sampling of the fracture system characterising the analysed beds which belong to the Kurra Chine, Sarki and Sehkaniyan Fms. Fracture sampling was performed with a multi-scale approach, followed by the integration and the analysis of the data gathered at two different observation scales, for a total of 1042 fractures collected. The macro-scale survey was carried out by means of a digital line-drawing based on camera-acquired images. The digitization of bedding surfaces and fractures structures led to the identification of hierarchical mechanical boundaries, which can have a strong impact on the overall fracture system architecture. At the meso-scale, sampling was performed with the scan line method, for a total length of about 19 meters, focussing on the background fractures. Subsequently, the collected data were statistically analysed in order to define the distribution laws for fracture sets characteristics such as aperture, height, and spacing. The obtained best-fit regression is a power law for aperture data, a logarithmic law for height data and exponential law for spacing data.
Following the multi-scale data sampling, 3D DFN models were developed by means of the software Move 2017 “Fracture Modelling” module. A basic “GeoCellular Volume” of the examined units was reproduced and characterized with intrinsic parameters relative to each analysed lithology and formation. Fracture sets features data were used as input to generate the DFN in the 3D models, in which the variations in the potential reservoirs rock volumes of some crucial petrophysical parameters, such as porosity and permeability, were shown. These features play a primary role in a reservoir performance. The elaborated models confirmed the crucial impact of throughgoing fractures on the related beds petrophysical properties. These major fractures, crosscutting several beds, have a paramount role in linking together smaller fracture systems otherwise isolated to each other, improving reservoir porosity and, especially, permeability attributes. Therefore, the Kurra Chine and Sehkaniyan Fms., benefitting from the occurrence of throughgoing fractures with relatively high intensities, showed good petrophysical properties, providing suitable fluid migration pathways and were considered as good-quality reservoir units. The Sehkaniyan Fm. showed well-developed background fracture sets with relatively high aperture values at the meso-scale analysis. On the other hand, the Sarki Fm. was characterised by medium to high fracture height and intensity values and medium to low fracture aperture values at the meso-scale, but the paucity of major throughgoing fractures observed at the macro-scale survey determined the lowest relative permeability and porosity values, resulting in a poor-quality reservoir unit. The analysis of this fractured carbonate reservoir analogue led to the definition of the fracture network architecture and the related geometries, providing useful constraint to support and calibrate subsurface data.
