Article

Evaluation of Remote-Sensing based Estimates of Actual Evapotranspiration over (Diverse Shape and Sized) Palmiet Wetlands

Rhodes University, Artillery Rd, Grahamstown 6139, South Africa
*
Author to whom correspondence should be addressed.
Geosciences 2019, 9(12), 491; https://doi.org/10.3390/geosciences9120491
Submission received: 23 September 2019 / Revised: 18 October 2019 / Accepted: 29 October 2019 / Published: 22 November 2019
(This article belongs to the Section Hydrogeology)

Abstract

:
Accurately quantifying actual evapotranspiration (ETa) over wetlands is important for the improved management of these ecosystems, since 65% of them are threatened by clearing or drainage in South Africa. This study evaluated a range of available estimates of ETa over six palmiet wetlands, which are key ecological structures in terms of water regulation and sediment trapping. The research compared three remote sensing based products (a local product, FruitLook, and two global data products, MOD16 ET and EEFlux) across different rainfall years (2008 to 2019). Their outputs were validated, where possible, with limited ground-based scintillometer data on the Krom palmiet wetland, which indicated that MOD16 and EEFlux were most representative of ground-based measurements. We also compared the small pixel size EEFlux data over three wetlands with ETa over increasing buffers of land cover (100, 500, 1000 m) in order to validate the perception of these wetlands being high water users. While larger wetlands had slightly higher evaporative demands than adjacent areas, ETa over a small wetland was similar to neighboring land cover. The results indicate that palmiet wetland ETa is highly variable and dependent on external factors such as climate, wetland size and seasonality.

1. Introduction

Wetlands are vital ecosystems in terms of supporting water resource ecosystem services. Some of the key services they provide include the regulation of water supplies, the mitigation of floods and droughts, and the improvement of water quality [1,2]. However, when it comes to land use planning, terrestrial ecosystems are favored over wetlands [3], and this has resulted in 50% of the Earth’s wetlands vanishing over the last century [4]. In South Africa, 65% of wetland ecosystems are regarded as threatened [5], which has prompted the initiation of large-scale wetland restoration programs largely through the nationally funded Working for Wetlands Programme [6,7]. However, these restoration programs are hindered by the lack of knowledge of many of South Africa’s diverse wetland systems, in particular around the hydrological functioning of these wetlands [8,9].
Palmiet wetlands found in the Eastern and Western Cape of South Africa are particularly threatened and poorly understood [10]. Palmiet wetlands are abundantly populated by palmiet plants (Prionium serratum) which are robust, tall stemmed plants that grow in dense stands typically forming unchanneled valley bottom wetlands. Palmiet wetlands are able to withstand the periodic flooding that occurs in the geological Cape Fold Belt region (Cape Supergroup geological formation). Their resilience to flooding is largely due to their height, and the thick network of fibrous roots that grow significantly deeper than other similar wetland plants (sometimes up to five meters deep) [11]. Due to their structure, palmiet wetlands perform key water regulation and sediment trapping services in South Africa and are important for water supply in many areas [12]. Rebelo [10] determined that floods are more prevalent, and baseflows less reliable, where the palmiet wetlands have been damaged or destroyed.
The Cape Fold Belt is home to the biodiversity hotspot, the Cape Floristic Region in which palmiet wetlands are exclusively found. Job [13] postulates that the folded and fractured quartzites of the Langeberg Mountains are an important source of water to the Goukou palmiet wetland (Western Cape), and that this sustained water source appears to be sufficient enough to generate hydrological conditions that support peat formation. Similarly, Smith [14] found that the folded and fractured quartzites surrounding the Krom palmiet wetland were key to ensuring a consistent water supply in the form of sub-surface water. Job [13] and Smith [14] suggest that without this sustained groundwater discharge from the Cape Fold Belt quartzites the wetlands would probably not exist in their current form, and that palmiet is possibly reliant on a consistent water supply for its existence and survival. This is supported by the fact that during a recent prolonged and severe drought in the Krom river valley, many tributaries continued to flow, and the palmiet wetland, despite low water levels that exposed the extensive root systems, continued to thrive. This is important as it suggests that palmiet plants require a consistent supply of water, which implies that their typical rate of ETa could be high. However, the palmiet plant has significantly sunken stomata indicating that transpiration from the plant may be less than that of typical wetland plants [10]. Evidence of efficient water use by palmiet plants would promote palmiet wetland protection and restoration.

1.1. Wetland Evapotranspiration

Evaporation and transpiration are the combined loss of water from open water surfaces, bare soil, canopy interception, and vegetation transpiration [15]. Due to the abundance of aquatic vegetation, the transpiration component usually dominates in wetland areas [16]. In addition to the interception and transpiration potential, wetland vegetation slows down water flow, which causes water to spread over a wider area thereby causing the evaporation and ultimately the evapotranspiration potential to increase [17,18]. Because of the diversity of wetlands and the numerous interrelating factors involved, accurate quantification of the actual evapotranspiration (ETa) losses on wetlands is difficult [15,19]. The high spatial and temporal variability in ETa among wetlands and the numerous techniques employed in quantifying ETa has led to widely divergent estimates of ETa [20]. There is no universal device that can be used to measure total amounts of ETa in a straightforward manner [21].

1.2. Use of Remote Sensing for Quantifying Actual Evapotranspiration

Remote sensing techniques can help to improve estimation of ETa in several ways; they are mainly recognized for their ability to map out ETa in a spatially and temporally distributed manner [22]. The expanded temporal and spatial scales of remote sensing based techniques allows them to represent the heterogeneities that exist in evapotranspiration fluxes better than conventional ground-based point measurements [15,23]. Nonetheless, ground-based measurements are consistent and accurate and they are needed to validate remotely sensed estimates of ETa [24].
The current study looks at a range of available estimates of ETa over palmiet wetlands, and compares and identifies the most reliable estimates from remote sensing sources. The study therefore also contributes to improving confidence in various remotely sensed evapotranspiration products for use in other environments. This study had three major objectives:
(a)
To compare ETa data from three remote sensing products for a range of diverse shape and sized wetlands;
(b)
To compare/validate the remote sensing-based ETa with limited ETa estimates from ground-based scintillometer data;
(c)
To evaluate if ETa over the wetlands is higher than surrounding land cover using remote sensing data for three different sized wetlands.

2. Materials and Methods

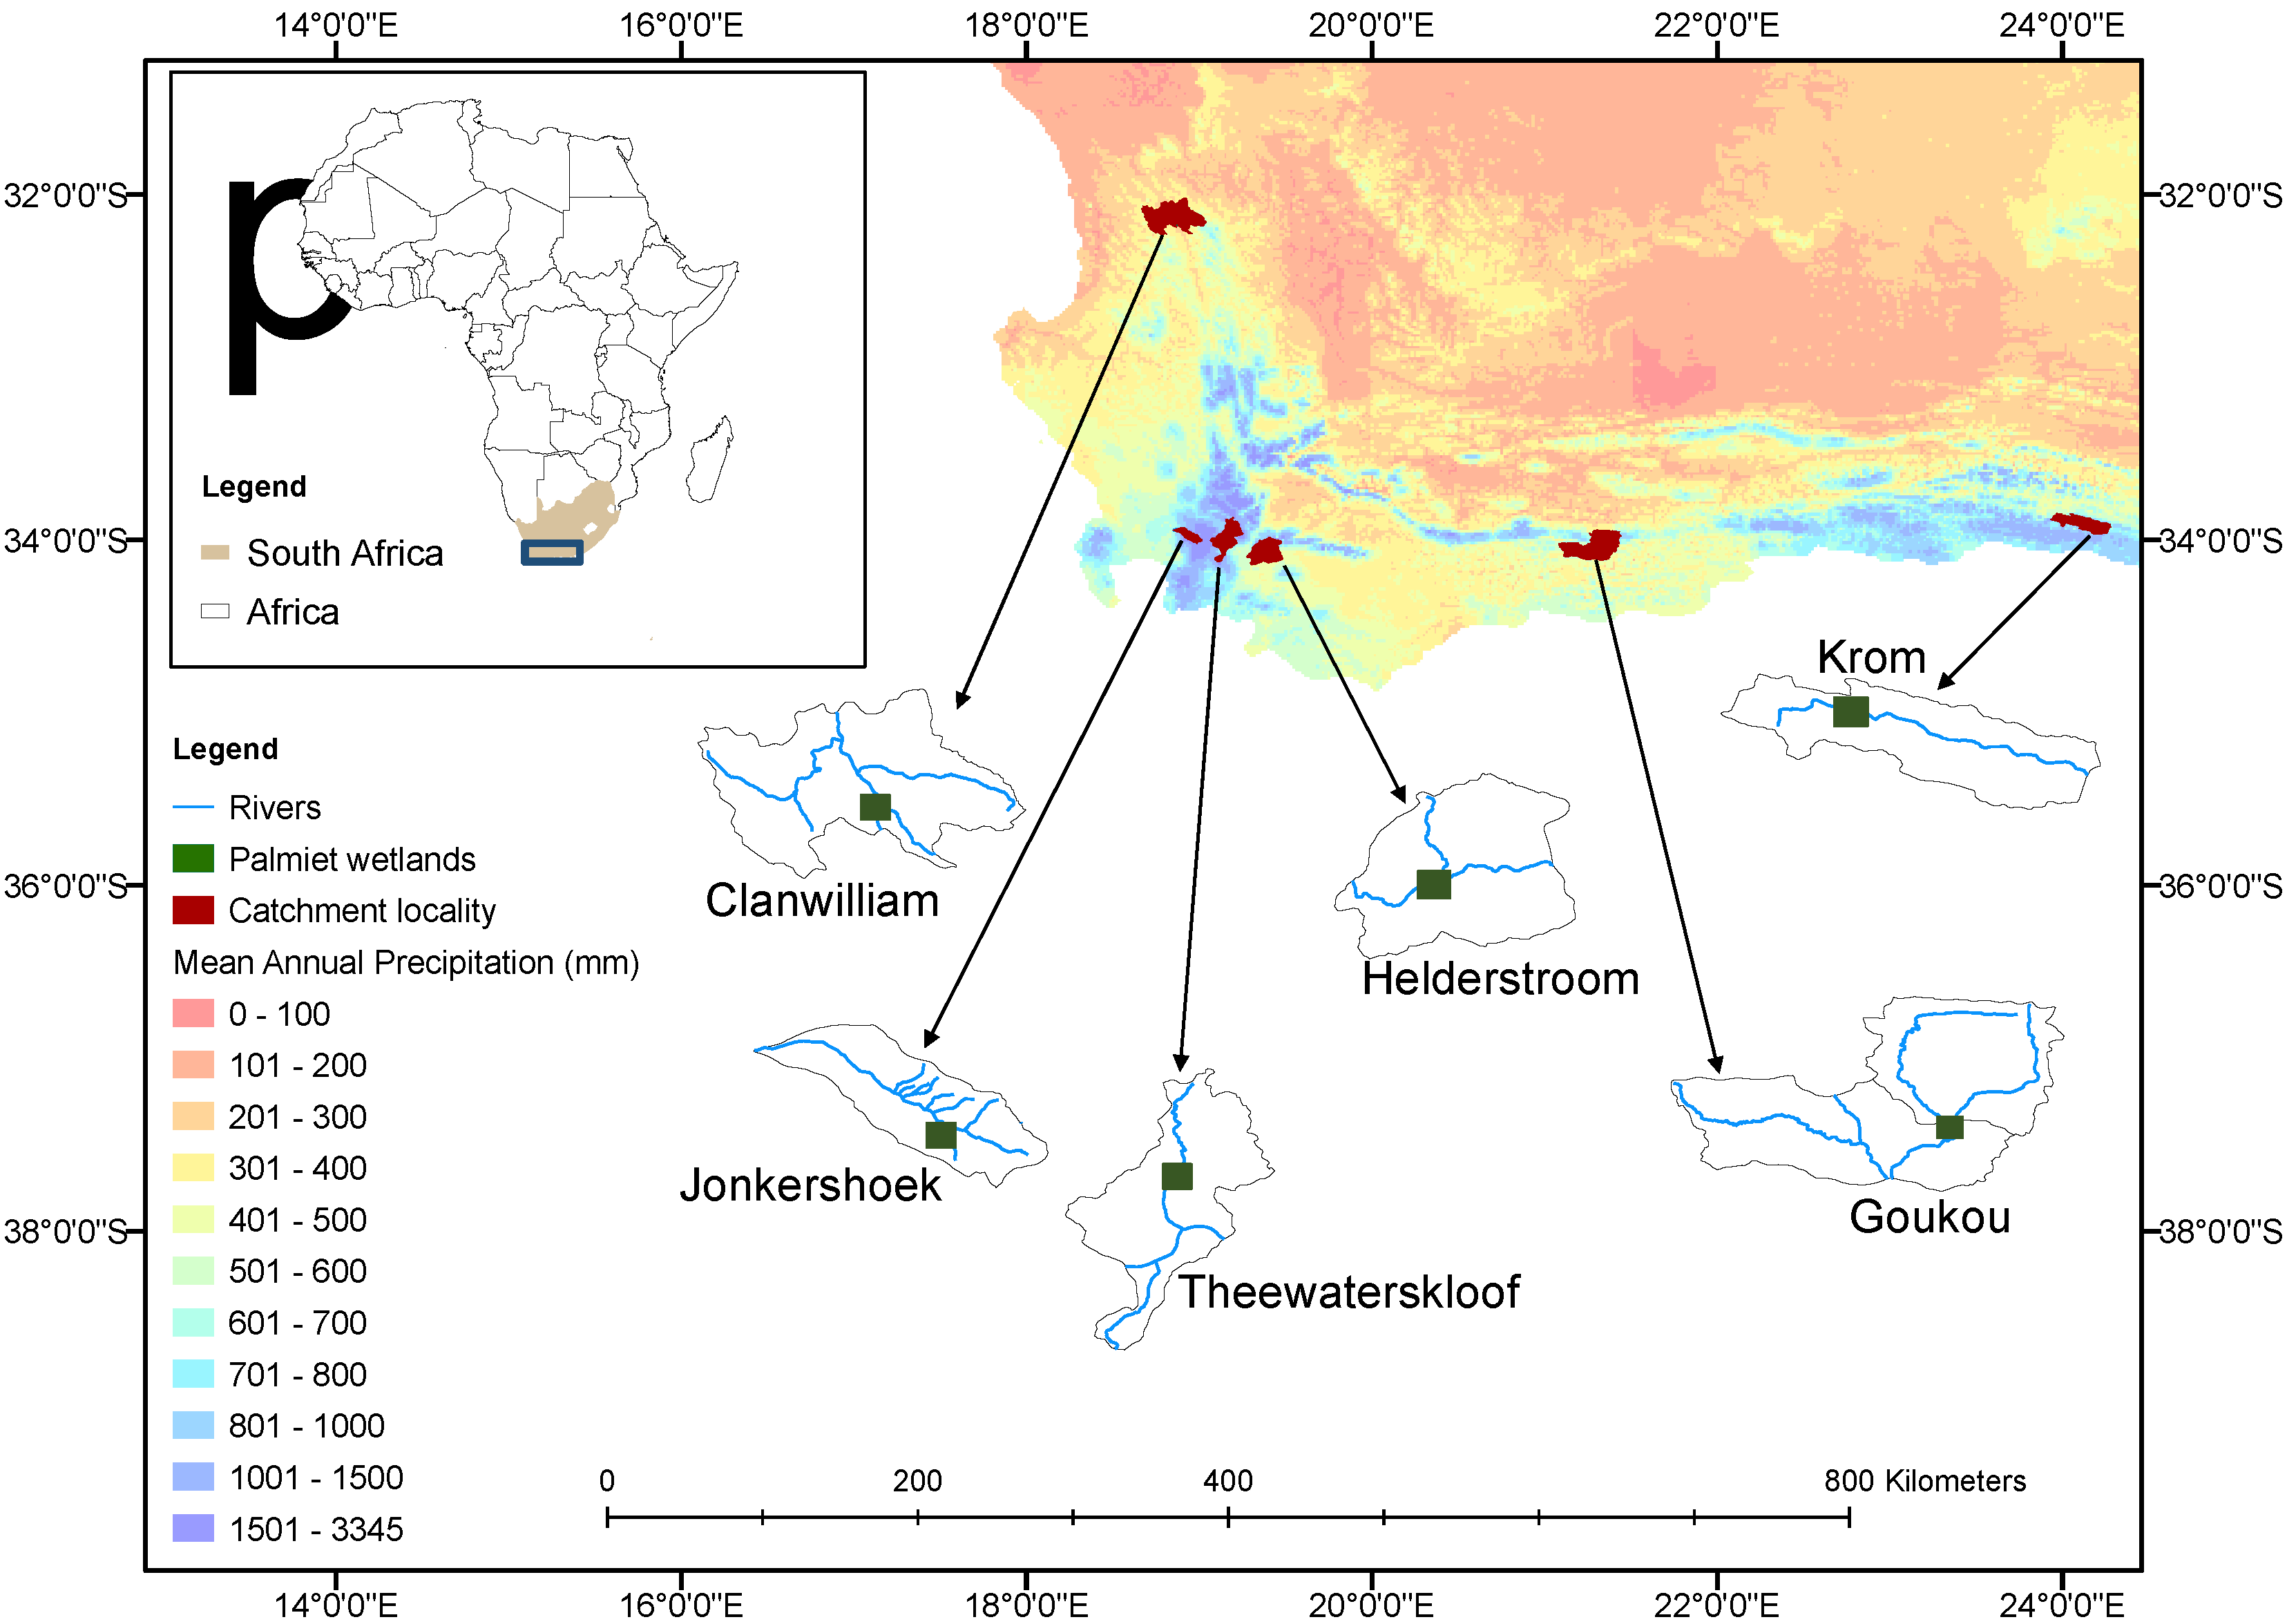
2.1. Study Area: Location of Palmiet Wetlands

Six palmiet wetlands located in the Eastern and Western Cape of South Africa, with available ETa data, were selected for this study (Figure 1). These wetlands, Clanwilliam, Goukou, Helderstroom, Jonkershoek, Krom, and Theewaterkloof, are some of the least degraded and transformed of their kind [12] and therefore offer an important opportunity to advance knowledge about the hydrology of this type of wetland. Table 1 provides an overview of some of the main characteristics of these wetlands.

2.2. Evapotranspiration Data Sources Evaluated

2.2.1. Remote Sensing Data Sources

Three remote sensing based products (FruitLook, MOD16 ET data product, and EEFLUX) (Table 2) were evaluated. These products are based on models, which compute ETa by applying highly complex automated or manual computations based on energy balance, aerodynamics, and radiation physics [22,25,26]. The models generally incorporate data such as surface temperature, surface albedo, and vegetation index acquired from satellite images (e.g., Landsat and MODerate Resolution Imaging Spectrometer [MODIS]) meteorological data (air temperature, wind speed, and humidity) together with digital elevation and land cover data [22,25,26]. Appropriate algorithms are then applied to these data to derive ETa estimates. The data relevant for the specific wetland were extracted using shapefiles of the wetland, and the mean value of the pixels within the wetland area are reported here.

2.2.2. Scintillometer

Scintillometer ETa data were derived by taking direct, on-site measurements of sensible heat flux densities (H) and weather data to obtain the latent heat fluxes (LE) from the energy balance equation [28]. This was followed by converting LE to obtain ETa. Scintillometer data used in this study were acquired from two study areas including data obtained from Dr Jarmain (pers. comm.; unpublished data) from the Helderstroom wetland, as well as data from a scintillometer set up by the authors on the Krom wetland. The Helderstrom data were derived by taking measurements of H at ten minute intervals for a limited number of days in October (14–29 October 2008) using the Scintec-BLS900 large aperture scintillometer. The Krom data were derived by taking measurements of H at 20 min intervals from 22 May to 22 July 2019 using a Kipp & Zonen MKII large aperture scintillometer.

2.2.3. Climate Data

Daily rainfall data (mm) generated by Climate Hazard Group InfraRed Precipitation with Station (CHIRPS) [29] were obtained using Google Earth Engine. CHIRPS data combines satellite imagery with in-situ station data to generate a rainfall time series at 0.05 arc-degrees resolution. The time period of data derived from various data sources used in the study is indicated in Figure 2.
Local climate data for the Krom palmiet wetland were obtained from two different sources due to availability (Figure 2). This included a weather station run by DuToit Agri, located 13 km north of the study site within the same valley, and a weather station run by the South African Agricultural Research Council (ARC) located 17 km away but nearer to the coast. The weather stations measured hourly rainfall, temperature, relative humidity, solar radiation, and wind speed, and the Penman–Monteith equation was used to produce a time series of ETo. A comparison of the two data sources over 5 months of overlap (January to May 2018) indicated that the ETo were very similar (Figure 3), but that the ARC rainfall data were significantly higher.

2.3. Data Analysis

2.3.1. Comparison of ETa for Palmiet Wetlands from Remote Sensing Datasets

The remote sensing ETa data are all produced at different temporal scales. They were all converted to monthly totals which were then analyzed as a time series graph. For MODIS this included determining a daily ETa from the summed 8-day total. The 8-day cumulative value is a summation of 7 preceding daily estimates plus the 8th day estimate. Similarly for FruitLook, this included determining a daily ETa from the summed 7-day total. The 7-day cumulative value is a summation of 6 preceding daily estimates plus the 7th day estimate.
To obtain monthly ETa estimates, the EEFlux single day value was up-scaled by multiplying it by the number of days in the month for all the study wetlands. To evaluate how coarse this estimation was, we estimated the monthly ETa for the Krom wetland using the data from the two local weather stations that are described above under the Climate data section. This involved calculating the crop coefficient (Kc) for each month by taking the ratio of EEFlux ETa and EEFlux ETo (FAO-56 approach; [30]). This is based on a reasonable assumption that the wetland vegetation does not change over the month. Then, the daily ETo from the local weather station was multiplied by the Kc to obtain daily ETa which were then summed to obtain the monthly ETa for Krom wetland. A comparison of these approaches is shown in Figure 3.
The ETa for the six palmiet wetlands were compared across different rainfall years ranging from 2015 to 2019. In addition, the monthly totals were summed over seven months (October to April, restricted by data availability) for two hydrological years (2015/16, 2016/17) from all ETa remote sensing products for the wetlands.
Outputs from all three remote sensing products (MOD16, FruitLook, and EEFlux) were compared with the measured scintillometer data where the data coincided. Similarly, daily ETa data from the EEFlux model were compared with daily scintillometer data where available.

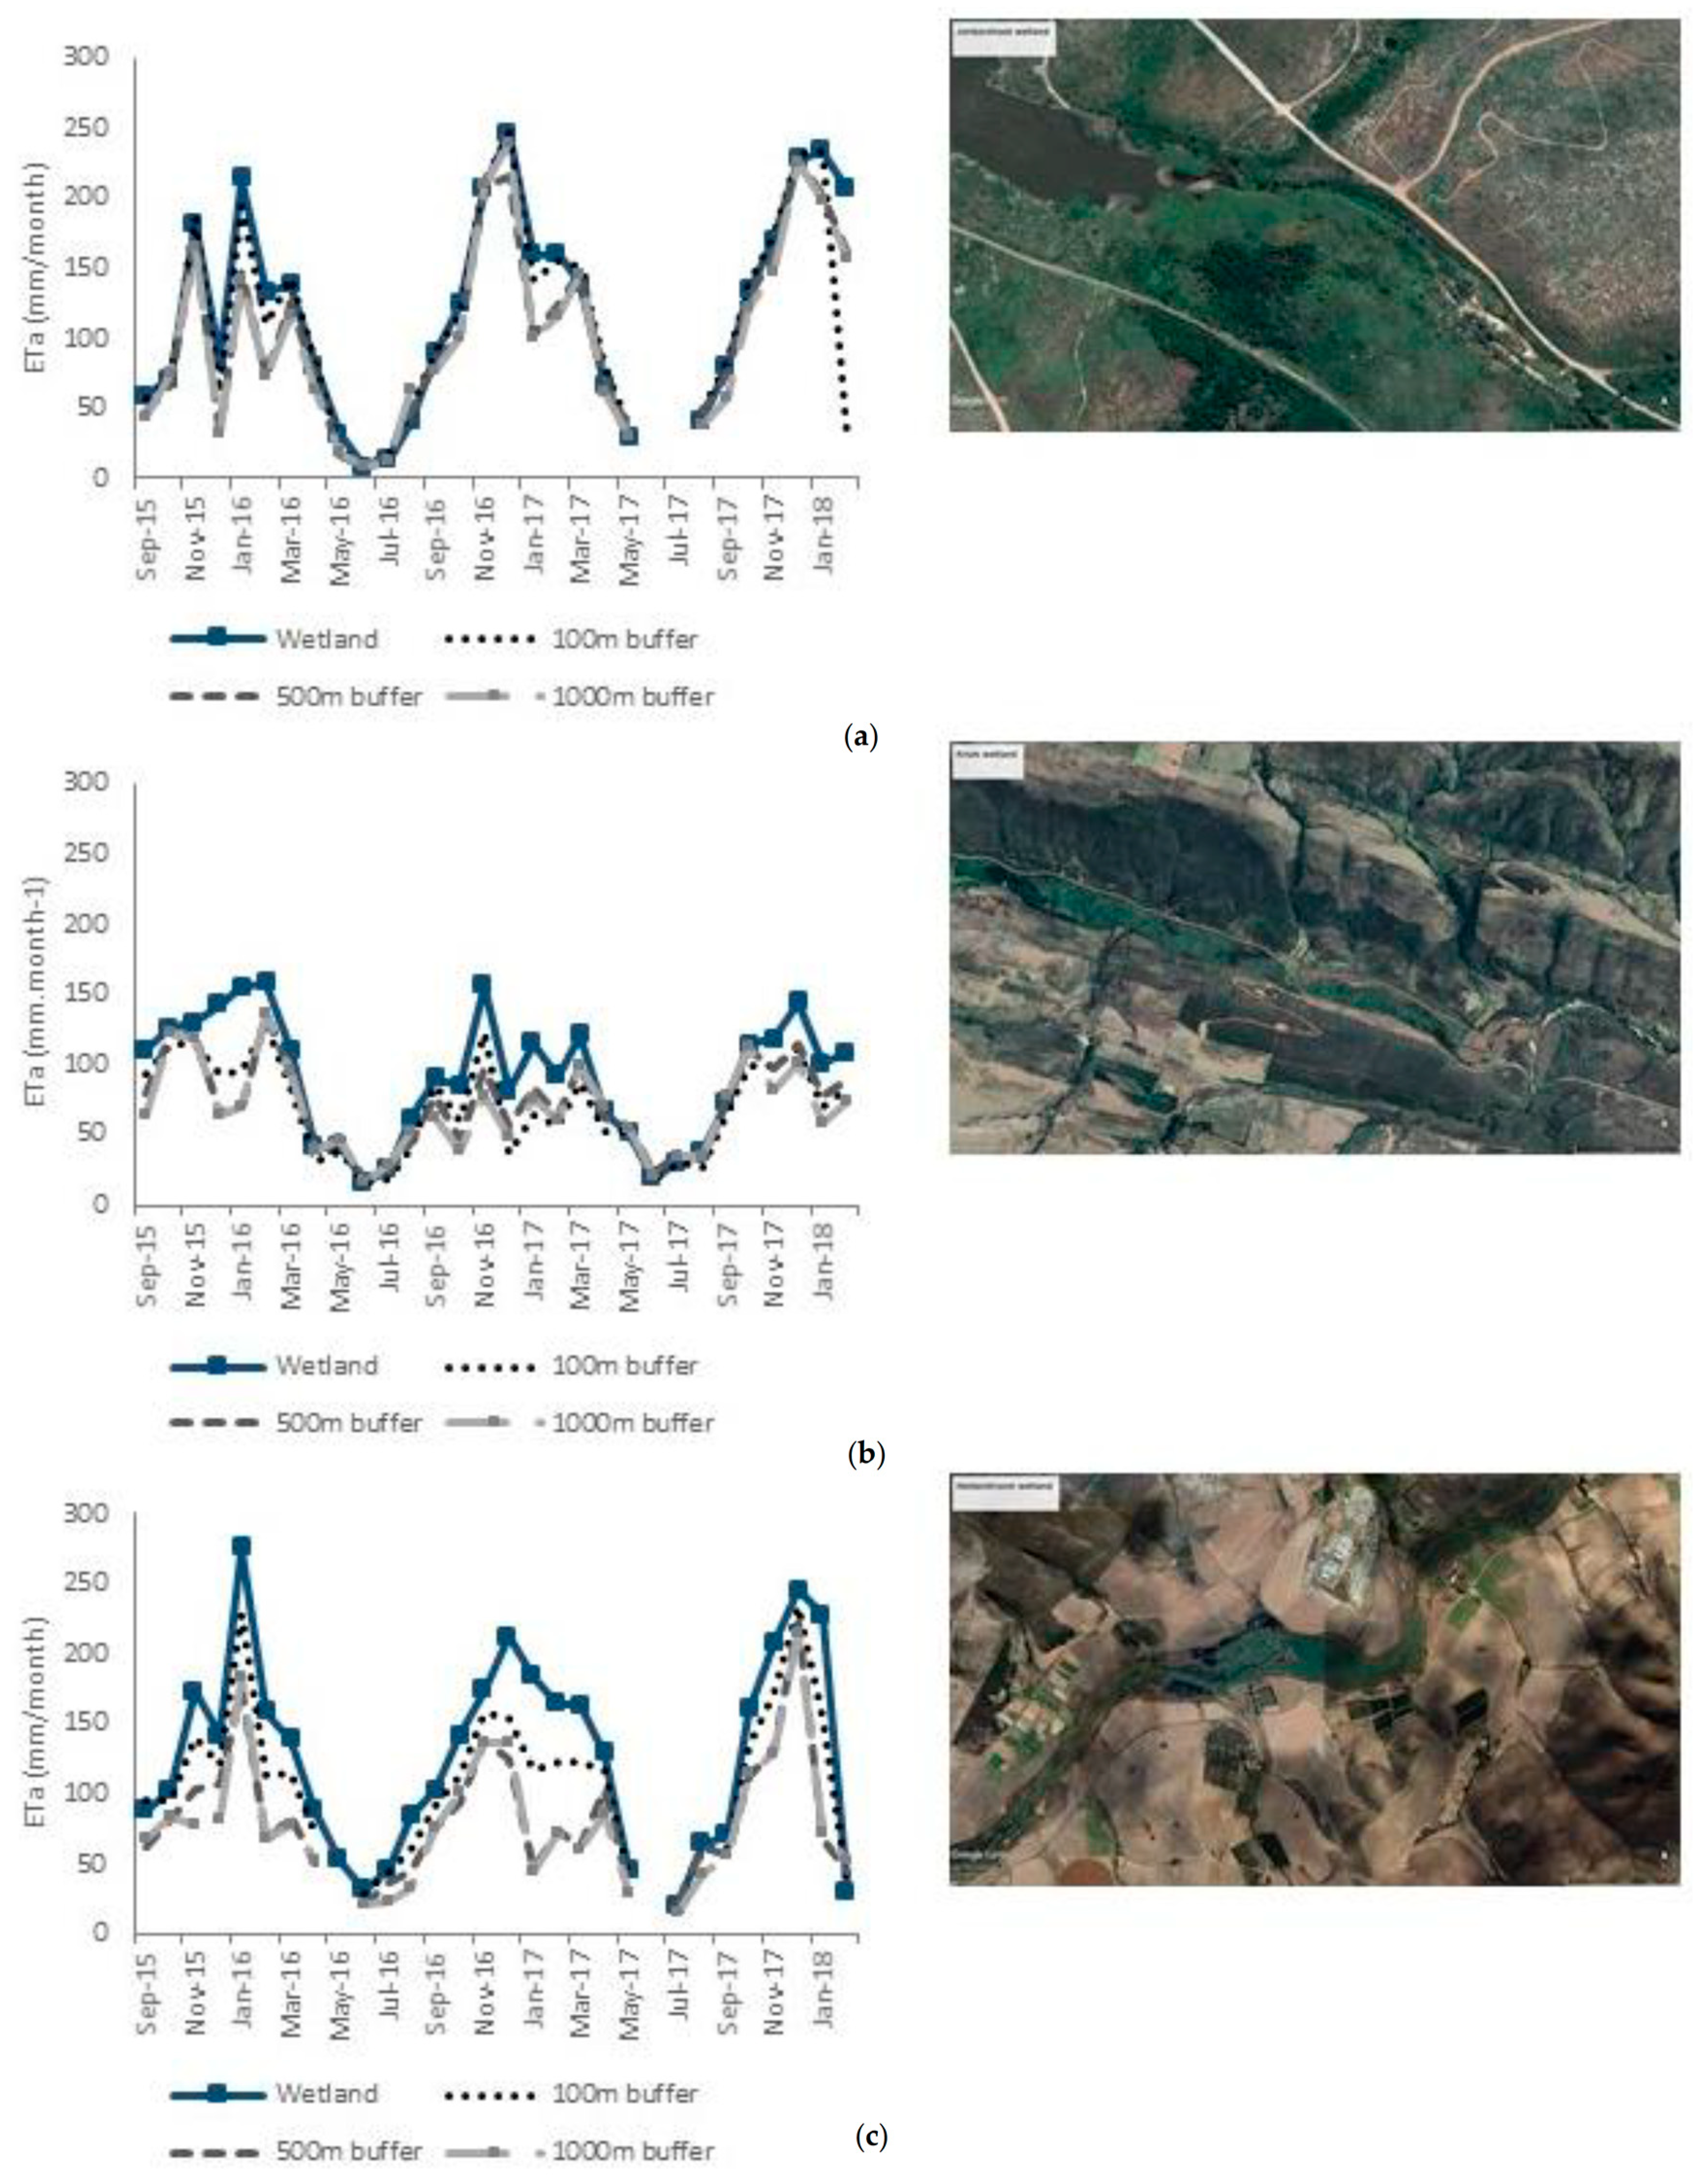
2.3.2. Comparison of ETa from Wetlands with the Surrounding Landscape

In order to evaluate whether wetlands evapotranspire at a higher rate than the surrounding land cover, we determined ETa using EEFlux over the wetland versus three wetland buffer areas (100 m, 500 m, and 1000 m). This analysis was conducted over three different wetlands (Helderstroom, Krom, and Jonkershoek) to assess if wetland size explains the differences in the results.

3. Results

3.1. Comparison of ETa for Palmiet Wetlands from Remote Sensing Datasets

Figure 4 and Table 3 show the various remote sensing outputs for ETa over the six wetlands. The time scales for the graphs vary due to different periods of data availability. Three of the wetlands (shown in grey in Figure 4) coincide with a higher rainfall region (Figure 1), and therefore the evaporative outputs are higher compared to the other three wetlands (shown in white in Figure 4).

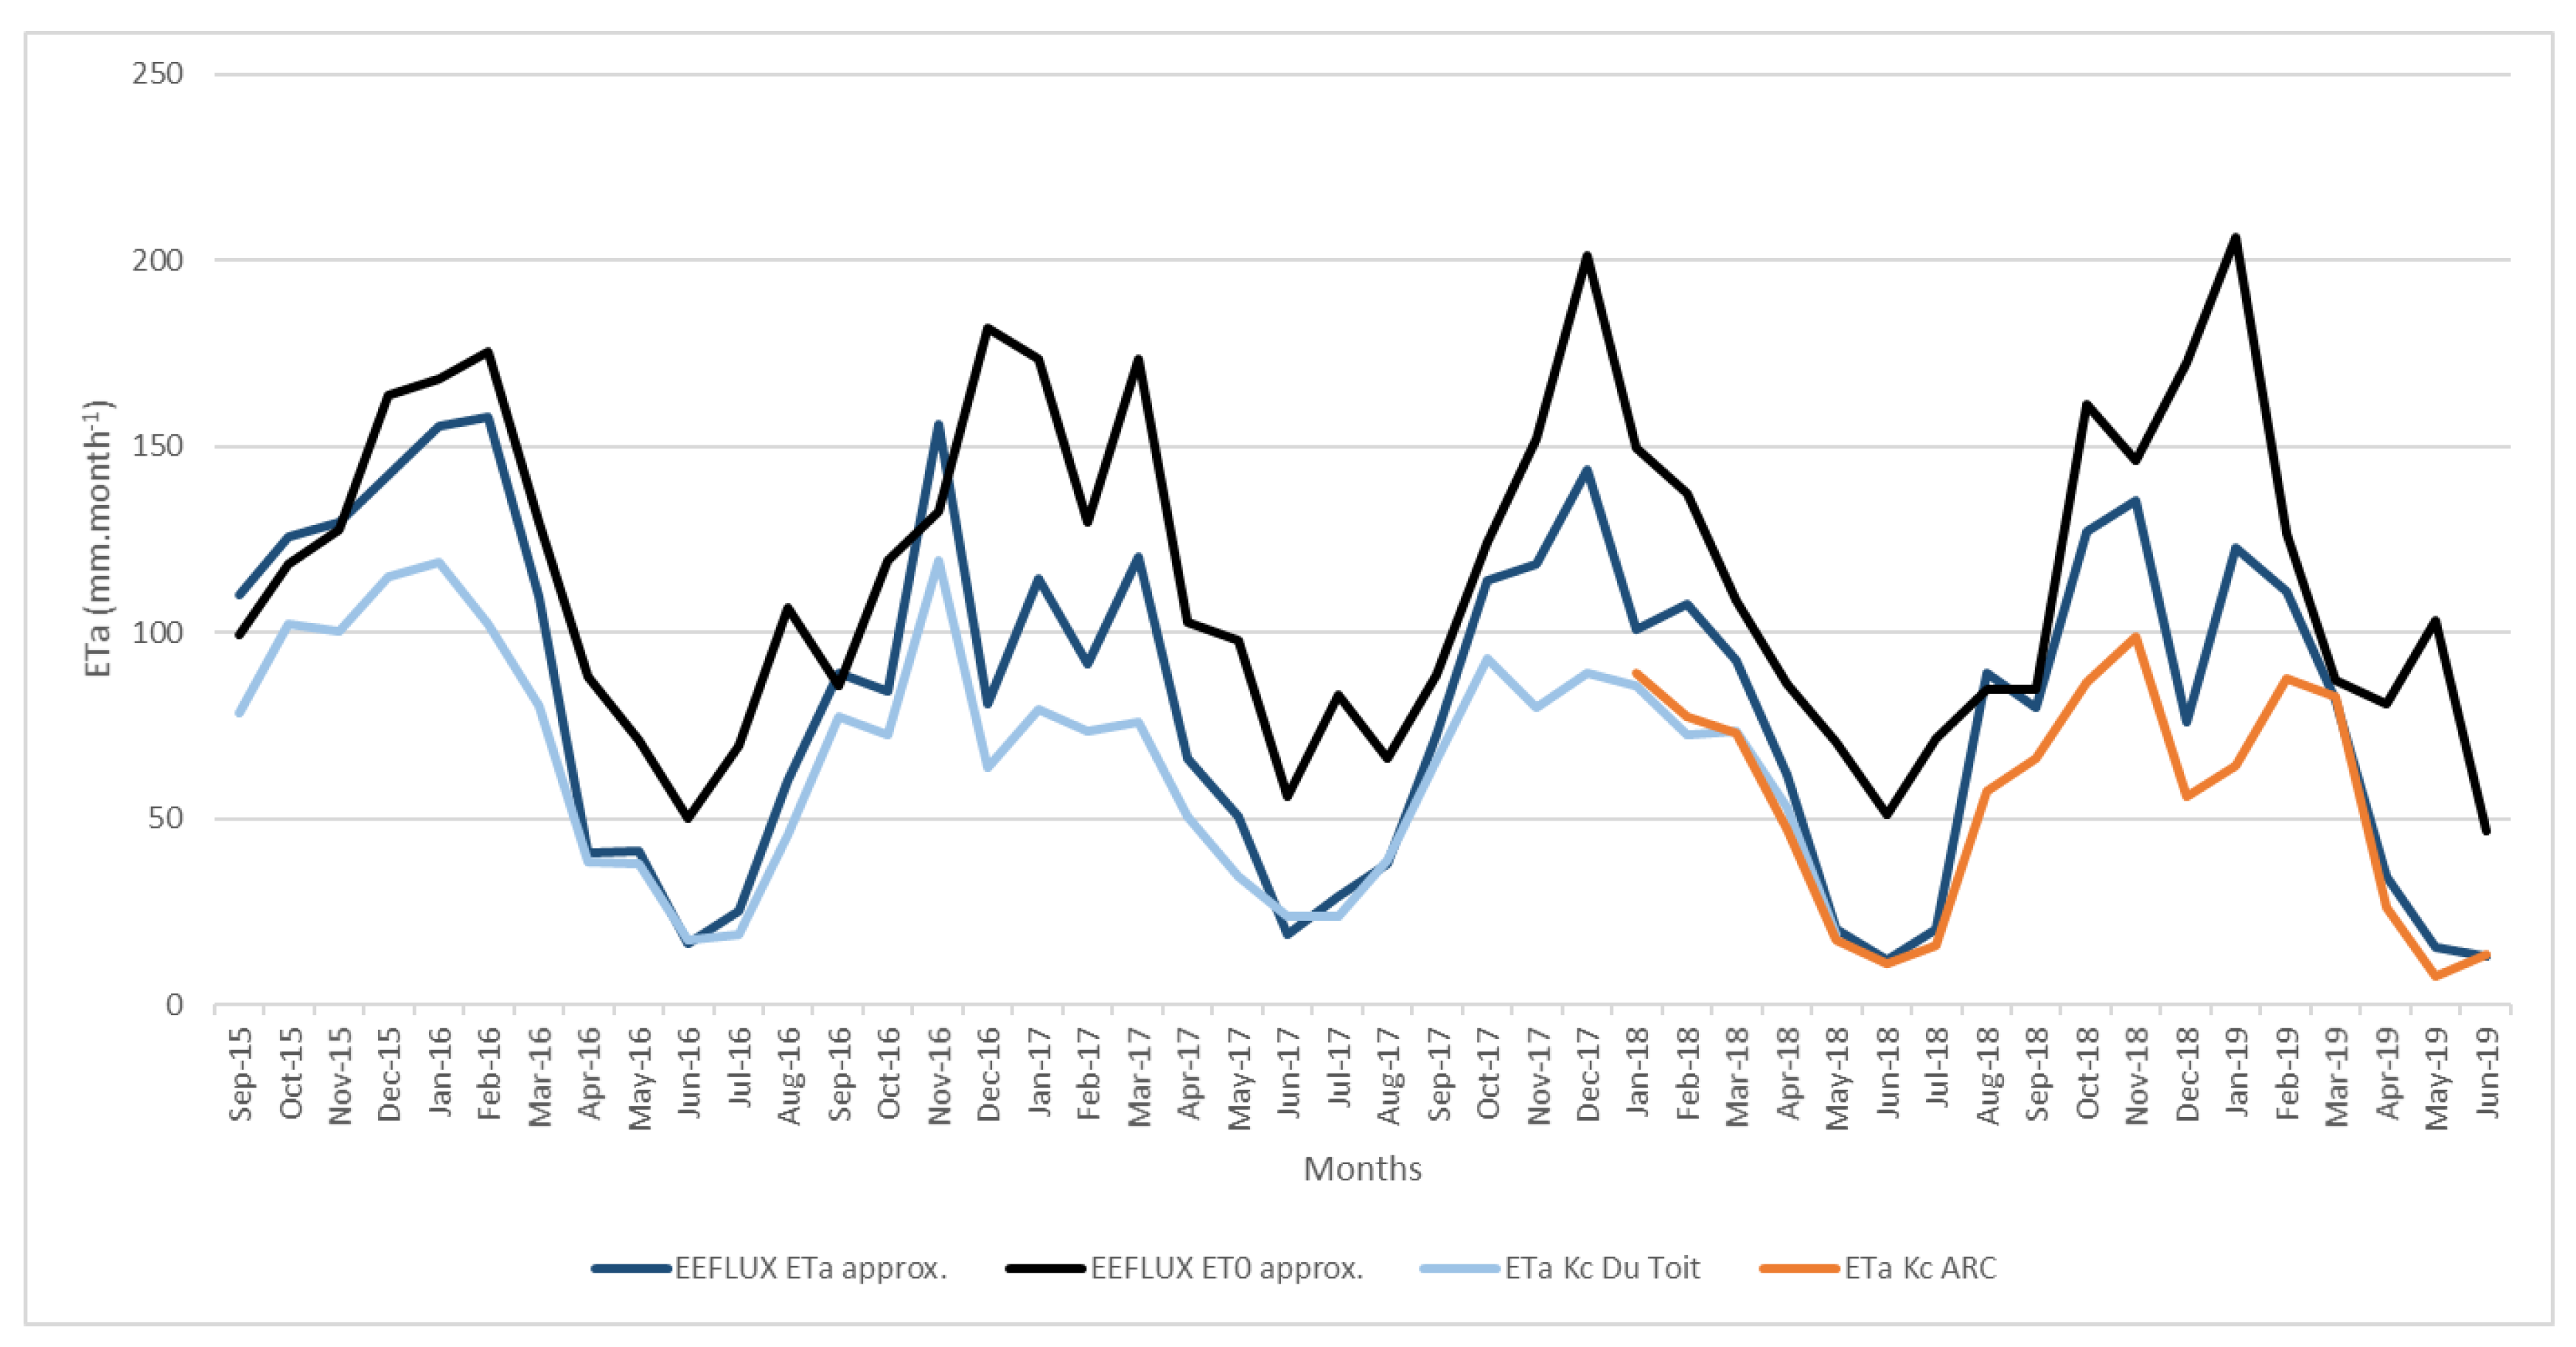
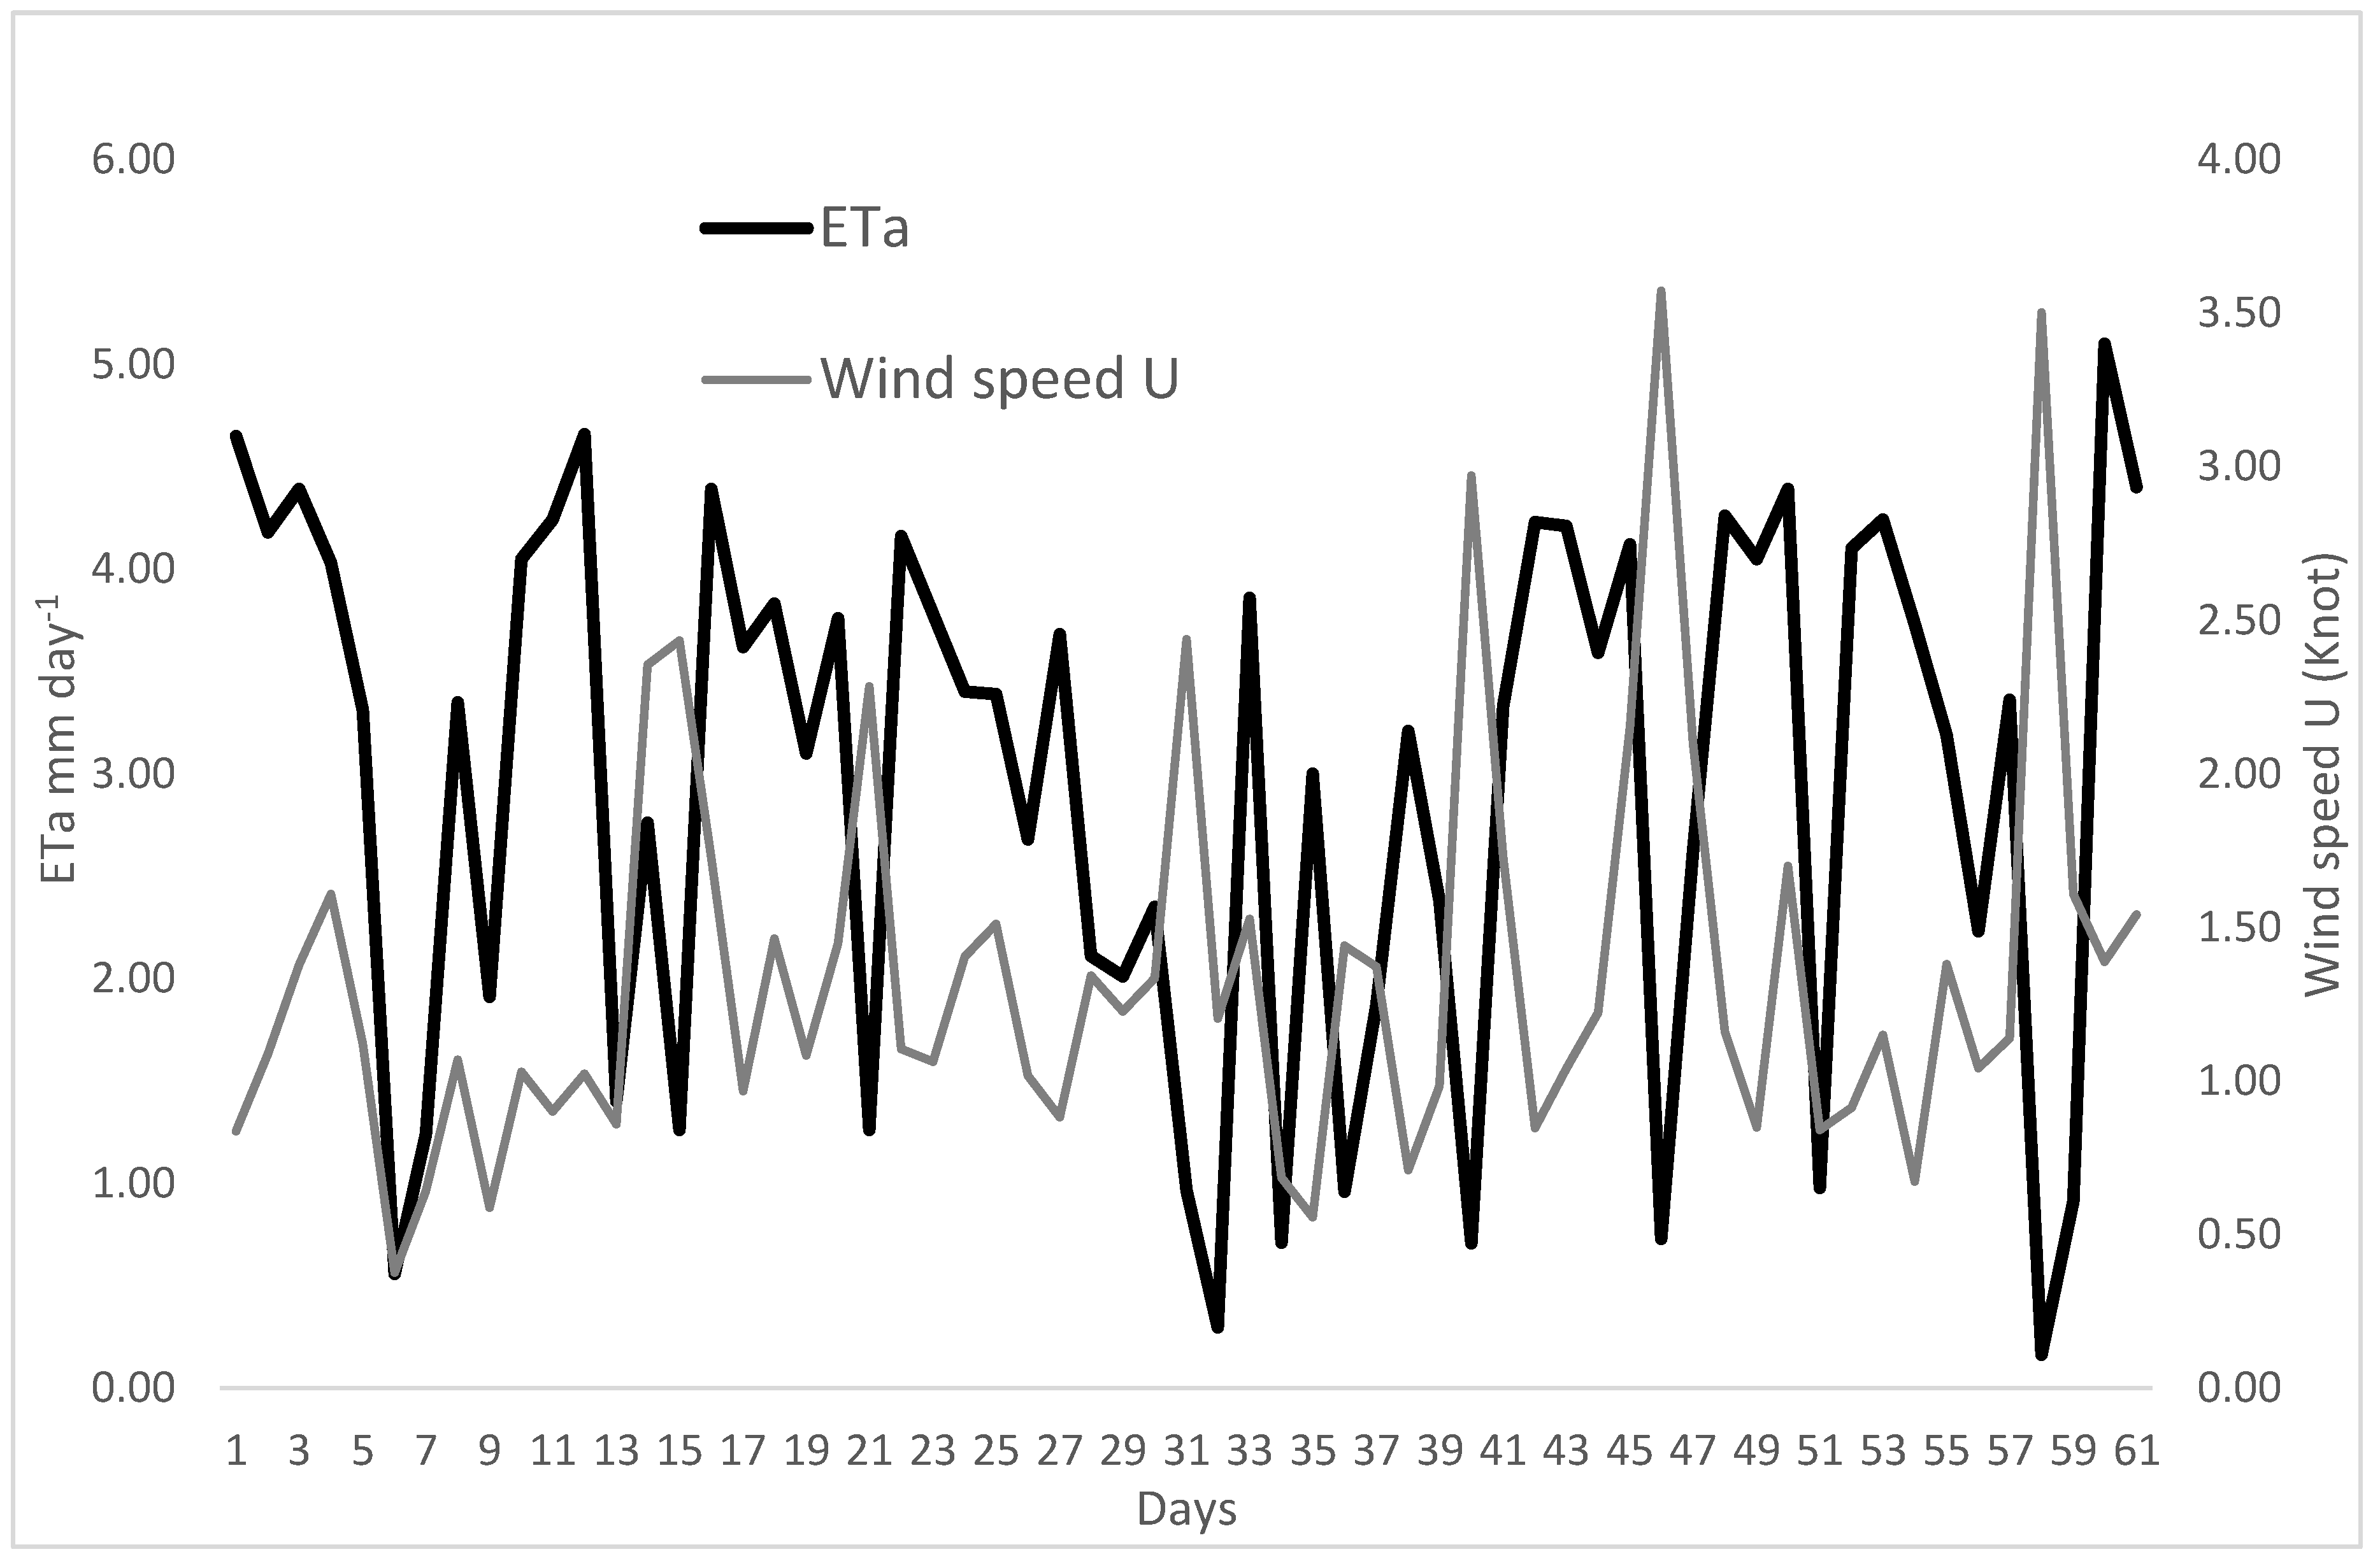
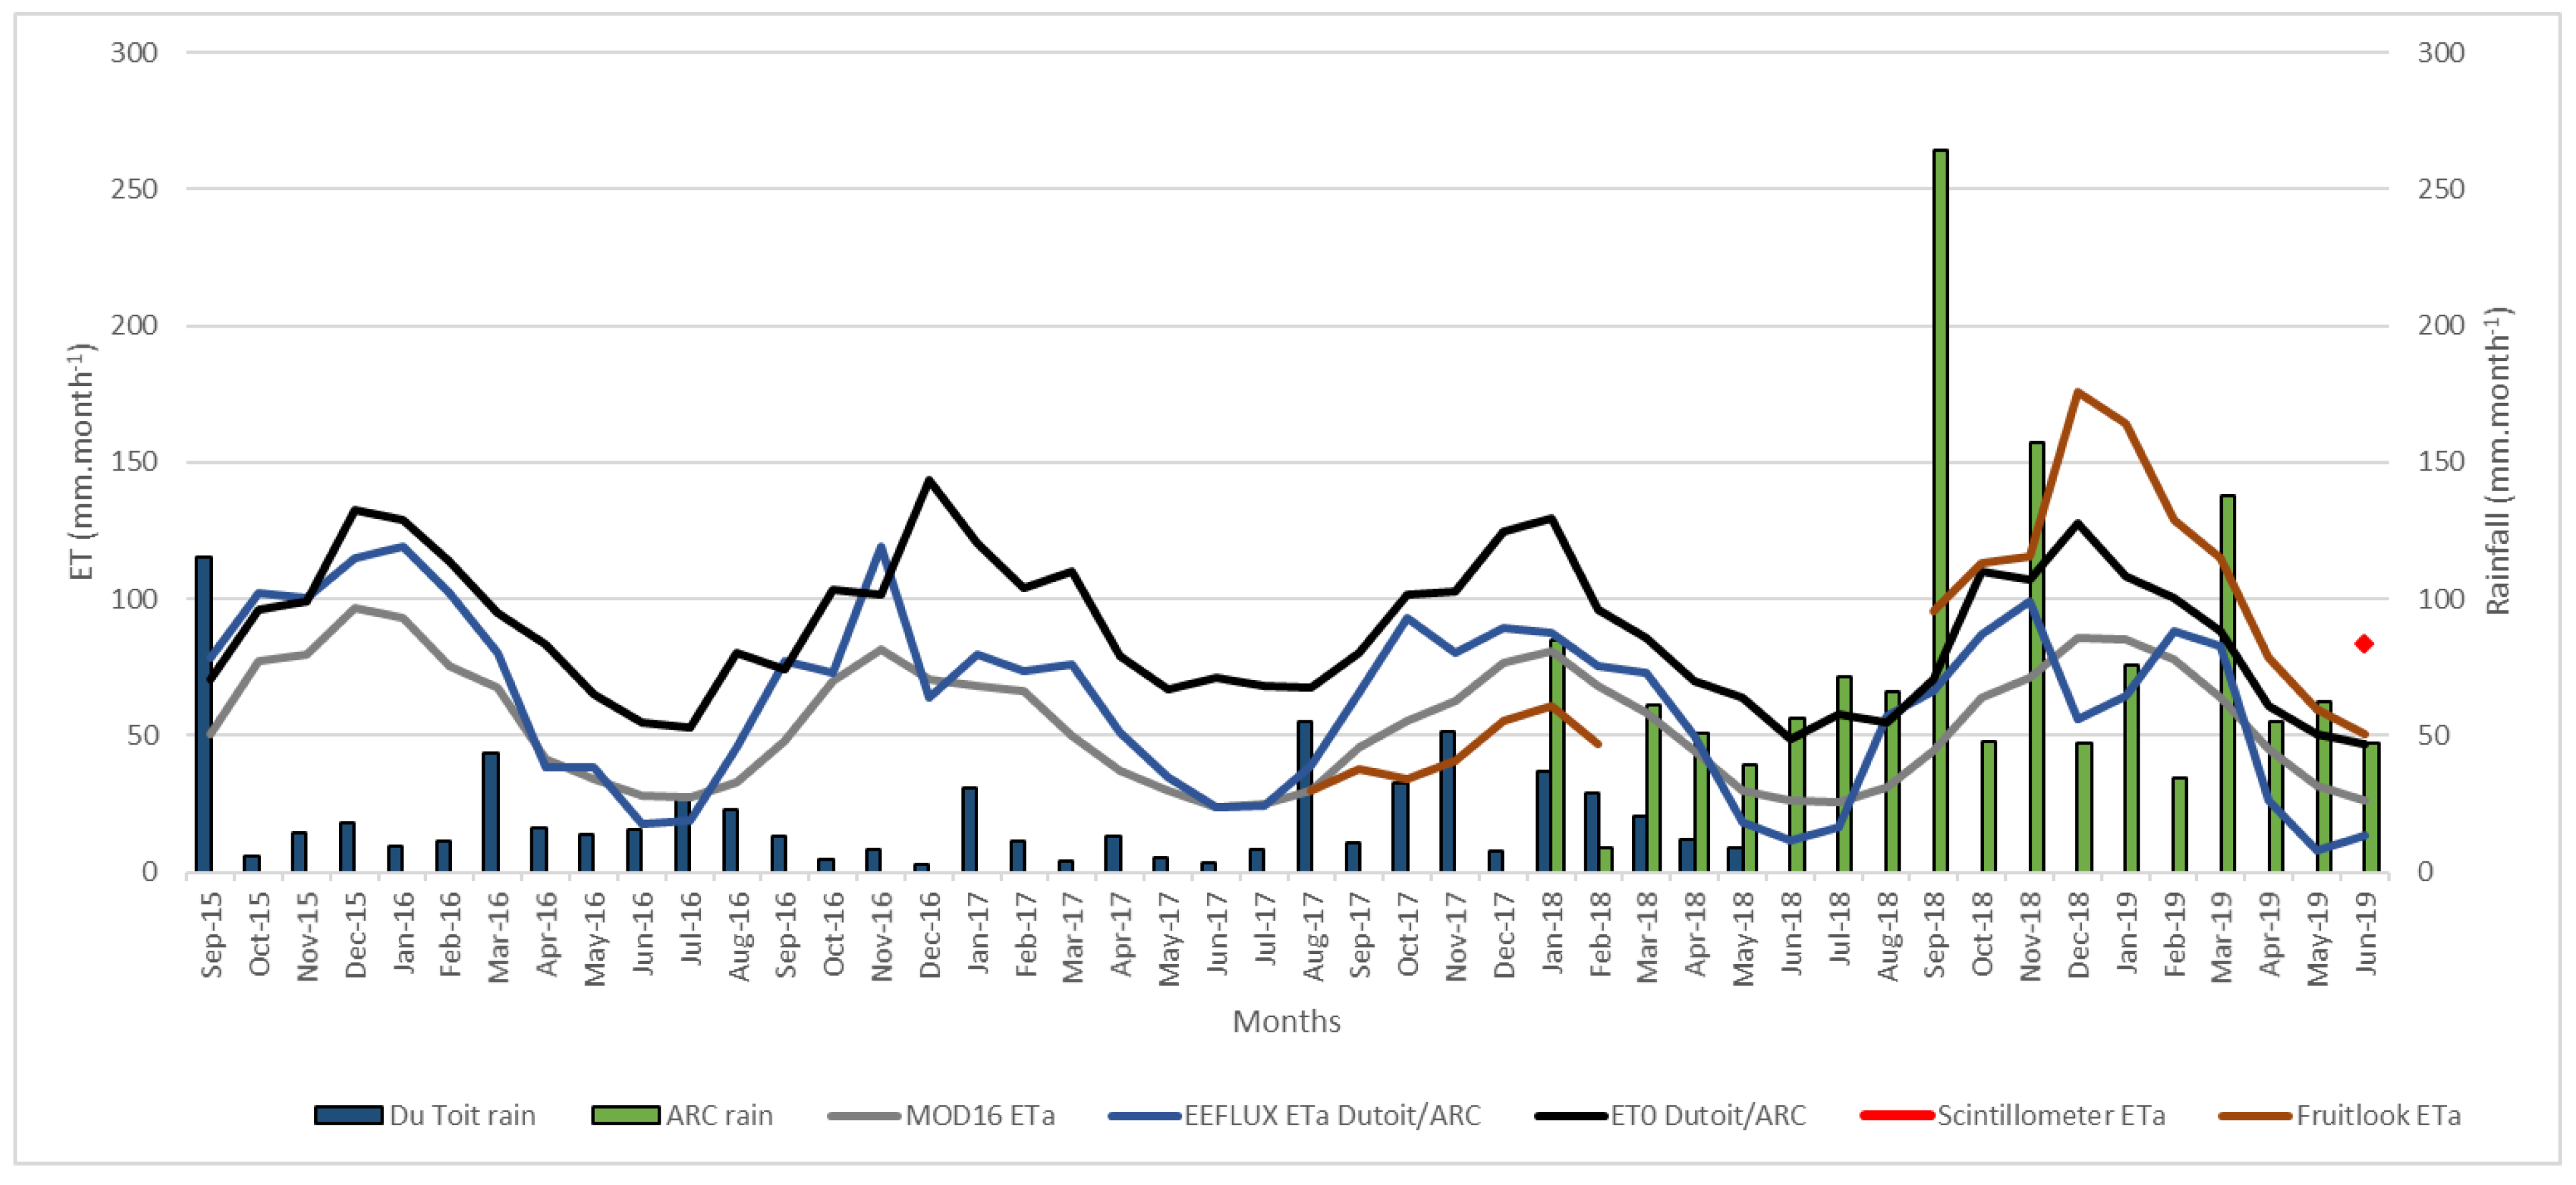
3.2. Comparison of ETa from Remote Sensing Datasets with Ground Data (Scintillometer)

Helderstroom Wetland: There were only two MOD16 ETa values available that coincided with the acquired scintillometer data over the Helderstroom wetland. The daily scintillometer data was summed to produce a cumulative 8-day value for comparison with the MOD16 8-day product (Table 4). The cumulative value of the scintillometer data (32.8 mm 8day−1) was at least two times more than the MODIS ETa cumulative value (13.97 mm 8day−1), suggesting that MODIS significantly underestimated ETa over the Helderstroom palmiet wetland. There was only one day (25 October) when Landsat 7 obtained a clear enough image to produce an estimate of ETa using the EEFlux model. A value of 4.65 mm day−1 from the EEFlux model is lower by approximately 2 mm day−1 with the ETa estimate from the scintillometer (6.5 mm day−1).
Krom Wetland: The daily scintillometer data are compared to MOD16 ETa data (a cumulative 8-day value), EEFlux ETa data (daily value) and FruitLook data (a cumulative 7-day value) in Table 5. The daily scintillometer data are shown in Figure 5.
Figure 6 illustrates the comparison between the various time series, with FruitLook estimates more sensitive to water availability in the catchment and therefore more variable than MOD16 and EEFlux estimates. Both data from MOD16 and EEFlux did not show significant sensitivity to water availability in terms of variations in rainfall.

3.3. Comparison of ETa from Wetlands with the Surrounding Landscape

It is expected that the ETa from the wetland area will be higher than that of the surrounding non-wetland areas due to constant inundation with water (even during drier periods due to groundwater input to the system). In general, all the buffers had lower ETa estimates derived from EEFLUX than the wetland; however, the estimates were significantly higher for the wetland compared to the surrounding land covers for the Krom and Helderstroom wetlands compared to the Jonkershoek wetland (Table 6 and Figure 7).

4. Discussion

4.1. Estimates of Palmiet Wetland ETa from Remote Sensing Products

Riparian and wetland plants are considered to be high water users [31,32]. This is because wetlands have an abundance of vegetation and a continuous supply of water, which contributes to high evapotranspiration rates. [17,33]. Wetland plants are however, not always high water users. Some woodlands in Zambia, for example, have a higher ET than nearby wetlands [34]. In particular, the water use of palmiet plants is unknown and the limited information on their water use [10,15,35] has resulted in wide ranging estimates, which this paper aimed to constrain.
The various remote sensing outputs were similar for wetlands grouped in similar climatic zones. The ETa estimates for the three wetlands found relatively close together in a winter rainfall area were similar and each remote sensing product picked up similar signals between wetlands (although different from each other), while the two wetlands situated in a region that receives year-round rainfall were also very similar (although different between the two climate zones; Figure 4). The Clanwilliam wetland found in an arid zone resulted in very different estimates from the two sources of data (MOD16 and Fruitlook) as well as from the other wetlands, and as a result these were unable to be validated or analysed effectively. Further findings from the study revealed that palmiet water use varies significantly between seasons.
Based on the comparison of the three remote sensing products, as well as the ground based scintillometer measurements, there is a high degree of variability in the ET estimations but some general observations based on Figure 4 and Table 3 are as follows:
MOD16 data:
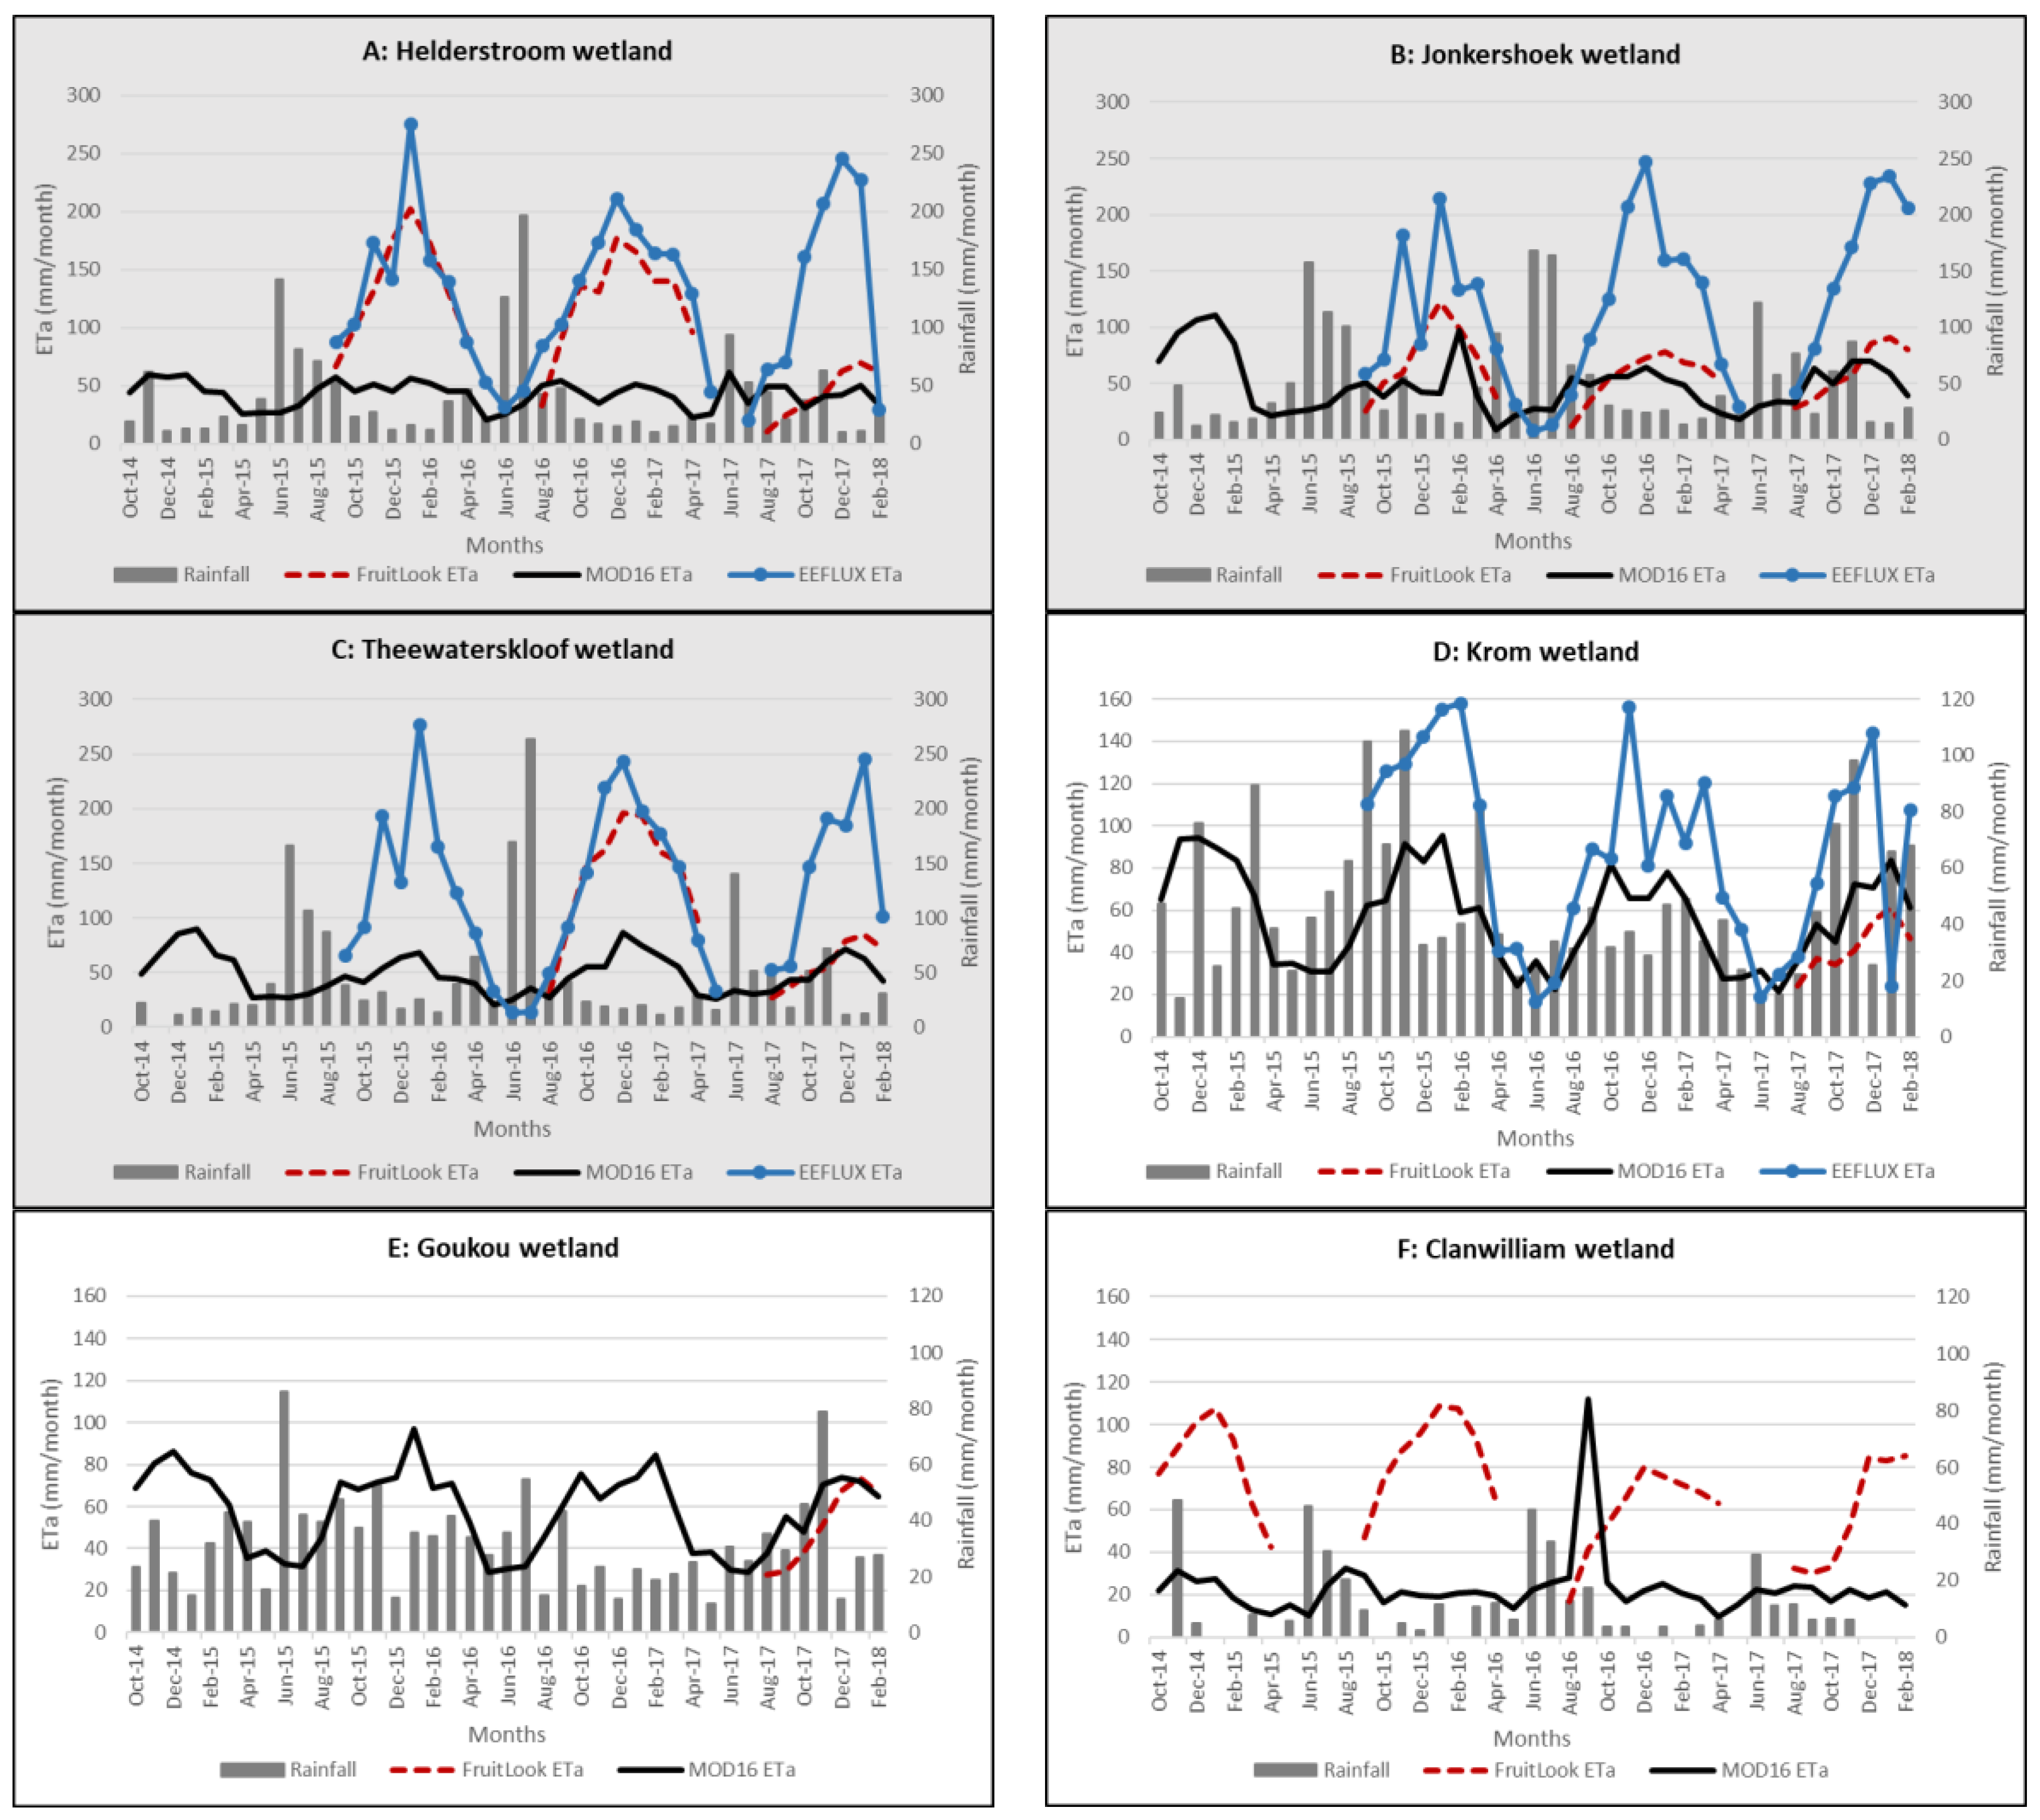
MOD16 estimates are generally lower compared to both FruitLook and EEFLUX for the wetlands for most of the study period.
MOD16 reflects far less seasonal variation in ETa than the other data sets.
For Clanwilliam wetland located in an arid region, MOD16 outputs display a different seasonal distribution to FruitLook.
EEFlux:
EEFlux estimates are higher compared to both FruitLook and MOD16 for all wetlands for most of the study period.
For wetlands (a) Helderstroom, (b) Jonkershoek, and (c) Theewaterskloof located in a higher rainfall region, EEFlux data were not sensitive to the hydrological dry year in 2017/2018
FruitLook:
FruitlLook estimates show the highest variability that appears to correspond with water availability in the catchment area, indicating that it is possibly oversensitive to water availability.
For the three drier catchments (d), (e), and (f), FruitLook estimates show the highest ETa for the arid Clanwilliam wetland (e), compared to the Goukou (d) and Krom (f) wetlands, which is a surprising result given the differences in water availability.
The Krom palmiet wetland was analysed in more detail as a scintillometer was installed to measure ETa. The Krom wetland comparisons confirmed the high sensitivity of FruitLook estimates to water availability, with FruitLook estimates being significantly lower than EEFlux and MOD16 during the dry year 2017/2018, and significantly higher than EEFlux and MOD16 during the much wetter year 2018/2019. The scintillometer was installed from 22 May 2019 to 22 July 2019 during a relatively high rainfall year. Measurements from the scintillometer during this time were most comparable with the FruitLook estimates although were higher than all of the remote sensing products most of the time (Table 5).
A scintillometer installed in the Helderstrom wetland during October 2008, also measured significantly higher ETa than those estimated by MOD16 and EEFlux (Table 4; FruitLook was not available at that time). Rebelo [10] investigated the Helderstrom palmiet wetland where she upscaled ETa estimates from a variety of sources including from the scintillometry to 1526 mm year−1 [35], from MOD16 to 1042 mm year−1, and from Landsat to 1623 mm year−1. By comparison, the ETa estimates reported in this paper for the seven month growing season (hydrological years 2015/16 and 2016/17) for Helderstrom wetland ETa were estimated at 1006 mm year−1 (2015/16) and 986 mm year−1 (2016/17) by FruitLook; at 340 mm year−1 (2015/16) and 286 mm year−1 (2016/17) by MOD16; and 1076 mm year−1 (2015/16) and 1166 mm year−1 (2016/17) for EEFlux (Table 3). It is not known how Rebelo [10] upscaled her estimates and these figures are not completely comparable with Rebelo’s estimate as they cover only seven months of the year (highest ETa months), but the comparisons certainly indicate that the ETa estimated by MOD16 are too low, and that estimates by FruitLook and EEFlux are more sensible in this environment.
The outputs from both scintillometers indicate a higher ETa than all remote sensed products are reporting. From the analysis of the scintillometer set up for the Krom wetland, however, the ETa is highly variable and although generally high, reduces considerably during both cooler and windy days (Figure 5). Particularly surprising was the drop in the ETa during days with high solar radiation but with high wind conditions, indicating that the sunken stomata identified by Rebelo [10] allow the plant to exert some control over water loss.

4.2. Influence of Wetland Size and Shape

The pixel size of Landsat 7/8 used in the EEFlux model is a 30 m resolution, and differences in ETa estimated by EEFlux between three wetlands and their surrounding land cover were also evaluated. The results (Table 6 and Figure 7) show that wetland ETa was higher in the wetland than the surrounding land cover for all three wetlands, although the small Jonkershoek wetland showed the least difference. As the surrounding land cover buffers moved further from the wetland, the ETa decreased which is a realistic representation of system behavior. EEFlux seems to be a fairly reliable tool for analysing wetland ETa for smaller palmiet wetlands, however care should be taken in drier years when EEFlux tends not to pick up changes.
For the small Jonkershoek palmiet wetland, the growing season ETa (October to April of the hydrological years 2015/16 and 2016/17) were estimated at 537 mm year−1 (2015/16) and 456 mm year−1 (2016/17) by FruitLook; at 319 mm year−1 (2015/16) and 334 mm year−1 (2016/17) by MOD16; and 904 mm year−1 (2015/16) and 1105 mm year−1 (2016/17) by EEFlux (Table 3). The differences in estimated ETa between Jonkershoek and Helderstrom are surprising from a location point of view, as they are found relatively close together with a similar climate. However, Jonkershoek is a much smaller wetland than Helderstrom, which could be the reason why both FruitLook and MOD16 provided much lower ETa estimates compared to EEFlux for Jonkershoek, while only MOD16 gave lower ETa values versus EEFlux for Helderstrom.
The size and shape of each wetland clearly influenced the results in two ways. Firstly, the smaller wetland ETa signals are affected by the remote sensing product. Secondly, a small wetland had similar ETa to the adjoining land covers. Table 1 presents the shape and size of each wetland and a number of the wetlands evaluated are very small or shaped irregularly (i.e., long and thin) resulting in data signals gathered at a larger pixel size being influenced by other types of land cover.

5. Conclusions

Despite their value, palmiet wetlands are becoming increasingly degraded and this is mostly a result of land use change [10,36]. A significant threat is the clearing or drainage of palmiet wetlands for agricultural purposes. Competing water users (typically farmers) consider palmiet plants to be high water users and thus clearing of palmiet wetlands has been common [37]. However, palmiet wetlands provide important flood regulation services [10] and the lack of understanding of their hydrological functioning is hindering protection drives.
The estimates of wetland ETa derived from the various sources in this paper were highly variable, as they were in previous studies [10,36], highlighting the complexities of determining ETa over palmiet wetlands located in climatically different areas. However, there were useful conclusions that emerged from the comparisons.
The large pixel size (500 m) of the MOD16 product resulted in too much averaging of the signal between the wetland and the surrounding land cover, which resulted in an underestimation of ETa by the MOD16 product for most of the wetlands.
The FruitLook platform which uses the MOD16 product within the SEBAL model was much more sensitive to water availability which resulted in more variable estimates between wet and dry years. The EEFlux product which uses Landsat 7/8 data and FruitLook provided the closest estimates to the measured scintillometer data. However, validation of these results using data from scintillometers on two wetlands indicated that all the remote sensing products are underestimating ETa from palmiet wetlands most of the time. The data from the scintillometers provided some clues as to the difficulty of estimating ETa through satellite measurements, since the ETa measured by the scintillometers indicate that ETa from palmiet wetlands is highly variable due to the plants ability to control water loss in high wind conditions. There are therefore indications that the physiological characteristics of the plant may exert some control over plant transpiration [10].
This paper has highlighted the variability in palmiet wetland ETa by size, climate, and seasonality, and shown that palmiet wetland ETa is governed by a number of external factors. Palmiet ETa was higher than all the remote sensing estimates, which supports the conclusions of Job [13] and Smith [14] that palmiet is reliant on a continuous supply of water, and that the high groundwater baseflows common in the Cape Fold Belt are a key reason palmiet is largely endemic to this region.

Author Contributions

Conceptualization, J.T.; methodology, J.T., P.R. and S.M.; data acquisition, P.R., J.T., S.M., A.P. and G.E.; writing, P.R., J.T., and S.M.; supervision, J.T. and S.M.; funding acquisition, J.T. and S.M.

Funding

This research was funded by Carnegie-RISE Sub-Saharan Water Resources Network (SSWRN) as an Honours bursary for P.R.

Acknowledgments

The climate data was provided by Dutoit Agri and Agricultural Research Council (ARC).

Conflicts of Interest

The funders had no role in the design of the study; in the collection, analyses, or interpretation of data; in the writing of the manuscript, or in the decision to publish the results.

References

  1. Mitsch, W.J.; Gosselink, J.G. Wetlands; John Wiley and Sons, Inc.: Hoboken, NJ, USA, 2015. [Google Scholar]
  2. Russi, D.; ten Brink, P.; Farmer, A.; Badura, T.; Coates, D.; Forster, J.; Kumar, R.; Davidson, N. The Economics of Ecosystems and Biodiversity for Water and Wetlands. IEEP Lond. Bruss. 2013, 78. Available online: https://www.ramsar.org/sites/default/files/documents/pdf/TEEB/TEEB_Water-Wetlands_Final-Consultation-Draft.pdf (accessed on 31 October 2019).
  3. Gardner, R.C.; Barchiesi, S.; Beltrame, C.; Finlayson, C.; Galewski, T.; Harrison, I.; Paganini, M.; Perennou, C.; Pritchard, D.; Rosenqvist, A.; et al. State of the World’s Wetlands and Their Services to People: A Compilation of Recent Analyses. 2015. Available online: https://www.ramsar.org/sites/default/files/documents/library/cop12_doc23_bn7_sowws_e_0.pdf (accessed on 31 October 2019).
  4. Silva, J.P.; Phillips, L.; Jones, W.; Eldridge, J.; O’Hara, E. Life and Europe’s Wetlands: Restoring a Vital Ecosystem; European Commission: Luxembourg, 2007; Available online: https://ec.europa.eu/environment/archives/life/publications/lifepublications/lifefocus/documents/wetlands.pdf (accessed on 31 October 2019).
  5. Nel, J.L.; Driver, A.; Strydom, W.F.; Maherry, A.; Petersen, C.; Hill, L.; Roux, D.J.; Nienaber, S.; Van Deventer, H.; Swartz, E.; et al. Atlas of Freshwater Ecosystem Priority Areas in South Africa: Maps to Support Sustainable Development of Water Resources; WRC Report TT55/11; Water Research Commission: Pretoria, South Africa, 2011. [Google Scholar]
  6. Dini, J.; Bahadur, U. South Africa’s national wetland rehabilitation programme: Working for wetlands. In The Wetland Book; Finlayson, C.M., Everard, M., Irvine, K., McInnes, R., Middleton, B., van Dam, A., Davidson, N.C., Eds.; Springer: Dordrecht, The Netherlands, 2016; pp. 1–7. [Google Scholar] [CrossRef]
  7. Department of Environmental Affairs (DEA). Projects and Programmes: Working for Wetlands. Available online: https://www.environment.gov.za/projectsprogrammes/workingfowetlands (accessed on 17 August 2018).
  8. Barclay, A. Ecosystem Engineering by the Wetland Plant Palmiet: Does It Control Fluvial Form and Promote Diffuse Flow in Steep-Sided Valleys of the Cape Fold Mountains. Master’s Thesis, Rhodes University, Grahamstown, South Africa, 2016. [Google Scholar]
  9. Pulley, S.; Ellery, W.N.; Lagesse, J.V.; Schlegel, P.K.; McNamara, S.J. Gully erosion as a mechanism for wetland formation: An examination of two contrasting landscapes. Land Degrad. Dev. 2018, 29, 1756–1767. [Google Scholar] [CrossRef]
  10. Rebelo, A.J. An Ecological and Hydrological Evaluation of the Effects of Restoration on Ecosystem Services in the Kromme River System, South Africa. Master’s Thesis, Stellenbosch University, Stellenbosch, South Africa, 2012. [Google Scholar]
  11. Munro, S.L.; Linder, H.P. The embryology and systematic relationships of Prionium serratum (Juncaceae: Juncales). Am. J. Bot. 1997, 84, 850–860. [Google Scholar] [CrossRef] [PubMed]
  12. Rebelo, A.J.; Morris, C.; Meire, P.; Esler, K.J. Ecosystem services provided by South African palmiet wetlands: A case for investment in strategic water source areas. Ecol. Indic. 2019, 101, 71–80. [Google Scholar] [CrossRef]
  13. Job, N. Geomorphic Origin and Dynamics of Deep, Peat-filled, Valley Bottom Wetlands Dominated by Palmiet (Prionium serratum)—A Case Study Based on the Goukou Wetland, Western Cape. Master’s Thesis, Rhodes University, Grahamstown, South Africa, 2014. [Google Scholar]
  14. Smith, C. Determining the Hydrological Functioning of the Palmiet Wetlands in the Eastern and Western Cape of South Africa. Master’s Thesis, Rhodes University, Grahamstown, South Africa, 2019. [Google Scholar]
  15. Labedzki, L. Evapotranspiration; InTech Publishers: Rijeka, Croatia, 2011. [Google Scholar]
  16. Reynolds, J.F.; Kemp, P.R.; Tenhunen, J.D. Effects of long-term rainfall variability on evapotranspiration and soil water distribution in the Chihuahuan Desert: A modeling analysis. Plant Ecol. 2000, 150, 145–159. [Google Scholar] [CrossRef]
  17. Howard-Williams, C. Wetlands and watershed management: The role of aquatic vegetation. J. Limnol. Soc. South. Afr. 1983, 9, 54–62. [Google Scholar] [CrossRef]
  18. Winter, T.C.; Rosenberry, D.O.; Buso, D.C.; Merk, D.A. Water source to four US wetlands: Implications for wetland management. Wetlands 2001, 21, 462–473. [Google Scholar] [CrossRef]
  19. Drexler, J.Z.; Snyder, R.L.; Spano, D.; Paw U, K.T. A review of models and micrometeorological methods used to estimate wetland evapotranspiration. Hydrol. Process. 2004, 18, 2071–2101. [Google Scholar] [CrossRef]
  20. Goulden, M.L.; Litvak, M.; Miller, S.D. Factors that control Typha marsh evapotranspiration. Aquat. Bot. 2007, 86, 97–106. [Google Scholar] [CrossRef]
  21. Davie, T. Fundamentals of Hydrology, 3rd ed.; Routledge: Oxford, UK, 2008. [Google Scholar]
  22. Mu, Q.; Zhao, M.; Running, S.W. Improvements to a MODIS global terrestrial evapotranspiration algorithm. Remote. Sens. Environ. 2011, 115, 1781–1800. [Google Scholar] [CrossRef]
  23. Glenn, E.P.; Huete, A.R.; Nagler, P.L.; Hirschboeck, K.K.; Brown, P. Integrating remote sensing and ground methods to estimate evapotranspiration. Crit. Rev. Plant Sci. 2007, 26, 139–168. [Google Scholar] [CrossRef]
  24. Jarmain, C.; Mengitsu, M.; Jewitt, G.P.W.; Kongo, V.; Bastiaanssen, W. A Methodology for Near-Real Time Spatial Estimation of Evaporation; WRC Report No. K5/1751:2009; Water Research Commission: Pretoria, South Africa, 2009; ISBN 978-1-77005-725-8. [Google Scholar]
  25. Bastiaanssen, W.G.M.; Noordman, E.J.M.; Pelgrum, H.; Davids, G.; Thoreson, B.P.; Allen, R.G. SEBAL model with remotely sensed data to improve water-resources management under actual field conditions. J. Irrig. Drain. Eng. 2005, 131, 85–93. [Google Scholar] [CrossRef]
  26. Allen, R.G.; Tasumi, M.; Trezza, R. Satellite-based energy balance for mapping evapotranspiration with internalized calibration (METRIC)—Model. J. Irrig. Drain. Eng. 2007, 133, 380–394. [Google Scholar] [CrossRef]
  27. Monteith, J.L. Evaporation and environment. In Symposia of the Society for Experimental Biology; Cambridge University Press: Cambridge, UK, 1965; Volume 19, pp. 205–224. [Google Scholar]
  28. Samain, B.; Ferket, B.V.; Defloor, W.; Pauwels, V.R. Estimation of catchment averaged sensible heat fluxes using a large aperture scintillometer. Water Resour. Res. 2011, 47. [Google Scholar] [CrossRef]
  29. Funk, C.; Peterson, P.; Landsfeld, M.; Pedreros, D.; Verdin, J.; Shukla, S.; Husak, G.; Rowland, J.; Harrison, L.; Hoell, A.; et al. The climate hazards infrared precipitation with stations—A new environmental record for monitoring extremes. Sci. Data 2015, 2, 150066. [Google Scholar] [CrossRef] [PubMed]
  30. Allen, R.G.; Pereira, L.S.; Raes, D.; Smith, M. Crop Evapotranspiration—Guidelines for Computing Crop Water Requirements—FAO Irrigation and Drainage Paper 56; FAO: Rome, Italy, 1998. [Google Scholar]
  31. Birkhead, A.L.; Olbrich, B.W.; James, C.S.; Rogers, K.H. Developing an Integrated Approach to Predicting the Water Use of Riparian Vegetation; WRC Report 474/1/97; Water Research Commission: Pretoria, South Africa, 1997. [Google Scholar]
  32. Everson, C.S.; Burger, C.; Olbrich, B.W.; Gush, M.B. Verification of Estimates of Water Use from Riverine Vegetation on the Sabie River in the Kruger National Park; WRC Report 877/1/01; Water Research Commission: Pretoria, South Africa, 2001. [Google Scholar]
  33. Roberts, J.; Young, B.; Marston, F. Estimating the Water Requirements for Plants of Floodplain Wetlands: A Guide; Land and Water Resources Research and Development Corporation: Canberra, Australia, 2000. [Google Scholar]
  34. Bullock, A.; Acreman, M. The role of wetlands in the hydrological cycle. Hydrol. Earth Syst. Sci. 2003, 7, 358–389. [Google Scholar] [CrossRef]
  35. Jarmain, C. Personal Communication; Stellenbosch University: Western Cape, South Africa, 2008. [Google Scholar]
  36. Rebelo, A.J.; Le Maitre, D.C.; Esler, K.J.; Cowling, R.M. Hydrological responses of a valley-bottom wetland to land-use/land-cover change in a South African catchment: Making a case for wetland restoration. Restor. Ecol. 2015, 23, 829–841. [Google Scholar] [CrossRef]
  37. Grundling, P.L.; Grundling, A.T.; Pretorius, L.; Mulders, J.; Mitchell, S. South African Peatlands: Ecohydrological Charcteristics and Socio-Economic Value; Water Research Commission: Pretoria, South Africa, 2017; Available online: http://www.wrc.org.za/wp-content/uploads/mdocs/2346-1-17.pdf (accessed on 31 October 2018).
Figure 1. Selected study areas (data from Water Resources of South Africa, 2012).
Geosciences 09 00491 g001
Figure 2. Chart showing the time period of data derived from various data sources that were used in the study.
Geosciences 09 00491 g002
Figure 3. Comparison of ET estimates for Krom wetland using different methods including 1) single day ET multiplied by the number of days in the month (EEFlux ETa and ETo approx.), and 2) Kc FAO-56 approach (ETa Kc DuToit and ETa Kc ARC). ET, evapotranspiration; ETa, actual evapotranspiration; Kc, crop coefficient; ARC, South African Agricultural Research Council weather station; Du Toit, weather station run by DuToit Agri.
Geosciences 09 00491 g003
Figure 4. Comparison of ETa for palmiet wetlands from remote sensing datasets. Graphs (A), (B) and (C) are shown in grey and represent areas with higher rainfall and ETa, while graphs (D), (E) and (F) are shown in white and represent lower rainfall regions.
Geosciences 09 00491 g004
Figure 5. Time series outputs of measured ETa and wind speed from the scintillometer installed on the Krom river palmiet wetland from 22 May to 22 July 2019.
Geosciences 09 00491 g005
Figure 6. Time series of MOD16, EEFlux, Fruitlook, and scintillometer ETa estimates for Krom wetland including a time series of ETo determined from the two local weather stations, September 2015–June 2019.
Geosciences 09 00491 g006
Figure 7. Time series of ETa determined by the EEFlux model over three wetlands and adjacent buffer land cover (100 m, 500 m, 1000 m) for increasing sizes of wetlands: (a) Jonkershoek, (b) Krom, and (c) Helderstroom.
Geosciences 09 00491 g007
Table 1. Size and shape of the six case study wetlands from smallest to largest wetland.
Wetland NameLength (m)Width (m)Area
(m2)
Catchment Area (km2)Shape
Jonkershoek217395525.526.83 Geosciences 09 00491 i001
Clanwilliam1213168146,764.02022.97 Geosciences 09 00491 i002
Theewaterskloof1296464363,884.050.94 Geosciences 09 00491 i003
Goukou2101583723,471.093.16 Geosciences 09 00491 i004
Krom50533591,017,210.042.82 Geosciences 09 00491 i005
Helderstroom46495111,205,750.0554.69 Geosciences 09 00491 i006
Table 2. Overview of remote sensing products evaluated.
Application/ProductModelTheoretical BasisContributing SatellitesResolution
FruitLook
www.fruitlook.co.za
Surface Energy Balance Algorithm for Land (SEBAL) [25]Surface Energy BalanceDisaster Monitoring
Constellation (DMC) sensor and MODIS
Temporal: weekly
Spatial: 30–250 m
MOD16 ET data product
https://developers.google.com/earth-engine/datasets/catalog/MODIS_006_MOD16A2
MODIS global ET algorithm [22]Penman-Monteith [27]MODISTemporal: 8 day
Spatial: 500 m
EEFLUX—Earth Engine Evapotranspiration Flux
https://eeflux-level1.appspot.com/
Mapping Evapotranspiration at high Resolution with Internalized Calibration (METRIC) [26]Surface Energy BalanceLandsatTemporal: 16 day
Spatial: 30 m
Table 3. Comparison of ETa totals (mm year−1) for the growing season October to April of the hydrological years 2015/16 and 2016/17 for the six wetlands. Missing values indicate data not available (na) or not collected (nc).
FruitLookMOD16EEFlux
2015/162016/172015/162016/172015/162016/17
Helderstroom100698634028610761166
Jonkershoek5374563193349041105
Theewaterskloofna111035842110681204
Kromnana494431861713
Goukounana502466ncnc
Clanwilliam632478138138ncnc
Table 4. Validation of data from MOD16 and EEFlux using scintillometer derived ETa data over the Helderstroom palmiet wetland, October 2008.
DateScintillometer ETa (mm day−1)Scintillometer ETa (mm 8day−1)MOD16 ETa (mm 8day−1)EEFlux Using Landsat 7 (mm day−1)
14 Oct2.9
15 Oct3.0 15.50
16 Oct2.8
17 Oct5.9
18 Oct6.1
19 Oct6.3
20 Oct3.8
21 Oct2.9
22 Oct2.0
23 Oct 32.813.97
24 Oct
25 Oct6.5 4.65
26 Oct
27 Oct
28 Oct6.0
29 Oct5.5
Table 5. Validation of ETa data from MOD16, EEFlux, and Fruitlook using scintillometer over the Krom palmiet wetland, May to July 2019.
DateScintillometer ETa (mm day−1)EEFlux (mm day−1)Scintillometer ETa (mm 8day−1)MOD16 ETa (mm 8day−1)Scintillometer ETa (mm 7day−1)Fruitlook (mm 7day−1)
2019/05/234.65
2019/05/244.18
2019/05/254.39 n/a1.98
2019/05/264.03
2019/05/273.31
2019/05/280.56 21.1211.50
2019/05/291.245.85
2019/05/303.35
2019/05/311.91
2019/06/014.05
2019/06/024.24 22.696.16
2019/06/034.66
2019/06/041.40 20.8511.40
2019/06/052.763.00
2019/06/061.26
2019/06/074.39
2019/06/083.62
2019/06/093.83
2019/06/103.10 25.028.17
2019/06/113.76 22.7215.60
2019/06/121.26
2019/06/134.161.46
2019/06/143.780.45
2019/06/153.40
2019/06/163.39
2019/06/172.68
2019/06/183.68 26.116.8922.358.36
2019/06/192.11
2019/06/202.01
2019/06/212.35
2019/06/220.97
2019/06/230.30
2019/06/243.86
2019/06/250.71 12.308.85
2019/06/263.00 15.307.21
2019/06/270.96
2019/06/281.87
2019/06/293.21
2019/06/302.381.65
2019/07/010.71
2019/07/023.33 15.4616.00
2019/07/034.23
2019/07/044.21 20.908.52
2019/07/053.59
2019/07/064.12
2019/07/070.73
2019/07/082.621.44
2019/07/094.26 23.7618.30
2019/07/104.05
2019/07/114.39
2019/07/120.98 24.747.24
2019/07/134.10
2019/07/144.24
2019/07/153.73
2019/07/163.191.90 24.6812.80
2019/07/172.23
2019/07/183.36
2019/07/190.16
2019/07/200.91 21.927.96
Table 6. Mean monthly ETa (mm month−1) averaged from 2.5 years of data (September 2015–February 2019) for Krom, Helderstroom, and Jonkershoek wetland and delineated buffers around the wetlands (non-wetland areas).
WetlandJonkershoekKromHelderstroom
ETa data productEEFLUXEELUXEELUX
Wetland ETa120.590.4128.1
100 m buffer113.469.4107.7
500 m buffer104.371.482.0
1000 m buffer101.367.478.6

