Abstract
Deforestation in peatland areas such as Kalimantan, Indonesia has been going on for decades. The deforestation has indirectly increased peatlands to become degraded and flammable. The Synthetic Aperture Radar (SAR) interferometry approach for identification of degraded peatlands can be performed using ALOS-2 PALSAR-2 data by converting land deformation data generated from SAR interferometry analysis into water table (WT) depth data using Wosten models. Peatlands with WT depth conditions of more than 40 cm are classified as degraded peatlands which are flammable. By using fire data from previous studies, this research confirms that identification of degraded peatlands using SAR interferometry approach by ALOS-2 PALSAR-2 is more reliable with high precision related to forest fires, with a precision level of 88% compared to 5% precision level using the WT depth monitoring system that has been installed in Central Kalimantan. The highest wavelength of ALOS-2 PALSAR-2 (L-Band) data can resolve the limitation due to temporal and volumetric decorrelation, compared to C-Band and X-Band satellite data. The combination methods of SAR interferometry approach and the real-time WT depth monitoring system to identify degraded peatlands can be more efficient, faster, and accurate. The advantage of this research result shows that SAR interferometry analysis can reach blank spot areas that are not covered by the observation station of WT depth monitoring system. It also gives a benefit as a guide to select precise locations of observation stations related to degraded peatland and forest fire.
1. Introduction
Approximately 12 percent or around 14.9 million hectares of Indonesia’s landmass are peatland areas, most of which are in Sumatra, about 7.1 million hectares, Kalimantan 6.5 million hectares and others in Papua region [1]. Peatland ecosystem areas are vulnerable due to anthropogenic activities such as drainage, conversion for agriculture, burning, and extraction for fuel and agriculture [2]. For the last two decades, human activities have rapidly increased and caused persistent environmental change [3,4]. The activities of drainage and forest clearing threaten peatland stability and make them susceptible to fire [4]. People also cleared peatland areas with the most extensive cleared peatlands found in Riau (≈450,000 ha), Central Kalimantan (≈400,000 ha), and South Sumatra (≈320,000 ha) [5].
Massive and extremely intensive deforestation in Kalimantan reached its highest peak in the 1980s and 1990s and has been occurring until present day [1]. The development of oil palm plantations has been the leading cause of the clearing of peat forests in Kalimantan, and besides that, there was also the development of one million hectares of agricultural land on peatland in 1996–1998, followed by the construction of 4000 km canals for drying and irrigation in Central Kalimantan [2]. Drainage causes an irreversible process of drying, oxidation, and collapse that increase peatland proneness to fire [3]. The onset of mega rice project (converting one million hectares of peatland into rice fields) in 1996 in central Kalimantan further caused degradation of peat widespread to other places. Because drainage and irrigation were constructed in this area and its surroundings, the deforestation expanded massively.
The multi-temporal Landsat images acquired between 1991 to 2000 showed a 3.2% reduction of forest per year, and between 1997 to 2000, logging increased approximately 6.7% [4]. When El Nino occurred in 1997, the forest fire in this area caused a huge amount of smoke covering 15 million km2 of Southeast Asia for several weeks. Most of the peatlands in central Kalimantan are generally ombrogenous with dome-shaped landforms with high water table at the center of the dome. The drainage of peatland makes the water flow from the vault to the canal, as a result of the dry bog that occurs in the dry season.
Nowadays it is widely accepted that the water table (WT) (in the many papers called groundwater table, water table depth, etc.) is a crucial parameter for the study of peatland health. The declining of WT depth will drive many negative processes of peat, for example, carbon decomposition, the vulnerability toward fire, increase of methane (CH4) production, etc. [5,6,7,8]. In principle, decreasing WT depth contributes to greenhouse gas emissions. Hence, WT is the critical parameter to determine whether the peatland is degraded or not.
Many approaches can be used to identify degraded peatlands; one of them is the use of biogeochemical as an indicator [9]. Parameters such as C, N, ash content, age of carbon radio, bulk density can be used to determine whether peatland is degraded or not, although not all can be used quantitatively. In addition, using remote sensing techniques namely Light Detection and Ranging (LIDAR), combined with other remote sensing optical systems such as Compact Airborne Spectrographic Imager (CASI), and aerial image datasets have many advantages over traditional ground surveys to identify and map degraded peatlands [10]. Water table depth and soil moisture are also important parameters that were explored by using remote sensing sensor, especially microwave remote sensing [11,12].
Microwave remote sensing Synthetic Aperture Radar (SAR) has been widely utilized to carry out subsidence mapping on peatlands by using SAR interferometry (InSAR) approach [13,14,15,16]. Subsidence information on bogs is essential because it is related to several things, such as water table depth conditions and carbon emissions [17]. The subsidence that occurs in peatlands is equal to the water table depth multiplied by 0.04, where subsidence is in cm/year, and the water table depth is in cm [18]. Forest fires in peatland is one of the main problems in Indonesia. Forest fires usually occur in the peatland areas when water table depth is more than 40 cm [19]. Regulations in Indonesia also mention that peatland areas that have water table depth greater than 40 cm are classified as degraded areas [20,21]. This condition will trigger peat fires because fire spreads quickly in dry peat soil [18,19,22,23,24].
This research implements the SAR interferometry approach using ALOS-2 PALSAR-2 data to identify degraded peatlands areas related to forest fire, and at the same time compares with the real-time WT depth monitoring system. Real-time WT depth monitoring system was developed by the Agency for The Assessment and Application of Technology (BPPT) in collaboration with Peatland Restoration Agency (BRG) Indonesia, namely SIPALAGA. This system can measure water table depth, soil moisture, and rainfall. The system sends data to the read down station for every hour nonstop. In this research, we quantify level of precision between degraded peatlands that were calculated using SAR Interferometry and WT depth monitoring system, associated with the occurrence of forest fires in peatlands.
This research is a novel approach to identify degraded peatlands by using SAR Interferometry ALOS-2 PALSAR-2 and measurement of non-stop WT depth data in the field. It contributes to the utilization of synthetic aperture radar data for mapping degraded peatland areas to prevent forest fires and furthermore peatlands management.
2. Materials and Methods
2.1. Materials
A pair of ALOS-2 data in Single Look Complex (SLC) format, acquired on 25 February 2016 and 28 February 2018 obtained from JAXA (Japan Aerospace Exploration Agency), Japan, were used in this research. Details specifications of the data are shown in Table 1.

Table 1.
Specifications of the data.
Data from 13 stations of real-time WT depth monitoring system, namely SIPALAGA provided by Peatland Restoration Agency (BRG) and the Agency for The Assessment and Application of Technology (BPPT) Indonesia were used. These stations are located in the Pulang Pisau and Kapuas Regency area, in South Kalimantan. The sensor was able to send data on the water table, soil moisture, and rainfall every hour for 24 h non-stop. The picture of real-time WT depth station in the field is shown in Figure 1.
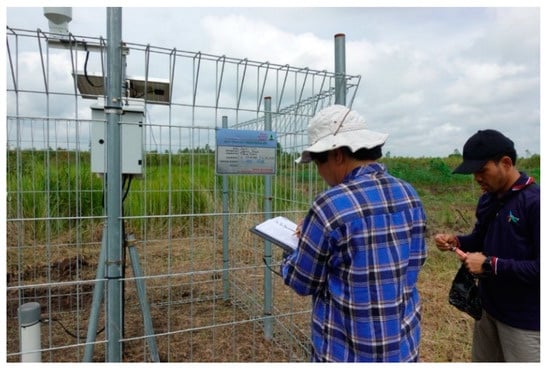
Figure 1.
Real-time WT depth monitoring station in Jabiren, Pulang Pisau Regency, Central Kalimantan, Indonesia (Source: Twitter of BRG Indonesia).
The forest fire data as a result of previous research [25] and forest fire data of 2015 from the Indonesian Center for Agricultural Land Resources (BBSDLP), Ministry of Agriculture is used for validation and comparison.
2.2. Methods
The research method started from the SAR interferometry analysis and then continued with the implementation of the Wosten model [18] to obtain the WT depth distribution map. Based on the WT depth condition, depths of more than 40 cm are classified as degraded peatland areas, based on scientific reports [18,19,20,21,22,23,24] and Indonesian regulations [20,21]. Subsequently, a degraded/undegraded peatland map is created based on InSAR and WT depth monitoring system. These results were then compared using previous peatland fire data with overlay techniques.
Regarding SAR interferometry analysis as shown in Figure 2, the first step was to input SLC using a pair of ALOS-2 PALSAR-2 data, Central Kalimantan, which were recorded on 25 February 2016 and 28 February 2018. The next step was to select the HH polarization data and orbit set. Thus, co-registration, the alignments of SAR images from two antennas, is an essential step for the accurate determination of phase difference and for noise reduction [26]. In this step, we selected fine co-registration for subpixel accuracy, including searching for subpixel tie points, fitting transformation equations, and resampling the slave image. Thus, amplitude stability index was computed by using Equation (1) [27].
where is the standard deviation and is mean value of the amplitude.
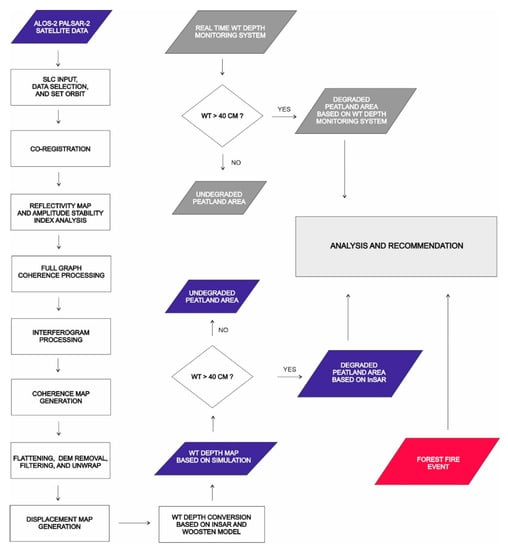
Figure 2.
Flowchart of research.
Then, the complex coherence or the normalized complex correlation was estimated using Equation (2) [28].
where and are the complex pixel values of two SAR images and the angular brackets denote ensemble averaging. High coherence indicates the high precision of the phase.
The comprehensive flowchart of this research is described in Figure 2 below.
Acquisition geometry for interferogram generation shows in Figure 3 [29] where S is the satellite at position i and k. O is the reference point and P is the target under examination. P is located at distance Δx w.r.t O and at height Δh. The master of slant range is indicated as r.
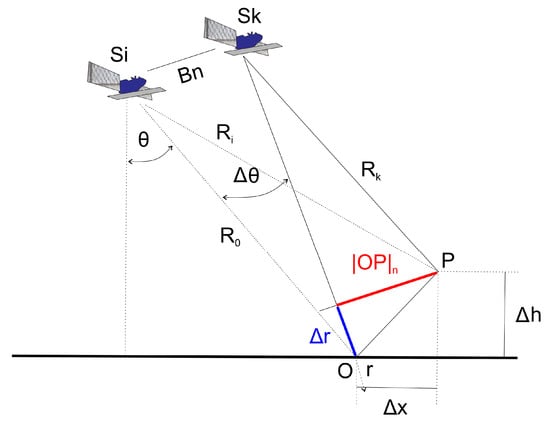
Figure 3.
Acquisition geometry for interferogram generation.
The relative of interferometric was thus calculated using Equation (3)
Based on Equation (3), therefore, the relative interferometric phase can be expressed as in Equation (4):
Since |OP|n is the projection of OP onto the direction normal of r, then it further decomposed to slant range () and height component ( thus the relative interferometric phase is total of flat terrain added with topographic (height) phase, where these terms were expressed in Equation (5).
The next step is called interferogram flattening. The flat terrain phase term was removed because there was no useful information due to availability of orbital data to simulate it. Then, the ambiguity height Δha, the height that generated a phase rotation was equal to 2π, was calculated using Equation (6):
The ambiguity height occurred because all analysis processes were calculated based on trigonometric functions and complex numbers. Integration of all fringes in the flattened interferogram would lead to the estimation of topography.
The next step was to generate the differential interferometry phase based on the equation to remove flat terrain and the topographic phase, and can be expressed as in Equation (7):
This technique is called differential SAR interferometry (DInSAR). It is a powerful tool for detecting surface changes [29].
After this, Goldstein filtering 5 × 5 was employed, then phase ambiguities were solved by using unwrapping. The operation of integration of phase fringes is called phase unwrapping as shown in Equation (8) [30].
WT depth based on simulation was then calculated based on Wosten model [31]. The area with WT depth more than −40 (subsidence 1.6 cm/year) is classified as degraded peatland area following the equation below:
where S is annual rates subsidence (cm/year) and WT depth is water table depth (cm) of the tropical peatland area.
2.3. Location
The research location is in peatland areas on the southern part of Palangkaraya City, in Pulang Pisau and Kapuas Regency, Central Kalimantan, Indonesia (Figure 4).
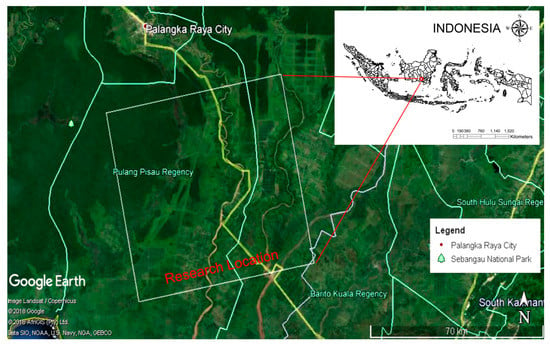
Figure 4.
Research location in Pulang Pisau and Kapuas Regency, Central Kalimantan, Indonesia.
Pulang Pisau Regency and Kapuas Regency are both located in Central Kalimantan Province, with locations attached. Pulang Pisau Regency consists of eight sub-districts with a total area of 8997 km2 [32]. This research covered four sub-districts in Pulang Pisau Regency, namely Jabiren Raya sub-district, Sebangau Kuala District, Kahayan Hilir District, and Maliku District. Kapuas Regency consists of 17 sub-districts with an area of 14,999 km2, while those included in this research are the sub-districts of Kapuas Barat, Basarang, and Mantangi, which is the largest sub-district [33]. The lowest rainfall in the Pulang Pisau regency was 111 mm, and the highest was 360 mm, while the lowest duration of solar radiation was 297.5% and the highest was 2212.5%. The air temperature at the research location ranged from 27.2–34.7 °C, while the humidity was between 44%–99%.
Based on the land cover in Figure 5, the most extensive land cover in the research location is the plantation area, while the paddy fields and agriculture area are insignificant in number. Based on the quadrant angle, Amuntai 1713 Indonesia geological map, the study area also included the alluvial plains which are deposits of surrounding rivers. In more detail, this alluvial plain consists of kaolinite clay, silt with inter-correlation from sand, lignite, peatland, loose pebble and gravel, as deposits from swamps and rivers.
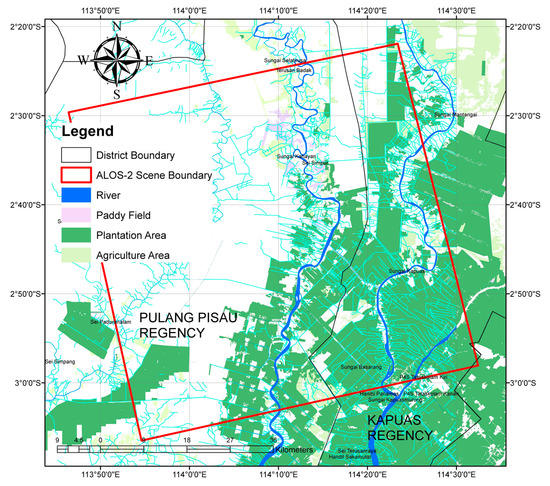
Figure 5.
Landcover of this research area.
3. Results
3.1. Degraded Peatland Areas Based on Synthetic Aperture Radar (SAR) Interferometry
Based on SAR interferometry analysis, using ALOS-2 PALSAR-2 data acquired in February 2016 and February 2018 as an input, a coherence interferogram map was obtained. The coherence interferogram map is the result of cross-correlation between two pairs of images. Regarding the results of the analysis process as shown in Figure 6a, the interferogram could not be generated on the entire image due to large temporal correlation. Temporal decorrelation is usually caused by the dynamics of vegetation cover on peatlands.
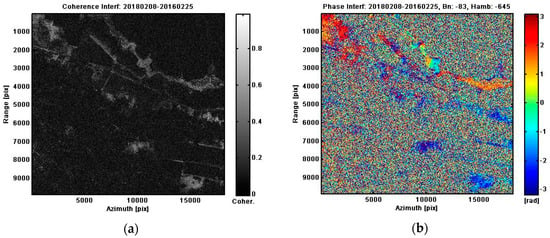
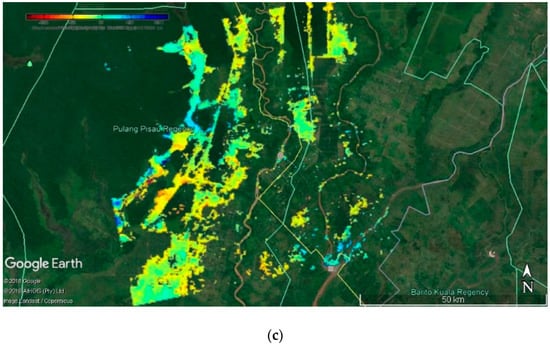
Figure 6.
(a) Coherence image; (b) phase interferogram, and (c) land displacement map of this research area based on Synthetic Aperture Radar (SAR) interferometry processing ALOS-2 PALSAR-2 Data.
The image of the interferogram was produced from two synthetic aperture radar images, especially in the coherence area. With a small normal baseline of −83 and ambiguity of −645, the expected interfaces produced are accurate. Based on the interferogram image, flattening, dem removal, and unwrap are done, and the final result is the land deformation map.
In Figure 6c it can be seen that, in most of the research areas which constitute peatlands, land deformation has occurred. This research was conducted in two contiguous district areas, namely Pulang Pisau Regency and Kapuas Regency, in which peatlands dominated these locations. Map of degraded and non-degraded peatlands from study sites can be seen in Figure 7. Degraded peatland maps have been developing on an annual basis, according to the Wosten model which is used as a basis for calculations based on the results of the land deformation analysis using the SAR interferometry approach. It can also be seen that peatlands within the scope of this study belong to degraded areas. There are only small areas near the Sebangau river and some areas to the north, where the condition of peatlands is not degraded.
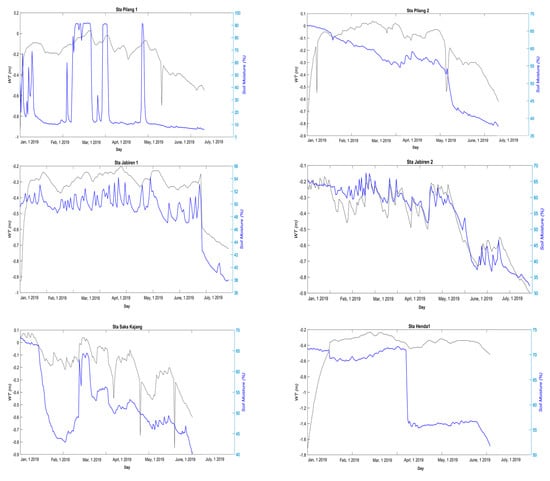
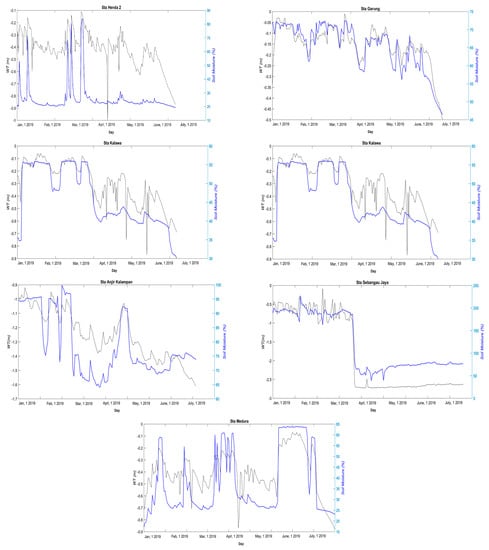
Figure 7.
Graph of real-time water table depth of 13 stations in the research area.
3.2. Degraded Peatland Areas Based on Real-Time Water Table Depth Monitoring
This research also employed data from 13 real-time stations of water table (WT) depth monitoring system, that were developed by the Indonesian Peatland Restoration Agency (BRG), and SIPALAGA, including the location of stations, namely Pilang 1, Pilang 2, Jabiren 1, Jabiren 2, Saka Kajang, Henda 1, Henda 2, Garung, Kalawa, Buntoi, Anjir Kalampan, Sebangau Jaya, Medura Sebangau.
Only one station is included in the Kapuas Regency area, namely Anjir Kalampan Station, while 12 other stations are included in the Pulang Pisau Regency area. Complete information regarding the real-time position of the WT depth monitoring system can be seen in Table 2. Degraded peatlands are characterized by WT depth conditions below 40 cm.

Table 2.
Location and coordinate of WT depth real-time monitoring station used in the research.
The station’s real-time WT depth monitoring system sends data to the read-down station once every hour for 24 hours. The data used in this study are the results of measurements from January to July 2019.
As shown in Figure 7, from Pilang Station 1, it is found that the water table condition was less than 40 cm, starting in June, as well as data from Pilang 2 station. Based on data from Jabiren 1 station, the WT depth condition was also very dynamic and declined in July. At Jabiren 2 station, the WT depth decrease to below 40 cm occurred in early February and continued to deteriorate until July. At Saka Kajang Station, the decrease of WT depth to below 40 cm began in April, although the dynamics were quite high, and the fall was approaching in July.
At Henda 1 station, even the condition of the WT depth had been deficient starting in January of minus 1.7 m and continued below 40 cm until July. At Henda Station 2, the decrease below 40 cm were also detected in the beginning of January, although not as significant as at Henda Station 1, but the terms also continued to decline until July. At Garung station, the decline of WT depth started in July. At Kalawa Station, the WT depth decrease began from January and slightly increased until April, but then continued to decline until July. A similar pattern also occurred in Buntoi station.
Anjir Kalampan Station is the only station within the Kapuas Regency area in this research, where the WT depth condition was less than 1 m starting in January and continuing to decline to 1.6 m in July. At Sebangau Jaya Station, the WT depth dropped below 1 m starting from January and the condition continued to deteriorate until July at 2.5 m below ground level. Similarly, at the Medura station, the WT depth decrease from 70 cm occurred in January and fluctuations worsened until July, at 90 cm below the surface of the peatlands.
Based on WT depth data in various stations, it can be assumed that overall peatlands in this research area are degraded.
4. Discussion
This research has used ALOS-2 PALSAR-2 data with L-Band waves, which is the longest wave currently for satellite-based radar sensors, which is very beneficial related to the issue of coherence, because the L-Band sensor is usually better than C-Band, and X-Band [34]. However, based on the SAR interferometry analysis, as explained earlier in Section 3.1, it appears that not all areas in this research are experiencing land deformation because of the decorrelation phenomenon. Decorrelation can be divided into four components: Geometric, volumetric, temporal, and thermal decorrelation [35]. Respectively geometric and volumetric decorrelation are also called spatial decorrelation, and also known as baseline decorrelation [36,37,38]. Geometric decorrelation occurs when sensor positions are different during acquisitions. Volumetric decorrelation occurs because of volume scattering, an example in the forest area. Temporal decorrelation occurred because of variation of dielectric and structural properties of the scattered [36], and thermal decorrelation is determined by the thermal noise of the interferometric instrument [36,37].
Based on Figure 6 and Figure 8, land cover and land use of the areas dominated by vegetation, which is a very dense forest in the western area, and many plantation locations are in the eastern area. Therefore, volumetric decorrelation leads to the incoherent condition in many areas. In addition, the difference in data acquisition time for two years from February 2016 to 2018, is the cause of the temporal decorrelation.
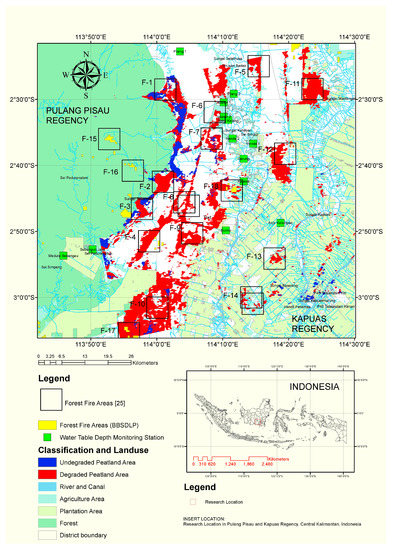
Figure 8.
Degraded peatland areas based on SAR interferometry, water table (WT) depth monitoring system, and peat fire of research area based on Indonesian Center for Agricultural Land Resources (BBSDLP) and previous research study [25].
Despite the limitations due to decorrelation, SAR interferometry is able to identify land deformation conditions in peatlands very well. Then, by using the Wosten model [18] and the assumption that WT depth over 40 cm is categorized as a degraded peatland area [19], an overlay between the degraded peatland data and the forest fire data from BBSDLP and previous research [25] was done as shown in Figure 8. From this analysis it can be seen that the precision level of identification of degraded peatland areas with SAR interferometry when assessed with forest fire data is 88% as shown in Table 3, which means it is very precise.

Table 3.
Precisian level of degraded peatland identification based on SAR interferometry and water table depth monitoring system.
Based on all graph series that are shown in Figure 7, almost all observation points of the water table depth in the dry season show the condition of the water table depth of more than 40 cm. This means that the peatlands have been degraded and become high risk because of the potential to burn. From the simulation results, the water table depth at Jabiren 1 and 2 stations is 56.25 cm so that it is classified into a degraded peat zone, while from the results of water table depth measurements, this condition began from July 2019. Under these conditions, it can be understood if in September 2019, at the time of this writing, peatland fires also occurred in the district area of Pulang Pisau [39], especially in the Jabiren area [40]. However, the overlapping map between WT depth stations site and the location of the forest fire, show that only at two stations (Jabiren 1 and 2) forest fires were detected. Therefore, the precision level of degraded peatland identification related to forest fire by using WT depth monitoring system installed in Central Kalimantan is 5%.
Based on the discussion above, identification of degraded peatland areas related to forest fire using the SAR interferometry approach is a more precise compared to the WT depth monitoring system, which is 88% compared to 5%, respectively. This is likely due to the tendency that forest fires on peatlands usually occur in open areas [31] that are easily detected using the SAR interferometry approach [35] and probably installed WT depth stations mostly located in the vegetation area.
Although SAR interferometry using ALOS-2 PALSAR-2 can map degraded peatlands efficiently and accurately, the weakness of this approach is the detailed time unit because it was developed on the basis of an annual unit analysis. Therefore, this method still requires in situ field measurement. Consequently, in order to obtain comprehensive and complementary results in monitoring degraded peatland areas, a combination of the two approaches of SAR interferometry and the installation of a real-time WT depth monitoring system is recommended.
5. Conclusions
Application of SAR interferometry using ALOS-2 PALSAR-2 data to identify degraded peatlands give 88% precision level when associated with forest fire. This result is more accurate compared to 5% precision level using the WT depth monitoring system installed in Central Kalimantan due to spatial lacking. However, the use of the SAR interferometry approach has limitations related to the volumetric and temporal decorrelation problem and time detail. Therefore, combining SAR interferometry using ALOS-2 PALSAR-2 data and real-time WT depth monitoring system is the best way to identify degraded peatlands in Indonesia related to forest fire. We give a recommendation that determining the points of the WT depth monitoring system station should consider the results of SAR interferometry, because it can be maximized on peatlands monitoring that are degraded and susceptible to burn. This research also can be used as a reference for the government of the Republic of Indonesia to pay attention to these degraded areas, in order to prevent forest fires.
Author Contributions
Conceptualization, J.W.; data curation, A.A., A.R. and M.N.; formal analysis, J.W. and A.S.; methodology, J.W.; supervision, D.P. and J.T.S.S.
Funding
This research was funded by Ministry of Research, Technology and Higher Education Republic of Indonesia, Program RISET-Pro, World Bank Loan: 8245-ID.
Acknowledgments
This work was supported in part by the 4th Japan Aerospace Exploration Agency (JAXA) ALOS Research Announcement under Grant 1024, in part by the 6th JAXA ALOS Research Announcement under Grant 3170, in part by the Japanese Government National Budget–Ministry of Education and Technology (MEXT) FY2015–2017 under Grant 2101, in part by the Chiba University Strategic Priority Research Promotion Program under Grant FY2016-FY2018, and the Ministry of Research, Technology and Higher Education Republic of Indonesia, Program RISET-Pro, World Bank Loan No. 8245-ID. The authors also thank the Peatland Restoration Agency (BRG), Indonesia for providing WT Depth data that has been available in the SIPALAGA System.
Conflicts of Interest
The authors declare no conflict of interest.
References
- Susilo, G.E.; Yamamoto, K.; Imai, T.; Inoue, T. Effect of Canal Damming on the Surface Water Level Stability in the Tropical Peatland Area. J. Water Environ. Technol. 2013, 11, 263–274. [Google Scholar] [CrossRef]
- Law, E.A.; Bryan, B.A.; Meijaard, E.; Mallawaarachchi, T.; Struebig, M.; Wilson, K.A. Ecosystem services from a degraded peatland of Central Kalimantan: Implications for policy, planning, and management. Ecol. Appl. 2015, 25, 70–87. [Google Scholar] [CrossRef] [PubMed]
- Hooijer, A.; Silvius, M.; Wösten, H.; Page, S. PEAT-CO2. Assessment of CO2 emissions from drained peatlands in SE Asia; Delft Hydraulics: Delft, The Netherlands, 2006. [Google Scholar]
- Boehm, H.; Siegert, F. Ecological impact of the One Million Hectare Rice Project in Central Kalimantan, Indonesia, using Remote Sensing and GIS. In Proceedings of the 22nd Asian conference on Remote Sensing, Singapore, 5–9 November 2001. [Google Scholar]
- Taufik, M.; Veldhuizen, A.A.; Wösten, J.H.M.; van Lanen, H.A.J. Exploration of the importance of physical properties of Indonesian peatlands to assess critical groundwater table depths, associated drought and fire hazard. Geoderma 2019, 347, 160–169. [Google Scholar] [CrossRef]
- Weiss, R.; Shurpali, N.J.; Sallantaus, T.; Laiho, R.; Laine, J.; Alm, J. Simulation of water table level and peat temperatures in boreal peatlands. Ecol. Model. 2006, 192, 441–456. [Google Scholar] [CrossRef]
- Girkin, N.T.; Turner, B.L.; Ostle, N.; Craigon, J.; Sjögersten, S. Root exudate analogues accelerate CO2 and CH4 production in tropical peat. Soil Biol. Biochem. 2018, 117, 48–55. [Google Scholar] [CrossRef]
- Girkin, N.T.; Turner, B.L.; Ostle, N.; Sjögersten, S. Composition and concentration of root exudate analogues regulate greenhouse gas fluxes from tropical peat. Soil Biol. Biochem. 2018, 127, 280–285. [Google Scholar] [CrossRef]
- Krüger, J.P.; Leifeld, J.; Glatzel, S.; Szidat, S.; Alewell, C. Biogeochemical indicators of peatland degradation—A case study of a temperate bog in northern Germany. Biogeosciences 2015, 12, 2861–2871. [Google Scholar] [CrossRef]
- Carless, D.; Luscombe, D.J.; Gatis, N.; Anderson, K.; Brazier, R.E. Mapping landscape-scale peatland degradation using airborne lidar and multispectral data. Landsc. Ecol. 2019, 34, 1329–1345. [Google Scholar] [CrossRef]
- Widodo, J.; Izumi, Y.; Takahashi, A.; Kausarian, H.; Kuze, H.; Sumantyo, J.T.S. Detection of Dry-Flammable Peatland Area by Using Backscattering Coefficient Information of ALOS-2 Data L-Band Frequency. In Proceedings of the 2018 Progress in Electromagnetics Research Symposium (PIERS-Toyama), Toyama, Japan, 1–4 August 2018; pp. 916–920. [Google Scholar] [CrossRef]
- Izumi, Y.; Widodo, J.; Kausarian, H.; Demirci, S.; Takahashi, A.; Razi, P.; Nasucha, M.; Yang, H.; Tetuko, J. Potential of soil moisture retrieval for tropical peatlands in Indonesia using ALOS-2 L-band full-polarimetric SAR data. Int. J. Remote Sens. 2019, 40, 5938–5956. [Google Scholar] [CrossRef]
- Alshammari, L.; Large, D.J.; Boyd, D.S.; Sowter, A.; Anderson, R.; Andersen, R.; Marsh, S. Long-term peatland condition assessment via surface motion monitoring using the ISBAS DInSAR technique over the Flow Country, Scotland. Remote Sens. 2018, 10, 1103. [Google Scholar] [CrossRef]
- Zhou, Z.; Li, Z.; Waldron, S.; Tanaka, A. Monitoring peat subsidence and carbon emission in Indonesia peatlands using InSAR time series. In Proceedings of the 2016 IEEE International Geoscience and Remote Sensing Symposium (IGARSS), Beijing, China, 10–15 July 2016; pp. 6797–6798. [Google Scholar] [CrossRef]
- Dahdal, B. The Use of Interferometric Spaceborne Radar and GIS to Measure Ground Subsidence in Peat Soils in Indonesia; Univ. Leicester: Leicester, UK, 2011; p. 378. [Google Scholar]
- Zhou, Z. The Applications of InSAR Time Series Analysis for Monitoring Long-Term Surface Change in Peatlands. Ph.D. Thesis, University of Glasgow, Glasgow, UK, 2013. [Google Scholar]
- Hooijer, A.; Page, S.; Jauhiainen, J.; Lee, W.A.; Lu, X.X.; Idris, A.; Anshari, G. Subsidence and carbon loss in drained tropical peatlands. Biogeosciences 2012, 9, 1053–1071. [Google Scholar] [CrossRef]
- Wösten, J.H.M.; Ismail, A.B.; van Wijk, A.L.M. Peat subsidence and its practical implications: A case study in Malaysia. Geoderma 1997, 78, 25–36. [Google Scholar] [CrossRef]
- Susilo, G.E.; Yamamoto, K.; Imai, T. Modeling Groundwater Level Fluctuation in the Tropical Peatland Areas under the Effect of El Nino. Procedia Environ. Sci. 2013, 17, 119–128. [Google Scholar] [CrossRef]
- Government of Indonesia. Government Regulation Number 71 of Year 2014 about Protection and Management of Peat Ecosystems; Government of Indonesia: Jakarta, Indonesia, 2014; pp. 1–25.
- Government of Indonesia. Government Regulation 57 of Year 2016 about Amendment to Government Regulation Number 71 of Year 2014 about Protection and Management of Peat Ecosystems; Government of Indonesia: Jakarta, Indonesia, 2016.
- Usup, A.; Hashimoto, Y.; Takahashi, H.; Hayasaka, H. Combustion and thermal characteristics of peat fire in tropical peatland in Central Kalimantan, Indonesia. Tropics 2004, 14, 1–19. [Google Scholar]
- Takahashi, H.; Usup, A.; Hayasaka, H.; Limin, S.H. Estimation of ground water level in a peat swamp forest as an index of peat/forest fire. In Proceedings of the International Symposium L. Manag. Biodivers, Southeast Asia, Montreal, Canada, 8–10 November 2001; pp. 311–314. [Google Scholar]
- Rieley, J.O.; Page, A.S.E.; Jauhiainen, J. Wise Use of Tropical Peatlands: Focus on Southeast Asia: Synthesis of Results and Conclusions of the UK Darwin Initiative and the EU INCO EUTROP, STRAPEAT AND RESTORPEAT Partnerships Together with Proposals for Implementing Wise Use of Tropical Peatlands; Wageningen University and the EU INCO STRAPEAT and RESTORPEAT Partnerships; Alterre: Wageningen, The Netherlands, 2005. [Google Scholar]
- Atwood, E.C.; Englhart, S.; Lorenz, E.; Halle, W.; Wiedemann, W.; Siegert, F. Detection and Characterization of Low Temperature Peat Fires during the 2015 Fire Catastrophe in Indonesia Using a New High-Sensitivity Fire Monitoring Satellite Sensor (FireBird). PLoS ONE 2016, 11, e0159410. [Google Scholar] [CrossRef]
- Li, Z.; Bethel, J. Image Coregistration in SAR Interferometry. XXXVII. In Proceedings of the International Archives of the Photogrammetry, Remote Sensing and Spatial Information Sciences, Beijing, China, 3–11 July 2008; pp. 433–438. [Google Scholar]
- Lei, L.; Perissin, D.; Qin, Y. Change detection with spaceborne InSAR technique in Hong Kong. In Proceedings of the 2013 IEEE International Geoscience and Remote Sensing Symposium-IGARSS, Melbourne, VIC, Australia, 21–26 July 2013; pp. 338–341. [Google Scholar] [CrossRef]
- Wang, T.; Liao, M.; Perissin, D. InSAR coherence-decomposition analysis. IEEE Geosci. Remote Sens. Lett. 2010, 7, 156–160. [Google Scholar] [CrossRef]
- Giardina, G.; Milillo, P.; DeJong, M.J.; Perissin, D.; Milillo, G. Evaluation of InSAR monitoring data for post-tunnelling settlement damage assessment. Struct. Control Health Monit. 2019, 26, 1–19. [Google Scholar] [CrossRef]
- Yu, H.; Lan, Y.; Yuan, Z.; Xu, J.; Lee, H. Phase Unwrapping in InSAR. IEEE Geosci. Remote Sens. Mag. 2019, 7, 40–58. [Google Scholar] [CrossRef]
- Widodo, J.; Izumi, Y.; Takahashi, A.; Kausarian, H.; Perissin, D.; Sumantyo, J.T.S. Detection of Peat Fire Risk Area Based on Impedance Model and DInSAR Approaches Using ALOS-2 PALSAR-2 Data. IEEE Access 2019, 7, 22395–22407. [Google Scholar] [CrossRef]
- BPS-Statistics of Pulang Pisau Regency. Pulang Pisau Regency in Figures 2018; BPS-Statistics of Pulang Pisau Regency: Central Kalimantan, Indonesia, 2018. [Google Scholar]
- BPS-Statistics of Kapuas Regency. Statistik Daerah Kabupaten Kapuas 2018; BPS-Statistics of Kapuas Regency: Central Kalimantan, Indonesia, 2018. [Google Scholar]
- Morishita, Y.; Hanssen, R.F. Temporal Decorrelation in L-, C-, and X-band Satellite Radar Interferometry for Pasture on Drained Peat Soils. IEEE Trans. Geosci. Remote Sens. 2015, 53, 1096–1104. [Google Scholar] [CrossRef]
- Jung, J.; Kim, D.J.; Lavalle, M.; Yun, S.H. Coherent change detection using temporal decorrelation model for volcanic ash detection. In Proceedings of the 2016 IEEE International Geoscience and Remote Sensing Symposium (IGARSS), Beijing, China, 10–15 July 2016; pp. 3394–3397. [Google Scholar] [CrossRef]
- Wei, M.; Sandwell, D.T. Decorrelation of L-Band and C-Band Interferometry Over Vegetated Areas in California. IEEE Trans. Geosci. Remote Sens. 2010, 48, 2942–2952. [Google Scholar]
- Zebker, H.A.; Member, S.; Villasenor, J. Decorrelation in Interferometric Radar Echoes. IEEE Trans. Geosci. Remote Sens. 1992, 30, 950–959. [Google Scholar] [CrossRef]
- Askne, J.I.H.; Dammert, P.B.G.; Ulander, L.M.H.; Smith, G. C-Band Repeat-Pass Interferometric SAR Observations of the Forest. IEEE Trans. Geosci. Remote Sens. 1997, 35, 25–35. [Google Scholar] [CrossRef]
- Haniy, S.U.; Hamzah, H.; Hanifa, M. Intense Forest Fires Threaten to Derail Indonesia’s Progress in Reducing Deforestation; World Resources Institute: Washington, DC, USA, 2019; pp. 1–8. [Google Scholar]
- Kebakaran hutan dan lahan kian meluas dan kabut asap semakin parah, BNPB kewalahan padamkan api. BBC, 16 September 2019. Available online: https://www.bbc.com/indonesia/indonesia-49708970 (accessed on 16 November 2019).
© 2019 by the authors. Licensee MDPI, Basel, Switzerland. This article is an open access article distributed under the terms and conditions of the Creative Commons Attribution (CC BY) license (http://creativecommons.org/licenses/by/4.0/).