Abstract
The physicochemical properties of soil and the unsaturated zone can have a large influence on the infiltration of precipitation into an aquifer. Soil permeability presents soil property that can be very variable. The main objectives of this study were to estimate differences in soil permeability in two dominant types of soils—Fluvisols and Eutric Cambisols—in the area of the Zagreb aquifer and determine the relationship between the physicochemical properties and the permeability of the analyzed soils. For this purpose, the particle size distribution, soil water retention curves (SWRCs), hydraulic parameters, and chemical properties of soils (i.e., electrical conductivity (EC), pH, carbonate content, cation exchange capacity (CEC), and total concentration of zinc (Zn)) from six soil profiles were observed. In general, the results show that Fluvisols have a smaller amount of clay and a higher amount of sand. Furthermore, particle size distribution indicates that Eutric Cambisols have smaller permeability and a slightly higher capacity for retention. In Eutric Cambisols, the percentages of clay, silt, and sand generally do not change with depth. On average, Fluvisols and Eutric Cambisols become impermeable when they reach different values of water content and effective saturation. All results suggest that Fluvisols generally have to desaturate more than Eutric Cambisols to become impermeable. The proportions of sand and Ks increases through the depth of all analyzed soils, while CEC, EC, and Zn decrease. The total Zn generally decrease with depth, which can be attributed to the aerodeposition in the surface horizons of the analyzed soils and their higher availability for binding/sorption elements. Generally, it can be seen that most Zn concentrations increase until 80 cm in depth, after which they decrease. This result indicates that, in these specific locations, the groundwater body is not under the influence of a potentially toxic metal, in this case Zn. Statistical analysis shows a strong correlation between Zn concentrations and some soil properties, such as soil texture and CEC. This may point to the prevalence of Zn retention. Furthermore, statistical results show that silt has a higher influence on the permeability of Eutric Cambisols than Fluvisols.
1. Introduction
The Zagreb aquifer represents the main source of potable water for the inhabitants of the City of Zagreb and part of Zagreb County. This aquifer is designated as a part of the strategic water reserves of the Republic of Croatia. Due to the anthropogenic influence, problems regarding groundwater quality have been observed. Five main groups of contaminants have been identified: nitrates, pesticides, potentially toxic metals, chlorinated aliphatic compounds, and pharmaceuticals [1]. Although different means of exploration regarding groundwater contamination have been undertaken, most efforts were related to the origins and trends of nitrates [2,3,4,5]. Research on the soil and unsaturated zone was not the main subject in most of these studies.
The chemical and physical properties of the soil and the unsaturated zone can have a large influence on effective infiltration (i.e., infiltration of the precipitation to the aquifer). Potentially toxic metals, such as zinc (Zn), can be easily transported through the unsaturated zone with water. Zn is an essential nutrient that can be toxic in large amounts [6]. In addition, Zn is substantially added to soil by agricultural practices [7], is widely used in fertilizers, and stimulates animal growth [8]. Generally, most of the analyzed soils in this study were distributed in arable land, so the possible contamination of the Zagreb aquifer with Zn from agriculture is not negligible.
One of the most commonly investigated parameters in the soil and unsaturated zone is soil permeability. Indeed, soil permeability presents a crucial physical parameter for the investigation of contaminants’ movements, for example, potentially toxic metals through the unsaturated zone. Soil permeability is a soil property that can be very variable. Different research has shown that soil waters in rivers contribute to eutrophication and hypoxia [9], although soil water can contribute in different percentages to water’s discharge into the surface water [10,11,12]. In addition, soil water directly or indirectly controls runoff generation, groundwater recharge, evapotranspiration, and even soil respiration [13]. Further, different chemical processes can influence soil permeability. It was shown that excessive sodium ions in the exchange complex can enhance swelling and dispersion, which may have an effect on soil matrix stability and generate a decrease in permeability [14]. The sodium adsorption ratio (SAR) can influence soil structure and permeability [15]. Sodium can cause adverse physiochemical changes in the soil, especially those related to soil structure [16]. Among the SAR, cation exchange capacity (CEC) and electrical conductivity (EC), in combination with soil texture, can also be related to soil permeability. High correlations between electrical conductivity and the physical properties of soils have also been observed [17]. It was found that soils with higher cation exchange capacity values have smaller permeability [17], which is consistent with research where the minimum cation exchange capacity value was found in the soil horizon with the maximum hydraulic conductivity value [18]. Different research has been conducted on water and solute transport in the vadose zone [19]. It has been shown that for the evaluation of water and solute transport, suction cup samplers and drainage lysimeters are mostly used. However, field and laboratory techniques can be very expensive and also time-consuming, with many different practical limitations [20]. Water distribution through the soil is directly related to hydraulic conductivity, where the permeability coefficient and permeability function can be predicted using empirical methods [21]. Additionally, a simple technique for the estimation of unsaturated conductivity values has been proposed based on conventional soil properties (i.e., saturated hydraulic conductivity and water content) [22]. In saturated soils, hydraulic conductivity can vary by more than 10 orders of magnitude, while unsaturated soils are even more difficult to analyze. In order to solve engineering problems, it is necessary to define the value of the hydraulic conductivity that presents the impermeable boundary. In this research, a value of 8.64 × 10⁻³ cm/day (i.e., 1 × 10⁻⁹ m/s) was used [23]. In soil permeability research, knowledge of the pressure heads and pore water pressures can be very important. In general, these values are insensitive to saturated hydraulic conductivity and its related permeability. The relationship between soil suction and water content is usually shown by the construction of a soil water retention curve (SWRC). As such, it relies on the soil texture, organic matter content, and bulk density. Furthermore, it varies in the soil profile both vertically and horizontally [24]. Historically, although different equations were developed [21,25,26], different parameters (i.e., soil structure, compaction energy, texture, organic content, mineralogy, and hysteresis) can also influence SWRC behavior [27,28].
The main objectives of this study were: a) to estimate the difference in soil permeability in two dominant types of soils in the area of the Zagreb aquifer and b) to determine the relationship between the physicochemical properties and permeability of the analyzed soils.
2. Study Area
The study area (the extent of the Zagreb aquifer) is situated in the northwest part of the Republic of Croatia (Figure 1). This area includes the City of Zagreb and its surroundings, covering approximately an area of 300 km2. In the research area, different types of soil have been observed, and two types dominate: Fluvisols and Eutric Cambisols on Holocene deposits [29,30,31]. Fluvisols cover approximately 43% of the investigated area, while Eutric Cambisols are developed in approximately 32% of the investigated area. Fluvisols are generally permeable, except during dry periods [32], while Eutric Cambisols developed on the Holocene deposits suggest less permeable soil, where percolation into the aquifer is negligible [33]. The investigated soil profiles are determined as Fluvisols and Eutric Cambisols developed on Holocene deposits [31]. Fluvisols are found on the alluvial plains, river fans, and valleys. This type of soil is characterized by weak horizon differentiation, although a distinct Ah-horizon may be present. The texture of these soils is mainly loam (rarely clayey loam) while their structure is crumbly or blocky. Eutric Cambisols combine soils with at least an incipient subsurface soil formation. Transformation of the parent material is evident from the structure’s formation and its mostly brownish discoloration, as well as its increasing clay percentage and/or carbonate removal. The texture of these soils is silty clay loam and the soil’s structure is mainly granular. The presence of the clayey cambic horizon, with a pedological profile structure of A-(B)w-C, is characteristic for the specified soil [31]. It has been shown that the thickness of the unsaturated zone varies from two meters in the southeastern part of the Zagreb aquifer to eight meters in the northwestern part [34], while in high waters, some areas can be flooded [35]. A great part of the unsaturated zone, especially in the left bank of the Sava River in the urban part of the City of Zagreb, has been disintegrated by anthropogenic influences, such as traffic, aerodeposition, industry, and illegal waste dumps.
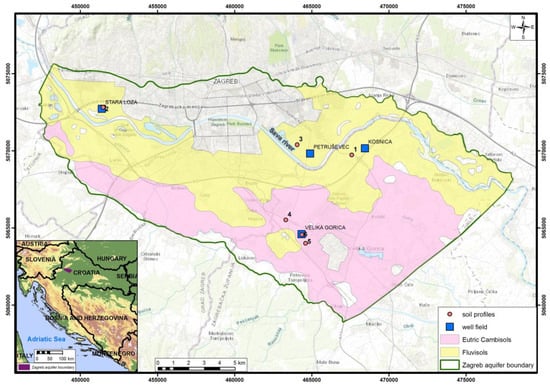
Figure 1.
Zagreb aquifer with the study areas (soil profiles).
The Zagreb aquifer consists of the two aquifer layers, which were deposited during the Middle and Upper Pleistocene and Holocene. Holocene deposits are alluvial, while Pleistocene are lacustrine–marshy [36,37,38]. The Middle Pleistocene unit is relatively uniform in composition. While the lower and middle part is predominantly composed of the grey colored sands, the upper part comprises grey colored or red to yellowish-brown mottled silt and clay sized material. During the warmer periods, the tops of these sediments were exposed to pedogenic processes. The Upper Pleistocene unit is characterized by frequent lateral changes of its gravels, sands, silts and clays. The Holocene unit is composed of pale, yellowish-grey, colored gravels and sands, in which limestone cobbles prevail [37,39]. All investigated soil profiles are situated in the Holocene sediments.
The Zagreb aquifer (Figure 1) is an alluvial unconfined aquifer, which is in direct contact with the Sava River, the main source of recharge. The general groundwater flow direction is from west to east and south–east. Although recharge also occurs from precipitation, the Sava River presents the dominant boundary condition, which is the most prominent in the vicinity of the Sava River [40]. The groundwater levels are declining. The main reasons for the lowering groundwater levels are (1) extensive riverbed erosion due to upstream Sava River regulation and gravel exploitation from the river; (2) embankment of the Sava River, which stopped occasional flooding of the area and potential infiltration to the groundwater; (3) excessive abstraction for municipal and industrial needs; and (4) prolonged periods of drought [1].
3. Materials and Methods
Each soil profile was classified according to the IUSS Working Group WRB [31]. Three soil profiles were determined to be the Fluvisols, while three were determined to be the Eutric Cambisols developed on Holocene deposits. Two profiles were located in the left bank of the Sava River, while four of them were located on the right bank of the Sava River (Figure 1). A detailed description of the soil profiles can be found in previous research [32,33,41,42,43]. Profile 1 is located in the eastern part of the Zagreb aquifer near the future regional well field Kosnica in the Fluvisols. The particle size analysis of the soil profile was investigated up to 210 cm deep in six different horizons. Soil particle size analysis was made by the pipette-method with wet sieving and sedimentation after dispersion with sodium-pyrophosphate (Na4P2O7, c = 0.4M). Profile 2 is located in the area of the Stara Loza well field in the western part of the aquifer (also determined to be Fluvisols). The particle size analysis was investigated up to a 170 cm depth in the six different soil horizons. Profile 3 is located in the area of the well field Petruševec, which is located in the Fluvisols till the depth of 190 cm in the eight different soil horizons. Profiles 4 to 6 are located in the area of the well field Velika Gorica, while the investigated depth varies from 90 to 120 cm in the 3 to 6 soil horizons. The particle size analysis of all soil profiles (by depth) is shown in Table 1. In sum, 34 soil samples were collected from the soil profiles. The soil samples were air-dried and passed through a 2 mm sieve for laboratory analysis (i.e., determination of electrical conductivity, pH, carbonate content, cation exchange capacity (CEC) and total concentration of zinc). Electrical conductivity of the soil was measured in the water with a 1:5 soil to water ratio using a Multi 340i WTW EC meter. Soil pH was measured in the water with a 1:5 soil to water ratio [44] using a Multi 340i WTW pH meter. Carbonate content was determined gas-volumetrically using a Scheibler apparatus [45]. CEC was determined using a barium chloride solution [46]. The total concentration of Zn was analyzed by flame atomic absorption spectrometry (AAnalyst 700, Perkin Elmer) after totally dissolving the samples using an aquaregia solution.

Table 1.
The particle size analysis of the soil profiles by depth [32,33,41,43].
Soil hydraulic parameters were estimated using Rosetta Lite software [47] and are shown in Table 2. Theoretical SWRCs and the estimated values of the unsaturated hydraulic conductivities [26] were constructed and calculated using Equations (1)–(4):
where θr is the residual water content (cm3/cm3), θs is the saturated water content (cm3/cm3), hb is the bubbling pressure (cm), K(θ) is the unsaturated hydraulic conductivity (cm/day), Ks is the saturated hydraulic conductivity (cm/day), Se is the effective saturation (%), ψ is the matrix potential (cm), while α (1/m), n, and m are parameters that depend on the slope of the curve [26,48]. For statistical analysis, the basic statistical parameters (i.e., average value, standard deviation, coefficient of variation, and correlation coefficient) were used. Further, correlation analyses was done between the clay, silt, sand content, estimated saturated hydraulic conductivity, and chemical properties of the investigated soils. Firstly, a correlation analysis was done on all available data, and after it was done separately for data from the Fluvisols and Eutric Cambisols. All statistically significant values are marked in red. The chemical properties of the investigated soils are shown in Table 3.
Table 2.
Soil hydraulic parameters of the investigated soil profiles by depth.
Table 3.
Chemical properties of the investigated soils. Not analyzed (n.a.); electrical conductivity (EC); cation exchange capacity (CEC).
4. Results and Discussion
4.1. Relationships Between the Soil Hydraulic Data
Statistical insight into the observed data has shown that the investigated soils in the area of the Zagreb aquifer contain, on average, 17.91% clay, 64.06% silt, and 18.03% sand, with the highest standard deviation and coefficient of variation for silt (Table 4). However, if the soils are investigated separately, it can be seen that the Fluvisols have a smaller amount of clay and a higher amount of sand, while the coefficients of variations are very similar. The first insight into the particle size distribution suggests that Eutric Cambisols should have a smaller permeability and a slightly higher capacity for retention due to the calculated hydraulic parameters (Table 4). This is consistent with the average values of the saturated hydraulic conductivity which are more than 50% higher in the Fluvisols. If the data are evaluated graphically (Figure 2), it can be seen that in the Fluvisol percentage of sand increases with depth, while the silt percentage continues to decrease. Soil texture (percentages of clay, silt, and sand) generally does not change with depth in the Eutric Cambisols.
Table 4.
Average values for the particle size distribution and soil hydraulic parameters.
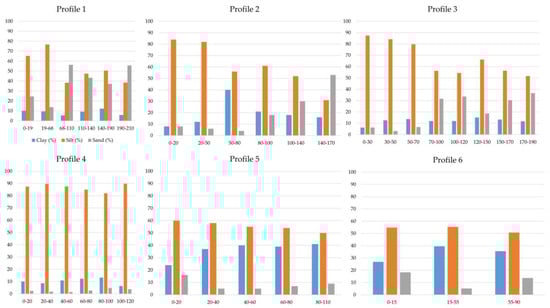
Figure 2.
Particle size distribution with depth (in cm) in the six soil profiles.
In the unsaturated zone, hydraulic conductivity decreases with a decrease in water content. Increased Ks values in the surface horizons of the Fluvisols could be due to the presence of root channels and macroporosities. Similar conclusions were reported in some of the previous research [49,50]. The authors found that the root systems increased water flow, as indicated by the higher Ks, macroporosities, and water recharge rates of the Ap horizon. The lowest Ks values were determined in the Eutric Cambisols on the Holocene deposits. This is due to the soil texture and close contact with gravels and sands. Similar results were reported by Wegehenkel et al. [51].
It is very important to monitor the water content in time because it can show the variability of unsaturated hydraulic conductivity and related permeability [32]. However, this kind of data can usually be used only when the pedological pits are excavated and different instruments are installed [52,53,54]. Additionally, water content can also be defined when sampling is carried out [33], but, in that case, unsaturated hydraulic conductivity can be only estimated during the sampling time. However, differences in the permeability between various materials can also be estimated by the creating theoretical SWRCs and by inspecting the range of values of the unsaturated hydraulic conductivities. According to Ružičić et al. [32], water content varies from 39.74% to 46.41% in the investigated Fluvisols developed in the area of the Zagreb aquifer. Borek and Bogdał [55] reported a similar distribution of water content in the Fluvisols. Figure 3, Figure 4, Figure 5, Figure 6, Figure 7 and Figure 8 show the SWRCs and the full range (for the water content from θr to θs) of the possible unsaturated hydraulic conductivities of all the analyzed soil profiles, together with the full range of the possible effective saturation. It can be seen that the soil depths where the highest percentage of sand is defined show faster desaturation (i.e., their slopes are steeper). Furthermore, they also have smaller values for the possible residual water content. On the other hand, when high percentages of silt and clay are recorded, higher values are obtained for the residual water content and porosity. In addition, it is obvious that in soils with a higher sand percentage, the start of desaturation occurs under a smaller pressure. Unsaturated hydraulic conductivities can also vary widely—from about 50 cm/day up to less than 1 × 10-32 cm/day, depending on the level of saturation. Kercheva et al. [56] reported similar hydraulic soil properties in the Fluvisols. In Profile 1 (Figure 3, Table 5), it can be seen that the impermeable boundary is reached when the water content is 0.16 and 0.18, and the effective saturation is between 29% and 41%. In Profile 2 (Figure 4, Table 5), the impermeable boundary is reached when the water content is between 0.19 and 0.3, and the effective saturation is between 31% and 50%. Similar numbers can be seen in Profile 3 (Figure 5, Table 5), where the impermeable boundary is reached when the water content is between 0.17 and 0.21, and the effective saturation is between 31% and 36%. In general, in the Eutric Cambisols, higher water content (i.e., smaller level of desaturation) is necessary for to establish the impermeable boundary. In Profile 4 (Figure 6, Table 5), the water content between 0.20 and 0.22 and effective saturation between 32% and 36% are necessary to reach the impermeable boundary. In Profile 5 (Figure 7, Table 5), the water content between 0.22 and 0.30 generates impermeability, and the effective saturation is between 40% and 51%. Similar values are obtained for Profile 6 (Figure 8, Table 5), where the impermeable boundary is reached when the water content is between 0.23 and 0.30, and effective saturation is between 42% and 49%. Generally, it can be seen that the soil profiles in the two most dominant soil types in the area of the Zagreb aquifer have different particle size distributions that generate different levels of retention. On average, Fluvisols become impermeable when they reach a water content of 0.19 with an effective saturation of 36%, while Eutric Cambisols become impermeable when their water content reaches 0.25 with an effective saturation of 42% (Figure 9). All results suggest that effective infiltration of the precipitation would be smaller if the Eutric Cambisols were developed, which is consistent with the study that found Fluvisols to generally have good permeability with low water retention capacity and Eutric Cambisols to have good water retention [57].
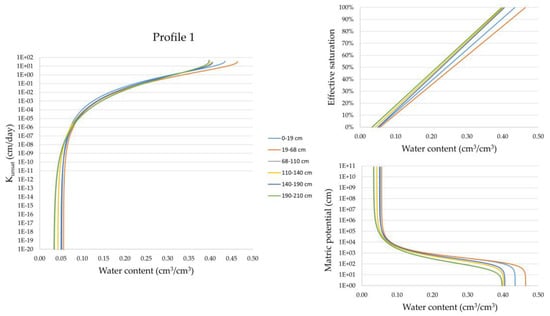
Figure 3.
Soil water retention curves (SWRCs), effective saturations, and unsaturated hydraulic conductivities in soil profile 1.
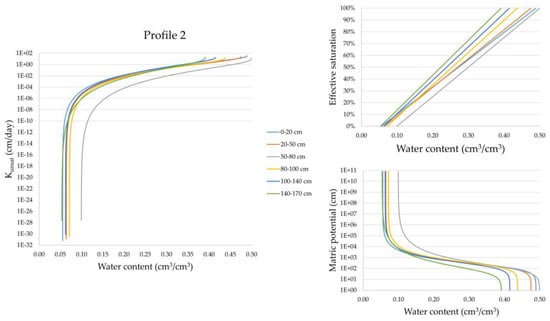
Figure 4.
SWRCs, effective saturations, and unsaturated hydraulic conductivities in soil profile 2.
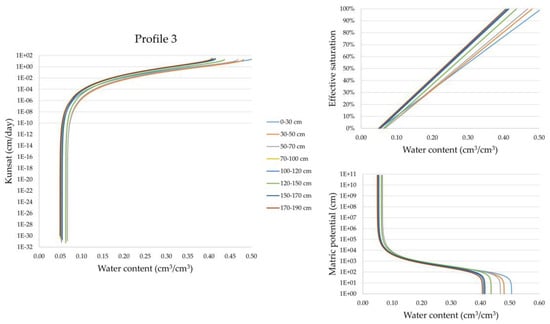
Figure 5.
SWRCs, effective saturations, and unsaturated hydraulic conductivities in soil profile 3.
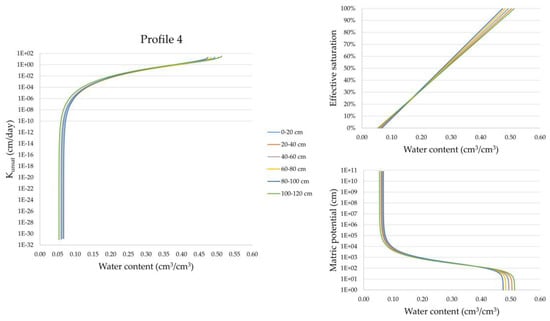
Figure 6.
SWRCs, effective saturations, and unsaturated hydraulic conductivities in soil profile 4.
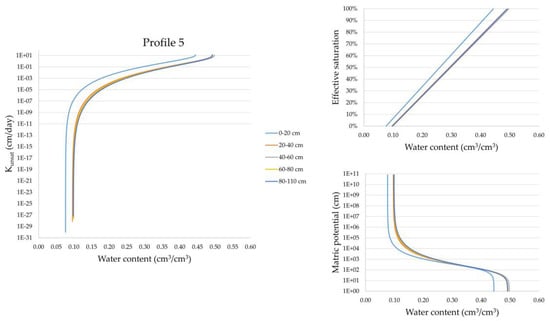
Figure 7.
SWRCs, effective saturations, and unsaturated hydraulic conductivities in soil profile 5.
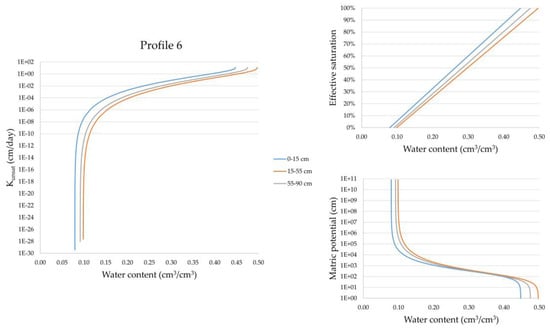
Figure 8.
SWRCs, effective saturations, and unsaturated hydraulic conductivities in soil profile 6.
Table 5.
Values of the water content and effective saturation that generate impermeability in the investigated soil profiles.
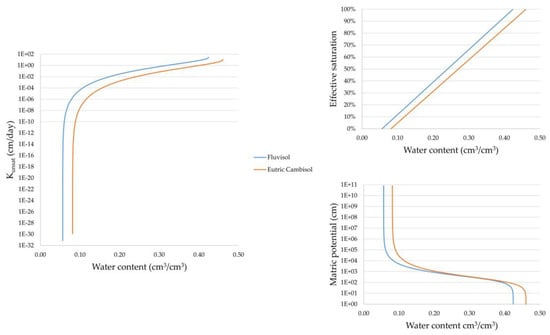
Figure 9.
Difference in the SWRCs, effective saturations, and unsaturated hydraulic conductivities between the Fluvisols and Eutric Cambisols.
4.2. Relationship Between Water Movement and Physicochemical Properties of Soils
The chemical properties of the analyzed soils are shown in Table 3. The highest CEC and EC values are determined at almost all soil subsurface depths (Table 3). Due to their higher organic matter, clay minerals, and iron oxyhydroxides, subsurface soil horizons—in almost all cases—show higher CEC and EC values. Correlation matrices are shown in Table 6. All statistically significant results are marked red (p <0.05). Results were evaluated both together and separately for the Fluvisols and Eutric Cambisols. When all the data are correlated, much more statistically significant correlation coefficients are obtained. Soil electrical conductivity may influence the CEC values [58]. However, in this research, correlation analyses did not produce statistically significant results between the CEC and EC. A strong relationship between Zn concentrations, CEC, and water content in soils was observed [59]. When a statistically significant correlation analysis of Zn with all other variables is evaluated, it can be seen that, in the Fluvisols, Zn is only negatively correlated with pH and with EC in the Eutric Cambisols. When all the data are correlated together, Zn concentrations have a statistically significant positive correlation with CEC and clay, and a negative correlation with pH, carbonate content, sand, and Ks. The correlation coefficients suggest that Zn concentrations are more closely related to the pH, carbonate content, and sand components, and higher Zn concentrations can be expected in soils with lower pH, less carbonate content, and fewer sand components. According to Mertens and Smolders [60], Zn concentration is increased as the pH decreases in soils.
Table 6.
Correlation matrices between the chemical properties, particle size distribution, and saturated hydraulic conductivity (correlation coefficients marked red are statistically significant).
Although a statistically significant moderate positive correlation between Zn and CEC is present, this correlation is not recorded when the correlation analysis is made separately. A very low negative correlation between Zn and CEC is present in the Fluvisols, and a very low positive correlation is present in the Eutric Cambisols. Due to increase of sand content in the Fluvisols, it seems that Zn more commonly binds to fine particles in the Eutric Cambisols than in the Fluvisols. In some research, positive correlations between Zn and siltous materials have been reported [61]. This correlation is not very pronounced in the present study, although in all three cases, there is a very low–moderate positive correlation between the silt components and Zn, which indicates that Zn is partially bounded in the silt component of the analyzed soils. The total Zn generally decreases with depth, which can be attributed to the aerodeposition in the surface horizons of the analyzed soils and their higher availability for binding/sorption elements. A similar distribution of Zn through the profiles of the Fluvisols and Eutric Cambisols have been found [62,63,64]. In some studies, a highly positive correlation between EC and siltous material has been pointed out [17]. Electrical conductivity generally decreases with depth, but no correlation between silt and EC can be seen in the Eutric Cambisols. On the contrary, in the Fluvisols, a moderately positive correlation between silt and EC is present, which is consistent with the moderately negative correlation between the EC and sand components. In general, the proportion of sand and Ks values increase through the depth of all analyzed soils, as CEC, EC, and Zn are decrease. Results also suggest that particle size distribution in the Fluvisols has a greater influence on CEC values, carbonate content, and EC, which is mostly related to the silt and sand components. Changes in pH values along the soil profile can be associated with a change of carbonates, while the alkalinity of the soil can be attributed to the presence of magnesium and calcium carbonates [41], which generally coincides with the correlation results in this research. Furthermore, when all data are correlated, the results suggest that silt is an unessential parameter that does not have any influence on hydraulic conductivities. This is evident within the correlation results for the Fluvisols. However, in the Eutric Cambisols, the silt components have a very positive correlation, which could be the consequence of the lower average content of the sand and the higher average content of the clay than in the Fluvisols. This impact is confirmed by the moderately negative correlation of the saturated hydraulic conductivity with the sand. It seems that in soils with high clay and low sand content, silt can have a very high impact on the soil’s permeability. All results indicate that a statistical analysis should be used to evaluate the different levels, which could point to different results and suggest different conclusions.
5. Conclusions
The Fluvisols and Eutric Cambisols that developed on the Holocene deposits represent the two most dominant types of soils in the area of the Zagreb aquifer. Generally, it can be seen that the soil profiles in the two most dominant soil types in the area of the Zagreb aquifer have different particle size distributions, which generate different retention and possible infiltration parameters. The sand percentage in the Fluvisols increases with depth, while the silt percentage decreases. This can be explained with the movement of the Sava River in the past and formation of various meanders with bigger particles. In average, the Fluvisols become impermeable when they reach a water content of 0.19 and an effective saturation of 36%, while the Eutric Cambisols become impermeable when their water content reaches 0.25, with an effective saturation of 42%. The increased Ks values in the surface horizons of the Fluvisols could be due to the presence of root channels and macroporosities. In addition, this study revealed a strong relationship between soil permeability and some chemical properties of the analyzed soils. Most of the highest Zn concentrations were determined in the first 30 cm of the analyzed soils, while the lowest concentrations were observed in the deepest soil depths, which can be attributed to the aerodeposition in the surface horizons of the analyzed soils and their higher availability for binding/sorption elements. Generally, it can be seen that most Zn concentrations increase to 80 cm depth and decrease afterward. In general, the statistical analyses showed strong correlations between the Zn concentrations and some physicochemical soil properties. Zn is negatively correlated with the pH, carbonate content, the sand component and Ks. The Zn concentration increases as pH decreases in the analyzed soils. In addition, a negative correlation was observed between the total Zn and sand content, which can be explained by Zn’s availability to bind to smaller particle size materials, in this specific case, siltous material. The results suggest that sand represents a very important variable in the estimation of the transport of Zn through the soils in the area of the Zagreb aquifer. However, this result should be tested in more detail in future research. Furthermore, the statistical results indicate that silt is an unessential parameter that does not have a big influence on the values of hydraulic conductivities in the Fluvisols but can be very important for estimating permeability in the Eutric Cambisols. All results suggest that percolation of the surface and soil water from precipitation, as well as Zn transport, is possible in larger quantities where the Fluvisols are developed. This is confirmed with the physicochemical properties and Zn availability of the Fluvisols. All results suggest that water movement or percolation is related with the physicochemical properties of soils, especially the particle size distribution of the analyzed soil. A detailed chemical analysis of the potentially toxic metals, which are also derived from the agricultural activities (e.g., Cd, Cu) and the creation of water flow and transport models using field measurements in the analyzed soils should be of primary interest in future research. Future research should alsofocus on monitoring the physical and chemical properties of the soil and the unsaturated zone in time and in the different parts of the aquifer, but also their interpretations at different scales. In addition, future research needs to consider the distribution of soil cracks and voids, which can also be important for water percolation with contaminants in soils.
Author Contributions
Z.K. have participated in the different previous studies, the data of which were used in this article. S.R. and Z.K. developed the concept of the research and wrote most of the article. Z.K., D.P., and L.B. produced the statistical analysis. D.P. made Figure 1 in ArcMap. Z.K., L.B., and D.P. participated in the technical editing of the figures and article. L.M. participated in the laboratory analysis. All authors participated in the writing of the article.
Funding
This research received no external funding.
Acknowledgments
The publication process is supported by the Development Fund of the Faculty of Mining, Geology, and Petroleum Engineering, University of Zagreb.
Conflicts of Interest
The authors declare no conflict of interest. The funders had no role in the design of the study; in the collection, analyses, or interpretation of data; in the writing of the manuscript; or in the decision to publish the results.
References
- Nakić, Z.; Ružičić, S.; Posavec, K.; Mileusnić, M.; Parlov, J.; Bačani, A.; Durn, G. Conceptual model for groundwater status and risk assessment—case study of the Zagreb aquifer system. Geol. Croat. 2013, 66, 55–76. [Google Scholar] [CrossRef]
- Kovač, Z.; Nakić, Z.; Pavlić, K. Influence of groundwater quality indicators on nitrate concentrations in the Zagreb aquifer system. Geol. Croat. 2017, 70, 93–103. [Google Scholar] [CrossRef]
- Kovač, Z.; Cvetković, M.; Parlov, J. Gaussian simulation of nitrate concentration distribution in the Zagreb aquifer. J. Maps 2017, 13, 727–732. [Google Scholar] [CrossRef]
- Kovač, Z.; Nakić, Z.; Barešić, J.; Parlov, J. Nitrate origin in the Zagreb aquifer system. Geofluids 2018, 15. [Google Scholar] [CrossRef]
- Kovač, Z.; Nakić, Z.; Špoljarić, D.; Stanek, D.; Bačani, A. Estimation of nitrate trends in the groundwater of the Zagreb aquifer. Geosciences 2018, 8, 159. [Google Scholar] [CrossRef]
- Nan, Z.; Li, J.; Zhang, J.; Cheng, G. Cadmium and zinc interactions and their transfer in soil-crop system under actual field conditions. Sci. Total. Environ. 2002, 285, 187–195. [Google Scholar] [CrossRef]
- Bonten, L.T.C.; Römkens, P.F.A.M.; Brus, D.J. Contribution of Heavy Metal Leaching from Agricultural Soils to Surface Water Loads. Environ. Forensics 2008, 9, 252–257. [Google Scholar] [CrossRef]
- Schipper, P.; Bonten, L.; Plette, A.; Moolenaar, S. Measures to diminish leaching of heavy metals to surface waters from agricultural soils. Desalination 2008, 226, 89–96. [Google Scholar] [CrossRef]
- Rabalais, N.N.; Díaz, R.J.; Levin, L.A.; Turner, R.E.; Gilbert, D.; Zhang, J. Dynamics and distribution of natural and human-caused hypoxia. Biogeosciences 2010, 7, 585–619. [Google Scholar] [CrossRef]
- Land, M.; Ingri, J.; Andersson, P.S.; Öhlander, B. Ba/Sr, Ca/Sr and 87Sr/86Sr ratios in soil water and groundwater: implications for relative contributions to stream water discharge. Appl. Geochem. 2000, 15, 311–325. [Google Scholar] [CrossRef]
- Hogan, J.; Blum, J. Tracing hydrologic flow paths in a small forested watershed using variations in 87Sr/86Sr, [Ca]/[Sr], [Ba]/[Sr] and δ18O. Water Resour. Res. 2003, 39. [Google Scholar] [CrossRef]
- Petelet-Giraud, E.; Klaver, G.; Negrel, P. Natural versus anthropogenic sources in the surface- and groundwater dissolved load of the Dommel river (Meuse basin): Constraints by boron and strontium isotopes and gadolinium anomaly. J. Hydrol. 2009, 369, 336–349. [Google Scholar] [CrossRef]
- Garcia-Estringana, P.; Latron, J.; Molina, A.J.; Llorens, P. Seasonal and spatial variability of rainfall redistribution under Scots pine and Downy oak forests in Mediterranean conditions. In EGU General Assembly Conference Abstracts; European Geosciences Union: Munich, Germany, 2013; Volume 15. [Google Scholar]
- Keren, R.; Ben-Hur, M. Interaction effects of clay swelling and dispersion and CaCO3 content on saturated hydraulic conductivity. Soil Res. 2003, 41, 979–989. [Google Scholar] [CrossRef]
- Subramani, T.; Elango, L.; Damodarasamy, S.R. Groundwater quality and its suitability for drinking and agricultural use in Chithar River Basin, Tamil Nadu, India. Environ. Geolo. 2005, 47, 1099–1110. [Google Scholar] [CrossRef]
- Rosu, C.; Pistea, I.; Roba, C.; Nes, M.; Ozunu, A. Groundwater quality and its suitability for drinking and agricultural use in a rural area from Cluj county (Floresti village). Eng. Agric. Rural Dev. 2014, 14, 247–251. [Google Scholar]
- Chaudhari, P.R.; Ahire, D.V.; Chkravarty, M.; Maity, S. Electrical conductivity as a tool for tetermining the physical properties of Indian soils. Int. J. Sci. Res. Publ. 2014, 4, 1–4. [Google Scholar]
- Ružičić, S.; Mileusnić, M.; Posavec, K.; Nakić, Z.; Durn, G.; Filipović, V. Water flow and solute transport model of potentially toxic elements through unsaturated zone at regional wellfield Kosnica. Hydrol. Process. 2016, 30, 4113–4124. [Google Scholar] [CrossRef]
- Singh, G.; Kaur, G.; Williard, K.; Schoonover, J.; Kang, J. Monitoring of water and solute transport in the vadose zone: A review. Vadose Zone J. 2017, 17. [Google Scholar] [CrossRef]
- Van Genuchten, M.T.; Kaveh, F.; Russell, W.B.; Yates, S.R. Direct and indirect methods of estimating the hydraulic properties of unsaturated soils. In Land Qualities in Space and Time, Proceedings of the Symposium Organized by the International Society of Soil Science (ISSS), Wageningen, The Netherlands, 22–26 August 1988; Bouma, J., Bregt, A.K., Eds.; Centre for Agricultural Publishing and documentation: Pudoc Wageningen, The Netherlands, 1989; pp. 61–72. [Google Scholar]
- Fredlund, D.; Xing, A. Equations for the soil-water characteristic curve. Can. Geotech. J. 1994, 31, 521–532. [Google Scholar] [CrossRef]
- Lobbezoo, J.P.; Vanapalli, S.K. A simple technique for estimating the coefficient of permeability of unsaturated soils. In Proceedings of the 55th Canadian Geotechnical Conference, Niagara Falls, ON, Canada, 20–23 October 2002; Stolle, D., Piggott, A.R., Crowder, J.J., Eds.; 2002; pp. 1277–1284. [Google Scholar]
- Terzaghi, K.; Peck, R.B. Soil Mechanics in Engineering Practice; J. Wiley and Sons: New York, NY, USA, 1967; p. 529. [Google Scholar]
- Cools, N.; De Vos, B. Availability and evaluation of European forest soil monitoring data in the study on the effects of air pollution on forests. iForest Biogeosciences For. 2011, 4, 205–211. [Google Scholar] [CrossRef]
- Brooks, R.H.; Corey, A.T. Hydraulic Properties of Porous Media; Hydrology Papers; Colorado State University: Fort Collins, CO, USA, 1964. [Google Scholar]
- Van Genuchten, M.T. A Closed-form Equation for Predicting the Hydraulic Conductivity of Unsaturated Soils1. Soil Sci. Soc. Am. J. 1980, 44, 892–898. [Google Scholar] [CrossRef]
- Vanapalli, S.K.; Pufahl, D.E.; Fredlund, D.G. The influence of soil structure and stress history on the soil–water characteristics of a compacted till. Geotechnique 1999, 49, 143–159. [Google Scholar] [CrossRef]
- Ng, C.W.W.; Pang, Y.W. Influence of Stress State on Soil-Water Characteristics and Slope Stability. J. Geotech. Geoenvironmental Eng. 2000, 126, 157–166. [Google Scholar] [CrossRef]
- Bogunović, M.; Vidaček, Ž.; Husnjak, S.; Sraka, M.; Petošić, D. Inventory of Soils in Croatia. Agric. Conspec. Sci. 1998, 63, 105–112. [Google Scholar]
- Sollitto, D.; Romić, M.; Castrignanò, A.; Romić, D.; Bakić, H. Assessing heavy metal contamination in soils of the Zagreb region (Northwest Croatia) using multivariate geostatistics. Catena 2010, 80, 182–194. [Google Scholar] [CrossRef]
- IUSS Working Group WRB. World Reference Base for Soil Resources, update 2015: International soil classification system for naming soils and creating legends for soil maps. In World Soil Resources Reports; Food and Agriculture Organization of the United Nations: Rome, Italy, 2015; No.106; p. 192. [Google Scholar]
- Ružičić, S.; Kovač, Z.; Nakić, Z.; Kireta, D. Fluvisol permeability estimation using soil water content variability. Geofiz. 2017, 34, 141–155. [Google Scholar] [CrossRef]
- Ružičić, S.; Kovač, Z.; Tumara, D. Physical and chemical properties in relation to soil permeability in the area of the Velika Gorica well field. Rudarsko-Geološko-Naftni Zbornik 2018, 33, 73–81. (In Slovenia) [Google Scholar] [CrossRef]
- Ružičić, S.; Mileusnić, M.; Posavec, K. Building conceptual and mathematical model for water flow and solute transport in the unsaturated zone at Kosnica site. Rudarsko-Geološko-Naftni Zbornik 2012, 25, 21–31. (In Slovenia) [Google Scholar]
- Huljek, L.; Perković, D.; Kovač, Z. Nitrate contamination risk of the Zagreb aquifer. J. Maps 2019, 15, 570–577. [Google Scholar] [CrossRef]
- Velić, J.; Saftić, B. Subsurface spreading and facies Characteristics of middle peistocene deposits between Zaprešić and Samobor. Geol. Vjesn. 1991, 44, 69–82. [Google Scholar]
- Velić, J.; Durn, G. Alternating Lacustrine-Marsh Sedimentation and Subaerial Exposure Phases during Quaternary: Prečko, Zagreb, Croatia. Geol. Croat. 1993, 46, 71–90. [Google Scholar] [CrossRef]
- Velić, J.; Saftić, B. Dubinskogeološki odnosi područja smetlišta “Jakuševec”-čimbenik sanacije- Gospodarenje otpadom (engl. Deep geologic relations on waste depository "Jakuševec"-factor of remediation-Waste management). ZGO Gospodarenje otpadom 1996, 20–22. [Google Scholar]
- Velić, J.; Saftić, B.; Malvić, T. Lithologic composition and stratigraphy of Quaternary sediments in the area of the “Jakuševec” Waste Depository (Zagreb, Northern Croatia). Geol. Croat. 1999, 52, 119–130. [Google Scholar] [CrossRef]
- Posavec, K.; Vukojević, P.; Ratkaj, M.; Bedeniković, T. Cross-correlation modelling of surface water—groundwater interaction using the Excel spreadsheet application. Min. Geol. Pet. Eng. Bull. 2017, 32, 25–32. [Google Scholar] [CrossRef]
- Ružičić, S.; Rako, T.J. Multielement sorption of cadmium, zinc, copper and lead onto a Fluvisol profile at the Stara Loza site, Croatia. Int. J. Environ. Pollut. 2017, 62, 63. [Google Scholar] [CrossRef]
- Balaž, B.I. Geokemijske i mineraloške karakteristike tla s područja vodocrpilišta Petruševec (engl. Geochemical and mineralogical characteristics of soil from the Petruševec well field area). Master’s Thesis, University of Zagreb, Zagreb, Croatia, 16 November 2018. [Google Scholar]
- Ružičić, S.; Kovač, Z.; Borovčak, T. Possible Influence of Agriculture on an Unsaturated Zone in Croatia. Pol. J. Environ. Stud. 2019, 28, 6. [Google Scholar] [CrossRef]
- ISO 13536. Soil quality-Determination of pH; International Organisation for Standardisation: Geneva, Switzerland, 2005.
- Head, K.H. Manual of Soil Laboratory Testing, 2nd ed.; Pentech press: London, England, 1992; p. 416. [Google Scholar]
- ISO 13536. Soil quality-Determination of the potential cation exchange capacity and exchangeable cations using barium chloride solution buffered at pH = 8,1; International Organisation for Standardisation: Geneva, Switzerland, 1995. [Google Scholar]
- SchaSchaap, M.G.; Leij, F.J.; Van Genuchten, M.T. Rosetta: A computer program for estimating soil hydraulic parameters with hierarchical pedotransfer functions. J. Hydrol. 2001, 251, 163–176. [Google Scholar] [CrossRef]
- Fetter, C.W.; Boving, T.B.; Kreamer, D.K. Contaminant Hydrogeology, 2nd ed.; Prentice Hall: Upper Saddle River, NJ, USA, 1999. [Google Scholar]
- Daniel, R.; Smucker, A.J.; Santos, D. Alfalfa Root and Shoot Mulching Effects on Soil Hydraulic Properties and Aggregation. Soil Sci. Soc. Am. J. 2000, 64, 725. [Google Scholar] [CrossRef]
- Iqbal, J.; Thomasson, J.A.; Jenkins, J.N.; Owens, P.R.; Whisler, F.D. Spatial Variability Analysis of Soil Physical Properties of Alluvial Soils. Soil Sci. Soc. Am. J. 2005, 69, 1338. [Google Scholar] [CrossRef]
- Wegehenkel, M.; Luzi, K.; Sowa, D.; Barkusky, D.; Mirschel, W. Simulation of Long-Term Soil Hydrological Conditions at Three Agricultural Experimental Field Plots Compared with Measurements. Water 2019, 11, 989. [Google Scholar] [CrossRef]
- Seuntjens, P.; Mallants, D.; Toride, N.; Cornelis, C.; Geuzens, P. Grid lysimeter study of steady state chloride transport in two Spodosol types using TDR and wick samplers. J. Contam. Hydrol. 2001, 51, 13–39. [Google Scholar] [CrossRef]
- Coquet, Y.; Coutadeur, C.; Labat, C.; Vachier, P.; van Genuchten, M.T.; Roger-Estrade, J.; Šimůnek, J. Water and Solute Transport in a Cultivated Silt Loam Soil: 1. Field Observations. Vadose Zone J. 2005, 4, 587–601. [Google Scholar] [CrossRef]
- Ramos, T.; Šimunek, J.; Gonçalves, M.; Martins, J.; Prazeres, A.; Castanheira, N.L.; Pereira, L.S.; Ramos, T.; Gonçalves, M. Field evaluation of a multicomponent solute transport model in soils irrigated with saline waters. J. Hydrol. 2011, 407, 129–144. [Google Scholar] [CrossRef]
- Borek, Ł.; Bogdał, A. Soil water retention of the Odra river alluvial soils (Poland): estimating parameters by RETC model and laboratory measurements. Appl. Ecol. Environ. Res. 2018, 16, 4681–4699. [Google Scholar] [CrossRef]
- Kercheva, M.; Sokołowska, Z.; Hajnos, M.; Skic, K.; Shishkov, T. Physical parameters of Fluvisols on flooded and non-flooded terraces. Int. Agrophysics 2017, 31, 73–82. [Google Scholar] [CrossRef][Green Version]
- Da Gama, J.T.; Nunes, J.R.; Loures, L.; Piñeiro, A.L.; Vivas, P. Assessing Spatial and Temporal Variability for Some Edaphic Characteristics of Mediterranean Rainfed and Irrigated Soils. Agronomy 2019, 9, 132. [Google Scholar] [CrossRef]
- Grisso, R.D.; Allex, M.M.; Holshouser, D.L.; Thomason, W.E. Precision Farming Tools: Soil Electrical Conductivity; Virginia cooperative extension: Black Castle, VA, USA, 2009; p. 508. [Google Scholar]
- Csorba, S.; Üveges, J.; Makó, A. Relationship between soil properties and potentially toxic element content based on the dataset of the Soil Information and Monitoring System in Hungary. Central Eur. Geol. 2014, 57, 253–263. [Google Scholar] [CrossRef]
- Alloway, B.J. Heavy Metals in Soils: Trace Metals and Metalloids in Soils and their Bioavailability; Springer Science & Business Media: Berlin, Germany, 2013. [Google Scholar] [CrossRef]
- Shelukindo, H.B.; Semu, E.; Msanya, B.M.; Singh, B.R.; Munishi, P.K.T. Predictor variables for soil organic carbon contents in the Miombo woodlands ecosystem of Kitonga forest reserve, Tanzania. Int. J. Agric. Sci. 2014, 4, 221–231. [Google Scholar]
- Różański, S. Fractionation of selected heavy metals in agricultural soils. Ecol. Chem. Eng. 2013, 20, 117–125. [Google Scholar] [CrossRef]
- Chojnicki, J.; Kwasowski, W.; Piotrowski, M.; Oktaba, L.; Kondras, M. Trace elements in arable Cambisols and Luvisols developed from boulder loam and fluvioglacial sands of the Skierniewicka Upland (central Poland). Soil Sci. Annu. 2015, 66, 198–203. [Google Scholar] [CrossRef][Green Version]
- Liénard, A.; Colinet, G. Assessment of vertical contamination of Cd, Pb and Zn in soils around a former ore smelter in Wallonia, Belgium. Environ. Earth Sci. 2016, 75, 1–15. [Google Scholar] [CrossRef]
© 2019 by the authors. Licensee MDPI, Basel, Switzerland. This article is an open access article distributed under the terms and conditions of the Creative Commons Attribution (CC BY) license (http://creativecommons.org/licenses/by/4.0/).