1. Introduction
Regional integration processes, like the Eurasian Economic Integration, are significantly influencing national energy security, due to the growing interconnectivity of critical infrastructures such as electricity transmission lines. The Eurasian Economic Union (EAEU), which currently consists of Armenia, Belarus, Kazakhstan, Kyrgyzstan, and Russia, creates a basis for such integration. The EAEU is currently facing a process of integration of its energy markets due to the planned creation of a common electricity market by 2019. Member states are already preparing strategies and plans for the integration of their electricity markets. The common electricity market will be based on existing trading platforms, while the pricing mechanism, as well as various other important aspects such as common quality standards, still need to be established [
1], and existing barriers (described in detail in the “obstacles register” in the energy field [
2]) will need to be overcome.
Electricity transmission infrastructure is a critical challenge for the EAEU countries as current electricity transmission grids date from the time of the Soviet Union and are in need of maintenance and modernization [
3]. The liberalized trade of electricity within the EAEU, which is foreseen to result from the creation of a common electricity market, will change the load distribution on the elements of the grids and may, thus, lead to unexpected system stresses. These may, in turn, result in power outages and cascading effects of these outages on the entire electricity supply system of the Union.
The main goal of the EAEU’s planned common electricity market is to provide a reliable and affordable electricity supply to households, as well as to the private and public sector. Thus, energy security is essential for the economic prosperity of all EAEU member states. At minimum, the reliability of electric power systems and interconnections should be kept at an acceptable level, while efforts should be made to increase it where possible. In order to achieve this, it is necessary to ensure the timely planning of the energy power systems (EPSs) that have to be developed, while ensuring the reliability of the power supply. Apart from having an economic function in that it guarantees the satisfaction of current and future energy demands in the EAEU region, a reliable common electricity system also has a role to play in the larger context of the development of integration processes, both within the EAEU and between the EAEU and its neighboring countries.
However, furthering integration processes on the electricity markets of EAEU countries and the interconnectivity of electricity supply system brings not only benefits, but also risks. Such risks include cascading power outages that originate in one part of the grid and then spread to its other parts and, potentially also, to the territories of other countries. A major challenge in the context of energy security in the EAEU is to guarantee a reliable, continuous, and sufficient energy supply considering all relevant existing risks in any part of the interconnected electricity transmission system and their systemic effect on the entire system.
The question around the reliability of electricity supply in the wake of natural hazards gained the attention of the EAEU states in the framework of energy strategies with plans specified up to 2030 [
4,
5,
6] and, also, at the level of the EAEU Board [
7]. Even though such interruptions are not frequent, each power outage or blackout affects several millions of people [
8,
9] and causes vast economic losses and damages [
10].
Integrated risk assessment and risk governance are essential to ensure the reliability of a system as complex as the electricity transmission system within the EAEU. The risk assessment should also address the issue of an optimal balance between the generation, transmission, and distribution of electricity in each node, and should be based on plausible scenarios of future electricity demand and electricity generation. Such a risk and reliability assessment should be carried out periodically, taking into account newly introduced equipment, EPS elements, and various external factors affecting the operation of the system [
4,
5,
6,
7]. Thus, the concepts of the EAEU countries provide a direction for the development of the common energy system of this Union that takes the required high reliability of EPSs into account [
11].
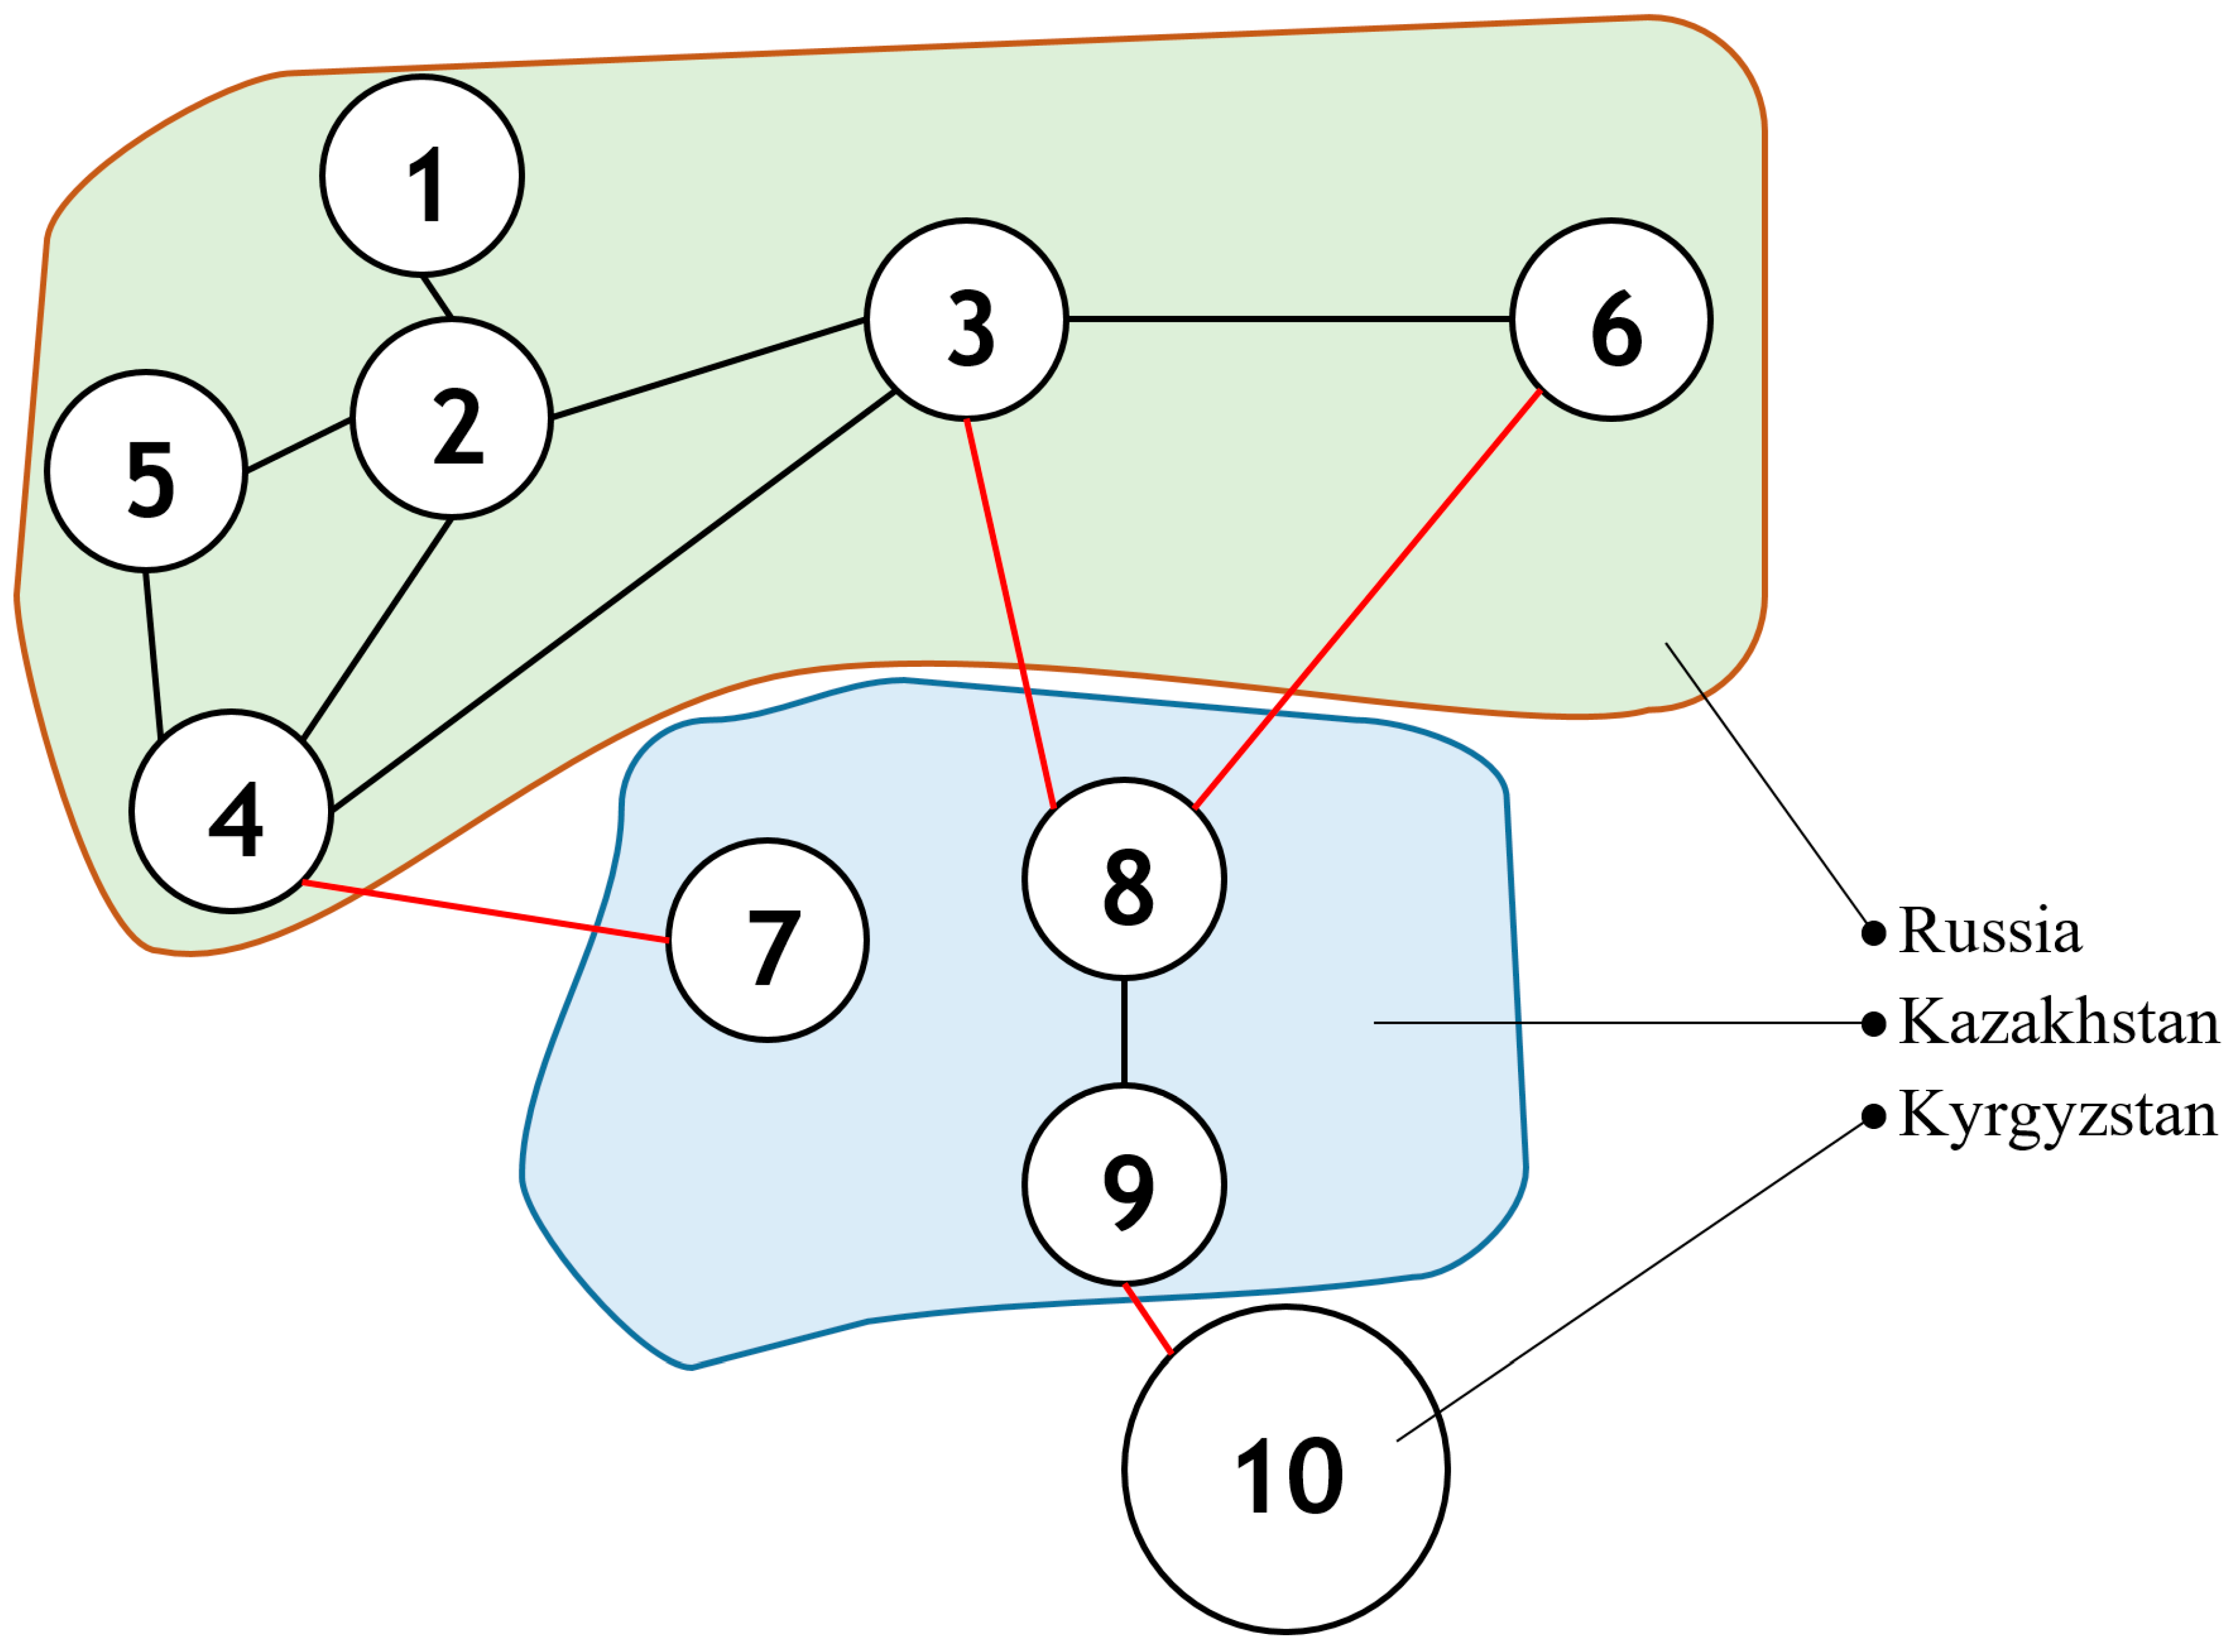
In this paper, we focus on three out of the five EAEU countries: Russia, Kazakhstan, and Kyrgyzstan, and on earthquakes as one of the major natural hazards that can cause shortages of electricity supply in these three countries. Armenia and Belarus were excluded, as Armenia is not physically linked to the three countries that were included, and Belarus is located in the western part of the Eastern European platform [
12], where the probability of earthquakes strong enough to cause a disconnection of elements of the electricity infrastructure is very small [
13].
Several kinds of natural hazards, including earthquakes, landslides, cyclones, heat waves, and manmade risks such as cyber threats, are able to affect the physical reliability of the electricity grids infrastructure, as well as to influence its transmission capacity in these three countries. We focus on earthquakes as the most frequent risk in the Central Asian region [
14].
Other authors, for example [
11], have assessed the impacts of earthquakes on the electricity transmission infrastructure for each EAEU member country separately. Yet, to the best of our knowledge, an integrated assessment taking into account interconnections between the electricity transmission systems of the three countries is not available. This paper addresses this gap in the literature.
In this work, we use a modification of the simplified reliability assessment approach, based on the so-called “
N −
i criterion” [
15]. The “
N −
i criterion” is the rule according to which the elements remaining in operation within a Transmission System Operator’s control area after the occurrence of a contingency are capable of accommodating the new operational situation without violating operational security limits. The proposed methodology includes three stages. At the first stage, we generate system states resulting from switching off one, two, or three system elements (lines and/or nodes), imitating their collapse due to an earthquake. We sort through all possible combinations of the disabled system elements. At the second stage, we optimize the allocation of flows across lines such that the total power shortages are minimized. At the third and last stage, we assess the significance of each line depending on its reliability and the probability of failure from the effects of the earthquake. The main modification we make here, compared to [
14], is that, at the first stage, we use the probabilities of strong earthquakes that are capable of destroying lines, instead of the probabilities of line failures. Using this approach, we investigate the impacts of earthquakes on the electricity transmission system, taking into consideration the existing interconnections within the EAEU region and the ongoing integration processes.
2. Background
2.1. The Eurasian Economic Union and the Common Electricity Market
The EAEU was established in January 2015 and currently includes Russia, Belarus, Kazakhstan, Armenia, and Kyrgyzstan. The goal of the EAEU is to strengthen political, social, economic and environmental cooperation among its member states. This cooperation also includes the creation of common energy markets [
1,
16]. The electricity market is an essential part of the common energy market relying on existing electricity interconnections within EAEU countries and between them. Its drivers and barriers, as well as the roadmap and strategy up to the year 2025, are analyzed in [
17]. The creation of common energy and electricity markets within the EAEU region has the potential for generating new opportunities for cooperation and larger spheres of integration [
18].
The Russian EPS is one of the largest energy systems in the world. It includes many complex processes, such as production, transmission, distribution of electricity, and centralized operational and technological management. The system covers a territory of about 7000 km from west to east, and 3000 km from north to south. This system consists of seven United Power Systems (UPSs), six of which—UPS Center, UPS South, UPS North-West, UPS Middle Volga, UPS Ural, and UPS of Siberia—operate in a synchronous (parallel) mode, while the seventh, UPS East, operates in isolation from the other Russian UPSs [
19]. The Russian EPS includes over 700 power stations whose capacity is greater than 5 MW, and many more smaller ones. As of 1 January 2017, the total installed capacity amounts to 236,343.63 MW, with each UPS operating with a surplus of electricity generation. The system is huge, and various procedures and types of protective equipment have been put in place to ensure a safe and stable operation. Automatic devices that disconnect broken and unstable parts of the system from the rest of the network prevent local collapses in the system from spreading further.
Kazakhstan’s EPS is also complex and peculiar in terms of topology and energy balance. It is divided into three large energy regions, each of which consists of a number of regional formations. These are the UPS West, UPS North, and UPS South. UPS West is located in the western part of the country and occupies a relatively small area. It is isolated from the rest of the energy regions of Kazakhstan. UPS West usually has an electricity deficit and exports electricity from Russia through its interconnections with this country. UPS North and UPS South are more advanced. They have several connections among themselves and, also, interconnections with Russia and Kyrgyzstan. UPS North has various connections with different UPSs of Russia, which works for both export and import. A special broadband line between UPS West and UPS North is currently under construction. In Kazakhstan, electric power generation is carried out by 118 power plants using various forms of production. As of 1 January 2017, the total installed capacity of Kazakhstan’s power plants is 22,055.5 MW, and the available capacity is 18,789.1 MW [
20].
The EPS of Kyrgyzstan is mainly based on a multitude of hydro power plants (HPP) and the plan for the development of the country’s electric power industry includes the construction of many additional hydroelectric power stations with varying generation ability. At the same time, the system is a single whole without any division. The current electricity demand and generation in the country are in a balanced equilibrium. The total amount of generation is 3797.90 MW. The EPS of Kyrgyzstan has a small number of interconnections with Kazakhstan.
Based on various sources of public data, including reports from the national Ministries of Energy, national energy companies, magazines, and other reference materials, we collected a dataset containing information on seismic zone maps. These included probabilities of earthquakes, the EPS schemes of each country, and information on each power plant, as well as data on resistance parameters for the seismic evaluation of each type of EPS element used in the calibration of our model.
Figure 1 schematically depicts the national EPSs and UPSs described above. In total, the system under consideration in this paper contains 10 nodes (UPSs) with 12 connections between them. We did not include Russia’s UPS East here because it has no connection with the other considered UPSs.
2.2. The Need to Address the Risks of Power Outages and Blackouts
During the last decade, the number of power outages—in other words short- or long-term states of electric power loss, in a given area or section of a power grid, caused by equipment failure resulting from a failure of the power supply—was getting more frequent. The number of large-scale blackouts, that is to say, when electric power is cut off for a general region especially due to shortages, mechanical failure, or overuse by consumers, also increased significantly. However, even small outages can have disastrous effects on unprepared businesses and the common market. Today, the task of protecting electricity transmission systems has become a greater challenge than ever before, as several blackouts have occurred over the last five years. These were caused by different factors, one of which is the growing interconnectivity of electricity transmission systems. Previous blackouts in Europe had severe consequences. There are three historical cases of blackouts in Europe, namely, the 2003 blackout that affected Italy and Switzerland, the blackout in Sweden and Denmark that happened during the same year, and the 2006 blackout in Germany. The 2003 blackout, that started in Switzerland and then also affected Italy, left 56 million people without electricity. The second blackout of 2003 affected 1.6 million people in Sweden and 2.4 million people in Denmark. It also resulted in 4700 MW of load being lost in Sweden and 1850 MW in Denmark. The blackout of 2006 in Germany lasted for up to two hours. This was a major blackout which affected more than 15 million people. The blackout had cascading effects on people in Poland, Benelux countries, France, Portugal, Spain, Greece, the Balkans, and even Morocco [
21,
22].
The EAEU region is experiencing both of the above—small local electricity failures and huge blackouts. Recent examples include the unexpected power outage in Siberia [
10] and the far east of Russia, and periodic power outages in the Almaty region of Kazakhstan. UPS East also experienced a blackout on the evening of August 2017. The press service of the Russian Ministry of Energy commented that the collapse was due to a short circuit in one of the transmission lines with a voltage of 220 KV. This caused disruptions in the United Energy System of the East (UES East) and, because of this blackout, there was a mass shutdown of consumers in the Amur Region, the Khabarovsk Territory, and Primorye [
9]. One of the most influential incidents occurred on 15 April 2009, when, due to an accident in the Central Asian energy system, the consumers of Almaty and the Almaty region were disconnected from electricity. The reason was the emergency shutdown of the high-voltage lines 500 kV Toktogul-Lachin and Toktogul-Frunze in Kyrgyzstan, which led to the shutdown of the Toktogul HPP line (Kyrgyzstan) and the transmission of capacity for the transit of 500kV to the North–South Kazakhstan line [
8].
Power outages and blackouts have a huge impact on billions of customers. They can also cause problems in the economy, disturb the functioning of markets, and slow down economic development and growth. All of these factors can lead to an increase in social pressures in a society. The reliability of the electricity supply system is also affected by multiple risks or multi-risks, including cascading and systemic risks. These include many different natural hazards, such as earthquakes, floods, heat waves, and storms that can destroy infrastructure and power generation stations, or cut off power lines. All of these hazards are among the main causes of power outages. Although risk assessment for single risks exist, problems often lie in the area of risk governance, as risk mitigation strategies are frequently implemented to address individual risks, rather than their cascading or systemic effects.
The interconnected electricity system of the EAEU region requires special attention in light of its vulnerability in terms of the huge territory it covers and the several thousand kilometers of electricity transmission lines that run across the region. The probability of earthquakes occurring is high in Kazakhstan and Kyrgyzstan when one takes into consideration that these countries are located in the Mediterranean–Trans-Asian seismic belt. The vulnerability of electricity transmission lines in these countries is increased due to the state of the electricity infrastructure, most of which is overloaded and needs renovation, as well as the huge deserted areas where infrastructure is deployed. According to the Central Asia Earthquake Risk Reduction Forum (2015), the Central Asian region is one of the regions in the world that is most vulnerable to many natural hazards, among which, earthquakes are the most catastrophic.
The global seismic hazard map [
23] shows that the Central Asian region is in a zone with high seismic activity where earthquakes are frequent, and there is a probability for high intensity earthquakes, which are really damaging to electricity transmission infrastructure.
Even though the probability of earthquake risks in Russia is significantly lower, the electricity transmission infrastructure in the country might also be impacted due to interconnectivity with the electricity transmission grids in Central Asian countries. In addition, considering the large territory of Russia, the regions of Siberia, the Caucasus and the Southern Federal District are under the influence of this seismic belt and, accordingly, have a high probability of earthquakes occurring.
Thus, the EAEU is a large union of countries, each of which is vulnerable to one or another type of natural hazard risk. As the first steps towards a common electricity market have already been taken through the preparation of common rules and management mechanisms, in order to maintain the reliability of supply within this system, it is, however, necessary to assess the impacts of natural hazard risks.
3. Methodology
Our methodology included three steps, each including several stages. The first step was the process of collecting data. During the second, the focus was on the mathematical model, scenarios, and simulations. The third step involved the analysis of the simulation results.
3.1. Data
The data collection included five stages. First, we collected seismic zone maps for each of the three countries: the Russian Federation, the Republic of Kazakhstan, and the Kyrgyz Republic. Maps were taken from public sources [
24,
25,
26].
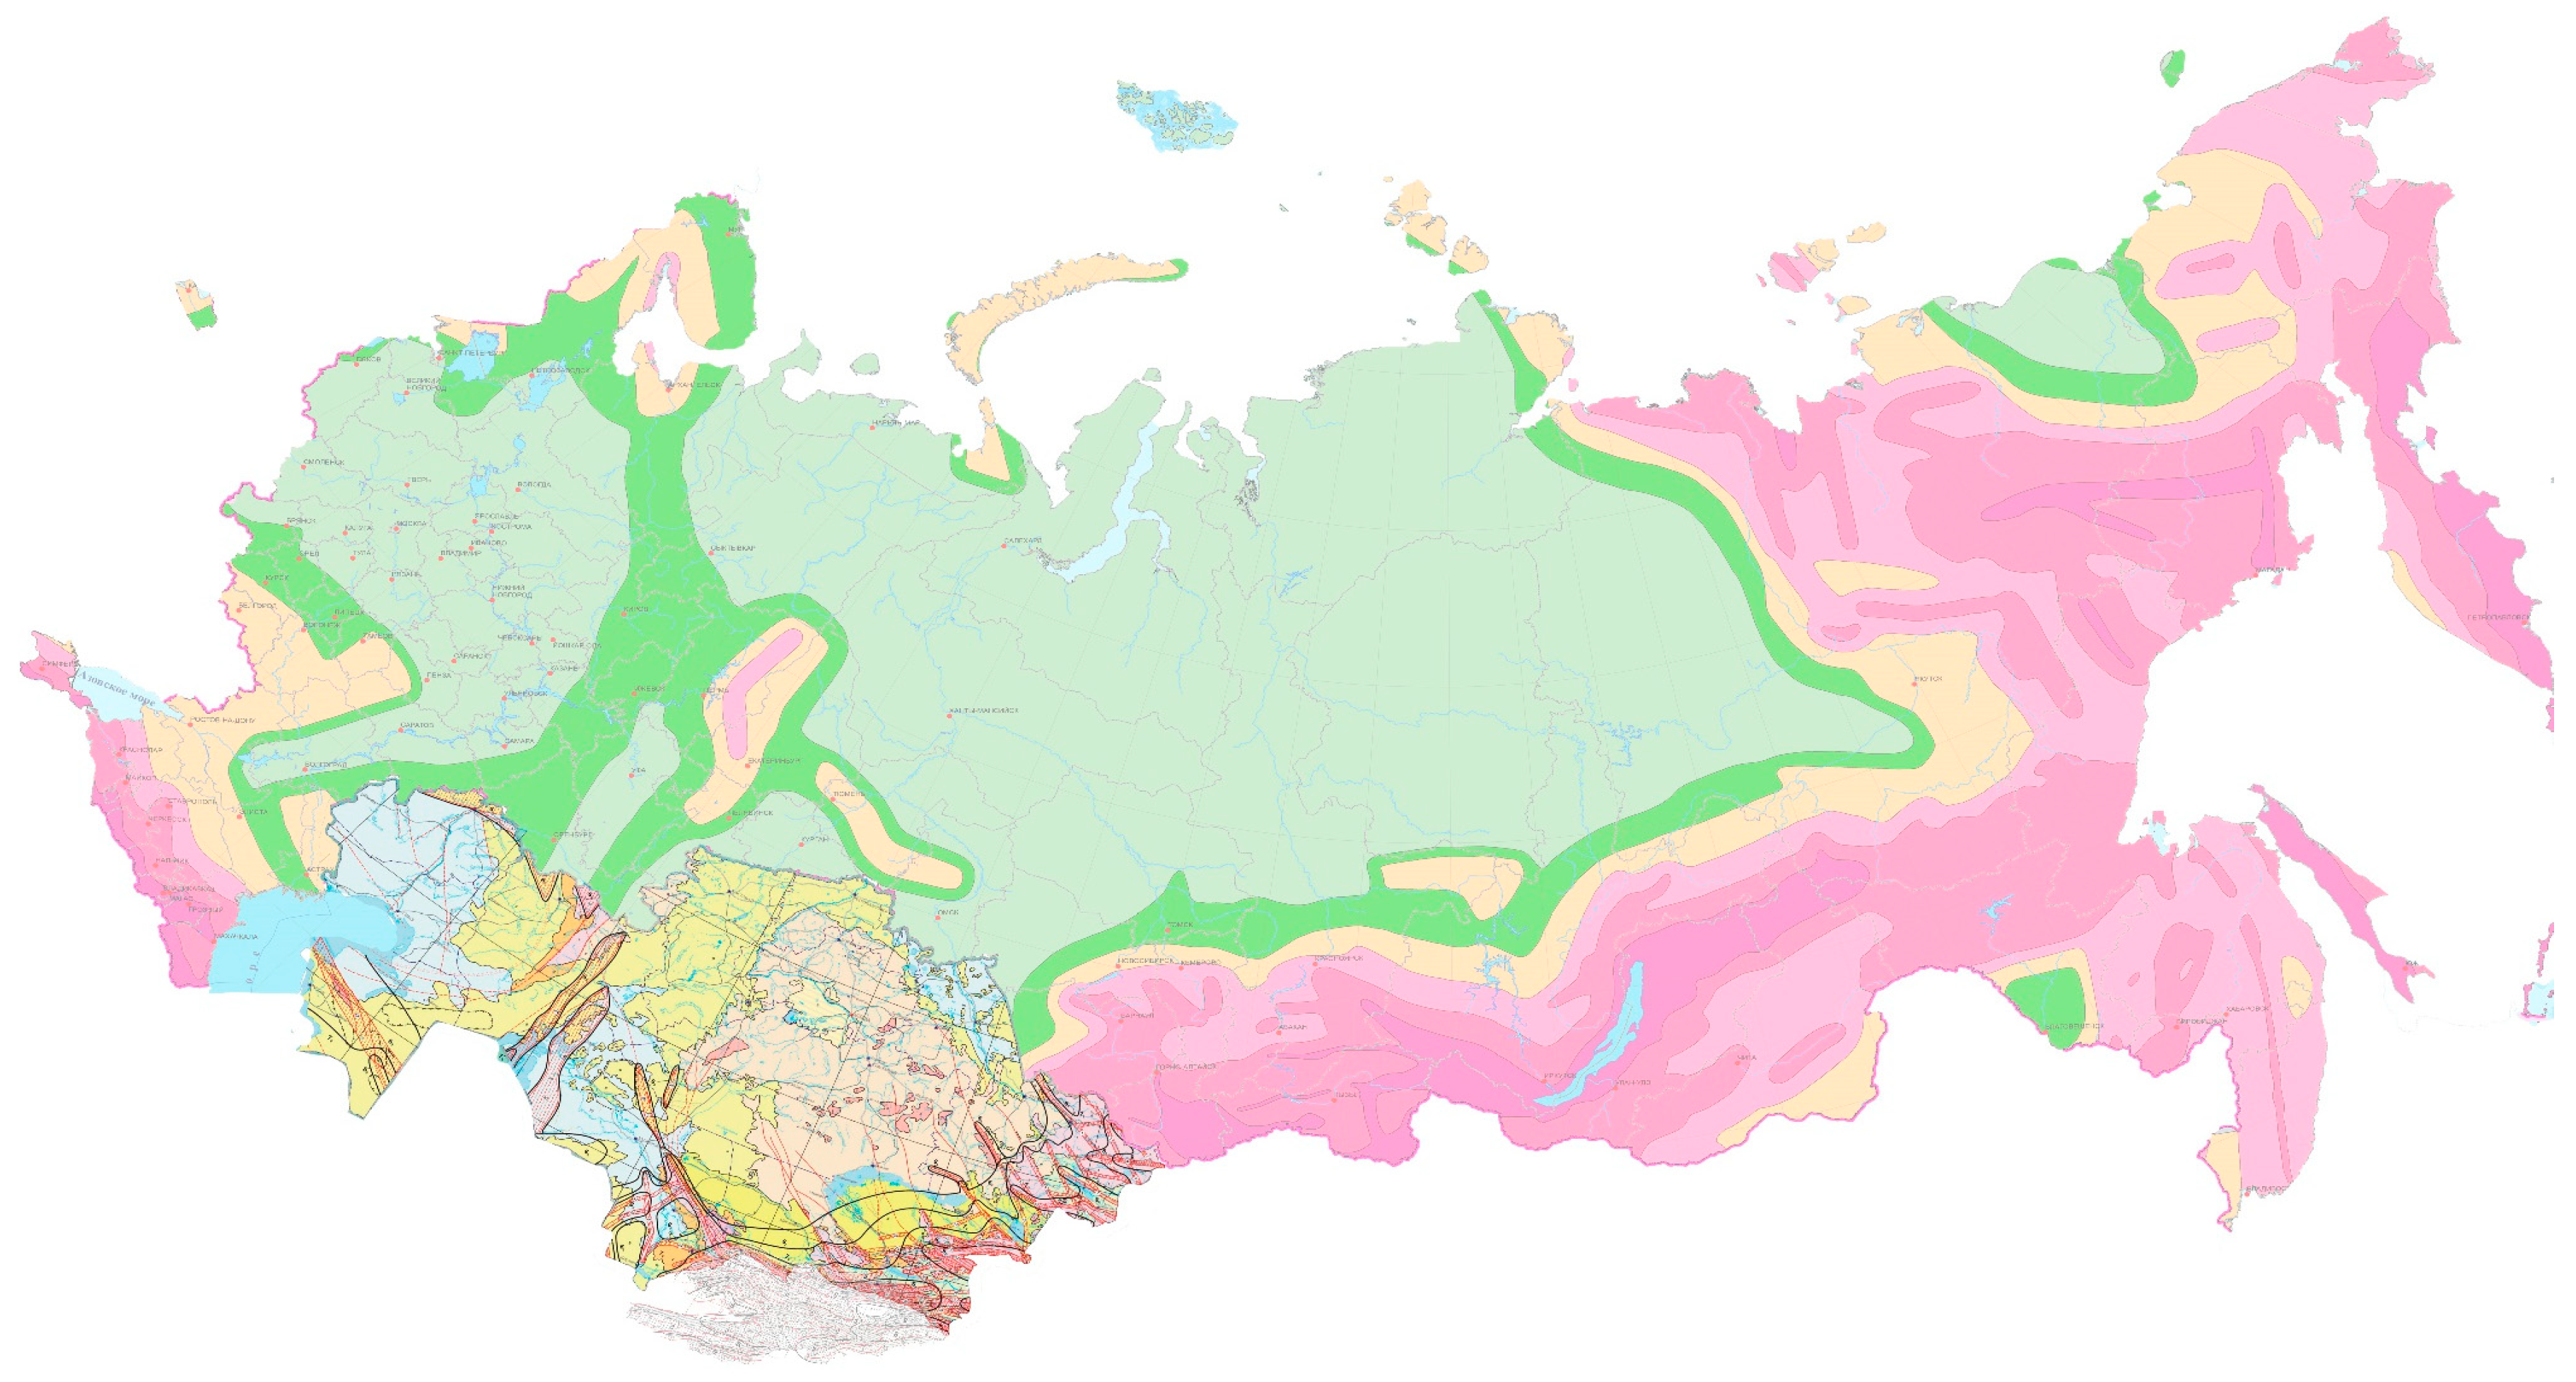
As represented in
Figure 2, we used three different types of maps. Different seismic zone maps were developed for each country included in this study. The maps were developed using various methodologies but contained comparable datasets. The Russian Federation map consists of four maps. Each of these contains zones delineated by various colors that indicate the intensity of the earthquake and the probability of system failure. The Kazakhstan map comprises polylines and signs of earthquake intensity scores and probabilities. The seismic zone map of Kyrgyzstan also contains polylines and signs of the frequency of earthquakes with various intensity scores. These scores were developed using data from the Institute of Seismology NAS of Kyrgyzstan on the probability of an earthquake with its frequency of occurrence in years.
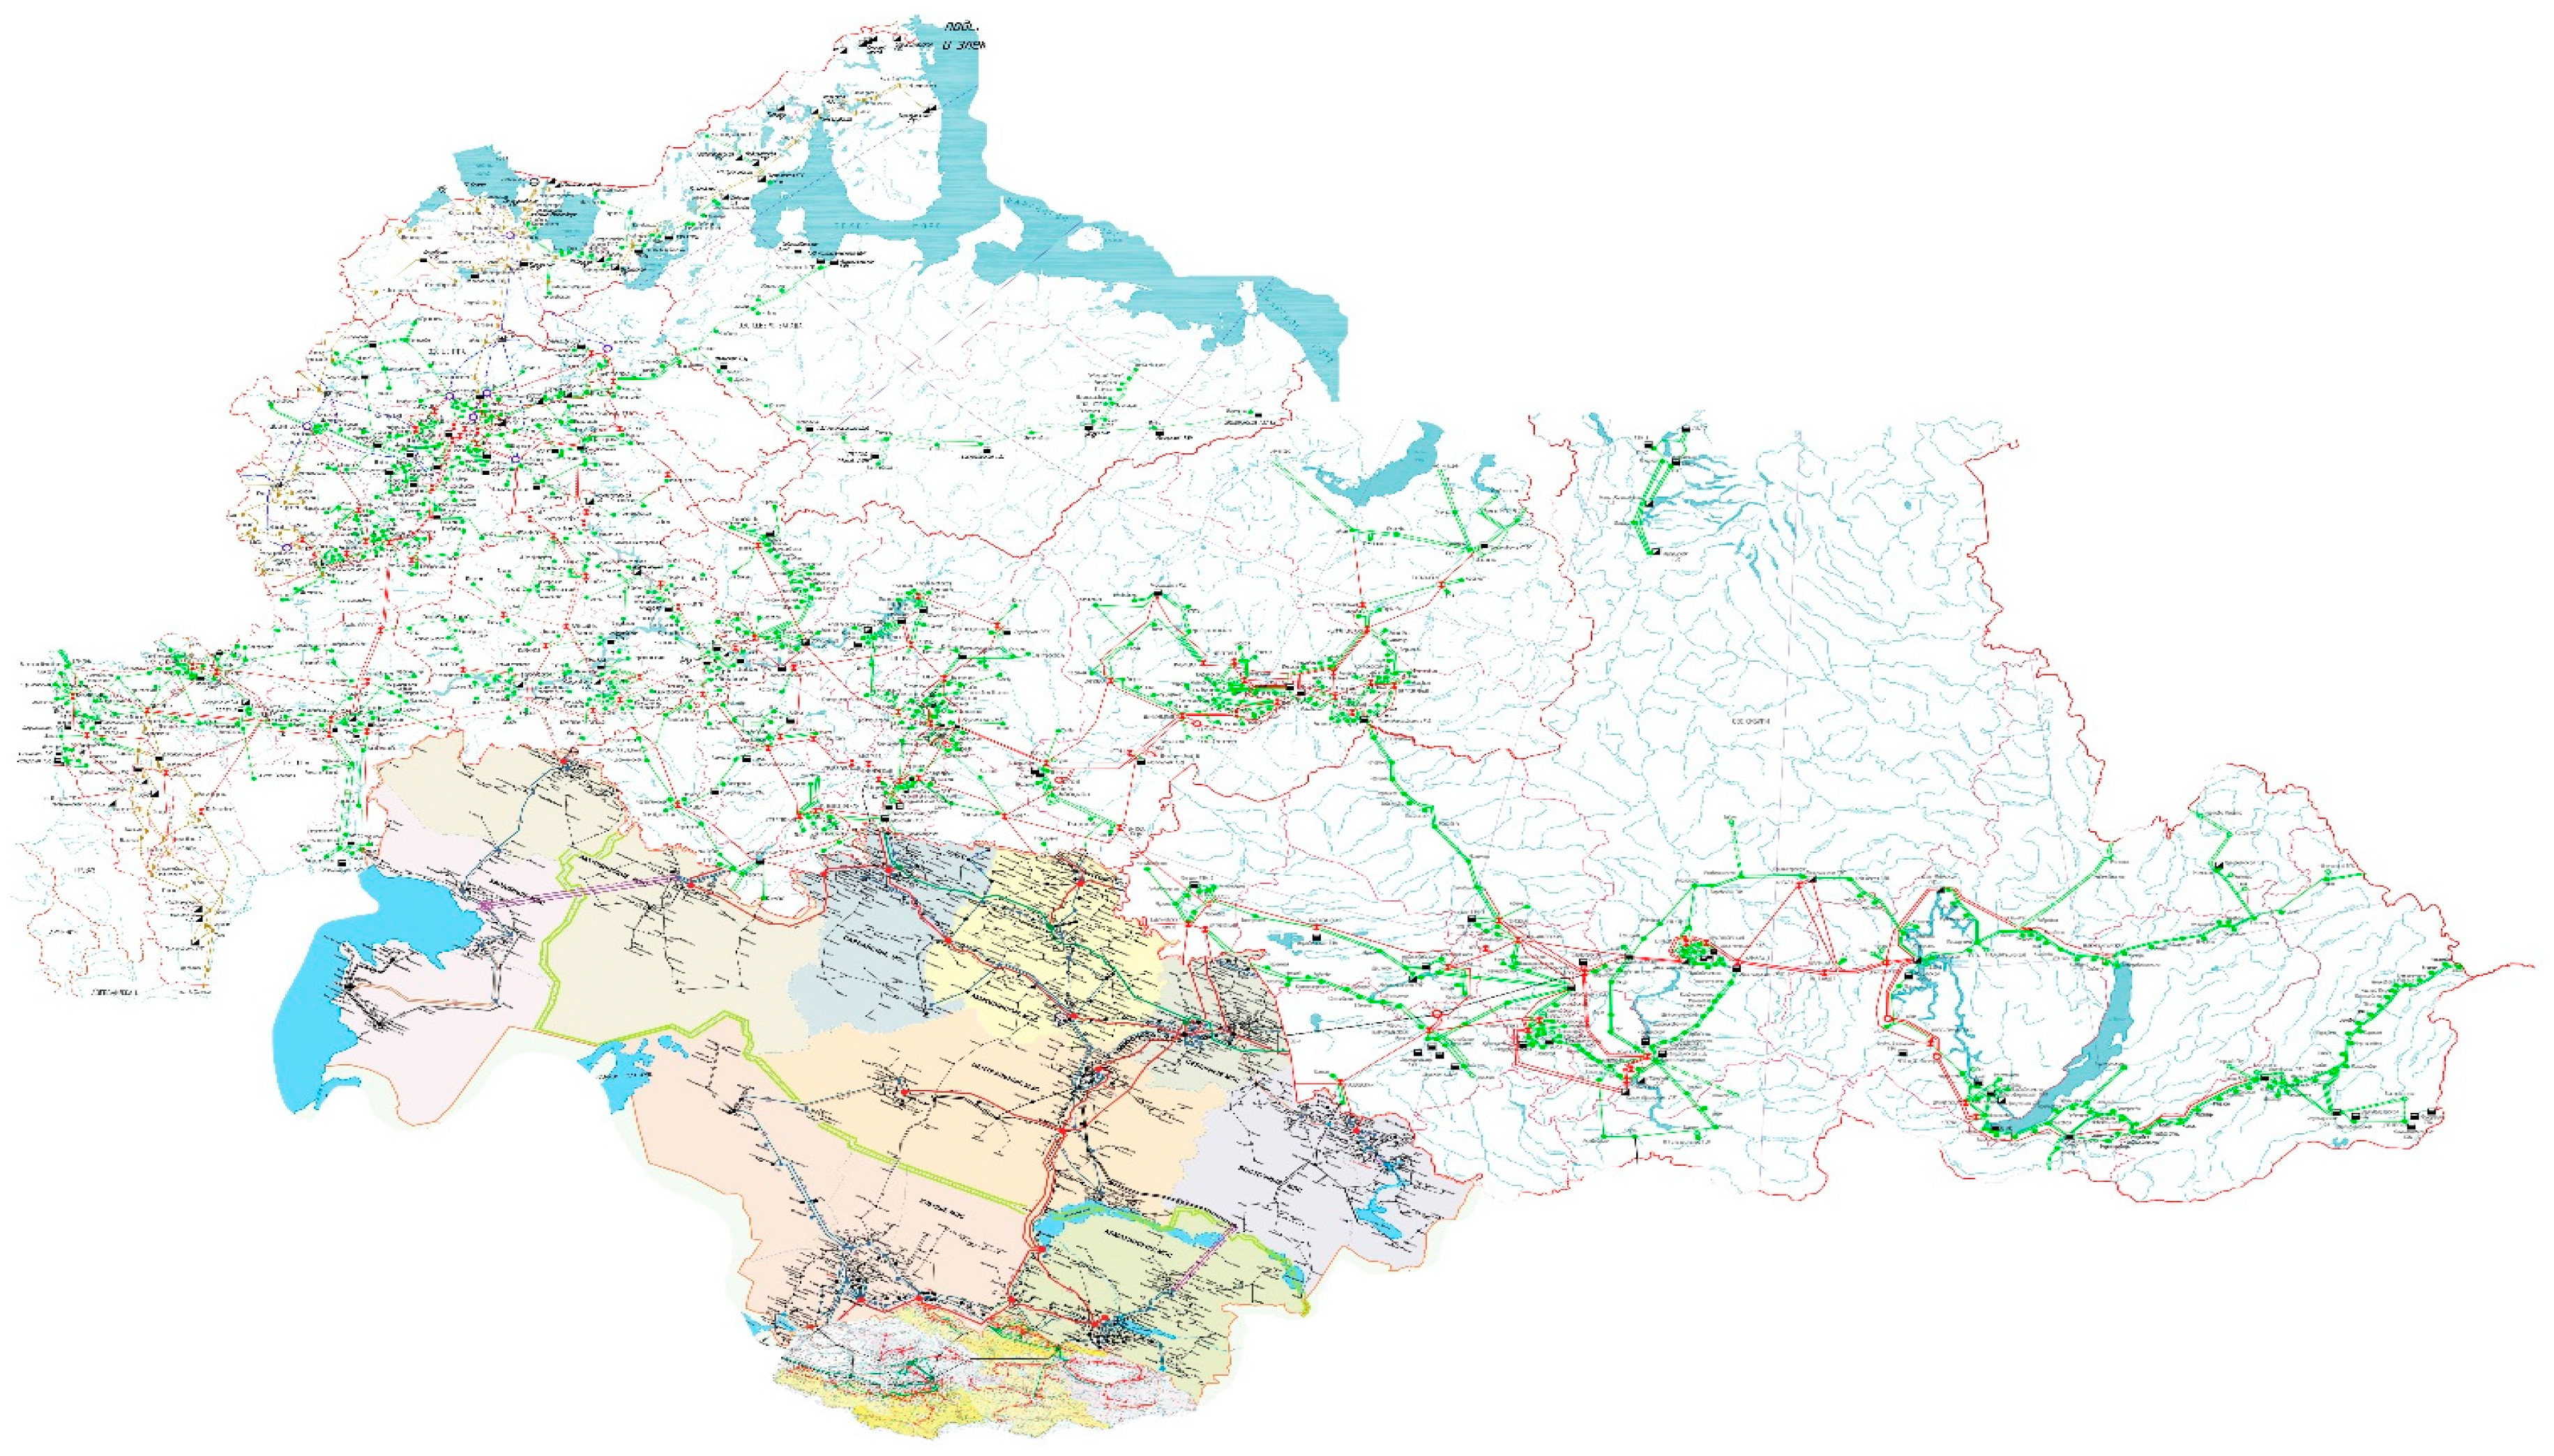
Second, we assembled EPS schemes of these countries, which we also received from public sources, such as seismological institutes or other geophysical sources [
27,
28,
29].
Figure 3 depicts a combined map with public information of EPS in this region. We used a standard method from classical methodology and created a simplified scheme (
Figure 1).
Thirdly, we collected information for each power plant in the three abovementioned countries, as well as for each interconnection between them [
30,
31]. In order to have accurate information about each station in these systems, we conducted an in-depth data search. As a result, we compiled a catalog of stations and interconnections. During the fourth stage, we collected data on resistance parameters for the seismic evaluation of each type of EPS element. Then, we combined all the data, overlapping the maps of the EPS schemes and the seismic zones.
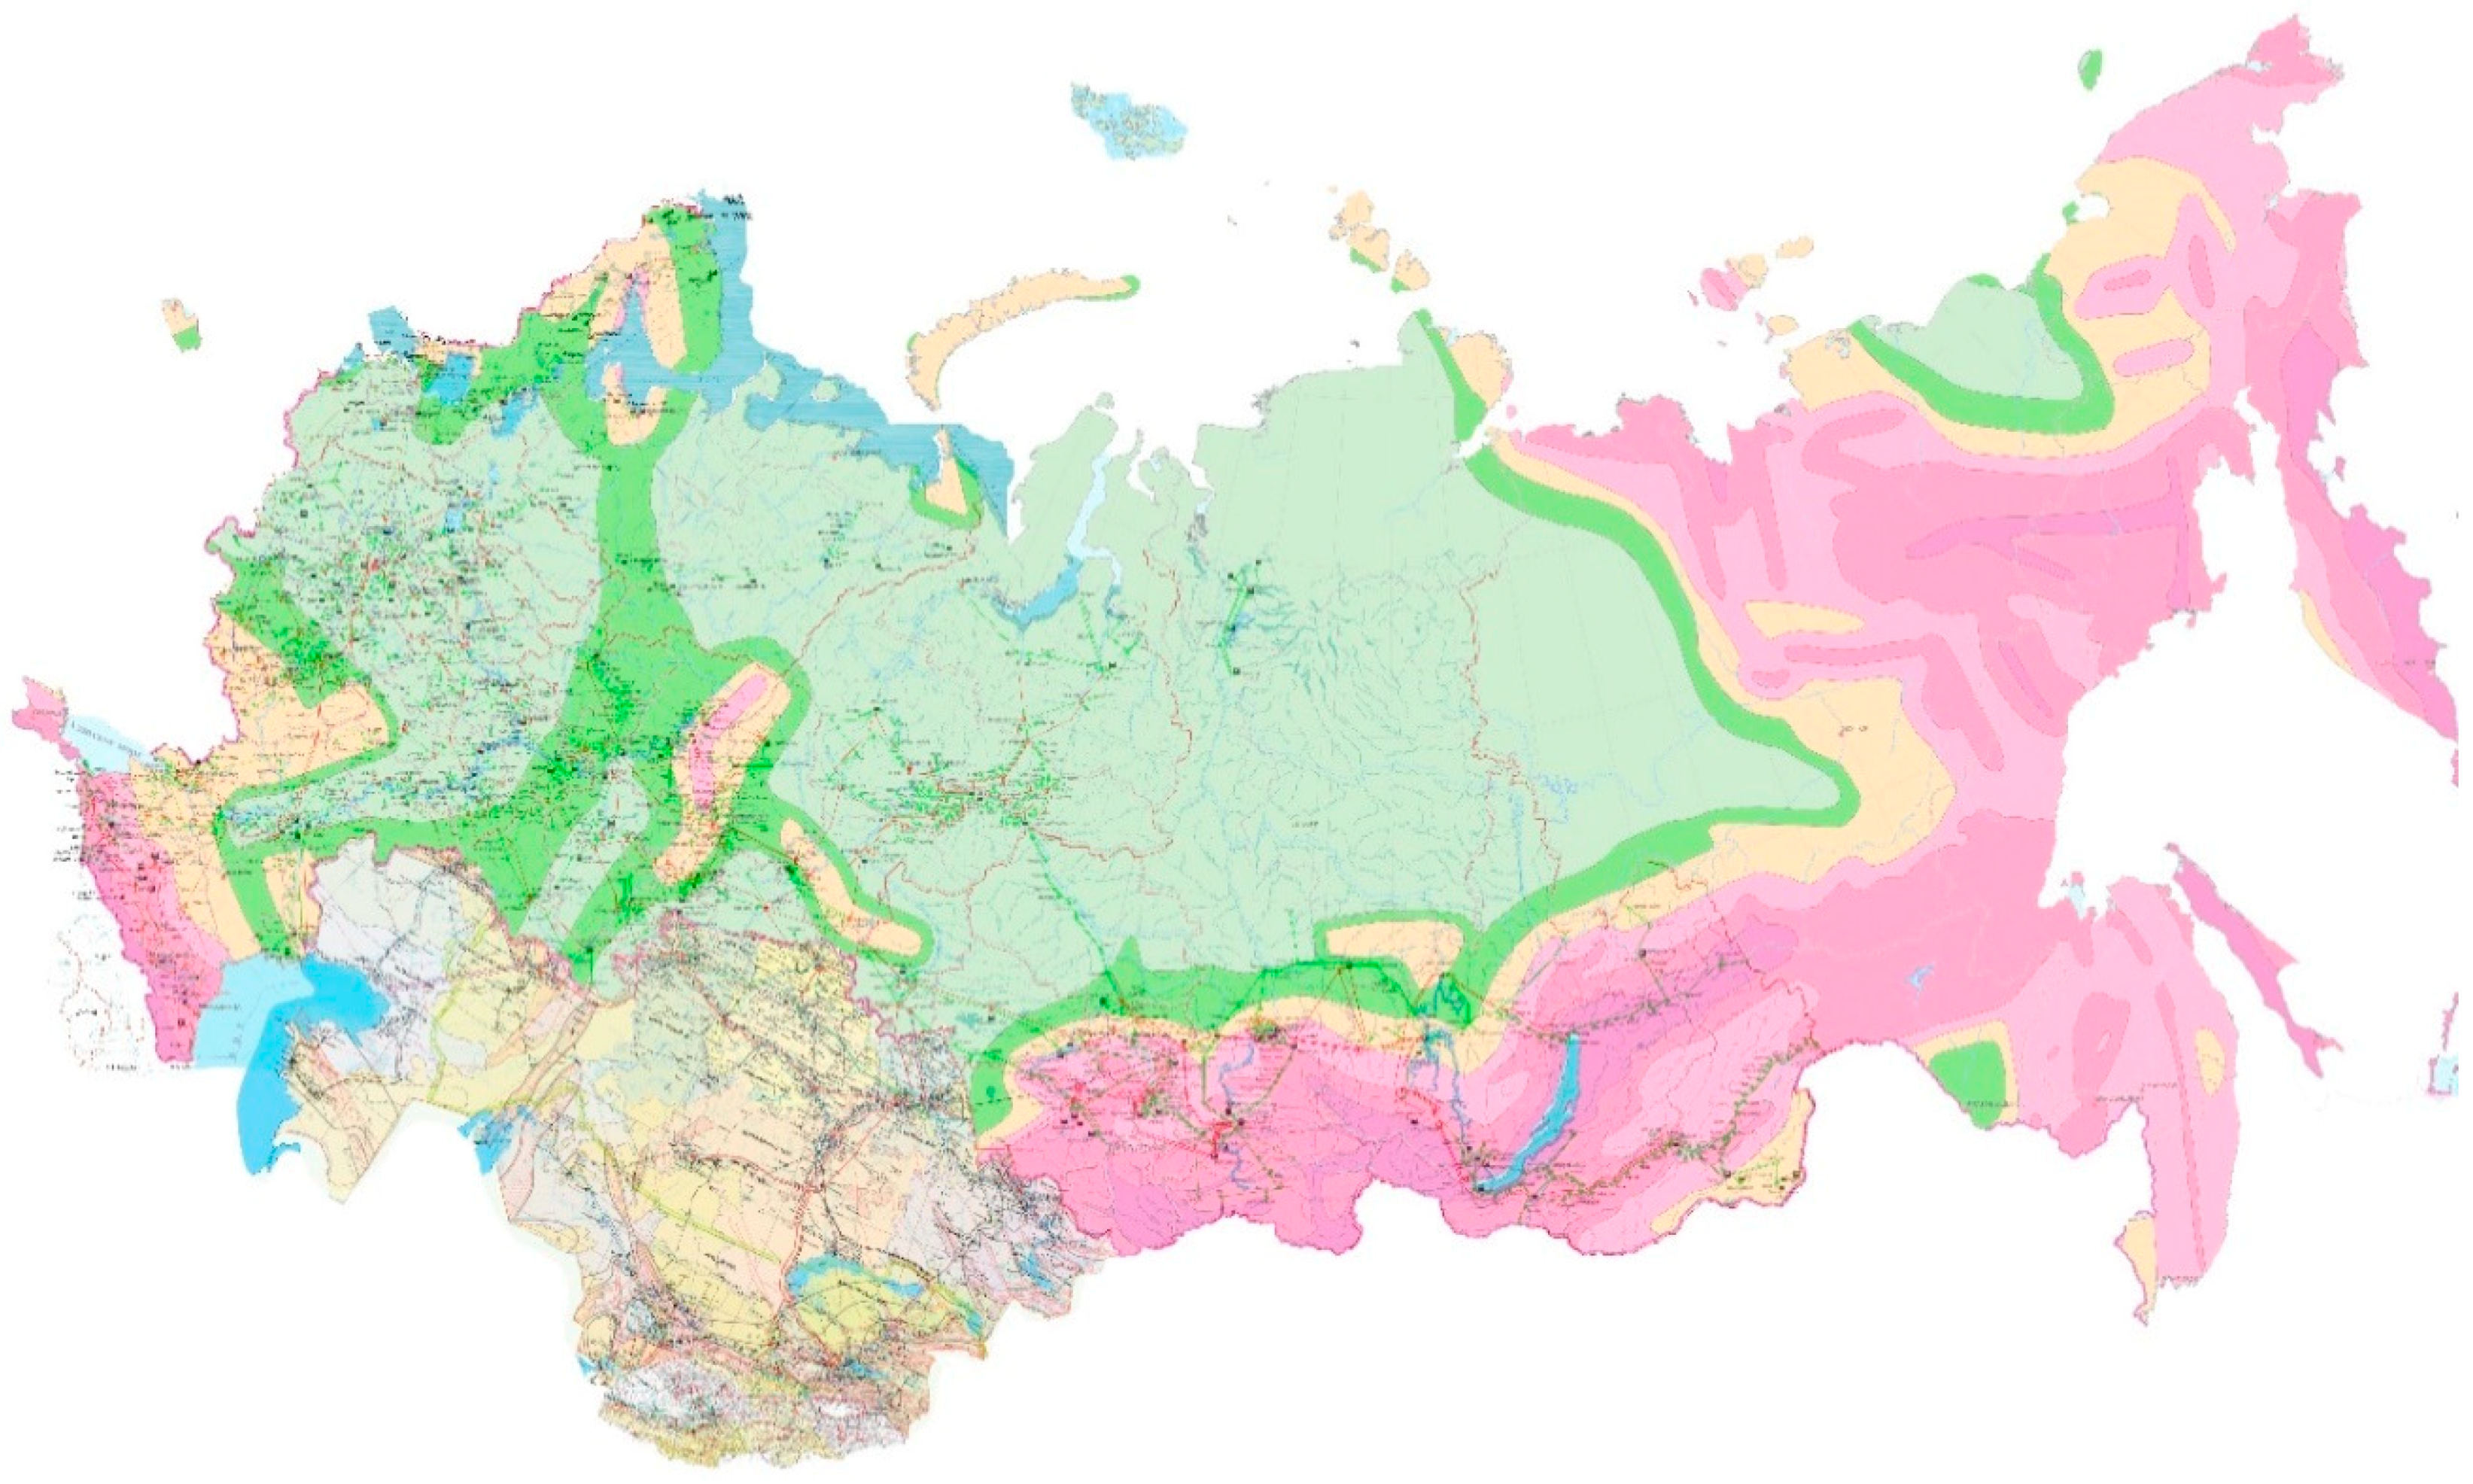
Finally, we compared the resistance parameters of each EPS element on the schemes and the seismic score of areas on the seismic zone maps where it dislocates, and identified the probability of an earthquake occurring for each EPS element in our study area (
Figure 4). Thus, each station and line were given a probability of failure in accordance with the probability of an earthquake occurring that is severe enough to destroy or damage elements of the system.
3.2. Methods
The methodology of this research is based on the classical theory of reliability. The standard methodology includes several stages. First, the scheme of the system is created. Then, the probability of failure is determined for each EPS element. This probability of failure for each EPS element,
, is determined using statistical data and is based on real events.
For lines, the probability is calculated according to Formula (1), where
is the total number of earthquakes for the period investigated (count events),
is the repair time for an EPS element (hours),
is the time when the events under investigation occurred, and
is the number of EPS elements. Next, a model with a set of nodes and lines is created, where the node contains data on demand and generation, and the line denotes its capacity. Following this, various situations are simulated, and the power deficits in the system are calculated. Ultimately, according to the received data, we determine the reliability of certain objects in the system [
32,
33]. We modified the methodology that was used to assess the reliability of the interconnected electricity systems of the three countries. We also included the methodology for assessing the reliability of power systems developed at the Melentiev Energy Systems Institute of the Siberian Branch of the Russian Academy of Sciences, to obtain distributions with mathematical expectations of the risk value for working and non-working lines. Below is a description of this method.
As already noted, there are several methodologies of reliability assessment. We use the main methodology of the classical theory of reliability to calculate the probability of EPS element failure. It is important that input data contain a set of different events that influence EPS elements. The set contains only events that cause damage that can provoke the disabling of an element and/or part of the system. According to the classical theory, the probability of EPS element failure can be calculated using Formula (1).
However, in the proposed methodology, we used the probability of an earthquake occurring as the probability of failure for an element located in the affected area, when the intensity of the earthquake exceeded the threshold of the inherent stability of the EPS elements. This approach is very effective because, already at this stage, it allows us to analytically determine which of the system elements can be corrupted and the associated probability.
During the next step, where the simulation of the system operation took place, we used the basic approaches of the classical reliability theory and simulated a large set of scenarios. To do this, we specifically created a distribution flow model based on the EPS scheme. Next, we applied a deterministic approach and used the method of scenario formation according to the “N − i criterion”, where i is the number of system elements that were switched off at once, and that did not have a zero probability of failure. In the third step, each scenario was optimized by minimizing the power shortage. This simulation gave us information about deficits in the system.
During this step, we worked with all the information obtained in the first and the second steps. We applied the collected information to create two distributions for each line (interconnection) between the EPSs of investigated countries. The first distribution considered the sum of multiple deficits and probabilities when the line worked, and the second distribution considered the sum of multiple deficits and probabilities when the line did not work. We calculated the risk value of losses within a set containing a working line in focus:
and the risk value of losses in a complementary set:
where
is the deficit in node
,
is the full probability of a node
to collapse due to an earthquake,
is the set of nodes an investigated line forms part of, and
is the set of nodes that the line being investigated is not a part of. The last step is aimed at defining the value of importance of each line (interconnection).
3.3. Simulations
In this part of the research work, we reviewed the model [
34] for the estimation of power shortages in electric power systems with quadratic (in the value of power transmitted) power losses in transmission lines. The current model is rather common, and realistically represents the flow distribution. The problem under investigation is one of minimization of power shortages with quadratic power losses. A problem description is necessary in order to determine the optimal distribution flow in full EPS considering the defined values for each node of working generation and required consumer demand, as well as the capacity and coefficient of power losses for each line.
The mathematical formulation employs the minimization of the sum of power deficits:
We must also consider the balance constrains with quadratic power loses in nodes:
It is very important to note that flow can only be in one direction. We added flow direction constrains to account for this:
The constrains are as follows:
where
is the power generation in node
,
is the current maximal generation for node
,
is the power demand that must be covered for node
, and
is the current maximal demand for node
.
is the value of the flow from node
to node
,
is the value of the flow, but for the opposite direction,
is the capacity of the flow between node
and
, and
is the capacity of the flow for the opposite direction. By running the model, we get incoming flow with power loses where
is specified as positive coefficients of unit power losses during the transmission from node
to node
,
,
,
.
An important step in this work was creating various states of the system. We defined a large set of states by “
“ criteria, where
. The
criterion is a minimum system security measure that the system operator should use to model the transmission network to address redundancy while avoiding potential power interruptions and/or system failures. The
criterion set means that there are various nonrepeating states with a single EPS element that is not working (failed, switched off, broke, etc.). [
34] The other criteria have the same meaning, but the set contains two and three not-working elements in one set. For example, we generated a start set with numbers of each EPS element, and created three sets by applying these criteria (other sets contain a number of not-working elements).
We solved our optimization problem (3–8) by applying the steepest descent algorithm [
35]. In addition, the problem was transformed from one with constraints to an unconstrained nonlinear programming problem. This became possible with the use of the penalty method, which let us use simple optimization methods, such as gradient and steepest descent, for solving some complex problems. The main changes were in the objective function, where we added all constraints in the penalty form. This implies that small changes or divergences will be influential in the fully optimized function because of quadratic penalties. The main objective function is to get the minimal power shortage, using optimized and starting values of loading. We can calculate the deficit in each node
. After the simulations, we got a set of deficits for each node in each stage, and used them to calculate the risk value of losses (2a, 2b).
3.4. Probabilities
We used the following calculation algorithm to generate a forecast for the emergency of the power system elements for 2018:
We used the formula for the exponential change in the probability of a failure-free operation of an element of the system:
where
is the probability of failure,
is the intensity of equipment failures, and
is the period of accumulation of the probability of failure;
Since data on the breakdown of each line in the next 50 years had already been found, we used the probability of failure for the lines;
We substituted the available values in Formula (9) and calculated the intensity of equipment failures:
If the intensity of failures and the last strong earthquake in the surrounding areas were defined, we calculated the probability of equipment failure, for example, the power line being interconnected.
4. Results
Our research allowed us to develop two sets of results. The first are analytical results obtained during the search for and processing of input data. These results concern the probability of failure in each line. The second set of results were obtained during the modeling and simulation of the operation of systems in different states. These results are about the importance of each line for the interconnected electricity system. Therefore, these two sets of results allow us to discuss the likelihood of risk and the seriousness of concerns around it.
4.1. Analytical Analyses of Earthquake Influence on Interconnections
The first set of results focused on the lines of intersystem connections. These lines have different voltage levels and varying capacity. In addition, there is a very high probability of failure in each of them. To simulate the operation of the system, information about all power plants and intersystem links in seismically hazardous areas was collected. Our research allowed us to identify 264 power generation stations, of which 204 were located in the seismic zones with a high intensity of earthquakes and a high risk for the destruction of power generation stations. Among all identified power plants, 77.2% are in seismically active zones, and are subject to partial or total destruction by earthquakes with all negative economic consequences.
Our research also allowed us to identify 95 interconnection lines, from which we excluded 28 with a voltage of 110 KV and small capacity, as our research focused mainly on lines with a voltage of more than 110 KV. We excluded the low voltage power lines because, usually, such lines are used as distribution networks for the transmission of energy to private consumers and, even if these lines were to be used for transmitting energy between state systems, they still have little influence on the interconnected electricity transmission system.
We focused on the remaining 67 lines, aiming to determine the risk of failure of the electricity supply. We determined that only 14 lines are really at risk of being destroyed by an earthquake. Thus, 20.8% of the lines can be destroyed as a result of the earthquake hazard. This risk can influence the operation of the system and can cause a reduction in the necessary electric power supply to neighboring regions.
To calculate the current probability of failure of ties (for the moment of 2018) we use the algorithm from “3.4 Probabilities” and then use Formula 9 to define the probability of failure of the line for the current year. We also applied the data from two huge earthquakes that occurred between Kazakhstan and Kyrgyzstan in 1992 and 2003 [
36,
37], and a 2001 earthquake that occurred in an area with a connection between two energy regions of Kazakhstan. To compute the probabilities of interconnections between Russian power plants (the Siberian node) and Kazakhstan, we used a 2003 earthquake while, for the interconnections between the Southern Russian node and Kazakhstan, we used earthquakes from 2008 [
38].
Table 1 contains full information about problem lines in all three countries.
Our results show that the electricity supply through the lines on the Kazakhstan and Kyrgyzstan border has a high probability of being affected by an earthquake. The most vulnerable line is between the “Glavnaya” (Kyrgyzstan) and “Shu” points in the southern node of Kazakhstan. This line has the highest probability of failure, which is 0.31 (0.125187 for 2018) for a line with 135 MW of capacity. In addition, there are three lines that were continually being threatened by events with a probability of 0.1 (0.021671 and 0.037264 for 2018) and a high capacity level. These lines have a common start/finish point, which is “Bishkek” in Kyrgyzstan. Taking into consideration the small number of lines between Kyrgyzstan and Kazakhstan (10 lines total) we suppose that this situation requires particular attention because 60% of 10 existing lines with non-zero probability of failure is a lot.
The border between Kazakhstan and Russia included eight lines with a non-zero probability of failure. We would like to pay specific attention to the isolated “West” node. This node is in a working state but usually has a big deficit. The Russian Federation supports this region through electricity export to Kazakhstan. It is also worth mentioning that we found 11 lines between the “West” node of Kazakhstan and two nodes of Russia. These are mostly lines with small capacity, but all lines with a high capacity level have a non-zero probability of failure from earthquakes. The government of Kazakhstan recently started a program to construct a new line between the “West” and “North” nodes. This solution will probably help Kazakhstan to make their system more balanced and reliable. We also think that this region is important for further investigation, and could probably experience serious economic damage in the case of earthquakes occurring.
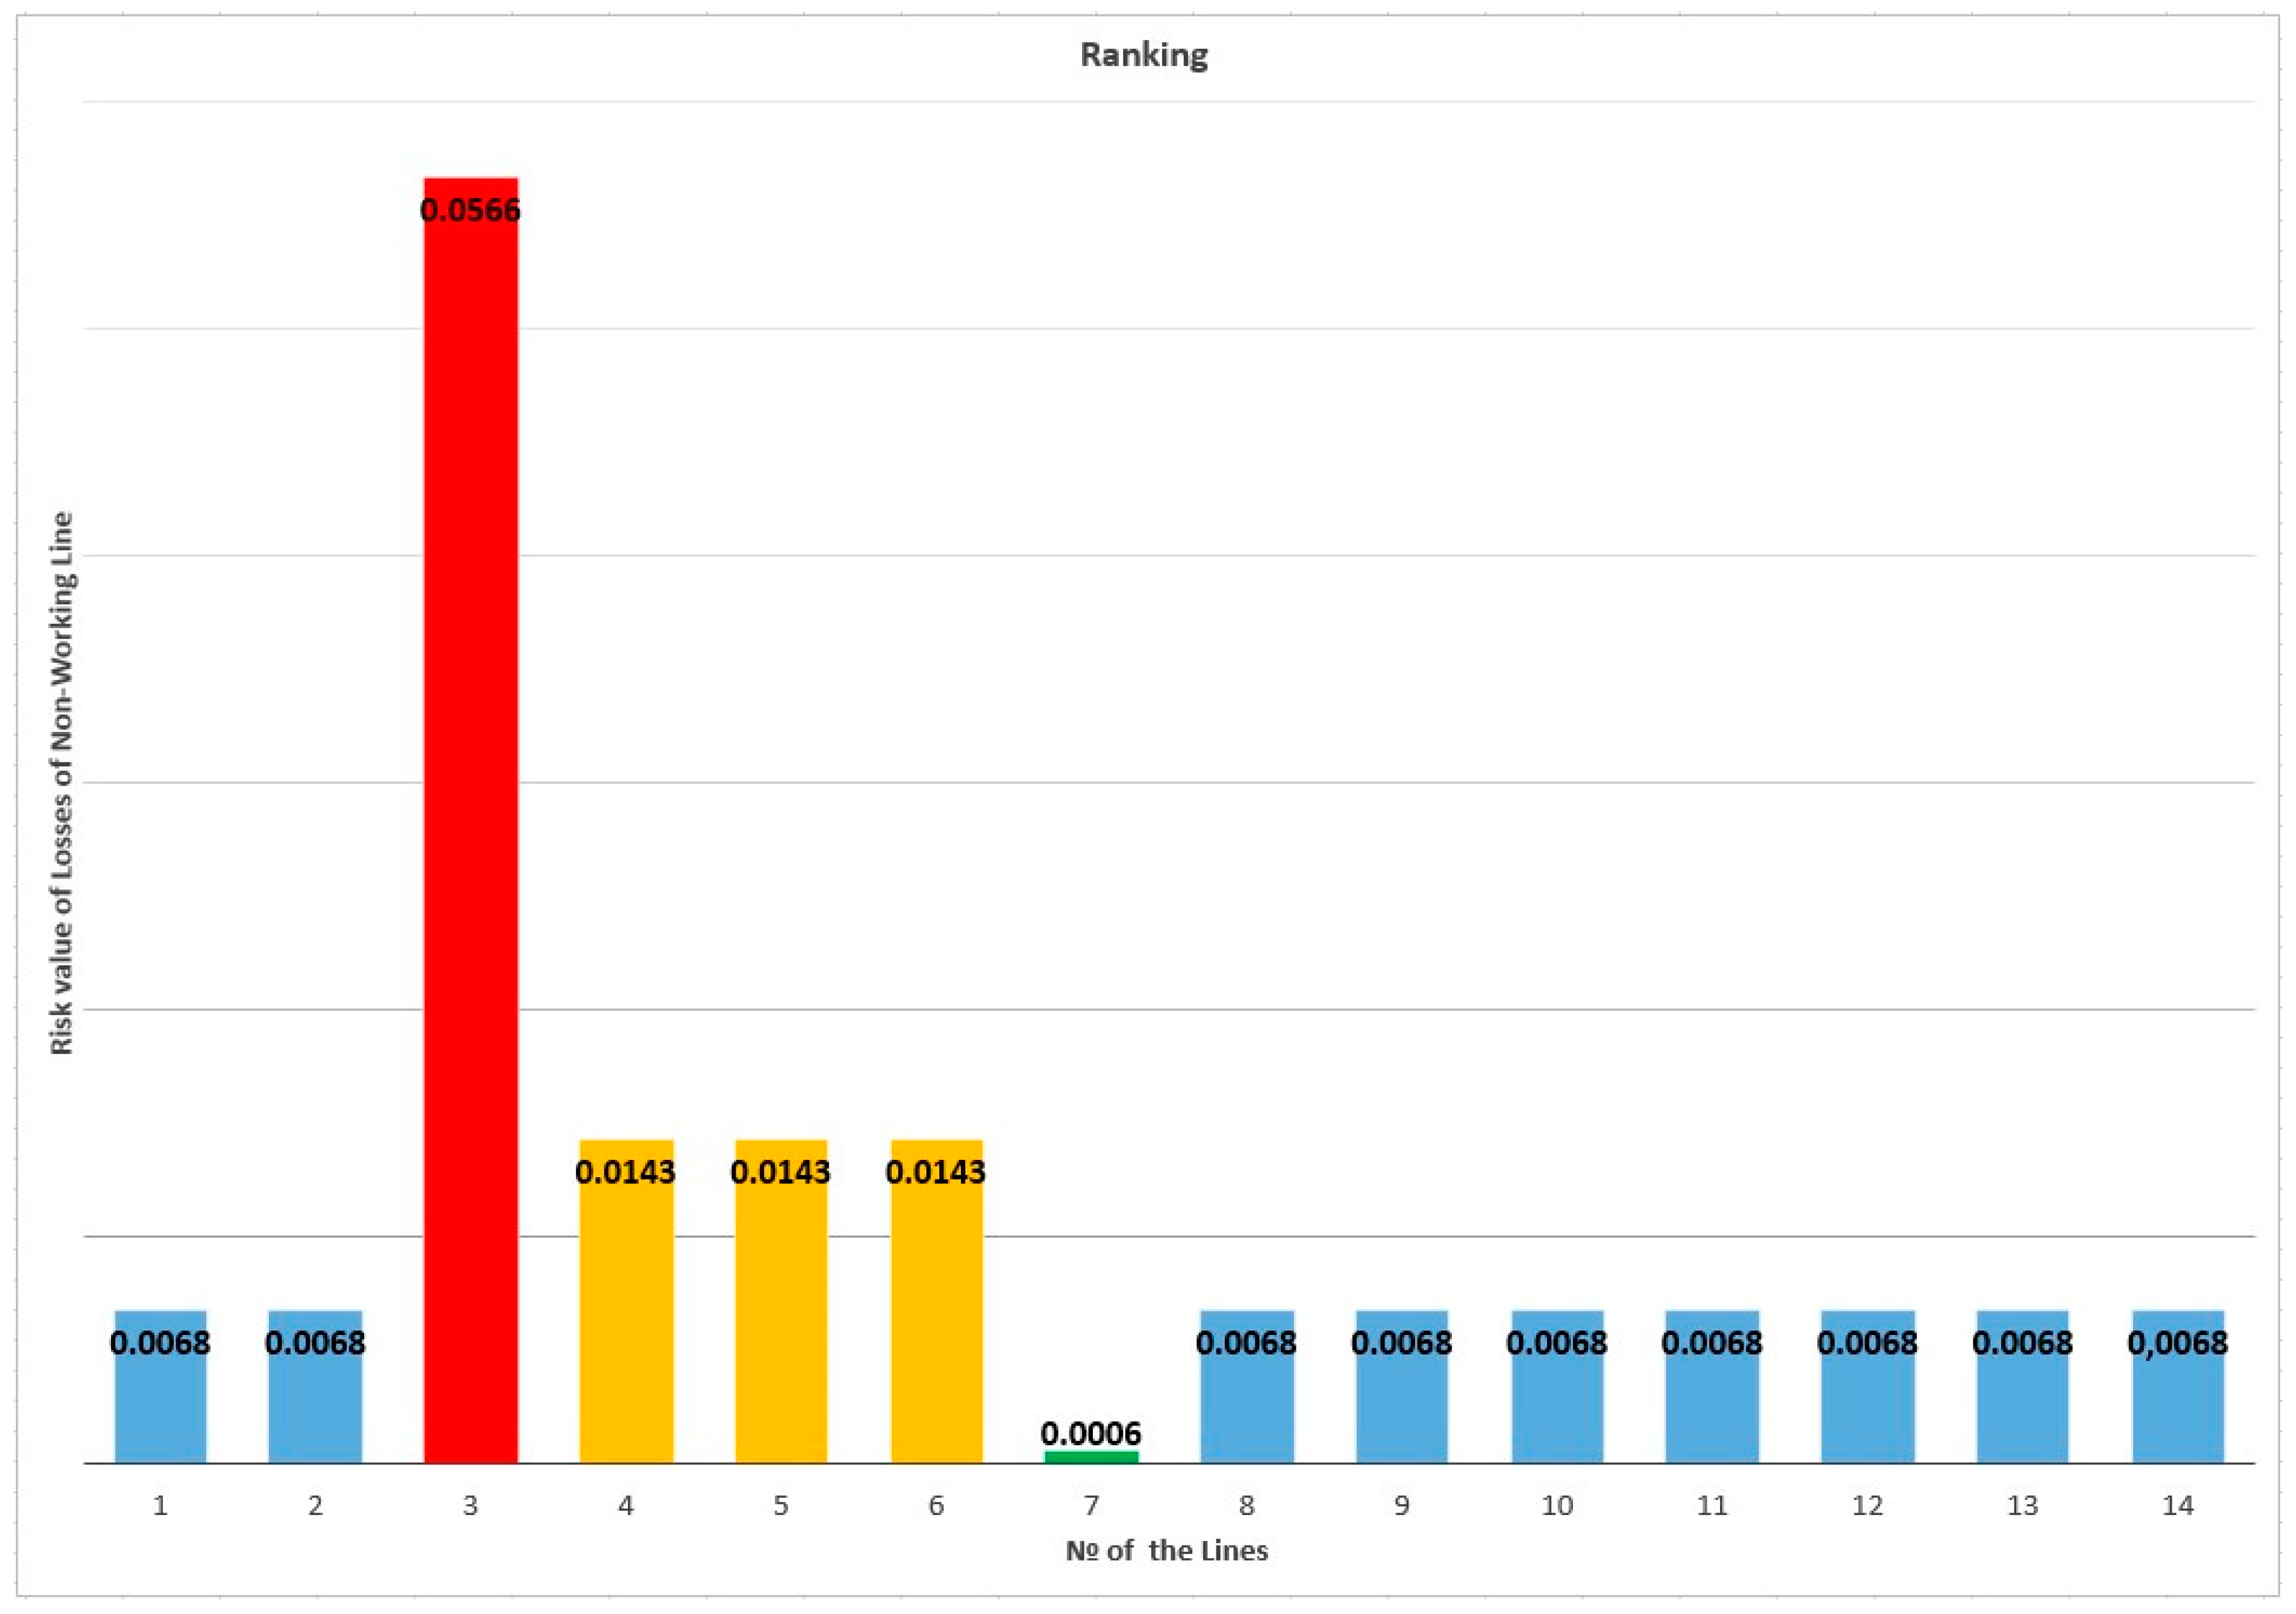
4.2. Assessment Values of Important Interconnections Investigated
The second set of results contained data about values of importance for each investigated line. We applied the “
N − 1” and “
N − 2” criteria and developed two distributions of mathematical expectations of the risk value of each line. The resulting distributions were ranked according to the mathematical expectation of the risk value of non-working lines. This approach makes it possible to determine the importance of lines, taking into account their influence on individual parts of the system (
Figure 5).
This chart is described by two axes, where one is called “Line №” (abscissa). All the numbers of the lines studied are located on this axis. The second is called “Probability of earthquake (50 years)” (ordinate), and is responsible for the height of the histogram column and allows one to visually compare the likelihood of the output of the investigated lines going out of order.
We developed four categories for all lines according to their impact on the electricity transmission system, and on the probability of failure of electricity supply:
The first category, marked in red, contains lines with a high level of influence on the system. This means that, in the event of a power failure and disconnection of this line (failure), the region will be in a deficit state.
The second category, which is marked in orange, characterizes the lines as an average necessity, which means that, in the event of certain circumstances, the disconnection of these lines can adversely affect the system and there will be a deficit.
The third category, marked in yellow, are lines of which the influence is noticeable but not significant.
The fourth category, marked in green, are lines without any visible influence on the system, as a whole or on its separate regions.
Table 2 contains the mathematical expectation of the risk value of working and non-working lines in the region investigated.
The current results show us that all lines between Kazakhstan and Russia have the same mathematical expectation of risk value. This means that there is no difference between interconnections between Russia and the isolated and deficit “West” node, or the connected and surplus “North” and “South” nodes.
As the high probability of failure has a big influence on the mathematical expectation of the risk value, we can see that the difference in the mathematical expectation of the risk value of the non-working line is bigger if the probability of failure is higher than usual. We found this observation for lines between Kazakhstan and Kyrgyzstan.
Our current model and data are a first-dimension approach, and consider only fully working systems with failed elements after earthquakes. This means that the real situation can be different because the full system will not work with full power transmitting and demand. Any element should be in a state of scheduled maintenance or failed. It is also worth considering the graphic of demand for each month, day of the week, and hour of the day. Unfortunately, the majority of interesting information, such as graphics of demand, is not available in public access sources, and further research will require additional access to data.
Often, in the classical theory of reliability, one can find research where correction factors are applied to change the state of the system toward more real data. To reduce the level of generation to real thresholds, the generation of each node is multiplied by 0.6–0.8. Such a coefficient simulates the operation of a real system, because the initial data contains a list of all generating stations. However, in reality, many of them may not work at full capacity, for example, HPPs due to low water levels or different combined heat and power (CHP) plants due to possible changes or fuel shortages. This factor reduces the amount of generation, simulating the location of generating stations. Correction coefficients were not applied in the studied system because such data is highly individual and, therefore, not readily available. Consequently, the studied EAEU EPS in its original position has no deficits and, when processing various scenarios, it has very modest deficits. However, applying the analytical approach, we can determine that if the coefficients are used, the amount of generation in Kyrgyzstan will be sharply reduced and the balance will be violated, and the South node of Kazakhstan will be in a state of small deficit close to the equilibrium of the load and generation. Thus, the disconnection of interconnections between Kazakhstan and Kyrgyzstan can lead to a deficit in Kyrgyzstan, which can have a negative economic effect.
5. Conclusions and Discussion
Our results show that the energy security of the EAEU region is affected by the existence of interconnections that are vulnerable to the threat of earthquakes, and where disruptions of the electricity supply will have high impacts on the reliability of electricity supply within the EAEU region. These interconnections are situated between Kazakhstan and Kyrgyzstan, as well as between the isolated “West” node of Kazakhstan and Russia. Power supply interruptions at these lines can seriously influence the stability of the electricity transmission system and lead to huge economic losses in the affected regions.
The public data used for the study allowed us to establish that the hazardous seismic situation in the countries studied could be the reason for the decrease in the reliability of the EPSs. However, the first-dimension assessment allowed us to identify only a part of the troubling sections of the EPSs and their interconnections. For a better evaluation, additional detailed and expanded studies are required. As alternative approaches and methodologies, modifications in which the first stage of generating states is replaced by a scenario approach, or where the states are generated by an expert group, can be used. A more complex approach based on the Monte Carlo method [
39] can also be applied to generate solutions to the presented problem. Recently, it became known that the Commonwealth of Independent States (CIS) countries are strengthening cooperation in the field of geodesy, cartography, and remote sensing of the Earth. The creation of a unified system of coordinates and heights in the CIS was discussed. In addition, an interstate technical committee could be created for the standardization. Such changes can, in many respects, positively influence further studies of this region, because one of the problems of researching energy systems for several countries is the lack of standardized maps and notations. These new studies could give us greater clarity, not only in the regions that have already been explored, but also in terms of expanding the geography of the research in general. We could also investigate the rest of the countries in Central Asia that have an interest in joining the common energy market. It is worth mentioning that the proposed approach could be used in any other region, or even for a group of countries, to conduct first-dimension research and identify problem areas in power systems.


