Indoor Multi-Risk Scenarios of Climate Change Effects on Building Materials in Scandinavian Countries


Abstract
1. Introduction
2. Materials and Methods
2.1. Climate for Culture Project
2.1.1. Description of Buildings and Climatic Data
2.1.2. Indoor Deterioration Variables
2.2. Risk Assessment
2.3. Historic Significance Assessment
3. Results
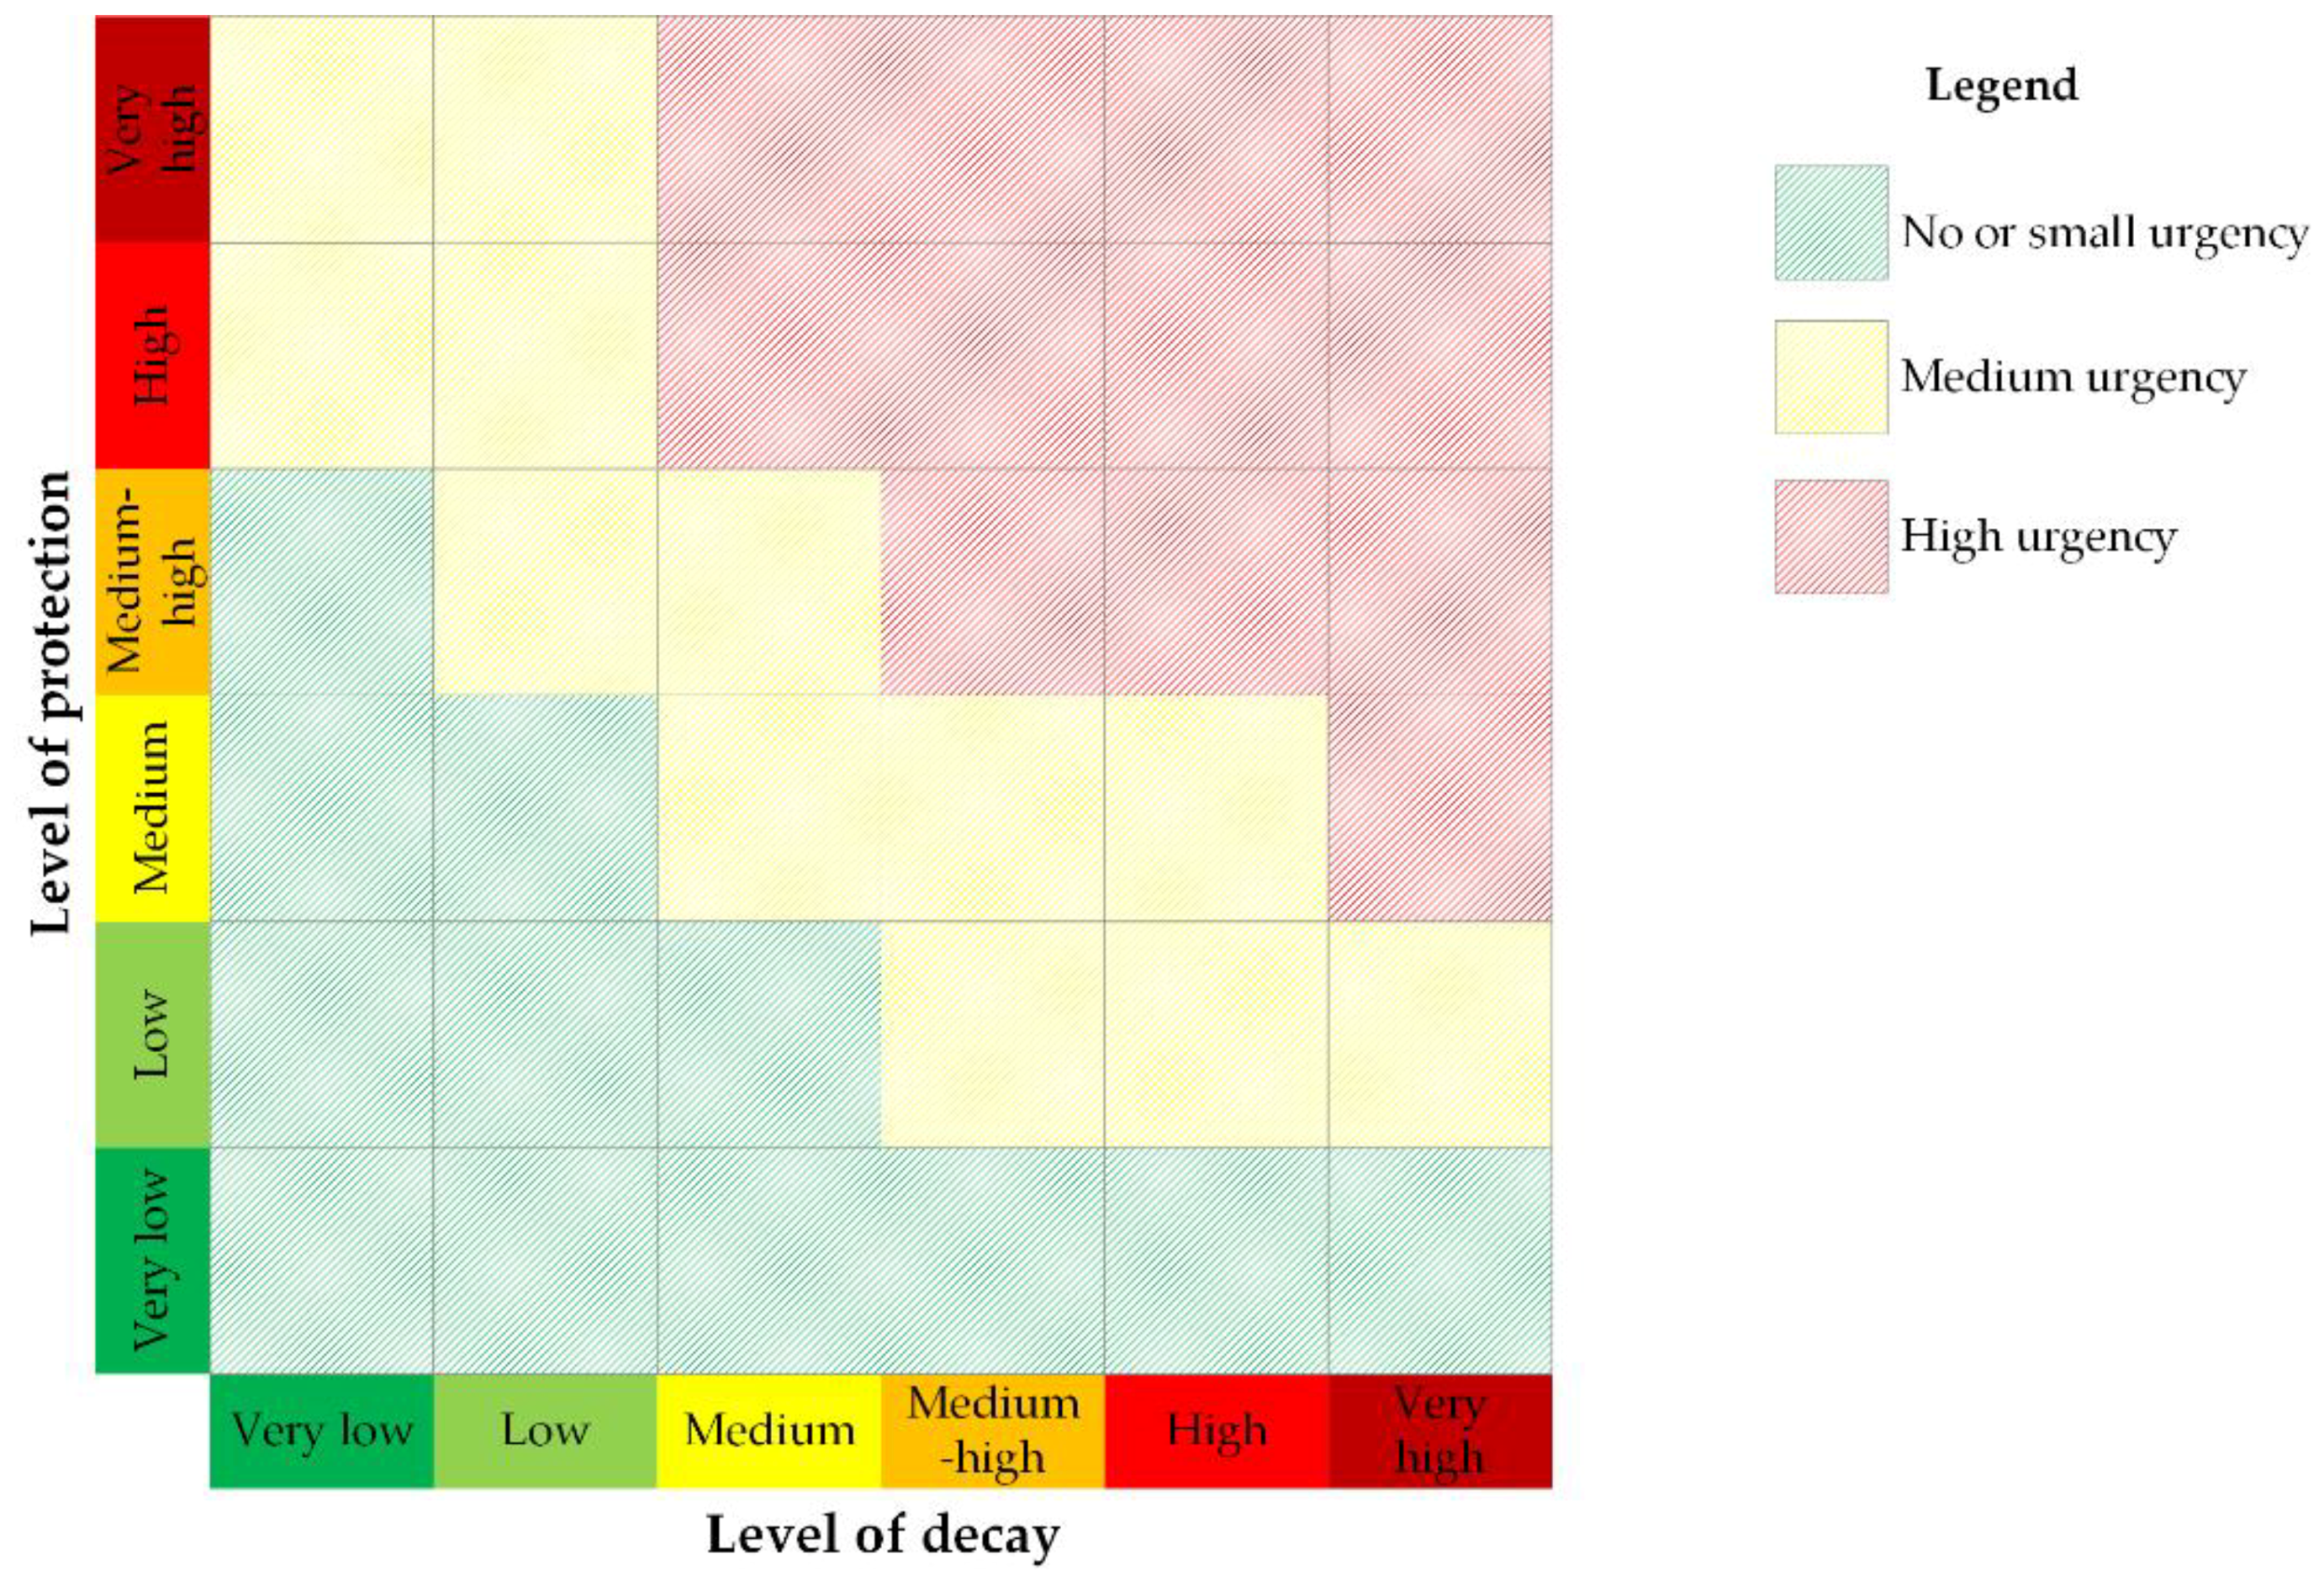
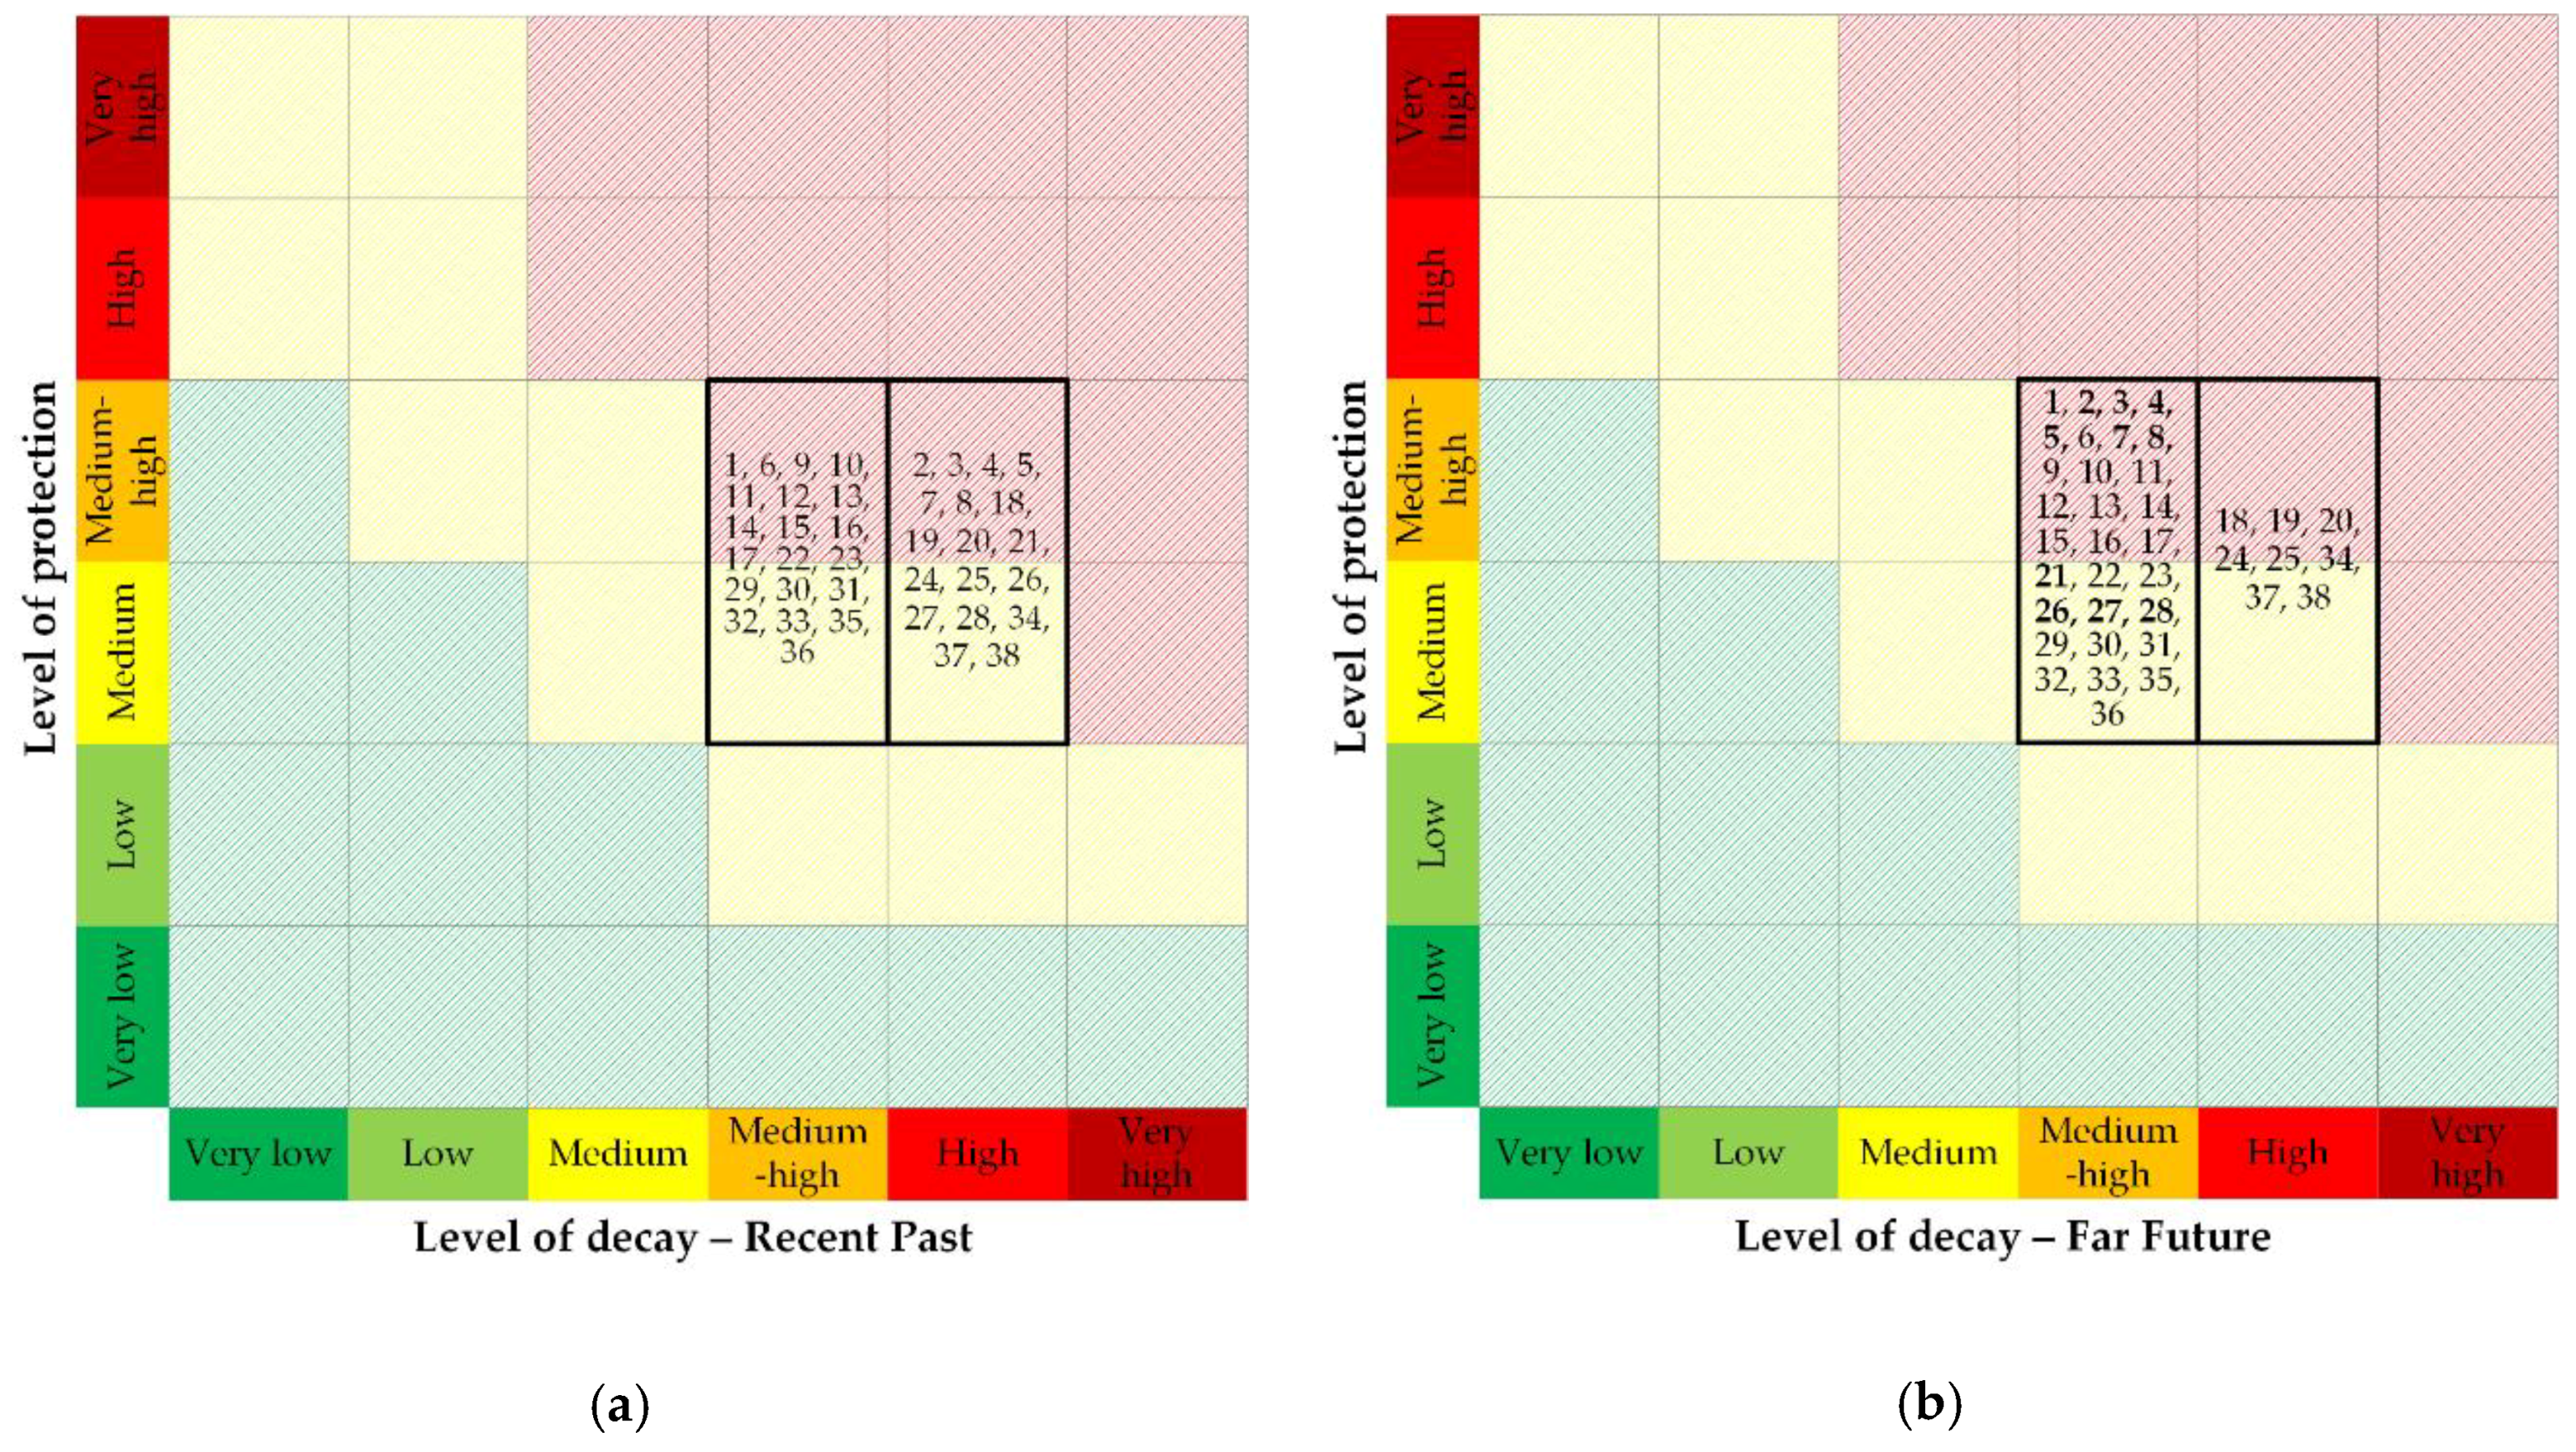
3.1. Matrix of Selection of Adaptation Intervention
3.2. Influence of Climatic Changes to Future Interventions in the Scandinavian Countries
3.2.1. Decay-Linked Variables
3.2.2. Level of Decay
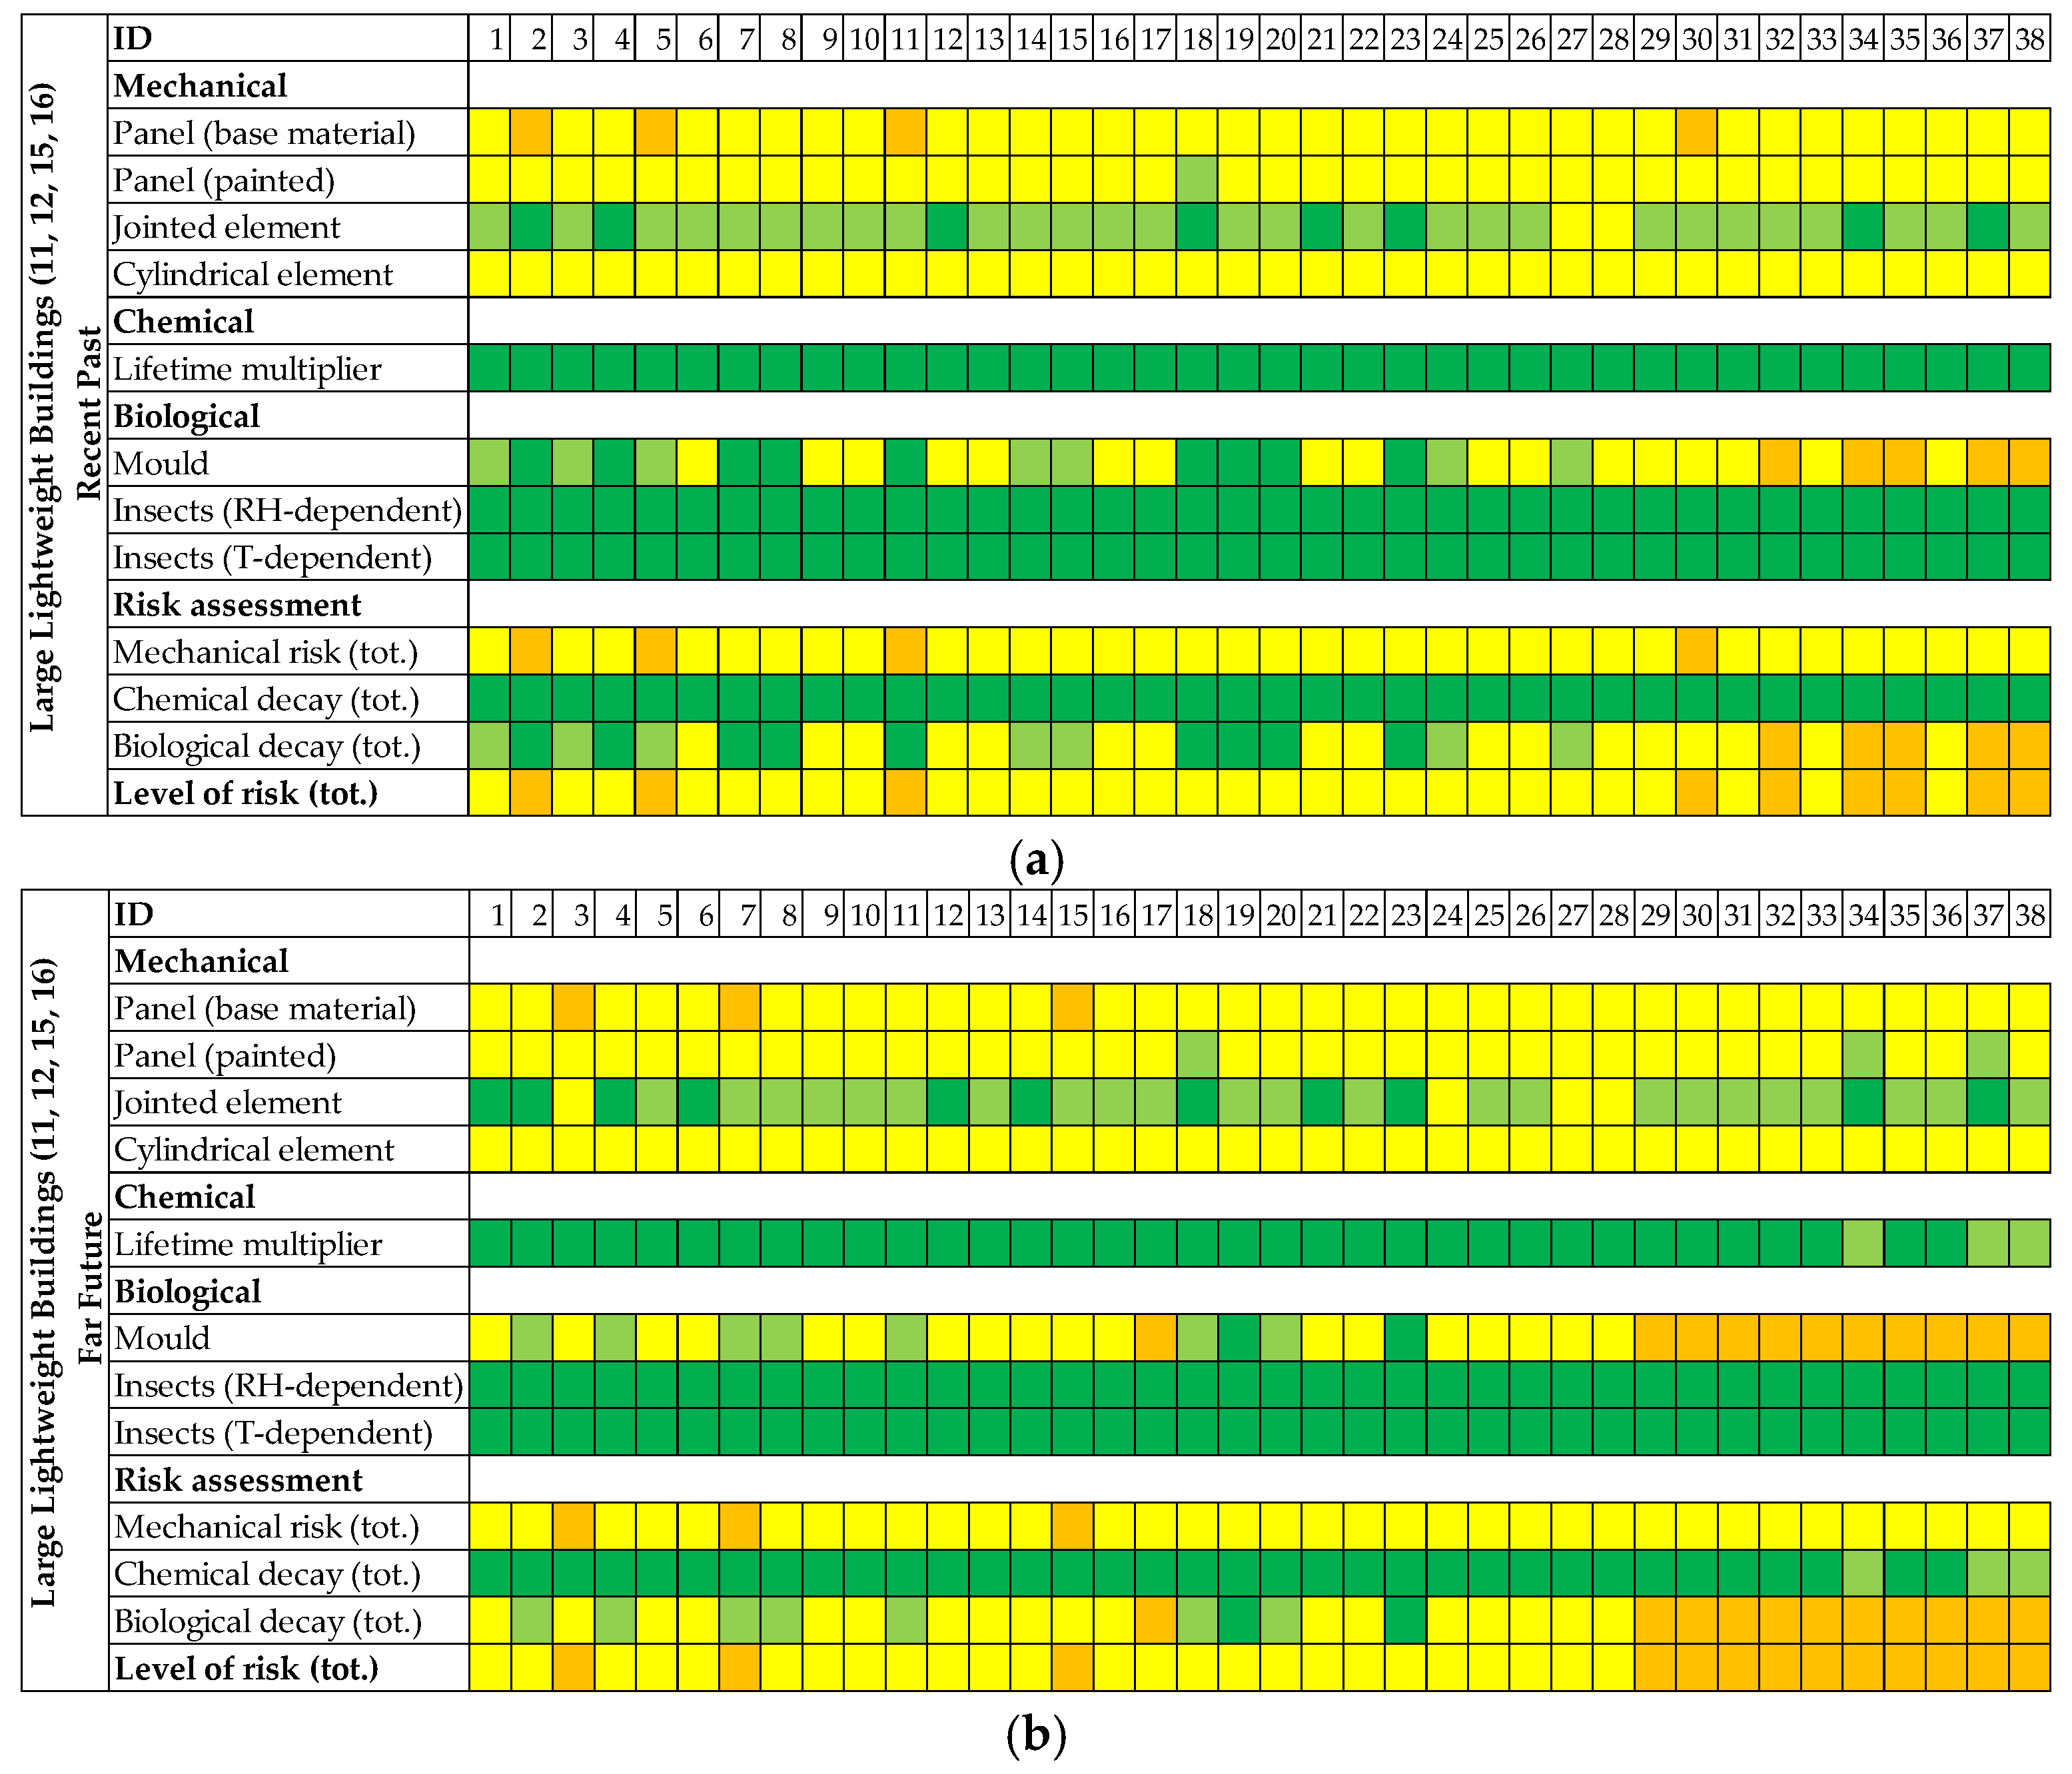
- In Scandinavian countries, the mechanical deterioration indoor in all types of buildings has a general decrease in the Far Future, although the decay remains in the ranges of medium to high risk.
- The chemical and biological risks increase. The former, exemplified by the lifetime multiplier indicator, remains in the range of low decay, except for the last locations in the map, corresponding to the south of Scandinavian Peninsula and Denmark (ID: 29–38) where the risk increases to a low or medium level. In the other ID points, the increase is still distinguishable, but it remains within the same level of risk for the buildings.
- The biological risk increases the number of locations in which the decay will fall in low, medium, and medium-high, especially in western Sweden, south of Scandinavian Peninsula and Denmark.
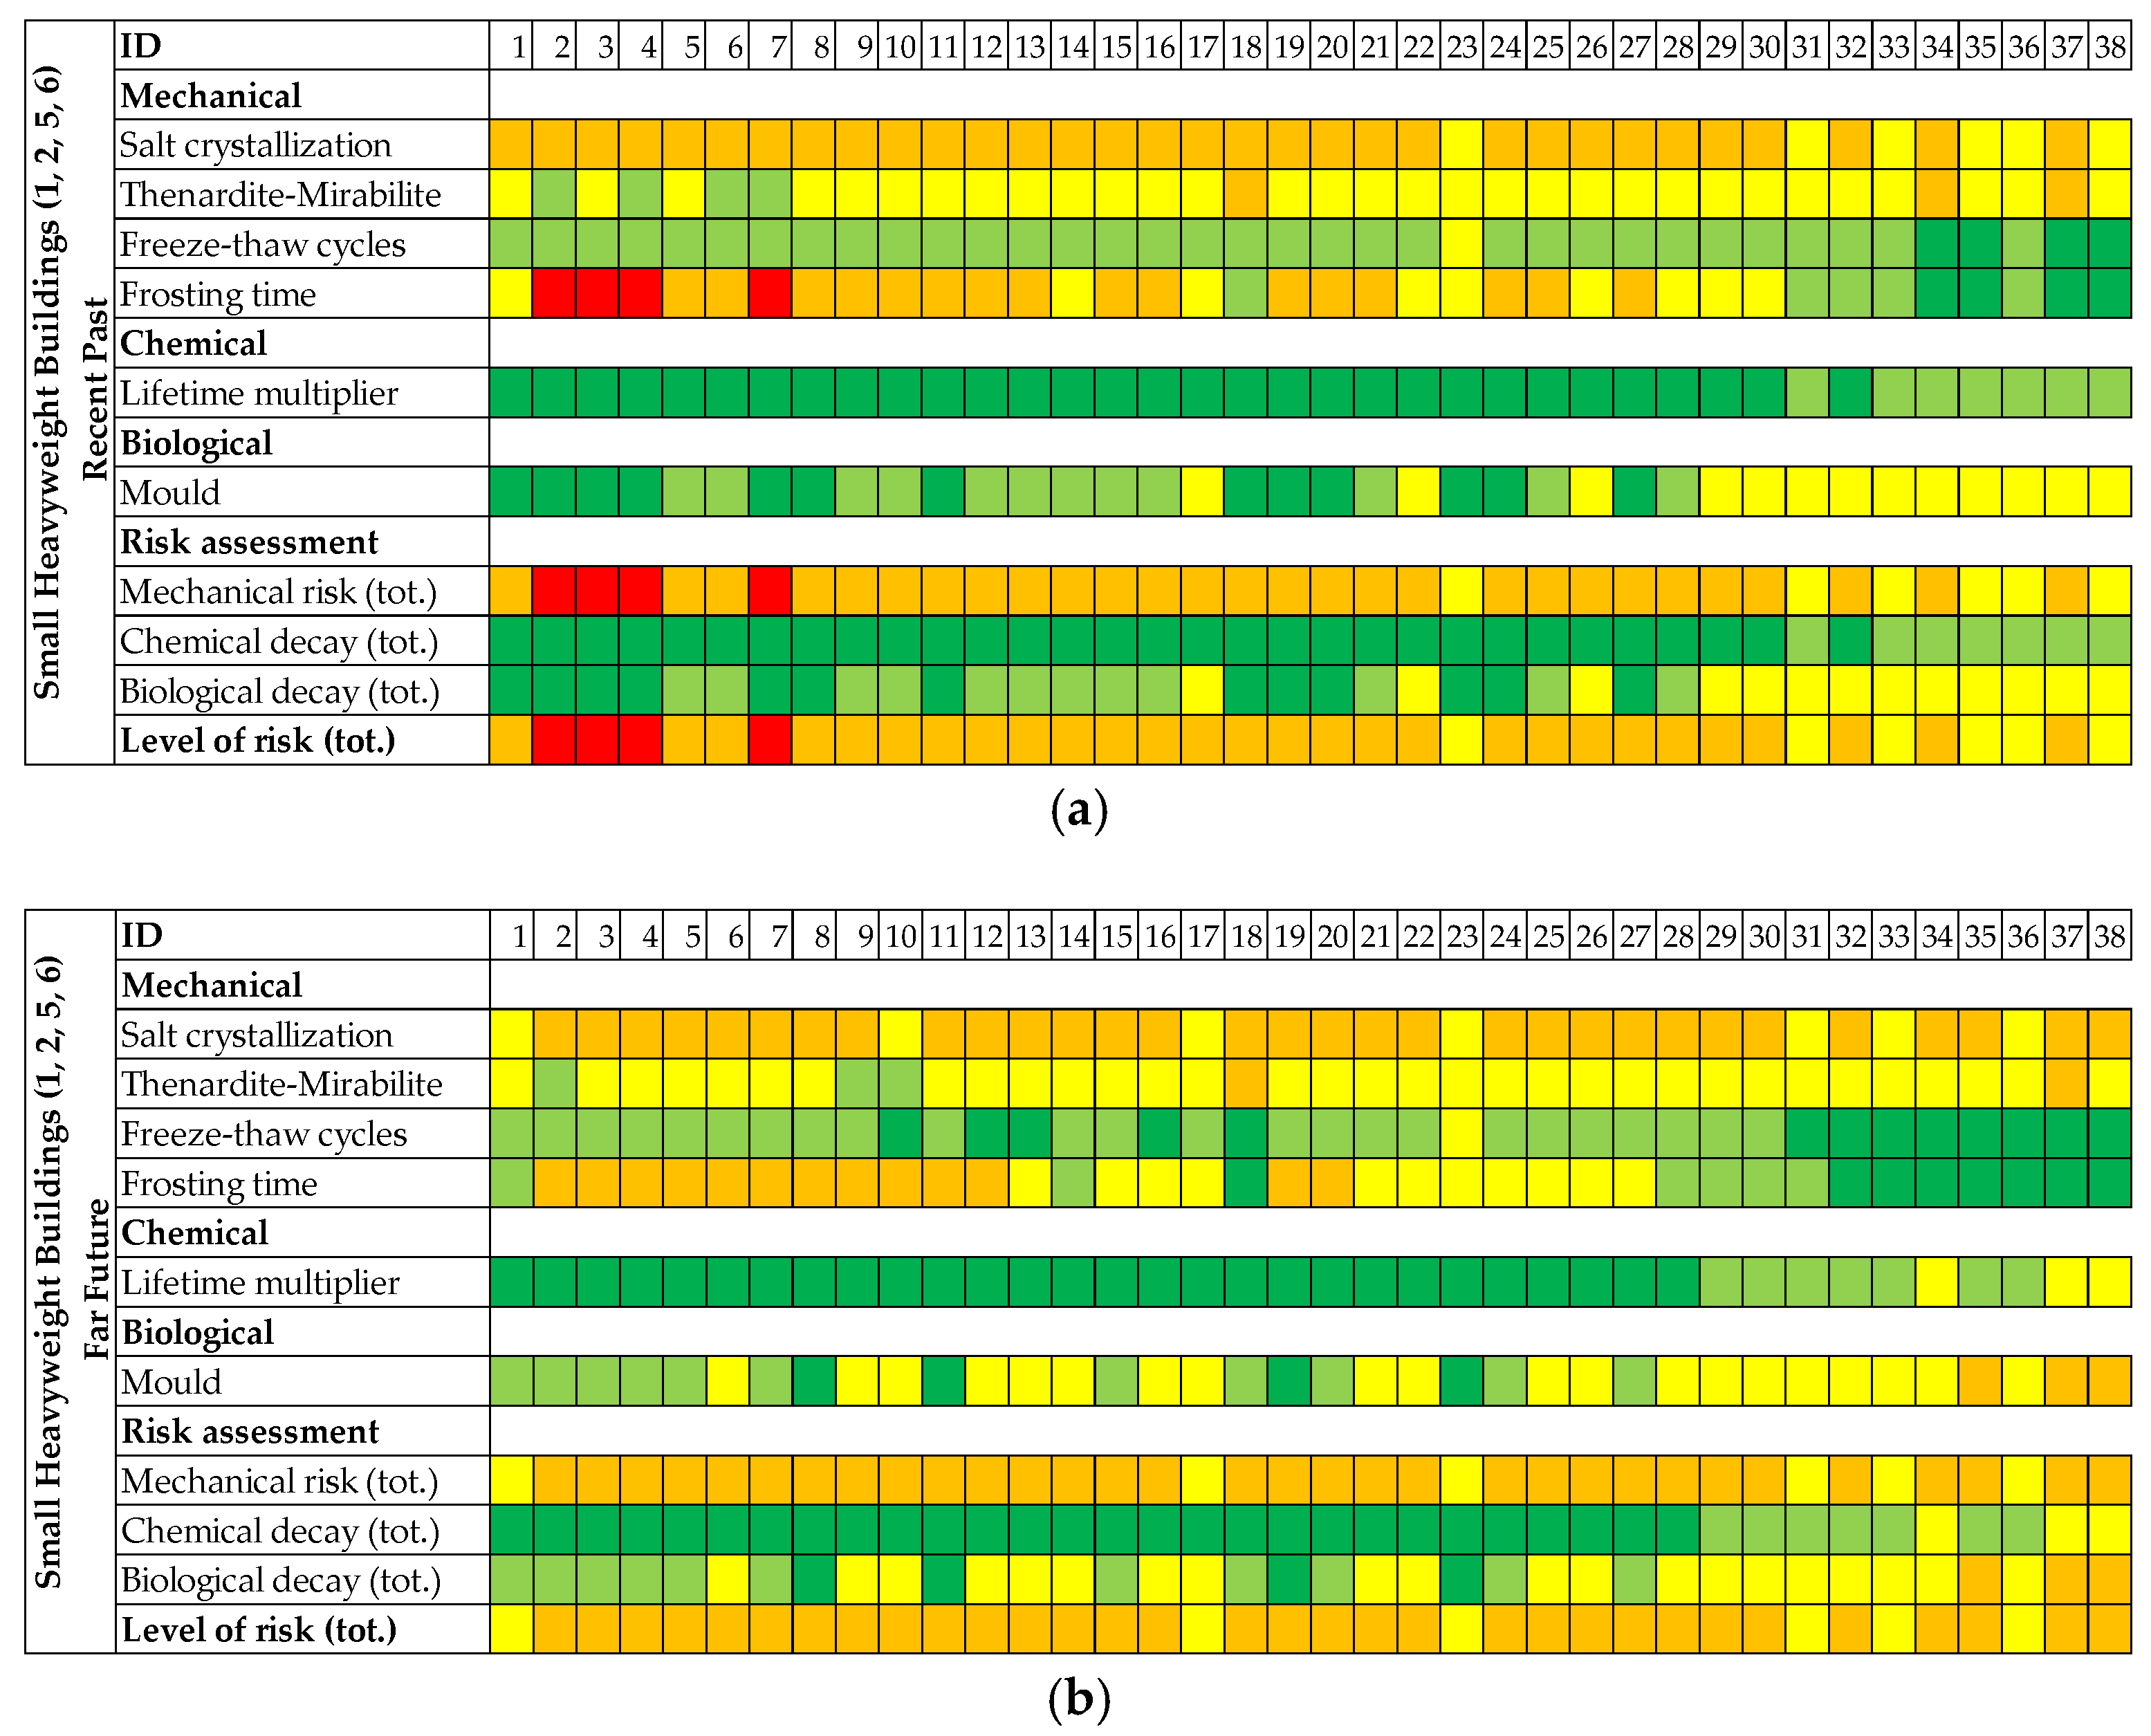
- Regarding the risk level over the Recent Past (1961–1990), high level of risk (red colour) in the indoor environment is noted only for heavyweight buildings, which resemble the masonry or concrete constructions. This level is caused by the mechanical damage in the building materials and has a throughout geographical distribution: in northern Scandinavian Peninsula (ID: 2–5, 7–8) due to the frosting time, while in central and southern parts of the peninsula (ID: 18–21; 24–28; 34; 37–38) due to the salt crystallization by sodium chloride and the transition from thenardite to mirabilite. In the Far Future (2071–2100), the risk tends to decrease because of the climatic changes, e.g., the risk due to frosting time in the northern peninsula will have a transition from high to medium level (ID: 2–5, 7–8).
- Specific effects of the climate change are also noted when the sizes of the buildings are compared. In all the three deterioration mechanisms, the level of risk in large buildings (ground floor area larger than 320 m2) results higher in comparison with small buildings, regardless the time window, constituting material, and the geographical location. In the Far Future, the decay risk of large lightweight buildings in the southern part of the peninsula (ID: 29, 32, 34–35, 37–38) will be medium-high due to climate change while small buildings in the same locations will face medium risk. Regarding heavyweight buildings in the Far Future, large ones will be disposed to high risk in central and southern areas (ID: 18–20, 24–25, 34, 37–38) while small buildings in these areas will remain at medium-high risk level.
3.2.3. Level of Intervention
4. Discussion
- No or small urgency of adaptation interventions rather than those allowed by the legislation (green colour in the matrix). This level is expected for existing buildings that are neither listed nor protected, as they have no specific need to guarantee the conservation of CDEs.
- Medium urgency of adaptation interventions (yellow colour in the matrix) is expected for historic buildings that are listed. Within this category of buildings, the ongoing climate change effect will require, in the next decades, implementation of different levels of intervention than those admitted by the legislation, for responding effectively to the expected decay.
- High urgency of adaptation interventions (red colour in the matrix) is expected for fully protected historic building, monuments and UNESCO sites. Within this category, new adaptation interventions have to be planned and implemented to respond both to the preservation of their valuable CDEs and to intervene with urgency in post-disaster situations.
5. Conclusions
Supplementary Materials
Author Contributions
Funding
Acknowledgments
Conflicts of Interest
References
- Robert, V.; Gobiet, A.; Sobolowski, S.; Kjellström, E.; Stegehuis, A.; Watkiss, P.; Mendlik, T.; Landgren, O.; Nikulin, G.; Teichmann, C. The European climate under a 2 °C global warming. Environ. Res. Lett. 2014, 9, 034006. [Google Scholar]
- Norwegian Climate Service Centre. Climate in Norway 2100; Norwegian Climate Service Centre: Oslo, Norway, 2015. [Google Scholar]
- Lisø, K.R.; Hygen, H.O.; Kvande, T.; Thue, J.V. Decay potential in wood structures using climate data. Build. Res. Inf. 2006, 34, 546–551. [Google Scholar] [CrossRef]
- Almås, A.J.; Lisø, K.R.; Hygen, H.O.; Øyen, C.F.; Thue, J.V. An approach to impact assessments of buildings in a changing climate. Build. Res. Inf. 2011, 39, 227–238. [Google Scholar] [CrossRef]
- Lisø, K.R.; Hygen, H.O.; Kvande, T.; Thue, J.V.; Harstveit, K. A frost decay exposure index for porous, mineral building materials. Build. Environ. 2007, 42, 3547–3555. [Google Scholar] [CrossRef]
- Larsen, P.K. The salt decay of medieval bricks at a vault in Brarup Church, Denmark. Environ. Geol. 2007, 52, 375–383. [Google Scholar] [CrossRef]
- Grøntoft, F. Climate change impact on building surfaces and façades. Int. J. Clim. Chang. Strateg. Manag. 2011, 3, 374–385. [Google Scholar] [CrossRef]
- Cassar, M.; Young, C.; Weighell, T.; Sheppard, D.; Bomhard, B.; Rosabal, P. Predicting and Managing the Effects of Climate Change on World Heritage. A Joint Report from the World Heritage Centre, Its Advisory Bodies, and a Broad Group of Experts to the 30th Session of the World Heritage Committee; World Heritage Committee: Vilnius, Lithuania, 2006. [Google Scholar]
- Cassar, M.; Pender, R. The impact of climate change on cultural heritage: Evidence and response. In Proceedings of the ICOM 14th Triennial Meeting, Hague, The Netherlands, 12–16 September 2005; Volume 2, pp. 610–616. [Google Scholar]
- Phillips, H. The capacity to adapt to climate change at heritage sites—The development of a conceptual framework. Environ. Sci. Policy 2015, 47, 118–125. [Google Scholar] [CrossRef]
- O’Brien, G.; O’Keefe, P.; Jayawickrama, J.; Jigyasu, R. Developing a model for building resilience to climate risks for cultural heritage. J. Cult. Herit. Manag. Sustain. Dev. 2015, 5, 99–114. [Google Scholar] [CrossRef]
- Gruber, S. The Impact of Climate Change on Cultural Heritage Sites: Environmental Law and Adaptation. Carbon Clim. Law Rev. 2011, 5, 209–219. [Google Scholar] [CrossRef]
- Leissner, J.; Kilian, R.; Kotova, L.; Jacob, D.; Mikolajewicz, U.; Broström, T.; Ashley-Smith, J.; Schellen, H.L.; Martens, M.; van Schijndel, J.; et al. Climate for Culture: Assessing the impact of climate change on the future indoor climate in historic buildings using simulations. Herit. Sci. 2015, 3, 38. [Google Scholar] [CrossRef]
- Sabbioni, C.; Cassar, M.; Brimblecombe, P.; Tidblad, J.; Kozlowski, R.; Drdacky, M.; Saiz-Jimenez, C.; Grontoft, T.; Wainwright, I.; Arino, X. Global climate change impact on built heritage and cultural landscapes. In Heritage, Weathering and Conservation; Fort, R., Alvarez de Buergo, M., Gomez-Heras, M., Vazquez-Calvo, C., Eds.; Taylor & Francis Group: Oxford, UK, 2006; pp. 395–401. [Google Scholar]
- Nordic Council of Ministers. CERCMA: Cultural Environment as Resource in Climate Change Mitigation and Adaptation, in Nordiske Arbejdspapirer; Nordic Council of Ministers: Copenhagen, Denmark, 2014. [Google Scholar]
- Kaslegard, A.S. Climate Change and Cultural Heritage in the Nordic Countries; Nordic Council of Ministers: Copenhagen, Denmark, 2011. [Google Scholar]
- Haugen, A.; Mattsson, J. Preparations for climate change’s influences on cultural heritage. Int. J. Clim. Chang. Strateg. Manag. 2011, 3, 386–401. [Google Scholar] [CrossRef]
- Damage Risk Assessment, Economic Impact and Mitigation Strategies for Sustainable Preservation of Cultural Heritage in the Times of Climate Change. Available online: https://cordis.europa.eu/project/rcn/92906_en.html (accessed on 12 September 2018).
- van Schijndel, A.W.M. Climate for Culture: Book of Maps; Eindhoven University of Technology: Eindhoven, The Netherlands, 2016. [Google Scholar]
- Jacob, D.; Elizalde, A.; Haensler, A.; Hagemann, S.; Kumar, P.; Podzun, R.; Rechid, D.; Remedio, A.R.; Saeed, F.; Sieck, K.; et al. Assessing the Transferability of the Regional Climate Model REMO to Different COordinated Regional Climate Downscaling EXperiment (CORDEX) Regions. Atmosphere 2012, 3, 181–199. [Google Scholar] [CrossRef]
- Intergovernmental Panel on Climate Change (IPCC). Special Report on Emissions Scenarios: A Special Report of Working Group III of the Intergovernmental Panel on Climate Change; Nakicenovic, N., Swart, R., Eds.; Cambridge University Press: Cambridge, UK, 2000. [Google Scholar]
- Intergovernmental Panel on Climate Change (IPCC). Climate Change 2013: The Physical Science Basis. Contribution of Working Group 1 (WG1) to the Fifth Assessment Report of the Intergovernmental Panel on Climate Change; Stocker, T.F., Qin, D., Plattner, G.K., Tignor, M., Allen, S.K., Boschung, J., Nauels, A., Xia, Y., Bex, V., Midgley, P.M., Eds.; Cambridge University Press: New York, NY, USA, 2013; p. 1535. [Google Scholar]
- Huijbregts, Z.; Schellen, H.; Martens, M.; van Schijndel, J. Object Damage Risk Evaluation in the European Project Climate for Culture. Energy Proced. 2015, 78, 1341–1346. [Google Scholar] [CrossRef][Green Version]
- Ashley-Smith, J. Climate for Culture: D 4.2. Report on Damage Functions in Relation to Climate Change and Microclimatic Response. Available online: https://www.climateforculture.eu/ (accessed on 11 September 2018).
- Bertolin, C.; Camuffo, D. Risk Assessment, in Built Cultural Heritage in Times of Climate Change; Leissner, J., Kaiser, U., Kilian, R., Eds.; Fraunhofer-Center for Central and Eastern Europe MOEZ: Leipzig, Germany, 2014; pp. 52–54. [Google Scholar]
- Martens, M.H.J. Climate Risk Assessment in Museums: Degradation Risks Determined from Temperature and Relative Humidity Data; Technische Universiteit Eindhoven: Eindhoven, The Netherlands, 2012. [Google Scholar]
- Mecklenburg, M.F.; Tumosa, C.S.; Erhardt, D. Structural Response of Painted Wood Surfaces to Changes in Ambient Relative Humidity in Painted Wood: History and Conservation; The Getty Conservation Institute: Los Angeles, NY, USA, 1988; pp. 464–483. [Google Scholar]
- Jakieła, S.; Bratasz, Ł.; Kozłowski, R. Numerical modelling of moisture movement and related stress field in lime wood subjected to changing climate conditions. Wood Sci. Technol. 2008, 42, 21–37. [Google Scholar] [CrossRef]
- Bratasz, L. Acceptable and non-acceptable microclimate variability: The case of wood. In Basic Environmental Mechanisms Affecting Cultural Heritage. Understanding Deterioration Mechanisms for Conservation Process; Camuffo, D., Fassima, V., Havermams, J., Eds.; European Cooperation in Science and Technology: Brussels, Belgium, 2010; Volume 42, pp. 49–58. [Google Scholar]
- Grossi, C.M.; Brimblecombe, P.; Menéndez, B.; Benavente, D.; Harris, I.; Déqué, M. Climatology of salt transitions and implications for stone weathering. Sci. Total Environ. 2011, 409, 2577–2585. [Google Scholar] [CrossRef] [PubMed]
- Sabbioni, C.; Brimblecombe, P.; Cassar, M. The Atlas of Climate Change Impact on European Cultural Heritage: Scientific Analysis and Management Strategies; Anthem Press: London, UK, 2010. [Google Scholar]
- Lankester, P.; Brimblecombe, P. Future thermohygrometric climate within historic houses. J. Cult. Herit. 2012, 13, 1–6. [Google Scholar] [CrossRef]
- Camuffo, D. Microclimate for Cultural Heritage: Conservation, Restoration, and Maintenance of Indoor and Outdoor Monuments; Elsevier: New York, NY, USA, 2013. [Google Scholar]
- Michalski, S. Double the life for each five-degree drop, more than double the life for each halving of relative humidity. In Preprints of 13th Meeting of ICOM-CC; Vontobel, R., Ed.; International Committees Comités Internationaux: London, UK, 2002; Volume 1, pp. 66–72. [Google Scholar]
- Sedlbauer, K. Prediction of Mould Fungus Formation on the Surface of and Inside Building Components; Fraunhofer Institute for Building Physics: Stuttgart, Germany, 2001. [Google Scholar]
- Child, R. The influence of the museum environment in controlling insect pests. In Climate for Collections: Standards and Uncertainties; Ashley-Smith, J., Burmester, A., Eibl, M., Eds.; Archetype Publications Ltd.: London, UK, 2013; pp. 419–424. [Google Scholar]
- Loli, A.; Bertolin, C. Towards Zero-Emission Refurbishment of Historic Buildings: A Literature Review. Buildings 2018, 8, 22. [Google Scholar] [CrossRef]
- Reinar, D.A.; Westerlind, A.M. Urban Heritage Analysis: A Handbook about DIVE; Riksantikvaren: Oslo, Norway, 2010. [Google Scholar]
- Lehtimäki, M. Sustainable Historic Towns—Urban Heritage as an Asset of Development; National Board of Antiquities: Helsinki, Finland, 2006. [Google Scholar]
- Reinar, D.A. Communicating Heritage in Urban Development Processes 2007–08: Co-Herit Project Report; Riksantikvaren: Oslo, Norway, 2009. [Google Scholar]
- Byplankontoret—Trondheim Kommune, Kulturmiljøet Kjøpmannsgata—En kulturhistorisk Stedsanalyse av Bryggerekken og Tilhørende Områder. Available online: https://www.riksantikvaren.no/ (accessed on 11 September 2018).
- Valluzzi, M.R.; Modena, C.; de Felice, G. Current practice and open issues in strengthening historical buildings with composites. Mater. Struct. 2014, 47, 1971–1985. [Google Scholar] [CrossRef]
- Modena, C.; Valluzzi, M.R.; da Porto, F.; Casarin, F. Structural Aspects of the Conservation of Historic Masonry Constructions in Seismic Areas: Remedial Measures and Emergency Actions. Int. J. Archit. Herit. 2011, 5, 539–558. [Google Scholar] [CrossRef]
- Cardani, G.; Belluco, P. Reducing the Loss of Built Heritage in Seismic Areas. Buildings 2018, 8, 19. [Google Scholar] [CrossRef]
- Rossi, M.; Cattari, S.; Lagomarsino, S. Performance-based assessment of the Great Mosque of Algiers. Bullet. Earthq. Eng. 2015, 13, 369–388. [Google Scholar] [CrossRef]
- Necevska-Cvetanovska, G.; Apostolska, R. Consolidation, rebuilding and strengthening of St. Clement’s church, St. Panteleymon, Plaoshnik, Ohrid. Eng. Struct. 2008, 30, 2185–2193. [Google Scholar] [CrossRef]
- Sesana, E.; Gagnon, A.; Bertolin, C.; Hughes, J. Adapting Cultural Heritage to Climate Change Risks: Perspectives of Cultural Heritage Experts in Europe. Geosciences 2018, 8, 305. [Google Scholar] [CrossRef]
- Hampster Map. Available online: https://www.hamstermap.com/custommap.html (accessed on 11 September 2018).


| Recent Past (RP) | Near Future (NF) | Far Future (FF) |
|---|---|---|
| 1961–1990 | 2021–2050 | 2071–2100 |
| Heavyweight | Lightweight | ||||
|---|---|---|---|---|---|
| Low MBP | High MBP | Low MBP | High MBP | ||
| Small Building | Small Window | Building 1 | Building 2 | Building 3 | Building 4 |
| Large Window | Building 5 | Building 6 | Building 7 | Building 8 | |
| Large Building | Small Window | Building 9 | Building 10 | Building 11 | Building 12 |
| Large Window | Building 13 | Building 14 | Building 15 | Building 16 | |
| Mechanical Damages | Chemical Degradation | Biological Deterioration |
|---|---|---|
| Panel (base material) | Lifetime multiplier | Mould |
| Panel (pictorial layer) | Insects | |
| Jointed element | ||
| Cylindrical element |
| Mechanical Damages | Chemical Degradation | Biological Deterioration |
|---|---|---|
| Salt crystallisation cycles | Lifetime multiplier | Mould |
| Thenardite-Mirabilite cycles 1 | ||
| Freeze-thaw cycles | ||
| Frosting time |
| Variable Name | Unit | Very Low | Low | Medium | Medium-High | High | Very High |
|---|---|---|---|---|---|---|---|
| Panel—base material | [-] | 0.333 | 0.667 | 1 | 1.333 | 1.667 | 2 |
| Panel—pictorial layer | [-] | 0.333 | 0.667 | 1 | 1.333 | 1.667 | 2 |
| Jointed element | [-] | 0.333 | 0.667 | 1 | 1.333 | 1.667 | 2 |
| Cylindrical element | [-] | 0.333 | 0.667 | 1 | 1.333 | 1.667 | 2 |
| Salt crystallisation cycles | [no/year] | 30 | 60 | 90 | 120 | 150 | 180 |
| Thenardite-Mirabilite cycles | [no/year] | 30 | 60 | 90 | 120 | 150 | 180 |
| Freeze-thaw cycles | [no/year] | 15 | 30 | 45 | 60 | 75 | 90 |
| Frosting time | [h/year] | 1200 | 2400 | 3600 | 4800 | 6000 | 7200 |
| Lifetime multiplier—Wood | [-] | 1.5 | 1.25 | 1 | 0.75 | 0.5 | 0.25 |
| Lifetime multiplier—Masonry | [-] | 1.5 | 1.25 | 1 | 0.75 | 0.5 | 0.25 |
| Lifetime multiplier—Concrete | [-] | 1.5 | 1.25 | 1 | 0.75 | 0.5 | 0.25 |
| Mould growth | [mm/year] | 25 | 50 | 125 | 200 | 400 | 600 |
| Insects—humidity dependent | [DD/year] | 500 | 1000 | 1500 | 2000 | 2500 | 3000 |
| Insects—temp. dependent | [DD/year] | 500 | 1000 | 1500 | 2000 | 2500 | 3000 |
| Map | ID | Lat. | Long. | Country |
|---|---|---|---|---|
 | 1 | 69.2898 | 17.5711 | Norway |
| 2 | 69.2659 | 21.1079 | Norway | |
| 3 | 69.1791 | 24.6277 | Norway | |
| 4 | 67.9698 | 17.5926 | Sweden | |
| 5 | 67.9471 | 20.9522 | Sweden | |
| 6 | 67.8647 | 24.2975 | Finland | |
| 7 | 66.6144 | 14.4121 | Norway | |
| 8 | 66.6498 | 17.6118 | Sweden | |
| 9 | 66.6282 | 20.8133 | Sweden | |
| 10 | 66.5496 | 24.0026 | Finland | |
| 11 | 65.2960 | 14.5712 | Sweden | |
| 12 | 65.3298 | 17.6291 | Sweden | |
| 13 | 65.3092 | 20.6884 | Sweden | |
| 14 | 63.8928 | 11.7972 | Norway | |
| 15 | 63.9774 | 14.7152 | Sweden | |
| 16 | 64.0099 | 17.6447 | Sweden | |
| 17 | 63.9901 | 20.5754 | Sweden | |
| 18 | 62.2671 | 6.5031 | Norway | |
| 19 | 62.4467 | 9.2598 | Norway | |
| 20 | 62.5775 | 12.0436 | Sweden | |
| 21 | 62.6587 | 14.8462 | Sweden | |
| 22 | 62.6899 | 17.6589 | Sweden | |
| 23 | 60.9630 | 6.9321 | Norway | |
| 24 | 61.1359 | 9.5886 | Norway | |
| 25 | 61.2618 | 12.2690 | Norway | |
| 26 | 61.3399 | 14.9660 | Sweden | |
| 27 | 59.6575 | 7.3273 | Norway | |
| 28 | 59.8244 | 9.8912 | Norway | |
| 29 | 59.9457 | 12.4764 | Sweden | |
| 30 | 60.0210 | 15.0762 | Sweden | |
| 31 | 60.0499 | 17.6838 | Sweden | |
| 32 | 58.3510 | 7.6928 | Norway | |
| 33 | 58.7020 | 15.1779 | Sweden | |
| 34 | 57.1994 | 10.4305 | Denmark | |
| 35 | 57.3127 | 12.8455 | Sweden | |
| 36 | 57.3829 | 15.2722 | Sweden | |
| 37 | 55.7352 | 8.3487 | Denmark | |
| 38 | 55.9958 | 13.0108 | Sweden |
© 2018 by the authors. Licensee MDPI, Basel, Switzerland. This article is an open access article distributed under the terms and conditions of the Creative Commons Attribution (CC BY) license (http://creativecommons.org/licenses/by/4.0/).
Share and Cite
Loli, A.; Bertolin, C. Indoor Multi-Risk Scenarios of Climate Change Effects on Building Materials in Scandinavian Countries. Geosciences 2018, 8, 347. https://doi.org/10.3390/geosciences8090347
Loli A, Bertolin C. Indoor Multi-Risk Scenarios of Climate Change Effects on Building Materials in Scandinavian Countries. Geosciences. 2018; 8(9):347. https://doi.org/10.3390/geosciences8090347
Chicago/Turabian StyleLoli, Arian, and Chiara Bertolin. 2018. "Indoor Multi-Risk Scenarios of Climate Change Effects on Building Materials in Scandinavian Countries" Geosciences 8, no. 9: 347. https://doi.org/10.3390/geosciences8090347
APA StyleLoli, A., & Bertolin, C. (2018). Indoor Multi-Risk Scenarios of Climate Change Effects on Building Materials in Scandinavian Countries. Geosciences, 8(9), 347. https://doi.org/10.3390/geosciences8090347