Article

Fluvial Geomorphology, Root Distribution, and Tensile Strength of the Invasive Giant Reed, Arundo Donax and Its Role on Stream Bank Stability in the Santa Clara River, Southern California

1
Upward Bound Math–Science, Lyon College, Batesville, AR 72501, USA
2
Department of Earth Science, University of California, Santa Barbara, CA 93106, USA
3
Marine Science Institute, University of California, Santa Barbara, CA 93106, USA
4
U.S. Department of Agriculture, Agricultural Research Service, National Sedimentation Laboratory, Oxford, MS 38655, USA
*
Author to whom correspondence should be addressed.
Geosciences 2018, 8(8), 304; https://doi.org/10.3390/geosciences8080304
Submission received: 4 June 2018 / Revised: 1 August 2018 / Accepted: 7 August 2018 / Published: 14 August 2018

Abstract

:
Arundo donax (giant reed) is a large, perennial grass that invades semi-arid riparian systems where it competes with native vegetation and modifies channel geomorphology. For the Santa Clara River, CA, changes in channel width and intensity of braiding over several decades are linked in part to high flow events that remove A. donax. Nevertheless, the area of A. donax at the two study sites increased fivefold over a period of 28 years at one site and fourfold over 15 years at the second site. Effects of A. donax on bank stability are compared to those of a common native riparian tree—Salix laevigata (red willow)—at two sites on the banks and floodplain of the Santa Clara River. There is a significant difference of root density of A. donax compared to S. laevigata and the latter has a higher number of roots per unit area at nearly all depths of the soil profile. Tensile root strength for S. laevigata (for roots of 1–6 mm in diameter) is about five times stronger than for A. donax and adds twice the apparent cohesion to weakly cohesive bank materials than does A. donax (8.6 kPa compared to 3.3 kPa, respectively). Modeling of bank stability for banks of variable height suggests that S. laevigata, as compared to A. donax, increases the factor of safety (FS) by ~60% for banks 1 m high, ~55% for banks 2 m high and ~40% for banks 3 m high. For 3 m high banks, the FS for banks with A. donax is <1. This has geomorphic significance because, in the case of A. donax growing near the water line of alluvial banks, the upper 10–20 cm has a hard, resistant near-surface layer overlying more erodible banks just below the near-surface rhizomal layer. Such banks may be easily undercut during high flow events, resulting in overhanging blocks of soil and A. donax that slump and collapse into the active channel, facilitating lateral bank erosion. Therefore, there is a decrease in the lateral stability of channels if the mixed riparian forest is converted to dominance by A. donax.

1. Introduction

1.1. Objectives and Significance of the Research
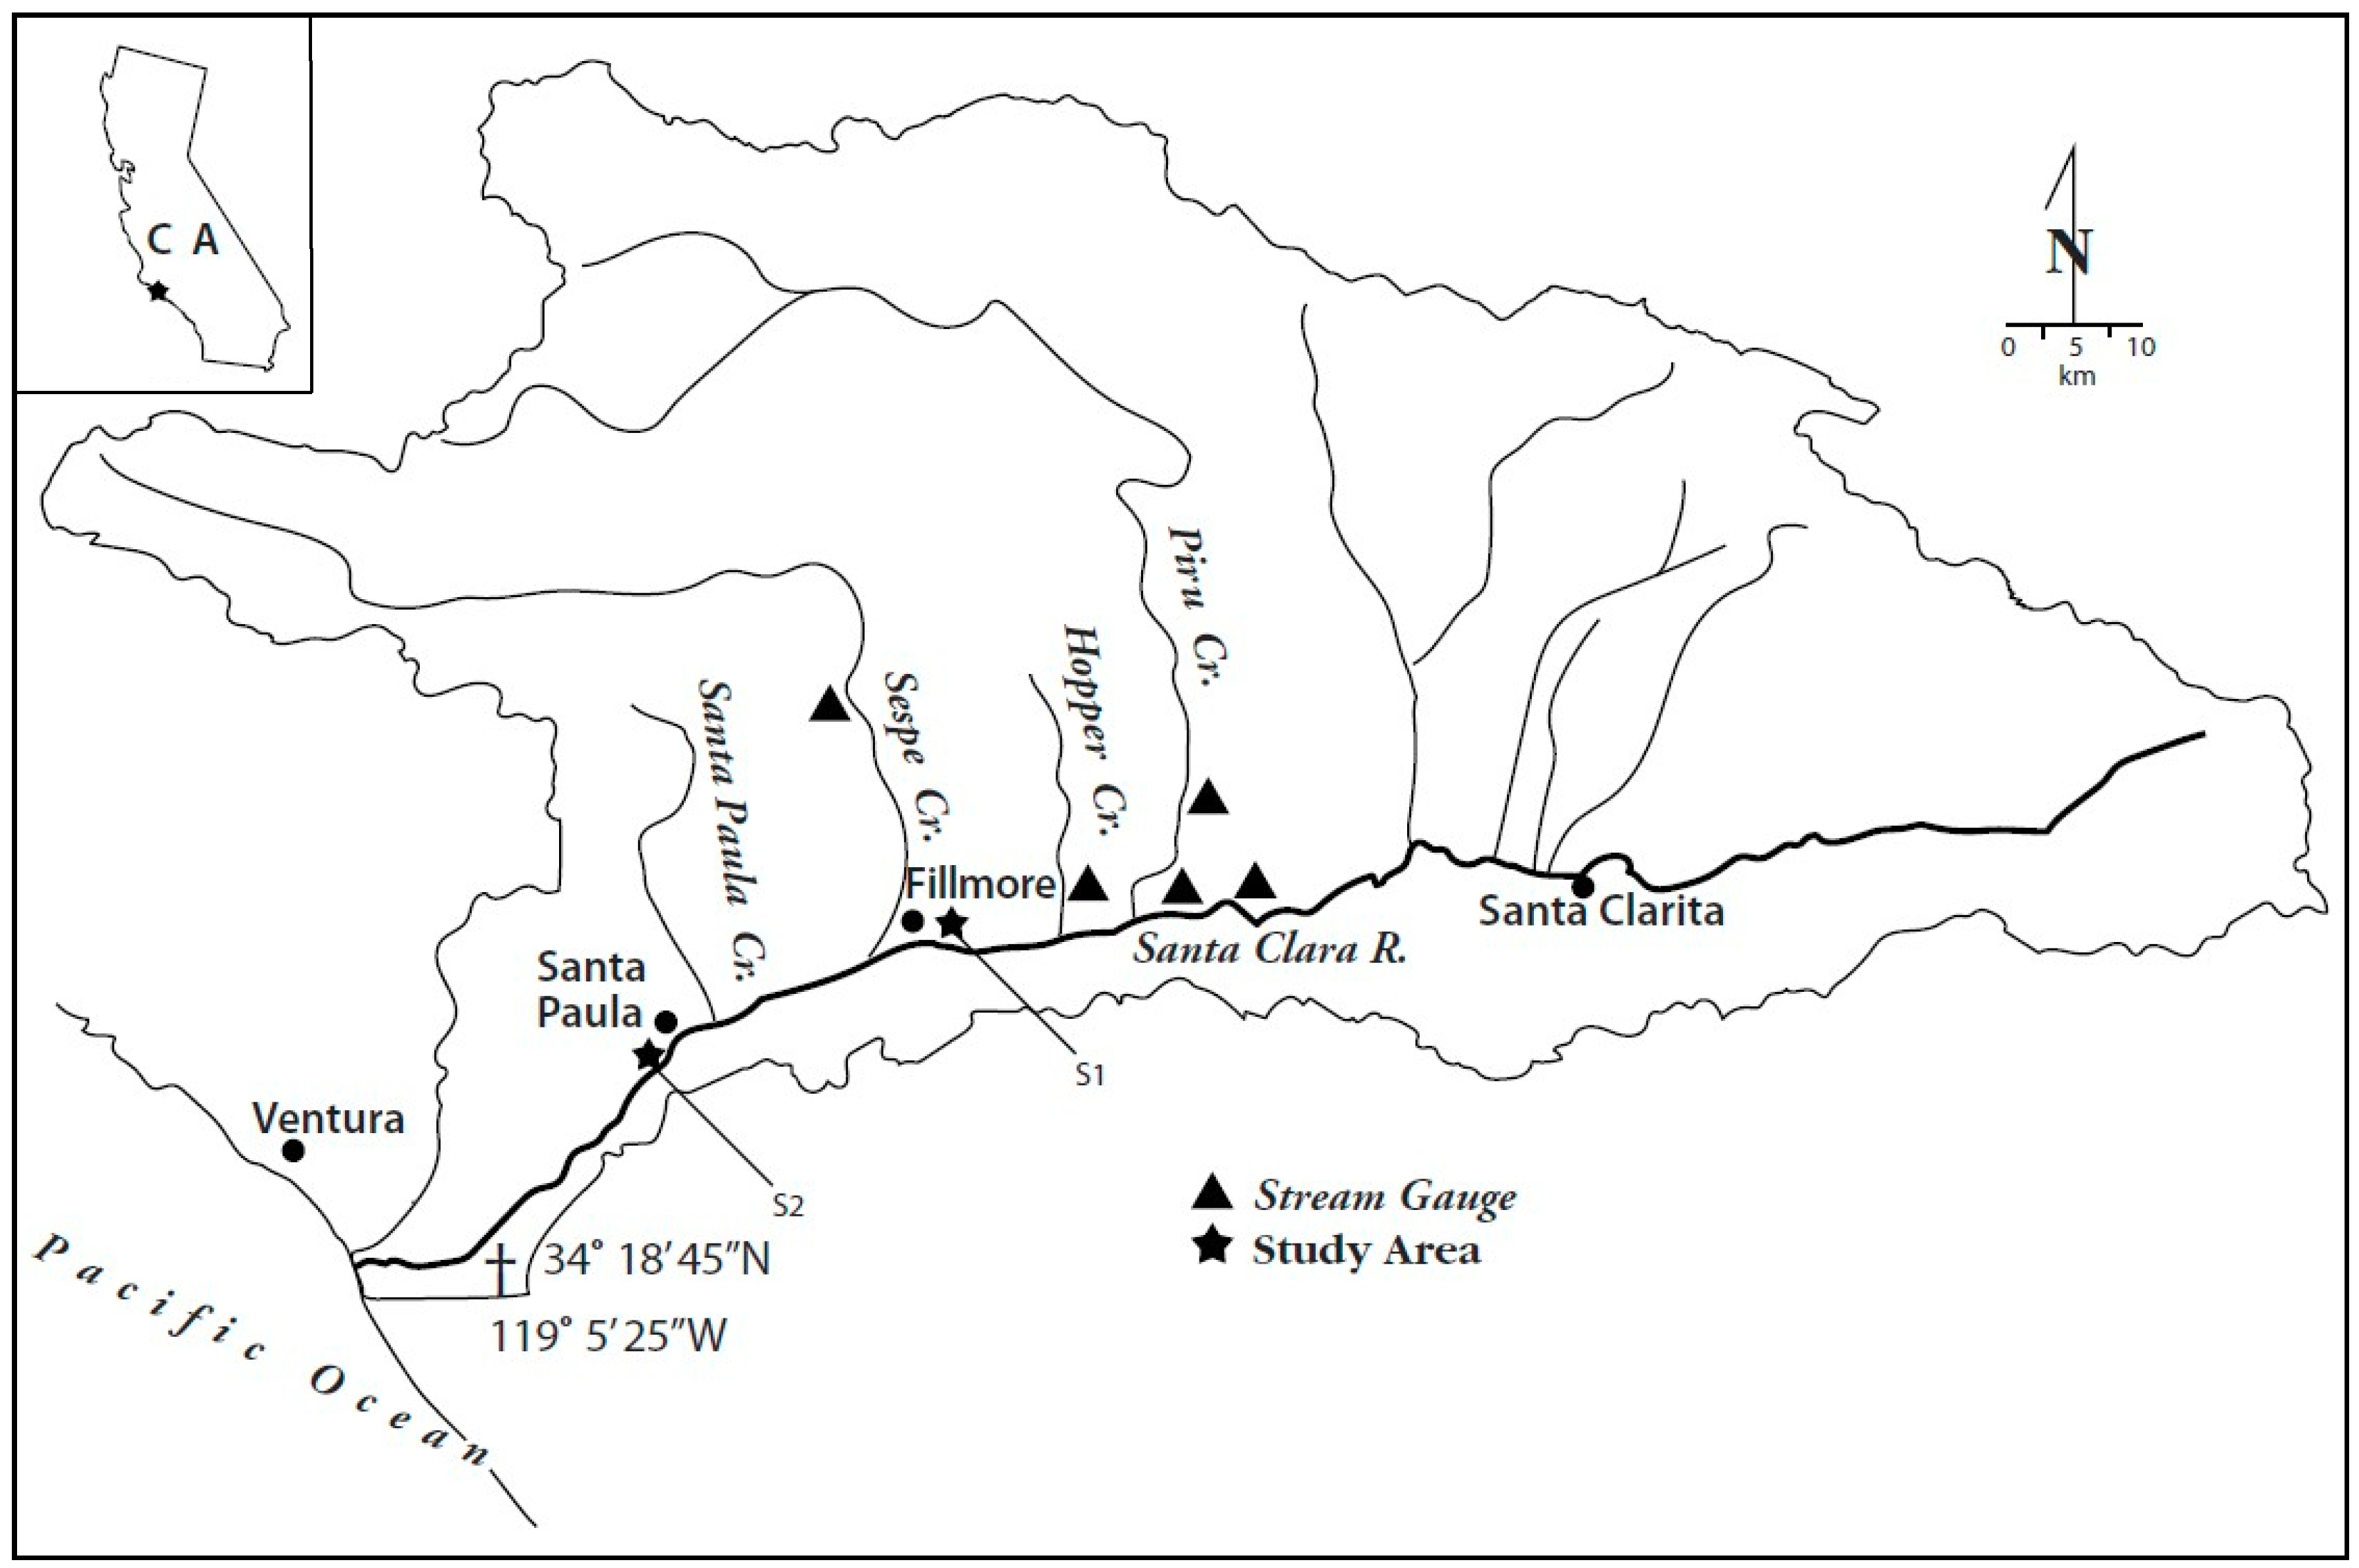
Arundo donax (giant reed) is a large, invasive reed-like grass that outcompetes native vegetation in many riparian settings in the southwestern United States [1]. If its dominance increases, the implications for riparian function and channel dynamics in the American Southwest are unknown. Other studies in rivers where A. donax is present have noted some bank failure and lateral instability but lacking are quantitative analyses of how the spatial distribution and mechanical properties of its roots may impact channel dynamics. The goal of this work is, thus, to better understand how A. donax influences channel form. Specific objectives are to: (i) estimate areal extent of A. donax over time and compare how magnitude of flood flow is linked to change in braiding and channel width; (ii) measure the root architecture, tensile root strength and apparent cohesion of A. donax; (iii) compare its root strength and root density with S. laevigata (red willow); and (iv) evaluate these traits with respect to bank stability.
Arundo donax was compared to S. laevigata in this study because this native willow tree commonly grows in abundance on channel banks but is often one of the primary riparian taxa displaced by invasive A. donax. This study has ecological and anthropogenic importance because the growth and spread of A. donax poses a threat to: ecosystems and biodiversity as a result of reduction of native plant species that support native wildlife; urban and agriculture land due to changes in riparian dynamics and erosion processes; water resources by increasing evapotranspiration in the semi-arid landscape; and both urban and wildlands by increasing risk of wildfire (Arundo has dense stands that burn readily) [2]. There has not been significant quantification of impacts, reported in the literature, of plants having morphology similar to this large reed grass on vegetation and fluvial processes. Reed grasses are a highly invasive group in riparian corridors in many regions across the U.S. and are considered a rising threat to both ecosystem diversity [3,4,5].

1.2. Study Area

This study was undertaken at two sites in the lower Santa Clara River in Ventura County, Southern California (Figure 1). Site S1 is 3.35 km long by ~0.5–1.0 km wide and S2 is 2.45 km long by ~0.25–0.5 km wide.
The Santa Clara River is the second largest river in Southern California, with a watershed area of approximately 4200 km2 and a mainstream that travels over 180 km from its headwaters to the Pacific Ocean [6,7]. Roughly 34% of the drainage basin (especially in the upper basin above Filmore) is controlled by dams [6] and for most of its length, the river is bounded by agricultural fields with shorter reaches under urban development. The Santa Clara River still retains a large floodplain with high quality riparian habitat for a number of endangered species, such as the Least Bell’s Vireo (Vireo bellii pusillus) and Southern California steelhead trout (Oncorhynchus mykiss) [8]. River discharge at various points along the channels varies considerably, depending on if a particular location is upstream or downstream of the confluence with Sespe Creek at Fillmore, CA. Sespe Creek is a major tributary in the Santa Clara River watershed, comprising roughly 20% of the total drainage basin area and contributing a significant part of the flood flows of the main stem of the Santa Clara River. This is important because the magnitude and timing of floods is linked to changes in channel morphology and abundance of A. donax.
The Santa Clara River is the focus of this study because the prominence of A. donax (Figure 2): allows for evaluation of channel form changes resulting from Arundo and testing of the hypothesis that A. donax alters bank strength characteristics and stability compared to other types of native vegetation, specifically S. laevigata (red willow, Figure 3), due to differences in its below-ground architecture.

1.3. Drainage Basin Characteristics

The Santa Clara watershed lies in a tectonically active area in the western Transverse Range in southern California. Faults and folds trend east-west, associated with north-south compression caused by the “big bend” of the right lateral strike-slip San Andreas fault which is near the northern and eastern boundary of the watershed [9,10,11].
The Santa Clara River Watershed drains to the Pacific Ocean, which in this Mediterranean-climate region has a moderating influence on temperatures with cool, wet winters and drier, warm summers. Also, El Nino, Southern Oscillation (ENSO)-driven winter storms recurring on a decadal time scale can lead to periodic high-magnitude flood events that can reconfigure channel morphology.
The climate of the Santa Clara River valley is such that most rainfall occurs in several large storms each year as opposed to more frequent, smaller storms. Unlike most rivers where channel planform is set by moderate recurrence interval and annual or bankfull floods, the morphology of the Santa Clara River is governed by high-magnitude, decadal scale episodic flood events [6].
The Santa Clara River is classified as a braided river, according to slope-discharge relationships [12,13]. Discharge is low most of the year and is typically confined to one stable low flow channel but occasionally with two or more low flow channels, especially following a flood event. The flux of water and sediment is impacted by several dams that store sediment [6], reducing sediment available to maintain a more persistent braided pattern. Ephemeral mid-channel islands are common. Some small islands (mid-channel bars) are defended by A. donax debris that wraps around the island (Figure 4). The river has an average slope of 0.0041 [6] and a bankfull discharge 1.5-year flow of about 184 m3/s (cms). Mean annual rainfall is 457 mm/year but can vary from 120 up to 1000 mm/year [14,15].

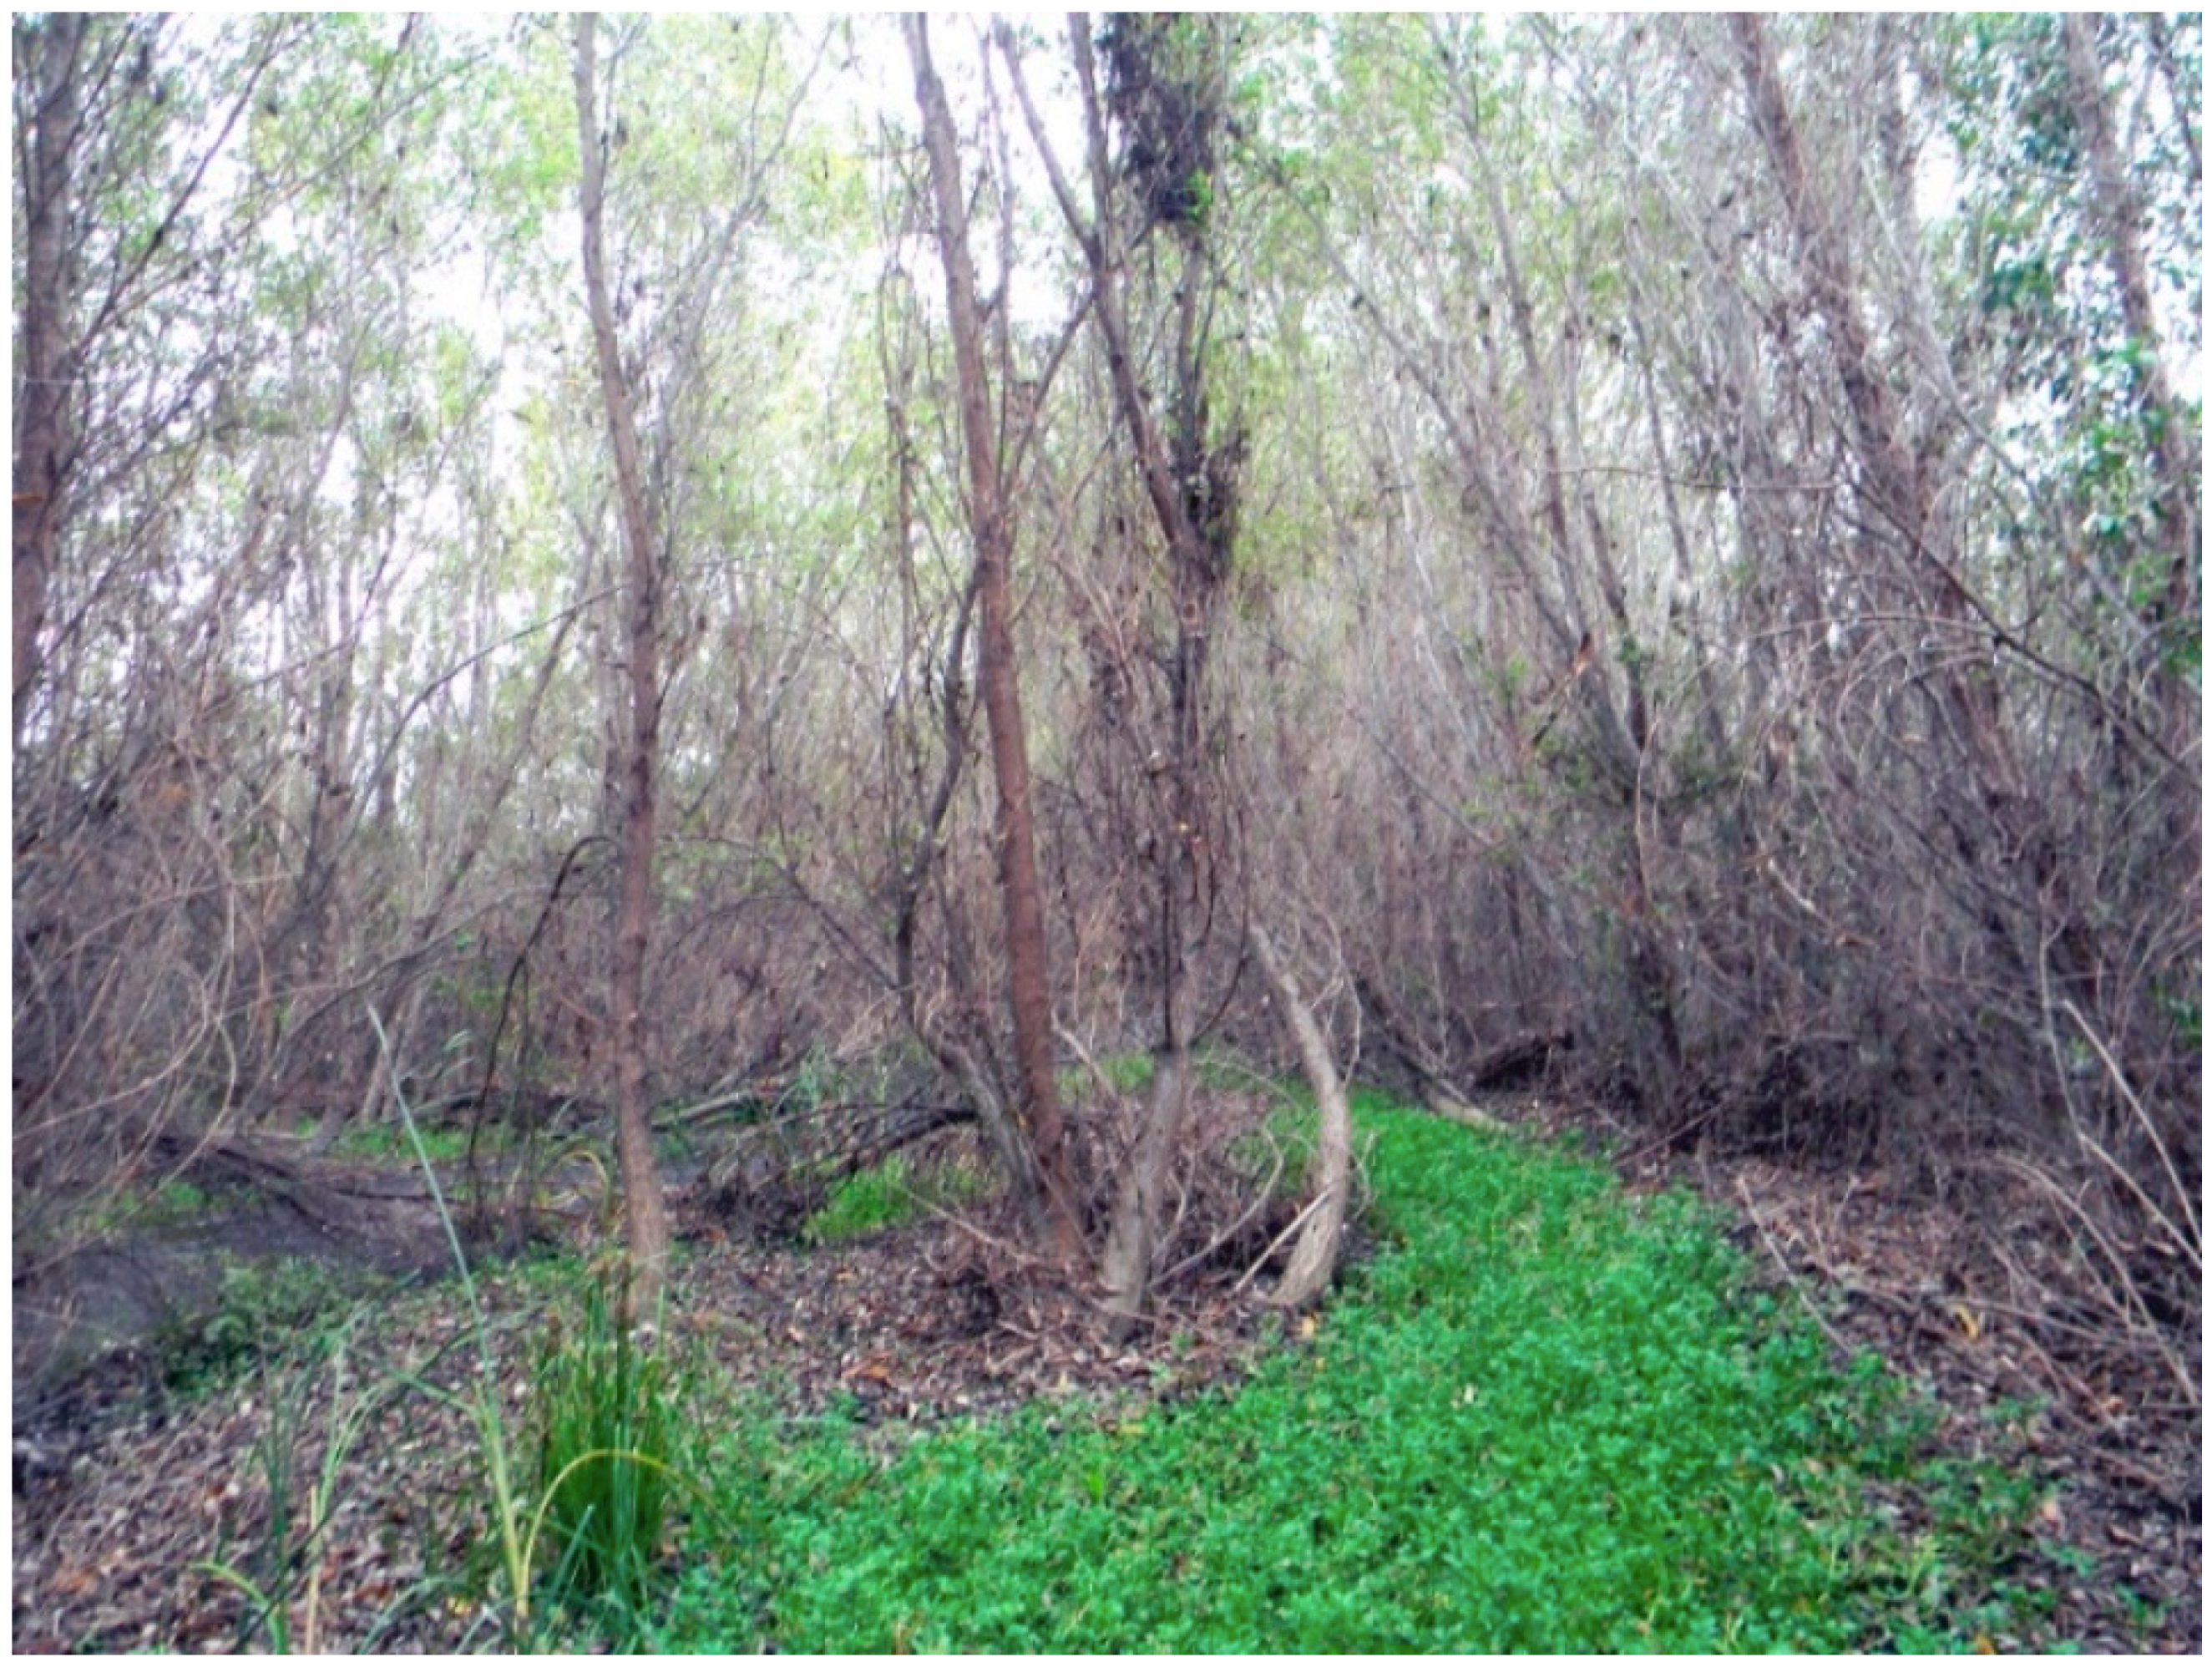
1.4. Arundo Donax Biology

Arundo donax is a perennial grass in the family Poaceae, which forms dense, clonal stands that can reach heights of >6 m (Figure 2). A. donax is native to tropical and subtropical regions in Europe and Asia but is an invasive, non-native species in Mediterranean climate regions, including California [1]. A. donax has spread rapidly during the last 40 years due to anthropogenic disturbances, such as flood control, cultivation of river floodplains and increased wildfire in riparian systems in California [4]. While there has been very little quantification of the depth and sizes of the root-rhizome complex for A. donax, it is generally known to produce a massive, shallow (<0.5 m deep) and laterally spreading rhizome [1,3].
A. donax does not produce viable seeds in North America [16] but instead spreads locally through vegetative reproduction by sprouting of buds on the rhizome [17] and along the riparian corridor via high-flow transport of rhizomes which are subsequently deposited on bar surfaces or lodged in debris or standing vegetation.

1.5. Previous Work

The emerging subject of ecogeomorphology explores linkages between organisms and landforms. In this study, we are studying linkages between an invasive riparian plant and stream processes. The role of vegetation as a primary control on fluvial form and process has been studied for decades [18,19,20,21,22,23,24,25,26,27,28,29,30,31,32,33,34]; however, anthropogenic disturbances and climate change may amplify the impacts of invasive species on river morphology and ecology, justifying an evaluation of the effect of A. donax on stream functions.
Research on the role of root strength on slope stability is a mature field of inquiry. Vegetation adds both mechanical and hydraulic effects to bank stability. The effect of vegetation is highly variable and is a function of the age, type and growing environment, as well as the amount and strength of roots of the plant. As shear stress is applied to bank materials, some of this load is transferred to the roots as the soil-root matrix is mobilized [19,23,25,35,36]. Roots add to the overall cohesion forces of soils, also known as the apparent cohesion, through the adhesive and frictional forces between the roots and the surrounding soil particles.
The above review of linkages between fluvial geomorphology and various types of riparian vegetation addresses the general concepts of how riparian vegetation functions in the river system. We now address A. donax in terms of the stated research objectives to better understand more about how this invasive plant is influencing the Santa Clara River.

2. Methods

2.1. Peak Discharge

Channel morphology and change in abundance of A. donax for the Santa Clara River is linked to the magnitude and timing of floods. Aerial photo analysis of channel morphology was completed for the two study sites S1 and S2. The study reaches do not have gauging stations. Estimations of the magnitude of peak discharges were made by summing the peak discharges from gauging stations (shown in Figure 1) located upstream and on all major tributaries leading to the study sites because two of the main tributaries are regulated by reservoirs. The peak data used from the different gauging stations were matched according to the date the peak was recorded at each station. For S1, the following gauging stations were used: USGS Santa Clara River near Piru, CA (#1110900); USGS Los Angeles County Line (#11108500); USGS Hopper Creek (#1110500); USGS Piru Creek below Santa Felicia Dam (#11109800); and VCWPD (Ventura County Watershed Protection District) Hopper Creek (#701). For S2, the data from all the aforementioned gauges were used and added to the discharge of USGS Sespe Creek near Fillmore, CA (#11113000). Some gauge locations only cover a limited or discontinuous range of dates, therefore to have a more complete record multiple gauges, were used interchangeably. Flood peak data from the USGS gauge on the Santa Clara River near Piru, CA was used interchangeably with data from the gauge on the Santa Clara River at the Los Angeles County Line. There were no overlapping records for these gauges where flow could be compared but it was assumed the discharge measured at each location would be in agreement because they are within 5 km of each other and there are no significant tributaries in between them. Data from the USGS gauge on Piru Creek below the Santa Felicia Dam, higher in the watershed, was used instead of the gauge on Piru Creek near Piru, CA, which is lower in the watershed, because it covered the desired range of dates. A comparison of the only overlapping data for the gauges on Piru Creek shows that the monthly averages for January through September of 1974 at each location on Piru Creek were roughly equivalent [8]. Peak discharges, estimated by adding the combined discharges from relatively close upstream gauges, provide a “ballpark” discharge at the study sites. Peak flows, so estimated, are assumed to be sufficiently accurate to compare robust channel change as a result of specific floods.

2.2. Channel Change over Time

A digital collection of historical non-orthorectified analog aerial photographs were acquired for two sites along the Santa Clara River: (S1) near the Fillmore Fish Hatchery in Fillmore, CA and (S2) in Santa Paula, CA. Aerial photos were acquired from 1978–2009 for S1 and 1966–2009 for S2 (Table 1 and Table 2). The historical photographs did not contain the necessary camera reports to orthorectify them, so they were georeferenced to a 2009 NAIP orthorectified photo (or orthophoto) that was scanned at 1 m pixel resolution and referenced to California UTM Zone 11, North American Datum 1983 (data available from USGS). The historical photos were scanned at 0.5–3 m pixel resolution, depending on the photo source and georeferenced to the orthophoto. A minimum of 5 control points that remained unchanged between the historical photo and the orthophoto, such as freeway ramps, barns and buildings, were used to reference each photograph using ESRI’s ArcMAP version 9.3 GIS software. The georeferencing created absolute positioning errors of less than 5 m and measurements made on the georeferenced historical photos were accurate to ±3 m (depending on the scanned resolution of the photo). Once georeferenced, 10 valley-normal cross sections for each site were overlaid on the study reaches along which changes in channel form were determined. Cross sections for S1 were spaced ~400 m and spacing for S2 was ~200 m.
Active channel width is defined as the width from boundary to boundary where actively scoured channels can be seen on aerial photographs (i.e., areas of the channel where there is a bare or sparsely vegetated channel bed where it can be presumed that flow is actively scouring and preventing the establishment of vegetation); vegetation width is the total width of dense, continuous vegetation in the channel and floodplain; and intensity of braiding is defined as the average number of downstream channels observed on aerial photographs from 10 cross sections for each reach for a particular photograph year (backwater and agricultural drainage channels were ignored). Measurements of active channel width and vegetation width were averaged over all the cross sections to derive one value for each category per photograph. Note, the average channel width, intensity of braiding and vegetation width were measured on aerial photographs following high magnitude flood events to help constrain the effect of discharge on each parameter.
Statistical tests using linear regression with peak discharge as the independent variable and intensity of braiding, active channel width and vegetation width were performed. A standard F-test was used to test for significance.
To estimate the maximum spatial distribution of stands of A. donax at each site, visual mapping was done on the photo years that corresponded to the greatest length of time since the last, large flooding event. Mapping was carried out on the available color-photo years 1981, 1992, 2004 and 2009 for site S1 and 1994, 1999, 2004 and 2009 for site S2. Focused mapping was done on the effects of the 2005 flood event for both, as the 2005 flood was the largest event during the study period.
For selected years at each site, the large, continuous, readily identifiable stands of A. donax were mapped.

2.3. Root Distribution and Tensile Strength Measurements

The distribution of root sizes at different depths in the bank profile was measured along excavated, vertical bank faces, using digital calipers and a frame measuring 50 cm × 50 cm which was divided into 25 individual sections measuring 10 cm by 10 cm each. Bank profiles were excavated by hand, using shovels to scrape away the outermost layer of sediment and brushes to gently extricate the remaining dirt from around the roots in order to expose them for measurement. Measurements took place in stands of A. donax and S. laevigata that were similar in age (10–15 years), moisture level within the channel and geographic proximity (within 30 km) in order to minimize climatic variation. The bank materials from the sites where plant roots were measured were variable but generally had a fining upward sequence from the basal river gravel to coarse sand, fine sand and some interbedded silt layers. The main difference between the bank material for the sites where S. laevigata and A. donax were collected is that A. donax was located in an agricultural drainage ditch adjacent to the river and the S. laevigata was in a side channel of the main river. Measurements were undertaken at the base of the plants where roots were directly attached to either the rhizomes or the trunk and support roots. In order to ensure that only A. donax and S. laevigata roots were being measured, respectively, the profiles were excavated along banks where each was the dominant species. Color and texture were also used as a means to distinguish between roots, insofar as S. laevigata roots tend to have a reddish hue, woody texture and dark colored bark, whereas A. donax roots are white or beige in color and have a fleshy texture.
Root tensile strengths are measured using the method of Abernethy and Rutherford [24], attaching one end of the root to a load cell, using a small metal clamp which then is attached to a metal frame and then pulling on the root with a constant, small amount of force that is parallel to the orientation of the root. Analysis was done on root tensile strength measured in the field compared to that measured in the lab for a common root size (0.8 mm) for this study and no significant difference was found between the lab and field results (Chi Square, p > 0.05), which agrees with the observations of Abernethy and Rutherford [24]. Each root collected in the field was measured within hours of collection [24]. The roots were trimmed to the same length (10 cm), with one end attached to a work-bench clamp and the other to a load cell attached to the root puller frame. The diameter at point of rupture was measured, as well as the peak load. The data for root size and tensile strength was regressed using a power function in the form of y = axb, which is the relationship most commonly found in the literature [25]. The root area ratio (RAR) of the roots in a bank profile is a useful statistic to indicate root density [24,25] and as a surrogate for below-ground biomass. RAR is expressed by:
Ar/Ab = Σ ai/Ab,
where Ar is the sum of all root areas a for a given cross sectional area of the bank profile i and Ab is the total cross section area of the bank profile [24]. For this study, 89 individual tensile root strength measurements were recorded for A. donax and 43 for S. laevigata [8].
The cohesion due to roots was calculated using the model RipRoot developed by Pollen and Simon [36]. Simulating a fiber bundle model approach, the model follows simple rules whereby a load is applied to a bundle of (n) roots until it exceeds the strength of the weakest root [37]. After a root breaks, the load is then redistributed to the remaining (n − 1) roots. The load is continuously applied until all the roots break or the limit of the driving force on the bank is reached.
Root diameter and distribution were mapped along a vertical profile measuring 0.5 m wide and 1 m total in depth with 10 cm depth increments. A total of 5 profiles were completed in stands of A. donax directly below the plants and 3 directly beneath two trees of S. laevigata. All the profiles were completed in wet environments where the mean age of the A. donax and S. laevigata was assumed to be roughly equivalent.

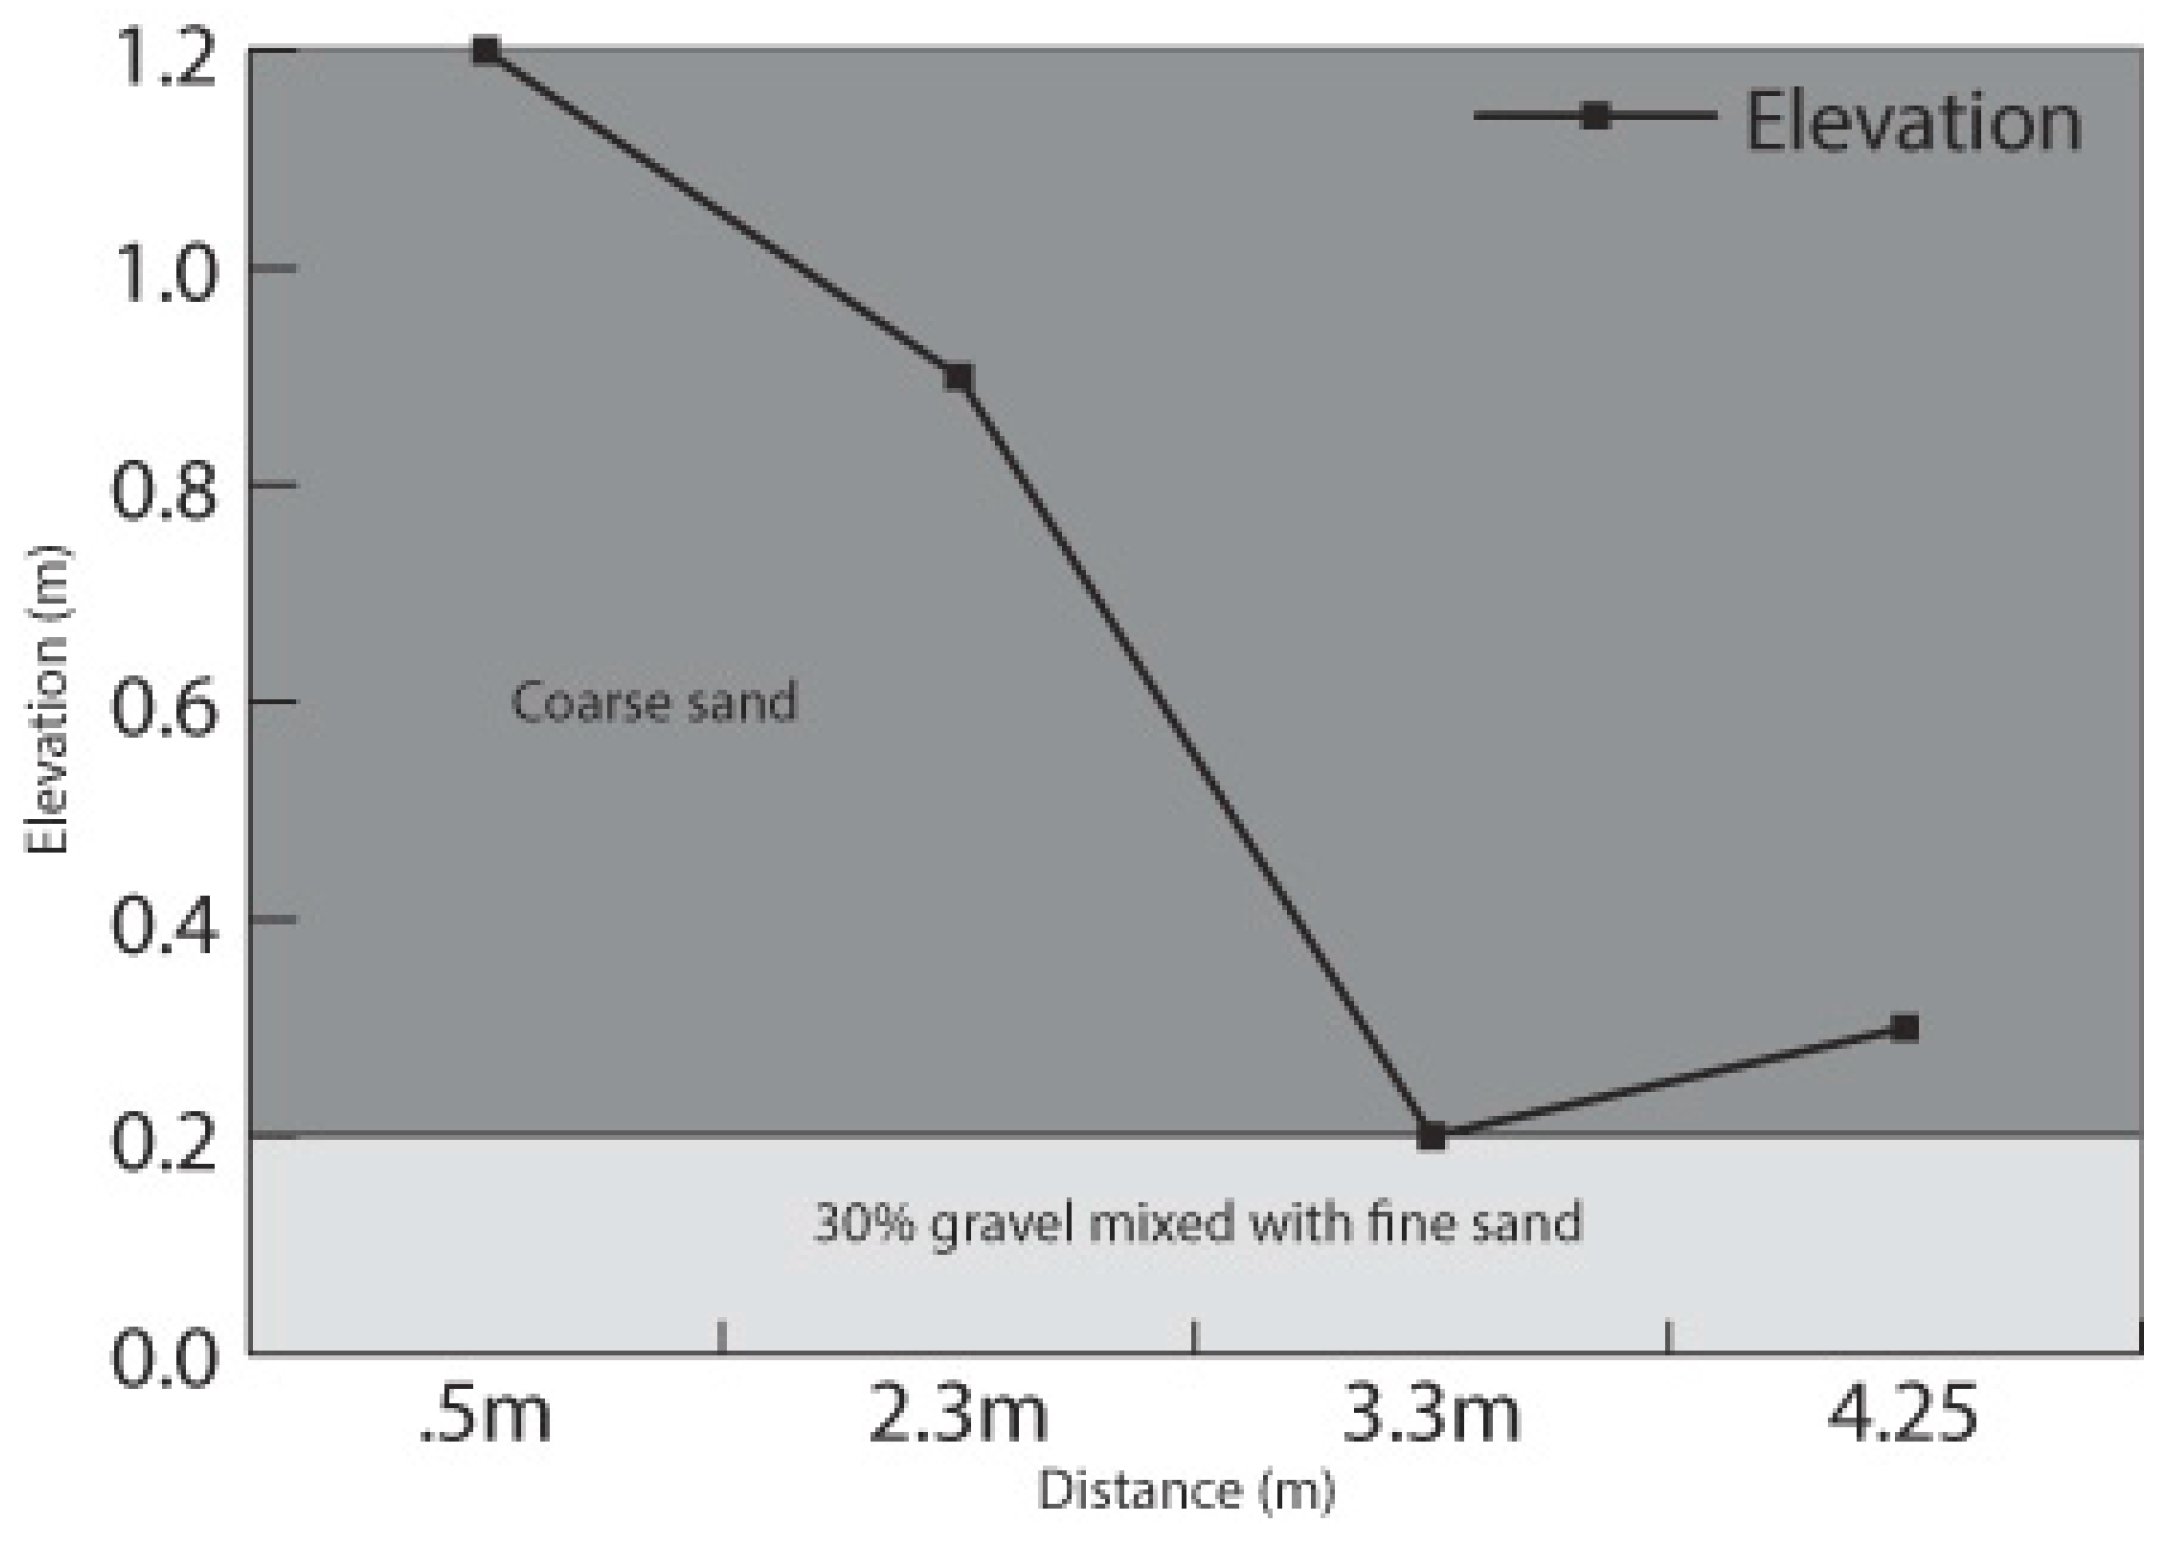
2.4. Experimental Modeling of Bank Stability

Bank stability was estimated using mechanical and hydrologic data to compute a factor of safety value by the model BSTEM v5.2 [38,39]. The Factor of Safety (FS) represents the balance between the resisting and driving forces acting on the bank. BSTEM, available as a Microsoft Excel spreadsheet tool [40], is a widely used mechanistic bank stability model designed for alluvial channels. It includes RipRoot as a root reinforcement tool to include vegetation in the BSTEM model [41].
An FS value of less than 1.0 is usually attributed to banks that will fail; however, in this model, banks with values between 1.0 and 1.3 are termed ‘conditionally stable’ to account for the potential inaccuracies of the input data. The model divides the bank profile into 5 horizontal layers (where each layer can have its own soil properties) and incorporates the confining pressure of the stream flow and changes in soil geotechnical properties with changes in moisture conditions according to the following equation [25]:
  FS = i ( c i L i + S i tan ϕ i b + [ W i cos β U i + P i cos ( α β ) ] tan ϕ i ) i ( W i sin β P i sin ( α β ) )  
where c i is the effective cohesion of layer i (kPa); Li is the length of the failure plane of layer i (m); Si is the force produced by matric suction on the unsaturated part of the failure plane (kN/m); Wi is the weight of layer i (kN/m); Ui is the hydrostatic-uplift force on the saturated portion of the failure surface of layer i (kN/m); Pi is the hydrostatic-confining force due to external water level of layer i and is normal to the bank face (kN/m); β is the angle of the failure plane (degrees); and α is the average bank angle which indicates the orientation of the confining force (degrees). The variables input into the model include: bank height, bank angle, channel slope, flow height, flow duration, bank soil type and properties, cohesion due to vegetation and water table height. Soil parameters used in the model, such as angle of internal friction and cohesion, are based on average values found by Simon and Collison [25] from collection of field data. These values were used in lieu of actual field data in this study, shown in Table 3.
Simon & Collison [25] showed that banks tend to fail when they are saturated, such as after a bankfull flood and flows on the receding limb of the hydrograph attack the lower part of the bank in combination with a reduction of the hydrostatic confining force. Following the methods of Pollen [29], banks were modeled in saturated conditions with flows at 30% of the bank height to simulate the waning flows of the receding limb of a flood. The effects of vegetation on bank stability are highly variable and unique to each location because the tensile strength of roots and of bank materials is a function of the climate and conditions in which they are located [24,25]. Regression analysis from this paper, as well as that from the literature, demonstrates the variable nature of the tensile strength of roots in general. In order to make the findings of this study more applicable to the general understanding of the differences between A. donax and other riparian vegetation, the bank stability modeling was carried out on theoretical banks where all factors were held constant except for bank height and bank material. One channel bar from the Santa Clara River was surveyed and modeled in order to have one bank that was based on actual bank topography for the Santa Clara River. Input values for the model of the surveyed profile are shown in Table 4.
Table 5 presents the root size class distribution used to calculate cohesion due to roots. Because the two Salix trees were measured directly below the trunk and were inundated, causing the trunks to be buried, the trunks were not used in the estimations of cohesion due to roots. The model input divides the root diameters into size classes that are averaged over 1 m depth of bank.

3. Results

3.1. Peak Discharges

Flood flow in the Santa Clara River is linked in part to changes in channel width and braiding intensity. Selected peak discharges were estimated for S1 and S2 (see Table A1 and Table A2 (Appendix A)). Peak discharges in common for both sites were for eight years from 2000–2009 when data was available. For earlier years from 1959–1999, gauge data was not available for all years at both sites. Years for which flood discharges could be estimated and were useful to estimate change in vegetation, change in active channel width and change in intensity of braiding are: 1969 (3888 cms, S2), 1978 (801 cms, S1), 1994 (315 cms, S1 and 1251 cms, S2) and 2005 (1032 cms, S1 and 3449 cms, S2).

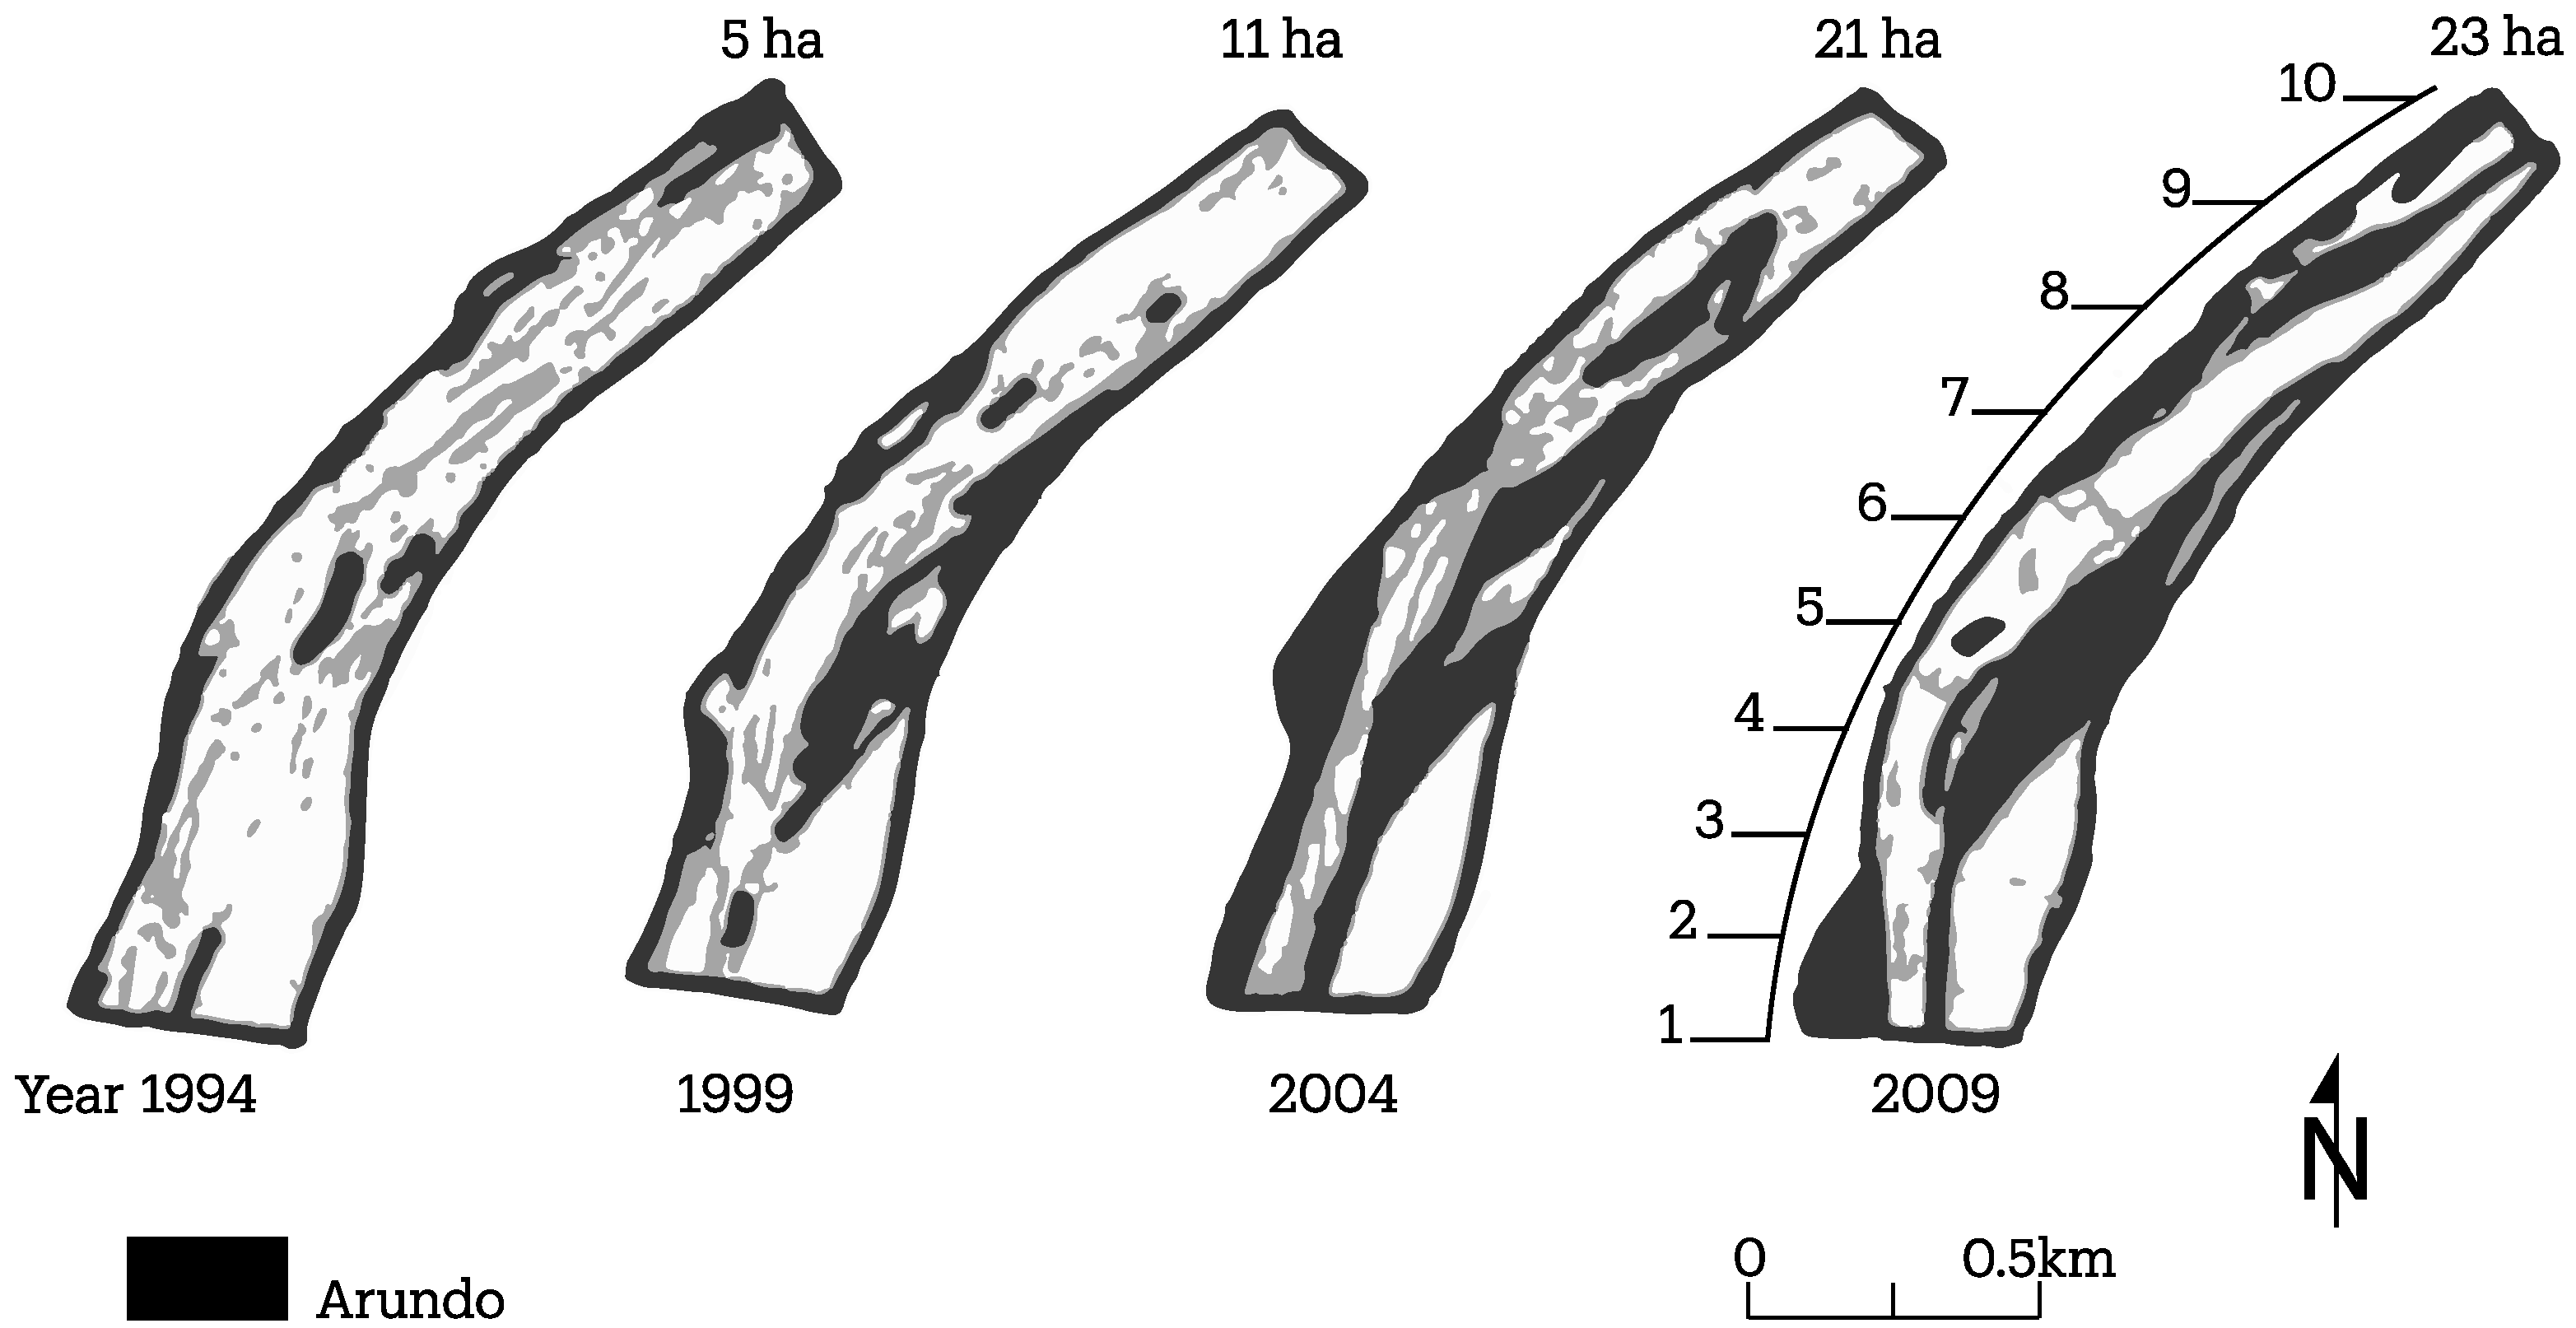
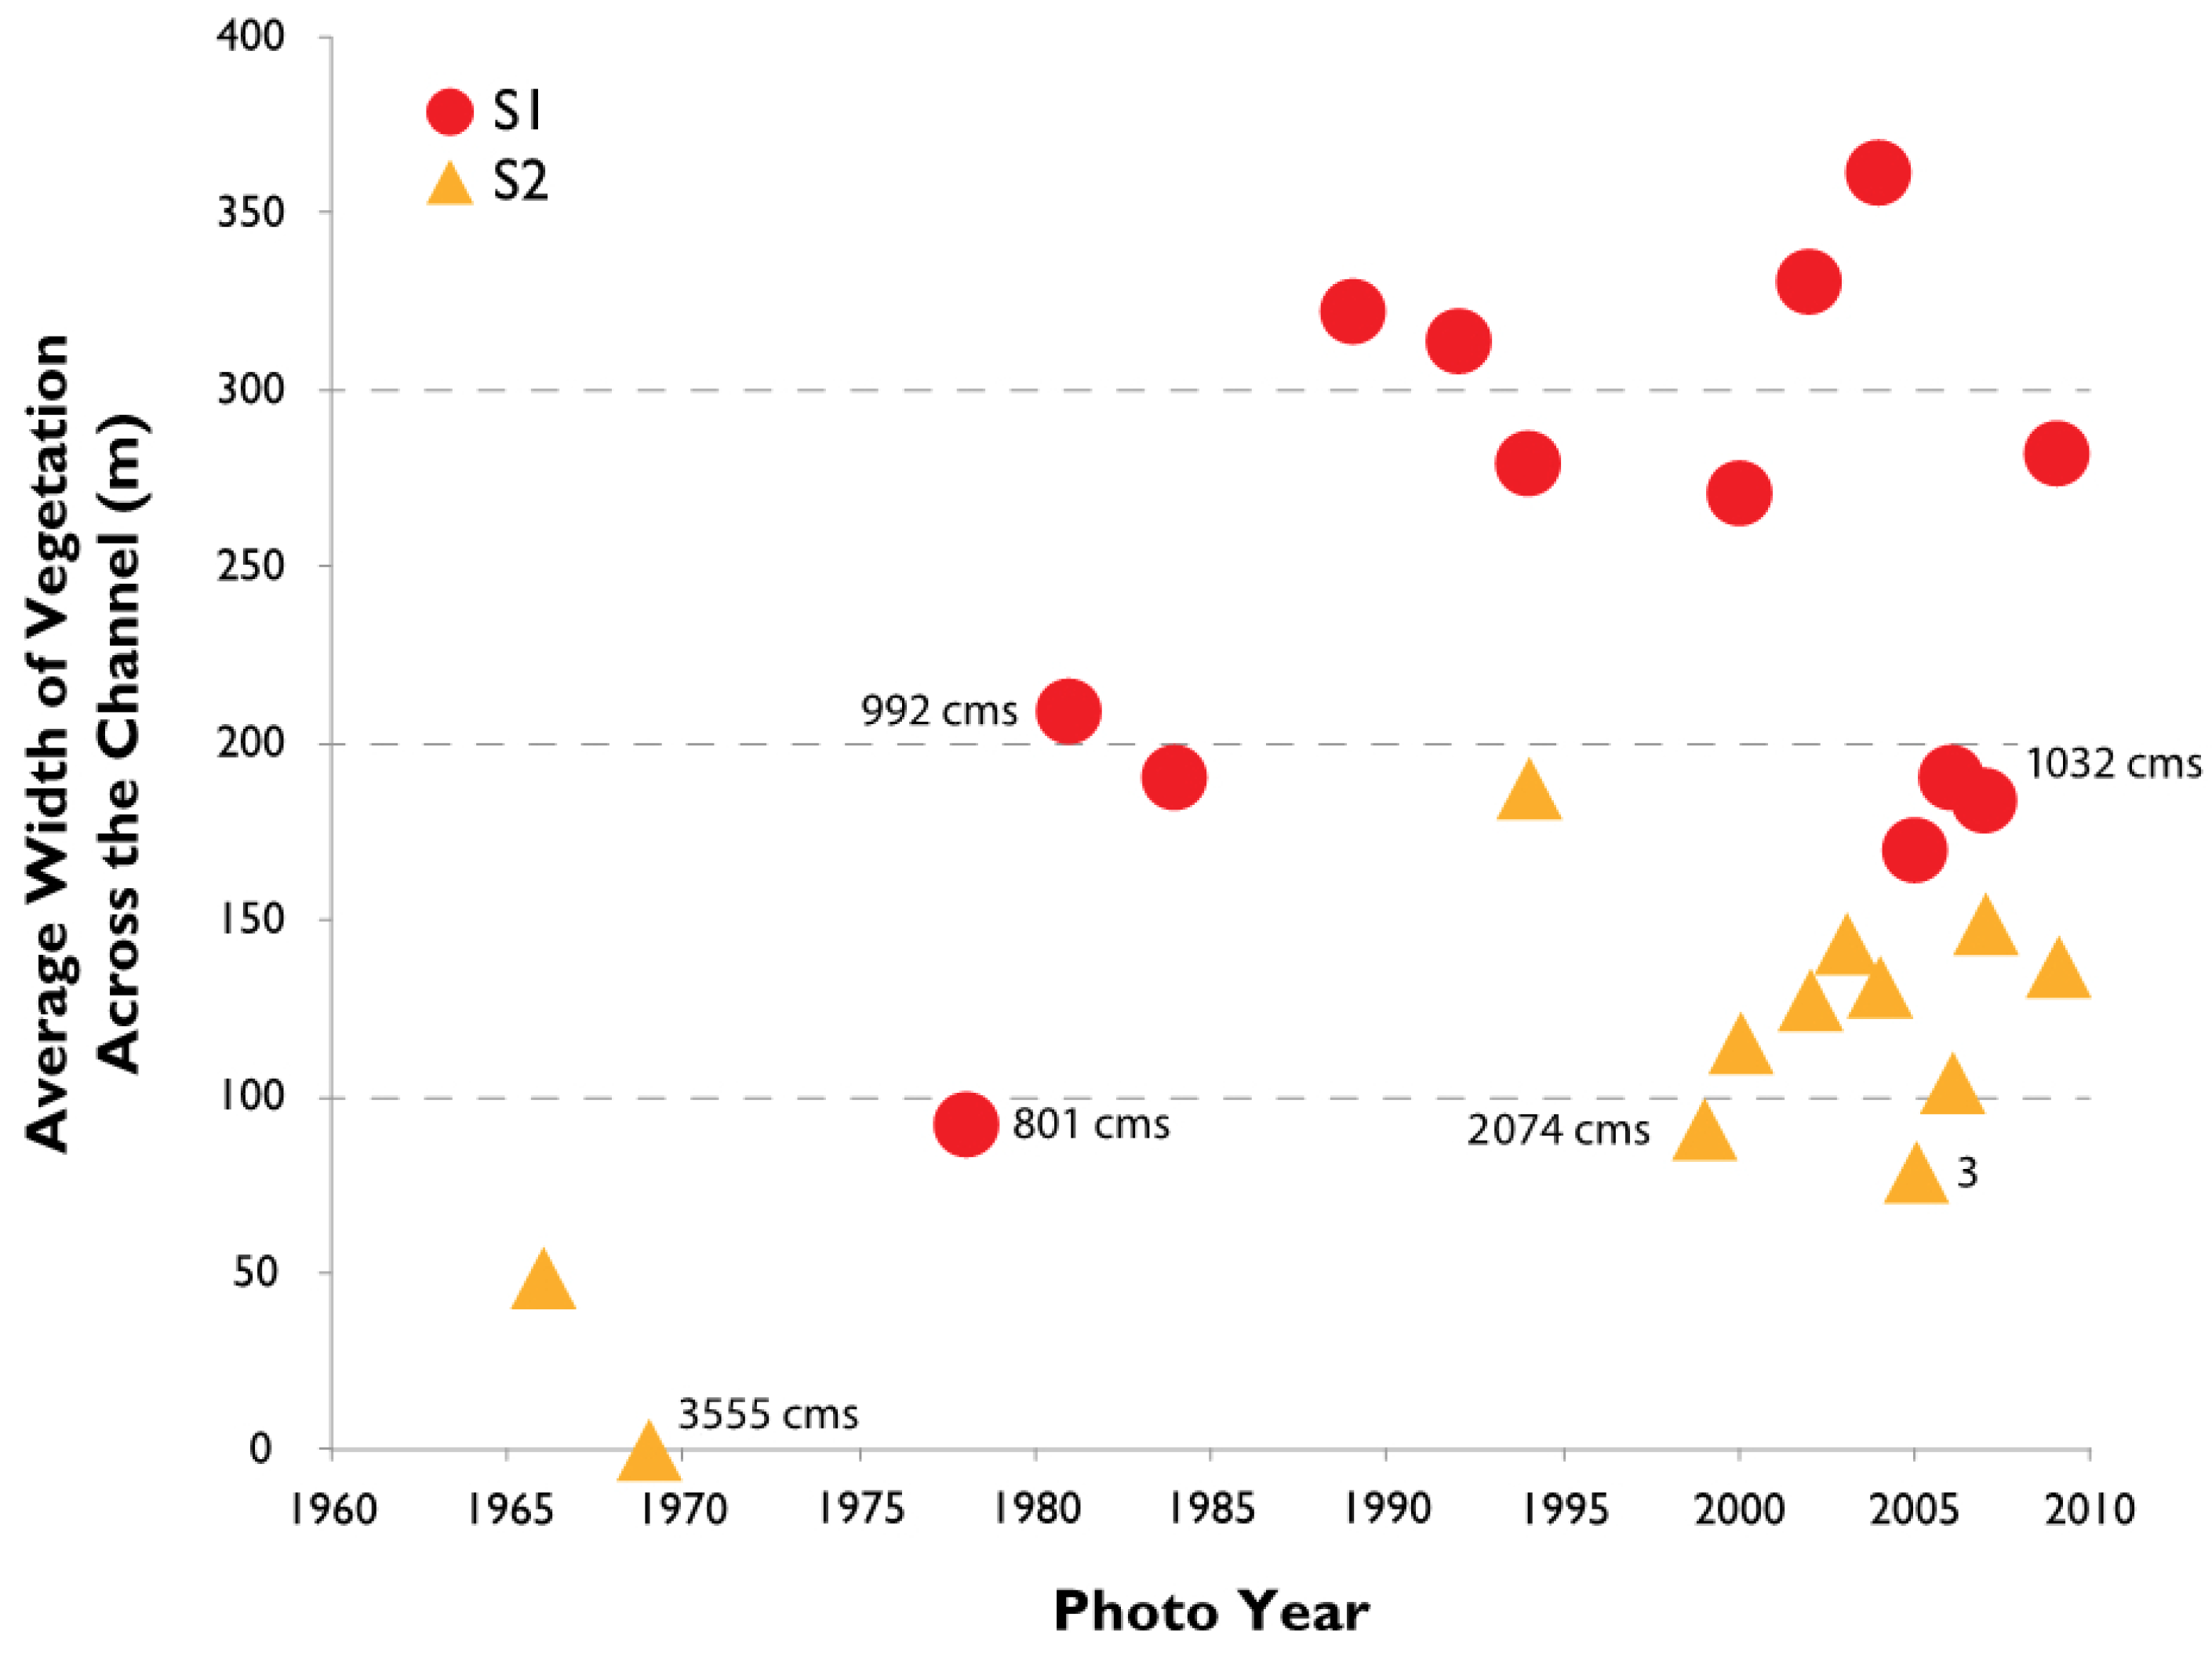
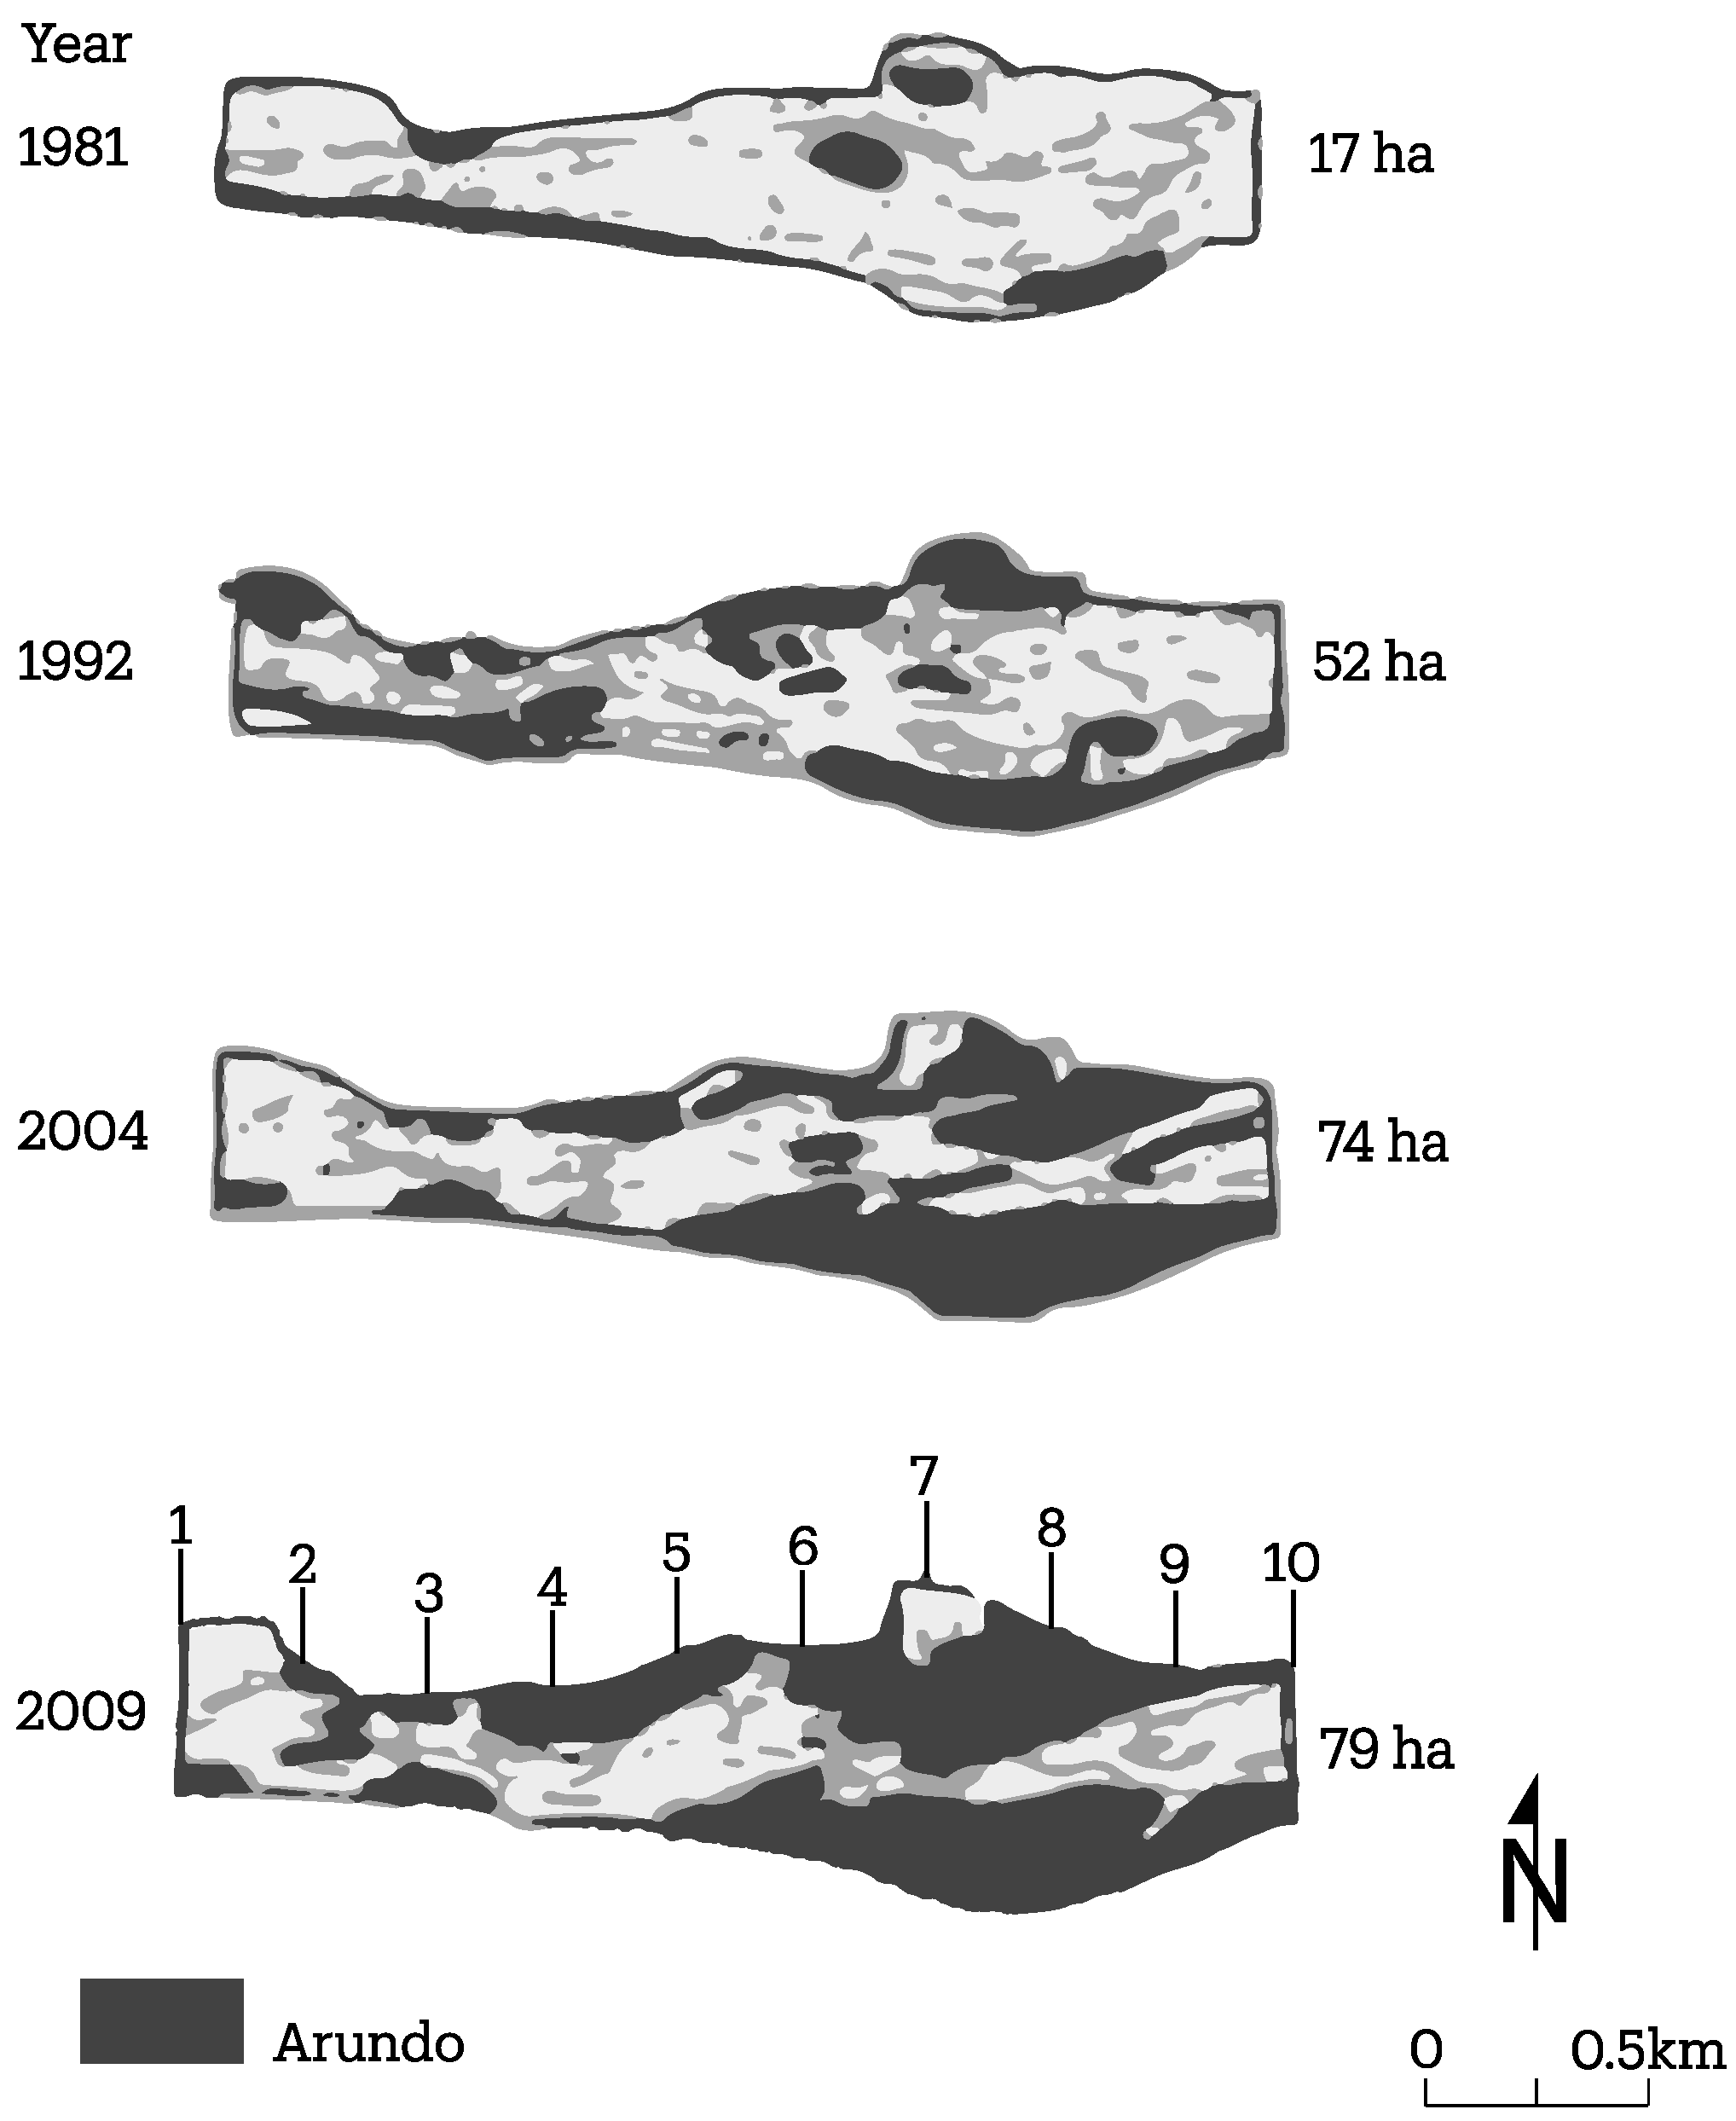
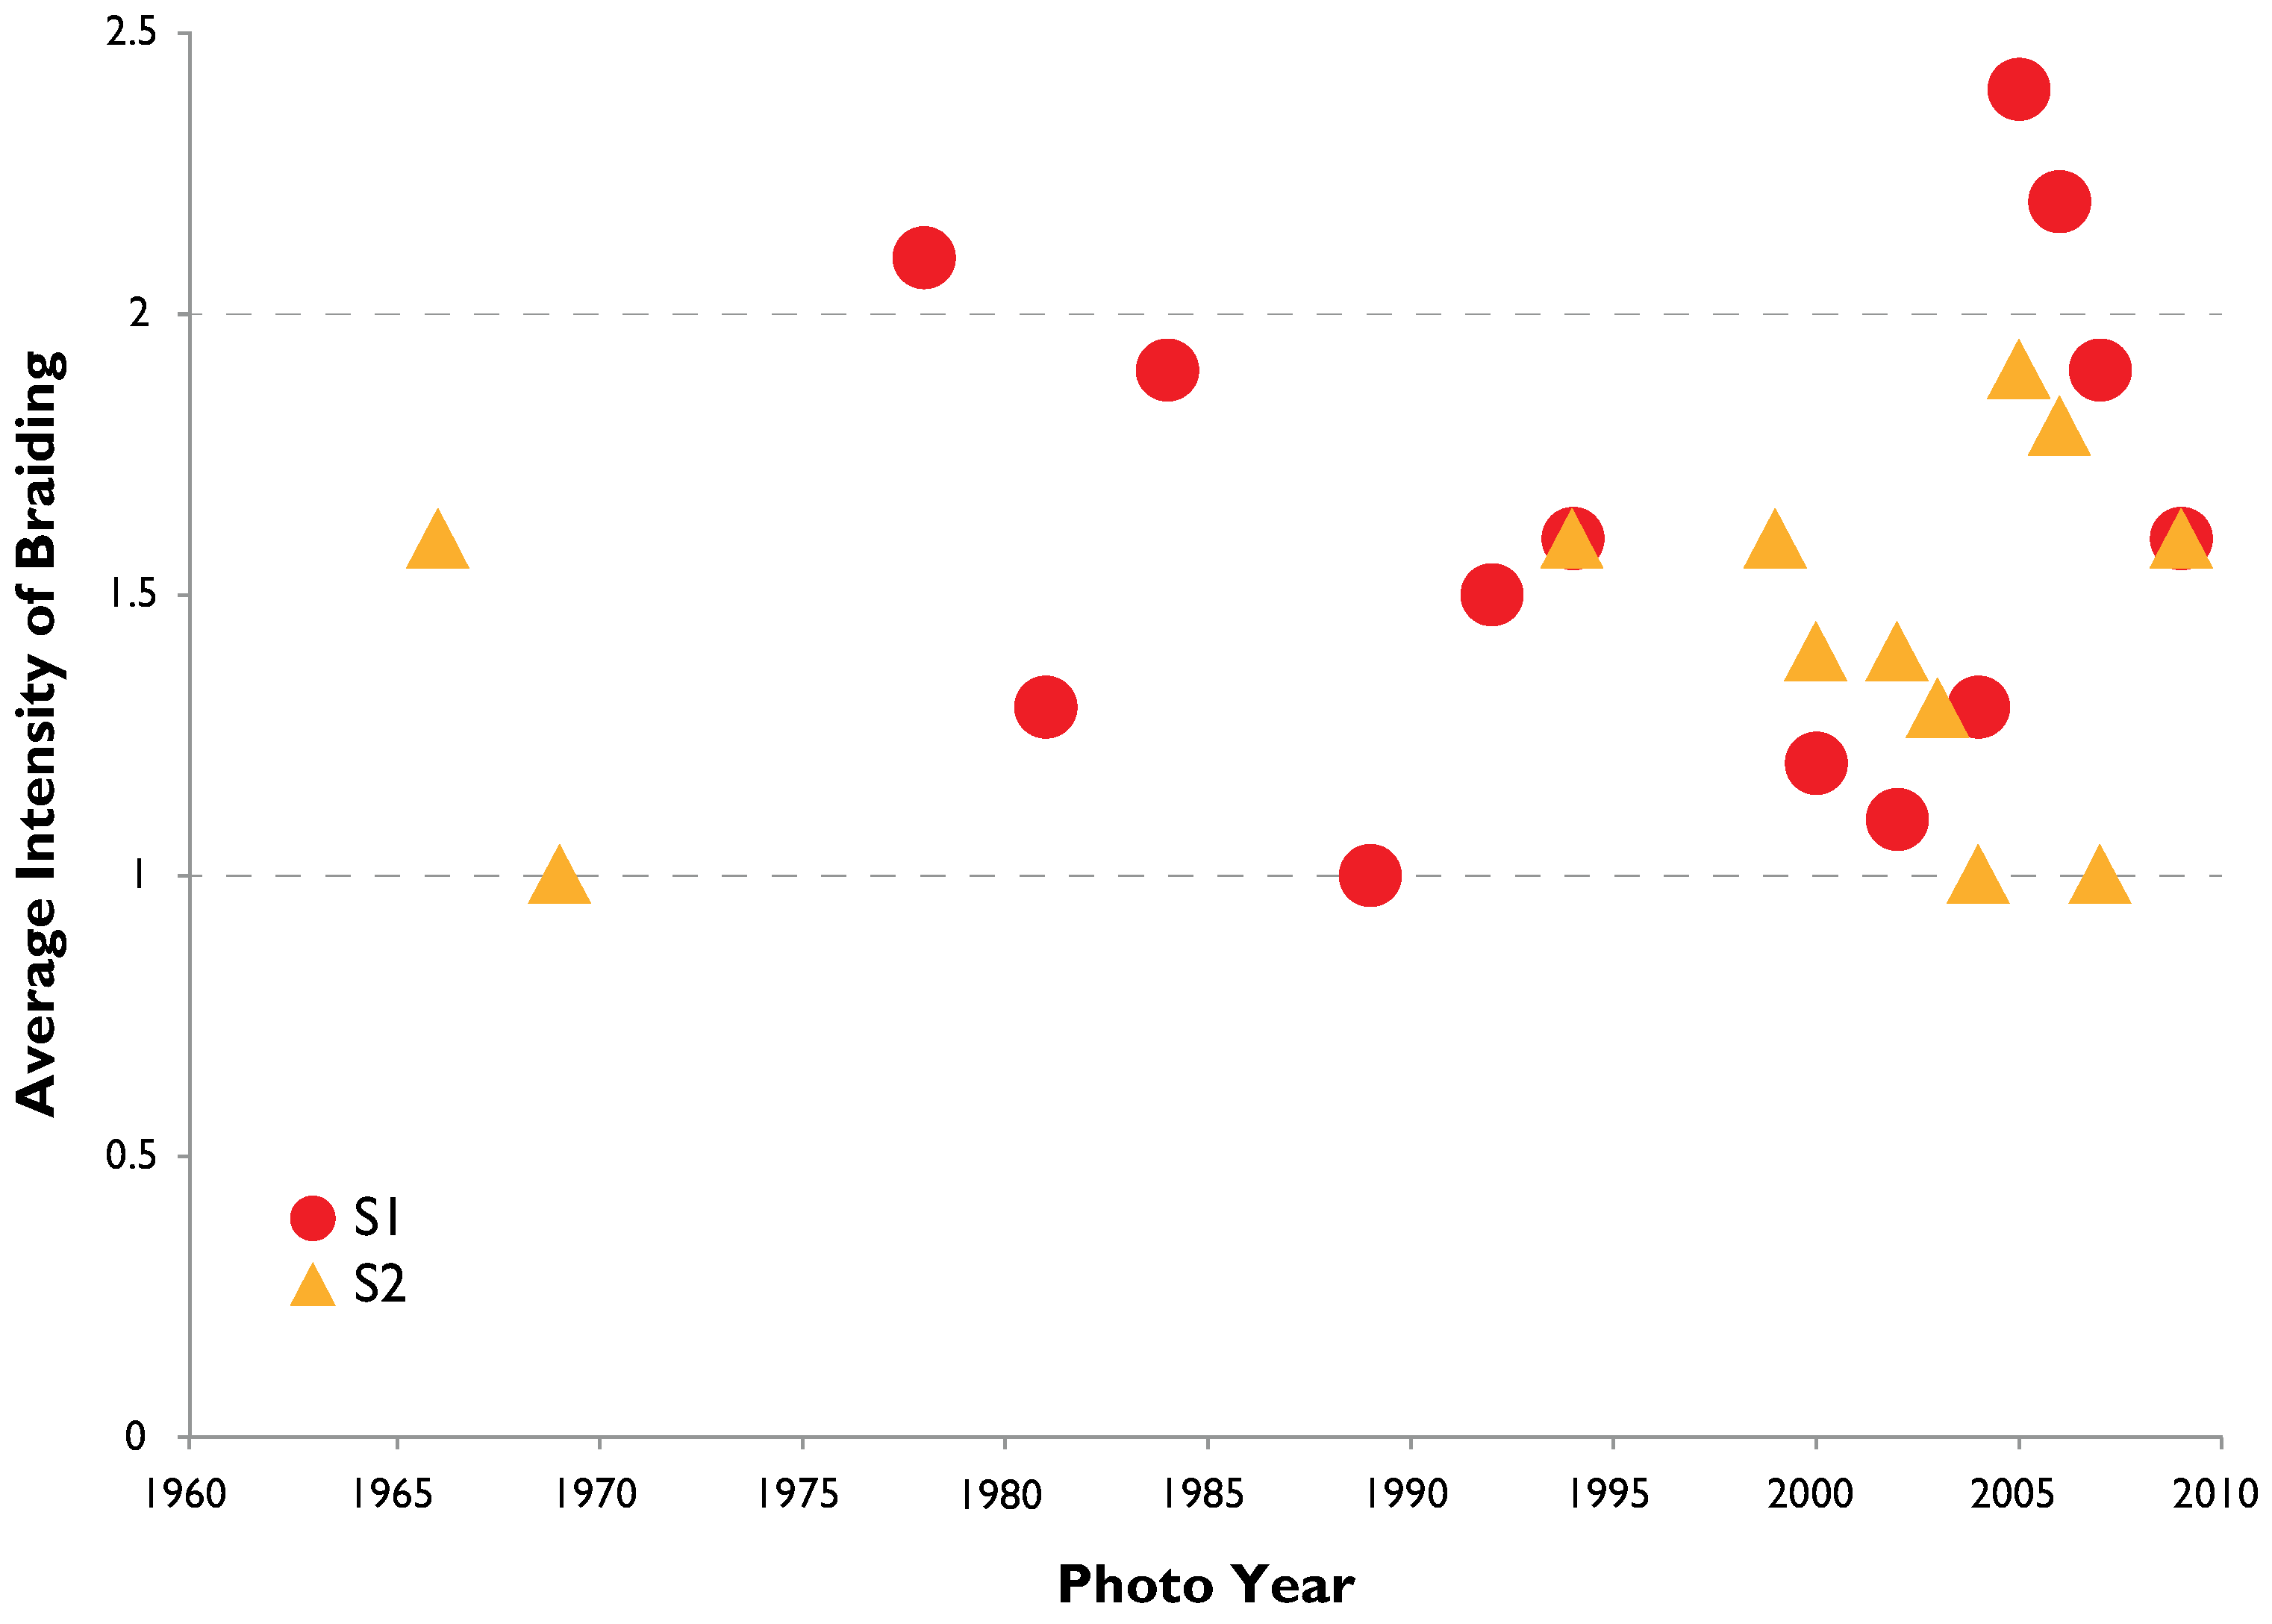
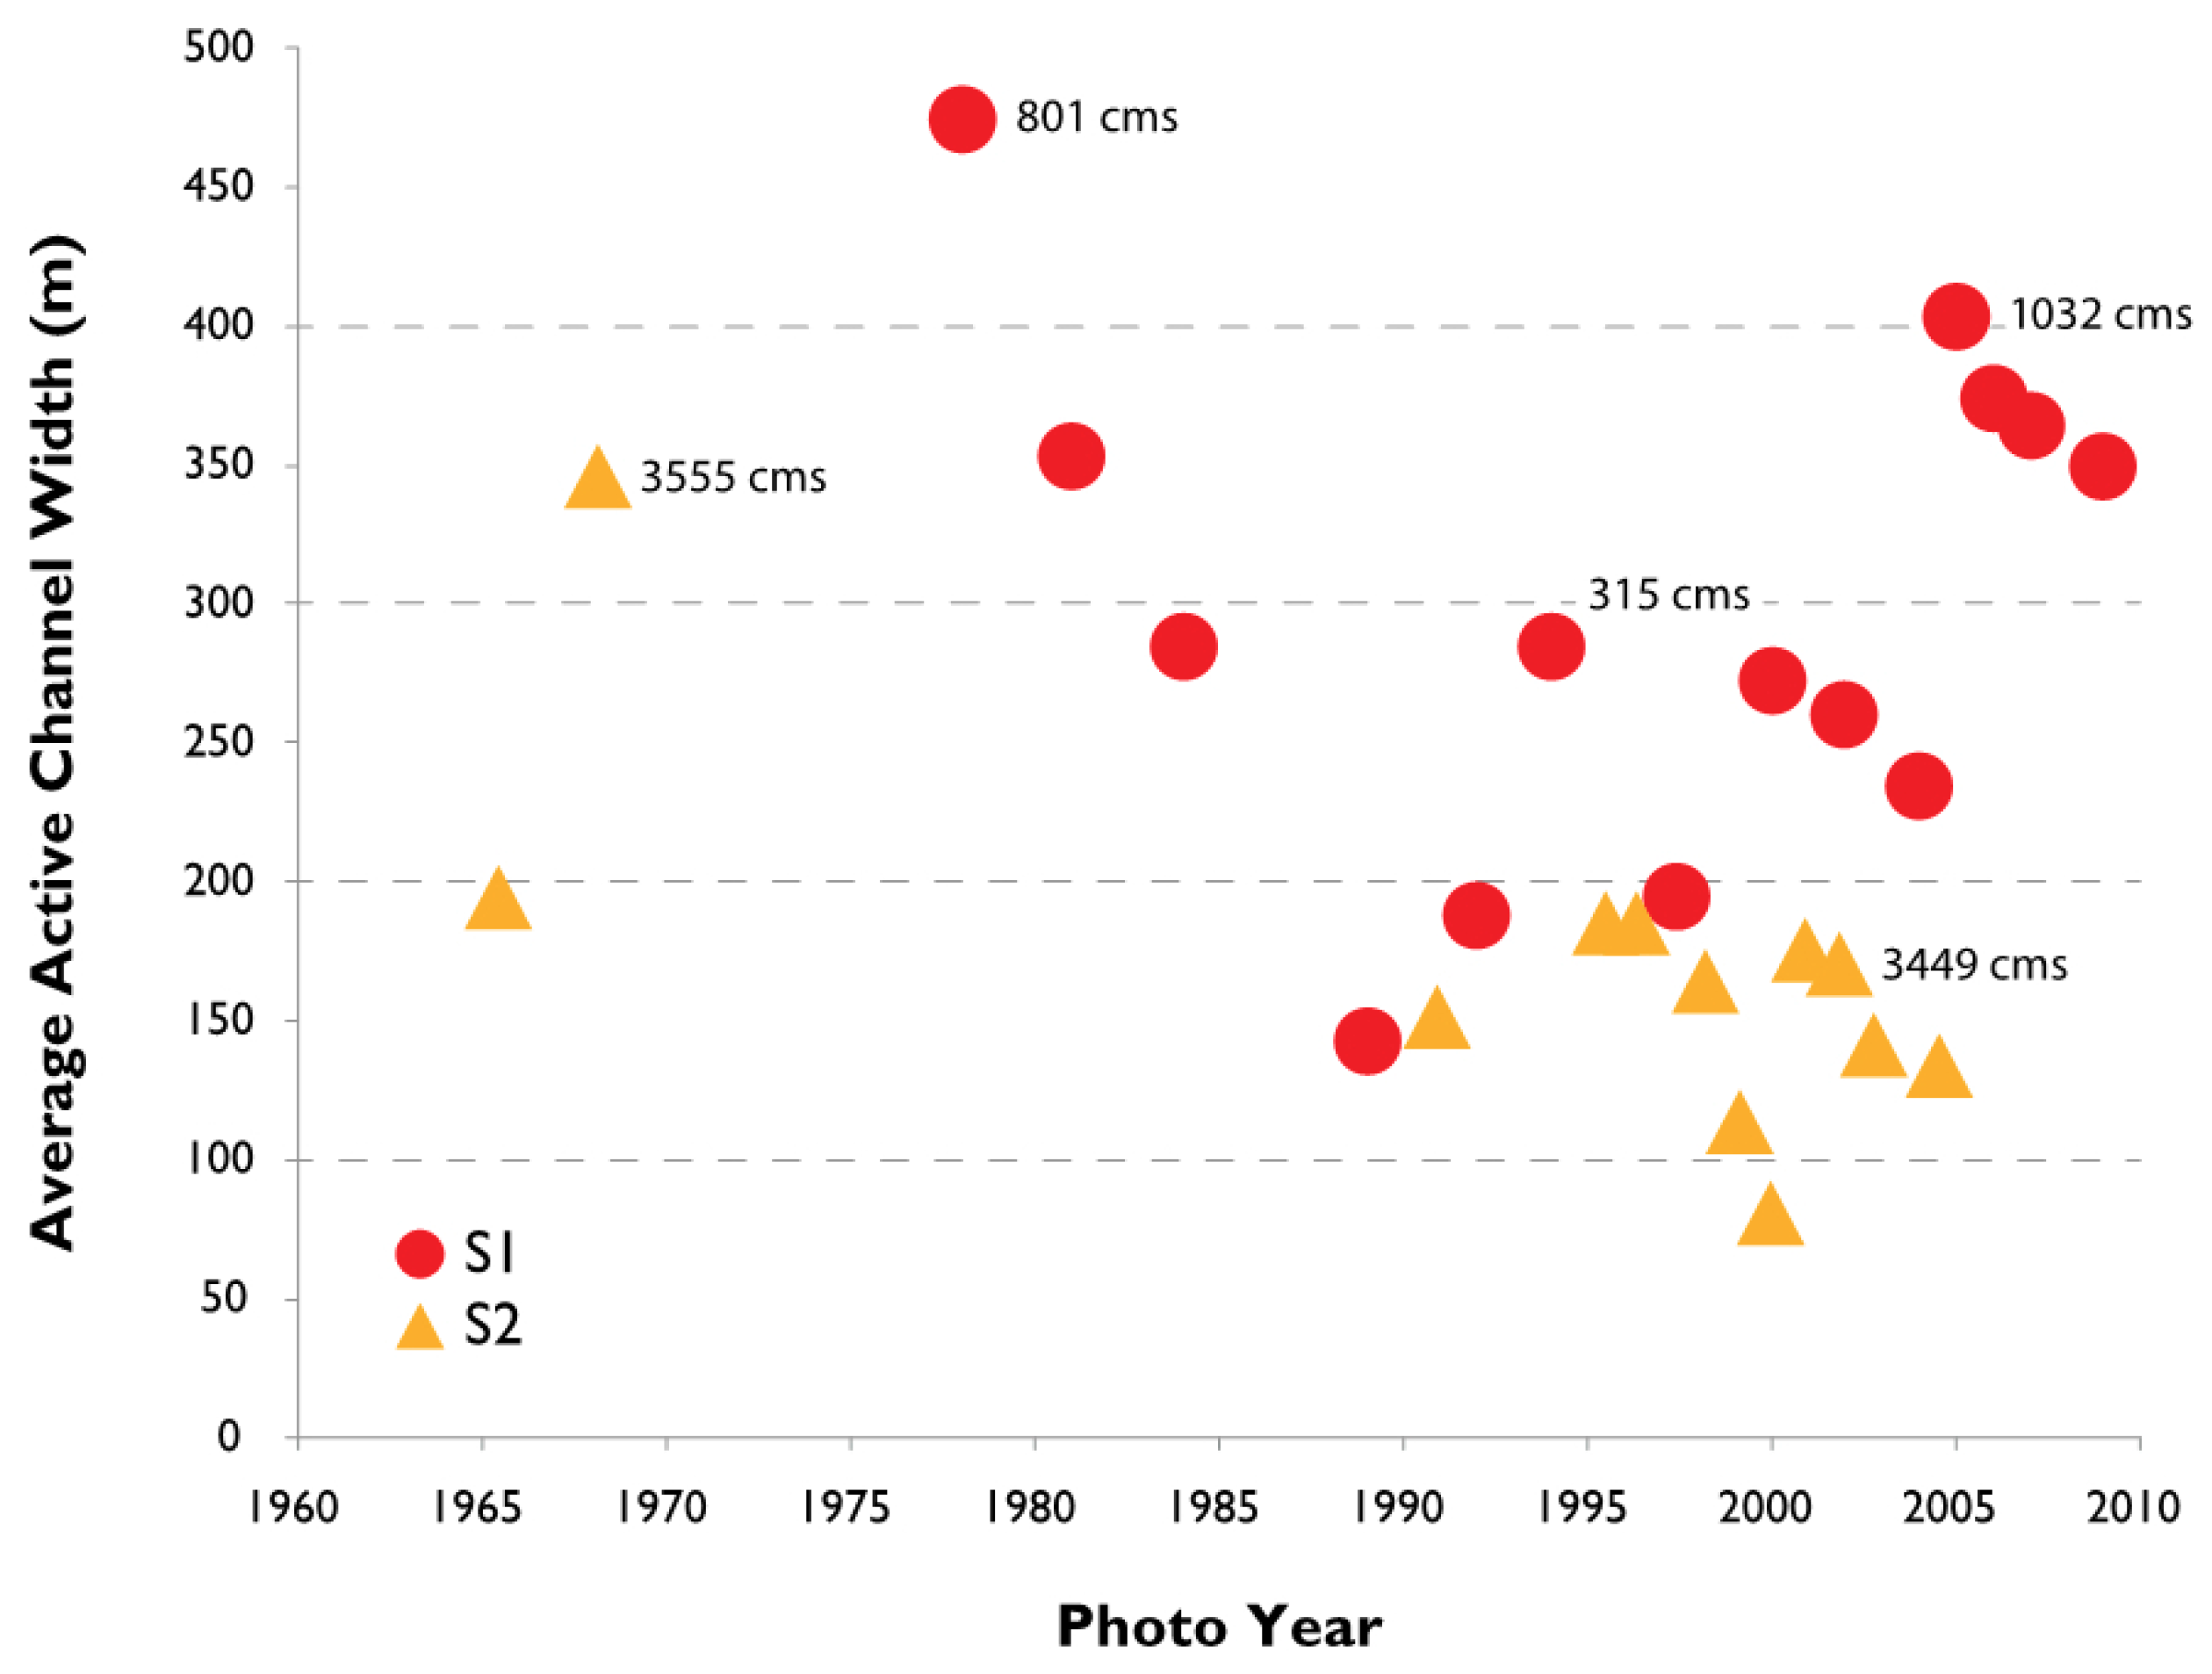
3.2. Channel Change over Time

The area of A. donax increased five-fold at site S1 over the course of 28 years, from 0.17 km2 to 0.79 km2 (Figure 5 and Figure 6). Site 1 from cross sections 7–8 on the north bank is the site of a large perennial wetland where significant spring flow occurs, nourishing a large area of A. donax as well as S. laevigata. Some of the large S. laevigata trees have produced islands—like mounds, often surrounded by A. donax. At site S2, the amount of A. donax has increased four-fold over the course of 15 years from 0.05 km2 to 0.23 km2. In terms of community composition, A. donax has displaced native vegetation at each site over two decades of evaluation and by 2009 represented over 50% of the total vegetation present at each site (Figure 5 and Figure 6 and Table 6).
Intensity of braiding, active channel width and vegetation width by cross section for aerial photographs from 1978–2009 (S1) and 1966–2009 (S2) are shown in Table A3 and Table A4. Average values of these channel characteristics over time are shown on Figure 7, Figure 8 and Figure 9. For both sites, vegetation width and active channel width are related, where increases in vegetation (and, thus, vegetation width) are associated with a decrease in active channel width.
Measuring change of active channel and vegetation width shows that successive floods of similar magnitude have been less able to widen the channel and the amount of vegetation has increased over time. At site S1, intensity of braiding is highly variable and fluctuates within an envelope of 1–2 channels, except for flood events exceeding 15–20 year recurrence intervals (such as 1978 and 2005, Figure 7). Site 1 experienced decreasing braiding activity with successive flood years until the 2005 flooding event. Site 2 has an incomplete record for years between 1969 and 1994, making it hard to compare against site S1 for which there is a more complete record. However, braiding in this reach is more restricted as the channel is narrower, yet, similar to the S1 site, the 2005 flood event was the highest braiding index value recorded in the series of aerial photographs (Figure 7). Therefore, there is a tendency for the intensity of braiding to increase during large floods, but, over decades (1960s to 2009), the active channel width has decreased as A. donax has increased (Figure 8). Vegetation width over time (Figure 9) has generally increased at both sites.
The 2005 flood was the second highest on record since 1938 for both site S1 and S2. The amount of A. donax was roughly equivalent to the amount of native vegetation at each site (measured from 2004 aerial photographs) prior to flooding in 2005. Measurements made from 2005 aerial photographs directly following the flood event showed that more A. donax was removed than native vegetation at S1 (62% compared to 42%, respectively), while less was removed compared to native vegetation at site S2 (38% compared to 94%; Table 7). At site S1, in 4 years, both A. donax and the native vegetation grew back to the same proportion that existed prior to the flood. At site S2, in 4 years, A. donax grew back to the same proportion as before the 2005 flood but the native vegetation did not grow back to the full amount. At site S1, A. donax grew at twice the rate of native vegetation, while at site S2, the A. donax grew back at a lower rate than native vegetation but the difference was less than at site S1 (Table 7).
Results of linear regression analysis and F test for significance suggest that for S1, there is a significant relationship (R2 = 0.36, p = 0.02) between the magnitude of the most recent peak discharge and intensity of braiding, as well as a significant relationship between magnitude of most recent flood and vegetation width (R2 = 0.46, p = 0.01) but no significant relationship between magnitude of most recent flood and active width. For S2, there is a significant relationship between magnitude of the most recent peak discharge and active width (R2 = 0.56, p = 0.01), as well as a significant relationship between magnitude of most recent flood and vegetation width (R2 = 0.59, p = 0.004) but no significant relationship between magnitude of most recent flood and intensity of braiding. The statistical analysis is not consistent between S1 and S2 and R2 values suggests that one-half to two-thirds of the variability between independent (flood discharge) and dependent variables (channel characteristics) remain unknown. However, the more remarkable conclusion is that about 50 percent of the variability of channel width can be explained by the variability of the magnitude of the most recent peak discharge.

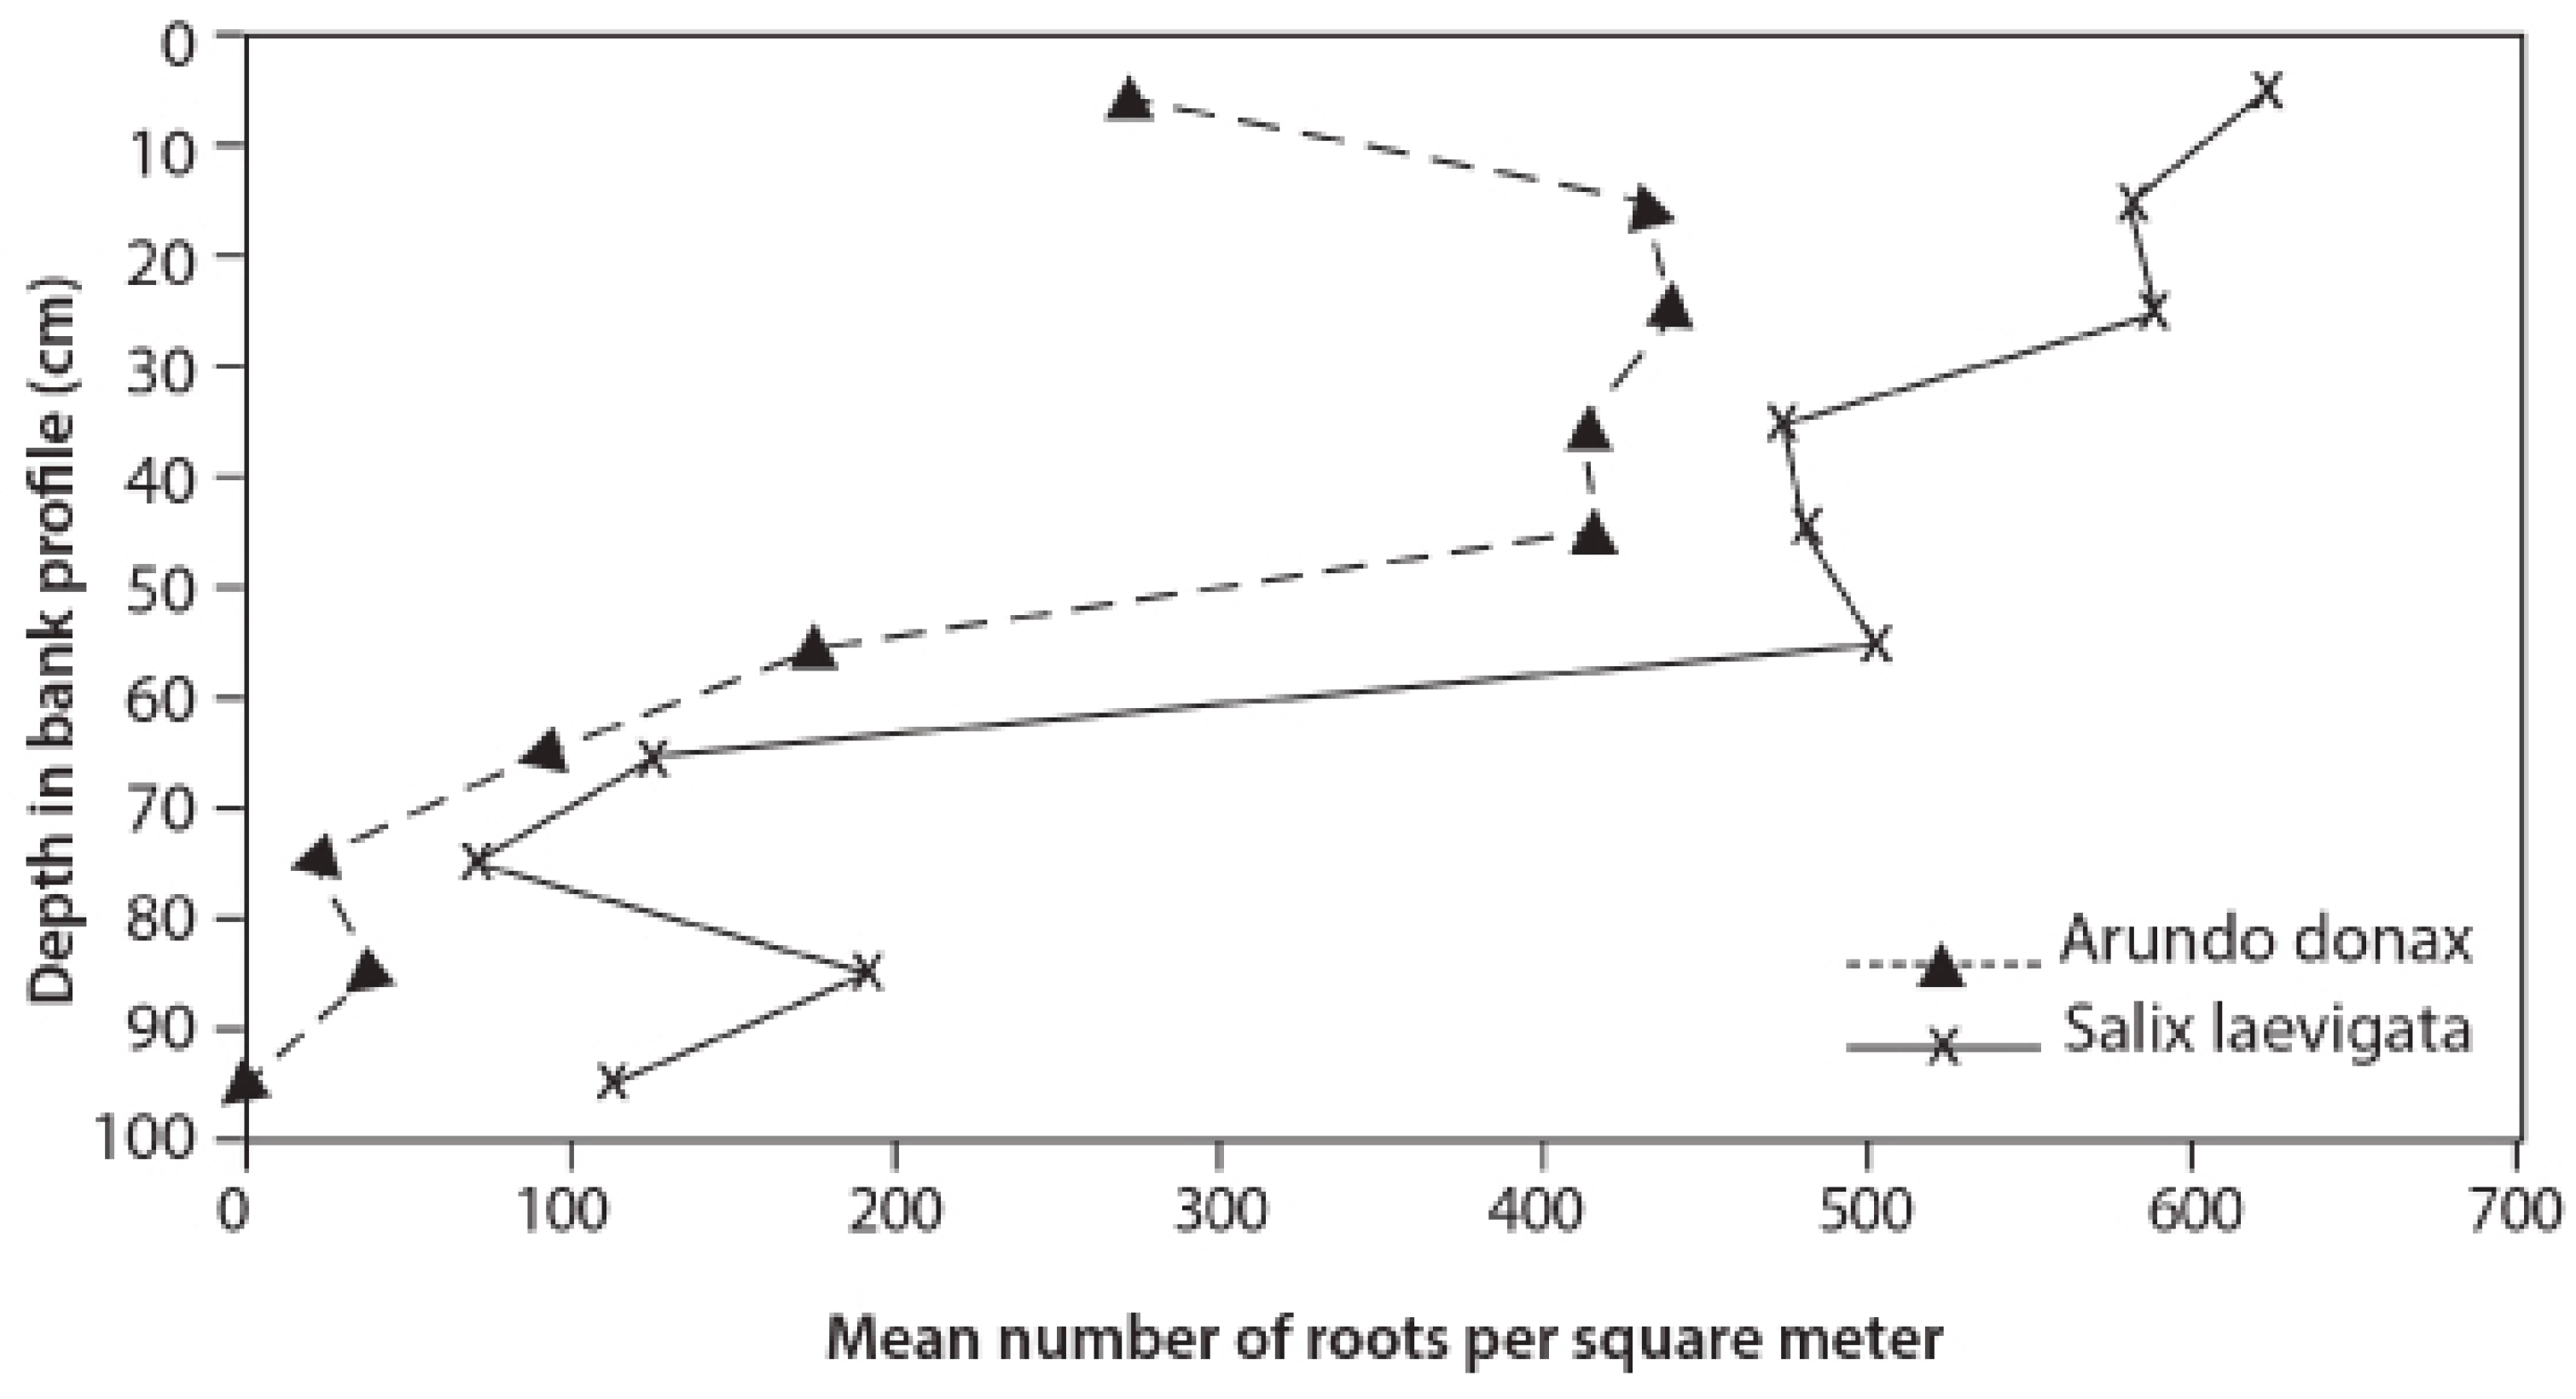
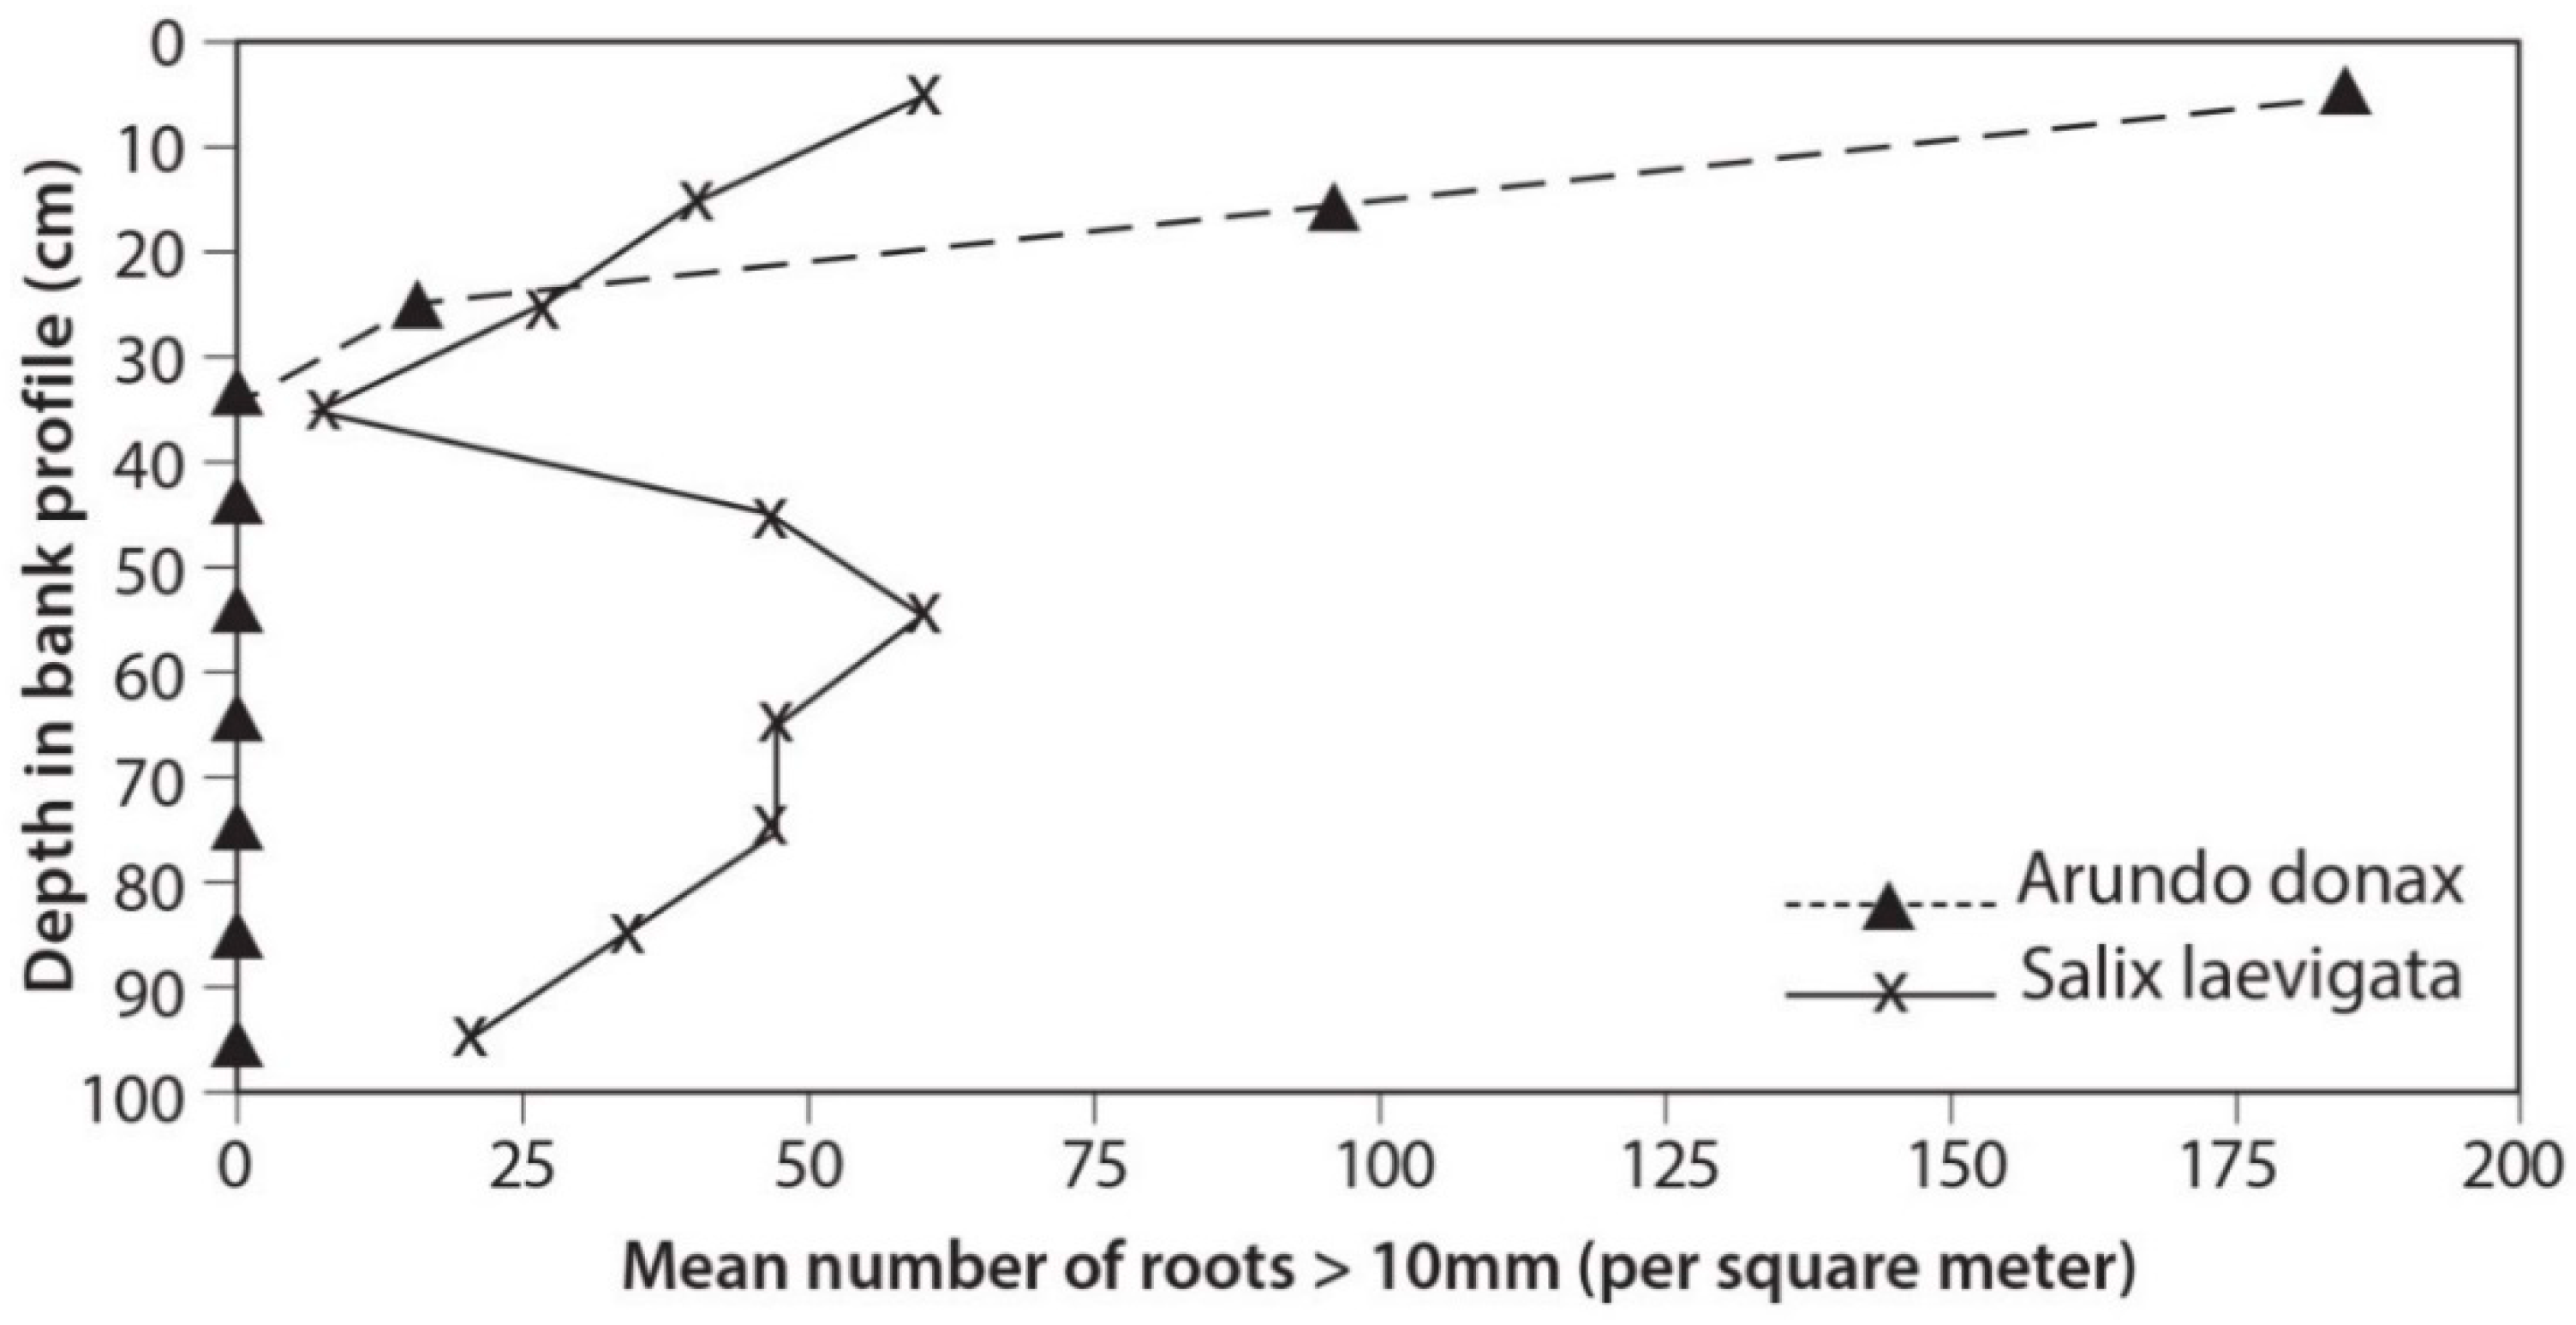
3.3. Root Distribution

Statistical analysis suggests that there is a significant difference between the mean number of roots per meter squared of A. donax versus S. laevigata. S. laevigata has a higher number of roots per unit area at all depths in the soil profile than A. donax (Figure 10). However, comparing only roots larger than 10 mm shows a key difference between A. donax and S. laevigata, with A. donax having more large roots per unit area in the top 20 cm of the profile (Figure 11).
Measured root diameters in mm for A. donax and S. laevigata are listed on Table A5 and Table A6. Table 8 shows differences between the distribution of fine (>1–3 mm), medium (3–10 mm) and large (>10 mm) roots per m2 present in each profile by depth. Differences in values of columns, as well as distribution of root classes across each depth, are significant at the 0.05 level (chi-square test). Table 9 shows the mean number of roots by root size class for each species per m2.
Critically, there is a significant difference (p < 0.05, chi-square test) in the area of bank profile occupied by roots, such that A. donax occupies more area in the top 10 cm, while S. laevigata occupies more area at each depth below that.

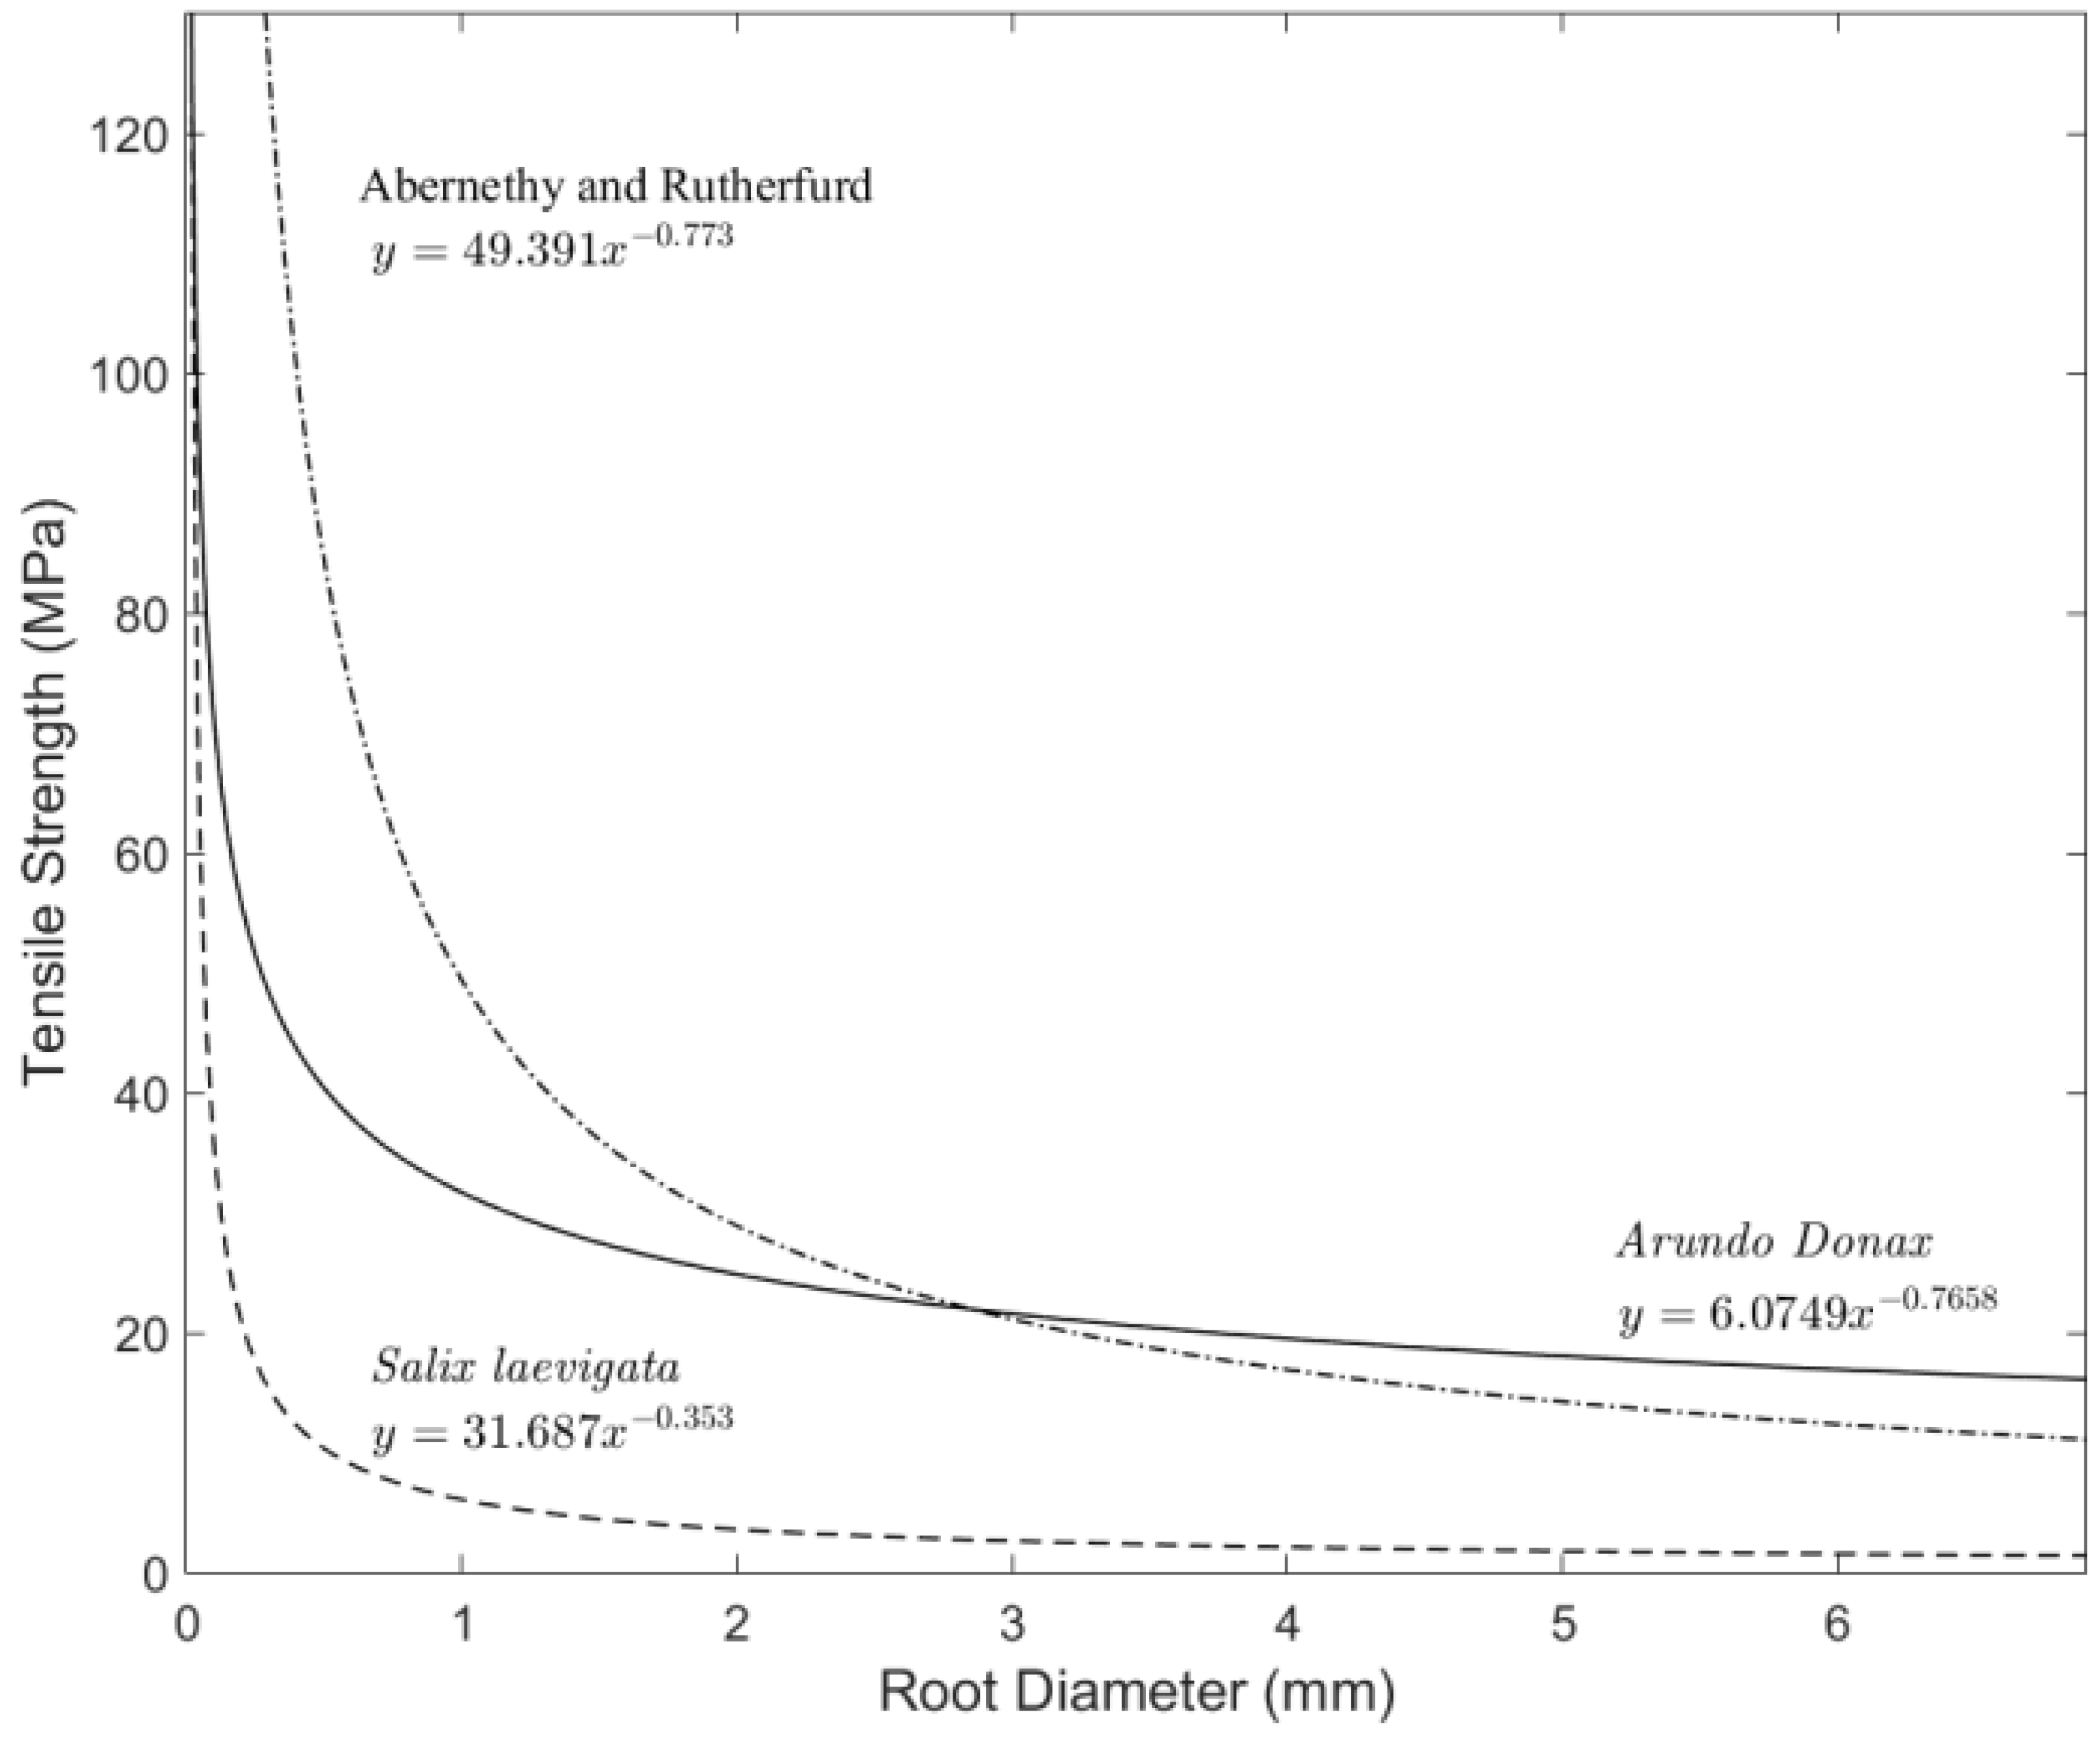
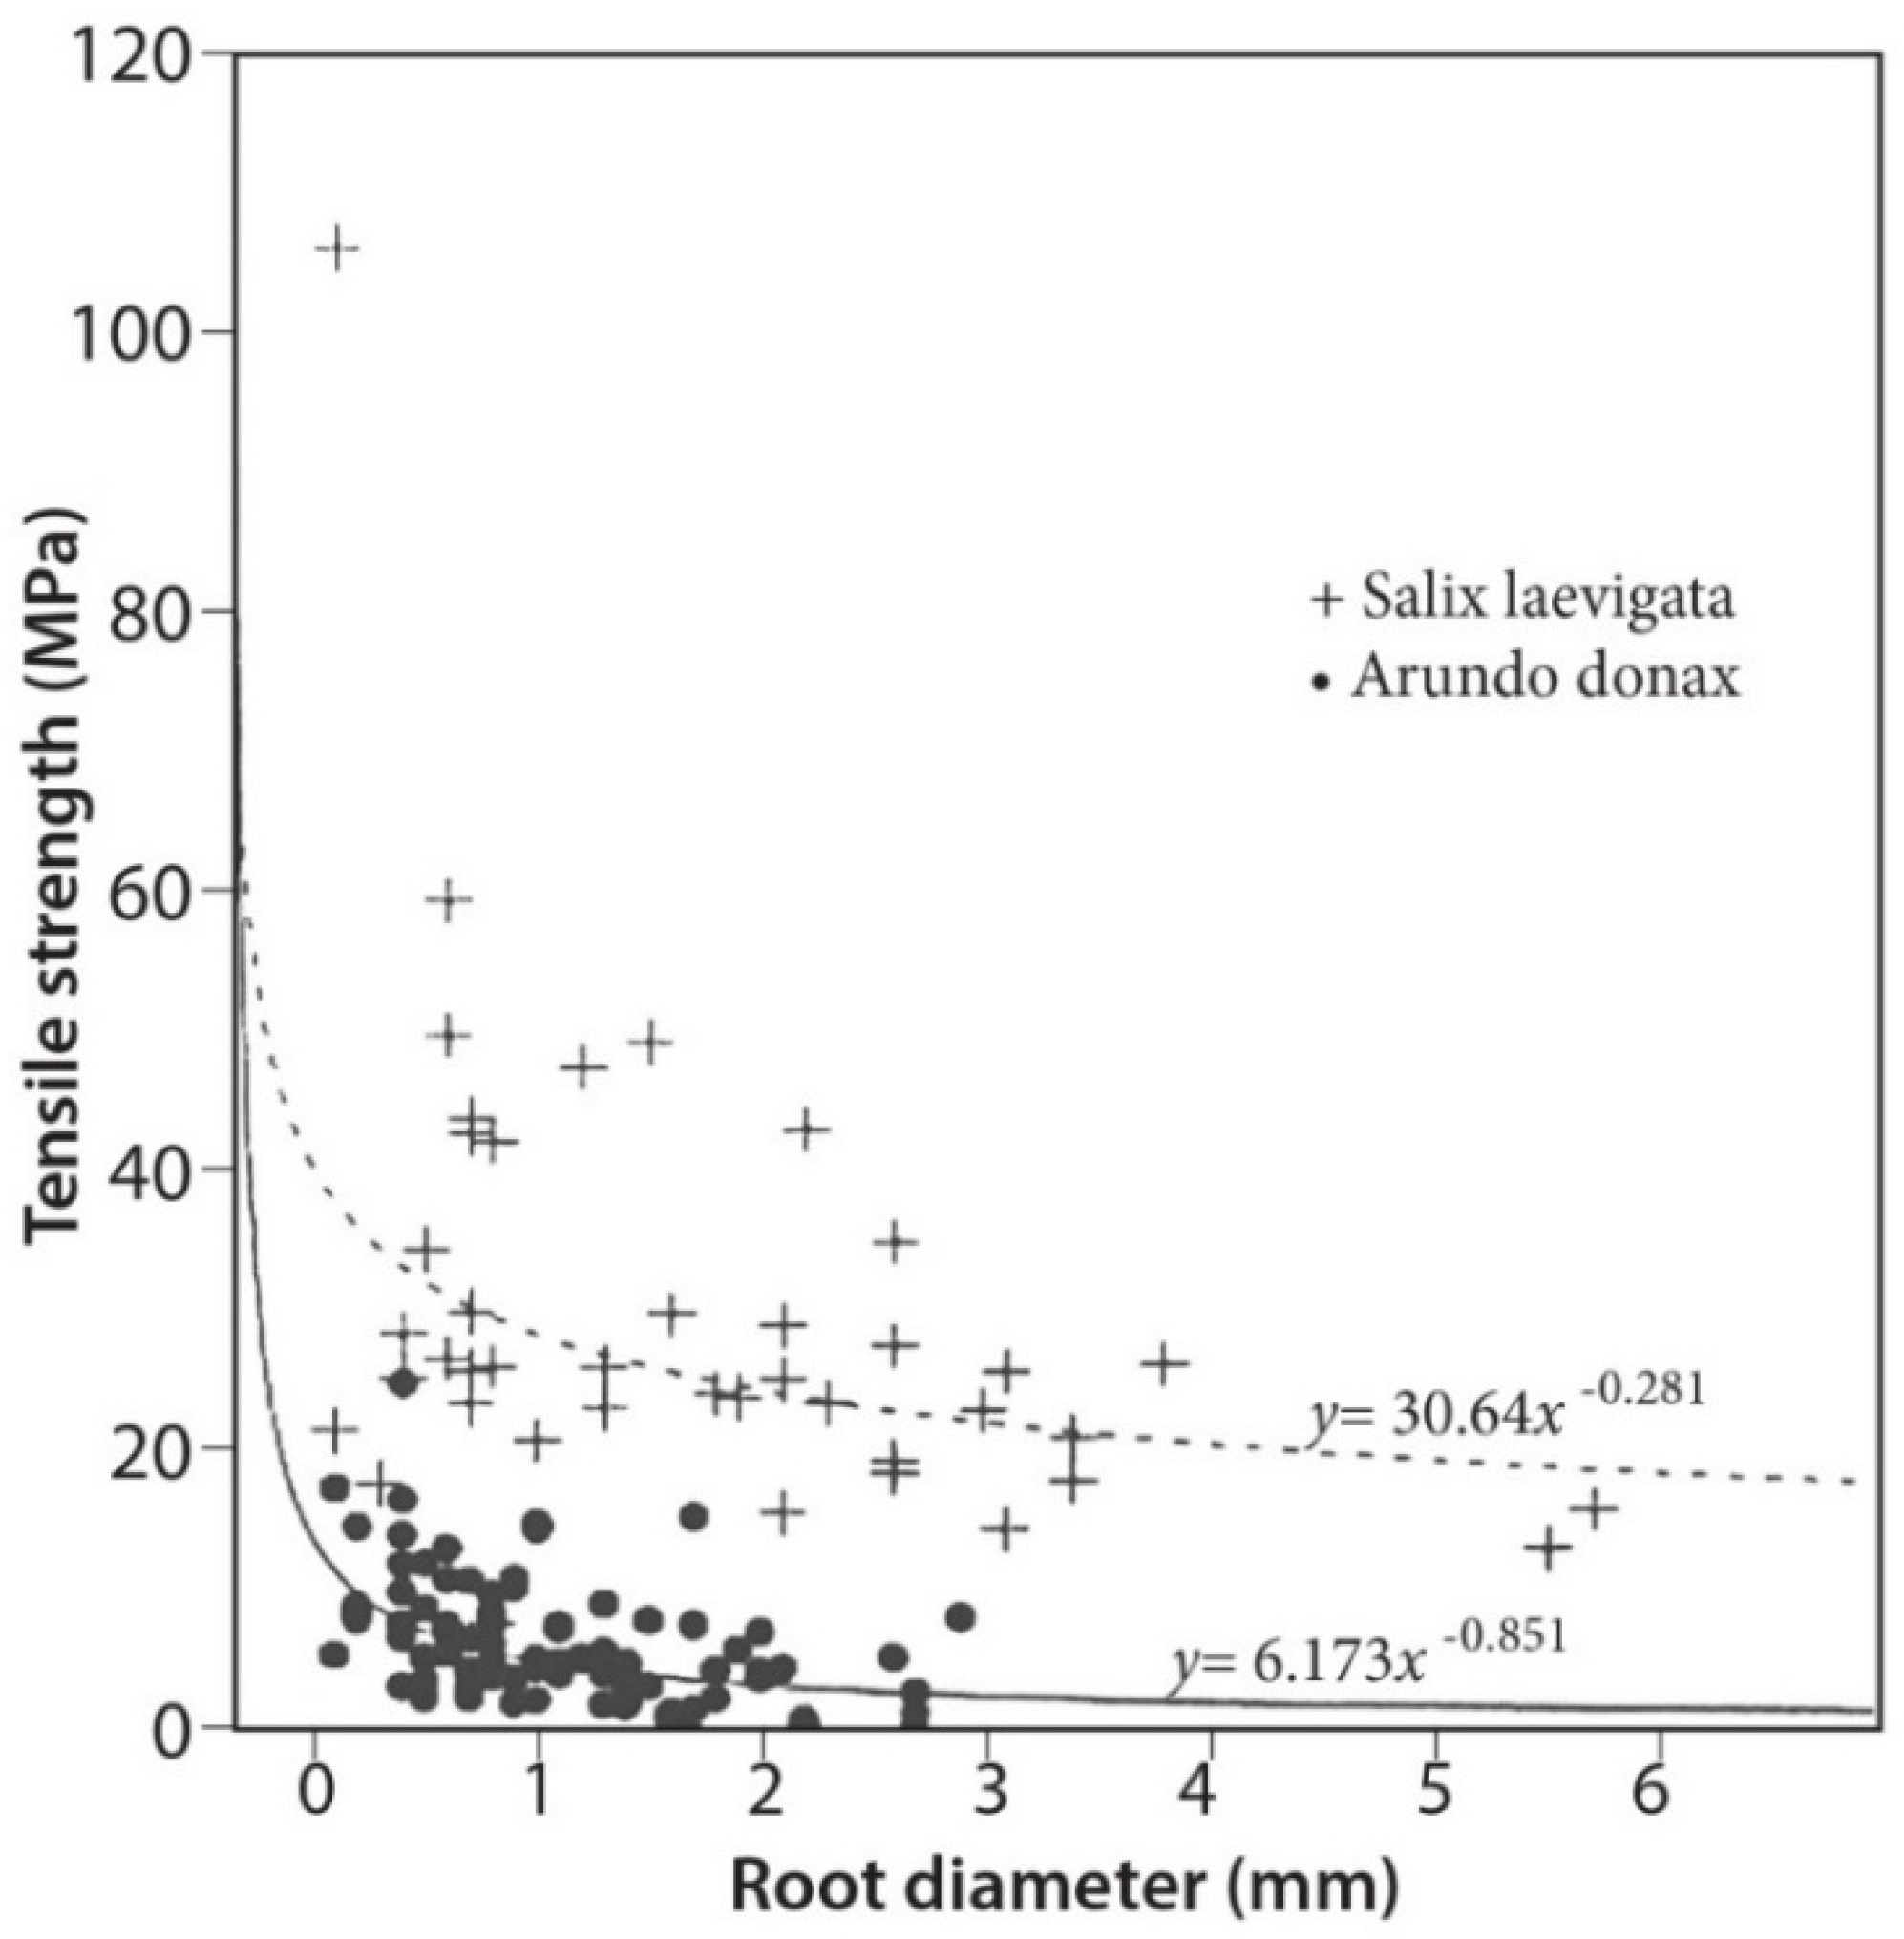
3.4. Tensile Strength

The two S. laevigata trees where tensile root strength was measured had been buried by flood deposits several times and continued to grow upwards, so that, at great depth, the main trunk of the tree was present and still intact. After each burial, new horizontal stabilizing roots had grown (or, possibly, they were buried branches). Despite that, A. donax was excavated in the same channel and directly across from the S. laevigata and there were no observed cases where buried rhizome mats were present that had continued to re-sprout, leaving buried mats at depth. Rhizomes of all A. donax plants were only present near the surface. The values of tensile strength for A. donax and S. laevigata are listed in Table A7 and Table A8.
The regression of tensile strength and diameter is a negative, non-linear power relationship, such that larger roots have less strength per unit area than small roots (Figure 12). These findings are in agreement with those of other studies [24,25,37]. The coefficients of determination for the regression of A. donax and S. laevigata are 0.24 and 0.17, respectively. These values fall within the range of those found in the literature for other types of riparian vegetation (0.14 < r2 < 0.75; [36]). When compared across the same distribution of sizes, a Kolmogorov-Smirnov test shows that there is a significant difference in the strength between the species, with S. laevigata having stronger roots across all sizes than A. donax.

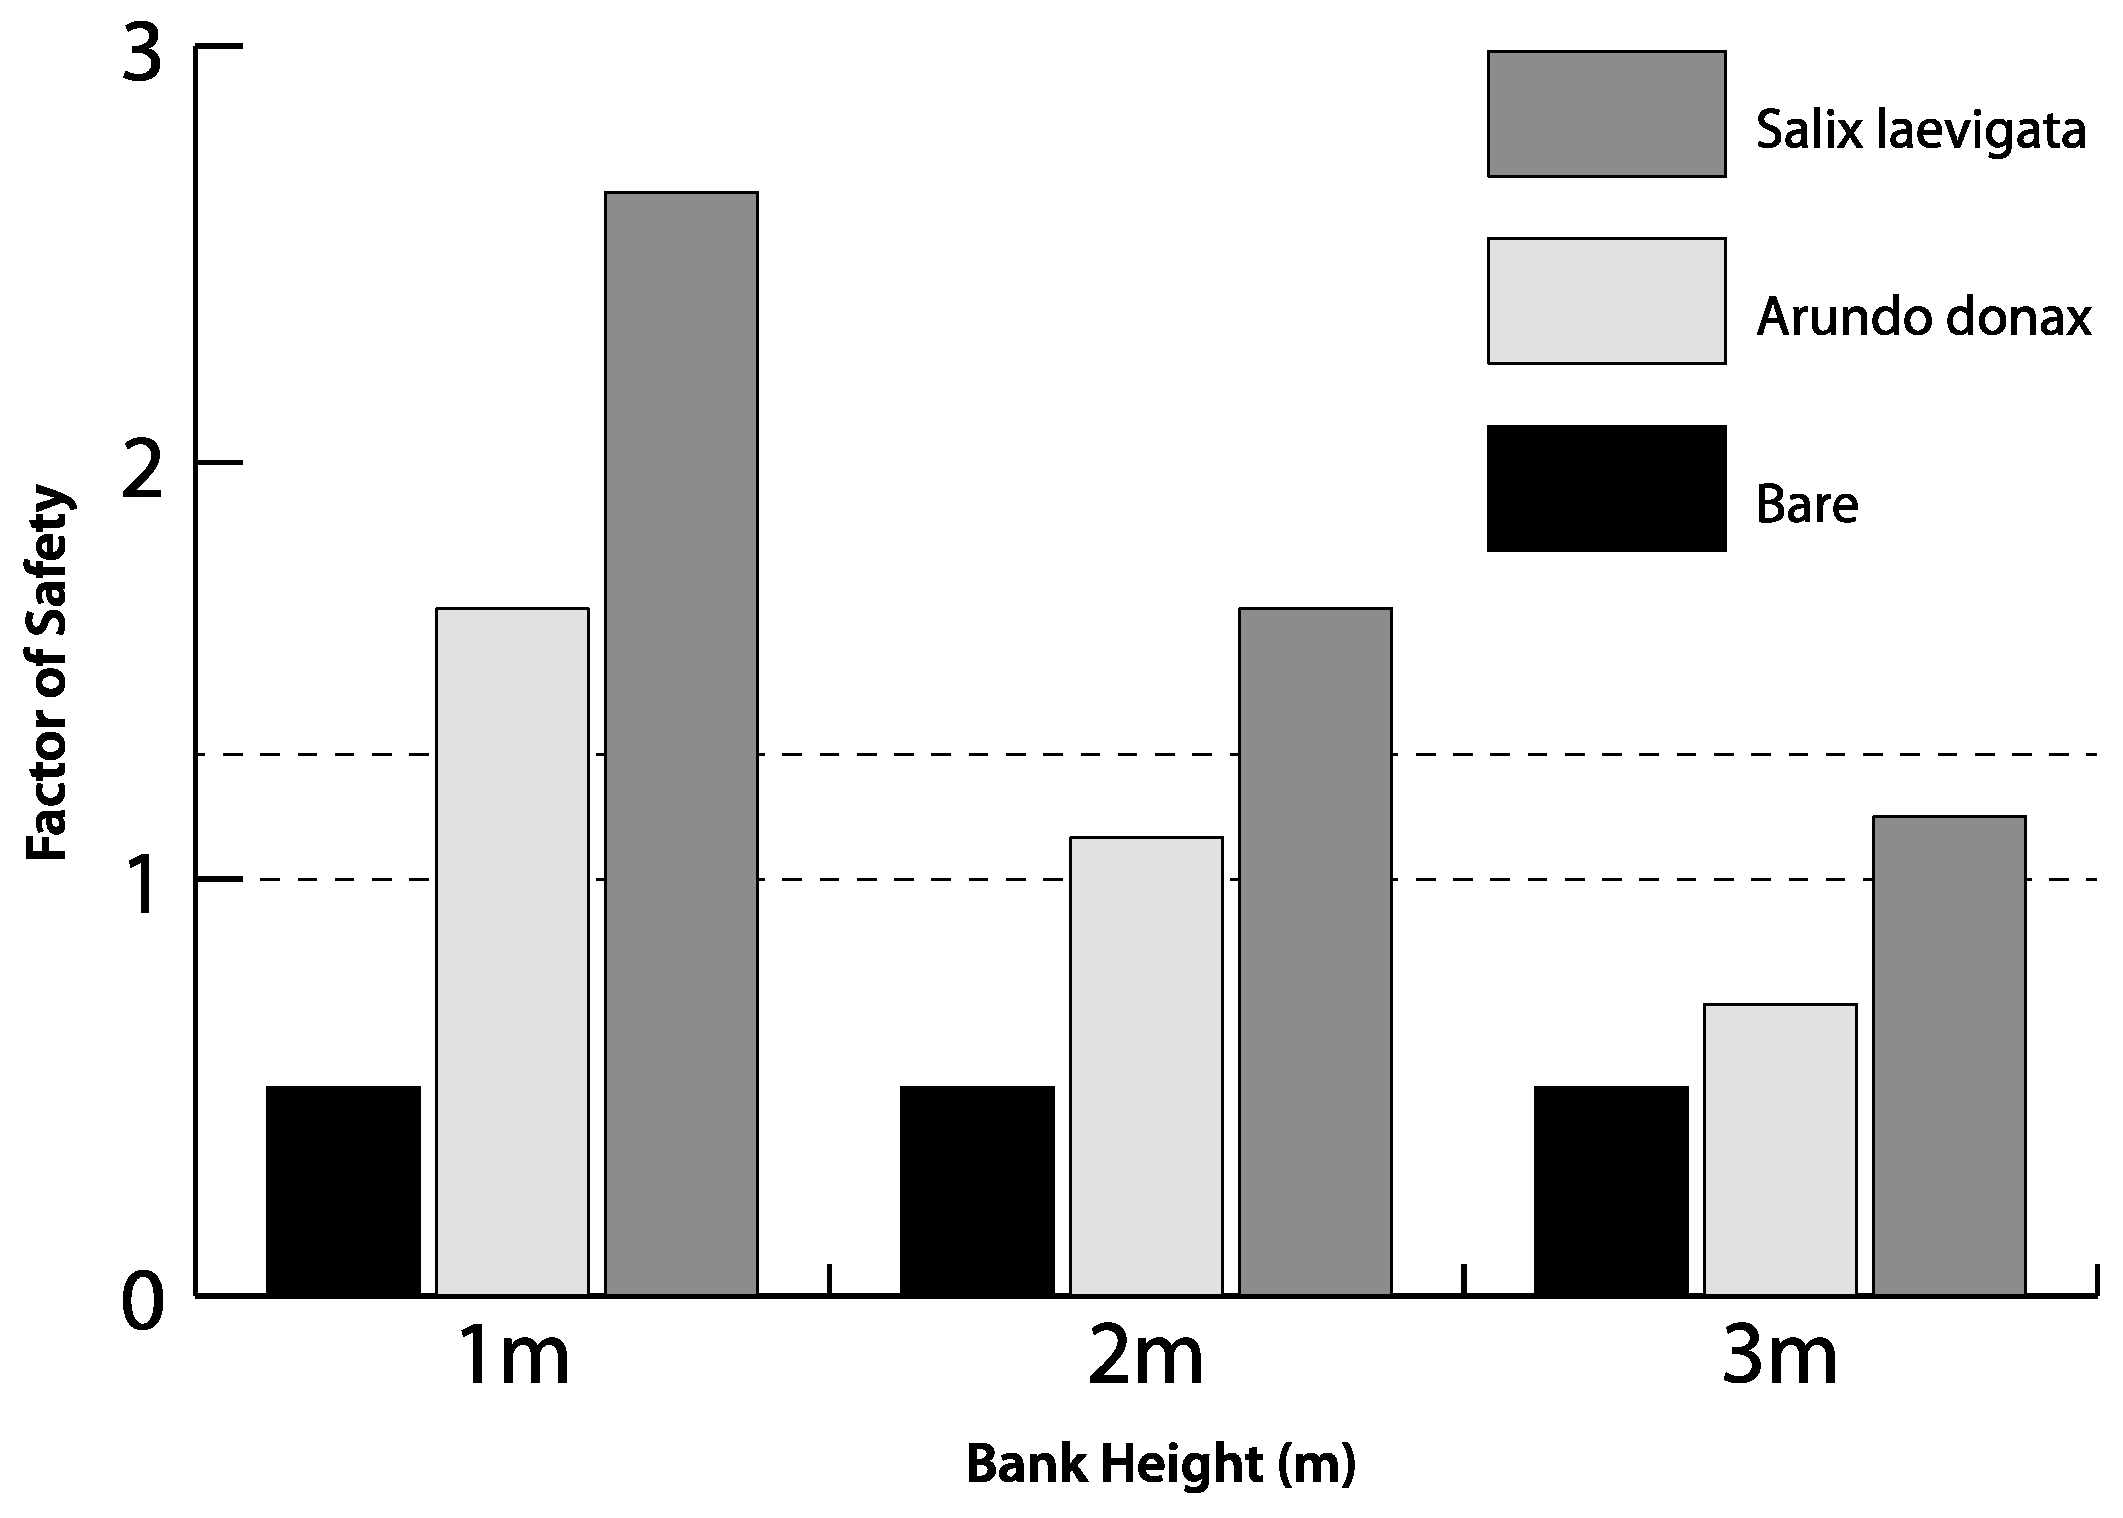
3.5. Experimental Modeling of Slope Stability

The additional cohesion added by the roots was 3.3 kPa and 8.6 kPa for A. donax and S. laevigata, respectively. Reported cohesion ranges from 2–18 kPa for different types of vegetation, with Black Willow (Salix nigra) as the lowest value and Alamo Switch Grass (Panicum vigratum) as the highest [25].
Experimental modeling bank stability, for coarse sandbanks of variable height, suggests that S. laevigata, compared to A. donax, increased the factor of safety (FS) by ~60% for banks 1 m high, ~55% for banks 2 m high and ~40% for banks 3 m high. For 3 m high banks, the FS for banks with Arundo donax is <1 (Figure 13). Therefore, there may be a decrease in the lateral stability of channels if the mixed riparian forest is transformed from being diverse to becoming a monoculture of A. donax.
One bank was characterized at site S2 in the Santa Clara River. The site is on a sand bar in the main channel and analyzed in the bank stability model. The 2-layer bank profile (Figure 14) is composed of fine sand on the toe, a mixture of sand and gravel and then coarse sand up to the top. The results show that, under saturated conditions, A. donax creates a factor of safety of 2.4, while S. laevigata creates a factor of safety of 6.2.

4. Discussion

4.1. Channel Change over Time

The upper Santa Clara River west of Fillmore has been modified by human processes for over 100 years. Prior to human changes, the Santa Clara River would probably have had a wide shallow floodplain with a high groundwater table that supported a rich riparian forest dominated by willows and sycamore trees [6]. The riparian forest would have helped stabilize shallow stream banks and store runoff leading to lower peak flows. There have been water diversions, channel modifications, artificial recharge, land use changes, construction of debris basins and construction of dams. These collectively have reduced the flow of water and sediment and impacted the river form and process. Dams on Bouquet Canyon (1934), Castaic Creek (1972), Piru Creek (1955 and 1971) have controlled the discharge from about 36% of the drainage basin. The dams have reduced the suspended load and bedload each by about 20%. Impacts of the dams decrease downstream until the confluence with Sespe Creek that contributes both water and sediment. Sespe Creek constructed a large fan that forces the river south. The reduction in bedload with increased agriculture and groundwater use would have favored channel incision and flashier peak flows [6]. The fluvial geomorphology of the river was also impacted by the catastrophic 1928 failure of the St Francis Dam in San Francisquito Canyon (a tributary to Bouquet Canyon). The resulting flood down the Santa Clara River was about 10 times larger than any natural flood in historic time. The flood greatly changed the channel form as riparian vegetation was ripped out, resulting in a much wider channel. Some of the effects of the 1928 flood remain today [6].
Dams can have a major effect on downstream channel morphology, hydrology and riparian plants, presumably including Arundo. Development of a new river equilibrium is thought to take as long as a century following disturbance such as the 1928 flood and construction of dams [42]. It has proven difficult to predict changes in erosion/deposition and channel width below dams, due to change on river flows and sediment transport. This study has documented changes in intensity of braiding and channel width changes with flood events over several decades linked to changes in the abundance of A. donax. The impact of dams, debris basins and land use, while having effects on fluvial geomorphology, are assumed to be small relative to the effects of the major flood events. This assumption is supported by the apparent rapid significant changes that are linked to flood events during the several decades they were measured.

4.2. Root Density and Tensile Strength
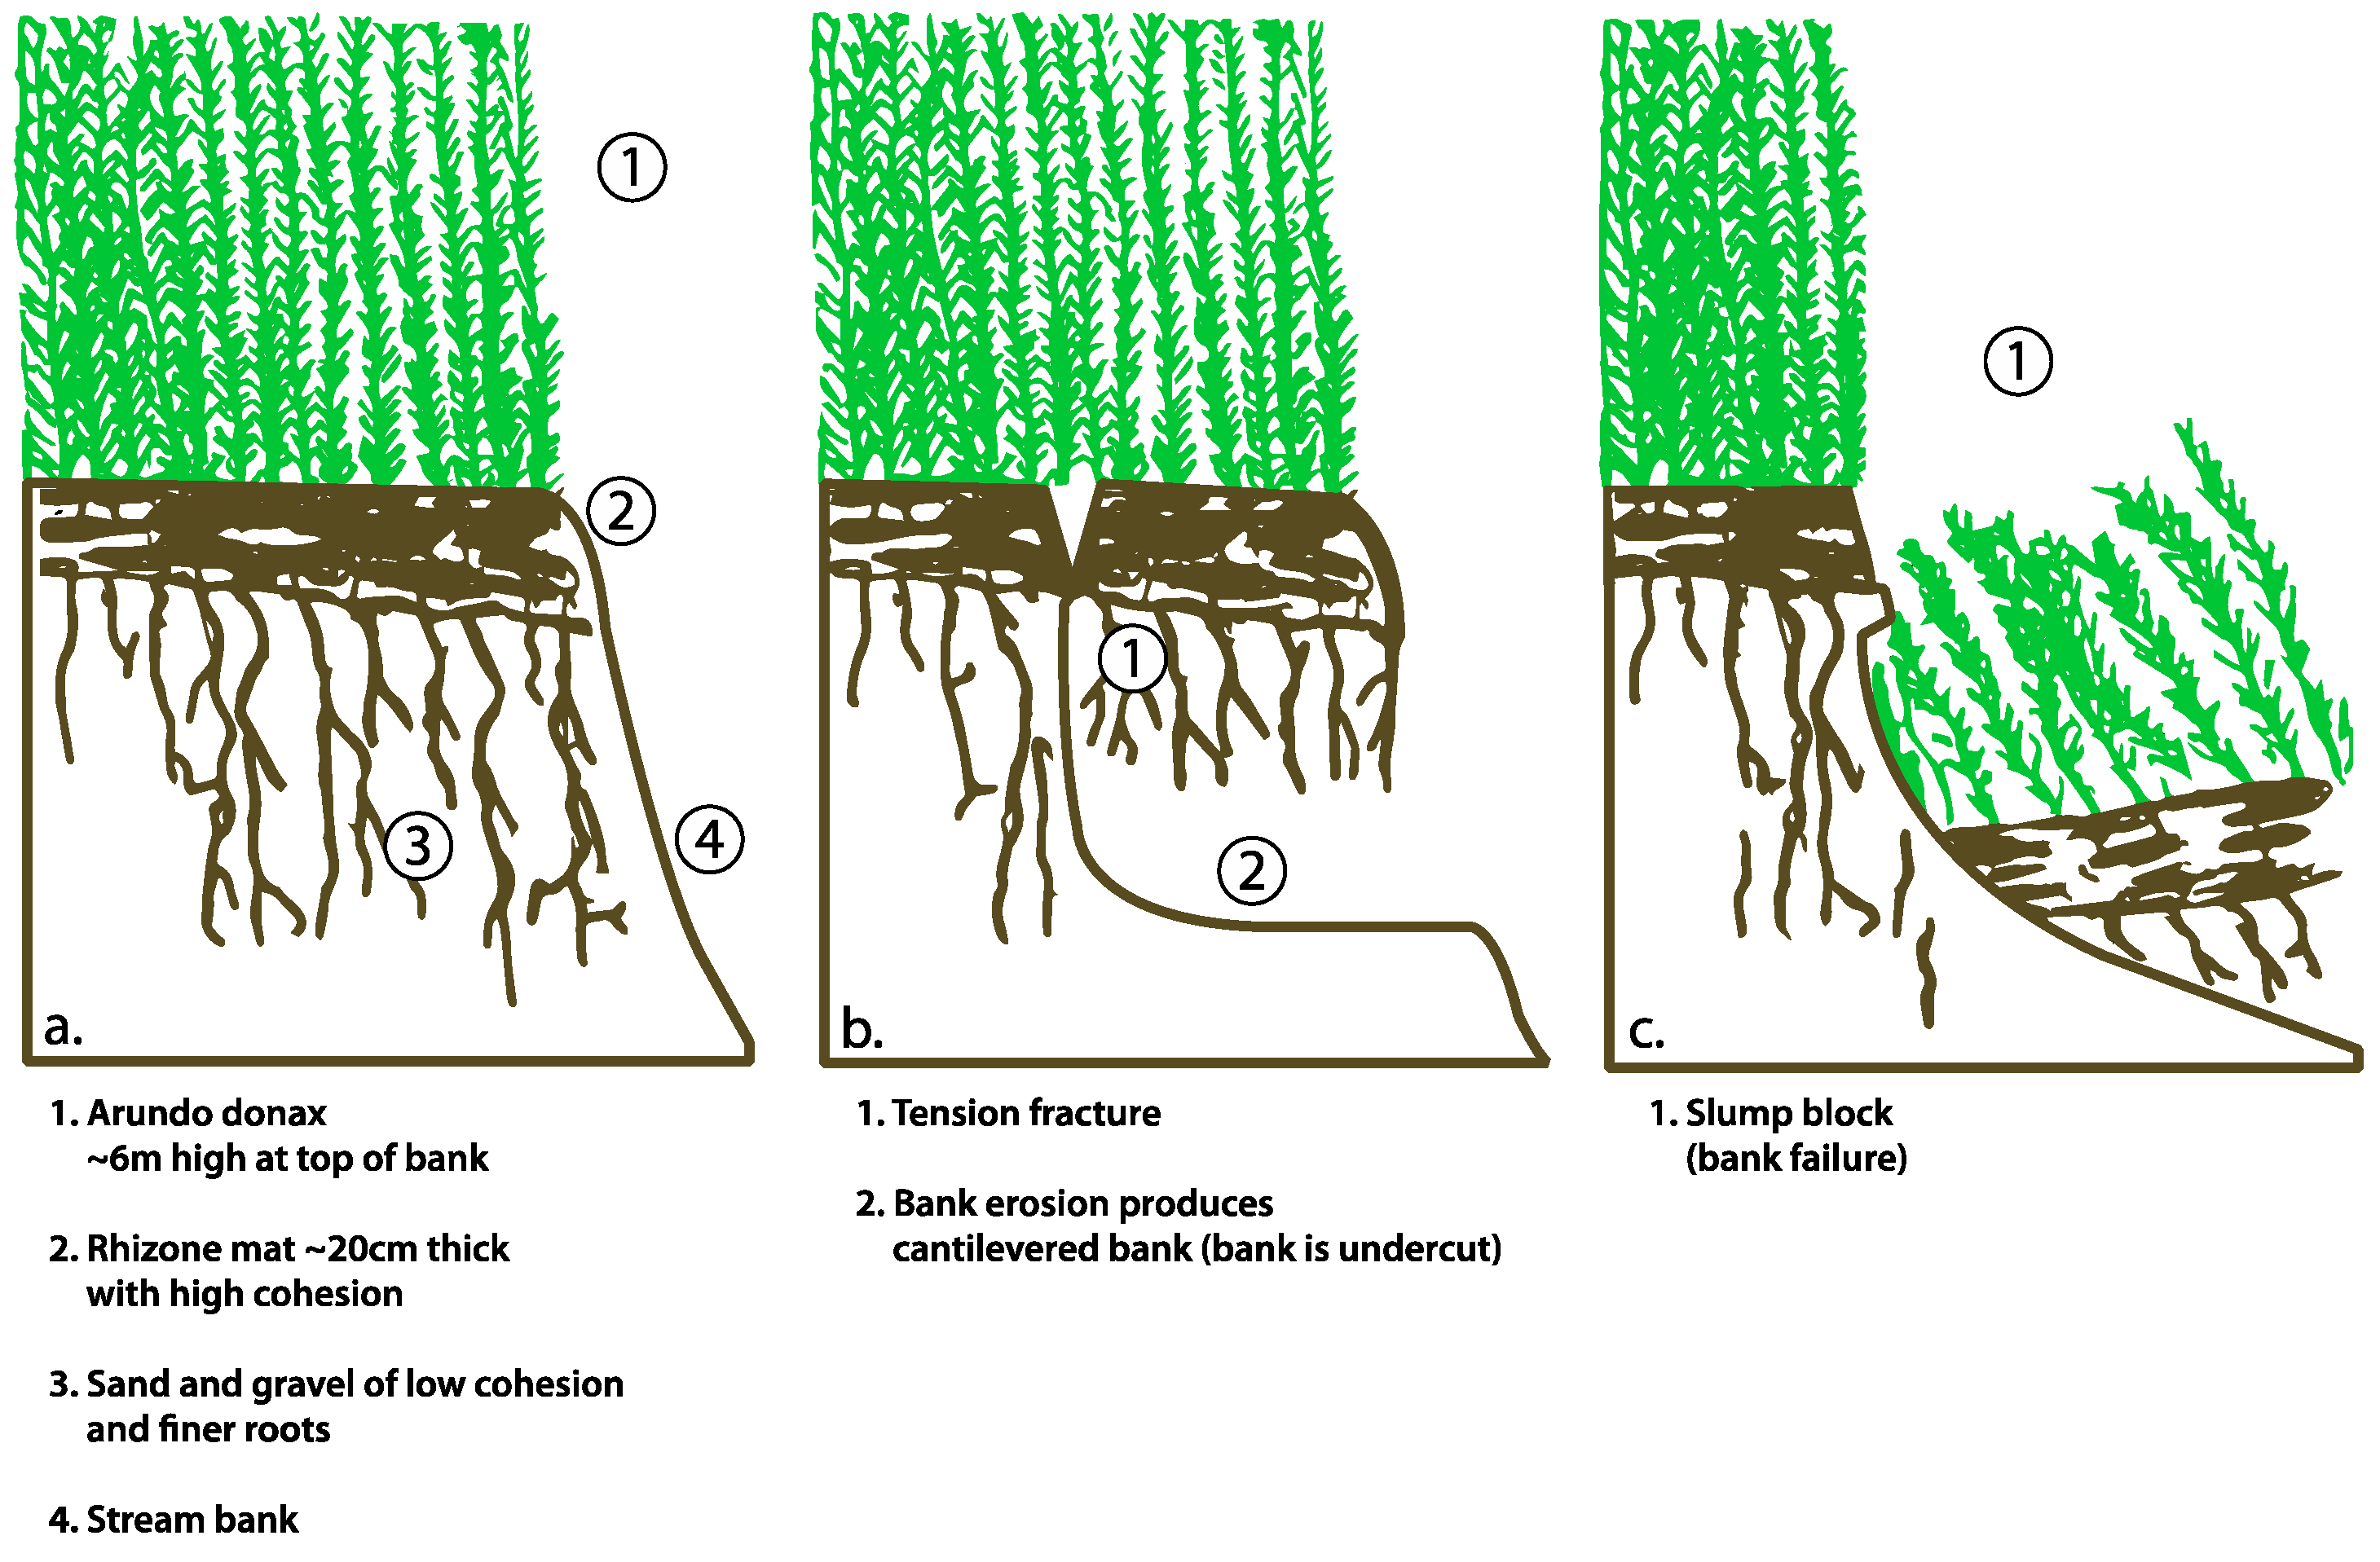
The properties of roots, such as the below-ground architecture and strength, reflect local conditions, as well as plant identity and age, making the results of different studies difficult to compare [18,24,37,43]. Comparing the relationships between tensile strength and root diameter in this study to those found by Abernethy and Rutherford [24] illustrates the variability in this relationship (Figure 15). Table 10 compares root properties of this study with others in the literature. The only other study that reports root characteristics for A. donax (along with many other plant species) comes from the Ethiopian highland. That region has an October to May dry period with annual precipitation of 1,280 mm (about twice the average rain of our study area). A. donax tensile root strength is much greater at the Ethiopian site but values of number of roots per square meter and cohesion due to roots are similar. The sample size of A. donax roots tested was 16. Of interest to this study is that the root volumetric ratio (or number of roots per square meter) has a greater effect on additional soil cohesion than root tensile strength [44]. Values in common to nearly all studies on root architecture is the finding that most roots exist in the top 1 m of soil, with the bulk of the roots in the top 30 cm [24,25].
Limitations of this study include the fact that profiles completed for the two plant types were in areas that were accessible for equipment use and may not be representative of the range of growing environments. The A. donax root profiles were measured in a drainage canal from a farm through the floodplain to the main channel and, hence, were not in a completely natural environment, although it was functionally similar to the S. laevigata site in a low flow channel of the floodplain. Only two trees were sampled (three total profiles), limiting the ability to make broad generalizations of natural variation in root traits. Despite this, the results show important differences in the below-ground architecture and strength that can exist between these two plant types and highlights the need for further study.

4.3. Bank Stability

The model used for determining bank stability, BSTEM 5.2, was developed by the US Department of Agriculture’s National Sedimentation Laboratory (USDA-NSL) and is based on a numerical analysis of limit equilibrium equations describing the mass wasting of streambanks [25,37]. It also incorporates the cohesion due to roots as calculated in the RipRoot model [36].
A limitation is that RipRoot averages the cohesion due to roots over one meter of depth and does not allow for modeling of how differences in cohesion at various increments of depth affect bank stability. However, most of the strength from the roots of A. donax is concentrated in the upper 20 cm, whereas root strength for S. laevigata is more distributed throughout all depths in the profile. Based on our observations, this is a key difference between A. donax and S. laevigata that could easily be overlooked using a model-only approach. Distributing the strength over a larger area of bank surface may hide the effect of failure caused by undercutting and subsequent failures, as idealized in Figure 16. Such failures have been observed to happen in the field on banks topped by A. donax, as illustrated by a cantilever bank failure along the Santa Clara River (Figure 17). We observed that during moderate to high flow with relatively low banks (less than 1 m), the much larger roots and higher tensile root strength of the near surface A. donax rhizome complex was undercut due to the weaker sand and gravel banks with less root cohesion immediately below the rhizome layer. The unsupported cantilevered banks then fail by slumping or because of slower, more persistent erosion. From field observation, these failures range in size from less than one to tens of m2 of bank.
In order to make the findings more broadly applicable to understanding of the differences between A. donax and other common riparian vegetation, particularly S. laevigata, we modeled the Factor of Safety (FS), using previously suggested parameters on theoretical banks with the RipRoot Model [36]. Banks of rounded fine to coarse sand and gravel were chosen for this experiment in order to model the effect of A. donax versus S. laevigata on sediment types that are similar to those of coastal southern California streams. Also, banks with cohesive sediments may derive most of their strength from the cohesion of their particles and vegetation has the largest effect on banks with less cohesive sediments [30]. A sensitivity test to bank angle was carried out on a 1 m high fine, sandy bank for bank angles of 30–35 degrees and it showed that FS decreases exponentially with increases in bank angle for each species. For a sandy bank with a gravel toe that was measured in Santa Clara River, it was shown that S. laevigata provided more stability than Arundo donax. The FS for a sand bank with A. donax is conditionally stable, whereas the bank is stable with S. laevigata. These stability estimates, while encouraging, clearly require detailed field tests, using soil properties from the field and soil mechanics linked to slope stability modeling before more specific conclusions may be drawn on bank stability with willow or arundo roots or with no roots.

5. Conclusions

A major conclusion of this study is that there is a significant difference in size, strength and distribution of roots for A. donax compared to a common native riparian tree, S. laevigata and that this difference decreases the additional strength offered to banks by vegetation when there is A. donax present versus native vegetation. Specific conclusions are:
  • A. donax is displacing native vegetation at two field sites studied, which appear to be broadly representative of many reaches of the Santa Clara River. The below-ground architecture of the root system is significantly different between the two plant species, leading to significant differences in the mechanical strength added to the banks;
  • Channel width and intensity of braiding varied over several decades with width and braiding linked in part to high flow events that removes A. donax.
  • S. laevigata had more roots at greater depths and the roots are stronger for any given size than those of A. donax;
  • Root tensile strength for S. laevigata (for roots of 1–6 mm in diameter) is about five times higher than for A. donax;
  • The difference in the number and strength of roots produced different values in effective bank cohesion: S. laevigata adds over twice the amount of cohesion compared to A. donax (8.6 kPa versus 3.3 kPa);
  • Modeling of bank stability, for banks of variable height, suggests that S. laevigata, compared to A. donax, increases the FS by ~60% for banks 1 m high, ~55% for banks 2 m high and ~40% for banks 3 m high. For 3 m high banks, the FS for banks with A. donax is <1. Therefore, there may be a decrease in the lateral stability of channels if the mixed riparian forest is converted to be dominated by A. donax.

Author Contributions

Conceptualization, J.E.S.; Methodology, J.E.S.; Software, E.J.L.; Validation, E.A.K., T.L.D., and E.J.L.; Formal Analysis, J.E.S.; Investigation, J.E.S. and E.A.K.; Resources, J.E.S., E.A.K., and T.L.D.; Data Curation, J.E.S.; Writing-Original Draft Preparation, J.E.S.; Writing-Review & Editing, E.A.K., T.L.D. and E.J.L.; Visualization, J.E.S. and E.A.K.; Supervision, E.A.K. and J.E.S.; Project Administration, E.A.K. and J.E.S.; Funding Acquisition, T.L.D.

Acknowledgments

We thank Andrew Simon and Natasha Bankhead-Pollen from the USDA ARS National Sedimentation Laboratory for the loan of equipment with which to measure root strength and we thank Joseph P. Stover for his support and advice regarding statistical analysis. Al Bassera (Senior) allowed access to Study Site #1 and provided some great watercress from California Watercress Inc. His son helped with the backhoe excavations of A. donax to allow the study of the plant biomass and root system. We also appreciate the review by Derek Booth and four anonymous reviewers who provided constructive criticism and encouragement. The raw data on root strength and abundance as well as additional statistical analysis for this study are available from the thesis of Jiana E. Stover. This research was supported, in part, by Santa Clara River Trustee Council Grant No. 448750-22642 to T. Dudley.

Conflicts of Interest

The authors declare no conflict of interest.

Appendix A

Table A1. Calculated values for magnitude of peak discharge for specific flooding events at S1 study site.
S1 (Fillmore Fish Hatchery)Discharge in Cubic Feet per Second (cfs)Peak Discharge for Study Reach
Photo YearPhoto MonthPeak Date(1) Santa Clara River(2) Hopper Creek(3) Piru CreekTot Qmax (cfs)Tot Qmax (cms)
200941 January 20083120 *274 **7341197
20077Monthly20 *0 °°52658
200662 January 200612,500 *240 °°712,747361
200599 January 200532,000 *4290 °°12436,4141032
2004925 February 20042640 *289 °°5293483
2003112 February 20032330 *128 °°6246470
20027Monthly26 *0 °°9351
2000423 February 20002440 *2680 °°85128145
19941118 February 199310,700 *314 °°9711,111315
19921112 February 199212,300 °1270 °°32813,898394
1989616 December 198811,000 °4 °°511,009312
198411 March 198330,600 °4410 °°135,011992
1981616 February 198013,900 °8120 ***3322,053625
197899 February 197822,800 °5450 ***1128,271801
Monthly = Used mean monthly discharge value because peak data was not available for that year. * USGS Gauge, Santa Clara River, near Piru, CA, #11109000; ° USGS Gauge, LA County Line, # 11108500; ** VCWPD Gauge, Hopper Creek, near HWY 129, Piru, CA, #701; *** USGS Gauge, Hopper Creek, near Piru, CA, #11110500; (3) USGS Gauge, Piru Creek, below Santa Felicia Dam, #11109800; S1 tot Qmax.
Table A2. Calculated values for magnitude of peak discharge for specific flooding events at S2 study site.
S2 (TNC-BRIGGS RD)Discharge in Cubic Feet per Second (ds)Peak Discharge at Reach
Photo YearPhoto MonthPeak DateS1 Tot QmaxSespe Creek *S2 Tot Qmax (ds)S2 Tot Qmax (cms)
2009427 January 2008225230,80033,052937
2007728 January 200714764164116
200664 April 2006168244,50046,2521311
200599 January 200536,41455,300121,7143449
2004925 February 2004293417,70020,534585
2003112 February 20032454763010,094285
200276 March 2001155325,90027,563781
2000423 February 2000244049007340208
1999103 February 199810,69162,50073,1912074
19941112 February 199415044,00044,1501251
1969225 January 196977,20050,000137,2003555
1966729 December 196532,02321,50053,6231520
19591016 February 19592051828010331293
* USGS gauge Sespe Creek near Fillmore, CA 11113000; S2 tot Qmax ( S I T o t Q m a x + S e s p e C r e e k ) .
Table A3. Summary of measurements made from cross sections for aerial photos from site S1 of intensity of braiding (mean number of channels), active width (m) and vegetation width (m). ND is no data. Locations of cross sections are shown on Figure 5.
Braiding Intensity: S2Cross Section
Year123456789AVE
19781111133442.1
19811111111221.3
19842233221111.9
1989NDNDND1111111.0
19921111122221.5
19942221122211.6
20001111111221.2
20021211111111.1
20042211111211.3
20053322324312.4
20063222223412.2
20071113423211.9
20091112212321.6
Active Width: S1Cross Section
Year12345678910AVE
1978399452291297427543718626557436474
1981320410212195301403472391413416353
1984328300221192221441373300206266285
1989NDNDND6811018420621215068143
19922311724953138212163295305261188
1994395223195233265254250371305352284
2000248411132310345240184150311392272
2002266382116271311195219139311390260
200426922610524031920118999300396234
2005577297184365407393421481455447403
2006571382229266407317246433444441374
2007472365206243407348266500438441364
2009461311184274404359271351450433350
Vegetation Width: S1Cross Section
Year12345678910AVE
19780.000.0059136781142720.008218292
19810.000.0011910414217691420271260209
19840.000.008289130193460319430200190
1989NDNDND21467245601346445334322
199218978222219341423783345323215314
199418987163163222360697342346218279
20002563916394134334727496287184271
2002226161215245167378801609293215331
2004253134291273170417879654401152362
20050.0085145937421159330814252170
20060.0060861457828267136017248190
20070.00781641378222670127415626184
20093052148145263252679623366257282
Table A4. Summary of measurements made from cross sections for. aerial photos from site S2 of intensity of braiding (mean number of channels), active width (m) and vegetation width (m). Locations of cross sections are shown on Figure 6.
Braiding Intensity: S2Cross Section
Year12345678910AVE
1966**121211221.6
196911111111111.0
199412122112221.6
199911311123211.6
200011111222211.4
200211111122221.4
200311111211221.3
200411111111111.0
200511232222221.9
200622221222211.8
200711111111111.0
200921211222211.6
Active Width: S2Cross Section
Year12345678910AVE
1966**328228204204206127133129195
1969426467467411346318280266258216346
199479567160187226170172172131170152
1999107103172253276207159219210150185
2000107114169261293206162199203149186
2002106103158.23828418814519615471164
2003106100931281188614119811541113
200485977912782716772933881
200519812417619218617017522123674175
200619312418218917918815121420579170
20071981161771791711521551047975142
2009149.1211621841721631261139555134
Vegetation Width: S2Cross Section
Year12345678910AVE
1966690001031304915666049
1969**000000000
199416914618026815320922326119963187
19991047312419097768590184991
20001447112820918414593913750115
2002147661672191531721041233780127
20031137815322920819017612238121143
20041137614820618112714012596103131
20057138971611431096129255679
20067851140172146125896068106104
20079812118326222515913111512079149
20091355415122414719017674118102137
* Construction in channel; no measurements could be made.
Table A5. Summary of all root diameters, in mm, measured for A. donax in depth increments of 10 cm from surface to 90 cm. Numbers in parenthesis show number of roots of that size.
Depth (cm)Root Diameter (mm)
0–100.40 (2), 0.50, 0.60, 0.70 (2), 0.80, 0.90, 1.00 (2), 1.20 (2), 1.30, 1.40, 1.50 (2), 1.80, 1.90 (5), 2.00, 2.22 (2), 2.30 (2), 2.50 (2), 2.60, 2.70, 2.90 (2), 3.10, 4.10, 6.70, 10.00, 10.90, 12.20 (2), 12.50, 13.60, 14.00, 14.20, 14.60, 15.2, 15.3 (2), 16.5, 16.6, 16.90, 17.80 (2), 17.90, 18.60, 19.20, 19.30, 19.40 (3), 19.50, 19.70, 20.00, 20.10, 20.30, 20.70, 22.00, 22.50 (2), 23.00, 23.30, 24.30, 24.50, 24.70, 27.70 (2), 27.90, 28.30, 29.30, 29.60, 30.00, 30.50, 30.60, 30.10, 32.20, 32.60, 34.40, 35.30, 36.30, 37.00, 37.10, 37.90, 38.40, 39.40, 39.90, 41.80 (2), 42.30, 43.40, 47.00, 48.30, 48.40, 48.50, 57.90, 61.40, 62.70, 74.20, 125.70. (108 measurements)
10–200.10 (2), 0.20 (4), 0.30 (5), 0.40 (3), 0.50 (3), 0.60 (6), 0.70 (4), 0.80 (5), 0.90 (2), 1.00 (7), 1.10 (4), 1.20 (3), 1.30 (4), 1.40 (14), 1.50 (9), 1.60 (9), 1.70 (5), 1.80 (4), 1.90 (3), 2.00, 2.20, 2.30, 2.40 (3), 2.60, 2.80 (2), 3.30, 26.70, 30.60, 35.50, 39.00. (110 measurements)
20–300.10, 0.30 (6), 0.40 (5), 0.50 (3), 0.60 (3), 0.70 (6), 0.80 (4), 0.90 (9), 1.00 (4), 1.10 (4), 1.20 (13), 1.30 (15), 1.40 (7), 1.50 (5), 1.60 (5), 1.70 (4), 1.80, 1.90 (3), 2.10 (2), 2.50, 3.70. (102 measurements)
30–400.10 (2), 0.20 (8), 0.30 (5), 0.40 (7), 0.50 (4), 0.60 (3), 0.70 (5), 0.80 (4), 0.9 (4), 1.00 (15), 1.10 (15), 1.20 (10), 1.30 (5), 1.40, 1.50 (3), 1.60 (2), 1.70 (3), 1.90, 2.00 (2), 2.30, 2.70, 3.10, 3.50, 7.00. (103 measurements)
40–500.10 (2), 0.20 (4), 0.30 (11), 0.40 (10), 0.50 (10), 0.60 (6), 0.70 (9), 0.80 (9), 0.90 (4), 1.00 (3). (68 measurements)
50–600.10, 0.30 (2), 0.40, 0.60 (7), 0.70 (4), 0.80 (8), 1.00, 1.10 (3), 1.20 (2), 1.30 (3), 1.40 (3), 1.50 (3), 1.80, 1.90, 2.00, 2.20, 3.00. (43 measurements)
60–700.10, 0.20, 0.30, 0.40 (2), 0.50 (5), 0.60 (2), 0.70, 0.80, 1.20 (2), 1.30, 1.40, 1.50, 1.60, 2.10, 2.30 (2). (23 measurements)
70–800.30 (2), 0.70, 1.00 (2), 1.10. (6 measurements)
80–900.10, 0.20, 0.30, 0.40, 0.50, 0.60 (2), 0.80, 1.20, 1.50. (10 measurements)
Table A6. Summary of all root diameters, in mm, measured for S. laevigata in depth increments of 10 cm from surface to 100 cm. Numbers in parenthesis show number of roots of that size.
Depth (cm)Root Diameter (mm)
0–100.01 (4), 0.04, 0.05, 0.07, 0.10 (26), 0.11, 0.15, 0.20 (2), 0.21, 0.22, 0.26, 0.28 (2), 0.30 (8), 0.33, 0.34 (2), 0.35, 0.38, 0.40 (4), 0.42, 0.45 (4), 0.47, 0.48, 0.49, 0.50, 0.53, 0.60, 0.64, 0.70, 0.78, 0.80, 1.00, 1.10, 1.30, 1.40, 1.50, 1.55, 1.64, 1.87, 2.18, 3.55, 13.80, 14.00, 14.90, 15.00, 17.00, 17.49, 22.75, 47.86, 97.00. (93 measurements)
10–200.01 (3), 0.20 (2), 0.30, 0.40, 0.50. 0.60, 0.10 (15), 0.11, 0.13, 0.14, 0.15, 0.20 (4), 0.23 (2), 0.28 (2), 0.29, 0.30 (8), 0.35, 0.39 (2), 0.40 (5), 0.43, 0.49, 0.50 (2), 0.60, 0.67 (2), 0.70 (2), 0.73, 0.78, 0.79, 0.85, 0.90, 1.11, 1.46, 1.47 (2), 1.79, 1.85, 2.04, 2.25, 2.21, 2.89, 3.05, 4.50, 6.14, 9.50, 12.19, 24.73, 28.27, 79.53, 100.00, 119.63. (87 measurements)
20–300.01 (4), 0.05, 0.10 (13), 0.17, 0.18 (3), 0.19, 0.20 (5), 0.21 (2), 0.26, 0.30 (3), 0.34, 0.37, 0.40 (6), 0.42, 0.43 (4), 0.47 (2), 0.48, 0.50 (2), 0.51, 0.60 (2), 0.62, 0.67, 0.68 (2), 0.71, 0,79 (2), 0.82, 0.83, 0.85, 0.86, 0.92, 0.97, 1.41 (2), 1.60, 1.66, 1.74, 1.98, 2.11, 2.20, 2.31, 2.35, 2.62, 2.65, 2.88, 3.01, 3.18, 4.79, 15.90, 23.54, 62.29, 63.42. (88 measurements)
30–400.01 (6), 0.03 (4), 0.10 (10), 0.13, 0.16 (2), 0.18, 0.19, 0.20, 0.23 (2), 0.25 (2), 0.26, 0.27, 0.30 (7), 0.35 (2), 0.40 (3), 0.53 (2), 0.56, 0.65, 0.69, 0.70, 0.71, 0.84, 0.90, 0.91, 0.93, 0.97, 0.99, 1.00, 1.04, 1.19, 1.54, 1.67, 1.86, 1.91, 1.95, 2.00, 2.26, 2.31, 2.85, 2.87, 23.3. (71 measurements)
40–500.01, 0.03 (2), 0.07, 0.08, 0.09, 0.10 (3), 0.12, 0.07 (3), 0.23, 0,24 (3), 0.25, 0.30, (3), 0.32 (2), 0.34, 0.36, 0.40 (4), 0.43, 0.50, 0.52, 0.54, 0.55, 0.60, 0.63, 0.64, 0.66, 0.67, 0.71, 0.73, 0.86, 0.89, 0.97 (2), 1.00 (3), 1.10, 1.20, 1.25, 1.26, 1.34, 1.40, 1.61, 1.63, 1.71, 2.00, 2.05, 2.26, 2.28, 2.52, 2.59, 7.00 (2), 12.00, 13.68, 15.03, 22.70, 36.60, 60.00, 73.00. (72 measurements)
50–600.01, 0.03, 0.06, 0. 07, 0.09 (3), 0.10, 0.14, 0.16, 0.20, 0.21 (2), 0.25 (2), 0.26, 0.29, 0.30, 0.34 (3), 0.35, 0.36 (2), 0.37, 0.40 (2), 0.42, 0.43, 0.45, 0.49, 0.50 (2), 0.53, 0.62, 0.68, 0.70, 0.80 (2), 0.86, 0.90 (4), 0.93, 0.96, 1.00 (2), 1.13, 1.23 (2), 1.35, 1.45, 1.64, 1.75, 2.07, 2.16, 2.76, 4.00, 4.71, 6.00 (3) 7.00, 7.79, 8.23, 10.21, 20.09, 20.33, 22.33, 26.00, 27.00, 30.99, 63.00, 78.00. (75 measurements)
60–700.01 (2), 0.03, 0.15, 0.20, 0.41, 0.50 (2), 0.60, 0.63, 1.00, 1.56, 10.00, 18.09, 29.00, 32.00, 38.00, 39.00, 100.00. (19 measurements)
70–800.01, 0.19, 0.22, 0.74, 21.00, 24.00 (2), 31.00, 40.00, 73.00. (10 measurements)
80–900.01 (4), 0.10 (4), 0.23, 0.24, 0.30 (3), 0.50 (4), 1.00 (2), 1.60, 2.00, 2.20, 2.50, 3.00, 10.00, 14.50, 16.00, 43.00, 76.00. (29 measurements)
90–1000.10 (2), 0.50, 1.00 (5), 2.00 (2), 3.00, 3.10, 7.50, 9.00, 20.00, 22.00, 77.00. (17 measurements)
Table A7. Summary of all root tensile strengths, in MPa, measured for Arundo donax. Plant Type = Arundo donax; Total Number of Roots Measured = 89; Conversion = 1 kgf/cm2 = 0.1 MPa.
Diameter (mm)kgfkgf/cm2MPa
0.51.36173.2916.99
0.50.4151.955.09
0.61.64144.7414.19
0.60.9987.808.61
0.60.9382.588.10
0.60.9382.588.10
0.60.8877.377.59
0.85.01249.1824.44
0.83.31164.6816.15
0.82.79138.7613.61
0.82.37117.7711.55
0.81.9697.689.58
0.81.5174.907.35
0.81.3064.516.33
0.80.5828.652.81
0.93.02118.7211.64
0.92.1885.758.41
0.91.2850.304.93
0.91.2749.914.89
0.90.8533.523.29
0.90.5320.672.03
1.04.06129.2312.67
1.03.36106.8610.48
1.02.3273.787.24
1.02.2069.876.85
1.01.7455.295.42
1.01.6753.005.20
1.14.02105.7310.37
1.12.4063.006.18
1.11.5741.414.06
1.11.4538.073.73
1.11.0327.102.66
1.10.7920.892.05
1.24.3495.969.41
1.23.7482.678.11
1.23.3674.217.28
1.22.7260.175.90
1.22.0946.134.52
1.21.6135.503.48
1.35.69107.1710.51
1.35.37101.079.91
1.31.8534.843.42
1.31.8534.843.42
1.30.8916.741.64
1.49.07147.3314.45
1.48.80142.9814.02
1.43.0148.834.79
1.42.5942.064.12
1.41.1919.331.90
1.55.1873.287.19
1.55.0571.417.00
1.53.3547.394.65
1.52.9942.364.15
1.52.6637.603.69
1.64.0550.314.93
1.63.9148.554.76
1.78.0688.778.71
1.74.6150.814.98
1.74.2246.464.56
1.73.4237.673.69
1.71.4215.641.53
1.84.7446.574.57
1.84.3342.564.17
1.83.5835.203.45
1.83.1530.933.03
1.81.9318.941.86
1.81.7917.561.72
1.81.4714.481.42
1.98.7176.797.53
1.93.2428.572.80
20.1.209.530.93
2.00.685.380.53
2.121.09152.2414.93
2.110.1773.447.20
2.11.6211.721.15
2.26.1440.393.96
2.23.0620.101.97
2.39.2255.485.44
2.412.3768.356.70
2.47.2139.863.91
2.46.2734.643.40
2.58.2241.884.11
2.60.984.610.45
3.014.1750.104.91
3.17.3424.312.38
3.12.588.550.84
3.327.1979.487.79
10.068.1021.682.13
12.0158.900.350.03
Table A8. Summary of all root tensile strengths, in MPa, measured for Salix laevigata. Plant Type = Salix laevigata; Total Number of Roots Measured = 42; Conversion = 1 kgf/cm2 = 0.1 MPa.
Diameter (mm)kgfkgf/cm2MPa
0.52.101069.52104.88
0.50.42214.9221.08
0.70.68176.6917.33
0.81.43285.0927.96
0.81.27252.6624.78
0.92.20345.8233.91
1.04.69597.1558.56
1.03.93500.7749.11
1.02.10266.8726.17
1.14.18440.0643.15
1.14.09430.0642.17
1.12.86300.7429.49
1.12.45258.2325.32
1.12.23234.3422.98
1.24.80424.3241.61
1.22.95261.1025.61
1.20.8474.187.27
1.43.20207.8820.39
1.69.61477.8146.86
1.75.90259.8025.48
1.75.25231.2122.67
1.914.06495.7948.62
2.09.41299.5929.38
2.29.20242.1023.74
2.39.92238.6723.41
2.512.36251.8024.69
2.57.63155.3815.24
2.622.99432.9842.46
2.713.44234.8123.03
3.024.88351.9134.51
3.019.56276.7027.14
3.013.64192.9018.92
3.013.06184.8018.12
3.420.92230.4622.60
3.524.88258.5525.35
3.513.85143.9914.12
3.823.92210.9020.68
3.820.34179.3817.59
4.236.56263.8925.88
5.935.54130.0112.75
6.146.42158.8215.58
10.068.1086.718.50

References

  1. Dudley, T.L. Arundo donax. In Invasions Plants of California’s Wildlands; Bossard, C.C., Randal, J.M., Hoshovsky, M.C., Eds.; University of California Press: Berkeley, CA, USA, 2000; pp. 53–58. [Google Scholar]
  2. Bell, I.E.; Prentice-Dekker, B.B.; McKelvey, Z.; Steele, M. Economic Analysis of Invasive Giant Reed (Arundo donax) Control for the Lower Santa Clara River; Group Masters Project; Bren School of Environmental Science & Management, UC Santa Barbara: Santa Barbara, CA, USA, 2016. [Google Scholar]
  3. Bell, G. Ecology and management of Arundo donax, and approaches to riparian habitat restoration in southern California. In Plant Invasions: Studies from North America and Europe; Brock, J.H., Wade, M., Pysek, P., Green, D., Eds.; California Natural Resources Agency: Sacramento, CA, USA, 1997; pp. 103–113. [Google Scholar]
  4. Coffman, G. Factors Influencing the Invasion of Giant Reed (Arundo donax) in Riparian Ecosystems of Mediterranean-Type Climate Regions. Ph.D. Thesis, University of California Los Angeles, Los Angeles, CA, USA, 2007. [Google Scholar]
  5. Lambert, A.M.; Dudley, T.L.; Saltonstall, K. Ecology and impacts of the large-statured invasive grasses Arundo donax and Phragmites australis in North America. Invasive Plant Sci. Manag. 2010, 3, 489–494. [Google Scholar] [CrossRef]
  6. Stillwater Sciences. Geomorphic Assessment of the Santa Clara River Watershed: Synthesis of the Lower and Upper Watershed Studies, Ventura and Los Angeles Counties, California. Available online: http://www.ladpw.org/wmd/scr/docs/SCR_Geomorph%20Synthesis_SWS_2011_FINAL.pdf (accessed on 10 April 2018).
  7. Stillwater Sciences. Analysis of Riparian Vegetation Dynamics for the Lower Santa Clara River and Major Tributaries, Ventura County, California. Available online: http://s3-us-west-2.amazonaws.com/ucldc-nuxeo-ref-media/59ffdf02-975f-4f0f-898c-09422cb8538b (accessed on 10 April 2018).
  8. Ten Brinke, J. Effects of the Invasive Reed Arundo Donax on Rivers in Southern California. Ph.D. Thesis, University of California Santa Barbara, Santa Barbara, CA, USA, 2010; 87p. [Google Scholar]
  9. Rockwell, T. Neotectonics of the san cayetano fault, transverse ranges, California. Geol. Soc. Am. Bull. 1988, 100, 500–513. [Google Scholar] [CrossRef]
  10. Yeats, R.S. Evluation of fault hazard: Surface rupture vs. earthquake potential. Geol. Soc. Am. Abstr Programm. 1977, 9, 529. [Google Scholar]
  11. Azor, A.; Keller, E.A.; Yeats, R.S. Geomorphic indicators of active fold growth: South Mountain-Oak Ridge anticline, Ventura basin, southern California. Geol. Soc. Am. Bull. 2002, 117, 745–753. [Google Scholar] [CrossRef]
  12. Leopold, L.B.; Wolman, M.G. River Channel Patterns: Braiding, Meandering, and Straight; U.S. Geological Survey Professional Paper 262-B; US Government Printing Office: Washington, DC, USA, 1957; pp. 39–85.
  13. Eaton, B.C.; Millar, G.M.; Davidson, S. Channel patterns: Braided, anabranching, and single-thread. Geomorphology 2010, 120, 353–364. [Google Scholar] [CrossRef]
  14. Ventura County Watershed Protection District. 2010. Available online: www.vcw.org (accessed on 10 April 2018).
  15. Harrison, L.R.; Keller, E.A.; Mertes, L.A.K. Minimum Flow Requirements for Southern Steelhead Passage on the Lower Santa Clara River, CA; Prepared for The Nature Conservancy; University of California: Santa Barbara, CA, USA, 2006. [Google Scholar]
  16. Johnson, M.; Dudley, T.; Burns, C. Cal-IPC News: Seed production in Arundo donax? Available online: https://www.cal-ipc.org/wp-content/uploads/2017/03/Fall2006-6.pdf#page=12 (accessed on 10 April 2018).
  17. Khudamrongsawat, J.; Tayyar, R.; Holt, J.S. Genetic diversity of giant reed (Arundo donax) in the Santa Ana River, CA. Weed Sci. 2004, 52, 395–405. [Google Scholar] [CrossRef]
  18. Hickin, E.J. Vegetation and river channel dynamics. Can. Geogr. 1984, 28, 111–126. [Google Scholar] [CrossRef]
  19. Thorne, C.R. Effect of vegetation on riverbank erosion and stability. In Vegetation and Erosion; Thornes, J.B., Ed.; John Wiley & Sons: Chichester, UK, 1990; pp. 125–144. [Google Scholar]
  20. Hupp, C.R.; Osterkamp, W.R. Riparian vegetation and fluvial geomorphic processes. Geomorphology 1996, 14, 277–295. [Google Scholar] [CrossRef]
  21. Huang, H.Q.; Nanson, G.C. The influence of bank strength on channel geometry: An integrated analysis of some observations. Earth Surf. Process. Landf. 1998, 23, 865–876. [Google Scholar] [CrossRef]
  22. Millar, R.G. Influence of bank vegetation on alluvial channel patterns. Water Resour. Res. 2000, 36, 1109–1118. [Google Scholar] [CrossRef] [Green Version]
  23. Abernathy, B.; Rutherford, I.D. The effect of tree roots on the mass-stability of riverbanks. Earth Surf. Process. Landf. 2000, 25, 921–937. [Google Scholar] [CrossRef]
  24. Abernathy, B.; Rutherford, I.D. The distribution and strength of tree roots in relation to riverbank reinforcement. Hydrol. Process. 2001, 15, 63–79. [Google Scholar] [CrossRef]
  25. Simon, A.; Collison, A.J.C. Quantifying the mechanical and hydrologic effects of riparian vegetation on streambank stability. Earth Surf. Process. Landf. 2002, 27, 527–546. [Google Scholar] [CrossRef]
  26. Tal, M.; Gran, K.; Murray, A.B.; Paola, C.; Murray Hicks, D. Riparian vegetation as a primary control in multi-thread rivers. In Riparian Vegetation and Fluvial Geomorphology; Bennett, S.J., Simon, A., Eds.; American Geophysical Union: Washington, DC, USA, 2004. [Google Scholar]
  27. Gurnell, A.M.; Petts, G.E. Trees as riparian engineers: The Tagliamento River, Italy. Earth Surf. Process. Landf. 2006, 31, 1558–1574. [Google Scholar] [CrossRef]
  28. Stallins, J.A. Geomorphology and ecology: Unifying themes for complex systems in biogeomorphology. Geomorphology 2006, 77, 207–216. [Google Scholar] [CrossRef]
  29. Pollen, N. Temporal and spatial variability in root reinforcement of streambanks: Accounting for soil shear strength and moisture. Catena 2007, 69, 197–205. [Google Scholar] [CrossRef]
  30. Van De Wiel, M.J.; Darby, S.E. A new model to analyse the impact of woody riparian vegetation on the geotechnical stability of riverbanks. Earth Surf. Process. Landf. 2007, 32, 2185–2198. [Google Scholar] [CrossRef]
  31. Merritt, D.M. Reciprocal relations between riparian vegetation, fluvial landforms, and channel processes. In Treatise on Geomorphology; Shroder, J.F., Ed.; Academic Press: San Diego, CA, USA, 2013; pp. 219–243. [Google Scholar] [CrossRef]
  32. Dean, D.J.; Schmidt, J.C. The role of feedback mechanisms in historic channel changes of the lower Rio Grande in the Big Bend region. Geomorphology 2015, 126, 333–349. [Google Scholar] [CrossRef]
  33. Manners, R.B.; Wilcox, A.C.; Kui, L.; Lightbody, A.F.; Stella, J.C.; Leonard, S.; Sklar, L.S. When do plants modify fluvial processes? Plant-hydraulic interactions under variable flow and sediment supply rates. J. Geophys. Res. Earth Surf. 2015, 120. [Google Scholar] [CrossRef]
  34. Fei, S.; Phillips, J.; Shouse, M. Biogeomorphic impacts of invasive species. Annu. Rev. Ecol. Evol. Syst. 2014, 45, 69–87. [Google Scholar] [CrossRef]
  35. Endo, T.; Tsuruta, T. On the Effect of Tree Roots upon Shearing Strength of Soil; Annual Report of the Hokkaido Branch, Forest Place Experimental Station; Hokkaido Research Organization: Sapporo, Japan, 1969; pp. 167–183. [Google Scholar]
  36. Wu, T.H.; McKinnell, W.P., III; Swanston, D.N. Strength of tree roots and landslides on Prince of Wales Island, Alaska. Can. Geotech. J. 1979, 16, 19–33. [Google Scholar] [CrossRef]
  37. Pollen, N.; Simon, A. Estimating the mechanical effects of riparian vegetation on stream bank stability using a fiber bundle model. Water Resour. Res. 2005, 41, W07025. [Google Scholar] [CrossRef]
  38. Simon, A.; Curini, A.; Darby, S.E.; Langendoen, E.J. Bank and near-bank processes in an incised channel. Geomorphology 2000, 35, 193–217. [Google Scholar] [CrossRef]
  39. Simon, A.; Pollen-Bankhead, N.; Thomas, R.E. Development and application of a deterministic bank stability and toe erosion model for stream restoration. In Stream Restoration in Dynamic Fluvial Systems: Scientific Approaches, Analyses, and Tools; Simon, A., Bennett, S.J., Castro, J.M., Eds.; Geophysical Union: Washington, DC, USA, 2011; Volume 194, pp. 453–474. [Google Scholar]
  40. United States Department of Agriculture, Agriculture Research Service. Bank Stability and Toe Erosion Model. 2016. Available online: https://www.ars.usda.gov/southeast-area/oxford-ms/national-sedimentation-laboratory/watershed-physical-processes-research/research/bstem/overview/ (accessed on 10 April 2018).
  41. Pollen-Bankhead, N.; Simon, A. Enhanced application of root-reinforcement algorithms for bank-stability modeling. Earth Surf. Process. Landf. 2009, 34, 471–480. [Google Scholar] [CrossRef]
  42. Magillian, F.J.; Nislow, K.H.; Renshaw, C.E. Flow regulation by dams. In Treatise on Geomorphology; Volume 9 Fluvial Geomorphology; Shroder, J., Wohl, E., Eds.; Academic Press: San Diego, CA, USA, 2013; pp. 794–808. [Google Scholar]
  43. Corenblit, D.; Tabacchi, E.; Steiger, J.; Gurnell, A.M. Reciprocal interactions and adjustments between fluvial landforms and vegetation dynamics in river corridors: A review of complementary approaches. Earth Sci. Rev. 2007, 84, 56–86. [Google Scholar] [CrossRef]
  44. Zegeye, A.D.; Langendoen, E.J.; Tilahun, S.A.; Mekuria, W.; Poesen, J.; Steenhuls, T.S. Root reinforcement to soil provided by common Ethiopian highland plants for gully erosion control. Ecohydrology 2018, e1940. [Google Scholar] [CrossRef]
Figure 1. Map of the Santa Clara River drainage basin showing the location of study sites (S1 and S2) and stream gauging stations used in this study.
Geosciences 08 00304 g001
Figure 2. Photograph of A. donax in the floodplain of the Santa Clara River at study site S1. Height of plants in this picture exceeds 5 m tall.
Geosciences 08 00304 g002
Figure 3. Stand of native vegetation containing S. laevigata at study site S2.
Geosciences 08 00304 g003
Figure 4. A. donax debris wrapped around and defending a small island from erosion in the Santa Clara River (S2) following a flood. The debris may later sprout and further defend the island.
Geosciences 08 00304 g004
Figure 5. Maximum extent of Arundo donax (black) and other vegetation (grey) at site S1 measured from aerial photograph years that represent the maximum amount of time since the last major flood. A. donax has increased 350% at a growth rate of 2.2 ha/year. Flow is from right to left. Locations of cross sections where channel characteristics were measured are shown.
Geosciences 08 00304 g005
Figure 6. Maximum extent of Arundo donax (black) and native vegetation (grey) for site S2 mapped from aerial photograph years that represent the maximum amount of time since the last flood. Flow is from bottom to top. Locations of cross sections where channel characteristics were measured are shown.
Geosciences 08 00304 g006
Figure 7. Average intensity of braiding over time for sites S1 and S2. Intensity of braiding is the mean number of channels measured from cross sections (see Figure 1) for a given reach. Dotted lines at y = 2.0 and 1.0 show a braiding envelope where most values lie between these points. High magnitude floods occurred at S1 in 1978, 1983, 2005, 2006 and S2 in 1969, 1998 and 2005.
Geosciences 08 00304 g007
Figure 8. Average active channel width over time for sites S1 and S2. Selected flood discharges are shown.
Geosciences 08 00304 g008
Figure 9. Average vegetation width over time for sites S1 and S2. Selected flood discharges are shown.
Geosciences 08 00304 g009
Figure 10. The mean number of roots (per square meter) for A. donax and S. laevigata at different depths in the bank profile.
Geosciences 08 00304 g010
Figure 11. The mean number of roots greater than 10 mm in diameter (per square meter) for A. donax and S. laevigata.
Geosciences 08 00304 g011
Figure 12. Regression of root diameter (mm) to tensile strength (MPa) for both A. donax and S. laevigata. S. laevigata is the top equation and A. donax is the bottom equation.
Geosciences 08 00304 g012
Figure 13. Factor of Safety for a coarse sand bank of 30 degrees, unsaturated conditions with bare bank soils (no vegetation), A. donax vegetation, or S. laevigata vegetation. Dashed lines at FS 1.0 and 1.3 are critical value when driving and resisting forces are equal (FS = 1) and conditional stability (FS = 1.3).
Geosciences 08 00304 g013
Figure 14. Profile and soils of a surveyed bank on a channel bar in the Santa Clara River measured at site S2.
Geosciences 08 00304 g014
Figure 15. Comparison of tensile strength and root diameter relationship to the relationship found [24] for two large Australian trees, Red River Gum and Swamp Paperbark to those found in this study for A. donax and S. laevigata.
Geosciences 08 00304 g015
Figure 16. Idealized diagram of how bank failures may develop with channel banks and floodplain dominated by A. donax.
Geosciences 08 00304 g016
Figure 17. Bank failure: Cantilever bank failure in 2009 (site S1) caused by A. donax being undercut below the tough near-surface root system.
Geosciences 08 00304 g017
Table 1. Summary of aerial photograph information for site S1. See Figure 1 for location map.
YearResolution (Pixel Width in Meters)ScaleSource
20091.51:24,000Ventura County Watershed Protection District
20071.01:24,000Ventura County Watershed Protection District
20061.51:24,000Ventura County Watershed Protection District
20051.51:24,000Ventura County Watershed Protection District
20041.51:24,000Ventura County Watershed Protection District
20031.51:24,000Ventura County Watershed Protection District
20021.51:24,000Ventura County Watershed Protection District
20001.51:24,000Ventura County Watershed Protection District
19991.01:24,000Pacific Western Aerial Surveys
19941.01:24,000Pacific Western Aerial Surveys
19690.51:24,000UC Santa Barbara Maps and Imagery Laboratory
19661.01:24,000UC Santa Barbara Maps and Imagery Laboratory
Table 2. Summary of aerial photograph information for site S2. See Figure 1 for location map.
YearResolution (Pixel Width in Meters)ScaleSource
20093.01:24,000Ventura County Watershed Protection District
20073.01:24,000Ventura County Watershed Protection District
20063.01:24,000Ventura County Watershed Protection District
20053.01:24,000Ventura County Watershed Protection District
20043.01:24,000Ventura County Watershed Protection District
20033.01:24,000Ventura County Watershed Protection District
20023.01:24,000Ventura County Watershed Protection District
20003.01:24,000Ventura County Watershed Protection District
19941.01:24,000Pacific Western Aerial Surveys
19921.01:24,000Pacific Western Aerial Surveys
19891.01:24,000Pacific Western Aerial Surveys
19841.01:24,000Pacific Western Aerial Surveys
19811.01:24,000Pacific Western Aerial Surveys
19782.01:24,000US Department of Agriculture
Table 3. Summary of soil parameter values used for the theoretical bank to calculate factor of safety in bank model BSTEM 5.2 [25].
Bank Material Size (mm)Angle of Internal Friction (Degrees)Cohesion (kPa)Saturated Unit Weight (kN·m−3)Matric Suction (Degrees)
0.352701815
Table 4. Summary of input values used for the surveyed bank profile to calculate factor of safety in bank model BSTEM 5.2.
LayerThickness (m)Bank Material Size (mm)Angle of Internal Friction (Degrees)Cohesion (kPa)Saturated Weight (kN·m−3)Matric Suction (Degrees)
Bank Top
10.30.352701815
20.70.352701815
30.111.33602015
40.30.352701815
Table 5. Summary of number of roots by size class input into the RipRoot Model.
Size Classes (mm)<11.01–22.01–33.01–55.01–1010.01–20>20.01
Arundo donax1077711211020
Salix laevigata27033177850
Table 6. Summary of results of vegetation mapping for sites S1 and S2.
SiteYearSparse Veg (km2)Dense Veg (km2)A. donax (km2)Tot. Veg * (km2)Percent A. donax ** (% of tot. veg)
S120090.281.160.791.4455
20040.291.120.741.4152
19920.230.960.521.1944
19810.350.750.171.1015
S220090.160.020.230.4157
20040.250.080.210.5439
19990.150.190.110.3432
19940.030.340.050.3712
* Amount of total vegetation present and includes A. donax. ** Amount that A. donax comprises of all vegetation present and equals the amount of A. donax divided by total vegetation.
Table 7. Summary of effects of 2005 flood on the removal and re-growth of Arundo donax and native vegetation.
SiteVeg. Type2004 Pre-Flood (km2)2005 Post-Flood (km2)Percent Removed (%)2009 Re-Growth (km)Growth Rate (ha/year)
S1A. donax0.740.28620.7912.75
Native Veg.0.670.39420.656.6
S2A. donax0.210.13380.232.5
Native Veg.0.330.02940.183.9
Table 8. Comparison of mean number of roots of different sizes at different depths for A. donax and S. laevigata.
Mean Number of Roots Per m2
Root Size ClassFine Roots (<1–3 mm)Medium Roots (3–10 mm)Large Roots (>10 mm)
Depth in Profile (cm)Arundo donaxSalix laevigataArundo donaxSalix laevigataArundo donaxSalix laevigata
0–107255316718460
10–203325134279640
20–304205404201627
30–404084674007
40–504044201213047
50–60172387453060
60–70928000047
70–80242700047
80–904015307033
90–100067027020
Table 9. Mean number of fine, medium and large roots per m2 for A. donax and S. laevigata.
Mean Number of Roots Per m2
Size ClassFine: <1–3 mmMedium: 3–10 mmLarge: >10 mm
A. donax196430
S. laevigata3211537
Table 10. Comparison of root properties from this study to those from the literature.
Plant TypeCommon NameMean Age (years)RAR **Cohesion (kPa)Source
Arundo donaxArundo152.83 × 10−23.3This study
Arundo donaxArundoN/A6.0 × 10−21.2[34]
Salix laevigataRed Willow156.40 × 10−28.6This study
Salix nigraBlack Willow58.70 × 10−52[25]
Panicum vigratumSwitch Grass51.40 × 10−418[25]
Melaleuca ericifoliaSwamp PaperbackN/A3.50 × 10−1N/A *[24]
* Value not reported in the study or different method used and, therefore, not compatible. ** RAR (root area ratio) was measured at the base of the plant.

