Article

Ancient Microbial Activity in Deep Hydraulically Conductive Fracture Zones within the Forsmark Target Area for Geological Nuclear Waste Disposal, Sweden

1
Department of Biology and Environmental Science, Linnaeus University, 392 31 Kalmar, Sweden
2
Department of Biology, University of Southern Denmark, Campusvej 55, 5230 Odense, Denmark
3
Department of Geosciences, Swedish Museum of Natural History, Box 50 007, 104 05 Stockholm, Sweden
*
Author to whom correspondence should be addressed.
Geosciences 2018, 8(6), 211; https://doi.org/10.3390/geosciences8060211
Submission received: 24 April 2018 / Revised: 4 June 2018 / Accepted: 7 June 2018 / Published: 11 June 2018

Abstract

:
Recent studies reveal that organisms from all three domains of life—Archaea, Bacteria, and even Eukarya—can thrive under energy-poor, dark, and anoxic conditions at large depths in the fractured crystalline continental crust. There is a need for an increased understanding of the processes and lifeforms in this vast realm, for example, regarding the spatiotemporal extent and variability of the different processes in the crust. Here, we present a study that set out to detect signs of ancient microbial life in the Forsmark area—the target area for deep geological nuclear waste disposal in Sweden. Stable isotope compositions were determined with high spatial resolution analyses within mineral coatings, and mineralized remains of putative microorganisms were studied in several deep water-conducting fracture zones (down to 663 m depth), from which hydrochemical and gas data exist. Large isotopic variabilities of δ13Ccalcite (−36.2 to +20.2‰ V-PDB) and δ34Spyrite (−11.7 to +37.8‰ V-CDT) disclose discrete periods of methanogenesis, and potentially, anaerobic oxidation of methane and related microbial sulfate reduction at several depth intervals. Dominant calcite–water disequilibrium of δ18O and 87Sr/86Sr precludes abundant recent precipitation. Instead, the mineral coatings largely reflect an ancient archive of episodic microbial processes in the fracture system, which, according to our microscale Rb–Sr dating of co-genetic adularia and calcite, date back to the mid-Paleozoic. Potential Quaternary precipitation exists mainly at ~400 m depth in one of the boreholes, where mineral–water compositions corresponded.

Graphical Abstract

1. Introduction

The deep continental biosphere is a potentially vast microbial habitat, and it has been estimated that 2–19% of the global biomass may be accumulated within it [1]. However, our knowledge of this biosphere is still scarce, largely owing to the difficulty of accessing samples (cost efficiently) from this realm. Observations have, therefore, been limited to a few sites with deep boreholes or to underground constructions, such as research tunnel facilities and deep mines. Studies of modern microbial activity in the continental deep biosphere include, but are not limited to, works in South African mines [2,3,4], Canadian mines [5], deep research boreholes, and underground facilities in Sweden [6,7,8,9,10], Finland [11,12,13,14,15], and Japan [16,17], showing a high degree of site-specificity on the microbial community profiles. A diverse biosphere consisting of archaea, bacteria, and recently, also eukaryotes (mainly fungi), has been detected at considerable depths; several kilometers for prokaryotes [4,18], and at least 700–800 m for fungi [19,20]. In general, the metabolisms tend to shift from dominantly heterotrophic, at shallow depth in the crust, to autotrophic at greater depth [18,21,22]. In addition, compositions of deep gases (e.g., methane) and dissolved compounds in groundwater have been used as indicators for microbial activity and for related substrate sources [13,23,24,25,26,27,28]. Signs of ancient microbial activity have been surveyed by isotopic investigations of minerals formed in response to microbial activity in deep fracture systems [29,30,31,32], and by detection of fossilized microorganisms, and preserved organic remains [30,33,34] and their compound specific isotope signatures [35,36]. Diagnostic C isotope signatures for anaerobic oxidation of methane have been detected in calcite from several hundred meters depth at different Swedish sites using high-spatial resolution analysis within minerals, and these findings that date back to Paleozoic times [29,30]. Similarly, sulfur isotope signatures diagnostic for microbial sulfate reduction have been shown to be widespread in pyrite precipitated in the fracture systems at the Laxemar site in Sweden [37], and the Olkiluoto site in Finland [38]. Due to the overall few observations of ancient life signatures in the crystalline continental crust, there is a need for more observations, particularly regarding how widespread the different microbial processes are in space and time in this realm. Here, we present high spatial resolution isotope determinations in secondary minerals from deep water-conducting bedrock fractures in the Forsmark area, Sweden, an area dominated by Paleoproterozoic crystalline bedrock that has been subjected to numerous events of fracture reactivations [39]. This site is the target area for the deep repository for spent nuclear fuel in Sweden [40]. Our study is focused in packed off borehole sections with water-conducting fractures within the target bedrock volume for the repository (Figure 1), in contrast to earlier reconnaissance studies of regional character [32]. Drill core samples of mineral-coated water-conducting fractures were collected from borehole sections, where hydrochemical and gas compositions have been determined. The main focus was on the newly drilled deep pilot borehole for the future skip shaft (borehole KFM24, Figure 1). The objective of the study can be divided into a general aim: to provide new knowledge of microbial processes and their depth distribution over long time spans in the continental deep biosphere; and a site-specific aim: to determine how microbial processes and hydrochemical conditions have varied over time in deep water-conducting fractures within the target area for a nuclear waste repository. At this site, deep Quaternary infiltration of glacial and marine waters is evident [41]. Therefore, the study also explores whether there are any potentially Quaternary mineral precipitates in the deep fracture system, and whether the isotopic signatures in the mineralogical record match the hydrochemical and microbiological record in the waters currently residing in the fractures.

2. Materials and Methods

2.1. Materials and Site

Samples were collected from four deep cored boreholes (KFM01D, KFM02A, KFM08D, and KFM24) drilled by the Swedish Nuclear Fuel and Waste Management Co (SKB) within the target repository area for spent nuclear fuel at the Forsmark site in eastern Sweden (Figure 1). The target area is located in a tectonic lens bordered by the regional Singö and Eckerfjärden deformation zones. The rock in the area is Proterozoic in age (crystallization age is 1.89–1.86 Ga [43]), and dominantly consisting of metamorphosed granitoids with subordinate amphibolite and volcanic rocks. Several events of Proterozoic and Paleozoic fracturing and fracture mineralization have been documented at the site [29,32,39,44,45]. The dominating rock type in the boreholes is a medium-grained and foliated metagranite–granodiorite. The fracture frequency for open fractures in the boreholes is 0.6–1.5 fractures/m, and for sealed fractures, 1.0–5.9 fractures/m [46,47].
Seventeen open fractures containing calcite and pyrite (Table 1) were sampled from seven hydraulically conductive fracture zones, where comprehensive hydrochemical characterization (and limited microbial and gas characterization) have been carried out by SKB in packed off borehole sections. Flow log measurements e.g., [48,49] were used to distinguish the most likely conductive fractures for mineral analysis in each packed off section. The quality controlled hydrochemical, gas, and microbiological data from the borehole sections have been extracted from the SKB site database (Sicada) for this study, and are presented in Table 2 and Table S1, and the methodology for sampling and analysis is described in detail elsewhere [50,51,52].
The groundwaters in the sampled sections are according to the site coding [50] of brackish non-marine origin (KFM01D:431, KFM08D:670 first sampling in time series, and KFM08D:830) or a mixture of the latter water type with glacial water (all sections in KFM24, and KFM08D:670 second sampling in time series). In KFM01D:316 there is a post-glacial brackish marine water component (post-glacial Littorina sea stage) in addition to the glacial/brackish non-marine water. These compositions reveal that there has been Quaternary infiltration and mixing of different surficial water types at large depth in the fracture system, which may have triggered mineral supersaturation and precipitation. For the KFM02A samples, hydrochemical data from a nearby fracture is used. The Cl concentrations in the boreholes vary from 2000 mg/L in the shallow KFM24 section (195 m) to 8000 mg/L in the deep section in KFM08D (830 m). The dissolved inorganic carbon (HCO3) and sulfate concentrations are highest (75 and 273 mg/L, respectively) in the KFM01D:316 section, which has a Littorina Sea stage component, whereas the other sections have concentrations in the ranges 6–36 and 9–125 mg/L, respectively. Dissolved organic carbon (DOC) varied from below detection (1 mg/L) to 14.7 mg/L (Table 2). Ca2+ occurred at 400–3000 mg/L. Mn2+ and Fe2+ occurred in detectable amounts in most waters, which is in line with what is expected in deep anoxic waters. From a structural and hydrogeological perspective, the borehole sections with minor fracture zones and single conductive fractures sampled in KFM01D and KFM24 are most representative for the target area, whereas the samples from KFM08D are from a major fracture zone.
During sampling and further preparation, the samples were treated with gloved hands and sterile tools like tweezers and chisels to minimize introduction of post-drilling contaminations.
The number of cells of microorganisms in the waters were previously presented for three borehole sections [53], and were highest in KFM01D:431 (total number of 250,000 cells/mL, based on staining technique), whereas KFM08D:670 and 830 had lower counts (21,000 and 11,000, respectively) [8]. These estimates are based on most probable number method, and for comparison, more recent analysis by direct cell counts from boreholes with similar DOC levels at the Äspö Hard Rock Laboratory, Sweden, place the cell numbers in the range of 100s per mL [6]. Methanogens were around or below detection limit (0.2 cells/mL). Sulfate-reducing bacteria (SRB) were in the range 2–13 cells/mL, whereas acetogens, and bacteria that reduce nitrate, iron, and manganese had one to three orders of magnitude higher cell counts (all based on viable counts).

2.2. Sample Preparation and Scanning Electron Microscopy

Sample characterization and mineral identification was carried out directly on the fracture surfaces of the core samples using a Hitachi S-3400N SEM (Hitachi, Tokyo, Japan) equipped with an integrated energy dispersive spectroscopy (EDS) system under low-vacuum conditions. The pyrite and calcite crystals were then handpicked from the fracture surface under the microscope, embedded in epoxy mounts (ø = 1 inch), and polished to expose cross-sections of the crystal interiors. The polished crystals had sizes from 20 to 500 µm, and were examined with SEM prior to isotopic analysis in order to detect zonations, impurities, and cracks. Low-temperature K-feldspar (adularia) crystals, being co-genetic with pyrite and calcite (as revealed by SEM investigation), were handpicked from a fracture surface and used for LA-ICP-MS in situ Rb–Sr dating. Characterization of fossilized microorganisms was carried out by environmental scanning electron microscopy (ESEM) directly on the fracture surface using a Philips XL30 microscope (Semtech Solutions, Billerica, MA, USA) with a field emission gun (XL30 ESEM-FEG) equipped with an Oxford x-act EDS, backscatter electron detector, and a secondary electron detector (Oxford corp., Oxford, England). The acceleration voltage was 20 kV, and low-vacuum conditions were used on uncoated samples. The instrument was calibrated with a cobalt standard. Peak and element analyses were made using the Aztec software (Oxford corp.). Since the cores can be colonized by microorganisms during storage, this characterization was only done on the newly retrieved core, KFM24, shortly after drilling. In addition, in order to minimize the potential influence from contamination and post-drilling colonization, characterization focused on partly sealed fractures that were mechanically opened with a chisel just prior to introduction into the SEM.

2.3. Secondary Ion Mass Spectrometry (SIMS) for Stable S, O, and C Isotopes

Intracrystal SIMS-analysis (10 μm lateral beam dimension, 1–2 μm depth dimension) of sulfur isotopes in pyrite and carbon and oxygen isotopes in calcite was performed on a CAMECA IMS1280 ion microprobe (CAMECA, Gennevilliers, France), following the analytical settings and tuning reported previously [30,37,54,55].
Sulfur was sputtered using a 133Cs+ primary beam with 20 kV incident energy (10 kV primary, −10 kV secondary) and a primary beam current of ~1.5 nA. A normal incidence electron gun was used for charge compensation. Analyses were performed in automated sequences, with each analysis comprising a 70 s pre-sputter to remove the gold coating over a rastered 15 µm × 15 µm area, centering of the secondary beam in the field aperture to correct for small variations in surface relief and data acquisition in sixteen four second integration cycles. The magnetic field was locked at the beginning of the session using an NMR field sensor. Secondary ion signals for 32S and 34S were detected simultaneously using two Faraday detectors with a common mass resolution of 4860 (M/ΔM). Data were normalized for instrumental mass fractionation using matrix matched reference materials, which were mounted together with the sample mounts and analyzed after every sixth sample analysis. Results are reported as per mil (‰) δ34S based on the Vienna Canon Diablo Troilite (V-CDT)-reference value. Analytical transects of up to nine spots were made from core to rim in the crystals. Two to six crystals were analyzed from each fracture sample (median n = 5). In total, 179 analyses were made for δ34S (34S/32S) of pyrite from 37 crystals. The pyrite reference material S0302A with a conventionally determined value of 0.0 ± 0.2‰ (R. Stern, University of Alberta, pers. comm.) was used. Typical precision on a single δ34S value, after propagating the within-run and external uncertainties from the reference material measurements was ±0.10‰.
For calcite, a total number of 252 δ13C and 220 δ18O SIMS-analyses were performed on the same CAMECA IMS1280 described above. Settings follow those described for S isotopes, with some differences: O was measured on two Faraday cages (FC) at mass resolution 2500, whereas C used a FC/EM combination, with mass resolution 2500 on the 12C peak and 4000 on the 13C peak to resolve it from 12C1H. Influence of organic carbon was avoided in the SIMS-analyses by careful spot placement to areas in the crystals without microfractures or inclusions and at a sufficient distance from grain-boundaries, where fine-grained clusters of other minerals and remnants of organic material may appear. The uncertainty associated with potential organic inclusions and matrix composition is therefore considered to be insignificant compared to the isotopic variations. Calcite results are reported as per mil (‰) δ13C and δ18O, based on the Vienna Pee Dee Belemnite (V-PDB) reference value. Analyses were carried out running blocks of six unknowns bracketed by two standards. Isotope data from calcite were normalized using calcite reference material S0161 from a granulite facies marble in the Adirondack Mountains, kindly provided by R.A. Stern (Univ. of Alberta). The values used for instrumental mass fractionation correction were determined by conventional stable isotope mass spectrometry at Stockholm University on ten separate pieces, yielding δ13C = −0.22 ± 0.11 ‰V-PDB (1 std. dev.) and δ18O = −5.62 ± 0.11 ‰ V-PDB (1 std. dev.). Precision was δ18O: ±0.2–0.3‰ and δ13C: ±0.4–0.5‰. Values of the reference material measurements are listed in Tables S4 (C), S5 (O), and S7 (S).

2.4. LA-(MC-)ICP-MS Analyses for 87Sr/86Sr and Rb–Sr Dating

Following SEM-investigation of the fracture surface, fine-grained secondary adularia and calcite were handpicked and mounted in epoxy for Rb–Sr dating. The spot analyses were carried out following sample characterization of the polished crystals. Rb/Sr analysis of the outermost growth zone in the adularia (co-genetic with calcite) was performed at the Department of Earth Sciences, University of Gothenburg, Sweden, using an ESI 213NWR laser ablation system connected to an Agilent 8800QQQ ICP-MS with an ORS3 (octopole reaction system) reaction cell sandwiched between two quadrupoles. Following laser warm-up, ablation occurred with static spot mode in a constant He flow (800 mL/min). The ablated material was mixed with N2 and Ar before entering the ICP-MS torch region, and ionized atoms reacted with N2O gas in the reaction cell to chemically separate 87Rb from 87Sr, and thereby enable calculation of 87Rb/86Sr and 87Sr/86Sr ratios [56]. While the octopole bias was set to negative voltage, N2O flow rates in the reaction cell were varied to obtain optimal SrO+ production rates. In MS/MS mode, both quadrupoles were controlled while reactive gas was in the reaction cell with the quadrupoles set at different masses to measure reaction products in mass-shifted mode. On mass 85Rb/mass-shifted 86Sr and mass-shifted 87Sr/mass-shifted 86Sr raw ratios were used to calculate 87Rb/86Sr and 87Sr/86Sr, respectively. The raw ratios were converted by correction factors derived from repeated analysis reference materials NIST SRM 610, BCR-2G, and Mica-Mg. The reference materials were selected to ensure that the pulse/analog setting of each measured isotope was identical in samples and reference materials. The feasibility of using NIST SRM 610, BCR-2G and Mica-Mg for calibration of Rb–Sr isotopic data obtained by in situ LA-ICP-MS/MS has been discussed previously [56,57]. The NIST SRM 610 certified reference material with 87Sr/86Sr of 0.7097 [58] was used for 87Sr/86Sr ratio calibration of the sample data. 87Rb/86Sr calibration was performed by using glass reference material BCR-2G [59]. Secondary reference material was Mica-Mg, a mineral powder of a phlogopite separate pressed to a nanopellet tablet [56]. The resulting ages of Mica-Mg in this study were 519 ± 26 Ma. This was comparable to the 519.4 ± 6.5 Ma age determining the 87Rb/86Sr ratio of Mica-Mg to 154.00 ± 0.70 [56]. For 87Rb/86Sr and 87Sr/86Sr respectively, BCR-2G yielded precisions at 1.39% and 0.43%, while NIST SRM 610 yielded 1.43% and 0.40%, and Mica-Mg gave 1.74% and 0.92%. Average count rate calculation of the reference material data was conducted by Glitter©, while sample data reduction and within-run error calculation of selected elements and isotopic ratios were performed using an in-house spreadsheet. No error propagation from uncertainties in literature data or within-run errors of reference materials was applied to sample errors.
The 87Sr/86Sr values of the calcite crystals were determined by LA-MC-ICP-MS analysis at the Vegacenter, Swedish Museum of Natural History, Stockholm, Sweden using a Nu plasma (II) MC-ICP-MS, and an ESI NWR193 ArF eximer laser ablation system. Ablation frequency was 15 Hz, spot size 80 μm, and fluence 2.8 J/cm2, and the same crystal growth zones analyzed with SIMS for C and O isotopes were targeted. Wash-out and ablation times were both 45 s. The 87Sr/86Sr analyses were normalized to an in-house brachiopod reference material “Ecnomiosa gerda” (linear drift and accuracy correction) using a value established by TIMS of 0.709181 (2 sd 0.000004, [60]). A modern oyster shell from Western Australia was used as a secondary reference material, and analyzed at regular intervals together with the primary reference. The accuracy of these analyses was quantified by comparison to the modern seawater value for 87Sr/86Sr of 0.7091792 ± 0.0000021 [61]. Values of the reference material measurements are listed in Table S6.

3. Results

3.1. Mineralogy

Calcite was more abundant on the fracture surfaces than pyrite. The crystal morphologies and paragenetic assemblages varied between the different fractures (Figure 2). The KFM01D samples and the shallowest KFM24 samples featured fine-grained subhedral calcite aggregates, the KFM02A calcite occurred as thin slickenfibres, and the KFM08D calcite as equant crystals on euhedral quartz. In the KFM24 samples from 379 to 414 m, euhedral calcite crystals (mostly of equant type with small c-axis to a-axes ratio) and cubic, octahedral, and pyritohedral pyrite were observed on top, and intergrown with euhedral quartz, and occasionally, euhedral adularia. Chlorite and clay minerals were usually present on the fracture surfaces. There were also small patches of organic material in the form of solid hydrocarbon (asphaltite) and filamentous material (described in more detail below) on the fracture surfaces, particularly in the KFM24 samples at 379 and 396–399 m. Accessory minerals in the latter samples included euhedral bastnäsite and scattered galena. In KFM24:412, pyrite occurred as cryptocrystalline aggregates in addition to larger single crystals.

3.2. Isotope Signatures in Calcite, Waters, and Gases

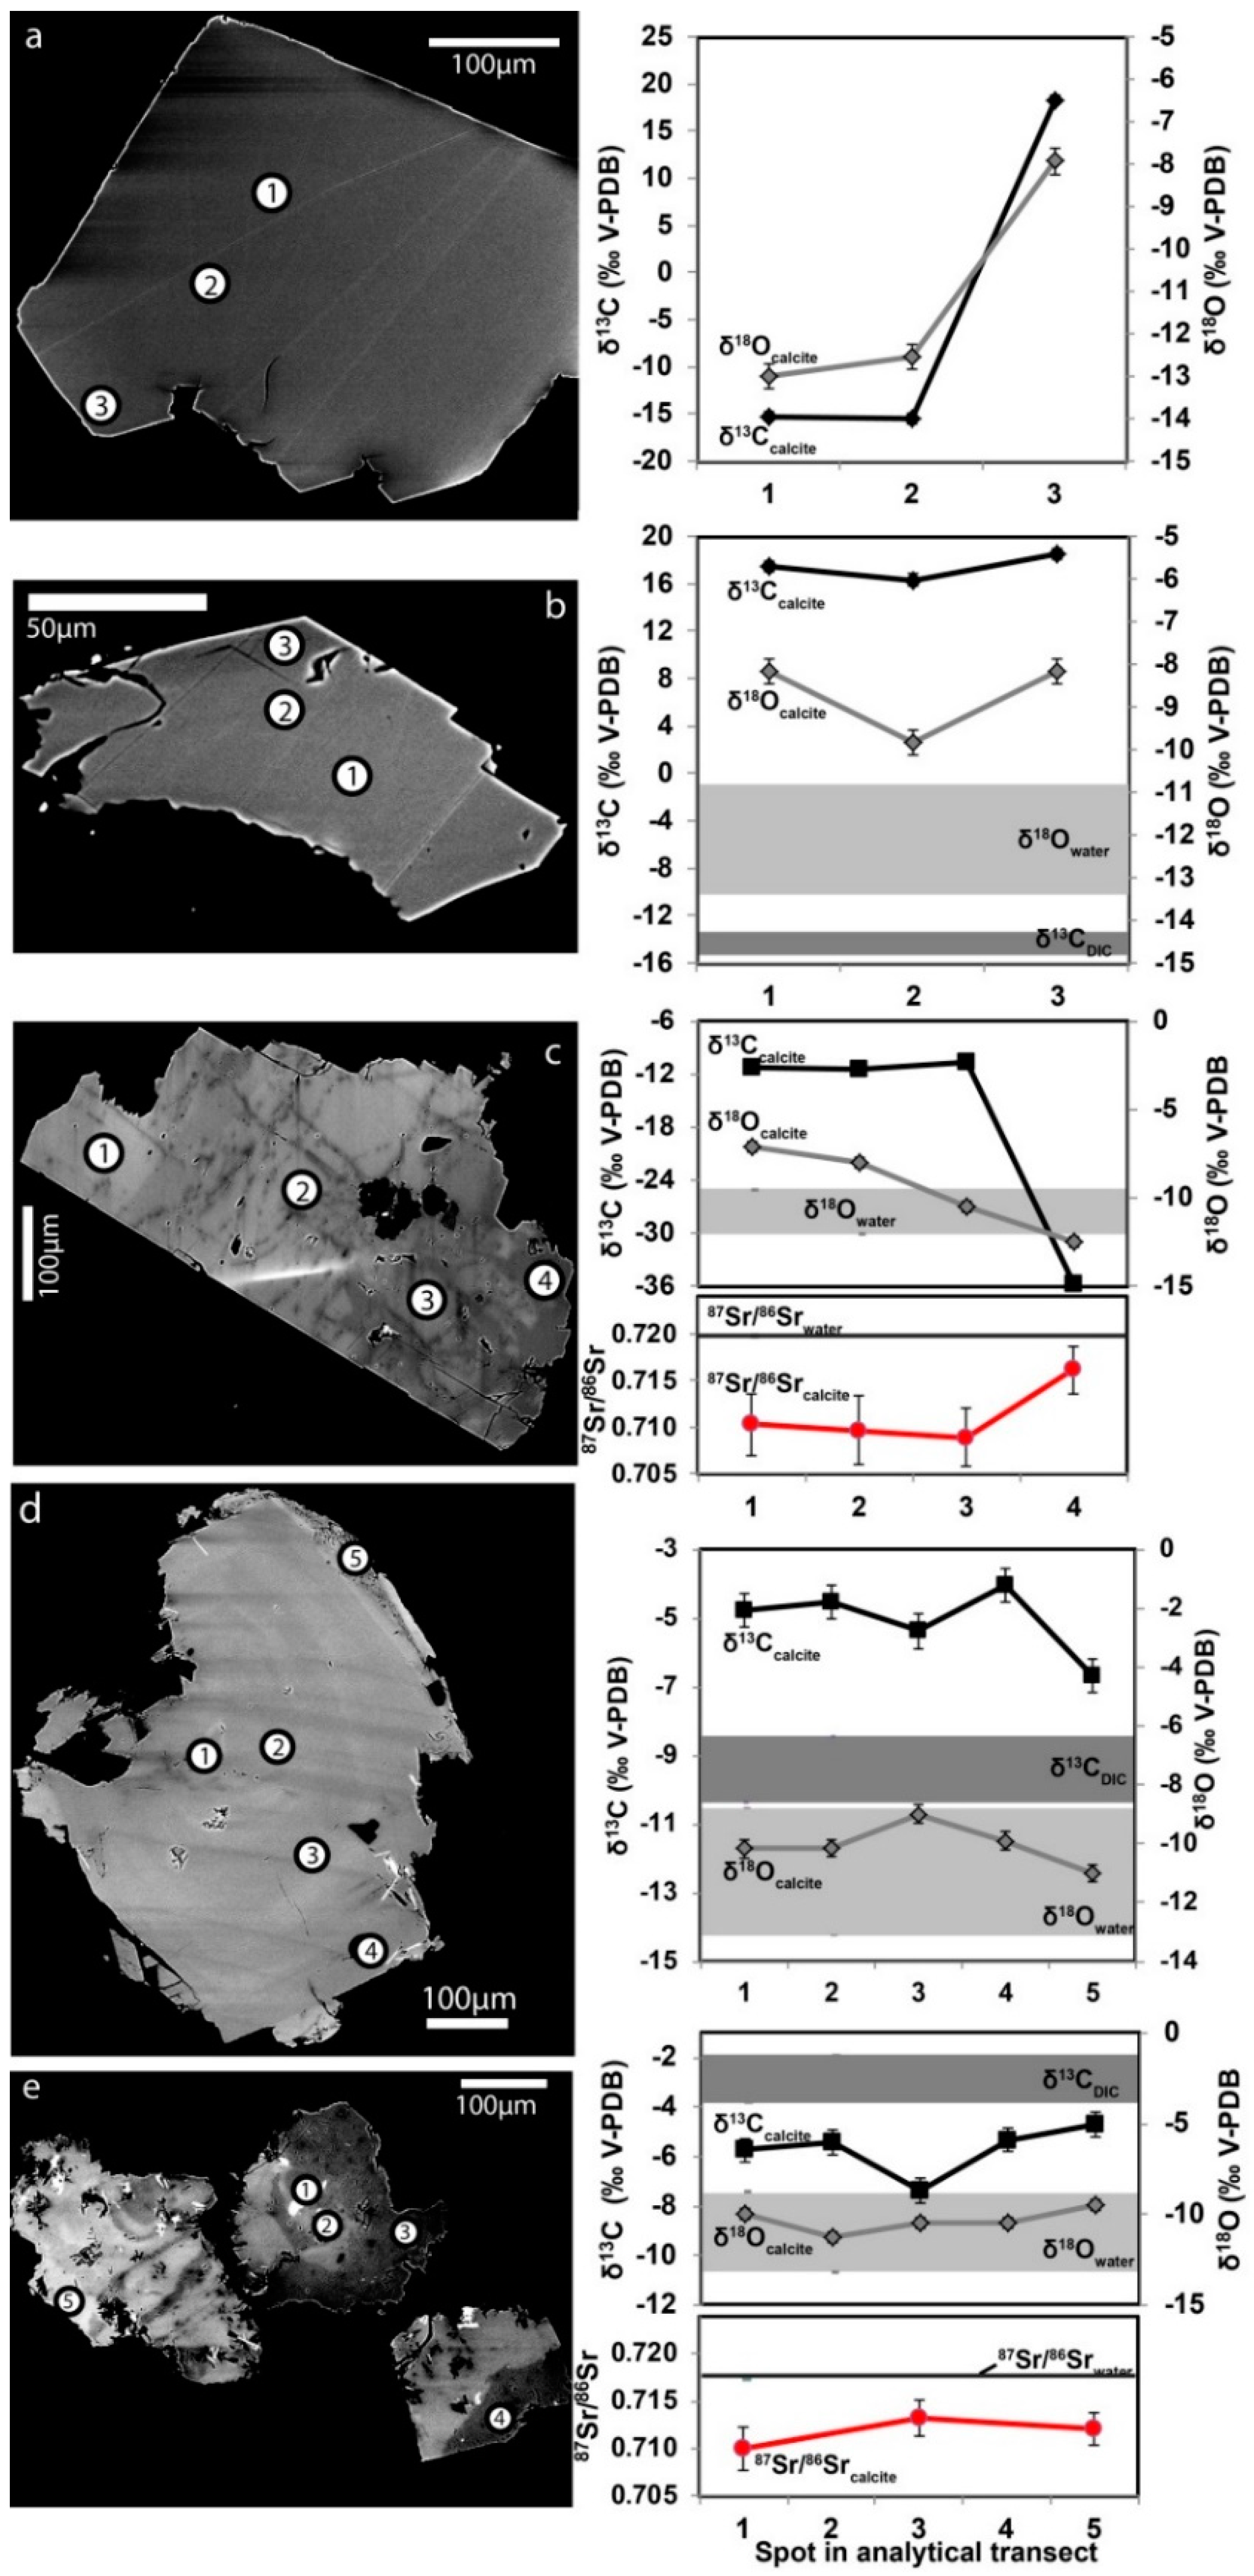
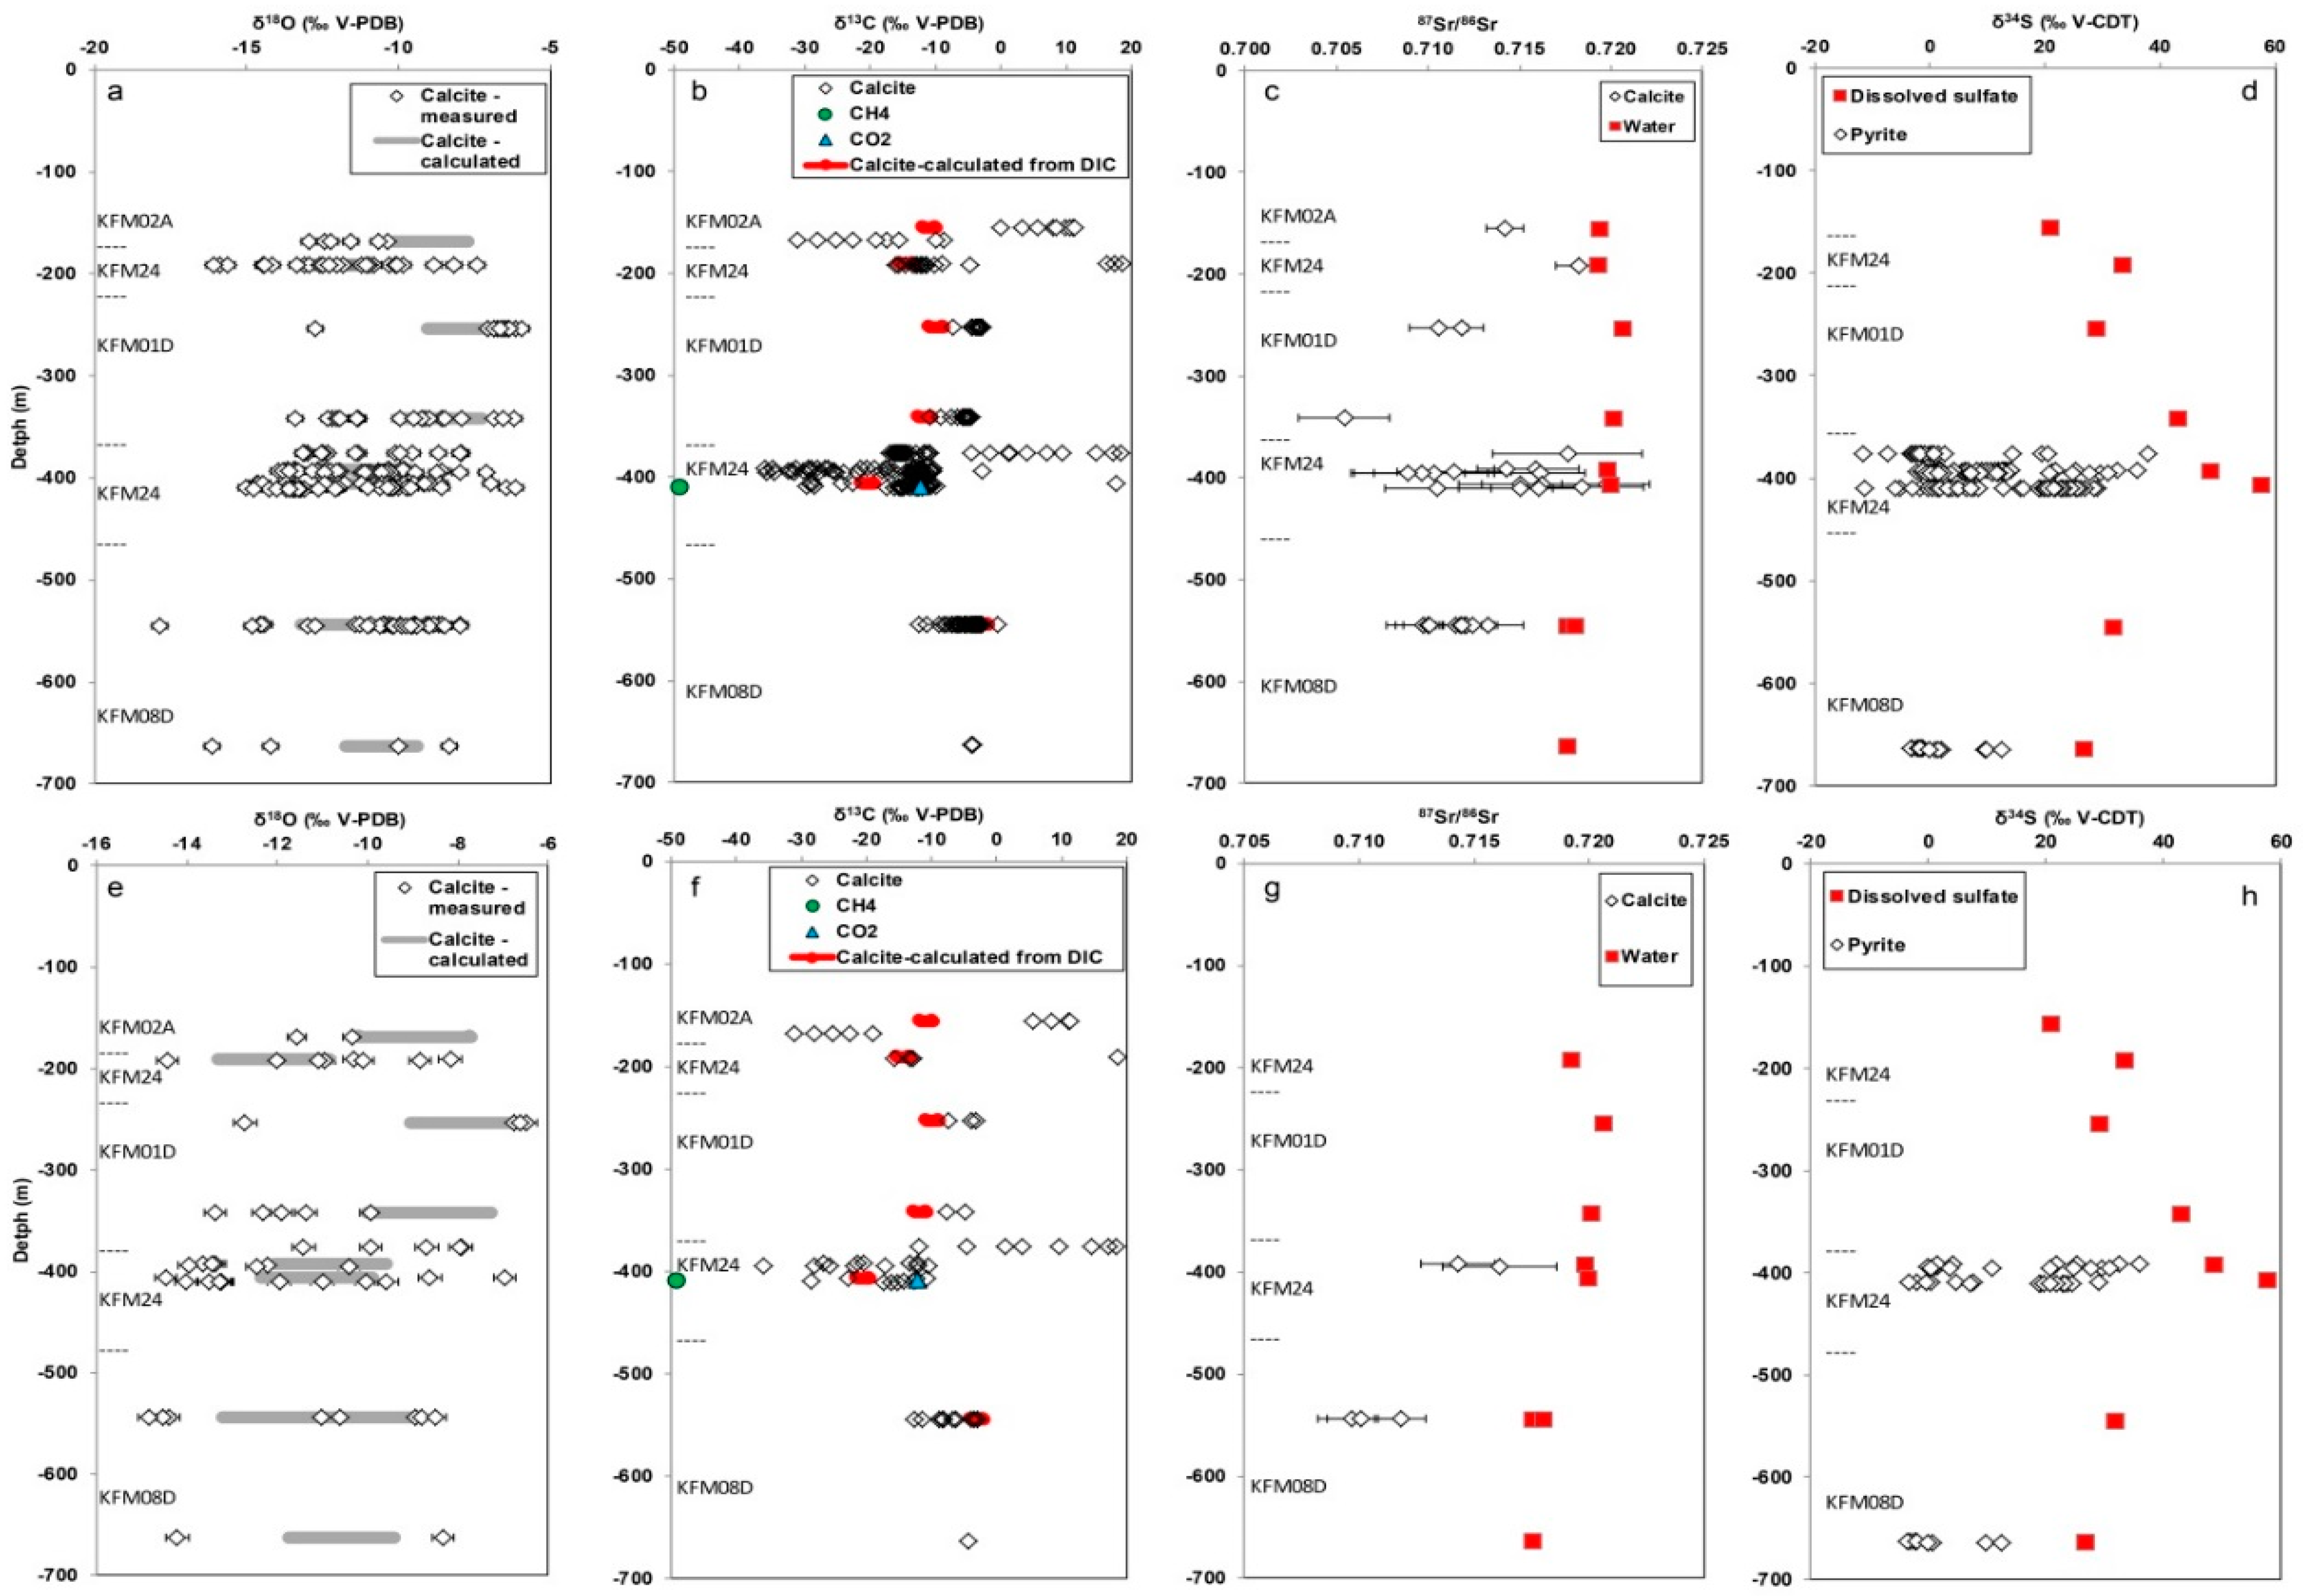
3.2.1. Carbon Isotopes and Gas Compositions

The carbon isotope composition varied substantially between and within the calcite samples. The total span in δ13Ccalcite was 56.4‰ (−36.2 to +20.2‰, span of each sample is listed in Table 1 and full SIMS results in Table S2). Four samples contained δ13Ccalcite values >>0‰ (KFM24: 193, 379 and 410, and KFM02A:162). In KFM24: 193 it was just one analysis out of seventeen showing these heavy values, in KFM24:379 the 13C-rich values were only found in the outermost rim of the crystals (Figure 3a) whereas crystals in the other two samples were dominantly 13C-rich (Figure 3b). The other samples can be divided into two groups based on the δ13Ccalcite values; (i) KFM01D:316, 431 and KFM08D:677, 830, and 832, as a rule, had values in the range −10 to −3‰, with small variations within the crystals (Figure 3d,e), and (ii) the remainder of the KFM24 samples and the KFM02A sample mainly showed δ13Ccalcite values from −36‰ to −10‰, and with large variation within the crystals (Figure 3c). This means that significant span in δ13Ccalcite was limited to samples from boreholes KFM02A and KFM24 (Figure 4b).
For the waters, the δ13C values of dissolved inorganic carbon (δ13CDIC) were in the −21.9 to −4.5‰ PDB range, but with a large variation between the different section (heaviest in KFM08D:677 and lightest in KFM24:410). The KFM24:410 δ13CDIC value is slightly uncertain, due to potential short circuiting at the end of a time series sampling (i.e., the hydrochemical composition gradually changed to that same as the section above, due to suspected interconnection between the conductive fractures in these two sections). The second lowest δ13CDIC value of the sample set was −15.9‰ (KFM24:191). The KFM24:410 section was sampled for gases, and contained 0.18 mL/L CH4 and had a methane to higher hydrocarbon ratio, C1/(C2 + C3), of 170, δ13CCH4, and δ2HCH4 values of −49.3‰ V-PDB (duplicate: −50.4‰) and −227‰ V-SMOW (Vienna Standard Mean Ocean Water, duplicate: −242‰), respectively (Table 2). With the exception of section KFM01D:316, which had higher methane concentrations (0.64 mL/L) and C1/(C2 + C3) ratio (~2300), the gas samples from the other borehole sections had quite similar concentrations of methane (0.09–0.19 mL/L) and C1/(C2 + C3) ratios (25–160), but no gas isotope analyses have been carried out from these samples.

3.2.2. Oxygen Isotopes

The δ18Ocalcite values had a total span of 12‰ V-PDB (−17.9‰ to −5.9‰). Most values (percentiles 10 to 90, P10-P90) were, however, in the −14 to −8‰ range, and heavier values than −7‰ were dominantly from KFM01D:316. Apart from this sample, there was no major depth variation in δ18Ocalcite (Figure 4a). The maximum variation within a single crystal was 7‰, and temporal variation trends could be discerned within the crystals, e.g., increasing values in the rim of crystal compared to the core (Figure 3a) or the opposite (Figure 3c), in both cases, correlated with the evolution of δ13Ccalcite. The δ18O values in the waters varied between −13.9‰ to −10.0‰ V-SMOW.

3.2.3. Strontium Isotopes

Strontium isotope ratios within the crystals were overlapping with—but generally lower than—the corresponding values in the groundwaters (0.705−0.720, P10-P90:0.710−0.718 in the calcite vs 0.718−0.721 in the water, Figure 4c, Table 1, Table 2 and Table S2). 87Sr/86Sr was generally elevated in the outermost growth zones compared to the crystal core (Figure 3c,e). It should be noted that the uncertainty of the Sr isotope analyses was relatively large due to the low concentrations of Sr in the calcite. The larger spot size of the Sr-isotope determinations (80 µm) compared to C and O (10 µm) inhibit full comparisons in finely zoned crystals. The fine outermost calcite growth zone could only be targeted in a small number of crystals, due to that the growth zone was smaller than the spot size, which inhibited direct 87Sr/86Sr comparison of waters and the outermost calcite growth zones for some sections (Figure 4g).

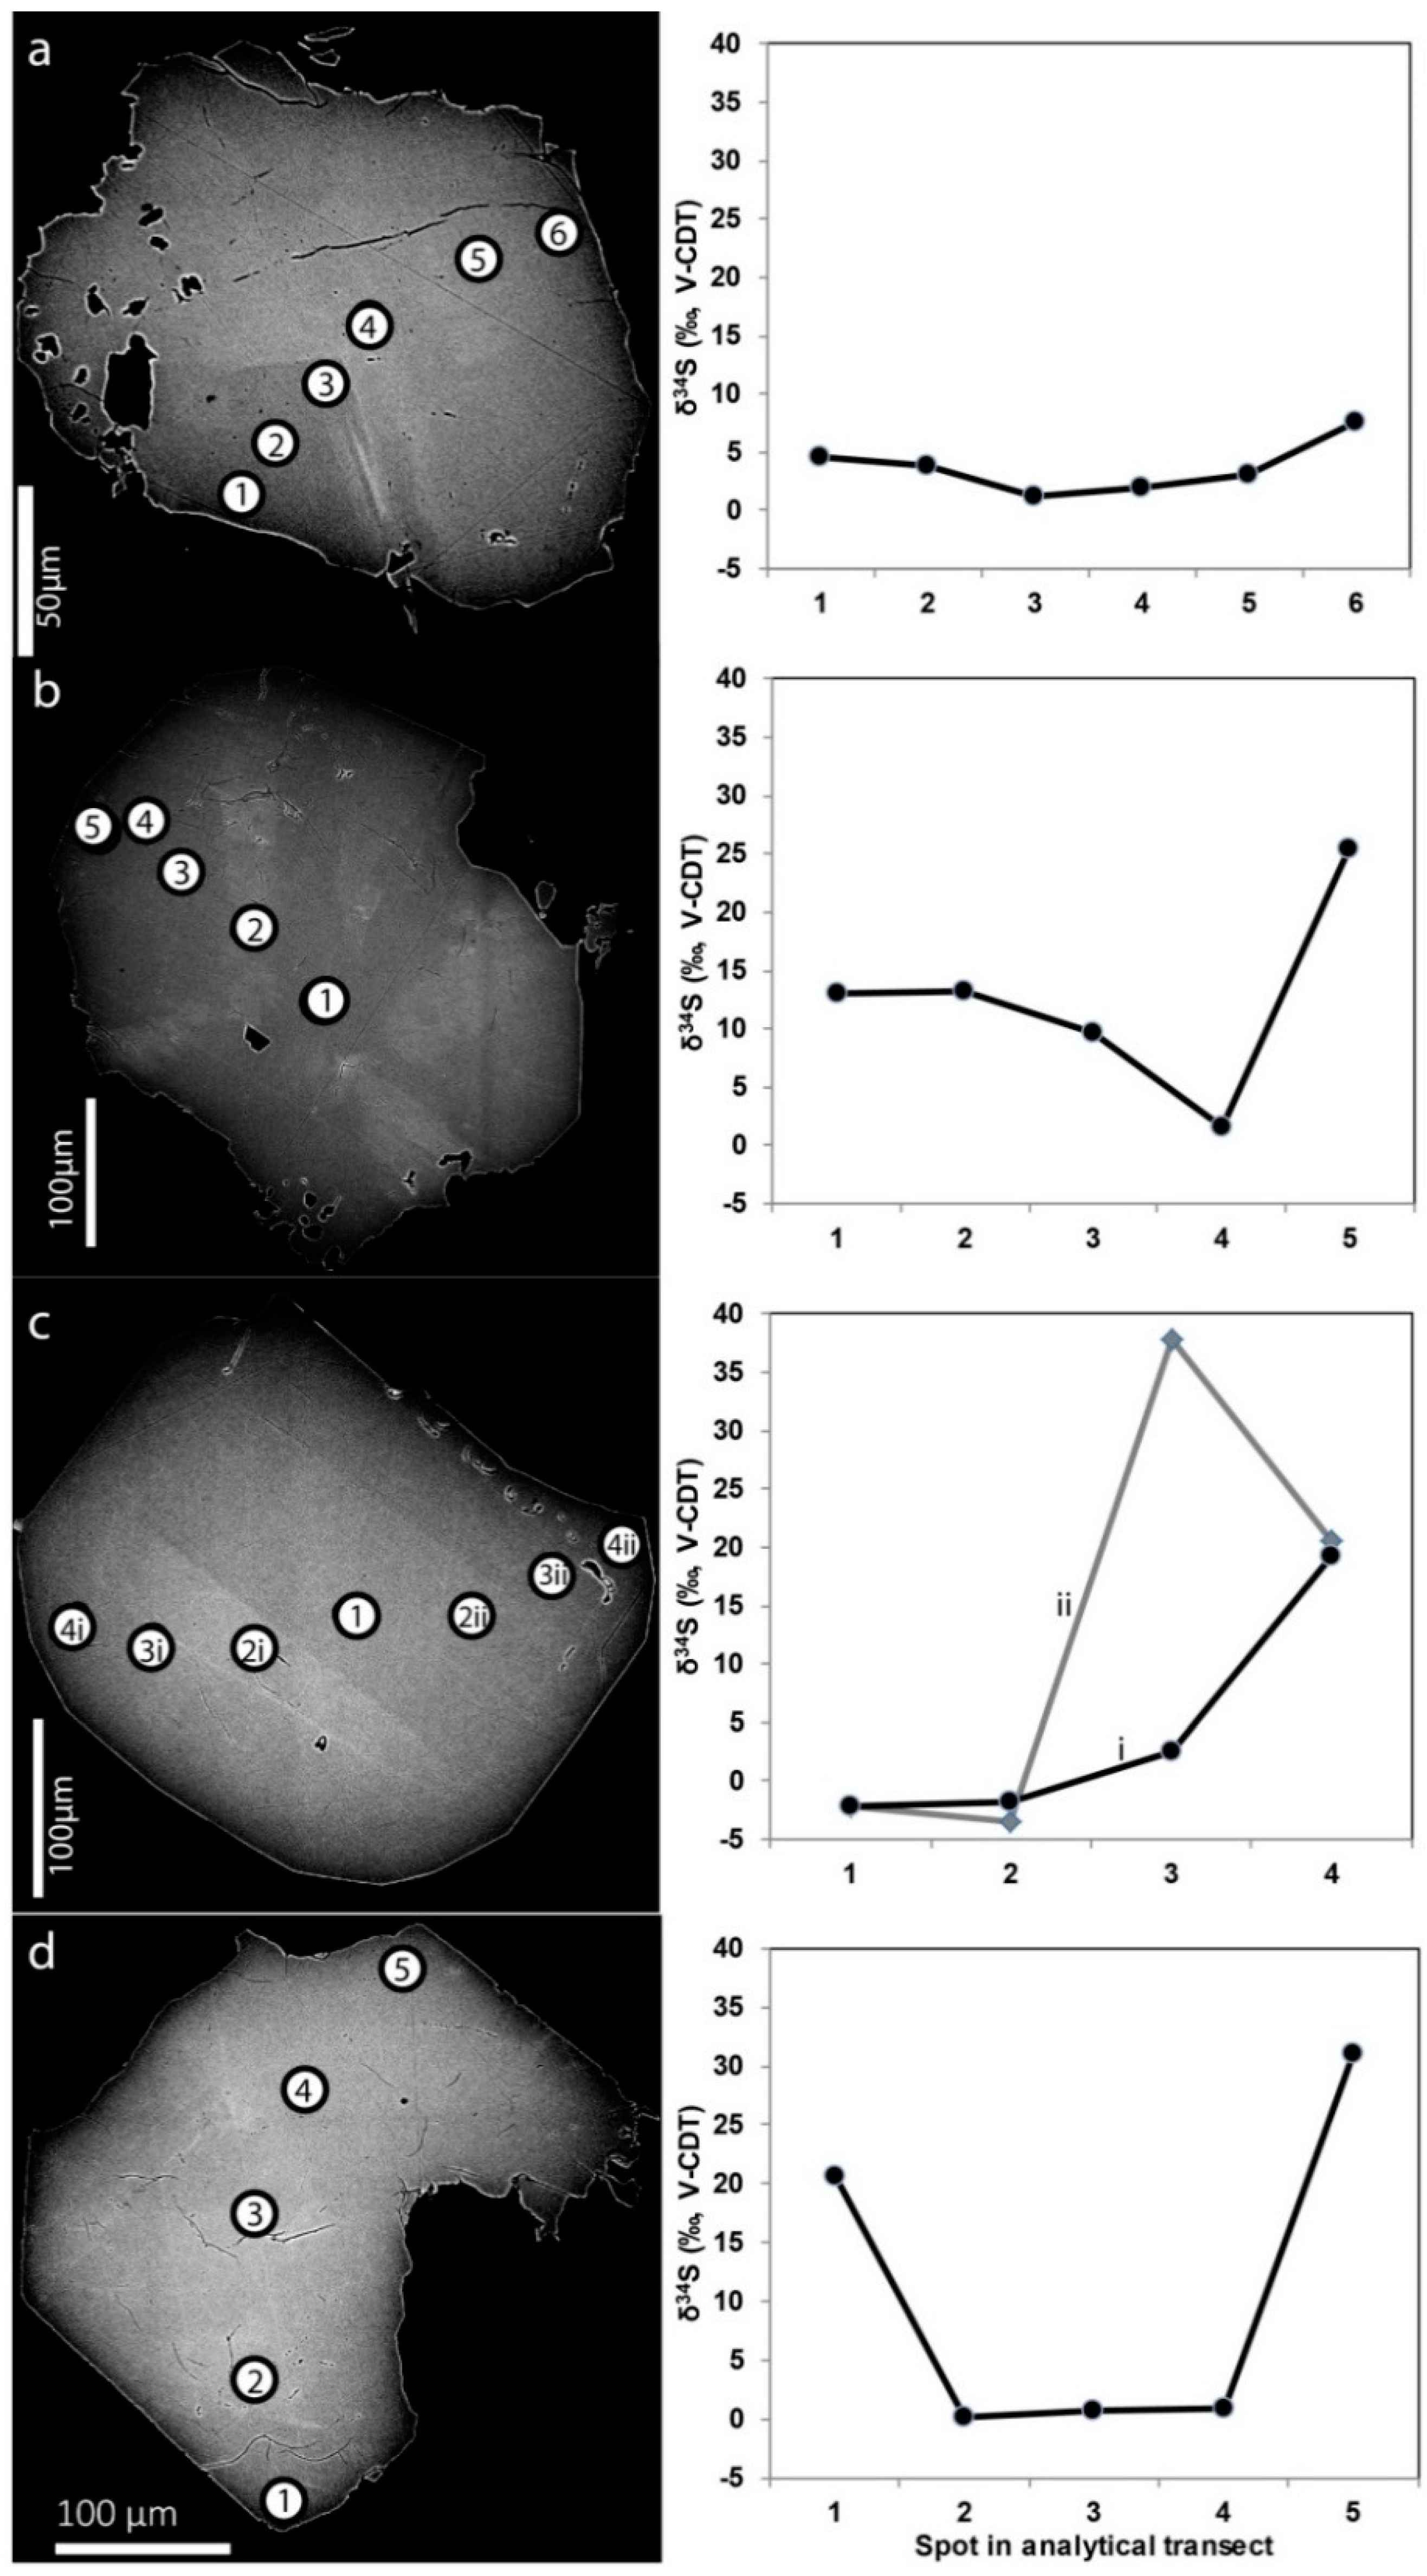
3.2.4. Sulfur Isotopes
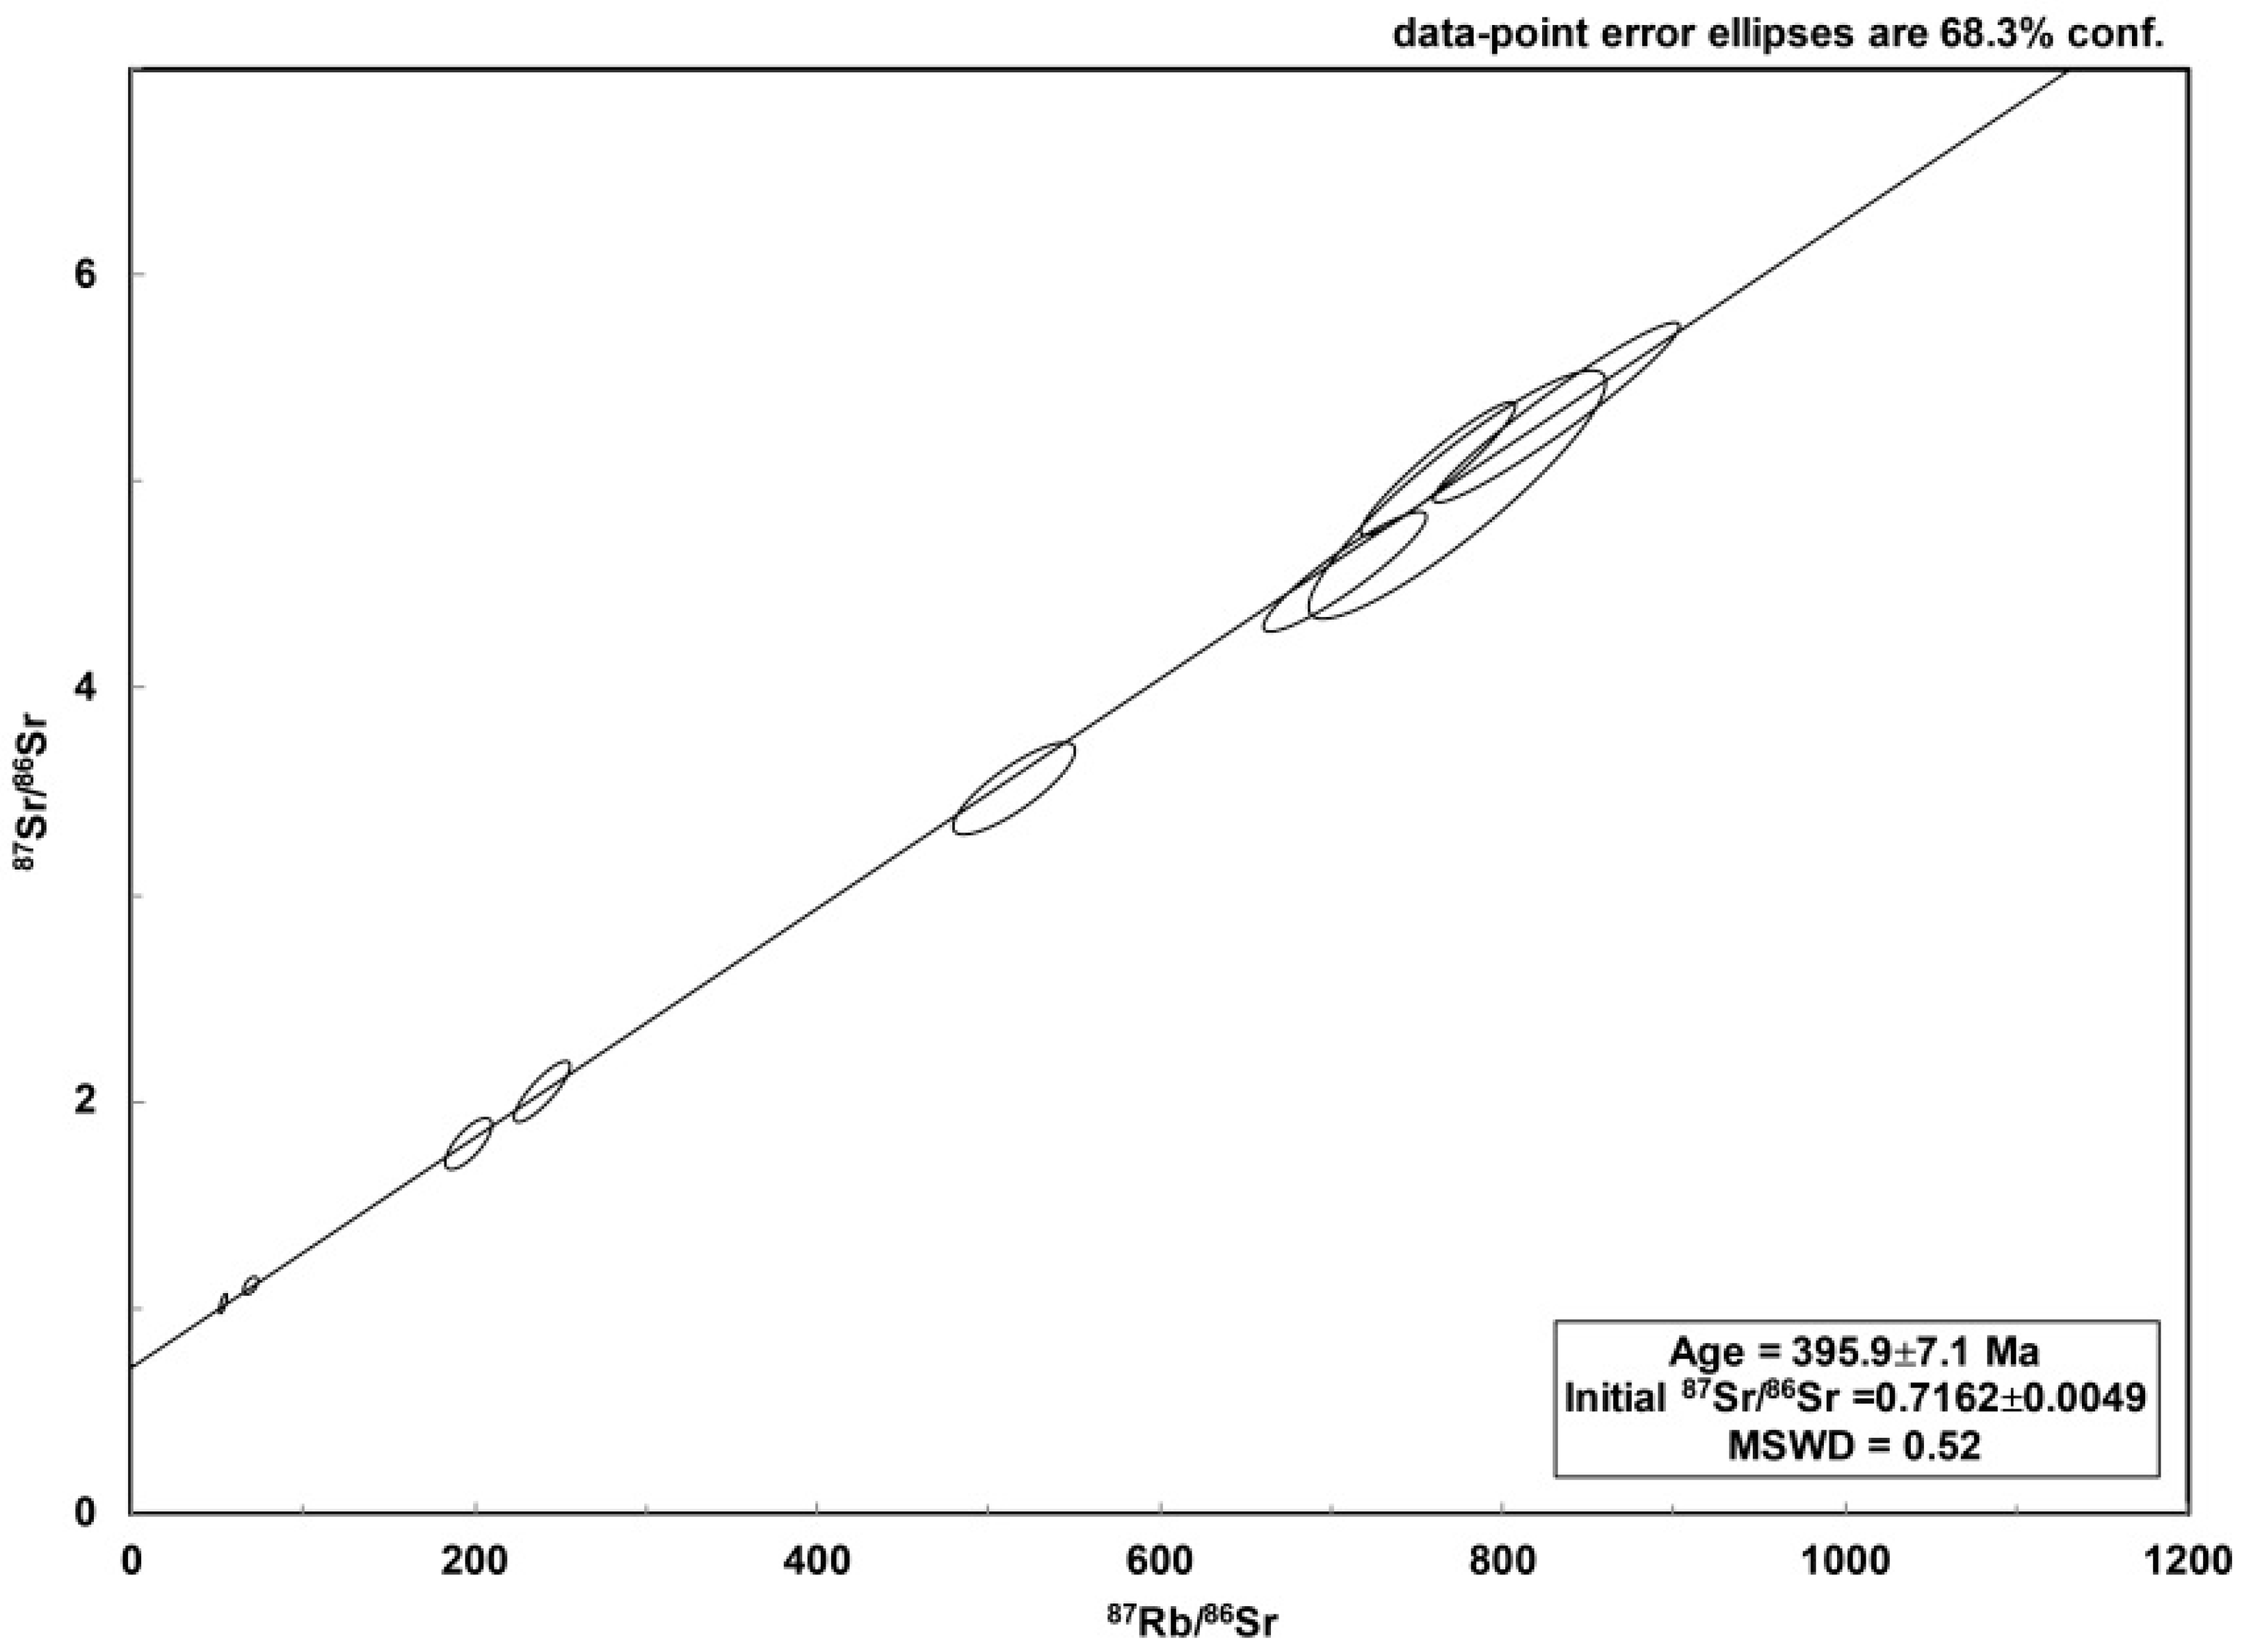
The δ34Spyrite values of the samples varied between −11.7‰ to +37.8‰ V-CDT (span of each sample is listed in Table 1 and full SIMS results in Table S3). Pyrite was not as abundant and evenly distributed as calcite, and consequently, the depth distribution pattern is not as complete (Figure 4d). The variability was larger in borehole KFM24 than in KFM08D. Microanalytical transects of δ34Spyrite within individual crystals showed two distinct groups: (1) relatively small variation between different growth zones (Figure 5a, in the deepest KFM24 section at variable δ34S in different crystals, and in KFM08D), and (2) significant increase in δ34Spyrite in the outermost growth zone(s) (Figure 5b–d), which dominated in the middle section in KFM24, and existed in the deeper section of the same borehole. The increase from crystal core to rim exceeded 40‰.
The groundwater δ34Ssulfate values varied between +20.8‰ to +57.5‰ (Figure 4d), and was particularly elevated in deeper sections of KFM24 (deepest section: +57.5‰ and middle section +48.5‰, Table 2).

3.2.5. Rb–Sr Dating

The secondary adularia–calcite assemblage in sample KFM24:399 gave an age of 396 ± 7 Ma (Figure 6, isotopic ratios in Table S8). The isochron consisted of nine adularia spots and a calcite spot for initial 87Sr/86Sr. The isochron gave a mean square weighted deviation (MSWD) of 0.52 and a probability of fit of 0.84 (maximum = 1).

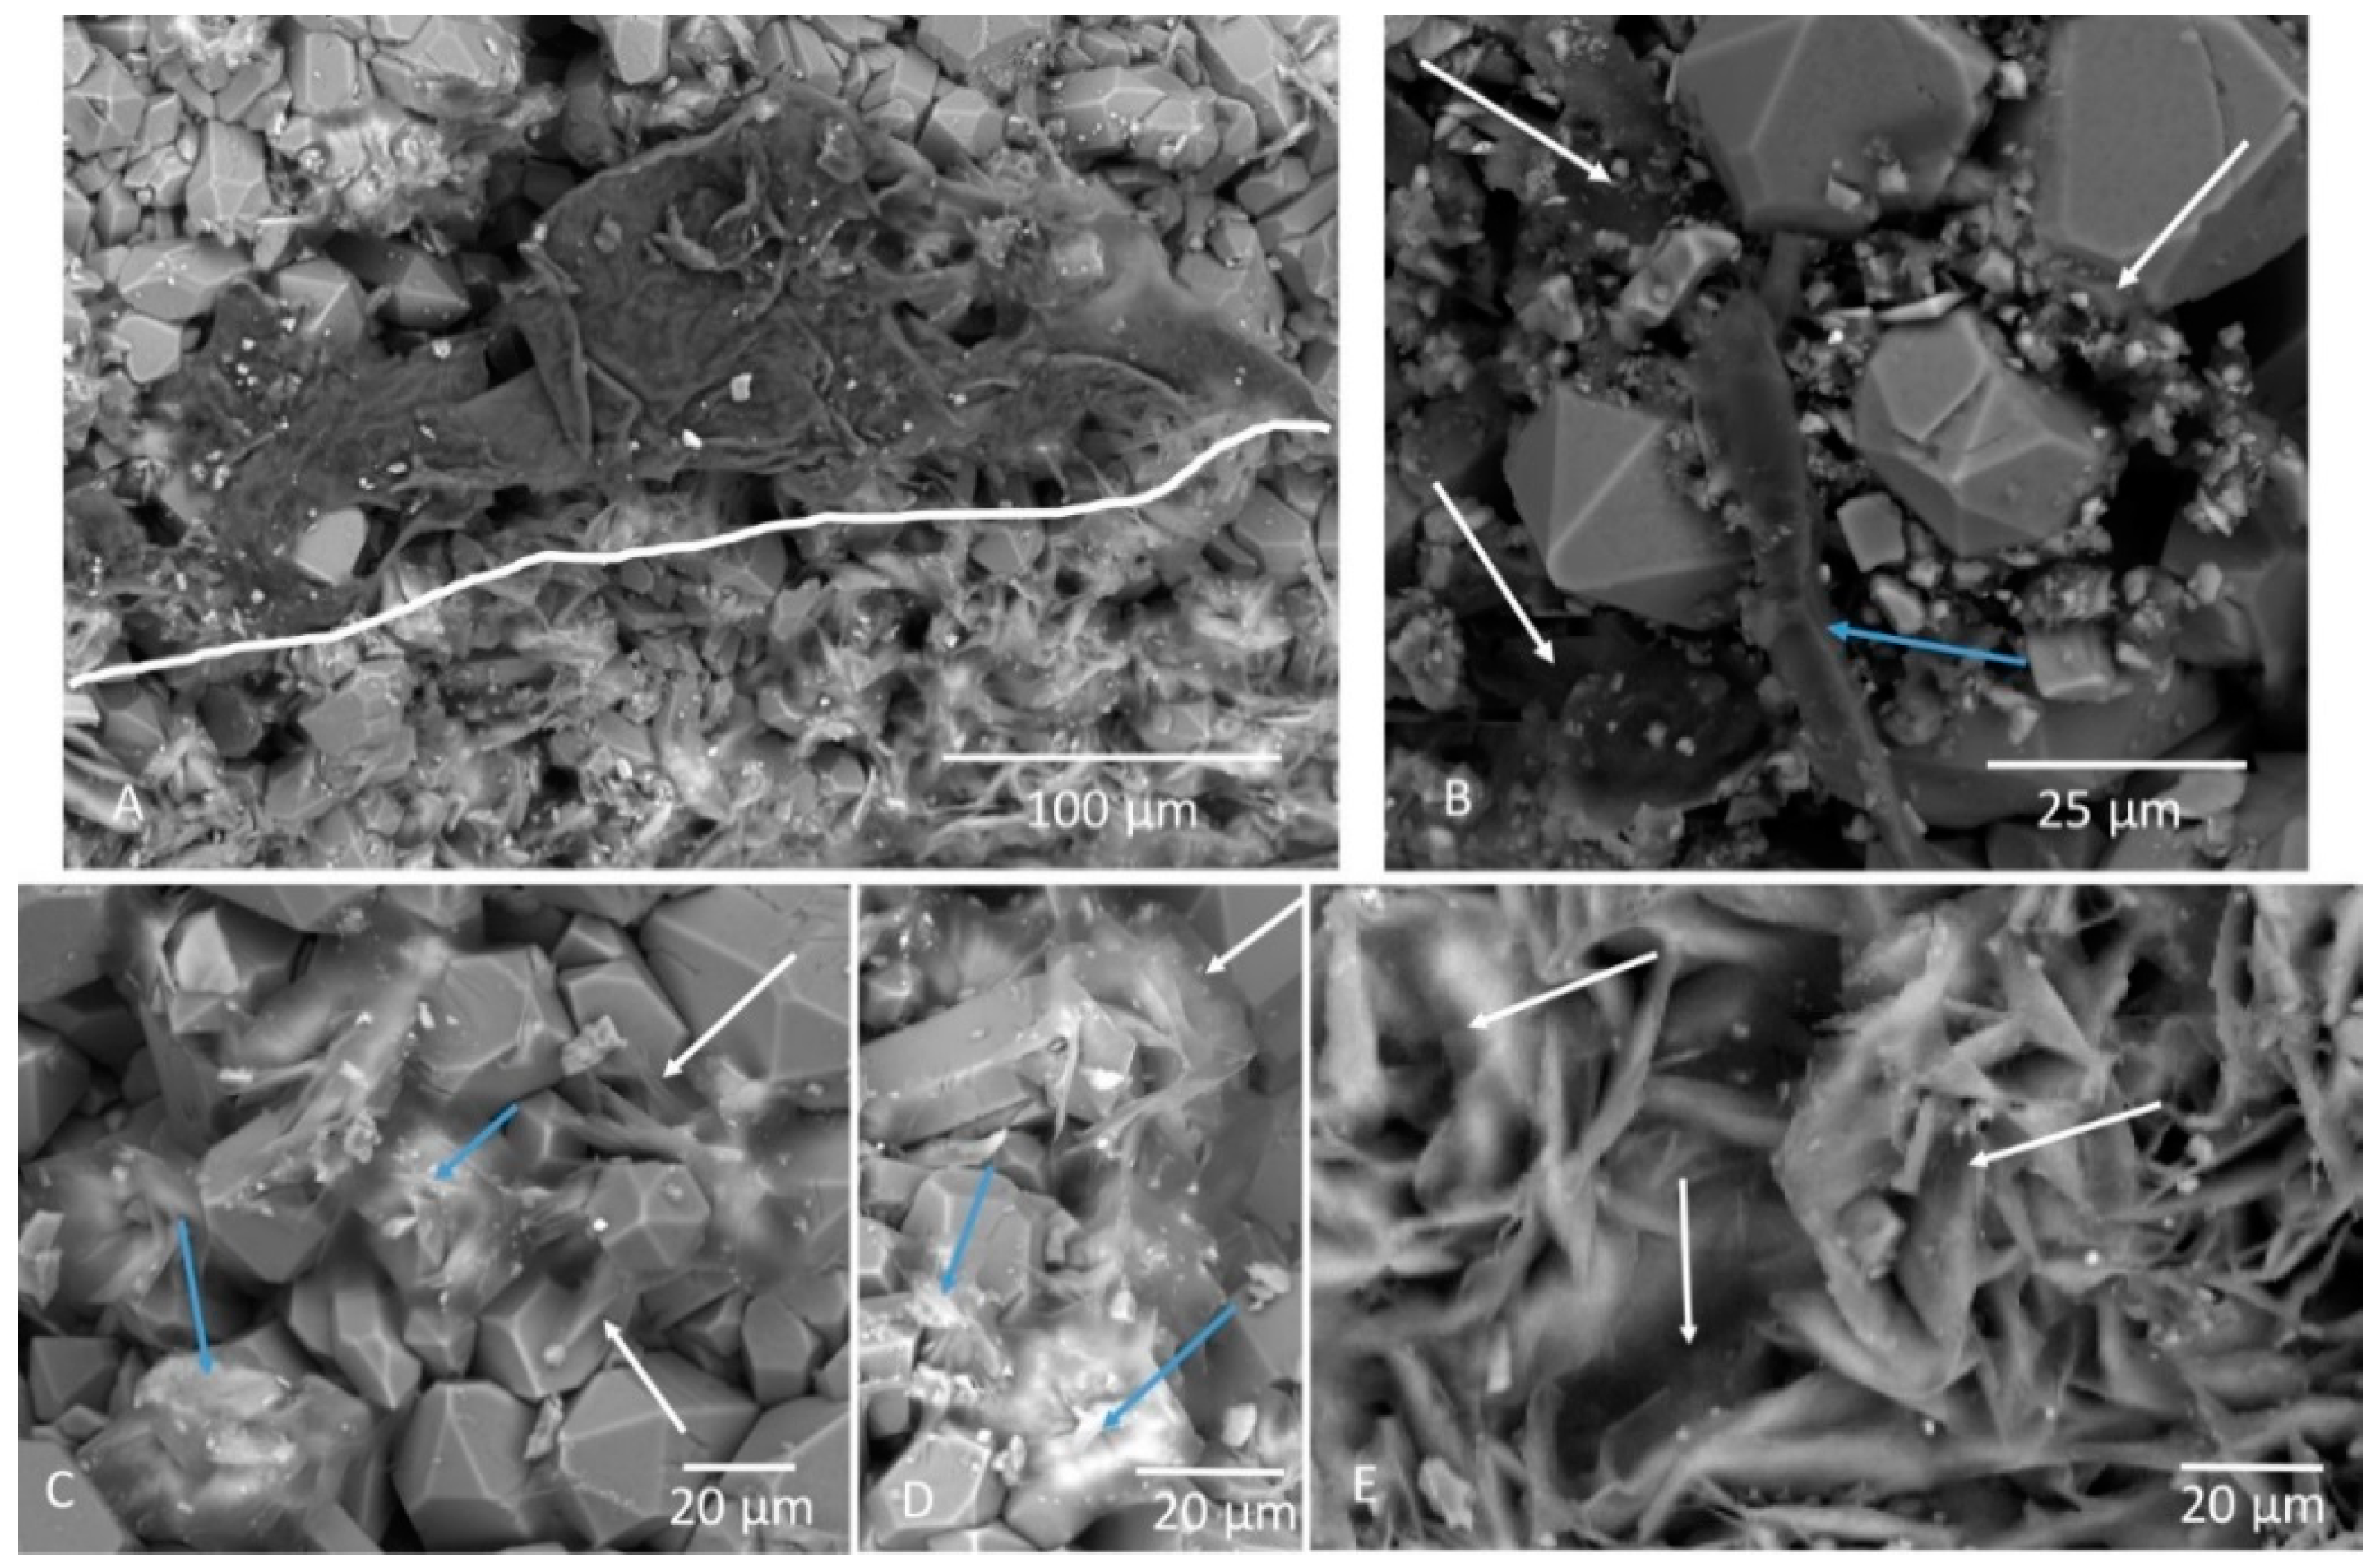
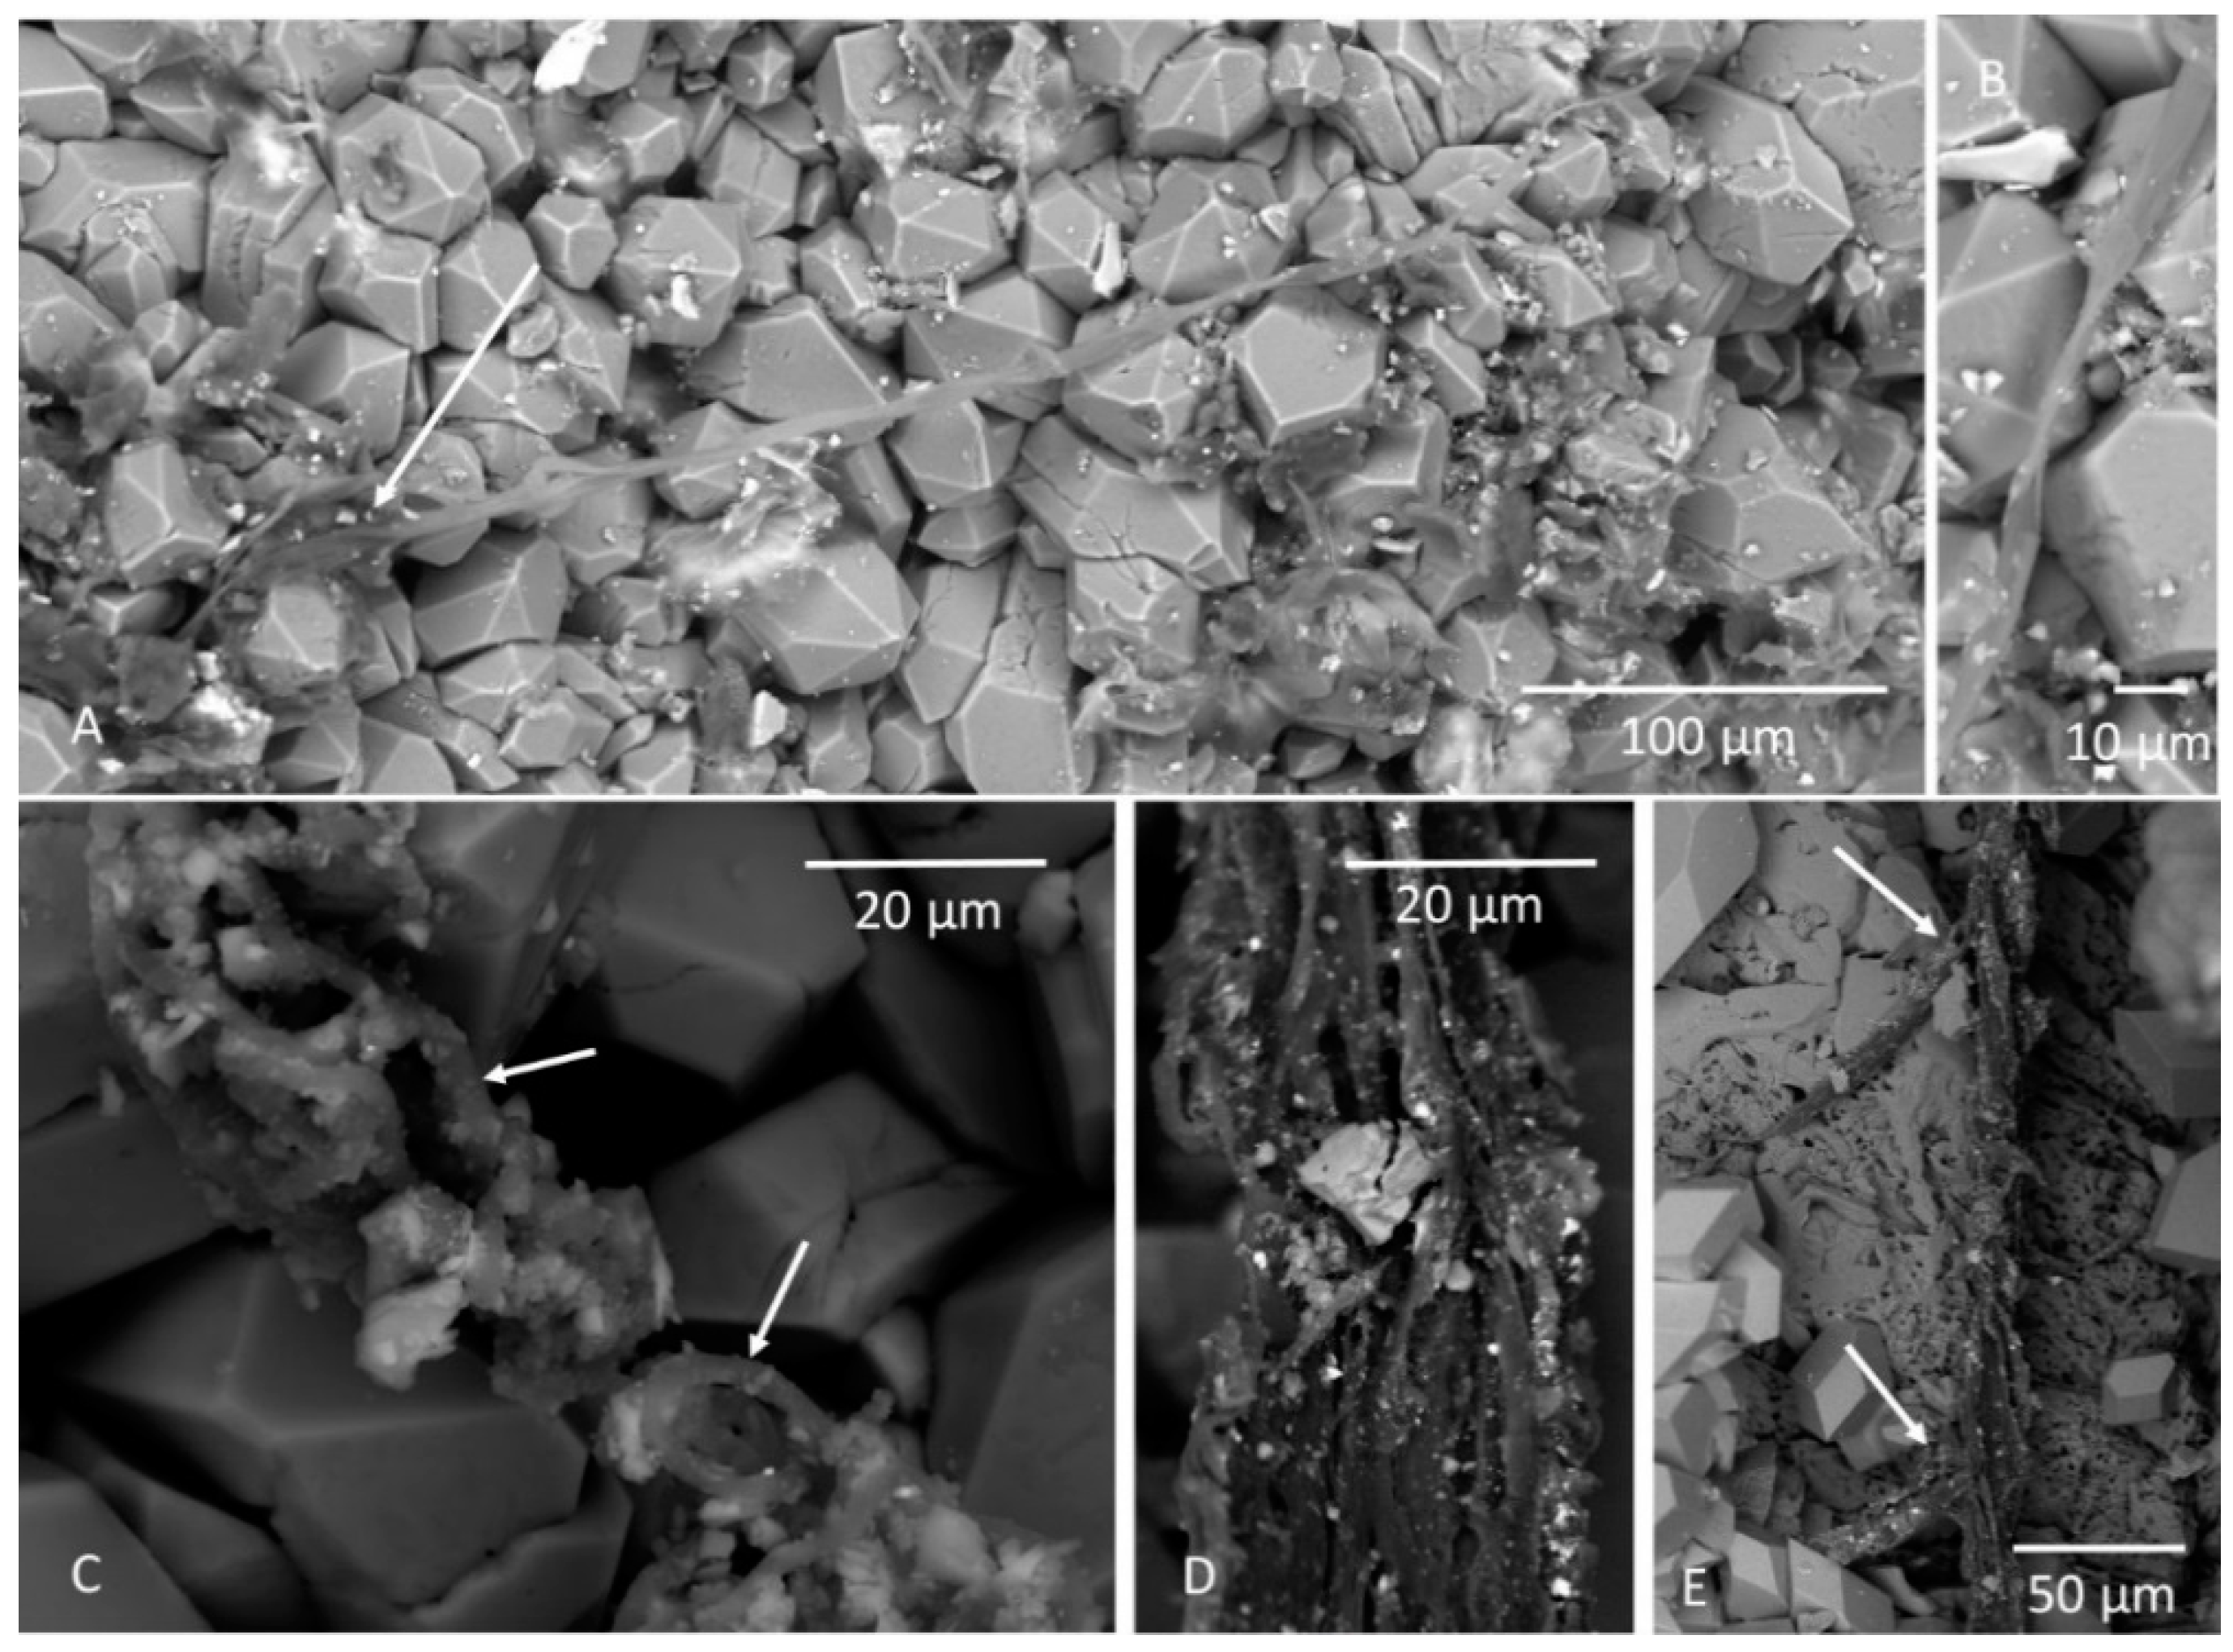
3.2.6. Putative Fossilized Microorganisms

Samples KFM24:379 and 399 featured abundant carbonaceous material (CM) on mineral surfaces, incorporated in between calcite crystals and as components in clay minerals (Figure 7). The CM occurred as biofilm-like sheets (Figure 7A), carbonaceous or partly mineralized by clay in nature (Figure 7B–D). Transitions between carbonaceous portions and mineralized portions were visible (Figure 7A,C,D), and it is evident that the CM has acted as nucleation sites for mineral growth including clay, oxides, calcite, and other Si-rich phases. The CM also occurred in between crystals and as a dominant constituent in clay-like phases in between calcite crystals, thus, CM was an integrated substance of the vein mineralogy (Figure 7E).
Filamentous structures protrude from the biofilm-like CM with the same composition as the CM, either completely carbonaceous in nature or partly mineralized by Fe-oxides, calcite, clay minerals and other Si-rich phases, along with some pyrite (Figure 8A–D). The diameter of the filaments ranged from 5 to 40 µm, and the lengths were up to 1 mm. They occurred in entangled networks with frequent branching and occasional loops (Figure 8C).
The filaments were characterized by a flattened appearance, probably due to dehydration (Figure 8B). However, the flattened filaments are partly mineralized, indicating that the dehydration occurred pre-drilling, and not as a result of the vacuum in the ESEM chamber. According to the EDS analyses, the carbonaceous material consist of O, C, Fe, Si, Mg, Al, and minor amounts of Ca, K, and S (see examples in Supplementary Material 1). The element concentrations vary depending on the grade of mineralization. Carbon makes up about 5–15 wt %, and decreases with increased mineralization. The opposite trend is seen for the other elements.

4. Discussion

Although it is commonly assumed, based on experimental observations, that calcite crystals will reprecipitate and homogenize during long-term interaction with fluids, observations from deep crystalline rock fractures show that zonation is sustained within crystals [64], with examples of >400 Ma old growth zonation [29] that has not been affected by dissolution-reprecipitation. The isotopic inventory of calcite crystals therefore serves as archives for processes in the fracture system over long time periods. In addition, the crystals (both calcite and pyrite) in the current study show dominantly sharp borders between different growth zones, which means that influence from dissolution-reprecipitation and large-scale homogenization due to fluid–mineral interaction can be regarded as minor. In the following sections, we discuss the various microbial processes that can be responsible for the observed isotope signatures, and compare the mineral signatures with water and gas data. However, because the fractures potentially host a complex community of different metabolic types, all which have different isotope discrimination values, various degrees of mixed signals from different processes can be expected in the studied minerals, which complicates certain process determinations. The highly variable δ13Ccalcite values between different fractures show that the processes leading to calcite precipitation have been fracture specific. There is usually also distinct temporal δ13Ccalcite variability within the single fractures, due to the episodic microbial processes. In addition, we discuss the findings of putative fossilized microorganisms.

4.1. Episodic Microbial Methanogenesis

Microbial methane usually is 13C-depleted compared to other carbon compounds [65]. As a consequence of the fractionation occurring during methanogenesis, which discriminates against 13C, the residual CO2 becomes 13C-rich [66]. Subsequent involvement of the residual C into precipitating carbonate minerals is, therefore, a useful diagnostic C-isotope tracer for methanogenesis [67], as shown by 13C-rich secondary carbonates in sedimentary basins [68], or in fractured crystalline rocks in the Fennoscandian shield [29,30,32,69,70,71]. Isotopic signatures of methane from Outokumpu, Finland, have also been indicative of microbial methane production at great depth [72]. The significantly 13C-enriched calcite (δ13Ccalcite values as heavy as +20.2‰, Figure 4b) observed in the present study, is thus a strong line of evidence for microbial methanogenesis in situ in the deep fracture systems, especially since potential abiotic methane forming chemical processes, such as serpentinization, graphite metamorphism, or Fischer–Tropsch type reactions [73], are unlikely under the local physicochemical and geological conditions. The distribution of the 13C-rich calcite marks methanogenesis in the depth interval 155–406 m, both as the dominant origin of the bicarbonate that was incorporated into calcite (Figure 3b), and late in the precipitation history (Figure 3a). In anaerobic environments, sulfate reducers and methanogens compete for the same substrates [74]. Since sulfate reducers have a higher affinity for acetate and hydrogen than methanogens, sulfate reducers may outcompete methanogens at high sulfate concentrations. The experiments of Lovley & Klug [74] showed that this can occur at as low sulfate concentrations as 60–105 µM sulfate (=10 mg/L). However, there are also observations of co-existence of SRB and methanogens at high sulfate concentrations, up to 10 mM in sulfate-rich estuarine sediments [75], and even up to 60 mM in organic-rich coastal sediments [76,77]. Nevertheless, the concentrations of dissolved sulfate can be an important aspect that explains why methanogenesis- and anaerobic oxidation of methane (AOM)-related calcite is localized to borehole KFM24, where sulfate concentrations are relatively low (9–16 mg/L in the lower sections, and 45 mg/L in the uppermost section), and not in the other sections, where concentrations are higher (KFM01D and KFM08D:67–273 mg/L). Detected autotrophic and heterotrophic methanogens and scattered elevated methane concentrations suggest microbial methanogenesis at least in a few deep groundwater sections in the Forsmark area, at present [53]. Unfortunately, none of the sections with 13C-rich calcite have been investigated for microorganisms. Overall, the methane concentrations are, however, generally low in the sampled sections (<1 mL/L, Table 2), suggesting that microbial methanogenesis is not a significant process at present. The ratio of methane to higher hydrocarbons, C1/(C2 + C3), points to a biogenic source of the methane in one of the borehole sections (KFM01D:316), where the ratio is >1000 (Table 2, cf. [78]). In addition, the only δ13CCH4 measurement carried out (KFM24:410) shows a value, ~−50‰, that is close to the border zone between biogenic and abiotic methane [65]. It is, however, lighter than δ13CCH4 in abiotic methane in volcanic-hydrothermal systems, serpentinized ultramafic rock systems, and deep boreholes in crystalline igneous rocks in South Africa, Canada, and Scandinavia [72,73]. The δ2HCH4 value is relatively heavy (−222‰ to −247‰), which places the gas in the microbial gas field on the border to mixed origin in a δ13CCH4 vs δ2HCH4 scatter plot [73,79] (not shown due to few data points). Taken together, a gas of mixed origin with a significant microbial component is the most likely origin for the KFM24 gas, in line with the support for microbial methanogenesis in situ offered by δ13Ccalcite. Microbial methanogenesis occurs either by organotrophic methanogens utilizing methyl group compounds (e.g., acetate fermentation [80]), or by chemolithoautotrophic carbonate (CO2) reduction with H2 [81]. The δ13CCH4 values of the KFM24 gas fit best with microbial gas formed via the acetate fermentation pathway, whereas the carbonate reduction pathway usually features even more 13C-depleted gas [65,73,82]. There are, to the best of our knowledge, no DNA-based data from this site that could give more information about which of these pathways is dominant. An additional substrate in these fractures is asphaltite, which is believed to originate from Paleozoic black shale that once covered the bedrock in the area [29,83]. These organics were most likely introduced to the deep fracture system during an extensional tectonic episode when elevated temperatures in the bottom of the sedimentary pile made the solid hydrocarbons viscous [83]. Asphaltite is highly reduced organic matter that also contains sulfate and can be utilized by the microorganisms (e.g., SRB or acetogens) in the presence of an electron acceptor.
The calcite samples with heavy δ13C dominantly had δ18O and/or 87Sr/86Sr out of equilibrium with modern groundwater when temperature dependent fractionation is taken into account (Figure 3b and Figure 4e–g) suggesting that the heavy δ13Ccalcite reflects mainly ancient methanogenesis, which may have occurred at different salinity and sulfate concentrations than at present. At around 400 m depth in KFM24, overlap in δ18O and/or 87Sr/86Sr between calcite and groundwater occurred in some crystals. These are, thus, the best candidates for modern precipitation.

4.2. Microbial Anaerobic Oxidation of Methane and Oxidation of Organic Matter

In marine seabed systems, AOM coupled with microbial sulfate reduction (MSR) is a major process that mitigates methane transport to the atmosphere [84,85,86]. At a depth horizon where surficial marine sulfate mixes with deeper seated methane, the methane is oxidized by methanotrophs (archaea), whereas sulfate is reduced by sulfate reducers via the simplified reaction:
CH4 + SO42− => HCO3 + HS + H2O.
After reaction of the produced bicarbonate and sulfide with dissolved Ca2+ and Fe2+, carbonate (mainly calcite) and sulfide (pyrite) minerals precipitate, respectively. During recent years, this AOM–MSR process has been observed in deep crystalline bedrock settings as well, both by ancient findings-based isotopic signatures in secondary minerals in fractures [29,30,66], and by microbiological and geochemical observations from modern groundwaters and gases residing in the deep fractured bedrock [2,3,16,17,18,87]. Significant 13C-depletion is inherited from the source methane during AOM, and can subsequently be detected in the δ13C signature of authigenic carbonate. This diagnostic δ13Ccalcite signature is one of the most widely used tools to distinguish ancient and modern AOM [35,36,88,89]. Although AOM involves fractionation that results in an even more 13C-depleted product than the source methane [84,90,91], the δ13C signature of the carbon originating from oxidized methane is usually diluted by other relatively 13C-rich dissolved carbon species (e.g., DIC) prior to incorporation in calcite. Consequently, authigenic carbonate in well-studied sedimentary systems is, as a rule, less 13C-depleted than the source methane. Typical δ13C values of AOM-related authigenic carbonate are in the −70‰ to −30‰ range [36,89,92], and in some cases, significantly heavier [93]. Although δ13Ccalcite values in the −35 to −25‰ can theoretically reflect oxidation of degraded organic matter e.g., in the form of oil and related substances which have δ13C values in the −35‰ to −25‰ range [94], the 13C-depleted calcite from Forsmark (δ13C down to -36.2‰) is proposed to originate from AOM, especially when taking into account dilution of the δ13C signature by other C-sources after AOM and prior to calcite precipitation, as described above. Since the δ13C values overlap with both microbial and abiotic methane [65,73], the origin for the source methane cannot be distinguished. The calcite crystals with moderately 13C-depleted values down to ~−20‰, although overlapping with values of abiotic methane [73], can, however, not be distinguished from bicarbonate formed by e.g., microbial oxidation of organic matter by SRB or other microorganisms [65], and can alternatively be of a mixed origin. Also, masking of process-specific C-isotope signatures is most likely to be expected in fractures with high bicarbonate contents (e.g., 76 mg/L in KFM01D). The 13C-depleted calcite occurs in middle section of KFM24 (396–399 m), where all fractures feature calcite with minimum values lighter than −32.5‰ suggesting that AOM has occurred in all fractures in this section. In the deepest KFM24 section (410–414 m), there are also 13C-depleted values in the calcite (down to −29.8‰) which suggest that AOM may have occurred there as well (Figure 4b). In the latter section, there is also one very heavy δ13Ccalcite value marking methanogenesis in situ, but there is no indicator of how methanogenesis and AOM are temporally related. It suggests that the position of the sulfate–methane transition zone (SMTZ) has changed with time, in accordance with findings from Olkiluoto, Finland, where a modern SMTZ is indicated at 300–400 m [13,14,15,87], but the calcite record suggests a more shallow position for a fossil SMTZ [69]. In the middle section of KFM24, there are no positive δ13Ccalcite values, showing that methanogenesis has not occurred there. Extensive precipitation of 13C-rich calcite is, instead, observed in shallower samples (e.g., 194 and 379 m in the same borehole). This indicates a reverse SMTZ at depths of roughly 395–415 m in KFM24, at which methane formed in shallower fractures mixes with deeper seated sulfate-rich water, in similarity with δ13Ccalcite distributions in the crystalline basement fracture system at Laxemar, Sweden [30]. In contrast to the hydrochemical situation at Laxemar, where the sulfate concentrations increase with depth, the Forsmark waters show overall decreasing sulfate concentrations beneath 300–500 m ([50] and Table 2). In the KFM24 borehole sections, the dissolved sulfate concentrations are overall low, and decrease slightly with depth (195 m: 44 mg/L; 395 m: 15 mg/L and 415 m: 9 mg/L). In addition, the depleted δ13Ccalcite values in the outermost calcite growth zones are lower than the δ13CDIC (−21.9‰) of modern groundwater (Figures 3c and 4f) and the 87Sr/86Sr and δ18O do not generally correspond. The SMTZ indicated by the δ13Ccalcite values is therefore proposed to be ancient. A Devonian precipitation age of a calcite–adularia assemblage was obtained by the Rb–Sr dating at these depths (Figure 7), and Devonian–Carboniferous microbial activity, such as AOM, has earlier been recorded from outside the target area in Forsmark and in the Laxemar area [29]. In KFM02A, the same depth relation as in KFM24 occurs, with methanogenesis-related δ13Ccalcite values in the shallower sample (up to +11.3‰ at 162 m), and proposed AOM-related values in the deeper sample (down to −1.2‰ at 175 m).

4.3. Microbial Sulfate Reduction

Pyrite is the most common non-carbonate mineral at marine methane-seeps. It forms as a result of the AOM–MSR reaction (1), and inherits the S isotopic composition of the hydrogen sulfide [95], and because the MSR metabolism produces hydrogen sulfide strongly depleted in 34S, δ34Spyrite serves as a marker for MSR.
The low minimum δ34Spyrite values in the deep and middle sections of KFM24, at lightest −11.5‰ CDT, reflect 32S enrichment in the produced sulfide during MSR. The initial sulfate is anticipated to originate dominantly from infiltration of marine waters. The brackish marine waters in the deep fracture system show relatively homogeneous δ34SSO4 values between 24–26‰ [50], which infers an isotope enrichment, 34ɛ (δ34SSO4–δ34Spyrite), of up to 40‰, when comparing the outermost pyrite growth zonation and the dissolved sulfate in the same fracture. This is a fully possible isotope enrichment, as experiments of pure culture MSR had resulted in 34ɛ of up to 66‰ [96], and exclude abiotic sulfide production through thermochemical sulfate reduction, which results in more moderate 34ɛ [97]. These δ34Spyrite values, together with the 13C-depleted calcite in the same fractures, support coupled AOM–MSR at the proposed fossil SMTZ at around 395–415 m depth. During a closed system Rayleigh fractionation cycle, the δ34SSO4 values will increase gradually as the sulfate pool is being exhausted, and consequently, the δ34Spyrite values in pyrite will show a large span in values and increase from core to rim of the pyrite crystals [98]. Therefore, we propose that the large δ34Spyrite variability spanning almost 50‰ (Figure 4d) within the individual fractures marks Rayleigh isotope reservoir effects in the fracture system. The increase in δ34Spyrite values across the crystal is rather abrupt, and occurs mainly close to the crystal rims. This suggests that the pyrite in the rim has precipitated in relation to MSR of a dissolved sulfate pool that was already enriched in 34S when reaching the fracture, and that the system undergoing Rayleigh fractionation is larger than the individual sampled borehole intercepts. The observed spatiotemporal relation between calcite growth zones depleted in 13C and pyrite growth zones enriched in 34S (outermost parts of the crystals, Figure 3c and Figure 5d) is similar to observations at SMTZ:s in seabed systems [99,100]. It is intriguing that the δ34SSO4 values are elevated (up to +57.5‰) in the fractures with highest δ34Spyrite values. This shows that the modern dissolved sulfate in the fracture system is affected by MSR-related Rayleigh isotope fractionation, which is plausible considering that sulfide is currently produced [101,102], and sulfate-reducing bacteria are detected in modern waters [8], although presence of viable cells is not direct proof for active metabolism. Pyrite with MSR-related δ34S values also occurs together with calcite with methanogenesis-related δ13C values, despite that there may be competition between sulfate reducers and methanogens for substrates. Explanations for this may be that methanogenesis is from non-competitive substrates, or an excess of substrates keeps concentrations above the threshold for methanogenesis (DOC presence in the water is locally at fairly high concentrations; ~15 mg/L). The deepest pyrite sample (KFM08D) showed a smaller δ34Spyrite range (−2 to +12‰), and may theoretically be a result of thermochemical reduction.

4.4. Putative Microfossils

The abundance of CM as biofilms and filaments in the KFM24:379 and KFM24:395–399 sections suggests previous presence of microorganisms in the fractures. Considering the immediate sampling of the samples after drilling, the sealed veins they occurred in, and the partly mineralized nature of the remnants, the biofilms and associated preserved microorganisms are likely to be primary, and not modern contaminants. Microbial remains of similar modes of preservation with carbonaceous and partly mineralized portions have previously been reported from fractures in granitic bedrock [20,103]. The widths of the filaments are 10–40 µm, which exclude most prokaryotes and suggest that the filaments are remains of fungal hyphae. Size-wise, cyanobacteria and giant sulfate bacteria are the only possible prokaryotic candidates, but both can be ruled out considering the anoxic and dark environment. Fungi, on the other hand, have been shown to thrive in such deep settings, feeding on biomass from prokaryotes, and upon death, become preserved in an identical manner as the current fossils [20,103,104]. The branching and entangled appearance is characteristic for fungal hypha and mycelium, as well, even though it is not diagnostic for fungi alone [103]. Observations of fungi in the deep biosphere have, until recently, been more or less exclusively from the marine or sub-seafloor realm [105]. Recent detections of fungi in deep waters from Olkiluoto, Finland [19], and fossilized remains at great depth in Laxemar, Sweden [20] suggest that fungi play a key role in this biosphere [106], where they seem to consort with prokaryotes [103,107]. Our current findings from the deep bedrock fractures Forsmark of putative partly mineralized fungal hyphae occurring together with minerals with microbial activity-specific stable isotope signatures (e.g., MSR) are in agreement with the recent observations from the deep continental biosphere. Heterotrophic fungi require a continuous growth of associated prokaryotic biomass available for their metabolism. In deep anoxic systems, it has been suggested that obligate anaerobic eukaryotes, including fungi, equipped with hydrogenosomes may produce H2 at a rate that makes continuous growth of H2-dependent prokaryotes possible, whereas rates of H2 formation by radiolysis is probably too low for that [20,107]. In addition, microbial activity in combination with mechanochemical reactions may also enhance H2 production [108].

4.5. Potential Quaternary Mineral Precipitation

The correlation between isotopic signatures of the outermost mineral growth zones and the waters in some of the sections means that Quaternary precipitation cannot be completely ruled out. The best candidates are around 400 m depth in KFM24, where there are overlaps in 87Sr/86Sr between calcite and water, corresponding to δ18O and heavy δ34S values, both in the outermost growth zones of pyrite crystals and in the dissolved sulfate. Additional indications of relatively recent microbial activity are the remains of carbonaceous matter on the fracture surfaces here. However, overall, it can be concluded that most of the calcite formation is pre-Quaternary, and at least in the inner parts of the crystals, most likely can be linked to Paleozoic and Mesozoic precipitation events, which have been documented in other parts of the Forsmark area [29,39], and by our single Rb–Sr dating (Figure 7). Microbial activity has apparently been active over several hundred million years in this area. Extensive mineral precipitation related to microbial activity has, however, been episodic in nature.

5. Conclusions

This comprehensive isotope study of minerals, waters, and gases from the target area for a spent nuclear fuel repository at Forsmark, Sweden shows long-term evidence of microbial processes in the deep fracture system. The transects of microscale isotope analyses provided unique information about the evolution of the deep fracture system in the Forsmark area during ambient temperature conditions, and allowed discrimination of processes that would not have been possible using conventional isotope analysis of bulk samples. The large isotope variabilities of δ13Ccalcite (−36.2‰ to +20.2‰) and δ34Spyrite (−11.7‰ to +37.8‰) mark microbial methanogenesis, potential anaerobic oxidation of methane, and coupled microbial sulfate reduction in the fracture system. A potential sulfate–methane transition zone was detected at 395–415 m in the shaft pilot borehole. Despite the potential triggers for carbonate precipitation, i.e., (1) active modern microbial processes, such as MSR (shown by isotopic signatures and detected microorganisms), and (2) large degree of water mixing during the Quaternary, potential modern mineral precipitates are few, with the best potential in the shaft pilot borehole at around 400 m depth. The large temporal isotopic variability within the minerals and radiometric dating of one of the fracture coatings point to episodic microbial activity-related mineral precipitation that dates back, at least, to the Devonian time period.

Supplementary Materials

The following are available online at https://www.mdpi.com/2076-3263/8/6/211/s1, Supplementary Material 1 consists of a PDF-file of ESEM images and corresponding EDS-spectra. Supplementary tables are enclosed as a spreadsheet (xlsx-file). These tables contain microorganism data (Table S1), isotope data (spot-by-spot) of calcite (Table S2) and pyrite (Table S3), (spot-by-spot) reference material analysis for C isotopes (Table S4), O isotopes (Table S5), Sr isotopes (Table S6) and S isotopes (Table S7). Rb/Sr isotope (spot-by-spot) data are presented in Table S8.

Author Contributions

H.D. conceived and designed the study and wrote the paper; M.I. and H.D. performed the SEM-analyses and M.I. wrote the part about the fossilized microorganisms; H.D. performed the SIMS and LA-MC-ICP analyses together with M.J.W. and E.K., respectively; M.T. and H.D. performed the Rb–Sr dating and M.T. performed corresponding data handling.

Acknowledgments

We acknowledge the following grants: Swedish research council (grant #2017-05186, to H.D., and grant#2015-04129 to M.I.), Formas (grant #2017-00766, to H.D.), SKB (grant #19216, to H.D.) and a Villum Investigator grant to Donald Canfield. Kenneth Åkerström (Sweco AB), Kerstin Lindén (Swedish Museum of Natural History), Thomas Zack (University of Gothenburg), Johan Hogmalm (University of Gothenburg) and Melanie Schmitt (Swedish Museum of Natural History) are thanked for assistance during sampling, sample preparation and analysis and Eva-Lena Tullborg (Terralogica AB), Ann-Chatrin Nilsson (Geosigma AB), Mats Tröjbom and Cecilia Berg (SKB) are thanked for providing quality controlled hydrochemical and gas data from the Forsmark site. This is NordSIM publication 562 and Vegacenter publication #9. All cited SKB reports can be downloaded from www.skb.se.

Conflicts of Interest

The authors declare no conflict of interest and the founding sponsors had no role in the design of the study; in the collection, analyses, or interpretation of data; in the writing of the manuscript, and in the decision to publish the results.

References

  1. McMahon, S.; Parnell, J. Weighing the deep continental biosphere. FEMS Microbiol. Ecol. 2014, 87, 113–120. [Google Scholar] [CrossRef] [PubMed]
  2. Lau, M.C.Y.; Kieft, T.L.; Kuloyo, O.; Linage-Alvarez, B.; van Heerden, E.; Lindsay, M.R.; Magnabosco, C.; Wang, W.; Wiggins, J.B.; Guo, L.; et al. An oligotrophic deep-subsurface community dependent on syntrophy is dominated by sulfur-driven autotrophic denitrifiers. Proc. Natl. Acad. Sci. USA 2016, 113, E7927–E7936. [Google Scholar] [CrossRef] [PubMed] [Green Version]
  3. Simkus, D.N.; Slater, G.F.; Lollar, B.S.; Wilkie, K.; Kieft, T.L.; Magnabosco, C.; Lau, M.C.Y.; Pullin, M.J.; Hendrickson, S.B.; Wommack, K.E.; et al. Variations in microbial carbon sources and cycling in the deep continental subsurface. Geochim. Cosmochim. Acta 2016, 173, 264–283. [Google Scholar] [CrossRef] [Green Version]
  4. Chivian, D.; Brodie, E.L.; Alm, E.J.; Culley, D.E.; Dehal, P.S.; DeSantis, T.Z.; Gihring, T.M.; Lapidus, A.; Lin, L.-H.; Lowry, S.R.; et al. Environmental Genomics Reveals a Single-Species Ecosystem Deep Within Earth. Science 2008, 322, 275–278. [Google Scholar] [CrossRef] [PubMed] [Green Version]
  5. Onstott, T.C.; McGown, D.J.; Bakermans, C.; Ruskeeniemi, T.; Ahonen, L.; Telling, J.; Soffientino, B.; Pfiffner, S.M.; Sherwood-Lollar, B.; Frape, S.; et al. Microbial Communities in Subpermafrost Saline Fracture Water at the Lupin Au Mine, Nunavut, Canada. Microb. Ecol. 2009, 58, 786–807. [Google Scholar] [CrossRef] [PubMed]
  6. Wu, X.; Holmfeldt, K.; Hubalek, V.; Lundin, D.; Åström, M.; Bertilsson, S.; Dopson, M. Microbial metagenomes from three aquifers in the Fennoscandian shield terrestrial deep biosphere reveal metabolic partitioning among populations. ISME J. 2016, 10, 1192–1203. [Google Scholar] [CrossRef] [PubMed] [Green Version]
  7. Pedersen, K. Subterranean microbial populations metabolize hydrogen and acetate under in situ conditions in granitic groundwater at 450 m depth in the Aspo Hard Rock Laboratory, Sweden. FEMS Microbiol. Ecol. 2012, 81, 217–229. [Google Scholar] [CrossRef] [PubMed]
  8. Hallbeck, L.; Pedersen, K. Culture-dependent comparison of microbial diversity in deep granitic groundwater from two sites considered for a Swedish final repository of spent nuclear fuel. FEMS Microbiol. Ecol. 2012, 81, 66–77. [Google Scholar] [CrossRef] [PubMed] [Green Version]
  9. Hallbeck, L.; Pedersen, K. Characterization of microbial processes in deep aquifers of the Fennoscandian Shield. Appl. Geochem. 2008, 23, 1796–1819. [Google Scholar] [CrossRef]
  10. Pedersen, K. Microbial life in granitic rock. FEMS Microbiol. Rev. 1997, 20, 399–414. [Google Scholar] [CrossRef]
  11. Haveman, S.A.; Pedersen, K.; Ruotsalainen, P. Distribution and metabolic diversity in of microorganisms in deep igneous rock aquifers in Finland. Geomicrobiology 1999, 16, 277–294. [Google Scholar]
  12. Purkamo, L.; Bomberg, M.; Nyyssönen, M.; Kukkonen, I.; Ahonen, L.; Kietäväinen, R.; Itävaara, M. Dissecting the deep biosphere: Retrieving authentic microbial communities from packer-isolated deep crystalline bedrock fracture zones. FEMS Microbiol. Ecol. 2013, 85, 324–337. [Google Scholar] [CrossRef] [PubMed]
  13. Pedersen, K.; Bengtsson, A.F.; Edlund, J.S.; Eriksson, L.C. Sulphate-controlled Diversity of Subterranean Microbial Communities over Depth in Deep Groundwater with Opposing Gradients of Sulphate and Methane. Geomicrobiol. J. 2014, 31, 617–631. [Google Scholar] [CrossRef] [Green Version]
  14. Pedersen, K. Metabolic activity of subterranean microbial communities in deep granitic groundwater supplemented with methane and H2. ISME J. 2012, 7, 839. [Google Scholar] [CrossRef] [PubMed]
  15. Pedersen, K.; Arlinger, J.; Hallbeck, A.; Hallbeck, L.; Eriksson, S.; Johansson, J. Numbers, biomass and cultivable diversity of microbial populations related to depth and borehole-specific conditions in groundwater from depths of 4 to 450 m in Olkiluoto, Finland. ISME J. 2008, 2, 760–775. [Google Scholar] [CrossRef] [PubMed]
  16. Ino, K.; Hernsdorf, A.W.; Konno, U.; Kouduka, M.; Yanagawa, K.; Kato, S.; Sunamura, M.; Hirota, A.; Togo, Y.S.; Ito, K.; et al. Ecological and genomic profiling of anaerobic methane-oxidizing archaea in a deep granitic environment. ISME J. 2017, 12, 31–47. [Google Scholar] [CrossRef] [PubMed]
  17. Ino, K.; Konno, U.; Kouduka, M.; Hirota, A.; Togo, Y.S.; Fukuda, A.; Komatsu, D.; Tsunogai, U.; Tanabe, A.S.; Yamamoto, S.; et al. Deep microbial life in high-quality granitic groundwater from geochemically and geographically distinct underground boreholes. Environ. Microbiol. Rep. 2016, 8, 285–294. [Google Scholar] [CrossRef] [PubMed]
  18. Nyyssönen, M.; Hultman, J.; Ahonen, L.; Kukkonen, I.; Paulin, L.; Laine, P.; Itävaara, M.; Auvinen, P. Taxonomically and functionally diverse microbial communities in deep crystalline rocks of the Fennoscandian shield. ISME J. 2014, 8, 126–138. [Google Scholar] [CrossRef] [PubMed]
  19. Sohlberg, E.; Bomberg, M.; Miettinen, H.; Nyyssönen, M.; Salavirta, H.; Vikman, M.; Itävaara, M. Revealing the unexplored fungal communities in deep groundwater of crystalline bedrock fracture zones in Olkiluoto, Finland. Front. Microbiol. 2015, 6, 573. [Google Scholar] [CrossRef] [PubMed]
  20. Drake, H.; Ivarsson, M.; Bengtson, S.; Heim, C.; Siljeström, S.; Whitehouse, M.J.; Broman, C.; Belivanova, V.; Åström, M.E. Anaerobic consortia of fungi and sulfate reducing bacteria in deep granite fractures. Nat. Commun. 2017, 8, 55. [Google Scholar] [CrossRef] [PubMed] [Green Version]
  21. Hubalek, V.; Wu, X.; Eiler, A.; Buck, M.; Heim, C.; Dopson, M.; Bertilsson, S.; Ionescu, D. Connectivity to the surface determines diversity patterns in subsurface aquifers of the Fennoscandian shield. ISME J. 2016, 10, 2447–2458. [Google Scholar] [CrossRef] [PubMed] [Green Version]
  22. Chapelle, F.H.; O’Neill, K.; Bradley, P.M.; Methe, B.A.; Ciufo, S.A.; Knobel, L.L.; Lovley, D.R. A hydrogen-based subsurface microbial community dominated by methanogens. Nature 2002, 415, 312–315. [Google Scholar] [CrossRef] [PubMed]
  23. Kietäväinen, R.; Purkamo, L. The origin, source, and cycling of methane in deep crystalline rock biosphere. Front. Microbiol. 2015, 6, 725. [Google Scholar] [CrossRef] [PubMed]
  24. Onstott, T.C.; Lin, L.H.; Davidson, M.; Mislowack, B.; Borcsik, M.; Hall, J.; Slater, G.; Ward, J.; Lollar, B.S.; Lippmann-Pipke, J.; et al. The Origin and Age of Biogeochemical Trends in Deep Fracture Water of the Witwatersrand Basin, South Africa. Geomicrobiol. J. 2006, 23, 369–414. [Google Scholar] [CrossRef]
  25. Kotelnikova, S. Microbial production and oxidation of methane in deep subsurface. Earth-Sci. Rev. 2002, 58, 367–395. [Google Scholar] [CrossRef]
  26. Stevens, T.O.; McKinley, J.P. Lithoautotrophic Microbia, Ecosystems in Deep Basalt Aquifers. Science 1995, 270, 450–454. [Google Scholar] [CrossRef]
  27. Sherwood Lollar, B.; Frape, S.K.; Fritz, P.; Macko, S.A.; Welhan, J.A.; Blomqvist, R.; Lahermo, P.W. Evidence for bacterially generated hydrocarbon gas in Canadian shield and fennoscandian shield rocks. Geochim. Cosmochim. Acta 1993, 57, 5073–5085. [Google Scholar] [CrossRef]
  28. Kieft, T.L.; Walters, C.C.; Higgins, M.B.; Mennito, A.S.; Clewett, C.F.M.; Heuer, V.; Pullin, M.J.; Hendrickson, S.; van Heerden, E.; Sherwood Lollar, B.; et al. Dissolved organic matter compositions in 0.6–3.4 km deep fracture waters, Kaapvaal Craton, South Africa. Org. Geochem. 2018, 118, 116–131. [Google Scholar] [CrossRef]
  29. Drake, H.; Heim, C.; Roberts, N.M.W.; Zack, T.; Tillberg, M.; Broman, C.; Ivarsson, M.; Whitehouse, M.J.; Åström, M.E. Isotopic evidence for microbial production and consumption of methane in the upper continental crust throughout the Phanerozoic eon. Earth Planet. Sci. Lett. 2017, 470, 108–118. [Google Scholar] [CrossRef] [Green Version]
  30. Drake, H.; Åström, M.E.; Heim, C.; Broman, C.; Åström, J.; Whitehouse, M.J.; Ivarsson, M.; Siljeström, S.; Sjövall, P. Extreme 13C-depletion of carbonates formed during oxidation of biogenic methane in fractured granite. Nat. Commun. 2015, 6, 7020. [Google Scholar] [CrossRef] [PubMed]
  31. Drake, H.; Tullborg, E.-L. Paleohydrogeological events recorded by stable isotopes, fluid inclusions and trace elements in fracture minerals in crystalline rock, Simpevarp area, SE Sweden. Appl. Geochem. 2009, 24, 715–732. [Google Scholar] [CrossRef]
  32. Sandström, B.; Tullborg, E.-L. Episodic fluid migration in the Fennoscandian Shield recorded by stable isotopes, rare earth elements and fluid inclusions in fracture minerals at Forsmark, Sweden. Chem. Geol. 2009, 266, 126–142. [Google Scholar] [CrossRef]
  33. Drake, H.; Heim, C.; Hogmalm, K.J.; Hansen, B.T. Fracture zone-scale variation of trace elements and stable isotopes in calcite in a crystalline rock setting. Appl. Geochem. 2014, 40, 11–24. [Google Scholar] [CrossRef]
  34. Heim, C.; Lausmaa, J.; Sjövall, P.; Toporski, J.; Dieing, T.; Simon, K.; Hansen, B.T.; Kronz, A.; Arp, G.; Reitner, J.; et al. Ancient microbial activity recorded in fracture fillings from granitic rocks (Äspö Hard Rock Laboratory, Sweden). Geobiology 2012, 10, 280–297. [Google Scholar] [CrossRef] [PubMed]
  35. Ziegenbalg, S.B.; Birgel, D.; Hoffmann-Sell, L.; Pierre, C.; Rouchy, J.M.; Peckmann, J. Anaerobic oxidation of methane in hypersaline Messinian environments revealed by 13C-depleted molecular fossils. Chem. Geol. 2012, 292–293, 140–148. [Google Scholar] [CrossRef]
  36. Peckmann, J.; Thiel, V. Carbon cycling at ancient methane-seeps. Chem. Geol. 2004, 205, 443–467. [Google Scholar] [CrossRef]
  37. Drake, H.; Åström, M.; Tullborg, E.-L.; Whitehouse, M.J.; Fallick, A.E. Variability of sulphur isotope ratios in pyrite and dissolved sulphate in granitoid fractures down to 1 km depth—Evidence for widespread activity of sulphur reducing bacteria. Geochim. Cosmochim. Acta 2013, 102, 143–161. [Google Scholar] [CrossRef]
  38. Sahlstedt, E.; Karhu, J.A.; Pitkänen, P.; Whitehouse, M. Implications of sulfur isotope fractionation in fracture-filling sulfides in crystalline bedrock, Olkiluoto, Finland. Appl. Geochem. 2013, 32, 52–69. [Google Scholar] [CrossRef]
  39. Sandström, B.; Tullborg, E.-L.; Larson, S.Å.; Page, L. Brittle tectonothermal evolution in the Forsmark area, central Fennoscandian Shield, recorded by paragenesis, orientation and 40Ar/39Ar geochronology of fracture minerals. Tectonophysics 2009, 478, 158–174. [Google Scholar] [CrossRef]
  40. Andersson, J.; Skagius, K.; Winberg, A.; Lindborg, T.; Ström, A. Site-descriptive modelling for a final repository for spent nuclear fuel in Sweden. Environ. Earth Sci. 2013, 69, 1045–1060. [Google Scholar] [CrossRef]
  41. Laaksoharju, M.; Smellie, J.; Tullborg, E.-L.; Gimeno, M.; Molinero, J.; Gurban, I.; Hallbeck, L. Hydrogeochemical evaluation and modelling performed within the Swedish site investigation programme. Appl. Geochem. 2008, 23, 1761–1795. [Google Scholar] [CrossRef]
  42. Sandström, B.; Stephens, M.B. Mineralogy, Geochemistry, Porosity and Redox Properties of Rocks from Forsmark. Compilation of Data from the Regional Model Volume for SR-Site; SKB-R-09-51; Swedish Nuclear Fuel and Waste Management Co. (SKB): Stockholm, Sweden, 2009. [Google Scholar]
  43. Stephens, M.B.; Fox, A.; La Pointe, P.; Simeonov, A.; Isaksson, H.; Hermanson, J.; Öhman, J. Geology Forsmark. Site Descriptive Modelling Forsmark Stage 2.2; R-07-45; Swedish Nuclear Fuel and Waste Management Co.: Stockholm, Sweden, 2007. [Google Scholar]
  44. Drake, H.; Sandström, B.; Tullborg, E.-L. Mineralogy and Geochemistry of Rocks and Fracture Fillings from Forsmark and Oskarshamn: Compilation of Data for SR-Can; SKB Report R-06-109; SKB: Stockholm, Sweden, 2006; p. 105. [Google Scholar]
  45. Saintot, A.; Stephens, M.B.; Viola, G.; Nordgulen, O. Brittle tectonic evolution and paleostress field reconstruction in the southwestern part of the Fennoscandian Shield, Forsmark, Sweden. Tectonics 2011, 30. [Google Scholar] [CrossRef] [Green Version]
  46. Dahlin, P.; Maskenskaya, O. Boremap Mapping of Core Drilled Borehole KFM24; SKB-Report P-16-28; Swedish Nuclear Fuel and Waste Management Co. (SKB): Stockholm, Sweden, 2017. [Google Scholar]
  47. Samuelsson, E.; Rauséus, G. Boremap Mapping of Telescopic Drilled Borehole KFM08D. Forsmark Site Investigation; SKB-Report P-07-103; Swedish Nuclear Fuel and Waste Management Co. (SKB): Stockholm, Sweden, 2007. [Google Scholar]
  48. Hurmerinta, E. Forsmark Site Investigations. Difference Flow Logging in Borehole KFM24; SKB-Report P-16-27; Swedish Nuclear Fuel and Waste Management Co. (SKB): Stockholm, Sweden, 2017. [Google Scholar]
  49. Teurneau, B.; Forsmark, T.; Forssman, I.; Rhén, I.; Zinn, E. Correlation of Posiva Flow Log Anomalies to Core Mapped Features in KFM01D, KFM07C, KFM08A, KFM08C and KFM10A. Forsmark Site Investigation; SKB-Report P-07-127; Swedish Nuclear Fuel and Waste Management Co. (SKB): Stockholm, Sweden, 2008. [Google Scholar]
  50. Laaksoharju, M.; Smellie, J.; Tullborg, E.-L.; Gimeno, M.; Hallbeck, L.; Molinero, J.; Waber, N. Bedrock hydrogeochemistry Forsmark. Site Descriptive Modelling. SDM-Site Forsmark; SKB Report R-08-47; Swedish Nuclear Fuel and Waste Management Co. (SKB): Stockholm, Sweden, 2008. [Google Scholar]
  51. Pedersen, K. Microorganisms in Groundwater from Boreholes KFM10A, KFM11A and KFM08D—Numbers, Viability, and Metabolic Diversity. Forsmark Site Investigation; Results from Five Sections 298.0-305.1 m and 478.0-487.5 m in KFM10A, 447.5-454.6 m in KFM11A, and 669.7-676.8 m and 828.4-835.5 m in KFM08D; SKB-Report P-07-198; Swedish Nuclear Fuel and Waste Management Co. (SKB): Stockholm, Sweden, 2007. [Google Scholar]
  52. Bergelin, A.; Lindquist, A.; Nilsson, K.; Wacker, P.; Nilsson, A.-C. Hydrochemical Characterisation in Borehole KFM08D. Forsmark Site Investigation; Results from Two Investigated Borehole Sections at 669.7-676.8 m and 828.4-835.5 m; SKB-Report P-07-190; Swedish Nuclear Fuel and Waste Management Co. (SKB): Stockholm, Sweden, 2007. [Google Scholar]
  53. Hallbeck, L.; Pedersen, K. Explorative Analysis of Microbes, Colloids and Gases. SDM-Site Forsmark; SKB Report R-08-85; Swedish Nuclear Fuel and Waste Management Co. (SKB): Stockholm, Sweden, 2008. [Google Scholar]
  54. Kamber, B.S.; Whitehouse, M.J. Micro-scale sulphur isotope evidence for sulphur cycling in the late Archean shallow ocean. Geobiology 2007, 5, 5–17. [Google Scholar] [CrossRef]
  55. Drake, H.; Tullborg, E.-L.; Sandberg, B.; Blomfeldt, T.; Åström, M.E. Extreme fractionation and micro-scale variation of sulphur isotopes during bacterial sulphate reduction in Deep groundwater systems. Geochim. Cosmochim. Acta 2015, 161, 1–18. [Google Scholar] [CrossRef]
  56. Hogmalm, K.J.; Zack, T.; Karlsson, A.K.O.; Sjoqvist, A.S.L.; Garbe-Schonberg, D. In situ Rb-Sr and K-Ca dating by LA-ICP-MS/MS: An evaluation of N2O and SF6 as reaction gases. J. Anal. At. Spectrom. 2017, 32, 305–313. [Google Scholar] [CrossRef]
  57. Zack, T.; Hogmalm, J. Laser ablation Rb/Sr dating by online chemical separation of Rb and Sr in an oxygen-filled reaction cell. Chem. Geol. 2016, 437, 120–133. [Google Scholar] [CrossRef]
  58. Jochum, K.P.; Weis, U.; Stoll, B.; Kuzmin, D.; Yang, Q.; Raczek, I.; Jacob, D.E.; Stracke, A.; Birbaum, K.; Frick, D.A.; et al. Determination of reference values for NIST SRM 610–617 glasses following ISO guidelines. Geostand. Geoanal. Res. 2011, 35, 397–429. [Google Scholar] [CrossRef]
  59. Elburg, M.; Vroon, P.; van der Wagt, B.; Tchalikian, A. Sr and Pb isotopic composition of five USGS glasses (BHVO-2G, BIR-1G, BCR-2G, TB-1G, NKT-1G). Chem. Geol. 2005, 223, 196–207. [Google Scholar] [CrossRef]
  60. Kiel, S.; Glodny, J.; Birgel, D.; Bulot, L.G.; Campbell, K.A.; Gaillard, C.; Graziano, R.; Kaim, A.; Lazăr, I.; Sandy, M.R.; et al. The Paleoecology, Habitats, and Stratigraphic Range of the Enigmatic Cretaceous Brachiopod Peregrinella. PLoS ONE 2014, 9, e109260. [Google Scholar] [CrossRef] [PubMed]
  61. Mokadem, F.; Parkinson, I.J.; Hathorne, E.C.; Anand, P.; Allen, J.T.; Burton, K.W. High-precision radiogenic strontium isotope measurements of the modern and glacial ocean: Limits on glacial–interglacial variations in continental weathering. Earth Planet. Sci. Lett. 2015, 415, 111–120. [Google Scholar] [CrossRef]
  62. Emrich, K.; Ehhalt, D.H.; Vogel, J.C. Carbon isotope fractionation during the precipitation of calcium carbonate. Earth Planet. Sci. Lett. 1970, 8, 363–371. [Google Scholar] [CrossRef]
  63. Kim, S.-T.; O’Neil, J.R. Equilibrium and nonequilibrium oxygen isotope effects in synthetic carbonates. Geochim. Cosmochim. Acta 1997, 61, 3461–3475. [Google Scholar] [CrossRef]
  64. Drake, H.; Mathurin, F.A.; Zack, T.; Schäfer, T.; Roberts, N.M.W.; Whitehouse, M.; Karlsson, A.; Broman, C.; Åström, M.E. Incorporation of metals into calcite in a deep anoxic granite aquifer. Environ. Sci. Technol. 2018, 52, 493–502. [Google Scholar] [CrossRef] [PubMed]
  65. Whiticar, M.J. Carbon and hydrogen isotope systematics of bacterial formation and oxidation of methane. Chem. Geol. 1999, 161, 291–314. [Google Scholar] [CrossRef]
  66. Boehme, S.E.; Blair, N.E.; Chanton, J.P.; Martens, C.S. A mass balance of 13C and 12C in an organic-rich methane-producing marine sediment. Geochim. Cosmochim. Acta 1996, 60, 3835–3848. [Google Scholar] [CrossRef]
  67. Irwin, H.; Cultis, C.; Coleman, M. Isotopic evidence for source of diagenetic carbonates formed during burial of organic-rich sediments. Nature 1977, 269, 209–213. [Google Scholar] [CrossRef]
  68. Budai, J.M.; Martini, A.M.; Walter, L.M.; Ku, T.C.W. Fracture-fill calcite as a record of microbial methanogenesis and fluid migration; a case study from the Devonian Antrim Shale, Michigan Basin. Geofluids 2002, 2, 163–183. [Google Scholar] [CrossRef]
  69. Sahlstedt, E.; Karhu, J.A.; Pitkänen, P.; Whitehouse, M. Biogenic processes in crystalline bedrock fractures indicated by carbon isotope signatures of secondary calcite. Appl. Geochem. 2016, 67, 30–41. [Google Scholar] [CrossRef]
  70. Sahlstedt, E.; Karhu, J.A.; Pitkänen, P. Indications for the past redox environments in deep groundwaters from the isotopic composition of carbon and oxygen in fracture calcite, Olkiluoto, SW Finland. Isotopes Environ. Health Stud. 2010, 46, 370–391. [Google Scholar] [CrossRef] [PubMed]
  71. Clauer, N.; Frape, S.K.; Fritz, B. Calcite veins of the Stripa granite (Sweden) as records of the origin of the groundwaters and their interactions with the granitic body. Geochim. Cosmochim. Acta 1989, 53, 1777–1781. [Google Scholar] [CrossRef]
  72. Kietäväinen, R.; Ahonen, L.; Niinikoski, P.; Nykänen, H.; Kukkonen, I.T. Abiotic and biotic controls on methane formation down to 2.5 km depth within the Precambrian Fennoscandian Shield. Geochim. Cosmochim. Acta 2017, 202, 124–145. [Google Scholar] [CrossRef]
  73. Etiope, G.; Sherwood Lollar, B. Abiotic methane on Earth. Rev. Geophys. 2013, 51, 276–299. [Google Scholar] [CrossRef]
  74. Lovley, D.R.; Klug, M.J. Sulfate Reducers Can Outcompete Methanogens at Freshwater Sulfate Concentrations. Appl. Environ. Microbiol. 1983, 45, 187–192. [Google Scholar] [PubMed]
  75. Sela-Adler, M.; Ronen, Z.; Herut, B.; Antler, G.; Vigderovich, H.; Eckert, W.; Sivan, O. Co-existence of Methanogenesis and Sulfate Reduction with Common Substrates in Sulfate-Rich Estuarine Sediments. Front. Microbiol. 2017, 8, 766. [Google Scholar] [CrossRef] [PubMed]
  76. Holmer, M.; Kristensen, E. Coexistence of sulfate reduction and methane production in an organic-rich sediment. Mar. Ecol. Prog. Ser. 1994, 107, 177–184. [Google Scholar] [CrossRef]
  77. Jørgensen, B.B.; Parkes, R.J. Role of sulfate reduction and methane production by organic carbon degradation in eutrophic fjord sediments (Limfjorden, Denmark). Limnol. Oceanogr. 2010, 55, 1338–1352. [Google Scholar] [CrossRef] [Green Version]
  78. Bernard, B.B.; Brooks, J.M.; Sackett, W.M. Light hydrocarbons in recent Texas continental shelf and slope sediments. J. Geophys. Res. Oceans 1978, 83, 4053–4061. [Google Scholar] [CrossRef]
  79. Etiope, G.; Schoell, M. Abiotic Gas: Atypical, But Not Rare. Elements 2014, 10, 291–296. [Google Scholar] [CrossRef]
  80. Garcia, J.-L.; Patel, B.K.C.; Ollivier, B. Taxonomic, Phylogenetic, and Ecological Diversity of Methanogenic Archaea. Anaerobe 2000, 6, 205–226. [Google Scholar] [CrossRef] [PubMed]
  81. Thauer, R.K.; Kaster, A.-K.; Seedorf, H.; Buckel, W.; Hedderich, R. Methanogenic archaea: Ecologically relevant differences in energy conservation. Nat. Rev. Microbiol. 2008, 6, 579–591. [Google Scholar] [CrossRef] [PubMed]
  82. Whiticar, M.J.; Faber, E.; Schoell, M. Biogenic methane formation in marine and freshwater environments: CO2 reduction vs. acetate fermentation—Isotope evidence. Geochim. Cosmochim. Acta 1986, 50, 693–709. [Google Scholar] [CrossRef]
  83. Sandström, B.; Tullborg, E.-L.; de Torres, T.; Ortiz, J.E. The occurrence and potential origin of asphaltite in bedrock fractures, Forsmark, central Sweden. GFF 2006, 128, 234–242. [Google Scholar] [CrossRef]
  84. Knittel, K.; Boetius, A. Anaerobic Oxidation of Methane: Progress with an Unknown Process. Ann. Rev. Microbiol. 2009, 63, 311–334. [Google Scholar] [CrossRef] [PubMed]
  85. Michaelis, W.; Seifert, R.; Nauhaus, K.; Treude, T.; Thiel, V.; Blumenberg, M.; Knittel, K.; Gieseke, A.; Peterknecht, K.; Pape, T.; et al. Microbial reefs in the Black Sea fueled by anaerobic oxidation of methane. Science 2002, 297, 1013–1015. [Google Scholar] [CrossRef] [PubMed]
  86. Orphan, V.J.; Hinrichs, K.U.; Ussler, W.; Paull, C.K.; Taylor, L.T.; Sylva, S.P.; Hayes, J.M.; Delong, E.F. Comparative Analysis of Methane-Oxidizing Archaea and Sulfate-Reducing Bacteria in Anoxic Marine Sediments. Appl. Environ. Microbiol. 2001, 67, 1922–1934. [Google Scholar] [CrossRef] [PubMed] [Green Version]
  87. Bomberg, M.; Nyyssönen, M.; Pitkänen, P.; Lehtinen, A.; Itävaara, M. Active Microbial Communities Inhabit Sulphate-Methane Interphase in Deep Bedrock Fracture Fluids in Olkiluoto, Finland. BioMed Res. Int. 2015, 2015, 979530. [Google Scholar] [CrossRef] [PubMed]
  88. Natalicchio, M.; Birgel, D.; Dela Pierre, F.; Martire, L.; Clari, P.; Spötl, C.; Peckmann, J. Polyphasic carbonate precipitation in the shallow subsurface: Insights from microbially-formed authigenic carbonate beds in upper Miocene sediments of the Tertiary Piedmont Basin (NW Italy). Palaeogeogr. Palaeoclimatol. Palaeoecol. 2012, 329–330, 158–172. [Google Scholar] [CrossRef]
  89. Feng, D.; Chen, D.; Peckmann, J.; Bohrmann, G. Authigenic carbonates from methane seeps of the northern Congo fan: Microbial formation mechanism. Mar. Pet. Geol. 2010, 27, 748–756. [Google Scholar] [CrossRef]
  90. Reeburgh, W.S. Oceanic methane biogeochemistry. Chem. Rev. 2007, 107, 486–513. [Google Scholar] [CrossRef] [PubMed]
  91. Whiticar, M.J.; Faber, E. Methane oxidation in sediment and water column environments—Isotope evidence. Org. Geochem. 1986, 10, 759–768. [Google Scholar] [CrossRef]
  92. Campbell, K.A.; Farmer, J.D.; des Marais, D. Ancient hydrocarbon seeps from the Mesozoic convergent margin of California: Carbonate geochemistry, fluids and palaeoenvironments. Geofluids 2002, 2, 63–94. [Google Scholar] [CrossRef]
  93. Peckmann, J.; Goedert, J.L.; Thiel, V.; Michaelis, W.; Reitner, J. A comprehensive approach to the study of methane-seep deposits from the Lincoln Creek Formation, western Washington State, USA. Sedimentology 2002, 49, 855–873. [Google Scholar] [CrossRef]
  94. Roberts, H.H.; Aharon, P. Hydrocarbon-derived carbonate buildups of the northern Gulf of Mexico continental slope: A review of submersible investigations. Geo-Mar. Lett. 1994, 14, 135–148. [Google Scholar] [CrossRef]
  95. Böttcher, M.E.; Smock, A.M.; Cypionka, H. Sulfur isotope fractionation during experimental precipitation of iron(II) and manganese(II) sulfide at room temperature. Chem. Geol. 1998, 146, 127–134. [Google Scholar] [CrossRef]
  96. Sim, M.S.; Bosak, T.; Ono, S. Large sulfur isotope fractionation does not require disproportionation. Science 2011, 333, 74–77. [Google Scholar] [CrossRef] [PubMed]
  97. Kiyosu, Y.; Krouse, H.R. The role of organic acid in the abiogenic reduction of sulfate and the sulfur isotope effect. Geochem. J. 1990, 24, 21–27. [Google Scholar] [CrossRef]
  98. Kohn, M.J.; Riciputi, L.R.; Stakes, D.; Orange, D.L. Sulfur isotope variability in biogenic pyrite; reflections of heterogeneous bacterial colonization? Am. Mineral. 1998, 83, 1454–1468. [Google Scholar] [CrossRef]
  99. Borowski, W.S.; Rodriguez, N.M.; Paull, C.K.; Ussler, W., III. Are 34S-enriched authigenic sulfide minerals a proxy for elevated methane flux and gas hydrates in the geologic record? Mar. Pet. Geol. 2013, 43, 381–395. [Google Scholar] [CrossRef]
  100. Jørgensen, B.B.; Böttcher, M.E.; Lüschen, H.; Neretin, L.N.; Volkov, I.I. Anaerobic methane oxidation and a deep H2S sink generate isotopically heavy sulfides in Black Sea sediments 1. Geochim. Cosmochim. Acta 2004, 68, 2095–2118. [Google Scholar] [CrossRef]
  101. Drake, H.; Hallbeck, L.; Pedersen, K.; Rosdahl, A.; Tullborg, E.-L.; Wallin, B.; Sandberg, B.; Blomfeldt, T. Investigation of Sulphide Production in Core-Drilled Boreholes in Äspö Hard Rock Laboratory. Boreholes KA3110A, KA3385A and KA3105A; Swedish Nuclear Fuel and Waste Management Co. (SKB): Stockholm, Sweden, 2013. [Google Scholar]
  102. Tullborg, E.-L.; Smellie, J.; Nilsson, A.-C.; Gimeno, M.J.; Auqué, L.F.; Brüchert, V.; Molinero, J. SR-Site—Sulphide Content in the Groundwater at Forsmark; SKB Report TR-10-39; Swedish Nuclear Fuel and Waste Management Co. (SKB): Stockholm, Sweden, 2010. [Google Scholar]
  103. Ivarsson, M.; Bengtson, S.; Drake, H.; Francis, W. Fungi in Deep Subsurface Environments. In Advances in Applied Microbiology; Academic Press: Cambridge, MA, USA, 2017. [Google Scholar]
  104. Bengtson, S.; Rasmussen, B.; Ivarsson, M.; Muhling, J.; Broman, C.; Marone, F.; Stampanoni, M.; Bekker, A. Fungus-like mycelial fossils in 2.4-billion-year-old vesicular basalt. Nat. Ecol. Evol. 2017, 1, 0141. [Google Scholar] [CrossRef] [PubMed]
  105. Ivarsson, M.; Holm, N.G.; Neubeck, A. The Deep Biosphere of the Subseafloor Igneous Crust. In Trace Metal Biogeochemistry and Ecology of Deep-Sea Hydrothermal Vent Systems; Demina, L.L., Galkin, V.S., Eds.; Springer International Publishing: Cham, Switzerland, 2016; pp. 143–166. [Google Scholar]
  106. Drake, H.; Ivarsson, M. The role of anaerobic fungi in fundamental biogeochemical cycles in the deep biosphere. Fungal Biol. Rev. 2018, 32, 20–25. [Google Scholar] [CrossRef]
  107. Ivarsson, M.; Schnürer, A.; Bengtson, S.; Neubeck, A. Anaerobic fungi: A potential source of biological H2 in the oceanic crust. Front. Microbiol. 2016, 7, 674. [Google Scholar] [CrossRef] [PubMed]
  108. Parkes, R.J.; Linnane, C.D.; Webster, G.; Sass, H.; Weightman, A.J.; Hornibrook, E.R.C.; Horsfield, B. Prokaryotes stimulate mineral H2 formation for the deep biosphere and subsequent thermogenic activity. Geology 2011, 39, 219–222. [Google Scholar] [CrossRef]
Figure 1. Map with sampled boreholes indicated. Geological units modified and slightly simplified from Sandström and Stephens [42].
Geosciences 08 00211 g001
Figure 2. Mineral coating descriptions. Photos of the drill core samples are on the left, including a separate photo of the sampled fracture surface. Backscattered SEM images are on the right-hand side. (a) KFM08D:677 m; subhedral coating of calcite on a chlorite-rich fracture coating. (b) KFM24:193; subhedral coating of calcite on a chlorite-rich fracture coating. (c) KFM24:379; euhedral pyrite (cubic with rounded edges) and calcite (equant) on euhedral quartz. (d) KFM24:396; euhedral calcite and pyrite on a coating of euhedral quartz. Calcite habit is scalenohedral, with relatively small c-axis to a-axes ratio, and obtuse crystal tip termination. Bright euhedral bastnäsite crystals occur on the calcite surface. (e) KFM24:399; intergrown K-feldspar (adularia, partly altered) and cubic pyrite on top and partly intergrown with euhedral quartz. (f) KFM24:410 m; subhedral calcite coating with scattered intergrown pyrite crystals.
Geosciences 08 00211 g002
Figure 3. Microanalytical transects within calcite. Backscattered SEM images of polished crystal cross sections are shown to the left, with spot locations indicated (for closely spaced 10 µm δ13C and δ18O SIMS spots and in (c,e) also for subsequent 80 µm 87Sr/86Sr LA-MC-ICP-MS spots). Corresponding isotopic values are shown on the graphs. Spans of calculated values for hypothetical calcite are also shown, and are based on the groundwater composition in the same section. For this comparison, temperature dependent fractionation factors for calcite precipitation at ambient temperatures are used for δ13C [62] and δ18O [63]. Due to the geothermal gradient, the deeper borehole sections (>500 m) have been assigned a larger temperature span (5–20 °C) than the shallower samples (~0–500 m; 5–15 °C). The lower temperature limit of 5 °C includes the possibility of rapid infiltration of glacial water to a great depth. Specific features include (a) spatiotemporal intracrystal variation in δ13C and δ18O values in sample KFM24:379. Both values increase substantially in the rim of the crystal compared to the crystal core. No groundwater data exists from this fracture, but the 15 m deeper section show hypothetical calcite δ18O values of −12 to −9.6‰V-PDB (Vienna Pee Dee Belemnite) that are neither corresponding to the rim nor to the core of the crystal. (b) 13C-enrichment throughout the crystal. The δ18O and δ13C values of the calcite are higher than the values calculated from the groundwater (KFM24:193). (c) Example of substantial 13C-depleted calcite, in this case, in the outermost rim of the crystal (KFM24:399, same feature exists in e.g., KFM24:410). The value of the calcite crystal rim neither has δ18O nor 87Sr/86Sr in equilibrium with the groundwater, although the outer part has elevated 87Sr/86Sr compared to the rest of the crystal. Similar δ18O and 87Sr/86Sr discrepancy between calcite and water occurs in KFM24:414 and KFM01D:431. (d) Calcite with moderate 13C-depletion (not in equilibrium with δ13CDIC) and δ18O values in correspondence with the groundwater (KFM08D:678, similar features occur in KFM24:413 and KFM24:194). (e) Aggregate of fine-grained crystals showing zonation (KFM08D:677). Microanalyses targeting the different crystal zones show overall correspondence of δ18O with the groundwater. By contrast, both δ13C and 87Sr/86Sr are overall higher in the groundwater than in calcite.
Geosciences 08 00211 g003
Figure 4. Isotope values (δ18O, δ13C, 87Sr/86Sr, and δ34S) in calcite, pyrite, groundwaters and gases vs depth. Top row (ad) shows all SIMS spots analyzed (V-CDT = Vienna Canyon Diablo Troilite). Lower row (eh) shows only the outermost crystal growth zone in contact with the modern groundwater. The graphs also show ranges for calculated values for hypothetical calcite based on the groundwater composition in the same borehole section (see caption to Figure 3 for details). For KFM02A, groundwater data from a slightly shallower zone is shown for comparison.
Geosciences 08 00211 g004
Figure 5. S isotope microanalytical transects within individual pyrite crystals. (a) KFM24:412 m, no major δ34Spyrite variation with growth. (bd) Increase in δ34Spyrite in the rim zone of the crystals. (b) KFM24:396, (c) KFM24:379 divided into two transects from core to rim (i and ii), (d) KFM24:399; several other crystals on the same fracture (and in sample KFM24:398) showed identical pattern. Errors are within size of the symbols. The axes of the different graphs have the same range, for comparison purposes.
Geosciences 08 00211 g005
Figure 6. Rb–Sr dating of co-genetic adularia–calcite from sample KFM24:399 m.
Geosciences 08 00211 g006
Figure 7. Carbonaceous matter as biofilms on, and incorporated in, minerals from sample KFM24:398. (A) A biofilm with characteristic “sheet-like” appearance. The top part is carbonaceous, and the lower part mineralized. The dashed line marks the transition from carbonaceous to mineralized portions of the biofilm. The appearance of the carbonaceous material (CM) is characterized by dark, patchy areas slightly stretched in the margins. (B) Abundant CM in between calcite and quartz crystals. The CM is partly mineralized (marked with white arrows). Remnant of associated putative fungal hyphae is marked by blue arrow. (C,D) CM with typical elongated and stretched appearance distributed on and in between calcite and quartz crystals, marked with white arrows. The CM has acted as nucleation site for mineralization, marked with blue arrows. (E) CM, as part of clay lining the sheet-like crystal lattice and voids in between the sheets as a dark patchy substance, marked by white arrows.
Geosciences 08 00211 g007
Figure 8. Putative fungal hyphae from sample KFM24:398 (AC) and KFM24:379 (D,E) preserved as CM or partly mineralized. (A) A long hypha originating in a biofilm (marked with a white arrow), which is incorporated in between calcite and quartz crystals. (B) Close up of a hypha that is flattened due to dehydration. (C) Hyphae in a chaotic and entangled mycelium-like network. Note the partial mineralization of the hyphae. Individual hyphae are marked with white arrows. (D) Close up of a hypha partly mineralized by calcite. (E) A hypha with multiple branching. The points of branching are marked with white arrows.
Geosciences 08 00211 g008
Table 1. Isotopic variability of the calcite and pyrite samples.
BoreholeSampleVertical Depthδ13Cminδ13Cmaxnδ13Cδ18Ominδ18Omaxnδ18O87Sr/86Srmin±87Sr/86Srmax±n87Sr/86Srδ34Sminδ34Smaxnδ34S
(m)‰, V-PDB‰, V-PDB‰, V-PDB‰, V-PDB‰, V-CDT‰, V-CDT
KFM01D316−253.27−7.4−2.815−12.7−5.9150.71060.00160.71180.00122 0
KFM01D431−341.50−10.9−4.513−13.4−6.2180.70540.0025 1 0
KFM02A162−155.290.011.310 0 0 0
KFM02A175−167.94−31.1−8.710−12.9−10.370.71420.0010 1 0
KFM08D677−544.25−12.6−0.521−14.5−8.0210.70970.00110.71240.001210 0
KFM08D678−544.48−8.9−2.925−8.0−17.918 0 0
KFM08D830−662.86−4.5−4.23−16.1−8.35 0−3.5−1.313
KFM08D832−664.86 0 0 00.012.48
KFM24193−191.00−9.118.54−13.1−8.27 0 0
KFM24194−192.00−16.1−4.913−16.1−7.4210.71820.0012 1 0
KFM24379−376.00−17.120.230−13.1−7.9160.71760.0033 1−11.737.824
KFM24396−392.00−36.2−10.424−13.7−9.8110.71430.00160.71590.00232−1.336.029
KFM24398−394.00−32.6−3.013−13.9−8.6130.71140.0031 1−2.421.227
KFM24399−395.00−35.8−10.623−12.4−7.1160.70890.00310.71610.00254−0.731.026
KFM24410−406.00−29.317.617−14.7−7.0190.71500.00330.71970.00243 0
KFM24413−409.53−29.8−9.916−15.0−6.2180.71840.0034 1−11.529.025
KFM24414−410.53−17.4−12.015−14.8−12.1150.71050.00290.716030.0007637.128.427
Total −36.220.2252−16.1−5.92200.70540.00250.71970.002430−11.737.8179
V-PDB = Vienna Pee Dee Belemnite, V-CDT = Vienna Canyon Diablo Troilite.
Table 2. Chemical composition (concentrations and isotopes) of waters and gases.
BoreholeSampling DateUpper PackerLower PackerNaKCaMgHCO3ClSO4FeMnSrDOCpH (lab)S2 in HSδ13Cδ34SSO487Sr/86Srδ2Hδ18OTemp
Groundwaters (m)(m)mg/Lmg/Lmg/Lmg/Lmg/Lmg/Lmg/Lmg/Lmg/Lmg/Lmg/L mg/L‰, V-PDB‰, V-CDT ‰ V-SMOW‰ V-SMOW°C
KFM01D2015312.50319.61179017.4108090.975.944662730.8040.34411.43.37.730.29−11.4028.90.720596−70.8−10.01
KFM01D2006428.50435.6415509.02143019.535.849401251.930.18217.43.77.550.01−13.2026.70.720149−74.9−10.70
KFM01D2015428.50435.6417507.20161018.414.7527267.20.04370.077219.14.67.813.22 42.90.720040−72.6−11.00
KFM08D2007669.70676.8419005.4227404.96.9874601010.00440.049829.3b.d.8.14b.d. 31.60.717523−84.0−12.30
KFM08D2013669.70676.8417807.23208010.410.0645575.4b.d.0.11422.80.78.40b.d.−4.5036.60.718009−84.1−13.11
KFM08D2007828.40835.5419906.2629608.59.0781601560.1140.072533.1b.d.7.930.07 26.60.717524−82.5−11.60
KFM242016191.50198.628174.7941111.321.0196544.00.7890.1194.59.37.200.17−15.9033.20.719201−107.8−14.4015.7
KFM242016395.50402.6215003.081740-0.56.80514815.1b.d.0.0039720.02.08.30b.d. 48.5 *0.719778 *−93.4−13.0916.1
KFM242016(nov)410.00417.1216003.271930-0.56.5055648.940.00490.0007122.42.08.830.29 57.50.719968−91.8−13.4115.9
KFM242016(dec) **410.00417.1214603.6017301.29.60503215.8b.d.0.006619.914.78.830.14−21.9037.60.719916−91.5−3.2115.4
BoreholeSampling DateUpper PackerLower PackerHeArN2CO2O2CH4H2C2H2C2H4C2H6C3H4C3H6C3H8C1/(C2+C3)
Gases, Concentrations (m)(m)(mL/L)(mL/L)(mL/L)(mL/L)(mL/L)(mL/L)(uL/L)(uL/L)(uL/L)(uL/L)(uL/L)(uL/L)(uL/L)
KFM01D *2015312.50319.6111b.d.1330.32b.d.0.643.5b.d.b.d.0.28b.d.b.d.b.d.2289
KFM01D2006428.50435.64261.10640.200.0620.14b.d.b.d.0.092.5b.d.b.d.0.5754
KFM01D2015428.50435.64231.30910.128.00.41b.d.b.d.b.d.3.0b.d.b.d.0.62137
KFM08D2007669.70676.84231.70730.0200.0350.090b.d.b.d.0.100.49b.d.b.d.0.20153
KFM08D2013669.70676.84221.20770.0400.250.10b.d.1.101.401.4b.d.b.d.0.7526
KFM08D2007828.40835.54241.40850.030b.d.0.060b.d.b.d.0.110.55b.d.b.d.0.2291
KFM242016395.50402.62101.30930.0191.40.19b.d.b.d.b.d.1.1b.d.b.d.b.d.173
KFM242016410.00417.12101.301210.0183.70.18b.d.b.d.b.d.1.1b.d.b.d.b.d.164
BoreholeSampling DateUpper PackerLower Packerδ2HCH4 δ13CCO2 δ13CCH4 δ18OCO2
Gases, Isotopes (m)(m)‰ V-SMOW± ‰, 1s‰, V-PDB± ‰, 1s‰, V-PDB± ‰, 1s‰ V-SMOW± ‰, 1s
KFM242016410.00417.12−22710.0−12.50.3−49.31.536.10.2
KFM242016 ***410.00417.12−24210.0−13.40.3−50.41.535.40.2
These results have been extracted from SKB: s database Sicada, and the data from 2007 have previously been presented in Hallbeck and Pedersen, 2009 [53]. DOC = dissolved organic carbon. V-SMOW = Vienna Standard Mean Ocean Water. b.d. = below detection. * From a separate sample in same monitoring time series. ** Indication of some degree of short circuiting. Gas sampling was done during this sampling in the monitoring time series. *** Duplicate analysis.

