Abstract
Glacitectonic deformation in the Upper Weichselian led to the tectonic framework of large-scale folds and displaced thrust sheets of Maastrichtian (Upper Cretaceous) chalk and Pleistocene glacial deposits in the southwestern Baltic Sea region. They form surface expressions of sub-parallel ridges and elongated valleys in between and on the Jasmund Peninsula. Geomorphological mapping and detailed landform analyses give another insight into the arrangement and the formation history of these proglacial surface structures. Light detection and ranging (LiDAR) digital elevation models (DEM) analysis techniques were applied to a proglacial rather than a subglacial environment. Results suggest a division into a northern part with morphological ridges striking NW–SE and a southern part with SW–NE trending ridges. The observation of partly truncated northerly ridges and their superimposition by the southern sub-complex suggest that the northern part was generated earlier than the southern part. The applied spatial analyses tools were used to develop a new, self-consistent genetic model integrating all parts of the 100 km2 large Jasmund Glacitectonic Complex. Results suggest a more consistent terminology for the tectonic setting and a revised genetic model for Jasmund, including three evolutional stages that are characterized by different ice flow patterns.
1. Introduction
Glacitectonic complexes are small-scale fold and thrust belts in terms of geometry and formation processes [1,2,3,4]. However, they originate from ice-marginal or proglacial deformation instead of classic orogenesis [3,4]. The deformation can extend to a depth of a few tens of meters up to 200 m [5,6]. Germany’s largest island, the Isle of Rügen, which is located in the SW-Baltic Sea (Figure 1a) is a major example of large-scale glacitectonic folding and thrusting [7,8,9,10]. The glacier-induced structural system is of Upper Weichselian age and well-exposed in the steep sea cliffs along the eastern and southeastern coast of the Jasmund Peninsula (Figure 1b,c). The tectonic structure and development of Rügen has been investigated for more than a century. An early significant study was published by Credner [11], who has already illustrated the surface structure of Jasmund, which is composed of differently orientated sets of sub-parallel ridges. There is a high number of scientific papers on the glacitectonic development of Jasmund, which chiefly refer to the term push moraine (e.g., [7,9,12]). Push moraines are known as proglacial landforms, which can, for instance, be observed on Iceland (e.g., [13,14,15,16,17]). However, Benn & Evans [18] classify the morphology of glacitectonic complexes as a large composite ridges system. One example is the morphology of the Weichselian glacitectonic complex of Møns Klint in SE Denmark, which is well comparable to the structural setting of Jasmund [18,19,20,21,22]. A recent example can be observed in front of Holmstrømbreen (Svalbard) [18,22,23].
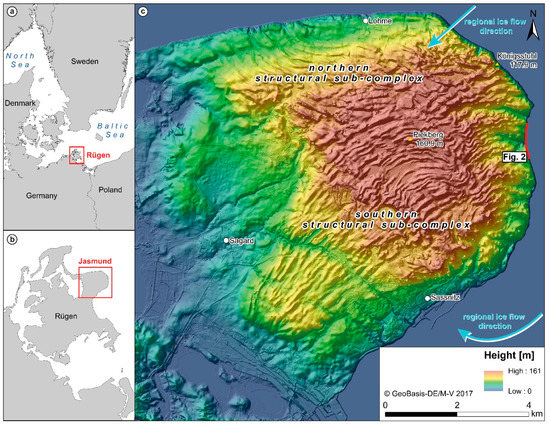
Figure 1.
Overview maps of Rügen Island in the southwestern part of the Baltic Sea (a) and the Jasmund Peninsula in the northeast of Rügen (b); The digital elevation model with a solution of 5 m (DEM5, 10 times exaggerated, hillshade) of the Jasmund Peninsula shows the topography and the separation of the surface into a northern and southern ridge domain representing structural sub-complexes of the entire glacitectonic complex (c). The regional Weichselian ice flow directions from NE and SE are shown as light blue arrows.
Tectonic studies of Jasmund are centered around two questions. Is the morphology of the Jasmund Peninsula, an expression of the internal architecture? If so, is there a characteristic morphological arrangement, which gives rise to the tectonic evolution? Answering those questions requires a discussion about the two proglacial landforms push moraines and composite ridges, which should lead to a consistent terminology for Jasmund, taking in the context of modern classifications of glacitectonic complexes (see [18,22]).
(Annual) push moraines are elongated glacial landforms, which developed through ice-marginal push during winter readvances by glaciers undergoing overall retreat [18]. They are characterized by an asymmetric mean longitudinal profile with a distal slope that is exceeding the proximal. However, composite ridges can be interpreted as surface expressions of fault-related folds, which show asymmetric profiles in relation to push direction, similar to push moraines [3,4,24]. An analysis of a glacitectonic environment, like Jasmund, needs to deal with this complication. However, push moraines and composite ridges may differ in ridge spacing, especially flow-parallel periodicity.
The application of digital terrain data is beneficial in tectonic geomorphology (see [25,26,27,28]). The analysis of high-resolution digital elevation models (DEM) derived from LiDAR (light detection and ranging) data constitutes a new research tool for sedimentological and tectonic studies and has been used extensively in the investigation of the glacitectonic complex of Jasmund. Intense geomorphological investigations on recent glacial landsystems were performed in Iceland, on Greenland and Svalbard by the use of historical maps, as well as aerial photographs, digital elevation models, and bathymetric data (e.g., [15,17,29,30,31,32,33,34]). In Germany/Poland DEMs were integrated to conceive Elsterian, Saalian, as well as Weichselian ice marginal landforms and glacier extents (e.g., [35,36,37,38,39]).
A special terrain analysis technique is the spectral Fourier transformation, which can be used to analyze the properties of periodic (sinusoidal) signals. Using the elevation of ridges and troughs encoded in a DEM as signal, Fourier analysis can be used to measure the predominant wavelength of the terrain [40,41]. This paper endeavors to resolve the discrepancies between the internal structure and the surface morphology of the Jasmund Peninsula and proposes a more consistent genetic model for the entire glacitectonic complex. Using high-resolution DEMs from LiDAR data and Fourier analysis, Cline et al. [42] investigated the origin of washboard moraines in the late-Wisconsinan Des Moines Lobe (IA, USA). In our investigation, we applied similar methods (Fourier analysis of LiDAR derived high-resolution DEM), albeit in the very different geological setting of Jasmund in the southwestern Baltic Sea.
2. Geological Setting of the Study Area
The Jasmund complex consists of a number of large-scale folds and associated thrusts, which form an imbricate thrust stack or duplex deforming both Upper Cretaceous (Maastrichtian) chalk bedrock and Pleistocene glacial deposits [7,9,10,11,12,43] (Figure 2).
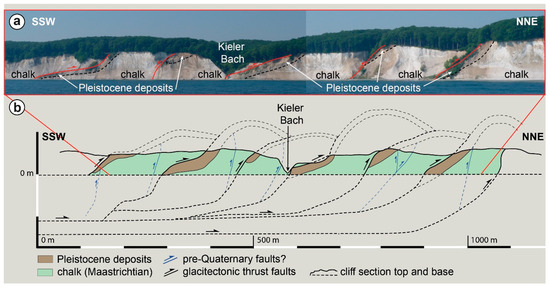
Figure 2.
Exemplary outcrop at the creek Kieler Bach showing six thrust sheets of the southern structural sub-complex of Jasmund. (a) Overview of the cliff coast SSW and NNE of Kieler Bach (c. 1000 m). The red lines represent the thrust faults. The black dashed lines show the boundary between the Cretaceous (Maastrichtian) chalk and the Pleistocene deposits; (b) Cross section of the same outcrop with interpreted thrust faults, anticlines and detachment surfaces above and below the cliff boundaries. The black thrust faults are highly likely related to the glacitectonic deformation in the Upper Weichselian, while the blue reverse faults could also be of pre-Quaternary age (see e.g., [44]). For simplification, the youngest Pleistocene till complex (M3) covering parts of the glacitectonized sequence at the cliff top has not been incorporated in the cross section.
The glacial sediments are subdivided into at least three tills that are separated and overlain by units of interbedded gravel, sand, and clay. The Pleistocene sediments lie paraconformably on the Maastrichtian chalk, parallel to this major lithostratigraphical boundary. These glacial deposits are exposed in the large synclines of the glacitectonic complex, mostly cut by thrust faults at the southern limbs. The faults in the southeastern and eastern cliff sections are generally inclined towards S/SW, while the thrust faults exposed at the northern cliff coast dip to NNE/NE (see [8,9,44,45]). The youngest till is exposed at the top of the cliff and lies unconformably upon a major erosion surface, which truncates the underlying glacitectonised sequence [9,46,47].
The regional stratigraphic correlation of the individual tills and their relationships to the interbedded sediments are still under debate (see [48] and references therein). The majority of the Pleistocene sedimentary record on the Jasmund Peninsula is considered to have been deposited during the Weichselian glaciation when the Scandinavian Ice Sheet (SIS) extended southwards across the Baltic Sea and into northern Europe. In this part of the Baltic Sea, the Weichselian glaciation has been divided into three ice advances; the Brandenburg/Frankfurt phase (W1, <24 ka BP), the Pomeranian phase (W2, 17.6 ka BP), and finally, the Mecklenburg phase (W3, 17–15 ka BP) [49,50,51,52,53].
These three phases resulted in the deposition of regionally extensive till sheets intercalated by interstadial sediments [8,45,47,52,54]. The age of the youngest till on top of the glacitectonised sequence is poorly constrained and it has previously been correlated with either the Pomeranian ice advance, or locally the Mecklenburg phase [8,47,52]. If these regional correlations are correct, then it would suggest, that the formation of the glacitectonic complex of Jasmund post-dated the Brandenburg/Frankfurt advance, hence occurred probably after the Last Glacial Maximum (MIS 2) in response to a re-advance of the SIS during the Pomeranian phase [7,8].
In this paper, we focus on two interesting areas on the Jasmund Peninsula: the southern part of the region (southern structural sub-complex) with its SW–NE-trending ridges, and the northern part (northern structural sub-complex) with approximately NW–SE-trending landforms. Figure 1c shows a hillshade map of the LiDAR-derived DEM. Given that deposits relating to the Mecklenburg phase are only locally preserved/developed, it can be argued that these landforms are also related to the Pomeranian ice advance.
Previous workers [7,9,11,12,43] have divided Jasmund’s surface structure into northern and southern zones, with these structural domains broadly corresponding to landform assemblage zones that were observed on the DEM (see Figure 1c). However, work by Ludwig [9] casts doubt on a complete conformity between the tectonic structure and the morphology of Jasmund. Within the central zone of the glacitectonic complex, structures with irregular dip and azimuth values were found. Furthermore, there appears to be a N–S trend of faults in the eastern cliff sections and E/NE verging folds in the south of the complex, which seem contrary to Jasmund’s surface structures.
Moreover, the structural evolution of Jasmund is still unclear. Groth [7] suggested a successive glacigenic formation of different structural units, starting with the major part of the southern structural sub-complex by a push from SE, followed by a glacier push from NE/E forming the northern structural sub-complex, as well as the south of the southern sub-complex. The deformation continued with a complicated reorganization of the southernmost zone (push from NE) and a final superposition of the entire complex. Ludwig [9] suggested that the glacitectonic complex of Jasmund developed at the confluence between two major ice streams, which were active during the Pomeranian W2 phase. In this model, the Jasmund Peninsula would have formed a topographic high, which at least initially separated the Baltic ice into two ice streams. Pressure that was formed between the two competing flows resulted in folding and thrusting of the chalk bedrock and its Pleistocene cover. Ludwig [9] describes that process as a loop-shaped accretion of the deposits between these ice streams, ending up in a compressional arc that is convex to the east. This is thought to have been followed by a westward shift of the southern and northern thrust sheets induced by the increasing ice accumulation.
Although both of the models contribute to our understanding of the overall evolution of the Jasmund Peninsula, they do not completely agree with each other and there is still need for a more consistent theory for the development that integrates all parts of the 100 km2 large complex.
3. Methodology
3.1. Geomorphological Mapping and Morphometric Analysis
We used a DEM of the Jasmund Peninsula to combine structural information with the morphology of the glacitectonic complex into a consistent kinematic model for Jasmund’s evolution. The related LiDAR data have been provided by the LAiV M-V (Landesamt für innere Verwaltung Mecklenburg-Vorpommern, Schwerin, Germany). The resolution of the original LiDAR point data set is around 1 m (LiDAR point distance: 60 to 80 cm). The bare-earth version of the LiDAR data was converted into elevation raster DEMs.
A digital elevation model with a resolution of 5 m (DEM5) was used to create a geomorphological map in ArcGIS 10.2, taking into account a 1 m resolution DEM (DEM1) to resolve some details. The map was produced at a working scale of 1:10,000, ridge digitizing was done at scales of 1:5000 to 1:3000. The mapping techniques that were used are based on Evans & Twigg [15] and Evans [31]. To characterize the spatial features of Jasmund, we used the orientation/outer shape and the total size of the glacitectonic complex, the number of ridges, their width and height, as well as the spacing between the ridge crests and their symmetry. The detailed assessment of the ridge morphometry is based on Bradwell et al. [17].
A total of 14 profiles (transects) were drawn across the two areas, while considering that each transect has to be perpendicular to the ridge crests. When the ridge orientations varied locally, long and short transects were drawn at similar positions, e.g., N01 (long) and N05 (short). To increase the signal-to-noise ratio of the analysis, each profile was sampled in a swath of parallel tracks that were centered around each profile. We used two types of swaths: five tracks with a 25 m spacing (5p) and nine tracks with 1 m spacing (9p). Regarding to the evolutional models of Jasmund, the northerly profile swaths have their distal end (towards the foreland) in the SW and the proximal (towards the hinterland) in the NE. The ridges of the southern sub-complex have a distal NW end and a proximal SE end.
For the analysis, the two sets of tracks for the 14 profiles were exported as Excel spreadsheet files. A traditional morphometric analysis of the averages of each of the 14 profiles (5p) was used to derive a set of ridge parameters. The morphometry of each ridge crest includes the height and width, as well as the spacing between each other. Furthermore, the ridge height, crest-line position and ridge width were used to calculate the slope angles using trigonometry (Figure 3) (see [17]).
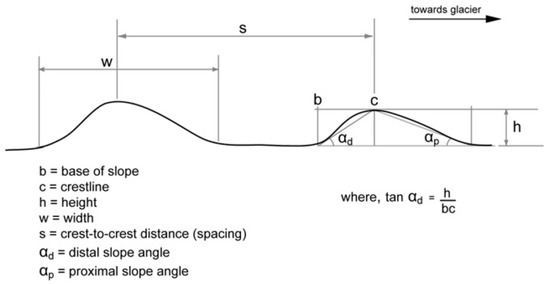
Figure 3.
Schematic showing of measurement and calculation of the morphometric parameters of ridges crests, e.g., push moraines. We used: height (h), width (w), slope angles (alpha), and spacing (s) [17].
Averages of the 5p profiles were used for the ridge stacking. However, for the spectral analysis, each of the 9p tracks was analyzed first and their results were then averaged.
3.2. Ridge Stacking
To visualize the shape of the ridges along each profile, the 14 (averaged) profiles were divided into trough-peak-trough segments. To calculate a representative shape, the segments were normalized, stacked, and averaged. The original trough-peak-trough curves (Figure 4a) were rotated so that the first and last sample are at the same elevation (Figure 4b), its highest (post-rotation) elevation was used to mark a structural peak (shown with a +). The curves were first normalized in x, so that troughs are at 0.0 and 1.0 and the peak is at 0.5 (Figure 4c) and then normalized in y and stacked at their peaks (Figure 4d). The resulting stack of curves was averaged and plotted with error bars (±1 standard deviation) (Figure 4e).
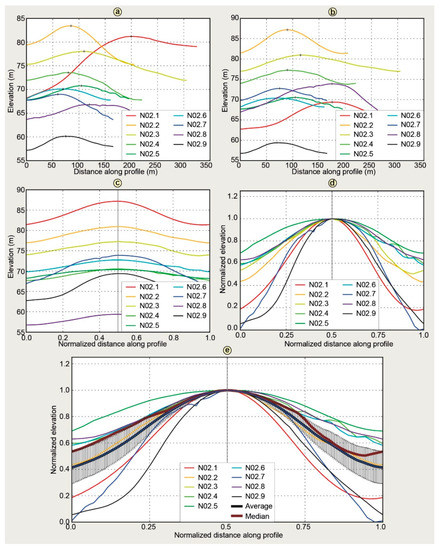
Figure 4.
Steps for calculating a stacked ridge plot from well-defined ridges along profile N02: (a) Original trough-peak-trough segments extracted from the elevation profile; (b) Rotated ridge crests with its highest (post-rotation) elevation to mark a structural peak (shown with +); (c) Normalized ridges in x; (d) Normalized ridges also in y and stacked at their peaks; and (e) Added elevation average with error bars (±1 standard deviation).
3.3. Spectral Analysis
Performing a Fourier (spectral) analysis of the trough-peak-trough “waves” of each ridge profile results in insights about the most important wavelength that was covered by the profile. Spectral analysis has been a useful tool for terrain analysis within various scientific disciplines [40,55,56].
A number of previous studies have used Fourier transforms to identify periodic structures or to describe the variance structure or the scaling properties of topographic or bathymetric data [57,58,59,60,61,62,63,64]. Its application to a glacigenic setting has been shown by an investigation of washboard moraines by Cline et al. [42]. Although it is not a proglacial environment, like the Jasmund Glacitectonic Complex, we use their work as a basis for our investigation. Spectral analysis of terrain assumes that the waves of the profiles across the terrain are composed of sine waves of different wavelengths and amplitudes. A Fourier transform, applied to this terrain signal, converts it from the space domain into the frequency (wavelength) domain and reveals its components. All of the profile tracks are sampled in regular intervals along a straight line; each elevation sample corresponds to a cell on the 5 m raster DEM. Each sample stores the horizontal distance from the start of the track and an elevation.
We wrote a MATLAB script to create a smoothed periodogram for each profile, via the following processing steps: Detrending, zero padding, tapering, and fast Fourier transform. As the ridge morphology shows regional deformations, the profiles show a weak trend. Detrending the data before the analysis helps to remove low-frequency/large wavelength noise. By fitting a polynomial function of a certain order (0, 1, 2, etc.) through the data and subtracting the data from it, the remaining residuals represent the detrended profile. Although higher order polynomials (3, 4, 5) capture more of the total variance, the objective is only to remove large-scale (10 km+) regional signals from the smaller scale (100–300 m) signal to be investigated. A higher order leads to “over-fitting”, which is mathematically correct, but is unrealistic for a geological setting like Jasmund. We therefore only removed trends of orders 1 or 2 providing a clearer periodogram, after which the elevation of the profile is centered around 0.
We use a fast Fourier transform (FFT) algorithm [65], which requires the number of samples to be a power of 2 (e.g., 1024, 2048, or 4096) (zero padding). The detrended elevation data is already centered around zero, appending a number of 0-elevation samples does not change the character of the data and does not alter the resulting spectrum. Typically, the next higher power of 2 is used, e.g., a profile with 1934 samples would be padded up to 2048 samples, 2134 samples to 4096. The power of 2 used, also determines the “granularity” (number of bins) for which the Fourier transform is performed. Padding to even higher powers of 2 (e.g., padding 1934 samples to 4096 instead of 2048) can provide more details in the periodogram.
Ideally, waveforms that are used for Fourier analysis are perfectly circular, i.e., the amplitude (elevation) of the last sample (ignoring padding) should be the same as that of the first sample. In reality, that is rarely the case and any difference between the first and the last sample create so-called spectral leakage, which may obscure the main frequency and should be minimized. Tapering “squeezes” the first and last short part of the profile down to 0 using a signal filter.
The MATLAB script calculates the Fourier transform for a profile with multiple tracks. The result is a frequency domain plot, called a periodogram, which shows the strength of periodic components (spectral power) as mean squared-amplitude of the variance on the y-axis and frequency/distance (ridge spacing) on x-axis. The distance logarithmically decreases from long wavelength (low frequencies, left) to short wavelength (high frequencies, right). The corresponding wavelength (ridge spacing) is shown in the top. The unit on the y-axis is the mean squared-amplitude of the variance; it has been normalized so that the sum of the spectral power of all the components corresponds to the variance of the data.
Recall that each profile contains multiple tracks that are parallel to a center track at certain spacing. It is possible to average the elevation of each track, detrend, pad, and taper it, and calculate a periodogram from it (pre-averaging). However, we found it to be somewhat beneficial, albeit more computationally intensive, to perform these steps on each track and to average the resulting periodograms into a generalized periodogram (post-averaging). Post-averaging seems to better bring out the essential wavelengths and provide clearer periodograms.
Although strong spectral peaks at a certain wavelength in the periodogram likely indicate an important spacing at this wavelength a baseline for determining statistical significance is required. The spectrum of red noise is used as baseline, or null continuum, in order to indicate which peaks are high enough to be the result of a non-random process [40]. Using a chi-square distribution with two degrees of freedom, a 95% confidence interval was calculated from the variance of the elevation profile (total area under the curve) spectrum and plotted as a line above the baseline. Spectral peaks reaching above this 95% confidence line have only a 5% probability to exist purely by chance, and are thus considered to be statistically significant.
Like any method, Fourier analysis of terrain has some limitations. The one-dimensional (1-D) Fourier analysis used here requires the digitization of straight profiles along which the DEM data for the analysis is sampled. The swath sampling we used mitigates data quality issues. Using a two-dimensional (2-D) Fourier analysis [40] instead would remove that human interpretation from the process. Note however, that interpreting 2-D periodograms is more challenging.
Although the core analysis, especially the statistical significance, is mathematically rigorous, some of the parameter values that were used for the entire process were chosen from experience and with an eye towards improving the visual power. For example, in the literature, the smoothing of the periodogram is often cited as vital to discern signal from noise, which was the case with the data in Cline et al. [42]. However, for our data set, no smoothing was required.
Although its effect on the periodogram is minor, the choice of the trend order (usually first or second order) was primarily motivated by what type of process might have affected the area and not by a separate investigation.
Finally, Fourier analysis fundamentally assumes that the underlying data is composed of sine waves, which, in concert, approximate the shape of the terrain. Because this is just an approximation, terrain periodograms can show artifacts, like the merging of peaks for two distinct, but close-together wavelengths (e.g., 160 m and 200 m), into one large peak (at 180 m). An alternative, more general approach that avoids this fundamental assumption can be found in wavelet analysis (e.g., [66]).
4. Geomorphological Map and Morphometry of the Surface Structures
4.1. Glacial Geomorphology of Jasmund
The main feature of Jasmund’s morphology is represented by two differently orientated ridge domains, the northern and southern structural sub-complex (Figure 5). In the geomorphological map, the quasi-parallel ridges and elongated valleys are initially labelled as composite ridges. The southern ridge set is orientated SW–NE, while the northern set is aligned NW-SE. The southern set of ridges is arcuate, assumedly concave to the former glacier margin in the southeast. It consists of ca. 13 to 25 quasi-continuous ridges. Their number decreases to the outer zones of the southern sub-complex due to the disappearance or merging of ridges in some parts, and they are also truncated by rivers and anthropogenic constructions, like roads and open pits. The ridges are less distinct in the southwestern district due to agricultural activity. There, without agricultural activity, the relatively strong original ridges have been well preserved. Furthermore, in the northeastern district of the southern set, the crest lines show a crenulated character.
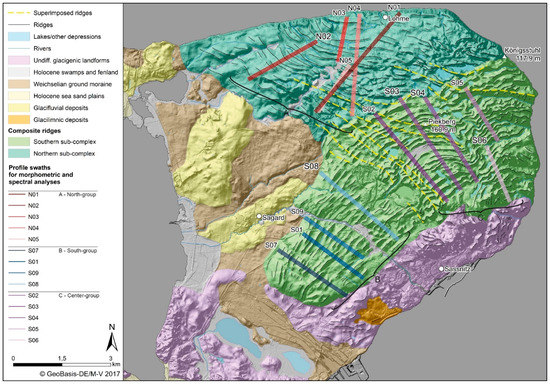
Figure 5.
Geomorphological map of the Jasmund Peninsula with the digital elevation model with a resolution of 5 m (DEM5) as background. The separation into the northern (turquoise) and southern (light green) sub-complexes is evident by the changes in ridge orientation. Profiles used for morphometric and spectral analyses in the northern (N01–N05) and southern sub-complex (S01–S09) are shown in different colors (North-group: red, South-group: blue, Center-group: violet).
The northern ridge set appears to be partly truncated and superimposed by the southern set. The yellow dotted lines in the geomorphological map indicate the traces of the superimposed northern ridges (Figure 5). The northern complex is arcuate, too, but is concave to NE. The ca. 12 ridges are mostly continuous, but are sometimes cut by roads and rivers. They show the same signs of bifurcations and mergers, like those in the southern complex. The morphology in the northern set is also very smooth due to agricultural effects. In the easternmost district, the ridges get extremely short and are arranged in a chaotic way.
Both composite ridge sets are in patches that are covered by depressions, which often form lakes (Figure 5). The lakes are potential karst phenomena, kettle holes, or both (e.g., [7,67]). Especially, the boundary between the southern and the northern ridge set and the area SE of the highest elevation Piekberg (160.9 m a.s.l.) are affected by these depressions.
Morphological highs SE of the southern ridge set, as well as in the southwestern region of Jasmund and the prolonged land districts are labelled as undifferentiated glacigenic landforms (Figure 5). The morphological highs are characterized by differently orientated ridges. The southeastern district has SSW-NNE striking ridges, a little further to the west the ridges tend to strike SE-NW. The westernmost area SW of the town Sassnitz rather shows a chaotic ridge arrangement. Although there is as of yet not a lot of evidence, these landforms might be interpreted as hummocky moraines.
The western area of the Jasmund Peninsula is characterized by glacifluvial deposits and a till of a Weichselian ground moraine (W2 after [68]). The ground moraine is likely to be older than the glacifluvial sediments or at the same age. All in all, the western deposits of the peninsula are likely younger than the glacitectonic complex in the east (Figure 5), as the M3-till complex (W2) covers the complex or at least parts of it. Some patches of Holocene swamps/fenland cover parts of the river valleys, the shore to the western bay, and the elongated area between the morphological highs in the south (Figure 5). Holocene sea sand plains connect the Jasmund Peninsula with the peninsulas in the NW and SE of Rügen (see Figure 1b and Figure 5).
4.2. Morphometry of the Ridge Crests on Top of the Northern and Southern Sub-Complex
The 14 elevation-profile tracks used are shown in Figure 5. Each profile is sampled by a swath of five parallel tracks, 25 m apart. We averaged the tracks for each swath to obtain information about the ridge morphometry within three groups. The profiles of the northern sub-complex (turquoise) comprise the North-group (N01–N05). Those of the southern sub-complex (light green) were subdivided into a South-group and a Center-group. The South-group comprises the profiles S01, S07, S08, and S09; the Center-group profiles sit farther northeast and include S02, S03, S04, S05, and S06.
The heights (amplitudes) of the North-group profiles (Table 1) range from 1.3 to 26.8 m, the mean amplitude is 9.9 m. Most crests tend to be asymmetric, especially at profile N03. In many cases, this asymmetry is not very pronounced (around 1° to 4° difference in proximal and distal slope angles). Of the overall 41 investigated ridges, only about seven are clearly symmetric.

Table 1.
Summary of all morphometric parameters of each elevation profile in the northern and southern sub-complex. For each profile, mean, the minimum and maximum values are shown. For each group, the mean its profile means is shown. Finally, the mean of the entire southern sub-complex (S + C) and the mean of all profiles is shown.
The width-to-spacing ratio ranges from 0.5 to 2, regarding to the calculated minimum and maximum values, but the average spacing-to-width ratios are close to 1. The mean width of the ridges ranges from about 150 m to 340 m, with an average of 216 m.
N02, the westernmost profile of the northern sub-complex is a representative example for this group. From the plot in Figure 6, N02 appears mostly symmetric, the measured data confirm that its northeastern (proximal) slope (2.23°) is only slightly steeper than the southwestern (distal) slope (1.92°). The ridges of profile N02 are, on average, 6.22 m high, 223.56 m wide, and spaced by 248.58 m (Figure 6, Table 1).
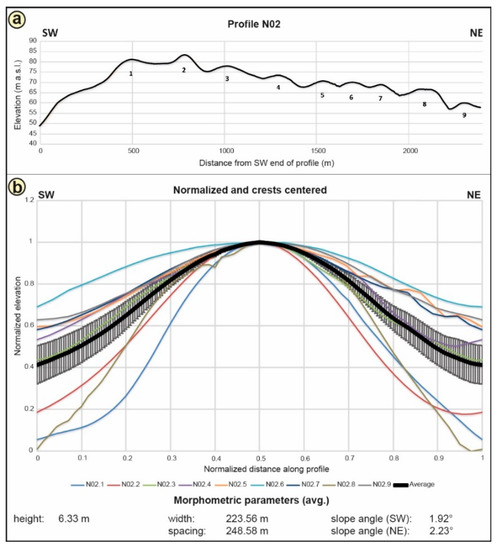
Figure 6.
Profile N02 is shown as elevation profile from its distal (SW) to proximal (NE) end with the numbered ridge crests (a); The stacked profiles of the elevation profile include the average graph (thick black graph) and error bars (±1 standard deviation) (b). The morphometric parameters—mean height, width, spacing, and slope angles—are shown below.
The amplitudes in the profiles of the South-group (Table 1) range only from 0.8 to 13 m. Except for profile S08, the ridges in the central part of each profile have the highest amplitudes. Optically, all of the ridges appear to be symmetric, but the calculated slope angles indicate slight asymmetries with steeper NW (distal) slopes. The mean spacing in the South-group profiles is equal to or smaller than the mean width. Profile S08, in the center of the southern ridge set (Figure 5), is a representative example for this group. Its 15 ridges are generally 6.41 m high, 179.1 m wide, and is spaced by 187.42 m (Figure 7). Its normalized, stacked ridges show a rather symmetric crest (NW: 2.63°, SE: 2.39°) (Figure 7, Table 1).
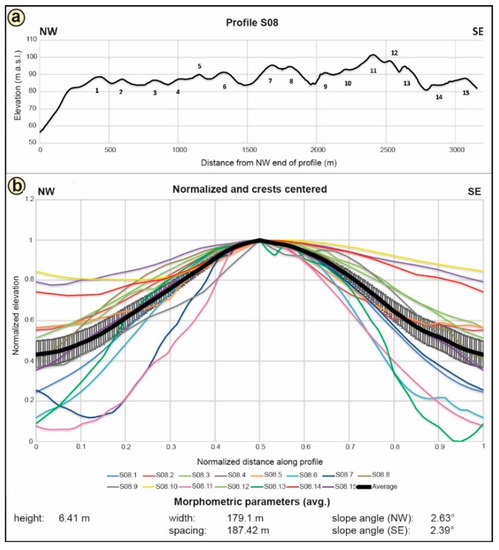
Figure 7.
Profile S08 is shown as elevation profile from its distal (NW) to proximal (SE) end with the numbered ridge crests (a); The stacked profiles of the elevation profile include the average graph (thick black graph) and error bars (±1 standard deviation) (b). The morphometric parameters—mean height, width, spacing, and slope angles—are shown below.
Ridges in the middle area of the zone comprising the Center-group show lower amplitudes than ridges towards the foreland (NW). This is very likely related to the depressions (e.g., kettle holes) affecting the morphology in the profile centers, south of the Piekberg (see Figure 5). The amplitudes range from 1.5 to 30 m (Table 1). There are very large differences between the minimum and maximum amplitude along a single elevation profile such as S03 and S05. On the stacked ridges plots, crests appear to be generally symmetric, but get more asymmetric to the east coast (see Figure 8 and Figure 9, and Table 1). The crests are characterized by a width-to-spacing ratio that is relatively close to 1. In profiles where this is not the case (e.g., S05), the mean spacing is smaller than the width.
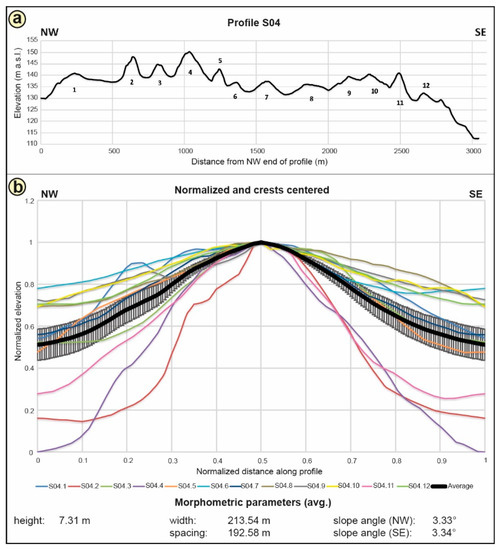
Figure 8.
Profile S04 is shown as elevation profile from its distal (NW) to proximal (SE) end with the numbered ridge crests (a); The stacked profiles of the elevation profile include the average graph (thick black graph) and error bars (±1 standard deviation) (b). The morphometric parameters—mean height, width, spacing, and slope angles—are shown below.
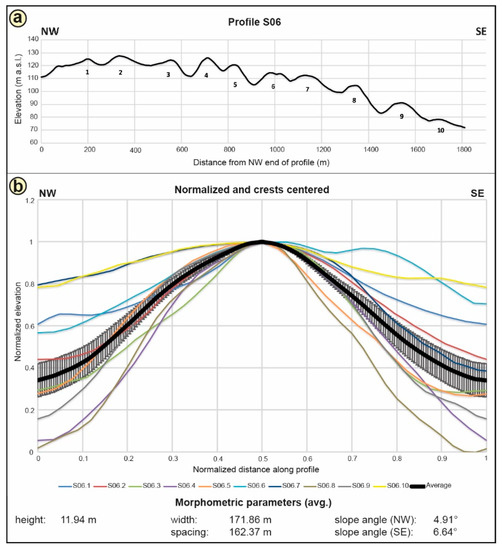
Figure 9.
Profile S06 is shown as elevation profile from its distal (NW) to proximal (SE) end with the numbered ridge crests (a); The stacked profiles of the elevation profile include the average graph (thick black graph) and error bars (±1 standard deviation) (b). The morphometric parameters—mean height, width, spacing, and slope angles—are shown below.
Profile S04, with 12 ridges, is a representative example for this group. Its wavelength appears to be relatively homogeneous (Figure 8a). However, the amplitudes in the northwest part are higher than in the southeast. The plot of normalized, stacked ridges shows a symmetric shape (Figure 8b). The average height of the ridges is 7.31 m, the average width 213.54 m, and their spacing 192.58 m.
Profile S06 is representative of the easternmost edge of the southern ridge domain and comprises 10 ridges (Figure 9a). The plot of normalized, stacked ridges shows a slight asymmetry with a steeper southeastern (proximal) slope (SE: 6.64°, NW: 4.91°) (Figure 9b). The average height of the ridges is 11.94 m, the width 171.86 m, and the spacing between the undulations is averagely 162.37 m.
The heights of all ridges in the southern sub-complex (South- and Center-group combined) range from 0.8 to 30 m, with an average of 7.76 m. The highest amplitudes occur in the easternmost district of the southern sub-complex. The mean heights (amplitudes) of the ridges in each elevation profile of the North-group range from about 2 to 27 m (average: 9.86 m), which is comparable to the ridges of the southern sub-complex.
All the ridges of the North-group appear to be relatively symmetric; morphometric calculations revealed slight asymmetries in a few profiles. Profiles of the South-group (S01, S07, S08, S09), which is located in the southwestern district of the southern sub-complex, have slightly steeper slopes facing NW (distal), while those of the Center-group in the northeast have rather steeper slopes facing SE (proximal).
According to the morphometric analysis, the widths and the spacing of the ridges along all profiles appear to be relatively homogeneous. They are between 134 and 228 m in the South- and Center-group and between 151 and 342 m in the North-group.
5. Spacing Character of the Morphological Ridges
Fourier analysis was performed to determine the periodicity and dominant wavelengths of each profile. The nine-track periodograms (9p), as shown in Figure 10, are indicative of the deformation chronology of Jasmund. They were primarily favored over the 5p results as they usually offered a clearer picture of the situation. The center of statistically significant peaks is interpreted to represent a single, significant wavelength (see [42]).
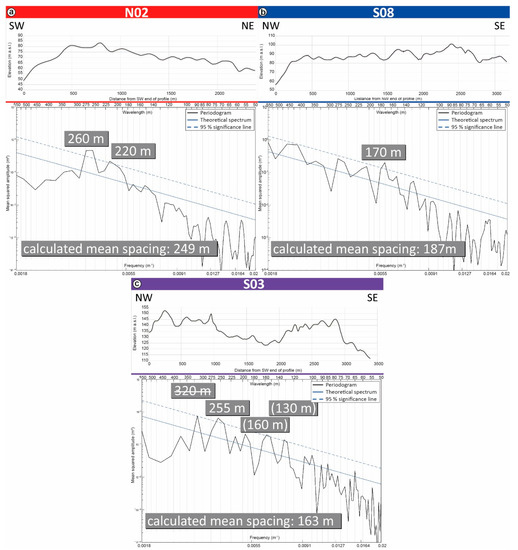
Figure 10.
Elevation profiles and related periodograms of the profiles N02 (a); S08 (b); and S03 (c) representing the southern and northern sub-complex, and the “central zone” as the special area of the southern ridge domain. The significant wavelengths are shown in grey boxes above the related peak. The struck through value in the S03-periodogram (c) represents an outlier and the values in parentheses are tangent to the 95% significance line, but are still significant. Calculated mean spacing values in grey boxes support the results within the periodograms.
Since no wavelength can realistically be smaller than the minimum value or larger than the maximum value of the observed ridge-to-ridge spacing of a profile (see Table 1), some theoretically significant wavelengths can safely be discarded as unrealistic. In addition, the z-scores and the Grubbs’ test [69] were used to detect other outliers.
Periodograms of the northern sub-complex potentially show statistically significant wavelengths from 160 to 320 m. However, the measured minimum and maximum ridge spacings, as well as the Grubbs’ test and z-scores limit the realistic wavelength to between 200 m and 260 m (Figure 11). The westernmost, short profile N02 shows two peaks in the periodogram at wavelengths of 260 m and 220 m (Figure 10a), which straddle the calculated mean spacing of 249 m as well as the mean width of the ridges (224 m). This may indicate a change of the dominant wavelength along the profile between those two values. The spectral analysis indicates that the profiles of the northern ridge area have a dominant wavelength at around 260 m (Figure 11).
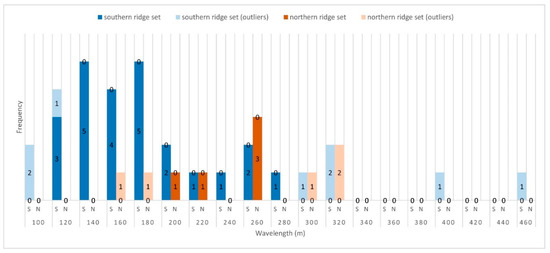
Figure 11.
Histogram of all results from the Fourier analysis of the northern and southern sub-complex. The bottom values represent the amount of significant wavelengths and the top values represent the outlier count. The wavelengths of the northern ridge set (orange bars) are significant between 200 and 260 m. The results from the southern ridge set (blue bars) are pooled around 140 to 180 m, but show significant wavelengths from 120 to 280 m.
The statistically significant periodicities of morphological ridges in the southern sub-complex (South- and Center-group combined) range from 97 to 450 m. However, wavelengths that are greater than 280 m can be discarded as unrealistic as it is longer than the longest ridge-to-ridge distance in any profile of this group. This also applies to the shortest ridge-to-ridge distance. All of the values shorter than 120 m can be excluded. Therefore, the realistic range of significant wavelengths in the southern sub-complex is only from 120 to 280 m. The dominant wavelengths range from 135 to 195 m (Figure 11), which are generally smaller than those of the northern sub-complex. This could point to slight differences in formation time and mechanisms between the northern and southern ridge domains, for instance, with regard to exerted stresses and glacier velocities. The periodogram of the easternmost profile of the South-group, S08, shows a significant 170 m peak on the 9-track periodogram (Figure 10b), which is close to the calculated mean spacing of 187 m and the mean ridge width of 179 m.
The wavelengths of the Center-group profiles (see Figure 5) show a more complex distribution than those of the North- and South-group. The periodogram for profile S03 shows several statistically significant peaks (320, 255, 160, and 130 m) (Figure 10c). Applying the Grubbs’ and z-scores tests, excludes the 320 m peak. The 160 m and 130 m peaks are close to the calculated mean spacing of 163 m and the mean ridge width of 175 m (Table 1). One possible explanation for the 255 m peak may be that parts of the S03 profile have been affected externally. The 255 m wavelength is characteristic of the elevation profiles in the northern sub-complex.
6. Interpretation and Discussion
6.1. Terminology of the Surface Structures
The glacitectonic complex of Jasmund is often termed “push moraine” (see [7,9,12], but is this still the term for our study area, with regard to modern classifications of glacitectonic complexes (e.g., [22])?
Both push moraines and composite ridges are elongated glacial landforms representing the result of ice-marginal push. The ridges on Jasmund have the characteristic arcuate shape, concave to the former glacier margin. However, while (annual) push moraines evolve during winter re-advances by glaciers that are undergoing overall retreat, composite ridges are formed in a single event, including rapid ice advance, extreme compressive deformation at the margin, and elevated pore-water pressures (e.g., [18]).
The amplitudes (heights) of the ridges are, on average, 8 m (±5 m), and they seem to be indicative of composite ridges, as those landforms are higher than 5 m (see [30,70]). However, there are amplitudes outside this window, ranging from around 1 m to up to 30 m. After e.g., Ottesen et al., Winkelmann et al. and Streuff et al. [32,33,34,71] push moraines are usually 1 to 5 m high, but they can reach 25 or 30 m, too. Thus, the height of the analyzed ridges does not necessarily serve as a distinguishing criterion.
Pushing and thrusting of the advancing ice front, regardless of whether push moraines or composite ridges are formed, would very likely result in asymmetric cross profiles, usually with steeper distal and flatter proximal slopes (e.g., [4,13,32]). Thus, the flow-parallel topographic profile seems to be rather a weak tool to distinguish between the two landforms. Furthermore, the southernmost and northern parts have been affected by agricultural activity, which, together with natural alterations, like a complicated deformational history (explained below), kettle holes, karstification, or young erosion, complicate the analysis of this ridge parameter.
The analysis of width-to-spacing ratios and periodicities may provide a better method to distinguish between both of the landforms. After Ottesen et al. [32] push moraines from Rindersbukta and Van Keulenfjorden (Svalbard) are 50 to 250 m wide and are spaced by 35 to 250 m. However, the spacing can be even 2200 m, with widths of 50 to 250 m in an example from the NE-Greenland shelf [33]. Although width-to-spacing ratios close to 1 are possible, typical (annual) push moraines do not have a flow-parallel periodicity, because of the effect of seasonal variations. Composite ridges, on the other hand, tend to produce a width-to-spacing ratio relatively close to 1 (see [30]). Furthermore, fold and thrust belts, thus glacitectonic complexes at a small-scale, are characterized by periodic ridge spacing (see [72,73]).
Based on our results, we suggest the establishment of a more consistent terminology for the tectonic setting of Jasmund. In the context of modern classifications of glacitectonic complexes (e.g., [18,22]), the morphological ridges should be re-classified as composite ridges instead of the term push moraine. This implies a direct relationship between the internal structure of the Jasmund Glacitectonic Complex and its morphology and the development of each of the two sub-complexes during a single, powerful glacier advance.
6.2. The Chronology of Jasmund’s Glacitectonic Development
We suggest a multi-stage structural evolution for the Jasmund Glacitectonic Complex in the Upper Weichselian (Pomeranian phase, W2) (Figure 12). The development comprises at least two stages and there are some indicators that are pointing to an additional, third evolutional stage (Pomeranian or Mecklenburg phase, W2/W3?).
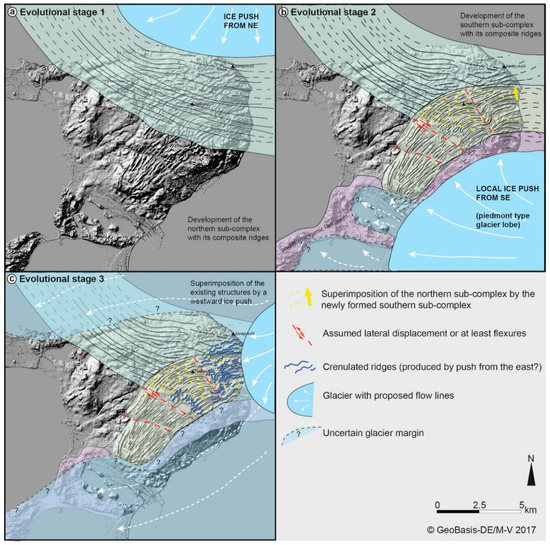
Figure 12.
Multi-stage evolutional model of the composite ridges on top of the Jasmund Glacitectonic Complex. (a) Formation of the northern sub-complex by a local ice push from NE; (b) Development of the southern sub-complex by a local ice push from SE leading to a partly truncation and superimposition of the northern ridge set; (c) Minimum reconstruction of the ice front only touching the easternmost part of the glacitectonic complex (light blue) and assumed wider glacier extent, which kind of envelopes the complex (transparent light blue). The local ice push from the E/ENE reshapes the quasi-straight ridges to wavy forms.
The first evolutional stage (Figure 12a) is characterized by a local NE-to-SW push by a branch of the Scandinavian Ice Sheet (SIS) forming the northern structural sub-complex and the related composite ridges. The glacitectonic complex has a characteristic arcuate shape concave to the glacier margin in the NE. The dominant wavelength of the composite ridges is about 260 m. This first stage is a contrast to the structural formation model that was created by Groth [7], who suggested a first phase of forming the main part of the southern structural unit.
In the second evolutional stage, the southern structural sub-complex with the related composite ridges was formed (Figure 12b). The glacier induced a compressional deformation of the Upper Cretaceous and Pleistocene beds, presumably compensated by lateral dislocation. The orientation of the ridge crests (SW–NE) differs from those of the northern sub-complex (NW–SE), as a branch of the SIS might have pushed the local deposits from SE. Compared to the periodicities of the northern sub-complex, the dominant wavelengths in the southern sub-complex are generally smaller, with 135 to 195 m. This might indicate slightly different formation times and mechanisms between the northern and southern sub-complex. Assuming successive glacier advances differs from the Ludwig [9] model, which instead suggested a loop-shaped flow of two competing ice streams around Jasmund that formed the different sub-complexes via a progression of deformations.
The formation of the southern ridge domain led to partly truncated and superimposed northerly ridges (see Figure 5). These features give rise to a superimposed deformation between the northern and southern sub-complex. The term “superimposed deformation” was introduced by Pedersen [74] for glacitectonic complexes, and can, for instance, be observed at Møns Klint in SE Denmark.
The widths and spacing of the composite ridges as well as the results from the spectral analysis best indicate the superimposition of the northern sub-complex by the southern. The larger wavelengths of the northern ridge domain of around 260 m are still present in the eastern part of the southern ridge domain (e.g., profile S03: 255 m) (see Figure 10 and Figure 11).
Even though the symmetry behavior of the ridges is a weak tool to distinguish between composite ridges and push moraines, as both landforms have asymmetric cross profiles, the results from ridge stacking and morphometric calculations can inform Jasmund’s detailed structural development. The characteristic cross profiles of composite ridges with steep distal and flat proximal slopes can be observed in the southwestern district of the southern ridge domain. Ridges in the eastern district are rather symmetric, which is perhaps due to the northern ridge set acting as a sort of resistance, when the southern ridge set was attached to it. In the northern and southwestern part of the Jasmund Peninsula, intense use of agriculture has almost certainly altered the composite ridges into more symmetric shapes, which may have obscured details on the stacked ridge plots of the profiles.
The amplitudes of the composite ridges and the topography of the entire glacitectonic complex provide additional evidence for the superimposed deformation hypothesis. Elevation profiles characteristic of composite-ridge sets with the highest amplitudes in the center can be seen in the South-group, thus the southwestern part of the southern sub-complex, where the foreland is relatively flat. The Center-group profiles have higher amplitudes towards the proximal end, which might be related to the northern sub-complex as an already existing resistance in the foreland.
In general, the elevation of the glacitectonic complex increases towards the central zone (see Figure 1c). The southwestern district of the southern sub-complex is not affected by this increase in elevation, which indicates that the northern sub-complex has been formed first and formed a “zone of resistance” during the later evolution of the southern sub-complex.
Based on the crenulated ridge shapes in the southeastern district of the Jasmund Glacitectonic Complex and the well-described complicated structural setting visible at the eastern cliff coast (e.g., [9]), we assume a third evolutional stage with a local ice push from the E/ENE (Figure 12c). The effect of this deformation may also be visible in the very complicated cliff sections, called Complex 7 and 9 after Steinich [44]. In the easternmost part of the southern sub-complex (e.g., S06), the shapes of the composite ridges are unusually complicated. They include ridge crests with steeper proximal slopes, which are unusual for pushed ridges and might point to additional structural developments during a third phase. Whether the glacier front only touched the eastern ridges of the glacitectonic complex or enveloped the entire complex cannot yet be determined. However, the existence of the till complex on top of the glacitectonized sequence in the northern and southern sub-complex is an indicator that the ice eventually overrode the complex or at least its marginal zones.
The lack of conformity between the tectonic structure and morphology of Jasmund in some parts of the glacitectonic complex that are mentioned by Ludwig [9] can be well explained by the superimposed-deformation approach. The irregular orientation of the internal structures in the central zone of Jasmund might be related to the complex relationship between the northern and southern structural sub-complex. Furthermore, the N-S trend of faults in the eastern cliff sections and E/NE verging folds in the south of the complex fit well into the multi-stage evolutional model of the Jasmund Glacitectonic Complex. Only the southernmost surface structures seem to be disconnected to the development of the internal tectonic architecture. This is thought to be related to the formation of the undifferentiated glacigenic landform immediately in front of the former glacier margin, as well as the third evolutional stage. The ice stream that was moving from E to W/ENE to WSW overrode the marginal parts of the glacitectonic complex, leading to the erosion of the glacitectonized sequence of Upper Cretaceous and Pleistocene beds and the subsequent deposition of the till complex on top.
In addition, there are distinct elongated gaps in the southern ridge domain crossing the ridge crests—respectively, one in the area of the South- and Center-group profiles and one in the middle close to the distal end of the northern ridge domain (see Figure 12b,c). These gaps might indicate lateral displacement along slip faults or at least flexures. Ludwig [9] has already introduced lateral dislocation in his formation model of Jasmund. The dextral slip fault in the middle of the southern sub-complex close to the distal end of the northern domain seems to be equivalent to the south margin of the central zone in the model by Ludwig [9]. Such lateral dislocation of the southern zone to NW could be proven in the open pit “Wittenfelde” [9]. Ludwig [9] describes these structures as a result of a progressive glacier push and west shift of the southernmost and northern zone of the Jasmund Glacitectonic Complex. The second evolutional stage in our model is consistent with the northwest shift of the southern zone. However, we suggest the shift along this particular fault to be connected to the already existing northern sub-complex. Its distal end is assumed to have acted as a zone of weakness for the lateral dislocation.
Nevertheless, a possible relation between late Paleozoic faults and the glacitectonic development of Jasmund have to be taken into account. Seidel et al. [75] presented the deep-seated Wiek, Nord Jasmund, and Schaabe fault crossing the north and middle part of Rügen Island (Arkona, Middle Rügen, and Wolin block). Steinich [44], for instance, has already shown the existence of pre-Quaternary faults in the cross sections from the eastern cliff coast of Jasmund. The role of pre-Quaternary deformation or even neotectonic activity related to these faults would imply that there were more than two events of superimposed deformation affecting the Jasmund Glacitectonic Complex.
6.3. Importance of High Resolution Data and Spatial Analysis Tools
Unlike earlier work by Groth [7] and Ludwig [9], we had the benefit of working with a new, high-resolution of LiDAR-derived digital terrain data for unravelling the glacitectonic development of Jasmund. Specifically, this allowed for us to measure the shape of glacigenic landforms directly on the digital elevation data (digital morphometry). We also were able to augment the morphometric analysis with ridge stacking and Fourier terrain analysis, which also benefited enormously from the higher resolution, but did require some custom computation and coding. The resulting information about the dominant wavelength of ridges along each profile could not easily have been determined via traditional morphometric analysis alone, and was valuable in developing the evolution of the area. However, morphometry, together with other statistical methods, was often very useful for cross-checking the results of the periodogram and for dismissing some seemingly strong wavelengths as unrealistic. Overall, the tools that were used in this work complement each other, other projects may also benefit by a similar, integrative approach.
7. Conclusions
The existing models on the structural evolution of the Jasmund Glacitectonic Complex [7,9] are important contributions to our understanding of the structural conditions and deformation history. Earlier mappings of the cliff sections and open pits had already gathered data and knowledge on this topic, including detailed sedimentological, micro-paleontological, chronostratigraphic, and tectonic analyses [7,8,9,10,11,12,43,44,45,46,47,48,49,50,54]. However, there remained unresolved details about the relationship between tectonic architecture and the morphology of Jasmund, which our work attempts to address with the help of geomorphological mapping and detailed landform analyses from a high-resolution DEM.
This combined analysis methodology was used to develop a new, self-consistent genetic model integrating all of the parts of the 100 km2 large glacitectonic complex and leads to insights into the Upper Weichselian proglacial setting of Jasmund. The mapping results suggest a division into a northern sub-complex with morphological ridges striking NW–SE and a southern sub-complex with SW–NE trending ridges. Detailed investigation of the landforms, including morphometric calculations and ridge stacking, provided insights into the topography of the glacitectonic complex, symmetry behavior of the ridge crests, and width-to-spacing ratios between the ridges. Spectral analysis of profiles provided information about periodicity, including the dominant wavelengths. These results helped us to define a more consistent terminology for the tectonic setting of Jasmund. In the context of modern classifications of glacitectonic complexes [22], the morphological ridges should be re-classified as composite ridges instead of the earlier used term push moraines.
The results indicate a multi-stage structural evolution of the Jasmund Glacitectonic Complex in the Upper Weichselian. The northern sub-complex was formed in the first evolutional stage by a local ice push from NE. In a subsequent second stage, the southern sub-complex was formed by a local ice push from SE leading to a partly truncation and superimposition of the northern ridge set. This was followed by a local ice push from the E/ENE, which reshaped the quasi-straight ridges in the eastern district to wavy forms in the third evolutional stage.
The morphological investigations that are presented here focused on the terminology, chronology of Jasmund’s glacitectonic development, and the glacier kinematics. Extending this work, future investigations could determine the exact timing of the single evolutional stages, environmental conditions, sediment properties, as well as glacier dynamics having the ability to form such a large-scale Weichselian glacitectonic complex in the SW Baltic Sea.
Author Contributions
C.H. and A.G. conceived and designed the methodology, performed the analysis, and wrote the paper.
Acknowledgments
Thanks go to the Landesamt für innere Verwaltung Mecklenburg-Vorpommern—Abt. 3: Amt für Geoinformation, Vermessung und Katasterwesen (LAiV) for providing the LiDAR data; and to Jörg Hartleib for processing the LiDAR data and providing the DEM of Jasmund. Many thanks to Martin Meschede, Heiko Hüneke, Stig A. Schack Pedersen, Karsten Obst, and Elisabeth Seidel for providing discussions, inspiration and motivational words. Additionally, we thank Stefanie Nachtweide for the support with methodological issues.
Conflicts of Interest
The authors declare no conflict of interest.
References
- Croot, D.G. Glacio-tectonic structures: A mesoscale model of thin-skinned thrust sheets? J. Struct. Geol. 1987, 9, 797–808. [Google Scholar] [CrossRef]
- Banham, P. Thin-skinned glaciotectonic structures. In Glaciotectonics: Forms and Processes; Croot, D.G., Ed.; Balkema: Rotterdam, The Netherlands, 1988; pp. 21–25. ISBN 9061918480. [Google Scholar]
- Pedersen, S.A.S. Structural Analysis of the Rubjerg Knude Glaciotectonic Complex, Vendsyssel, Northern Denmark; Geological Survey of Denmark and Greenland: Copenhagen, Denmark, 2005; Volume 8, pp. 1–192. [Google Scholar]
- Vaughan-Hirsch, D.P.; Phillips, E.R. Mid-Pleistocene thin-skinned glaciotectonic thrusting of the Aberdeen Ground Formation, Central Graben region, central North Sea. J. Quat. Sci. 2017, 32, 196–212. [Google Scholar] [CrossRef]
- Aber, J.S.; Croot, D.G.; Fenton, M.M. Glaciotectonic Landforms and Structures; Kluwer: Dordrecht, The Netherlands, 1989; ISBN 978-9401568432. [Google Scholar]
- Van der Wateren, F.M. Ice-margin terrestrial landsystems: Southern Scandinavian ice sheet margin. In Glacial Landsystems; Evans, D.J.A., Ed.; Arnold: London, UK, 2003; pp. 166–203. ISBN 9780340806661. [Google Scholar]
- Groth, K. Zur glazitektonischen Entwicklung der Stauchmoräne Jasmund/Rügen. Schriftenr. d. Landesamtes f. Umwelt Naturschutz und Geol. M. V. 2003, 3, 39–49. [Google Scholar]
- Müller, U.; Obst, K. Lithostratigraphie und Lagerungsverhältnisse der pleistozänen Schichten im Gebiet von Lohme (Jasmund/Rügen). Z. Geol. Wiss. 2006, 34, 39–54. [Google Scholar]
- Ludwig, A.O. Zwei markante Stauchmoränen: Peski/Belorussland und Jasmund, Ostseeinsel Rügen/Nordostdeutschland—Gemeinsame Merkmale und Unterschiede. E G Quat. Sci. J. 2011, 60, 464–487. [Google Scholar]
- Gehrmann, A.; Hüneke, H.; Meschede, M.; Phillips, E. 3D microstructural architecture of deformed glacigenic sediments associated with large-scale glacitectonism, Jasmund Peninsula (NE Rügen), Germany. J. Quat. Sci. 2017, 32, 213–230. [Google Scholar] [CrossRef]
- Credner, R. Rügen. Eine Inselstudie. Forsch. Dtsch. Landes-Volkskd. 1893, 7, 373–494. [Google Scholar]
- Gripp, K. Jasmund und Möen, eine glacialmorphologische Untersuchung. Z. Erdkd. 1947, 1, 175–182. [Google Scholar]
- Sharp, M.J. Annual moraine ridges at Skafallsjökull, southeast Iceland. J. Glaciol. 1984, 30, 82–93. [Google Scholar] [CrossRef]
- Krüger, J. Origin, chronology and climatological significance of annual moraine ridges at Mýrdalsjökull, Iceland. Holocene 1995, 5, 420–427. [Google Scholar] [CrossRef]
- Evans, D.J.A.; Twigg, D.R. The active temperate glacial landsystem: A model based on Breiðamerkurjökull and Fjallsjökull, Iceland. Quat. Sci. Rev. 2002, 21, 2143–2177. [Google Scholar] [CrossRef]
- Bradwell, T. Annual moraines and summer temperatures at Lambatungnajökull, Iceland. Arct. Antarct. Alp. Res. 2004, 36, 502–508. [Google Scholar] [CrossRef]
- Bradwell, T.; Siggurðsson, O.; Everest, J. Recent, very rapid retreat of a temperate glacier in SE Iceland. Boreas 2013, 42, 959–973. [Google Scholar] [CrossRef]
- Benn, D.I.; Evans, D.J.A. Glaciers and Glaciation, 2nd ed.; Hodder Education: London, UK, 2010; pp. 500–510. ISBN 978-0-340-90579-1. [Google Scholar]
- Pedersen, S.A.S.; Gravesen, P. Geological Map of Denmark, 1:50,000, Møn; Geological Survey of Denmark and Greenland: Copenhagen, Denmark, 2006. [Google Scholar]
- Pedersen, S.A.S.; Gravesen, P. Structural development of Maglevandsfald: A key to understanding the glaciotectonic architecture of Møns Klint, SE Denmark. Geol. Surv. Den. Greenl. Bull. 2009, 17, 29–32. [Google Scholar]
- Pedersen, S.A.S.; Boldreel, L.O. Thrust-fault architecture of glaciotectonic complexes in Denmark. Geol. Surv. Den. Greenl. Bull. 2015, 33, 17–20. [Google Scholar]
- Aber, J.S.; Ber, A. Chapter 5 Composite ridges. In Glaciotectonism, 1st ed.; van der Meer, J.J.M., Ed.; Elsevier Science: Amsterdam, The Netherlands, 2007; Volume 6, pp. 59–82. ISBN 978-0444529435. [Google Scholar]
- Boulton, G.S.; van der Meer, J.J.M.; Beets, D.J.; Hart, J.K.; Ruegg, G.H.J. The sedimentary and structural evolution of a recent push moraine complex: Holmstrømbreen, Spitsbergen. Quat. Sci. Rev. 1999, 18, 339–371. [Google Scholar] [CrossRef]
- Rowland, S.M.; Duebendorfer, E.M.; Schiefelbein, I.M. Structural Analysis and Synthesis. A Laboratory Course in Structural Geology, 3rd ed.; Blackwell Publishing: Malden, MA, USA, 2007; pp. 133–136. ISBN 978-1-4051-1652-7. [Google Scholar]
- Siegal, B.S.; Gillespie, A.R. Remote Sensing in Geology, 1st ed.; John Wiley and Sons: New York, NY, USA, 1980; ISBN 978-0471790525. [Google Scholar]
- Drury, S.A. Image Interpretation in Geology, 1st ed.; Allen and Unwin: London, UK, 1987; ISBN 978-0045500376. [Google Scholar]
- Prost, G.L. Remote Sensing for Geologists. A Guide to Image Interpretation, 1st ed.; Gordon and Breach Science Publishers: Amsterdam, The Netherlands, 1994; ISBN 978-2884491013. [Google Scholar]
- Jordan, G. Morphometric analysis and tectonic interpretation of digital terrain data: A case study. Earth Surf. Process. Landf. 2003, 28, 807–822. [Google Scholar] [CrossRef]
- Benediktsson, Í.Ö.; Möller, P.; Ingólfsson, Ó.; van der Meer, J.J.M.; Kjær, K.H.; Krüger, J. Instantaneous end moraine and sediment wedge formation during the 1890 glacier surge of Brúarjökull, Iceland. Quat. Sci. Rev. 2008, 27, 209–234. [Google Scholar] [CrossRef]
- Benediktsson, Í.Ö.; Schomacker, A.; Lokrantz, H.; Ingólfsson, Ó. The 1890 surge end moraine at Eyjabakkajökull, Iceland: A re-assessment of a classic glaciotectonic locality. Quat. Sci. Rev. 2010, 29, 484–506. [Google Scholar] [CrossRef]
- Evans, D.J.A. Glacial landsystems of Satujökull, Iceland: A modern analogue for glacial landsystem overprinting by mountain icecaps. Geomorphology 2011, 129, 225–237. [Google Scholar] [CrossRef]
- Ottesen, D.; Dowdeswell, J.A.; Benn, D.I.; Kristensen, L.; Christiansen, H.H.; Christensen, O.; Hansen, L.; Lebesbye, E.; Forwick, M.; Vorren, T.O. Submarine landforms characteristic of glacier surges in two Spitsbergen fjords. Quat. Sci. Rev. 2008, 27, 1583–1599. [Google Scholar] [CrossRef]
- Winkelmann, D.; Jokat, W.; Jensen, L.; Schenke, H.-W. Submarine end moraines on the continental shelf off NE Greenland—Implications for Lateglacial dynamics. Quat. Sci. Rev. 2010, 29, 1069–1077. [Google Scholar] [CrossRef]
- Streuff, K.; Forwick, M.; Szczuciński, W.; Andreassen, K.; Cofaigh, C.Ó. Submarine landform assemblages and sedimentary processes related to glacier surging in Kongsfjorden, Svalbard. Arktos 2015, 1, 1–19. [Google Scholar] [CrossRef]
- Krentz, O. Nutzung des digitalen Höhenmodells für die geologische Landesaufnahme in Sachsen. Publ. Dtsch. Ges. Photogramm. Fernerkund. Geoinf. 1995, 3, 179–185. [Google Scholar]
- Kupetz, M. Die Geomorphologie des Muskauer Faltenbogens im hochauflösenden digitalen Geländemodell (Airborne Laserscanning). Brandenbg. Geowiss. Beitr. 2003, 10, 19–28. [Google Scholar]
- Lang, J.; Lauer, T.; Winsemann, J. New age constraints for the Saalian glaciation in northern central Europe: Implications for the extent of ice sheets and related proglacial lake systems. Quat. Sci. Rev. 2018, 180, 240–259. [Google Scholar] [CrossRef]
- Hardt, J.; Hebenstreit, R.; Lüthgens, C.; Böse, M. High-resolution mapping of ice-marginal landforms in the Barnim region, northeast Germany. Geomorphology 2015, 250, 41–52. [Google Scholar] [CrossRef]
- Hardt, J.; Lüthgens, C.; Hebenstreit, R.; Böse, M. Geochronological (OSL) and geomorphological investigations at the presumed Frankfurt ice marginal position in northeast Germany. Quat. Sci. Rev. 2016, 154, 85–99. [Google Scholar] [CrossRef]
- Perron, J.T.; Kirchner, J.W.; Dietrich, W.E. Spectral signatures of characteristic spatial scales and nonfractal structure in landscapes. J. Geophys. Res. 2008, 113, F04003. [Google Scholar] [CrossRef]
- Spagnolo, M.; Bartholomaus, T.C.; Clark, C.D.; Stokes, C.R.; Atkinson, N.; Dowdeswell, J.A.; Ely, J.C.; Graham, A.G.C.; Hogan, K.A.; King, E.C.; et al. The periodic topography of ice stream beds: Insights from the Fourier spectra of mega-scale glacial lineations. J. Geophys. Res. Earth Surf. 2017, 122, 1355–1373. [Google Scholar] [CrossRef]
- Cline, M.; Iverson, N.; Harding, C. Origin of washboard moraines of the Des Moines Lobe: Spatial analyses with LiDAR data. Geomorphology 2015, 246, 570–578. [Google Scholar] [CrossRef]
- Von Bülow, K. Stapelmoränen und Untergrund im norddeutschen Jungdiluvium. Geologie 1955, 4, 3–14. [Google Scholar]
- Steinich, G. Endogene Tektonik in Den Unter-Maastricht-Vorkommen auf Jamsund (Rügen); Akademie-Verlag: Berlin, Germany, 1972; pp. 1–207. [Google Scholar]
- Ludwig, A.-O. Zur Interpretation des Kliffanschnitts östlich von Glowe/Insel Rügen (Ostsee). Z. Geol. Wiss. 2005, 33, 263–272. [Google Scholar]
- Jaekel, O. Vier nordische Eiszeiten. Jahresber. Geogr. Ges. Greifswald 1917, 16, 1–41. [Google Scholar]
- Panzig, W.A. Zum Pleistozän Nordost-Rügens. In Geologie des Südlichen Ostseeraumes—Umwelt und Untergrund, 147; Hauptversammlung der Deutschen Geologischen Gesellschaft—Exkursionsführer, Greifswald, Germany, October 1995; Katzung, G., Hüneke, H., Obst, K., Eds.; Terra Nostra—Schriften der Alfred-Wegener-Stiftung: Bonn, Germany, 1995; pp. 177–200. [Google Scholar]
- Kenzler, M.; Tsukamoto, S.; Meng, S.; Thiel, C.; Frechen, M.; Hüneke, H. Luminescence dating of Weichselian interstadial sediments from the German Baltic Sea coast. Quat. Geochronol. 2015, 30, 251–256. [Google Scholar] [CrossRef]
- Katzung, G.; Müller, U. Quartär. In Geologie von Mecklenburg-Vorpommern; Katzung, G., Ed.; E. Schweizerbart’sche Verlagsbuchhandlung: Stuttgart, Germany, 2004; pp. 221–225. ISBN 978-3510652105. [Google Scholar]
- Müller, U. Jung-Pleistozän—Eem-Warmzeit bis Weichsel-Hochglazial. In Geologie von Mecklenburg-Vorpommern; Katzung, G., Ed.; E. Schweizerbart’sche Verlagsbuchhandlung: Stuttgart, Germany, 2004; pp. 234–242. ISBN 978-3510652105. [Google Scholar]
- Litt, T.; Behre, K.-E.; Meyer, K.-D.; Stephan, H.-J.; Wansa, S. Stratigraphische Begriffe für das Quartär des norddeutschen Vereisungsgebietes. Eiszeitalt. Ggw. 2007, 56, 7–65. [Google Scholar]
- Janke, W.; Niedermeyer, R.-O. Geologische Entwicklung im Pleistozän. In Die deutsche Ostseeküste; Niedermeyer, R.-O., Lampe, R., Janke, W., Schwarzer, K., Duphorn, K., Kliewe, H., Werner, F., Eds.; Gebr. Borntraeger Verlagsbuchhandlung: Stuttgart, Germany, 2011; pp. 32–51. ISBN 978-3443150914. [Google Scholar]
- Rinterknecht, V.; Börner, A.; Bourlès, D.; Braucher, R. Cosmogenic 10Be dating of ice sheet marginal belts in Mecklenburg-Vorpommern, Western Pomerania (northeast Germany). Quat. Geochronol. 2014, 19, 42–51. [Google Scholar] [CrossRef]
- Groth, K. Der glazitektonische Aufbau der Halbinsel Jamsund/Rügen unter Besonderer Berücksichtigung der Glazidynamischen Entwicklung der Stauchmoräne. Ph.D. Thesis, Mathematisch-Naturwissenschaftliche Fakultät, Ernst-Moritz-Arndt-Universität Greifswald, Greifswald, Germany, 1969. [Google Scholar]
- Pike, R.J.; Rozema, W.J. Spectral Analysis of Landforms. Ann. Assoc. Am. Geogr. 1975, 65, 499–516. [Google Scholar] [CrossRef]
- Davis, J.D.; Chojnacki, J.D. Two-dimensional discrete Fourier transform analysis of karst and coral reef morphologies. Trans. GIS 2017, 21, 521–545. [Google Scholar] [CrossRef]
- Rayner, J.N. The application of harmonic and spectral analysis to the study of terrain. In Spatial Analysis in Geomorphology, 1st ed.; Chorley, R.J., Ed.; Methuen: London, UK, 1972; pp. 283–302. ISBN 978-0416660708. [Google Scholar]
- Ricard, Y.; Froidevaux, C.; Simpson, R. Spectral analysis of topography and gravity in the Basin and Range Province. Tectonophysics 1987, 133, 175–187. [Google Scholar] [CrossRef]
- Gallant, J.C. Scale and Structure in Landscapes. Ph.D. Thesis, Australian National University, Canberra, Australia, 1997. [Google Scholar]
- Steyn, D.G.; Ayotte, K.W. Application of two-dimensional terrain height spectra to mesoscale modeling. J. Atmos. Sci. 1985, 42, 2884–2887. [Google Scholar] [CrossRef]
- Hough, S.E. On the use of spectral methods for the determination of fractal dimension. Geophys. Res. Lett. 1989, 16, 673–676. [Google Scholar] [CrossRef]
- Goff, J.A.; Tucholke, B.E. Multiscale spectral analysis of bathymetry on the flank of the Mid-Atlantic Ridge: Modification of the seafloor by mass wasting and sedimentation. J. Geophys. Res. 1997, 102, 15447–15462. [Google Scholar] [CrossRef]
- Hovius, N. Regular spacing of drainage outlets from linear mountain belts. Basin Res. 1996, 8, 29–44. [Google Scholar] [CrossRef]
- Schorghofer, N.; Jensen, B.; Kudrolli, A.; Rothmann, D.H. Spontaneous channelization in permeable ground: Theory, experiment, and observation. J. Fluid Mech. 2004, 503, 357–374. [Google Scholar] [CrossRef]
- Cooley, J.W.; Tukey, J.W. An algorithm for the machine calculation of complex Fourier series. Math. Comput. 1965, 19, 297–301. [Google Scholar] [CrossRef]
- Gomez, C. Understanding volcanic geomorphology from derivates and wavelet analysis: A case study at Miyakejima Volcano, Izu Islands, Japan. J. Volcanol. Geotherm. Res. 2018, 354, 57–66. [Google Scholar] [CrossRef]
- Paulson, C. Die Karstmoore in der Kreidelandschaft des Nationalparks Jasmund auf Rügen. Greifswald. Geogr. Arb. 2001, 21, 59–271. [Google Scholar]
- Niedermeyer, R.-O.; Kanter, L.; Kenzler, M.; Panzig, W.-A.; Krienke, K.; Ludwig, A.O.; Schnick, H.H.; Schütze, K. Die Insel Rügen (I)—Fazies, Stratigraphie, Lagerungsverhältnisse und geologisches Gefahrenpotenzial pleistozäner Sedimente der Steilküste Jasmund. In Eiszeitlandschaften in Mecklenburg-Vorpommern. Exkursionsführer zur 35. Hauptversammlung der Deutschen Quartärvereinigung DEUQUA e.V. und der 12. Jahrestagung der INQUA PeriBaltic Working Group in Greifswald/Mecklenburg-Vorpommern; Lampe, R., Lorenz, S., Eds.; Geozon: Greifswald, Germany, 2010; p. 51. [Google Scholar]
- Grubbs, F.E. Procedures for Detecting Outlying Observations in Samples. Technometrics 1969, 11, 1–21. [Google Scholar] [CrossRef]
- Bennett, M.R. The morphology, structural evolution and significance of push moraines. Earth-Sci. Rev. 2001, 53, 197–236. [Google Scholar] [CrossRef]
- Ottesen, D.; Dowdeswell, J.A.; Rise, L. Submarine landforms and the reconstruction of fast-flowing ice streams within a large Quaternary ice sheet: The 2500-km-long Norwegian-Svalbard margin (57°–80° N). Geol. Soc. Am. Bull. 2005, 117, 1033–1050. [Google Scholar] [CrossRef]
- Dixon, J.M.; Liu, S. Centrifuge modelling of the propagation of thrust faults. In Thrust Tectonics, 1st ed.; McClay, K.R., Ed.; Chapman & Hall: London, UK, 1992; pp. 53–70. ISBN 978-94-011-3066-0. [Google Scholar]
- Noble, T.E.; Dixon, J.M. Structural evolution of fold-thrust structures in analog models deformed in a large geotechnical centrifuge. J. Struct. Geol. 2011, 33, 62–77. [Google Scholar] [CrossRef]
- Pedersen, S.A.S. Superimposed deformation in glaciotectonics. Bull. Geol. Soc. Den. 2000, 46, 125–144. [Google Scholar]
- Seidel, E.; Meschede, M.; Obst, K. The Wiek Fault System east of Rügen Island: Origin, tectonic phases and its relationship to the Trans-European Suture Zone. Geol. Soc. Lond. Spec. Publ. 2018, 469. [Google Scholar] [CrossRef]
© 2018 by the authors. Licensee MDPI, Basel, Switzerland. This article is an open access article distributed under the terms and conditions of the Creative Commons Attribution (CC BY) license (http://creativecommons.org/licenses/by/4.0/).