Abstract
Lead isotope compositions and Pb, Cu, Zn, and As concentrations in stream sediment leachates in the White River Basin, southern Ozark Region, have been determined to discriminate between natural and anthropogenic sources of Pb and to assess the metal loads that are transported by streams draining the Mississippi Valley-type (MVT) Zn-Pb mines in the Northern Arkansas district. The samples that were collected downstream of and closest to the mines have trace element concentrations well above those in soils from Arkansas. The trace element concentrations are lower in samples that were collected upstream of the mines. Most of the analyzed samples have trace metal concentrations above the United States Environmental Protection Agency (USEPA) Sediment Quality Guidelines Threshold Effects Level. The Pb isotope values of the downstream samples and the MVT ores are similar, suggesting a similar Pb source. The Pb isotope values of the upstream samples are similar to those that were defined by soils from the Ozark Plateau, suggesting that Pb from historic mining does not dominate upstream sediments. However, a linear regression line through the leachate data indicates that mixing between two end-members represented by leaded gasoline and ores could generate the Pb isotope ratios that were noticed in the upstream leachates.
1. Introduction
The concentration of toxic elements in soils from areas with little human impact can provide an estimate of the natural geochemical background levels at the regional scale, against which changes may be recognized and quantified. Relative to the natural levels, studies have shown potentially toxic trace metal enrichments in the environment that are caused by anthropogenic activity, including mining and smelting of base metal ores, coal burning, heavy industry, and automotive traffic [1]. Mining of base metal sulfide minerals, including pyrite (FeS2), galena (PbS), chalcopyrite (CuFeS2), sphalerite (ZnS), and greenockite (CdS), have led to perturbations of the Pb, Zn, Cd, Cu, and other heavy metal cycles by enhancing the release of metals originally locked up in the ores. In 2007, worldwide production of refined Zn, Cd, and Pb metals was 11.5 Mt, 0.02 Mt, and 8.2 Mt, respectively [2,3,4]. Zinc is mostly used as an anticorrosion coating, Cd is mainly used to produce the metallic Cd electrode plate that is found in Ni-Cd batteries, and lead-acid battery production accounts for the largest use of Pb [5].
The sulfide minerals are originally isolated from the atmosphere and surface waters, and acid production in these buried deposits takes place very slowly and generally in a risk-free rate. However, when exposed to air or dissolved oxygen in water, sulfides weather and cause acidification, and the acid waters can further dissolve heavy, toxic metals. The solid particulate mining waste may also be mobilized due to physical processes, like mass wasting, wind, and hydraulic processes, and can thus be directly delivered to the nearby waterways. Atmospheric Pb is concentrated mainly in submicrometer aerosols, and, due to the relatively long residence time of Pb in aerosols (around 5–10 days), can be transported over long distances and deposited over large areas by prevailing wind transport [6,7]. Previous studies indicate that industrial Pb in flowing surface waters react rapidly with substrates over which the waters pass [8], being adsorbed by clay minerals or by the Fe- and Mn-oxide coatings on sediment grains [9]. In mineralized areas, with elevated metal concentrations, large amounts of metals are released due to the rapid chemical weathering of exposed pyrite and other ore minerals, leading to geochemical anomalies being preserved on the sediment coating [9].
Lead has an industrial legacy; with millions of tons of anthropogenically sourced Pb being used in Pb-based paints and leaded gasoline still present in the environment [10]. In the 1970s, it was considered that the dominant source of soil Pb contamination was Pb-based house paint [11]. However, later studies [12,13] showed that the Pb-based paint was not the dominant Pb source contributing to the United States of America (USA) environment, and that the emissions of Pb from combustion of leaded gasoline accounted for a high percentage of the soil Pb. In the USA, motor vehicles used gasoline containing tetramethyl and tetraethyl Pb additives from 1923 to 1996, when the use of leaded gasoline was banned [10,14]. However, in some parts of the world (eastern Europe, Africa, the Middle East, Asia, and Latin America) leaded gasoline was still sold in 2001 for use in automobiles and small general aviation aircrafts [15]. By 1986, around 5–6 Mt of Pb had been used as a gasoline additive, and about 4–5 Mt of this Pb had been released into the atmosphere [10,16,17]. Major sources of Pb in the USA include Pb ores in cordilleran vein type deposits in Idaho, Colorado, Utah, Arizona, and California, and the Mississippi Valley-type (MVT) deposits (US Bureau of Mines Yearbooks, 1920–1992).
The MVT hydrothermal ores represent the dominant source worldwide of Pb and Zn and are also significant sources of Cu [18,19]. The MVT ores are found throughout the world, but they are most widespread within the midcontinent United States (US) (Figure 1) and owe their name to the fact that the largest and most studied deposits occur within the Mississippi River drainage. Well-known deposits and districts in the midcontinent region include the Tri-State, Northern Arkansas, Central and SE Missouri, Illinois-Kentucky, South-Central Kentucky, and Central and Eastern Tennessee districts (Figure 1). Tributaries of major rivers (Arkansas, White, Missouri, Ohio, Cumberland, and Tennessee) drain the aforementioned districts. There are many Zn-Pb mines in the Northern Arkansas district along the southern flank of the Ozark uplift (Figure 1). Lead ore was reported in the region as early as 1818, and small processing plants were built close to Lead Hill in 1851 or 1852 [20]. The earliest Zn mining occurred in the 1890s, reached its peak during World War I, and the last operating mine closed in 1962 [21]. The ore deposits in the Northern Arkansas district are similar to the much larger deposits in the Tri-State (Oklahoma, Kansas, Missouri) mining district, which is located around 160 km NW of the Northern Arkansas mining area (Figure 1). Mining in the Tri-State district peaked in the 1920s and declined gradually after World War II, with the last mine in the district closing in 1970 [22].
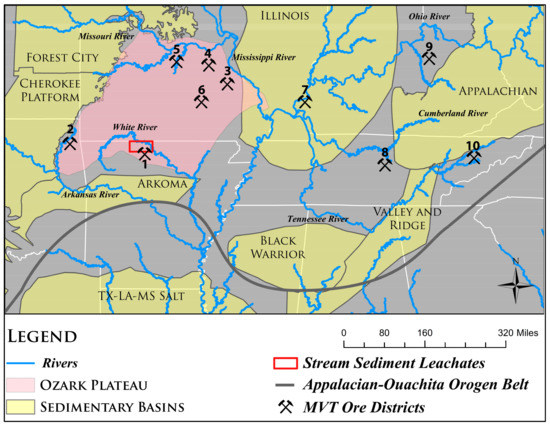
Figure 1.
Map of the US midcontinent region showing the locations of major Mississippi Valley-type (MVT) districts (1 through 10), sedimentary basins, and the location of the study area (red rectangle). (1) Northern Arkansas; (2) Tri-State; (3) Old Lead Belt; (4) Southeast Missouri Barite; (5) Central Missouri Barite; (6) Viburnum Trend; (7) Illinois-Kentucky Fluorspar; (8) Central Tennessee; (9) Central Kentucky; and, (10) Eastern Tennessee. (This map was modified from [25]).
A recent study [23] in the Tri-State (SW Missouri, SE Kansas, and NE Oklahoma) mining district, presenting Pb isotope data and trace-element distribution profiles, indicates that Pb sourced from historic mining and mineral processing dominates the present-day flux of extractable Pb in the lower Arkansas River. The same study shows that another Pb contributor is Pb from leaded gasoline. The mining waste and the Pb additives that are used in gasoline can be directly delivered to the nearby waterways by water or wind transport. Several metals, including Pb and Zn, are adsorbed onto clay minerals and onto Fe and Mn oxide and hydroxide colloids that are suspended in stream water, causing them to be transported in land-surface runoff and re-suspended from streambed sediments during high stream-flows [9]. The mobilization and re-suspension of the heavy metals can have major health implications for populations downstream of the mining regions. The Pb isotope signature of the adsorbed (labile) Pb on the grain coatings can be used to “fingerprint” the contribution of Pb from various sources, including the base metal ores and Pb additives, to the streams. Lead isotopes represent the best available tracer to provide insights into the possible sources of Pb. Physiochemical processes, in general, do not significantly fractionate Pb isotopes [24]; thus, the isotopic composition of the adsorbed Pb is similar to that of Pb in its source. The Pb isotope ratios of ores and Pb additives can thus provide an indicator of the source material that is released to the environment.
The current study aims at (1) quantifying the toxic trace element concentrations in sediment leachates, which represent the adsorbed metals on the grain coatings of the sediments, in streams draining mines of the Northern Arkansas district; and, (2) identifying the source(s) and contribution of potential contaminants. Given the lack of available literature data from the White River basin acquired using this technique, the current study represents an important contribution to the current state of knowledge of the region and of areas with mining activity, and can have implications for regions with dispersed historic mining operations. This projects traces toxic metals from dispersed mines in the Northern Arkansas district, the last of which closed in 1962, more than 55 years ago. To carry out the aforementioned objectives, this study will:
- Use trace element geochemical signatures of stream leachates to trace and quantify the contaminants as they move downstream from the mines. This is done by assessing the Pb, Cu, Zn, and As concentrations of stream sediment leachates that were collected from the White River and its tributaries that drain the Northern Arkansas mines. The results will be compared with published soil data (averages of top soil, A horizon, and C horizon) for Arkansas, Kansas, Missouri, and Oklahoma [26], regions surrounding the study area, with a long history of mining MVT deposits. The results will also be compared to the average crustal abundances of Pb, Cu, Zn, and As [27].
- Use Pb isotope signatures to evaluate the possible sources of Pb in the stream sediments. This is accomplished by measuring the Pb isotope ratios in the above-mentioned stream sediment leachates and comparing the values with available Pb isotope data of (1) ores from the Northern Arkansas, Central and SE Missouri, and the Tri-State mining districts [28,29]; (2) leaded gasoline [30,31]; and, (3) soils in the Osage Plains and Ozark Plateau [32].
2. Geologic Setting
Many Mississippi Valley-Type (MVT) deposits that were formed between Devonian and Permian periods and are related to the tectonic assimilation of Pangea [19]. A second important period of MVT deposit formation was from the Cretaceous to Tertiary, coinciding with microplate assimilation along the western margin of North America and Africa-Eurasia [19]. The Northern Arkansas mining district is located on the southern edge of the Ozark Plateau, north of the Ouachita orogenic belt (Figure 1). The ores were emplaced during Late Pennsylvanian-Early Permian, corresponding to the waning stages of the Ouachita Orogeny [33]. Fluids that were expelled from the Arkoma basin (Figure 1) in response to the orogenic event were ultimately responsible for the formation of the MVT deposits in the Ozark region of Missouri, Arkansas, Kansas, and Oklahoma [34]. The fluid flow was gravity-driven [35,36]. Ground water, recharged in the uplifted orogenic margin of the foredeep, migrates through deep portions of the basin, acquires heat and dissolved components, and discharges along the basin’s cratonic flank [34,37].
The Northern Arkansas district includes at least 250 small deposits in two geographically separated clusters hosted mainly by the Lower Ordovician Everton Formation and the Mississippian Boone Formation [20]. The Everton Formation, which is around 120 m thick, consists of limestone and dolostone interbedded with sandstone. The Boone Formation, around 100 m thick, is made up of limestone and interbedded chert. Other mineralized strata are the Mississippian St. Joe (mainly limestone) and the Lower Ordovician Powell and Cotter dolomites [21,38]. The host rocks have been altered to hydrothermal dolomite and jasperoid, as in the Tri-State district [39]. Mineralization developed along faults and occurs as open space filling in solution collapse breccias and as replacement zones bordering the faults and breccia zones [21,38]. Individual orebodies range up to 6 m thick, 60 m wide, and 180 m long [21]. The sulfide mineralogy is mostly sphalerite ZnS (Zn/Pb = 50), with lesser amounts of galena PbS, chalcopyrite CuFeS2, pyrite FeS2, marcasite FeS2, enargite Cu3AsS4, and greenockite CdS [20]. The main secondary ore minerals are smithsonite ZnCO3, cerusite PbCO3, anglesite PbSO4, malachite Cu2CO3(OH)2, and wulfenite PbMoO4 [20]. Important gangue minerals are dolomite, calcite, chert, quartz, and gypsum. Between 1907 and 1930, production figures for Zn and Pb were 29,000 tons and 1920 tons, respectively [20].
The major stream in northern Arkansas is the White River. The largest tributary of the White River in the Pb-Zn field is the Buffalo River. Crooked Creek is another important tributary, which drains a basin north of the Buffalo basin. These two are the largest tributaries of the White River that traverse the most productive part of the Pb and Zn region [20]. The Horton and the East Sugarloaf creeks drain the Pilot Rock mine into the White River (Figure 2). The Sugar Orchard Creek drains the Jackpot mine into the Crooked Creek, and eventually into the White River. The North Star mine is drained by the Moccasin Creek into the White River. Many mines in the Northern Arkansas district (Excelsior, Lucky Dog, Red Bird, Monte Cristo, Philadelphia) are found south of the Crooked Creek and are drained by tributaries of the Buffalo River (Mill, Tomahawk, Water, Panther, Rush, and Clabber creeks), not sampled in this study.
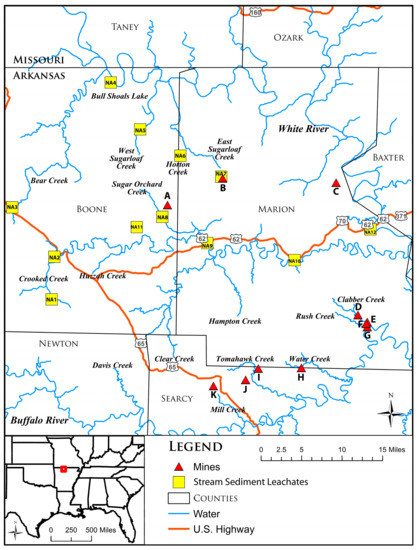
Figure 2.
Map showing the location of the stream sediment samples analyzed in this study, and the White River and tributaries. Also shown are the mines in the Northern Arkansas mining district (A through K) and major United States (US) highways. A—Jackpot Mine; B—Pilot Rock Mine; C—North Star Mine; D—Beulah Mine; E—Philadelphia Mine; F—Monte Cristo Mine; G—White Eagle Mine; H—Red Bird Mine; I—Lucky Dog Mine; J—Davy Crocket Mine; and K—Excelsior Mine.
3. Materials and Methods
The current study utilizes multi-element, partial chemical-dissolution techniques following the methods that are described in [9]. Common Pb isotopic ratios and trace element concentrations of 13 stream sediment leachates are determined to distinguish the potential source(s) of Pb and to quantify the toxic element levels in the samples collected from the White River and its tributaries that drain the Northern Arkansas mines: Crooked Creek, Bear Creek, West Sugarloaf Creek, East Sugarloaf Creek, Sugar Orchard Creek, Horton Creek, Bull Shoals Lake, and White River (Figure 2). Seven samples (NA-1, NA-2, NA-3, NA-4, NA-5a, NA-5b, and NA-11) were collected upstream of major mines from the Northern Arkansas mining district, and six samples (NA-6, NA-7, NA-8, NA-9, NA-10, and NA-12) were collected downstream of the mines. The samples were collected using the “grab sample” technique. Each sample consisted of mixed size sediment fractions (coarse silt and various sand-size fractions), which were not sieved or ground prior to chemical analyses. The sediment samples were placed in zip lock bags to avoid cross contamination and were processed in the Radiogenic Isotope Laboratory at the University of Arkansas. An arbitrary amount of each sediment sample was placed into acid-cleaned sample vials and was washed with double distilled water. The vials were placed in an ultrasonic bath and the samples were cleaned for approximately 20 min. The sediments were then rinsed with double distilled and triple distilled water and were placed on a hot plate to dry. Then, 2 ± 0.002 g of each washed sample was placed into new clean Teflon vials and 15 mL of 2N HCl and 200 µL H2O2 were added to them. The vials were placed in a Dubnoff metabolic shaking incubator, in a double distilled water bath, and brought to a constant temperature of 55 °C for 2 h for the leaching process. Following this step, the samples were taken to the “clean 100” section of the lab and were processed further. The maximum amount of leachate was separated from the residue, pipetted into clean acid-leached centrifuge tubes, and centrifuged for 30 min.
The above-mentioned extraction technique releases the labile metals, defined as those metals released by a weak, warm-acid leach (2N HCl–H2O2). The concentrations of the labile metals, including Pb, Zn, Cu, Co, and Ni, that were deposited on the grain coatings of the stream sediments represent weakly-bound metals that are associated with the organic, carbonate, and Fe- and Mn-oxide phases or adsorbed onto clay surfaces [9,40,41]. Acid mine drainage that was caused by the weathering of pyrite triggers the precipitation of Fe-oxide coatings on sediment grains, and therefore the precipitation of metals carried in the streams is a grain-surface phenomenon [9]. The coating of grain surfaces is the main mechanism of metal enrichment in stream sediments that underlies geochemical exploration methods utilizing partial digestion procedures [9,41]. The use of this partial dissolution technique in removing elements other than the Pb, Zn, Cu, Co, and Ni, including Au, As, Sb, and Hg, in geochemical exploration for ore bodies, is well documented [41], and references therein]; however, the efficiency of removal of these elements is not as proficient as the removal of heavy metals. Also, some toxic elements may be transferred from mining wastes into rivers in association with mineral phases that are not targeted by the leaching technique. Therefore, the concentrations of toxic elements in the leachable fraction represent the minimum amount that is sourced from anthropogenic activity, and not the absolute amount. Thus, a low concentration in a particular element may not necessarily mean a lack of contamination.
3.1. Analytical Procedures for Trace Elements Concentrations
Half a mL of the leachate was removed, diluted 20 times with triple-distilled water to a final solution mass of 10 g, and analyzed for elemental concentrations on a Thermo Scientific iCAP Q ICP-MS at the University of Arkansas. To avoid polyatomic interferences, a kinetic energy discrimination (KED) collision cell was used. This cell provides a clearer ICP-MS spectra and better detection power for interfered isotopes. Six U.S. Geological Survey rock standards (BIR-1; DNC-1; SDC-1; SGR-1; AGV-1; and, QLO-1) were measured along with the samples to build calibration curves and constrain the accuracy and reproducibility of the measurements. Around 0.150 g of rock standard powder was dissolved using a mixture of concentrated HF and 7N HNO3. Successive additions of 6N HCl and 7N HNO3 ensured full dissolution (clear standard solution, with no bits present) of the standards. Following the total digestion procedure, the rock standards were heated to dryness. Half a mL of 2N HCl was added to each standard and further diluted with triple-distilled water to a final solution mass of 10 g. This ensured that the standards were prepared in the same matrix as the leachate samples. The six standards were run three times in the sequence: at the beginning, midway, and at the end of the sequence. The values from the start of the sequence were used to build calibration curves, and the averages of the second and third batches (Table S1) were used to constrain the accuracy (veracity) of the data. The average deviation of Cu, Zn, Pb, and As analyses of the standards are all better than 2% for Cu and Pb, 1% for Zn, and 5% for As (Table S1). Two duplicates (standard DNC-1 and sample NA-4) and two replicates (standard SDC-1 and sample NA-10) were prepared and were analyzed to evaluate the precision (reproducibility) of the data (Table 1; Table S1). Four blanks were run after the first batch of standards, yielding values that were lower than 10 pg for Pb, 8 ng for Cu, 21 ng for Zn, and 3 ng for As. Relative to the lowest recorded Pb, Cu, Zn, and As values (6.5 μg Pb, 8.4 μg Cu, 15.1 μg Zn, and 0.1 μg As in 2 g of processed sample; Table 1), these values are negligible, accounting for less than 0.0002% Pb, 0.1% Cu, 0.1% Zn, and less than 3% As external contamination.

Table 1.
Pb, Zn, Cu, and As concentrations (in ppm) in stream sediment leachates from tributaries of the White River and their proximity to the mines. The TEL (threshold effect level = concentration below which adverse biological effects are expected to occur rarely) is also shown.
3.2. Analytical Procedures for Pb isotope Measurements
The samples analyzed for their Pb isotope compositions were processed in the “class 100” section of the lab. Three mL of the centrifuged leachate were transferred into clean Teflon vials and allowed to dry. Lead was separated and purified using cation exchange columns and an HBr medium [42]. In preparation for column chemistry, around 150 µL resin (Dowex AG1-8X, 200–400 mesh) that was used to separate the Pb from any other ions was added to clean, 3 mL syringes. For column cleaning, 2 mL of 0.5N HNO3 and 2 mL of triple distilled water were successively added to the columns and were allowed to drip through. For column conditioning, 2 mL of 6N HCl were added and allowed to drip through. Then, 200 µL of 1N HBr were added to each dried leachate sample, and using clean pipette tips the solutions were loaded in the columns and allowed to drain. Before sample collection, each sample was rinsed in three successive additions of 1 mL 1N HBr. For sample collection, 1 mL 20% HNO3 was added and collected in clean Teflon containers, and then placed on hot plate to dry. The samples were subsequently diluted with 2% HNO3 containing 4 ppb Tl, just before the isotopic analysis.
Lead isotope analyses were conducted on the Nu Plasma multi-collector ICP-MS at the Trace element and Radiogenic Isotope Laboratory (TRAIL) at the University of Arkansas, on freshly mixed (less than 10 min) Pb-Tl solutions using the 205Tl/203Tl (=2.38750) as an internal standard to correct for mass-dependent fractionation [43]. Measured average values of 13 analyses of the National Institute of Standards and Technology (NIST) common Pb standard SRM 981 at the University of Arkansas, yielded the following results: 208Pb/204Pb = 36.6944 (±0.0083, 2SD), 207Pb/204Pb = 15.4911 (±0.0037, 2SD), and 206Pb/204Pb = 16.9386 (±0.0043, 2SD), where 2SD represents two standard deviations from the mean. These values are in good agreement with the NIST values and with the long-term values that were obtained at the University of Arkansas on the Nu Plasma MC-ICP-MS. The data collected for each sample represented averages of 60 ratios per sample. To eliminate error caused by instrumental drift, the raw Pb isotope data were corrected using the sample-standard bracketing method by comparison with published consensus values [44] for the SRM 981 (208Pb/204Pb = 36.7006; 207Pb/204Pb = 15.4891; 206Pb/204Pb = 16.9356). USGS rock standard AGV-1 was analyzed with the samples to ensure the accuracy of the Pb isotope analyses. One duplicate (sample NA-4) and two replicates (standard AGV-1 and sample NA-10) were analyzed to test the reproducibility of the measurements (Table 2).
Table 2.
Lead isotope ratios of extractable Pb in stream sediments from tributaries of the White River and their proximity to the mines.
4. Results
4.1. Concentration of Pb, Cu, Zn, and As in the Stream Sediment Leachates
The Pb concentrations in the analyzed leachates vary between 3.25 and 124.78 ppm (Table 1), with the lowest levels found in the Crooked Creek (NA-1) and the highest in the East Sugarloaf Creek (NA-7; Figure 2). The highest Pb concentration is almost 10 times greater when compared to the average Pb crustal abundance (13 ppm) [27] and more than six times the average Pb concentration in soils from Arkansas (19.32 ppm; Table S2) [26]. The Cu concentrations in the leachates analyzed in this study range between 4.22 and 61.23 ppm (Table 1), with the lowest levels found in the Crooked Creek (NA-1) and the highest in the East Sugarloaf Creek (NA-7; Figure 2). The highest recorded Cu concentration is close to the average Cu crustal abundance of 68 ppm [27] and almost five times higher when compared to the average Cu concentration in soils from Arkansas (13.52 ppm) (Table S2).
The Zn concentrations in the analyzed samples vary between 7.56 and 494.11 ppm (Table 1), with the lowest levels being found in the Bull Shoals Lake (NA-4) and the highest in the East Sugarloaf Creek (NA-7; Figure 2). The highest Zn level is almost seven times greater when compared to the average Zn crustal abundance (76 ppm) [27] and ten times the average Zn concentration in soils from Arkansas (45.3 ppm) [26]. The As concentrations are low as compared to the average As concentration in soils from Arkansas (6.64 ppm), varying between 0.05 and 2.5 ppm (Table 1), with the highest concentrations being recorded in the East Sugarloaf Creek (NA-7; Figure 2). The highest As concentration is less than half the average As concentration in soils from Arkansas and the surrounding states (Table S2).
High concentrations of trace elements are consistently seen in the leachate samples that were acquired downstream of the mines, with the highest values recorded in the East Sugarloaf Creek (NA-7) sample, collected around 0.3 km NW of Pilot Rock Mine (B in Figure 2). Low toxic element concentrations are noticed in samples collected upstream of the mines, reaching values (3.25 ppm for Pb, 4.22 ppm for Cu, and 7.56 ppm for Zn in the NA-1 sample), well below the average concentrations in soil samples from Arkansas. There is one exception, however, to this trend. The samples collected from West Sugarloaf Creek (NA-5a and NA-5b), upstream of the mines, have higher trace element concentrations (Table 1) when compared to the average concentrations in soil samples from Arkansas and the surrounding regions.
4.2. Lead Isotope Ratios in the Stream Sediment Leachates
The Pb isotope compositions of the 13 stream sediment leachates that were analyzed in this study vary between 38.680 and 40.976 for 208Pb/204Pb, 15.636 and 15.916 for 207Pb/204Pb, 18.933 and 21.987 for 206Pb/204, 1.211 and 1.383 for Pb206Pb/207, and between 2.471 and 2.576 for 208Pb/207Pb (Table 2). In terms of 208Pb/204Pb and 207Pb/204Pb values, the most radiogenic sample corresponds to the sample with the highest concentrations of trace metals, which was collected in the East Sugarloaf Creek (NA-7). Additionally, the highest 206Pb/204 ratio is recorded in Sugar Orchard Creek (NA-8). The NA-7 and NA-8 samples were gathered downstream of two mines from the Northern Arkansas MVT district, the Pilot Rock Mine (sample collected 0.3 km NW of the mine) and the Jackpot Mine (sample collected 2 km SW of the mine), respectively (B and A in Figure 2).
The analyzed leachates show a wide range of isotopic ratios with a linear trend, and plot in two clusters on conventional Pb isotope diagrams, 208Pb/204Pb vs. 206Pb/204Pb (thorogenic diagram) (Figure 3A) and 207Pb/204Pb vs. 206Pb/204Pb (uranogenic diagrams) (Figure 3B): one cluster, with lower Pb isotope ratios, representing samples that were collected upstream of the mining areas (NA-1, NA-2, NA-3, NA-4, and NA-11) and another cluster, with higher Pb isotope ratios, representing samples collected downstream of the mines (NA-6, NA-7, NA-8, NA-9, NA-10, and NA-12). Two samples that were collected upstream of the mining areas, NA-5a and NA-5b, plot within the cluster defined by more radiogenic samples collected downstream of the mines (Figure 3).
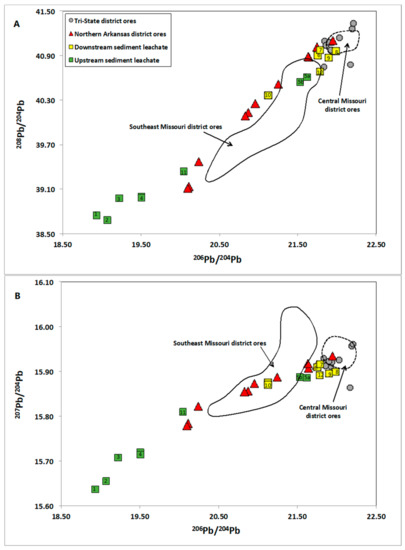
Figure 3.
Measured 208Pb/204Pb vs. 206Pb/204Pb (A) and 207Pb/204Pb vs. 206Pb/204Pb (B) of extractable Pb in stream sediments from the White River and tributaries, superimposed on previously published data [28,29] of ore samples from the Tri-State, Northern Arkansas, Southeast Missouri, and Central Missouri MVT districts. The numbers inside the symbols indicate the sample ID (the “NA” has been omitted for clarity purposes).
5. Discussion
5.1. Enrichment of Toxic Elements in Stream Sediments in the Southern Ozark Region
In evaluating the impact that metal contamination has on the local environment, it is essential to determine the concentration of metals that are easily mobilized and labile [9]. The leaching technique that is described above dissolves particular mineral constituents, and therefore the metals associated with that phase are determined in the extract solution [9]. Quantifying the extractable element concentrations that are associated with these mineral phases will provide information on the metal availability and transport, which ultimately affects their impact on biological populations [9].
One way to determine the enrichment of toxic elements in the study area is to compare this study’s results to (1) the average concentration of selected elements in soils from the surrounding regions, including the states of Kansas, Missouri, Oklahoma, and Arkansas; and, (2) the average crustal abundance of the element. If the concentration of an element is higher relative to natural variability, it indicates that the geochemical cycle of the element has been disturbed by mineral extraction activities, industrial contamination, or weathering of an undisturbed mineral deposit [9]. We use published [26,27] elemental concentration data in soils (Table S2) and in the Earth’s crust. A few cautionary words are needed here. While the leaching technique that is utilized in this study to determine the elemental concentrations in the extractable fraction in the sediments uses a partial dissolution procedure, the reference concentration values for the soils and the average crust have been determined using a total digestion procedure. This fact, when coupled with the observation that the leaching method utilized in this study may not target certain mineral phases containing toxic elements transferred from the mining waste, suggests that the proportion of elements in the sediments that are inferred as being from anthropogenic sources represents the minimum concentrations.
The United States Environmental Protection Agency (USEPA) has recommended sediment-quality guidelines in the form of level-of-concern concentrations for several toxic trace elements [22]. These concentrations were derived from biological-effects correlations made on the basis of paired field and laboratory data to relate the incidence of adverse biological effects to dry-weight sediment concentrations [22]. The threshold effects level (TEL) represents the concentration below which toxic effects rarely occur [22]. Around half of the analyzed samples have Pb, Cu, and Zn concentrations above the TEL of 30.2 mg/kg (Pb), 18.7 mg/kg (Cu), and 124 mg/kg (Zn), respectively (Table 1). All of the analyzed leachates have As concentrations that are lower than the TEL of 7.24 mg/kg (Table 1). The low concentrations of As in the stream sediments are quite surprising, when considering the fact that the primary ore minerals mined in the Northern Arkansas district are sphalerite (ZnS), galena (PbS), chalcopyrite (CuFeS2), and enargite (Cu3AsS4).
A similar study [23] that was conducted in the Tri-State mining district area indicated very high Pb and Zn concentrations in the extractable fraction in the Tar Creek sediments. Tar Creek is the main stream that flows through the center of the mining area in Picher, OK. That study reported that the highest Pb (326 ppm) and Zn (1592 ppm) concentrations reached values about 14 and 29 times, respectively, higher when compared to the average reported [26] concentrations in soils from the Tri-State region. Most of the samples exceeded the TEL Pb and Zn concentrations. The highest Pb (124.78 ppm), Zn (494.11 ppm), and Cu (61.23 ppm) concentrations in the leachates analyzed in this study reached values about 6, 10, and 5 times, respectively, higher as compared to the average reported [26] Pb, Zn, and Cu concentrations in soils from Arkansas. The Tri-State mining district had always been more prolific than the Northern Arkansas district, reaching production figures of more than 7.2 million tons for Zn and 1.7 million tons for Pb [45]. As expected, this fact is shown in the much higher Pb and Zn enrichment factors in the leachates from the Tri-State region. The same study [23] showed that maximum Cu (10.50 ppm) and As (1.44 ppm) concentrations were lower than the average reported [26] background values for the Tri-State region. While this study shows high Cu concentrations relative to the natural background values in the Northern Arkansas sediments, the former study in the Tri-State district does not. In both districts the As concentrations are quite low. This may be due to (1) As transferring from the mining waste into the streams in association with mineral phases that are not targeted by the utilized leaching method or (2) As being only slightly attacked by this leaching technique.
Overall, there is a general trend of higher trace element concentrations with proximity to the mines (Figure 4), with the samples closest to the mines recording values that were well above those in soils from the surrounding states. The highest concentrations of trace elements are consistently seen in the leachate sample from the East Sugarloaf Creek (NA-7) collected around 0.3 km NW downstream of Pilot Rock Mine (B in Figure 2). High concentrations are also noticed in the Sugar Orchard Creek (sample NA-8) and Crooked Creek (sample NA-9). The NA-8 and NA-9 samples were acquired downstream of Jackpot Mine, around 2 km SW and 8.8 km SE, respectively, from the mine (A in Figure 2). With the aforementioned creeks in such close proximity to the mines, high concentrations of trace metals are expected as a consequence of weathering of mining waste, which would flow directly into the creeks. The trace element concentrations in the NA-10 sample (Table 1), which were collected also from the Crooked Creek, are lower than the concentrations noticed in the NA-9 sample. This may be due to the location of the former sample further downstream from Jackpot Mine (22 km), with the higher dilution factor causing a decrease in toxic element concentrations. The NA-12 sample, which was acquired from the White River, 9 km downstream of the North Star Mine (C in Figure 2), has relatively high trace element concentrations (Table 1) when compared to the average concentrations in soil samples from Arkansas (Table S2); however, it has lower concentrations as compared to the NA-10 sample that was collected from the Crooked Creek (Figure 2).
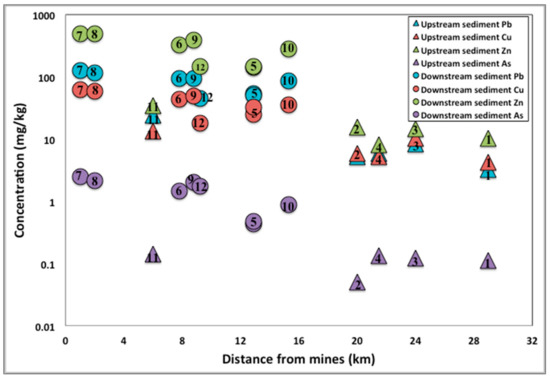
Figure 4.
Concentration of extractable Pb, Cu, Zn, and As in stream sediments from the White River and tributaries plotted as a function of distance to closest mine. The numbers inside the symbols indicate the sample ID (the “NA” has been omitted for clarity purposes). Samples NA-5a and NA-5b appear as “5”.
The exceptions from the general trend of lower trace element concentrations in samples acquired upstream of the mines are the West Sugarloaf Creek (NA-5a and NA-5b) samples, which have higher concentrations (Table 1) when compared to those in soil samples from Arkansas and the surrounding states. This could be attributed to a number of other contaminants, including leaded gasoline, wind transport from an area with higher heavy metal concentrations, or nearby eroding surface material with similar concentrations and Pb isotope ratios to the minerals in the mines. As stated above, the solid particulate mining waste may be mobilized due to physical processes like mass wasting, wind, and hydraulic processes, and can thus be directly delivered to the nearby waterways. The NA-11 sample from the Crooked Creek, which was collected upstream of Jackpot Mine (B in Figure 2), has lower concentrations than NA-9, despite their proximity. The latter sample was collected at the confluence of Sugar Orchard creek with the Crooked Creek, and it is possible that the higher trace element concentrations are related to the fact that the Sugar Orchard Creek drains Jackpot Mine (A in Figure 2).
The current results suggest that the mineralized area, which is drained by the White River and its tributaries, is the major source of metals in the stream sediments. To determine whether the MVT ores from the southern Ozark region are the main contributor of Pb to the stream sediments, the Pb isotope ratios of the analyzed leachates have been compared to the available Pb isotope values of ores from the Northern Arkansas, Tri-State, Southeast Missouri, and Central Missouri mining districts.
5.2. Lead Isotopes and Possible Sources of Lead in the Stream Sediment Leachate
One objective of this study is to determine if mining of the MVT ores in the southern Ozark region is the main contributor of Pb and possibly other toxic elements to the stream sediment leachates in the White River. To carry out this objective, the Pb isotope ratios of the analyzed leachates have been compared to available Pb isotope data of galena (PbS) and sphalerite (ZnS) ore minerals from the southern Ozark region [28,29]. The Pb isotope compositions of the leachates have also been compared to the Pb isotope ratios of Ozark Plateau and Osage Plains soils [32], which provide an estimate of the local natural baseline value in Kansas, Oklahoma, Missouri, and Arkansas. To assess the potential Pb contribution from gasoline to stream sediments, the Pb isotope ratios of the leachates have been compared to available Pb isotope data of leaded gasoline [30,31].
The leachates with higher Pb isotope ratios plot close to the fields that were defined by ores from the Northern Arkansas, Tri-State, Southeast Missouri, and Central Missouri mining districts, suggesting similar Pb source(s) (Figure 3). The ore samples from the Tri-State and Central Missouri districts define narrow fields as compared to the Northern Arkansas and Southeast Missouri samples, which may indicate that the mineralization process caused, to some extent, homogenization and mixing of the Pb that contributed to generation of the ores. However, this may also indicate a single, well-mixed, and homogenized Pb source. The Tri-State and the Central Missouri ores have similar Pb isotope ratios, making it difficult to precisely identify point sources of environmental contamination. The Northern Arkansas and Southeast Missouri district ores have a broader range of isotopic ratios and define linear trends, suggesting mixing of Pb from two distinct end-members, without the extent of homogenization noticed in the Tri-State and the Central Missouri ores. One end-member must be highly radiogenic with Pb isotope ratios equal or higher than the highest measured value in the Northern Arkansas and the Southeast Missouri ores. The other end-member must be less radiogenic, with Pb isotope ratios that are equal or lower than the lowest measured value in the Northern Arkansas and the Southeast Missouri ores.
The Pb isotope ratios of leachate samples NA-6 and NA-7 are similar to the Pb isotope ratios of ores from the Pilot Rock mine (B in Figure 2), suggesting similar Pb sources (Figure 3). Similarly, the Pb isotope ratios of samples NA-8 and NA-9 plot close to the Pb isotope ratios of ores from the Jackpot mine (A in Figure 2), and the Pb isotope ratios of sample NA-10 plots close to the Pb isotope ratios of ores from the Beulah mine (D in Figure 2). These results indicate that the weathering of ore minerals galena and sphalerite mobilized high amounts of Pb, and that the metals sourced from historic mining and mineral processing dominates the present-day flux of extractable metals in the East Sugarloaf and the middle Crooked creeks.
The less radiogenic leachates, characterizing the samples that were collected mainly upstream of the mining areas, plot within the field defined by soils from Kansas and Missouri (Figure 5), suggesting that Pb from historic mining is not dominating the stream sediments upstream of the mines. Therefore, the Pb isotope ratios of the less radiogenic samples seem to correspond to the natural baseline ratios, suggesting low anthropogenic Pb input. Therefore, these values could also be explained by the presence of local source materials in the stream sediments with low concentrations of toxic metals and correspondingly low Pb isotope ratios. The soils in the Osage Plains and the Ozark Plateau are derived from weathered shales or formed on limestone-dolostone bedrock residuum, often with abundant chert fragments [32]. Missouri has the highest known concentration of Pb in the Earth’s crust, hosting the largest MVT districts in the world (the Viburnum Trend, the Old Lead Belt, and Central Missouri districts; Figure 1). The ores in the abovementioned districts have unusually high Pb isotope ratios, and this pattern is reflected in the high Pb isotope ratios of soils in the Ozark Plateau (Figure 5).
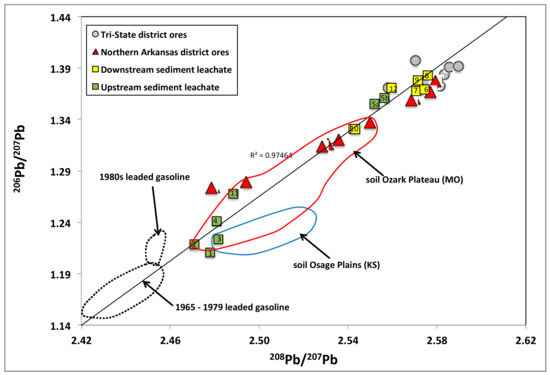
Figure 5.
Measured 206Pb/207Pb vs. 208Pb/207Pb of extractable Pb in stream sediments from the White River and tributaries superimposed on previously published data (Goldhaber et al. (1995) [28]; Potra et al. (2017) [23] of ore samples from the Tri-State, Northern Arkansas, Southeast Missouri, and Central Missouri MVT districts. The compositional fields of leaded gasoline (Dunlap et al. (2000) [30]; Dunlap et al. (2008) [31]) and soils of the Osage Plains and Ozark Plateau (Reimann et al. (2011) [32]) are also shown. The numbers inside the symbols indicate the sample ID (the “NA” has been omitted for clarity purposes).
We measured a shift in the isotopic signature as we travel downstream along the White River from sample NA-4 to sample NA-12 (Figure 5), which is a result of the contributions from the tributaries where samples NA-5, NA-6, and NA-7 were collected.
The less radiogenic samples plot close to the field defined by the leaded gasoline (Figure 5). A linear regression line through all the leachate data indicates that mixing between two end-members could generate the Pb isotope ratios that were noticed in the leachates. Therefore, an alternative explanation for the observed array, although less likely than the previous explanation, is that the Pb isotopes represent varying degrees of mixing of Pb from leaded gasoline and Pb sourced from the near-by ore deposits. In this scenario, the influence of leaded gasoline is more pronounced in the less radiogenic group of leachates.
The ore sources used to extract the Pb to produce leaded gasoline changed in time. Cordilleran vein type deposits were the major source of Pb in the 1960s, whereas the use of MVT ores increased from the late 1960s to the mid 1980’s [31,46,47]. Different Pb ores have characteristic Pb isotope signatures, which provide valuable information on the source of Pb that is used to produce leaded gasoline [46]. The MVT sources accounted for 40–45% of United States of America (USA) Pb production pre-1960 and increased to around 90% by the late 1980’s (US Bureau of Mines Yearbooks, 1920–1992). The Pb originating from the MVT deposits has a broad range of Pb isotope values and is characterized by unusually high Pb isotope ratios compared to Pb originating from other type of deposits. The introduction of highly radiogenic MVT ores is reflected in the different Pb isotope ratios of the pre-1980’s and the 1980’s leaded gasoline (Figure 5). A previous study [6] showed that the 206Pb/207Pb ratios of atmospheric Pb particulate matter in the eastern USA are markedly higher from that in eastern Canada. The authors attributed the higher ratios to the use of MVT Pb in the production of leaded gasoline in the USA. Lead in gasoline additives (e.g., tetraethyllead) is less radiogenic than Pb in ores from the Tri-State and the Northern Arkansas MVT mining district (Figure 5), but similar to those of the MVT ores from the Appalachian region, suggesting that an amount of Pb used in the gasoline additives originated from the Appalachian deposits. The ores from the Appalachian region show relatively nonradiogenic Pb isotope ratios when compared to all the other MVT districts from the mid-continent USA, indicating derivation from a source that was more depleted in U and Th. This allows for the discrimination between Pb originating from gasoline additives and Pb originating from MVT ores in the Ozark region.
6. Conclusions
This investigation analyzed the concentrations of harmful metals in the stream sediment leachates in the White River Basin, and determined the sources of these metals based on the Pb isotope ratios. This study resulted in the following conclusions:
- Overall, the Pb, Cu, Zn, and As concentrations in the analyzed samples are directly correlated with their proximity to the mines. The samples that were collected closest to the mines have trace element concentrations that are well above those in soils from the surrounding areas. The lowest toxic element concentrations are noticed in samples collected upstream of the mines, reaching levels that were well below the average concentrations in soil.
- The analyzed leachates show a wide range of Pb isotope ratios with a linear trend and plot in two clusters on conventional Pb isotope diagrams: one cluster, with lower Pb isotope ratios, representing samples collected upstream of the mining areas, and another cluster, with higher Pb isotope ratios, representing samples collected downstream of the mines.
- Overall, the samples that were collected downstream in the watersheds of the mines have more radiogenic Pb isotope signatures, similar those of ores from the Tri-State, Northern Arkansas, Southeast Missouri, and Central Missouri districts, reflecting Pb contributions from the local mines. These results indicate that the weathering of ore minerals mobilized high amounts of Pb and that the metals sourced from historic mining and mineral processing dominates the present-day flux of extractable metals in the downstream samples.
- The samples collected upstream are representative of Ozark Plateau soil. However, a linear regression line through the leachate data indicates that mixing between two end-members represented by leaded gasoline and ores could generate the Pb isotope ratios that were noticed in the upstream leachates.
The results from this study indicate the effective use of Pb isotopes to trace sources of toxic metals in the environment. The results from this study will aid in remediation of contaminated sites and differentiation of the contaminant sources.
Supplementary Materials
The following are available online at http://www.mdpi.com/2076-3263/8/6/189/s1, Table S1: Detailed analyses of the USGS reference materials (concentrations expressed in ppm), Table S2: Natural background values (average values; concentrations expressed in ppm) of selected elements in Kansas, Missouri, Oklahoma, Arkansas, and the conterminous United States of America.
Author Contributions
A.P. and L.R. collected the samples; A.P. contributed reagents/materials/analysis tools, processed the samples, and designed the experiments; J.S. analyzed the samples and created some of the figures (ArcMap 10.2 and Illustrator 5); A.P. wrote the majority of the paper; L.R. and J.S. helped editing the paper.
Acknowledgments
This work was partially supported by the Arkansas Science and Technology Authority [award number 15-B-15]. The authors thank Erik D. Pollock for his help during measurements by Nu Plasma MC ICP-MS and Thermo Scientific iCAP Q ICP-MS at the University of Arkansas. The authors also thank Jason Dodd, William Ketcheside, and Breanna North for their field and lab support.
Conflicts of Interest
The authors declare no conflict of interest.
References
- Nriagu, J.O.; Pacyna, J.M. Quantitative assessment of worldwide contamination of air, water and soils by trace metals. Nature 1988, 333, 134–139. [Google Scholar] [CrossRef] [PubMed]
- Tolcin, A.C. Cadmium. In Metals and Minerals. US Geological Survey Minerals Yearbook 2007; U.S. Geological Survey: Reston, VA, USA, 2008; Volume I. [Google Scholar]
- Tolcin, A.C. Zinc. In Metals and Minerals. US Geological Survey Minerals Yearbook 2007; U.S. Geological Survey: Reston, VA, USA, 2009; Volume I. [Google Scholar]
- Guberman, D.E. Lead. In Metals and Minerals. US Geological Survey Minerals Yearbook 2007; U.S. Geological Survey: Reston, VA, USA, 2009; Volume I. [Google Scholar]
- Shiel, A.E.; Weis, D.; Orians, K.J. Evaluation of zinc, cadmium, and lead isotope fractionation during smelting and refining. Sci. Total Environ. 2010, 408, 2357–2368. [Google Scholar] [CrossRef] [PubMed]
- Sturges, W.T.; Barrie, L.A. Lead 206/207 isotope ratios in the atmosphere of North America as tracers of US and Canadian emissions. Nature 1987, 329, 144–146. [Google Scholar] [CrossRef]
- Simonetti, A.; Gariepy, C.; Carignan, J. Pb and Sr isotopic evidence for sources of atmospheric heavy metals and their deposition budgets in northeastern North America. Geochim. Cosmochim. Acta 2000, 64, 3439–3452. [Google Scholar] [CrossRef]
- Erel, Y.; Patterson, C.C. Leakage of industrial lead into the hydrocycle. Geochim. Cosmochim. Acta 1994, 58, 3289–3296. [Google Scholar] [CrossRef]
- Church, S.E.; Wilson, S.A.; Vaughn, R.B.; Fey, D.L. Geochemical and Lead-Isotopic Studies of River and Lake Sediments, Upper Arkansas River Basin, Twin Lakes to Pueblo, Colorado; Open-File Report 94-412; U.S. Geological Survey: Reston, VA, USA, 1994; 44p. [Google Scholar]
- Laidlaw, M.A.S.; Filippelli, G.M. Resuspension of urban soils as a persistent source of lead poisoning in children: A review and new directions. Appl. Geochem. 2008, 23, 2021–2039. [Google Scholar] [CrossRef]
- Ter Haar, G.; Aronow, R. New information on lead in dirt and dust as related to the childhood lead problem. Environ. Health Perspect. 1974, 7, 83–89. [Google Scholar] [CrossRef]
- Mielke, H.W.; Anderson, J.C.; Berry, K.J.; Mielke, P.W.; Chaney, R.L.; Leech, M. Lead concentrations in inner-city soils as a factor in the child lead problem. Am. J. Public Health 1983, 72, 1366–1369. [Google Scholar] [CrossRef]
- Ericson, J.E.; Mishra, S.I. Soil lead concentrations and prevalence of hyperactive behavior among school children in Ottawa, Canada. Environ. Int. 1990, 16, 247–256. [Google Scholar] [CrossRef]
- Hurst, R.W. Lead isotopes as age sensitive, genetic markers in hydrocarbons: 3. Leaded gasoline, 1923–1990 (ALAS Model). Environ. Geosci. 2002, 9, 43–50. [Google Scholar] [CrossRef]
- Greenwood, N.N.; Earnshaw, A. Chemistry of the Elements; Butterworth Heinemann: Oxford, UK, 2001; 1341p. [Google Scholar]
- Chaney, R.L.; Mielke, H.W. Standards for soil Lead limitations in the United States. In Trace Substances in Environmental Health; Heamphill, D.D., Ed.; University of Missouri: Columbia, MO, USA, 1986; pp. 357–377. [Google Scholar]
- Mielke, H.W.; Reagan, P.L. Soil is an important pathway of human lead exposure. Environ. Health Perspect. 1998, 106, 217–229. [Google Scholar] [CrossRef] [PubMed]
- Leach, D.L.; Sangster, D.F.; Kelley, K.D.; Large, R.R.; Garven, G.; Allen, C.R.; Gutzmer, J.; Walters, S. Sediment-hosted lead-zinc deposits; a global perspective. Econ. Geol. Bull. Soc. Econ. Geol. 2005, 100, 561–607. [Google Scholar]
- Leach, D.L.; Taylor, R.D.; Fey, D.L.; Diehl, S.F.; Saltus, R.W. A Deposit Model for Mississippi Valley-Type Lead-Zinc Ores; Scientific Investigations Report 2010-5070-A; U.S. Geological Survey: Reston, VA, USA, 2010; 54 p.
- McKnight, E.T. Zinc and Lead Deposits of Northern Arkansas; U.S. Geological Survey Bulletin 853; U.S. Government Printing Office: Washington, DC, USA, 1935; 311p.
- Leach, D.L.; Nelson, R.C.; Williams, D. Fluid inclusion studies in the Northern Arkansas Zinc District. Econ. Geol. 1975, 70, 1084–1091. [Google Scholar] [CrossRef]
- Pope, L.M. Assessment of Contaminated Streambed Sediment in the Kansas Part of the Historic Tri-State Lead and Zinc Mining District, Cherokee County, 2004; Scientific Investigations Report 2005-5251; U.S. Geological Survey: Reston, VA, USA, 2005; 61p.
- Potra, A.; Dodd, J.W.; Ruhl, L.S. Distribution of trace elements and Pb isotopes in stream sediments of the Tri-State mining district (Oklahoma, Kansas, and Missouri), USA. Appl. Geochem. 2017, 82, 25–37. [Google Scholar] [CrossRef]
- Tosdal, R.M.; Wooden, J.L.; Bouse, R.M. Pb isotopes, ore deposits, and metallogenic terranes. Rev. Econ. Geol. 1999, 12, 1–28. [Google Scholar]
- Garven, G.; Ge, S.; Person, M.A.; Sverjensky, D.A. Genesis of stratabound ore deposits in the midcontinent basins of North America. 1. The role of regional groundwater flow. Am. J. Sci. 1993, 293, 497–568. [Google Scholar] [CrossRef]
- Smith, D.B.; Cannon, W.F.; Woodruff, L.G.; Solano, F.; Killburn, J.E.; Fey, D.L. Geochemical and Mineralogical Data for Soils of the Conterminous United States; Data Series 801; U.S. Geological Survey: Reston, VA, USA, 2013; 20p.
- Fortescue, J.A.C. Landscape geochemistry: Retrospect and prospect-1990. Appl. Geochem. 1992, 7, 1–53. [Google Scholar] [CrossRef]
- Goldhaber, M.B.; Church, S.E.; Doe, B.R.; Aleinikoff, J.N.; Brannon, J.C.; Podosek, F.A.; Mosier, E.L.; Taylor, C.D.; Gent, C.A. Lead and sulfur isotope investigation of Paleozoic sedimentary rocks from the southern Midcontinent of the United States: Implications for paleohydrology and ore genesis of the Southeast Missouri lead belts. Econ. Geol. Bull. Soc. Econ. Geol. 1995, 90, 1875–1910. [Google Scholar] [CrossRef]
- Potra, A. Lead Isotope Geochemistry of Mississippi Valley-Type Pb-Zn Deposits of the Ozark Region, US Midcontinent: Constraints on the Origin of Ore Metals; Abstract EP13B-0955; American Geophysical Union: Washington, DC, USA, 2015. [Google Scholar]
- Dunlap, C.E.; Bouse, R.; Flegal, A.R. Past leaded gasoline emissions as a non-point source tracer in riparian systems. Environ. Sci. Technol. 2000, 34, 1211–1215. [Google Scholar] [CrossRef]
- Dunlap, C.E.; Alpers, C.N.; Bouse, R.; Taylor, H.E.; Unruh, D.M.; Flegal, A.R. The persistence of lead from past gasoline emissions and mining drainage in a large riparian system: Evidence from lead isotopes in the Sacramento River, California. Geochim. Cosmochim. Acta 2008, 72, 5935–5948. [Google Scholar] [CrossRef]
- Reimann, C.; Smith, D.B.; Woodruff, L.G.; Flem, B. Pb concentrations and Pb isotope ratios in soils collected along an east-west transect across the United States. Appl. Geochem. 2011, 26, 1623–1631. [Google Scholar] [CrossRef]
- Arbenz, J.K. Ouachita thrust belt and Arkoma Basin. In The Appalachian-Ouachita Orogen in the United States; Hatcher, R.D., Thomas, W.A., Viele, G.W., Eds.; The Geology of North America, Geological Society of America: Boulder, CO, USA, 1989; pp. 621–634. [Google Scholar]
- Leach, D.L.; Rowan, E. Genetic link between Ouachita foldbelt tectonism and the Mississippi Valley-type lead-zinc deposits of the Ozarks. Geology 1986, 14, 931–935. [Google Scholar] [CrossRef]
- Garven, G. The role of regional fluid flow in the genesis of the Pine Point Deposit, Western Canada sedimentary basin. Econ. Geol. Bull. Soc. Econ. Geol. 1985, 80, 307–324. [Google Scholar] [CrossRef]
- Bethke, C.M. Hydrologic constraints on the genesis of the Upper Mississippi Valley mineral district from Illinois Basin brines. Econ. Geol. Bull. Soc. Econ. Geol. 1986, 81, 233–249. [Google Scholar] [CrossRef]
- Bethke, C.M.; Marshak, S. Brine migrations across North America: The plate tectonics of groundwater. Annu. Rev. Earth Planet. Sci. 1990, 18, 287–315. [Google Scholar] [CrossRef]
- Snyder, F.G.; Gerdemann, P.E. Geology of the Southeast Missouri lead district. In Ore Deposits of the United States, 1933–1967; Ridge, J.D., Ed.; The American Institute of Mining, Metallurgical, and Petroleum Engineers: New York, NY, USA, 1968; pp. 326–358. [Google Scholar]
- Plumlee, G.S.; Leach, D.L.; Hofstra, A.H.; Landis, G.P.; Rowan, E.L.; Viets, J.G. Chemical reaction path modeling of ore deposition in Mississippi valley-type Pb-Zn deposits of the Ozark region, U.S. Midcontinent. Econ. Geol. Bull. Soc. Econ. Geol. 1994, 89, 1361–1383. [Google Scholar] [CrossRef]
- Church, S.E.; Holmes, C.W.; Briggs, P.H.; Vaughn, R.B.; Cathcart, J.; Marot, M. Geochemical and Lead-Isotope Data from Stream and Lake Sediments, and Cores from the Upper Arkansas River Drainage: Effects of Mining at Leadville, Colorado on Heavy-Metal Concentrations in the Arkansas River; Open-File Report 93-534; U.S. Geological Survey: Reston, VA, USA, 1993; 60p.
- Chao, T.J. Use of partial dissolution techniques in geochemical exploration. J. Geochem. Explor. 1984, 20, 101–135. [Google Scholar] [CrossRef]
- Manhes, G.; Minster, J.F.; Allegre, C.J. Comparative uranium-thorium-lead and rubidium-strontium study of the Saint Severin amphoterite: Consequences for early solar system chronology. Earth Planet. Sci. Lett. 1978, 39, 14–24. [Google Scholar] [CrossRef]
- Kamenov, G.D.; Mueller, P.A.; Perfit, M.R. Optimization of mixed Pb-Tl solutions for high precision isotopic analyses by MC-ICP-MS. J. Anal. Atom. Spectrom. 2004, 19, 1262–1267. [Google Scholar] [CrossRef]
- Todt, W.; Cliff, R.A.; Hanser, A.; Hofmann, A.W. Evaluation of a (super 202) Pb- (super 205) Pb double spike for high-precision lead isotope analysis. Geophys. Monogr. 1996, 95, 429–437. [Google Scholar]
- Brockie, D.C.; Hare, E.H., Jr.; Dingess, P.R. The geology and ore deposits of the Tri-State District of Missouri, Kansas, and Oklahoma. In Ore Deposits of the United States, 1933–1967; Ridge, J.D., Ed.; The American Institute of Mining, Metallurgical, and Petroleum Engineers: New York, NY, USA, 1968; pp. 400–430. [Google Scholar]
- Hurst, R.W.; Davis, T.E.; Chinn, B.D. The lead fingerprints of gasoline contamination. Environ. Sci. Technol. 1996, 30, 304A–307A. [Google Scholar] [CrossRef] [PubMed]
- Kamenov, G.D.; Brenner, M.; Tucker, J.L. Anthropogenic versus natural control on trace element and Sr-Nd-Pb isotope stratigraphy in peat sediments of southeast Florida (USA), approximately 1500 AD to present. Geochim. Cosmochim. Acta 2009, 73, 3549–3567. [Google Scholar] [CrossRef]
© 2018 by the authors. Licensee MDPI, Basel, Switzerland. This article is an open access article distributed under the terms and conditions of the Creative Commons Attribution (CC BY) license (http://creativecommons.org/licenses/by/4.0/).