Article

Effects of pH-Induced Changes in Soil Physical Characteristics on the Development of Soil Water Erosion

1
Geological Survey of Japan, National Institute of Advanced Industrial Science and Technology, Higashi 1-1-1, Ibaraki, Tsukuba 3058567, Japan
2
Department of Earth Resources Engineering, Kyushu University, Motooka 744, Nishi-ku, Fukuoka 8190395, Japan
3
Department of Mining Engineering, Institut Teknologi Bandung, Jl. Ganesha 10, Bandung 40132, Indonesia
*
Author to whom correspondence should be addressed.
Geosciences 2018, 8(4), 134; https://doi.org/10.3390/geosciences8040134
Submission received: 30 January 2018 / Revised: 14 March 2018 / Accepted: 19 March 2018 / Published: 16 April 2018
(This article belongs to the Special Issue Soil Hydrology and Erosion)

Abstract

:
Soil water erosion is frequently reported as serious problem in soils in Southeast Asia with tropical climates, and the variations in pH affect the development of the erosion. This study investigated the effects of changes in pH on soil water erosion based on changes in the physical properties of the simulated soils with pH adjusted from 2.0 to 10.0 through artificial rainfall tests. The zeta potential was entirely shifted to positive direction at each pH condition due to Al, Ca, and Mg. In the pH range of 6.0 to 2.0, the aggregation of soil particles resulting from the release of Al3+ from clay minerals and/or molecular attraction between soil particles caused the plastic index (IP) of the soil to decrease. The decrease in IP led to the development of soil water erosion at the pH range. When the pH exceeded 6.0, the repulsive force generated by the negative charges on soil particles decreased IP, resulting in accelerated erosion by water. The results suggest that changes in pH causes physical properties of the soil to change through changes of the zeta potential in the clayey soil rich in Al, Ca, and Mg, leading to the development of soil water erosion.

1. Introduction

Soil erosion, which is serious problem in soils, naturally results from water and wind. In erosion by water, raindrops cause soil particles to be detached from the ground and transported along the slope. The change in soil structure and removal of topsoil resulting from the erosion may cause nutrient removal and environmental degradation, thereby inhibiting plant growth [1,2]. This issue has been frequently reported in Southeast Asian countries with tropical climates [3,4,5], where squalls with high rain intensity are a major contributor to the erosion caused by water [6]. The physical characteristics of soils such as attraction force among soil particles, Atterberg limits, which include the liquid limit (LL) and plastic limit (PL) and indicate the soil’s vulnerability to degradation, and soil particle size also contribute to the erosion [7,8]. For example, low-LL soils easily transform into viscous liquids with increasing water content and are easily transported by rainwater, making them susceptible to soil water erosion. Moreover, small particles formed by soil dispersion resulting from electric repulsion between particles are easily detached from the soil surface and transported by rainwater. Thus, the physical properties of soils strongly affect the development of erosion by water [9].
Erosion by water is distinguished by the mode of running water on the land, such as rill erosion, gully erosion, and sheet erosion [10]. All types of the water erosion are often reported on the slopes formed by waste dumps at mine sites [11,12]. Such waste dumps eventually are covered by trees and grasses during rehabilitation efforts designed to promote environmental conservation, and these surface structures can help prevent erosion by water. However, unrehabilitated surface soils without these structures are susceptible to the erosion. Soil erosion complicates rehabilitation efforts by changing the soil structure and causing nutrient discharge from surface soils; thus, soil erosion, especially soil water erosion, is a serious problem at mine sites. According to past research, the extent of soil erosion by water varies with pH. Acid mine drainage, which commonly occurs at the waste dumps of mining sites, causes acidic conditions with a pH of approximately 2 develop over time [13,14,15]. This acidification changes the physical properties of soils, including the shear strength and Atterberg limits [16,17]. These changes in soil physical properties resulting from acidic condition can trigger the erosion. Alkaline conditions (pH of approximately 8–10) can also form at mine sites as a result of mineral deposits and the use of limestone to improve the soil properties and control the pH in waste dumps [18]. The changes in soil physical properties induced by these alkaline conditions can also affect the development of the water erosion [17,19]. Therefore, the effects of different pH conditions on erosion by water should be elucidated when assessing the risk of soil water erosion. However, few studies have attempted to understand the relationship between pH and the development of water erosion.
This study used artificial rainfall tests with simulated soils adjusted to different pH values to investigate the effects of pH on soil erosion by water in terms of changes in the soil physical properties.

2. Materials and Methods

2.1. Sample Preparation

The simulated soils were prepared by mixing decomposed granite produced by Gulin Kita-Kyu Co., Ltd. and Kyushu bentonite produced by Shinagawa Yogyo Co., Ltd. after screening based on soil texture. It was measured at a post-mining site in A coal mine in Indonesia, where topsoil was placed soon after excavation (Table 1) [20]. The measurement was conducted at 6 points at the site, and the soil samples were supplied to sieving test to understand the soil texture. The soil texture of the simulated soils reflects that of the topsoil at the site. The simulated soils were homogeneously mixed by cone and quartering and then analyzed by X-ray diffraction (XRD), X-ray fluorescence (XRF), and Atterberg limits test. XRD analysis was carried out using a RINT 2100 diffractometer with a wide-angle goniometer under the following conditions: radiation, CuKα; operating voltage, 40 kV; current, 20 mA; divergence slit, 2/3 deg.; anti-scatter, 2/3 deg.; receiving slit, 0.3 mm; scanning step, 0.020 deg.; and scan range, 2.000–40.000 deg. To understand the physical characteristics of the simulated soils, Atterberg limits tests were conducted based on the ASTM D4318-05 standard [21]. Plasticity index (IP), which reflects the soil’s vulnerability to degradation, was calculated by subtracting PL from LL.

2.2. Physcial Characteristics of Simulated Soils at Different pH Values

The pH of the simulated soils was adjusted to seven different values (2.0, 3.0, 4.0, 5.0, 6.0, 8.0, and 10.0) with sulfuric acid (H2SO4), sodium hydroxide (NaOH), and deionized water. The water content of each simulated soil was adjusted to 1.5–2 times the LL of the soil. Atterberg limits tests were performed on the simulated soils to evaluate the effects of pH on the physical properties of the soils. The particle-size distributions of the pH-adjusted soils were analyzed based on the ASTM D422-63 standard [22]; the solution pH was adjusted to different values during these tests. After filtering through a 2-μm filter, the concentration of aluminum (Al) in the test solution was measured by inductively coupled plasma-atomic emission spectroscopy (ICP-AES).

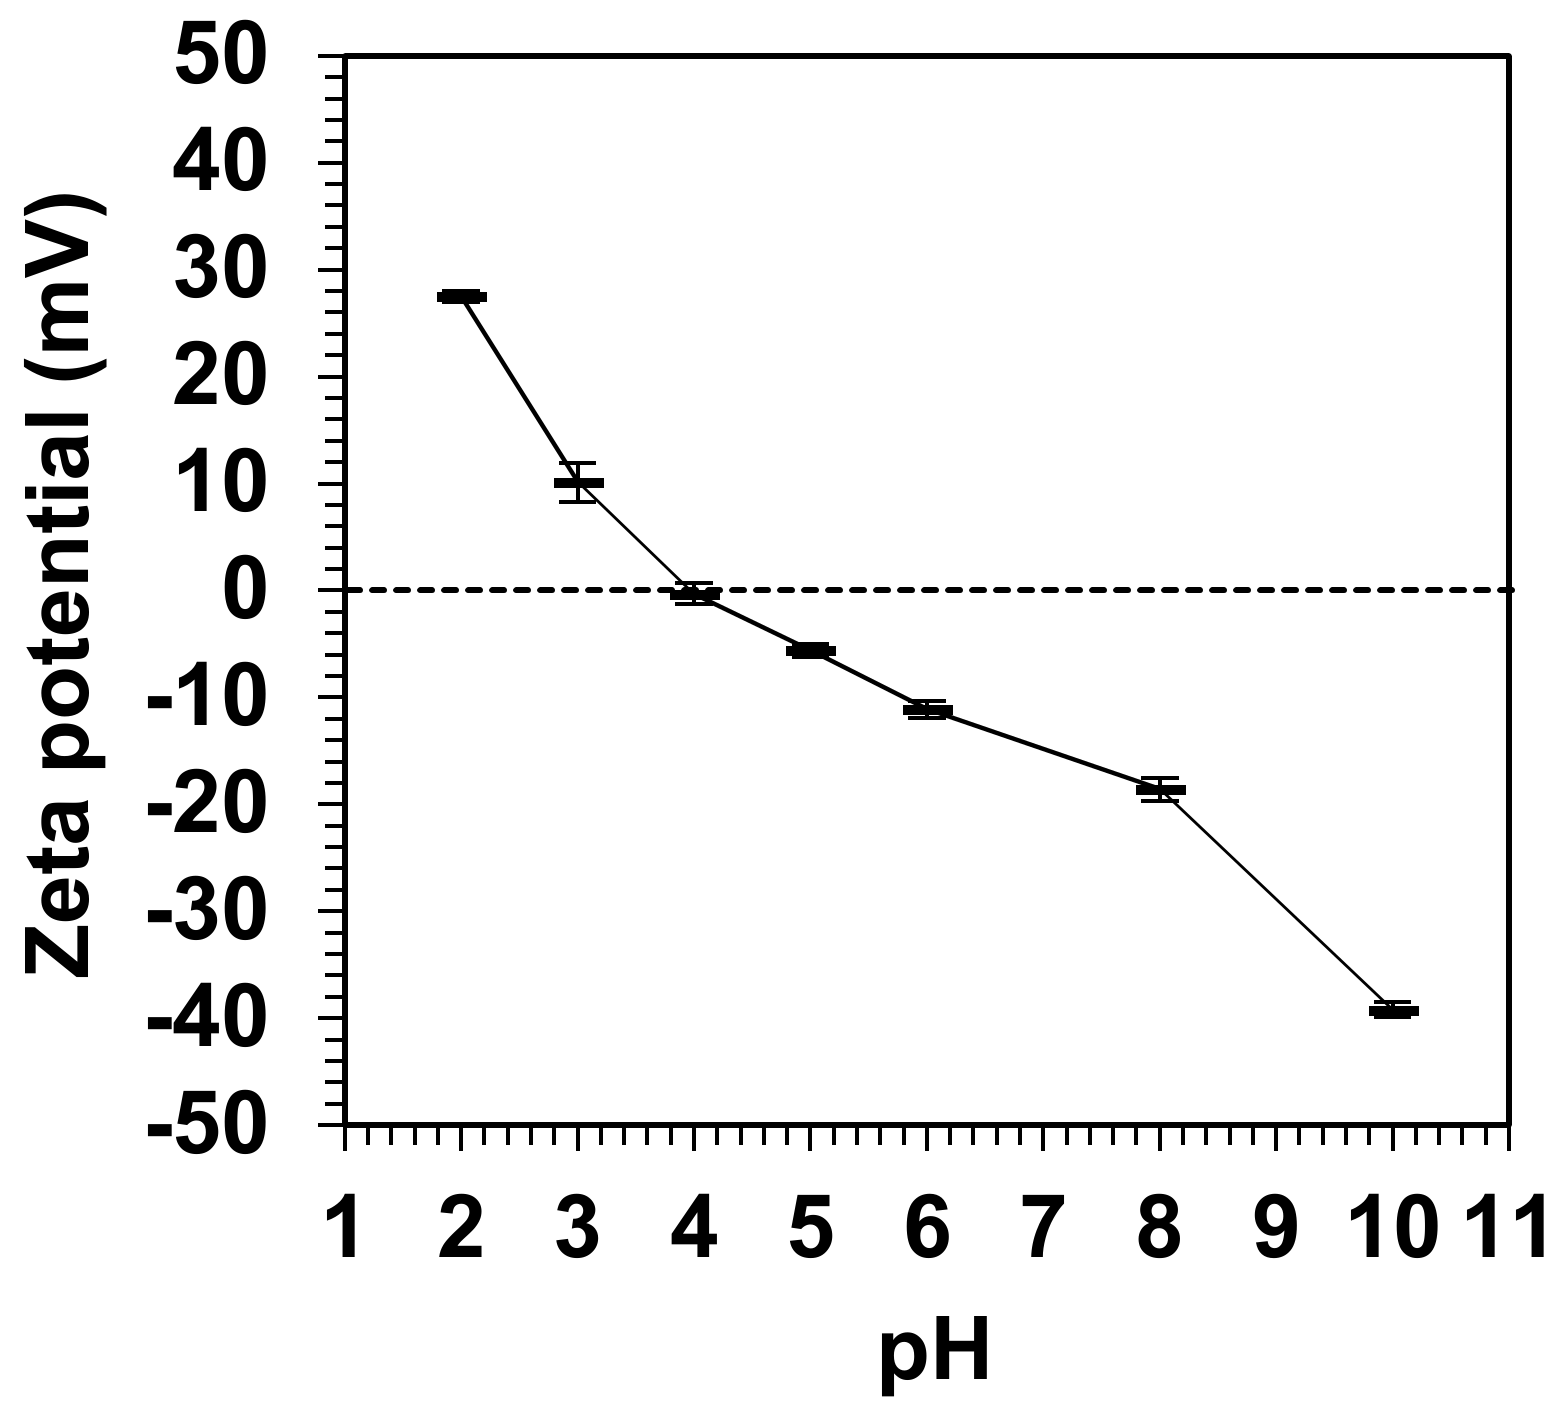
2.3. Zeta-Potential Measurement

The zeta potentials of the simulated soils were measured in 10−3 mol/L potassium chloride (KCl) solution using a Zeta-Sizer Nano ZS instrument (Malvern Instruments Ltd., Malvern, UK). The solution pH was adjusted with 0.25 mol/L hydrochloric acid (HCl) and 0.25 mol/L NaOH. Fine-grained sample (5 mg) was added to 20 mL of solution adjusted to different pH values ranging from 2.0 to 10.0.

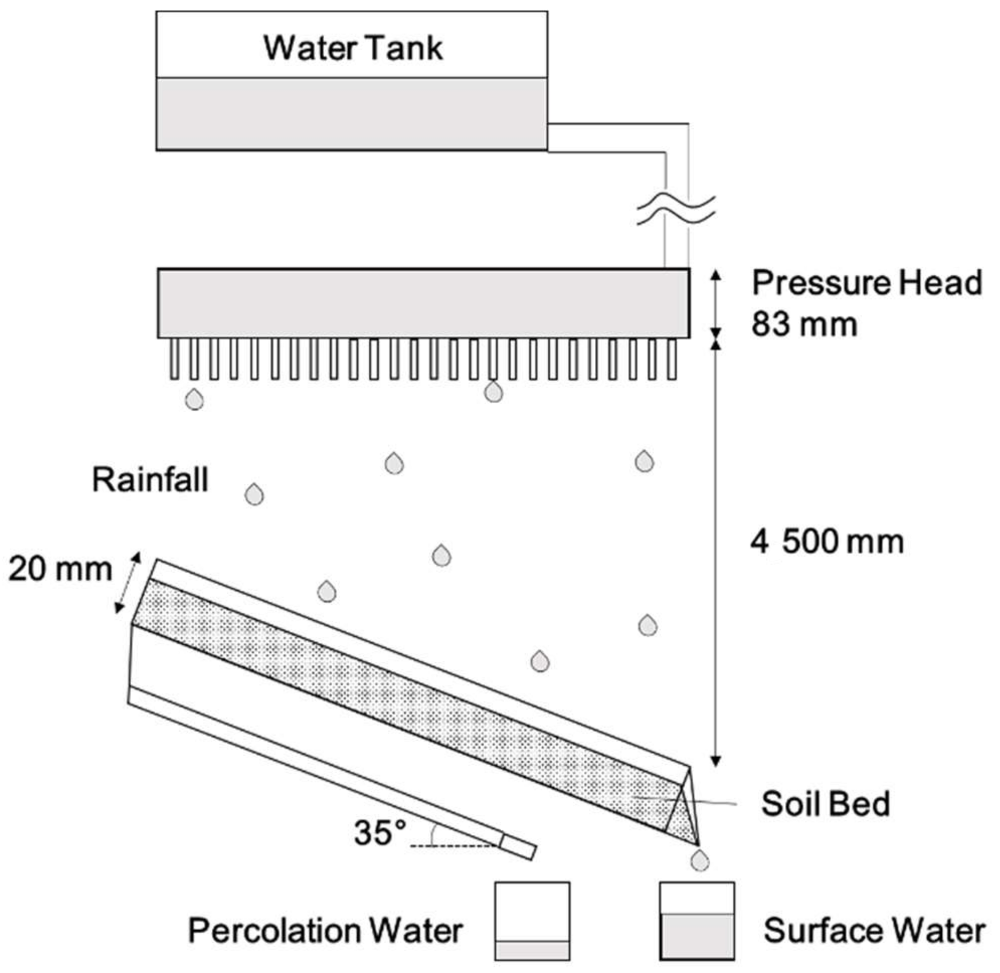
2.4. Artificial Rainfall Test

The annual rate of soil water erosion was investigated using artificial rainfall tests. Figure 1 shows a schematic diagram of the artificial rainfall tests. The simulated soils with pH ranging from 2.0 to 10.0 were placed in the case (240 mm × 155 mm, thickness = 20 mm) at the same rate of filling. Artificial precipitation (pH = 6.2) was then supplied to the simulated soils for 1 h to accelerate soil water erosion. The measured pH of rainwater at the post-mining site showed pH = 5.6–6.0. The experimental conditions were set by reference to a past study [20]. The rainfall intensity was adjusted to 80 mm/hour using the hydraulic head, the water content of the simulated soils was 15%, the slope angle was 35 deg., and the annual rainfall was 3000 mm/year [23,24,25,26]; these annual rainfall and rainfall intensity values reflect those observed in Indonesia. The rainwater was collected as surface and percolation water during the artificial rainfall test. After drying the surface water at 105 °C in an oven, the weight of the residue was measured and used to calculate the amount of soil water erosion per hour E. Based on E (g/hour), the annual rainfall R (mm/year), the section area A (cm2), the dry density of the simulated soil G (g/cm3), and the rainfall intensity I (mm/hour), the annual rate of soil water erosion H (cm/year) was calculated as
H = (R × E)/(A × G × I),

3. Results

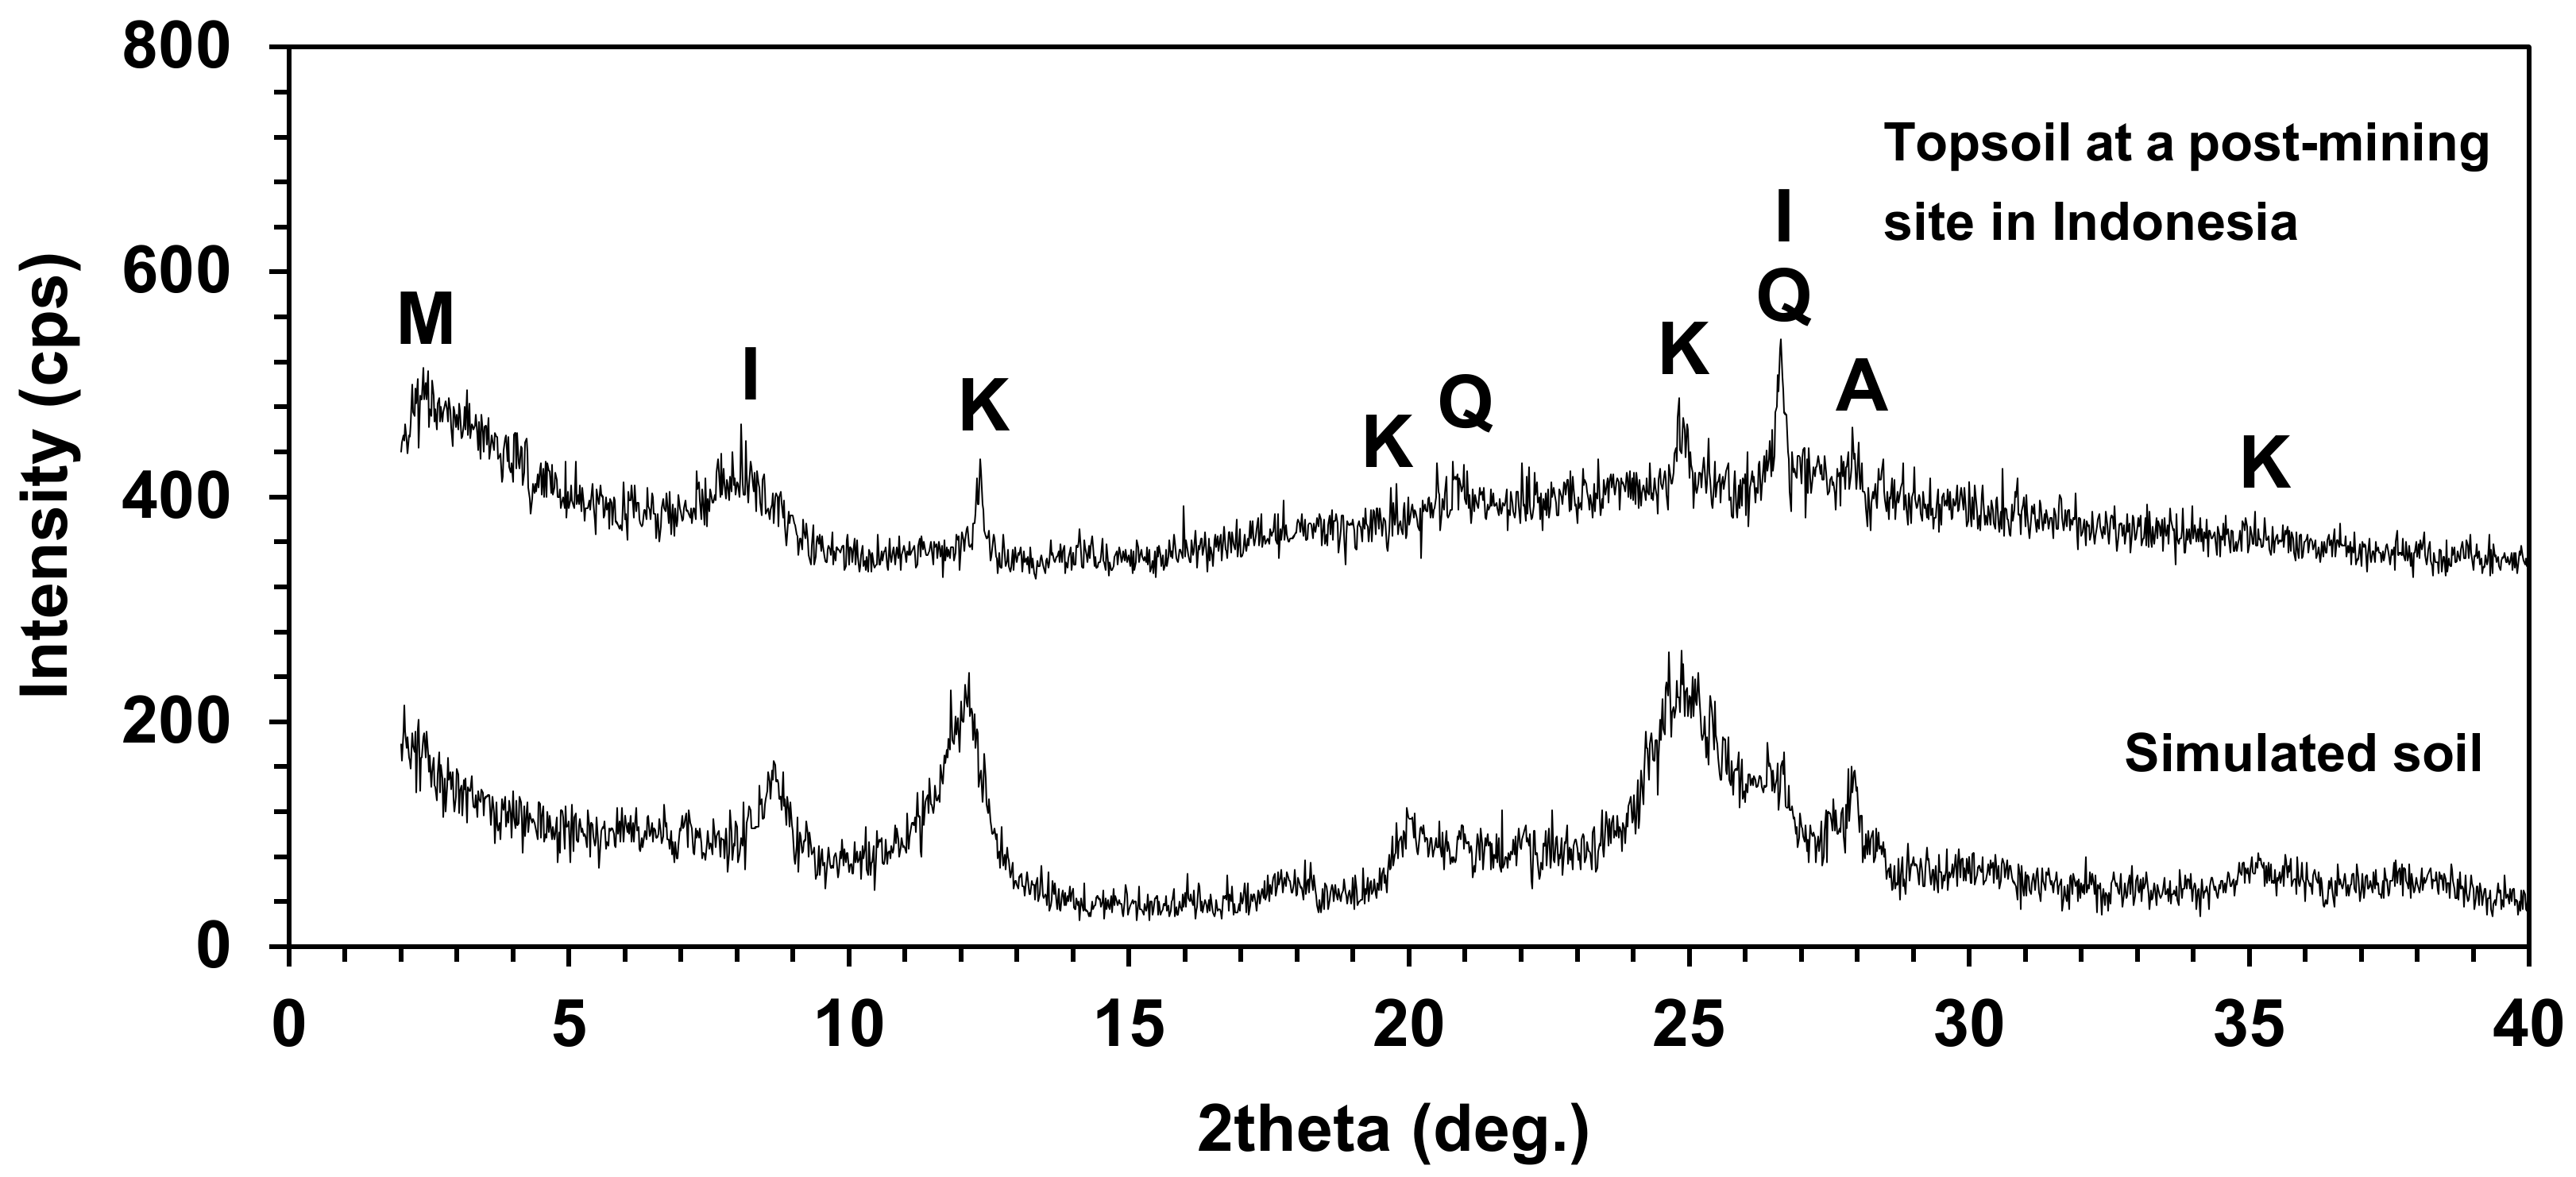
3.1. Chemical and Physical Properties of Simulated Soils

The mineral compositions of the topsoil from A mine in Indonesia and the simulated soils are shown in Figure 2. The simulated soils and topsoil from the mine in Indonesia has similar compositions, with montmorillonite [(Na,Ca)0.33(Al,Mg)2Si4O10(OH)2nH2O], illite ((K,H3O)(Al,Mg,Fe)2(Si,Al)4O10[(OH)2,(H2O)]), quartz (SiO2), kaolinite [Al4Si4O10(OH)8], and albite (NaAlSi3O8) being the primary components. The presence of clay minerals (e.g., montmorillonite, illite, and kaolinite) was consistent with the classifications of the topsoil and simulated soils, which were categorized as “Light Clay” and/or “Silty Clay” based on the soil composition. Table 2 shows the chemical composition of the simulated soils. The simulated soils were dominated by Si and Al, which were found in montmorillonite, illite, and kaolinite. According to the Atterberg limits, the topsoil from the Indonesian mine showed LL and PL values of 25.7–53.9 and 17.4–24.3, respectively, IP values of 6.9–29.6, and soil pH in the range of 3.4–5.7. The physical characteristics of the simulated soils (LL = 43.2, PL = 24.1, IP = 19.1, and soil pH = 5.9) were similar to those of the topsoil from the mine site.

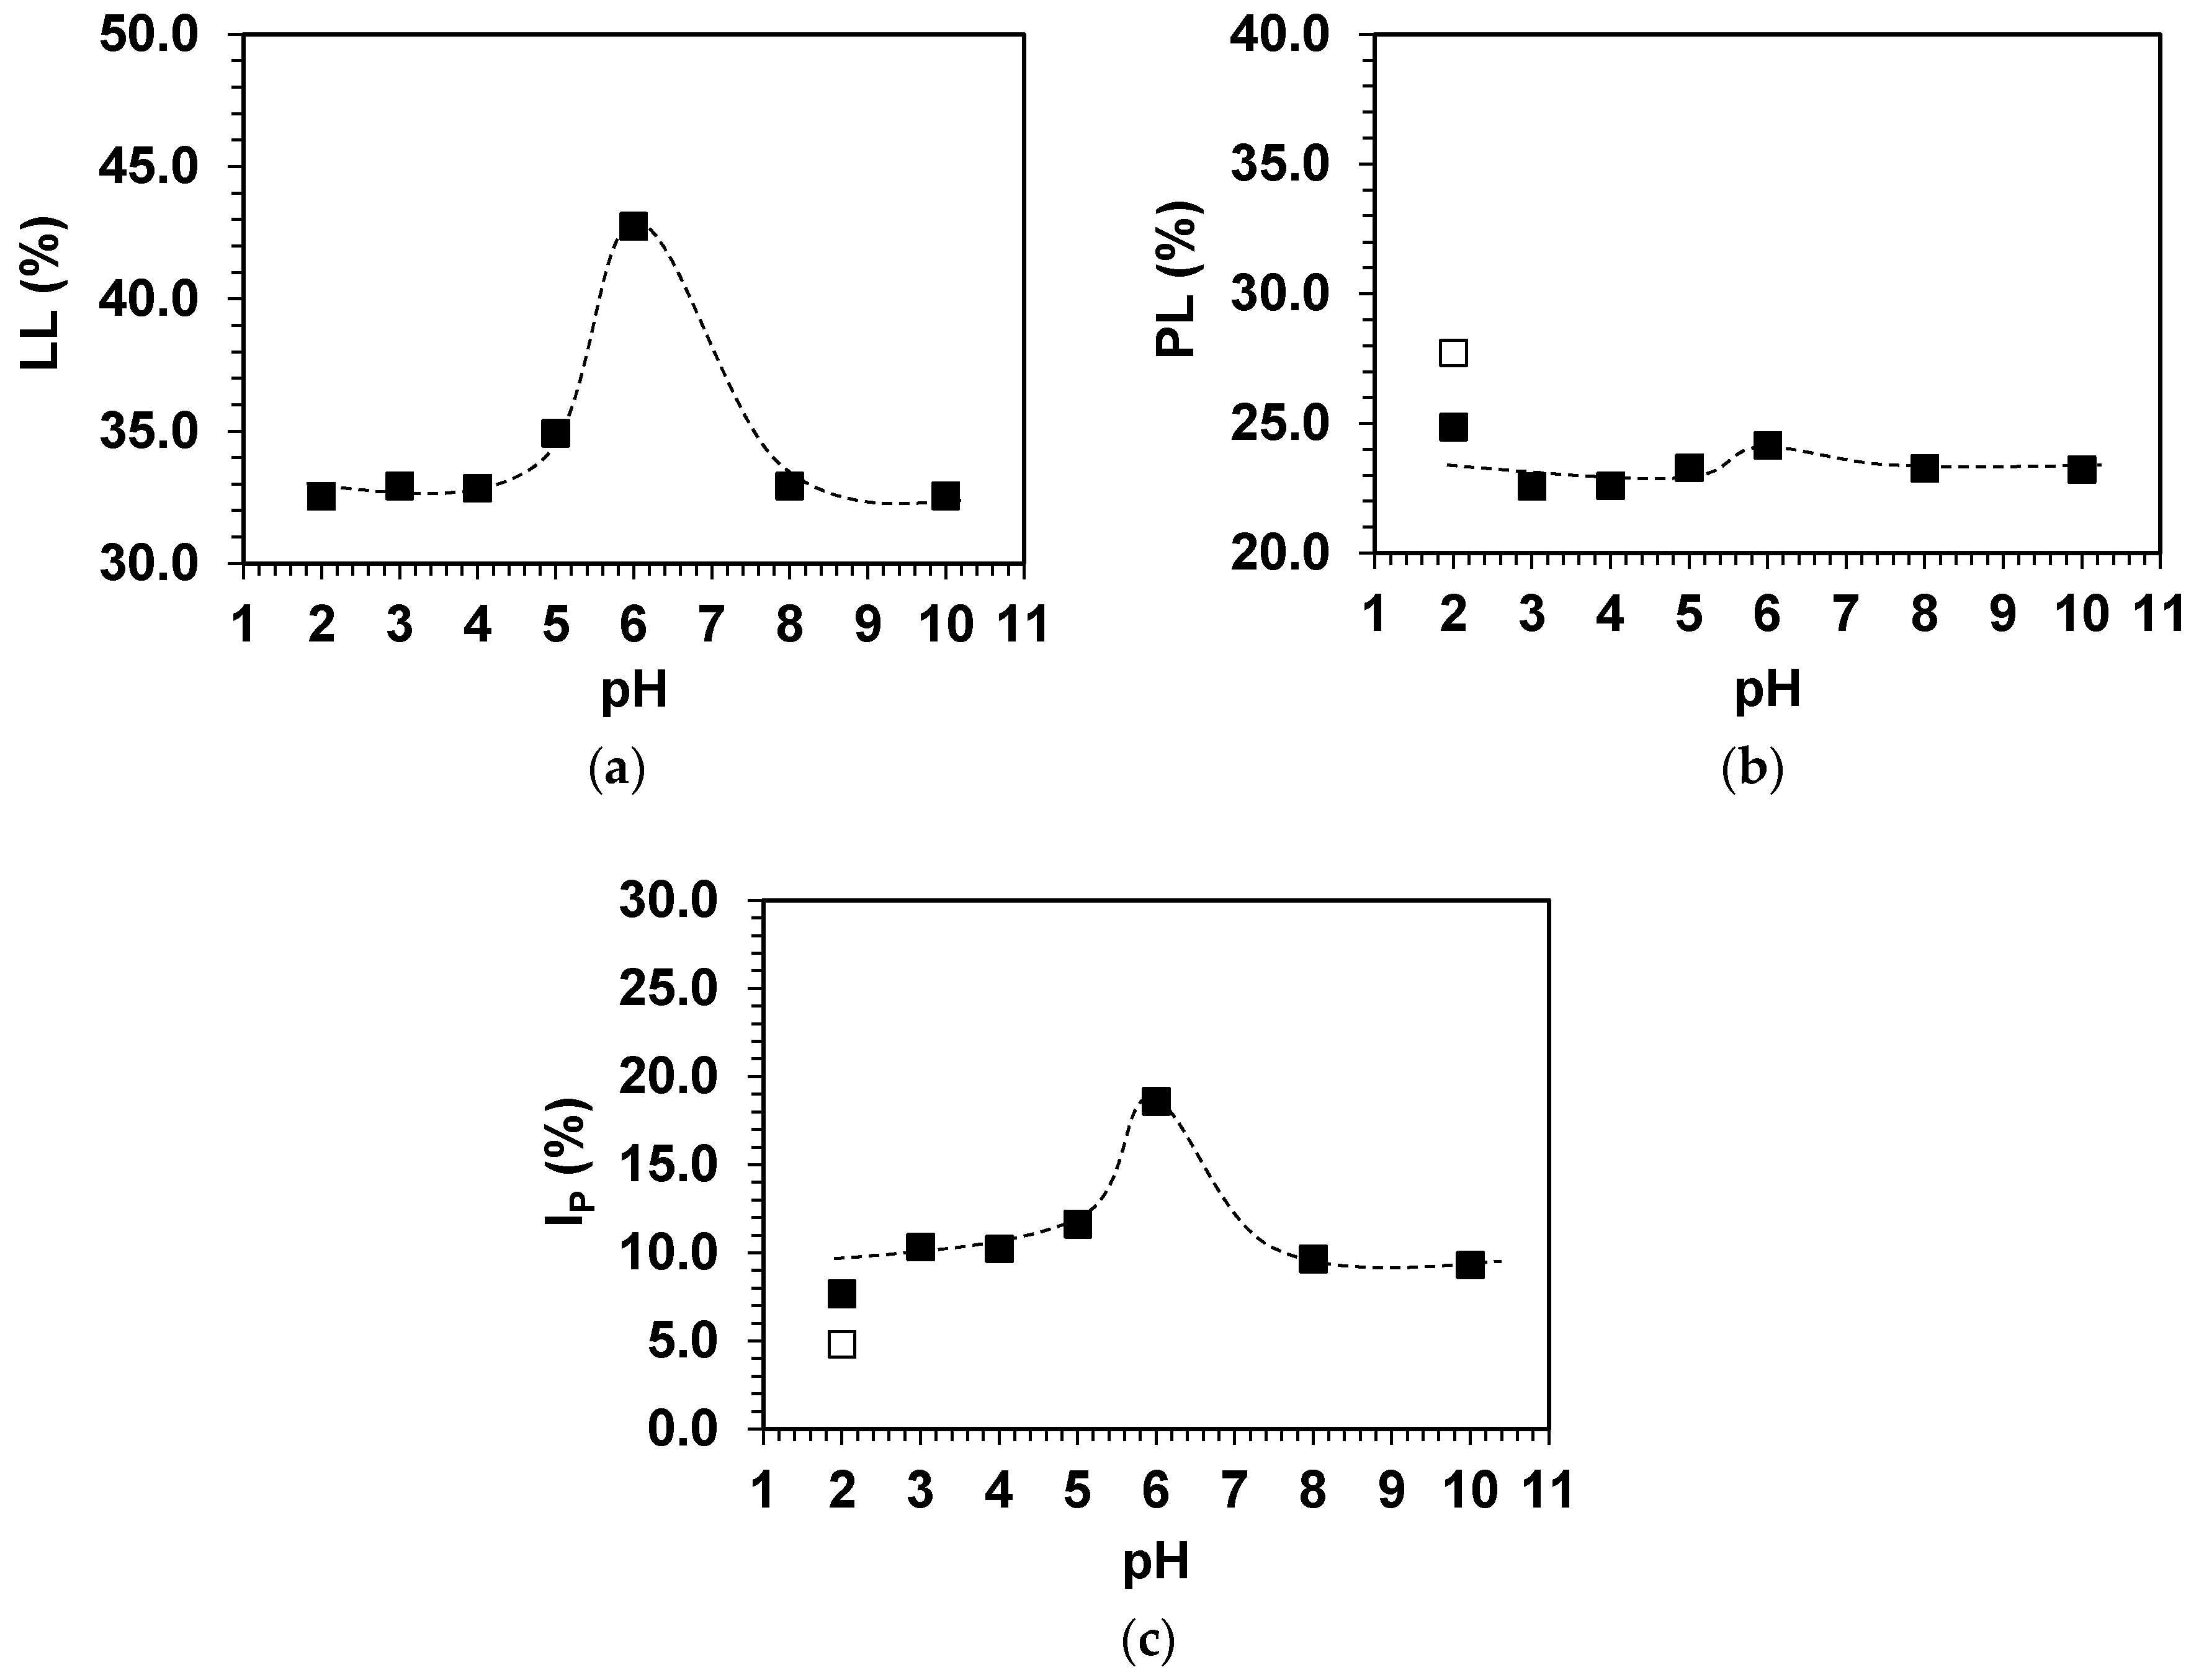
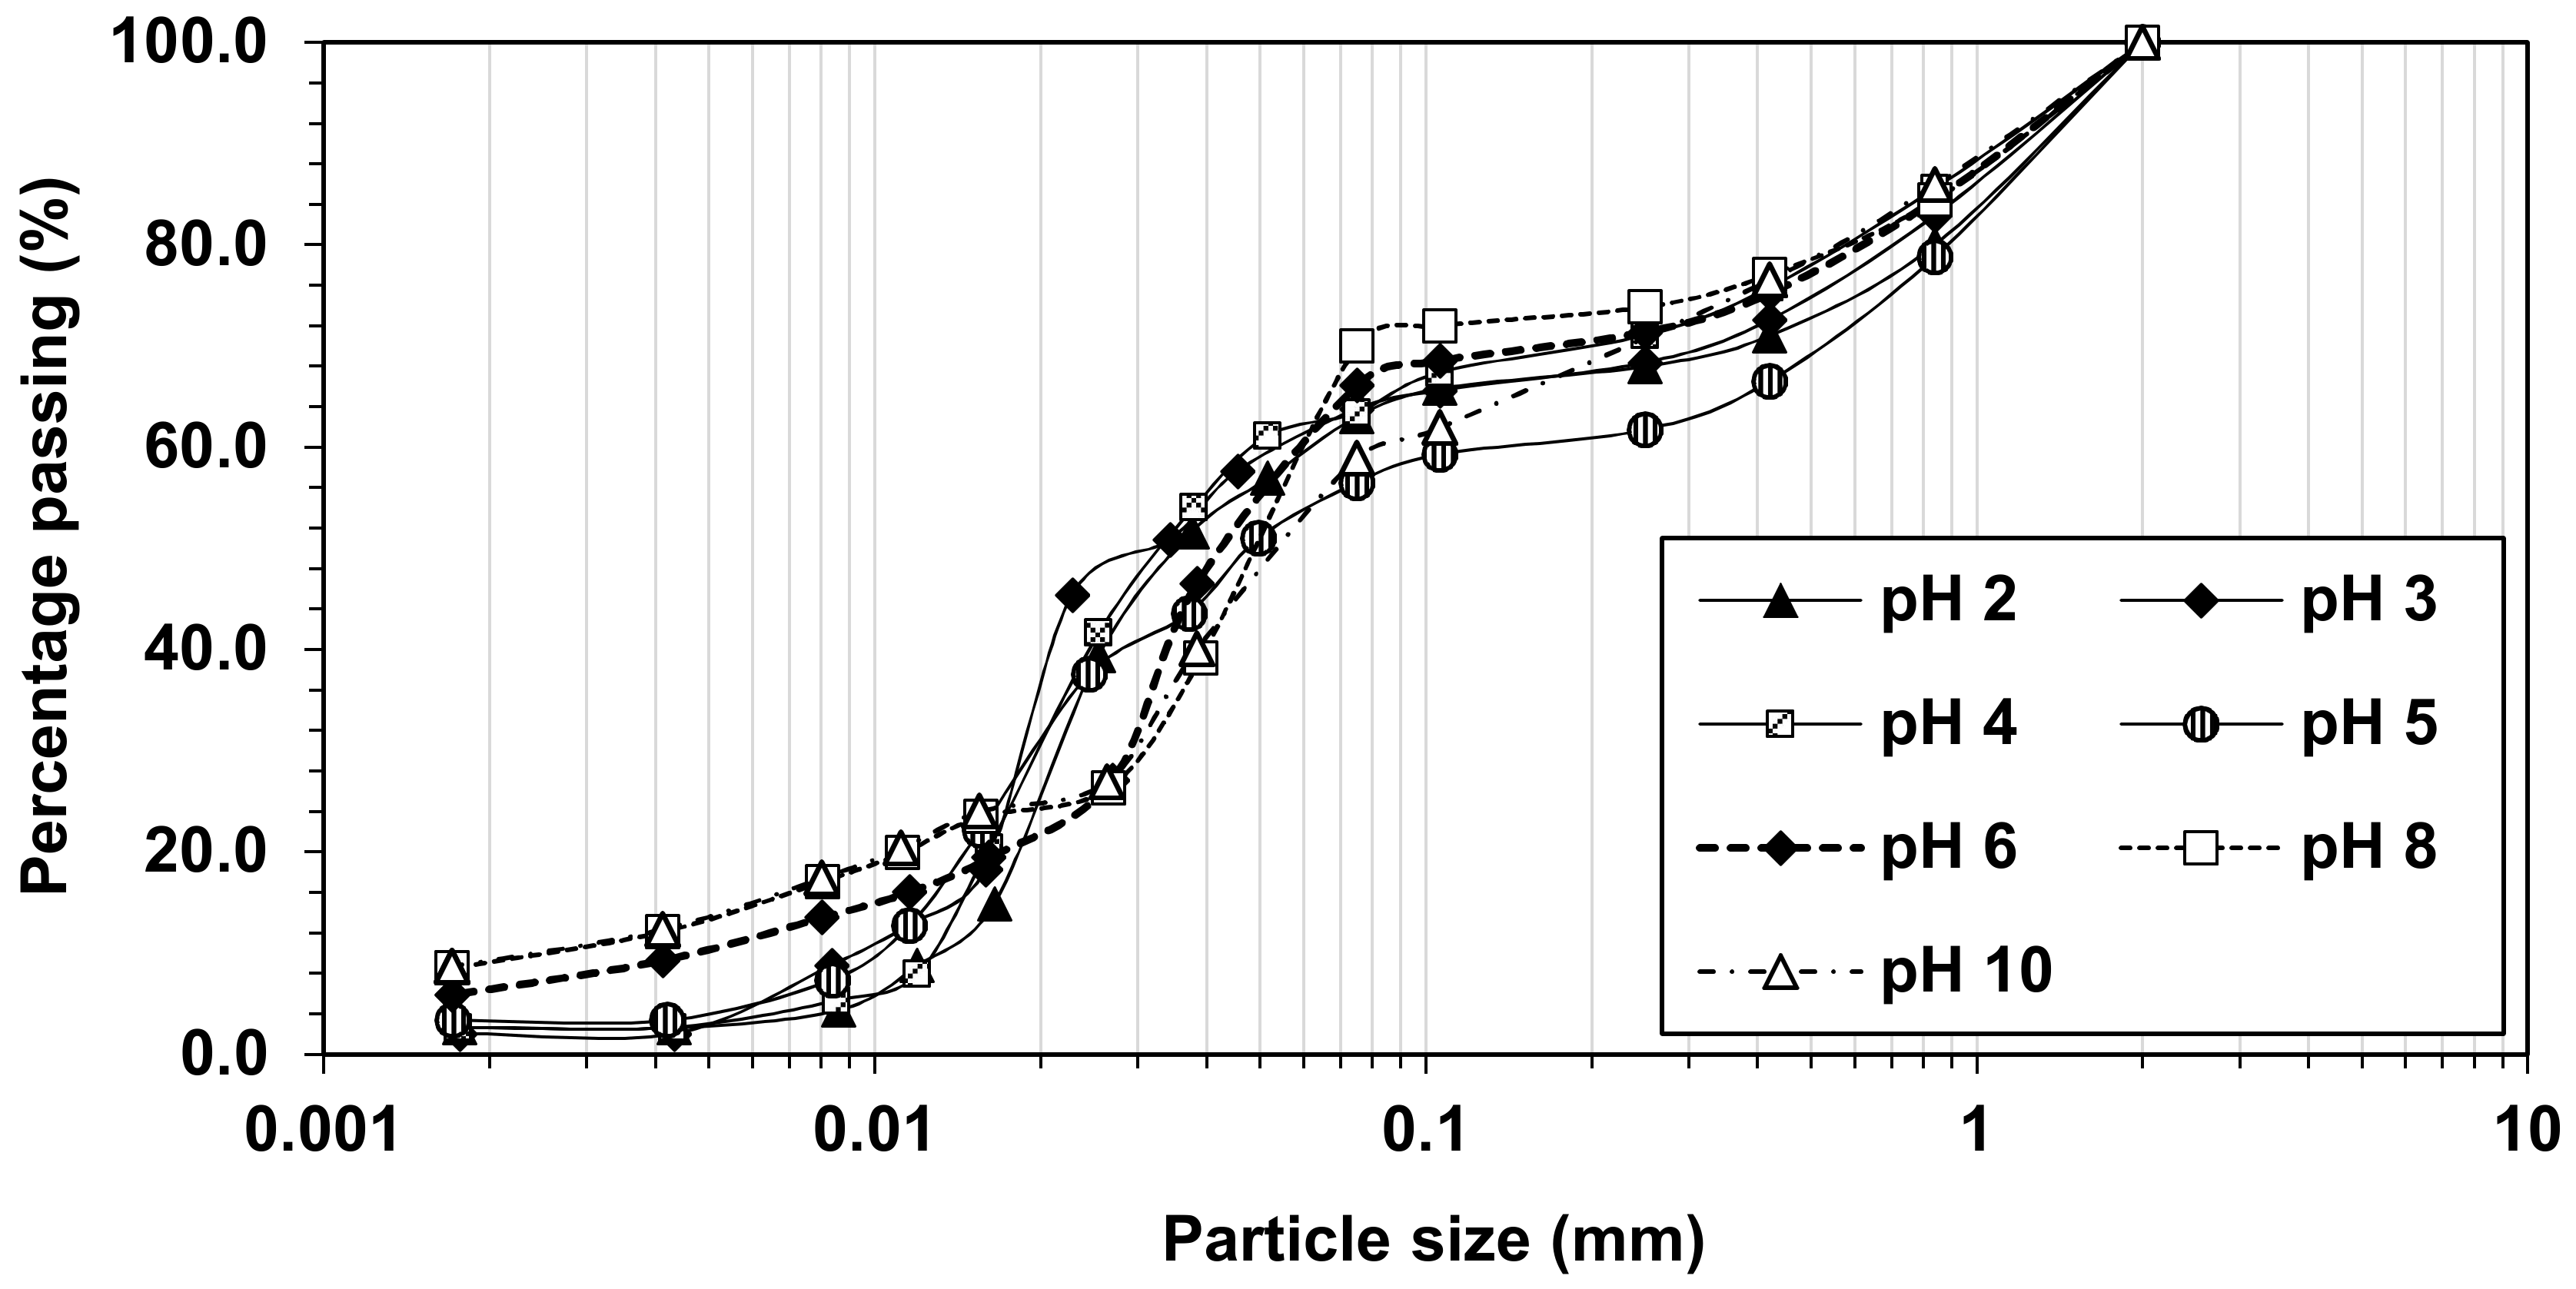
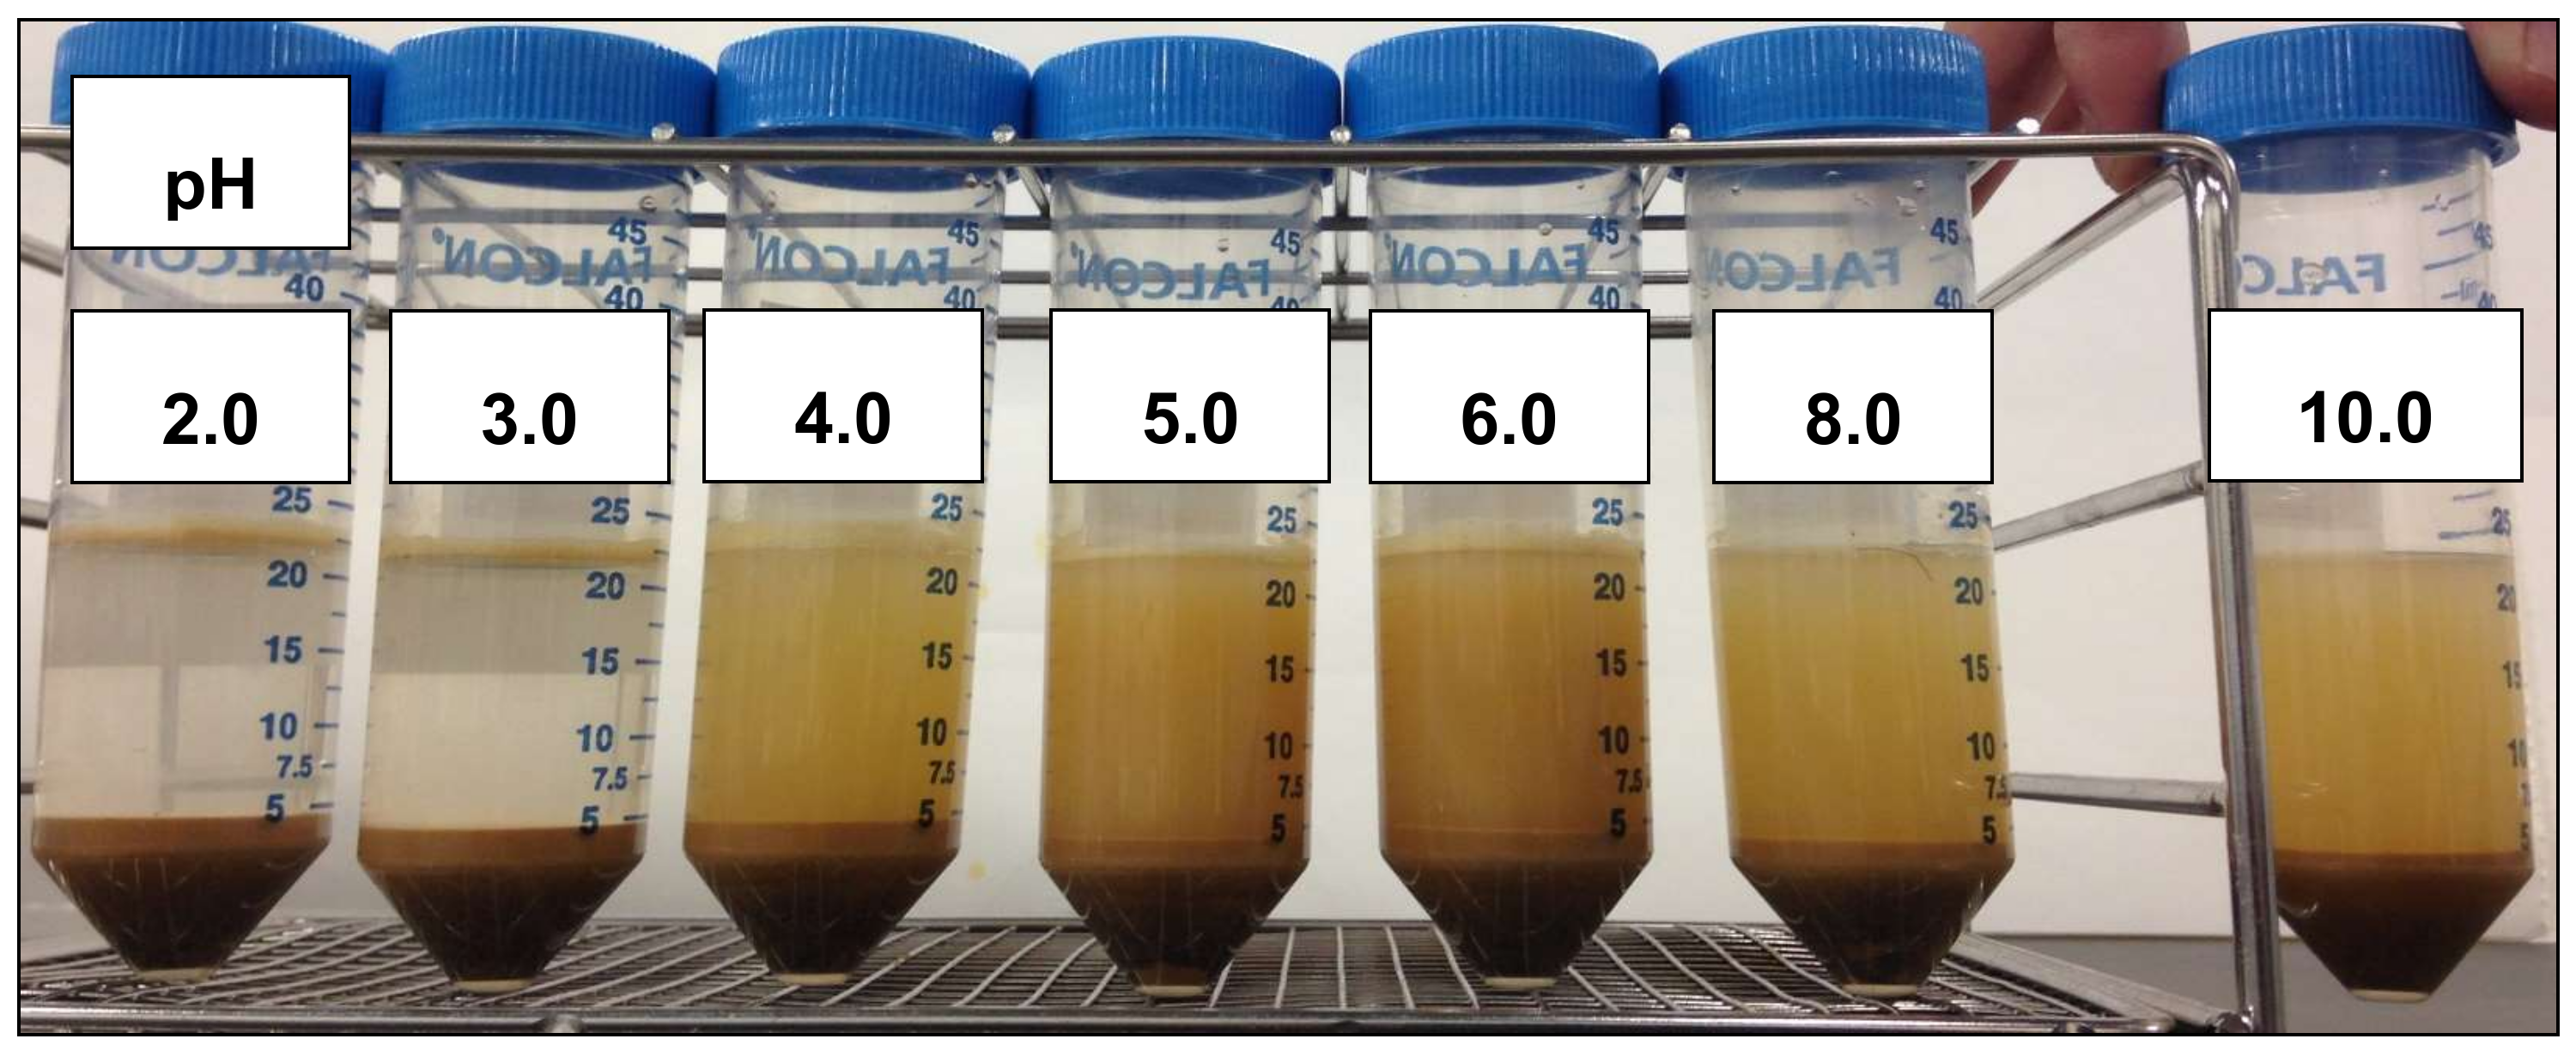
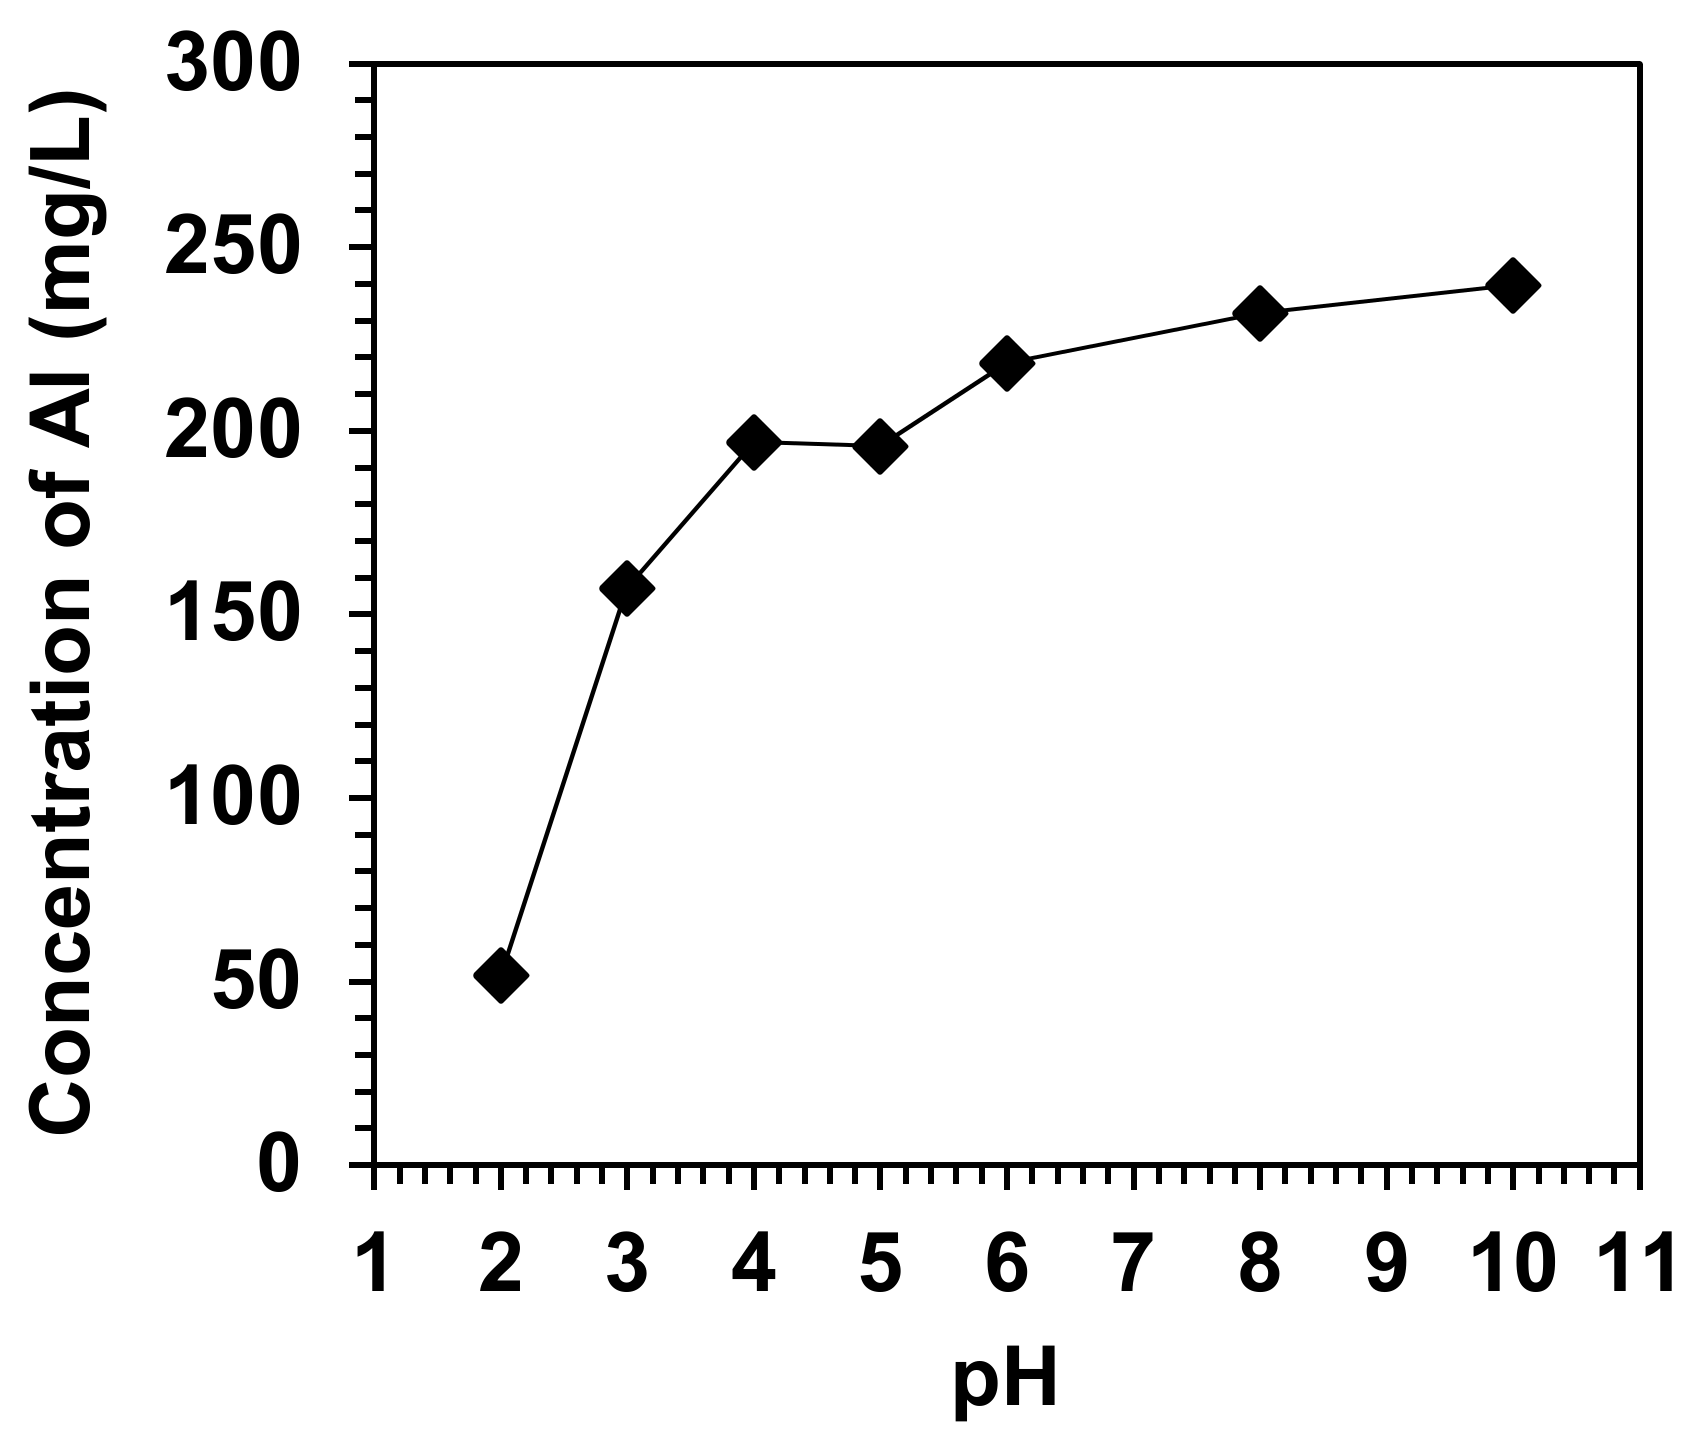
3.2. Effects of pH on the Physical Characteristics of Simulated Soils

The LL, PL, and IP values of the simulated soils under different pH conditions are plotted in Figure 3 (the experimental data is presented as Supplementary Materials), and the corresponding particle-size distributions are shown in Figure 4 (the experimental data is presented as Supplementary Materials). Figure 5 shows a photograph of the solutions after adjusting the pH to 2.0, 3.0, 4.0, 5.0, 6.0, 8.0, and 10.0. In Figure 3, the PL and IP was ranged from 24.86–29.35 and 3.18–7.67 at pH 2.0, respectively. The changing trends of PL and IP implied that the value indicated by a white dot was thought to be that indicated by a black dot. Considering the results as indicated by black dots in Figure 3, the LL and IP in particular increased with increasing pH from 2.0 to 6.0 and then decreased as pH increased further to 10.0 in Figure 3. As LL, PL, and IP depend primarily on soil texture, which is related to the particle-size distribution [7,28], the changes in LL, PL, and IP with pH resulted from changes in soil particle size. As shown in Figure 4, the proportion of soil particles with sizes less than 0.01 mm decreased as pH decreased from 6.0 to 2.0. On the other hand, the proportion increased with increasing pH from 6.0 to 10.0, suggesting a decrease in soil particle size. Furthermore, the turbidity decreased as the pH decreased from 6.0 to 2.0 (Figure 5); this was attributed to the precipitation of small particles resulting from the increase in particle size with decreasing pH. LL generally tends to decrease with increasing soil particle size [28]. Since the attractive force between soil particles attributed to the surface tension of pore water decreases with increasing particle size, the soil easily transforms into a viscous liquid with low water content. This supports the finding that LL and IP decreased significantly with increasing particle size as pH decreased from 6.0 to 2.0 (Figure 3). Meanwhile, the attractive force between soil particles increased with increasing surface tension caused by the decrease in particle size; thus, the soil is not easily transformed into a viscos liquid, even at high water content, leading to the increase in LL. However, in this study, as pH increased from 6.0 to 10.0, LL decreased along with the particle size; thus, other factors should be considered.
Figure 6 shows the Al concentration in solutions with different pH values after filtering through a 2-μm filter. In the pH range of 2.0 to 6.0, Al primarily exists as Al3+ [29]. From pH 4.0 to 6.0, some Al exists as Al(OH)2+. At pH above 6.0, Al exists as Al(OH)4. In this study, the Al concentration decreased with the change of pH from 6.0 to 2.0 compared to that at pH more than 6.0. Al3+ is considered as an aggregating agent in solution and easily released in solution at pH less than 6.0. Thus, a pH decreased from 6.0 to 2.0, soil particles aggregated with Al3+ and precipitated from the solution; this resulted in an increase in soil particle size (Figure 4) and a decrease in turbidity (Figure 5). Conversely, from pH 6.0 to 10.0, most Al was in the form of Al(OH)4, and particle aggregation was not induced. Furthermore, the mineral and chemical compositions of the simulated soils (Figure 2 and Table 2) indicate that most of the Al was derived from montmorillonite, illite, and kaolinite. In summary, pH has significant effects on the physical properties of soils, although the mechanism varies.
The zeta potentials of the simulated soils at different pH are plotted in Figure 7 [27]. The zeta potential became more negative with increasing pH throughout the tested pH range. According to the past studies [30,31], the zeta potential of the mixed mineral clay (MMC) composed of montmorillonite, illite, kaolinite, and quartz became more negative as pH of solution increases, which is good agreement with the changing trends in zeta potential in this study. The zeta potential was −11.1 mV at pH 6.0 and increased to 0.0 mV at pH 4.0 in this study. The zero zeta potential can be attributed to the absorption of H+ and/or Al3+ on the surface of clay with decreasing pH from 6.0 to 4.0. This indicates that the electric repulsion between soil particles was minimized at pH 4.0, whereas molecular attraction was maximized. Thus, at pH from 6.0 to 4.0, the soil particle size increased as a result of molecular attraction between soil particles in addition to Al3+-induced aggregation. In contrast, in the pH range of 4.0 to 2.0, the positive charges on soil particles (0–10.1 mV) resulted in electric repulsion between the particles, while Al3+ caused particle aggregation, resulting in increased soil particle size and decreased turbidity. In summary, as pH decreased from 6.0 to 4.0, Al3+-induced aggregation along with molecular attraction between soil particles caused the soil particle size to increase, resulting in a significant decrease in LL. The decrease in LL was attributed primarily to the aggregation induced by Al3+ at pH in the range of 4.0 to 2.0. For pH > 6.0, the soil particles were negatively charged (Figure 7), and the electric repulsion between particles led to a decrease in soil particle size. OH and Al(OH)4 were thought to contribute to the negative charges on the soil particles under alkaline conditions, and soil particles did not obviously aggregate in the pH range. The electric repulsion between soil particles at pH > 6 increased the mobility of the soil particles regardless of the surface tension of pore water, thereby decreasing the LL.
It was reported that the zeta potential of MMC showed positive values under acidic conditions as Al3+ can compress diffuse double layer [30]. Furthermore, in the pH range of 6.0 to 8.0–10.0, Al(OH)3 precipitate is positively charged with the absorption of positively charged AlOH2+ and Al(OH)2+ species; on the other hand, it is negatively charged due to Al(OH)4 for pH > 8.0–10.0 [30]. In addition, the zeta potential becomes more positive in the presence of salt cation such as Ca2+ and Mg2+ since they can compress the diffuse double layer of the minerals. They precipitate as salt hydroxide at alkaline pH values and the zeta potential becomes more positive due to precipitated covered solid [30]. Although the zeta potential of the simulated soils composed of 1.58% Ca and 1.46% Mg in this study (Table 2) showed different values from that of MMC in distilled water (−22.6 mV at pH 3 and −41.2 mV at pH 11) [30], the changing trends of the zeta potential was in good agreement with that of the past study. Thus, in this study, the zeta potential was entirely shifted to positive direction at each pH condition due to Al, Ca, and Mg, resulting in changes of the physical properties of the simulated soils.

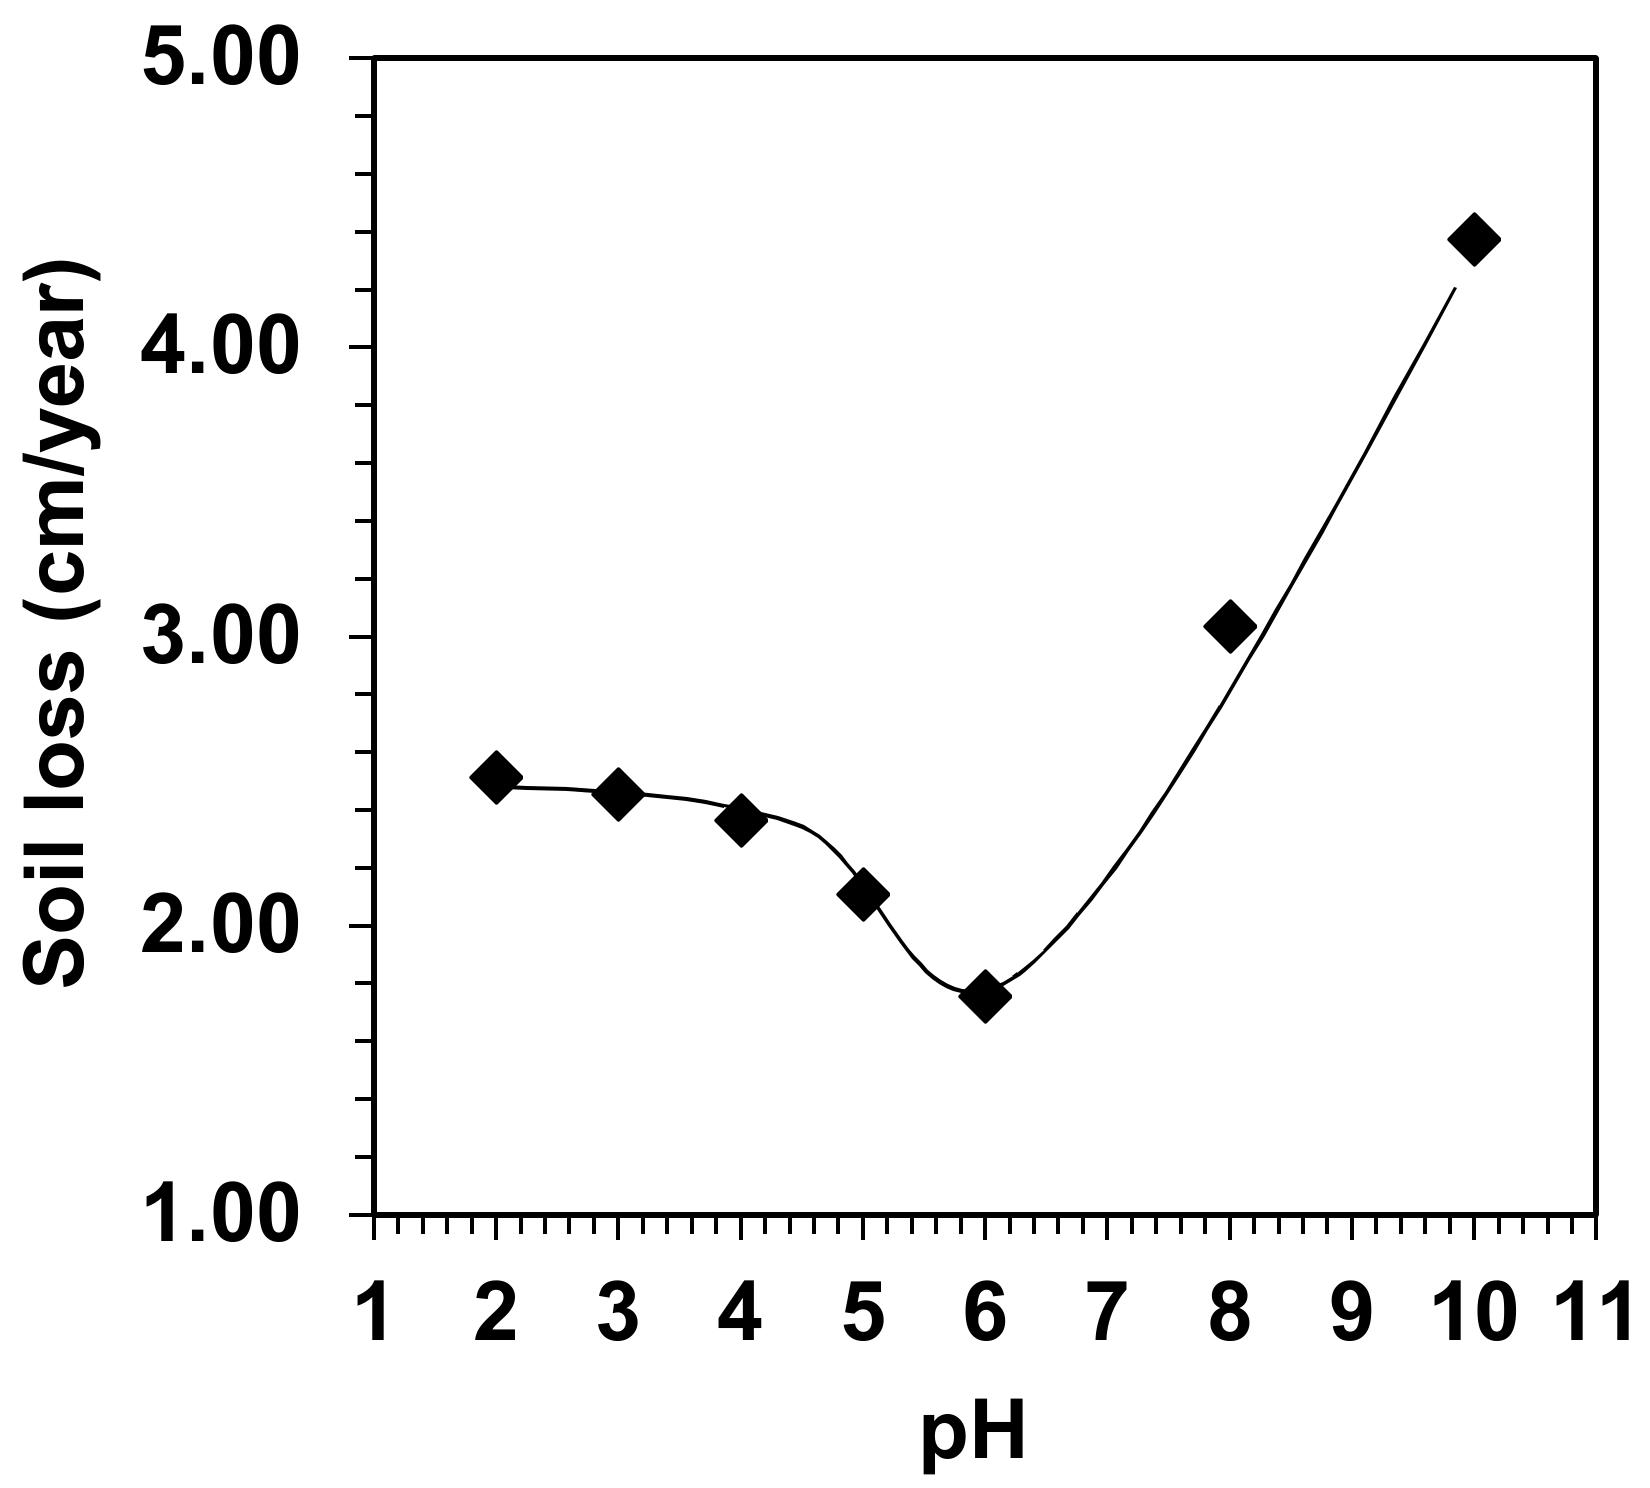
3.3. Development of Soil Water Erosion at Different pH Values

Figure 8 shows the annual rate of soil water erosion of the simulated soils at different pH, as determined in the artificial rainfall tests (the experimental data is presented as Supplementary Materials) [27]. The annual rate of soil water erosion decreased from 2.51 cm/year to 1.76 cm/year as pH increased from 2.0 to 6.0 and then increased up to 4.37 cm/year as pH increased further to 10.0. Based on the erosion hazard in the guideline for the district government of Aceh Barat in Indonesia, which is not site specific and can be applied to other districts [32], the risk is very low when soil loss is less than 0.15 cm/year, low when it ranges from 0.15 to 0.9 cm/year, moderate when it ranges from 0.9 to 1.8 cm/year, and high when it ranges from 1.8 to 4.8 cm/year. As the measured annual erosion rates in this study were ranged within the values, the soil water erosion in the artificial rainfall test possibly occurs in the site in Indonesia. Further, the changing trends in the annual erosion rate corresponded to the changes in LL shown in Figure 3. The simulated soils were easily detached and transported by rainwater as a result of the low cohesive strength between soil particles along with the low LL and IP at the pH compared the soil at pH 6.0. The greatest erosion rate was observed at pH 10.0 because the repulsion force between negatively charged particles was maximized at this pH (Figure 7).
Consequently, soil erosion by water developed under different pH conditions with changes in the Atterberg limits of soils through a variety of mechanisms in this study (Figure 9). The aggregation by Al3+ released from clay minerals and molecular attraction between soil particles caused a significant decrease of IP at pH from 6.0 to 4.0. At pH in the range of 4.0 to 2.0, the aggregating effect decreased IP. The decreases in IP and LL led to the development of soil water erosion at pH in the range of 6.0 to 2.0. At pH > 6, the repulsion between negatively charged soil particles resulted in decreases in IP and LL, leading to the development of soil erosion by water. The pH conditions can change the risk of soil water erosion through the change in physical characteristics of soils and this can develop over time at mine sites since mining operations contribute to changes in pH (e.g., through the generation of acidic water during the construction of waste dumps and the use of limestone) [13,16]. Considering that there were not large differences in soil texture, physical properties of soil, and minerals among the simulated soil samples, the difference in pH conditions affected the erosion rate of the soils through changes of the physical properties of the soils with zeta potential changes. However, as changes of the zeta potential and the physical properties of the soils derived from the effects of salt and metal cations such as Al3+, Ca2+, and Mg2+ as described in Section 3.2, the effects of different pH conditions on the development of soil water erosion in this study were only observed in the clayey soil rich in Al, Ca, and Mg. Since the experimental conditions focused on the field conditions in Indonesian coal mines and other factors (such as mineralogy in soils and organic matters) also affect the development of soil water erosion, the phenomena observed in this study should be further elucidated in the light of different experimental conditions and the other factors.

3.4. Implication of pH-Induced Changes in Soil Physical Characteristics with Soil Water Erosion Model

As indicated above, soils with different pH values are formed over time within nature and the clayey soil rich in Al, Ca, and Mg can show the acceleration of soil water erosion with changes of the physical properties of soil at different pH conditions; thereby, the effects of pH changes on the development of soil erosion by water have to be considered in the model of soil water erosion, by taking account of the factors causing the pH changes. The pH of rainwater, which is considered as a major factor of soil water erosion, varies according to region [33]. The pH of rainwater was ranged from 4.8–7.3 in India [34], and from 5.0 to 9.0 in China [35], and from 5.55–7.55 in Pakistan [36]. The acid and alkaline rainwater have been reported in the world with industrialization and urbanization [37]. The main results of this study indicate that the rainwater induces soil water erosion as the physical characteristics of the soils change. Furthermore, contamination of river water and leachate from industrial waste during industrialization and urbanization induce the changes in soil physical properties resulting from pH changes, leading to accelerating soil water erosion. For example, the pH of the river water in Poland varied from 7.2 to 8.4 due to house hold sewage according to Bartnik and Moniewski [38]. Gomes et al. stated that the leachate from alkaline residues produced by industries such as steel production, alumina refining, and coal-fired power plant affected the environment [39]. Hull et al. also reported that the pH of the river water ranged from 9.06 to 11.64 induced by alkaline leachate from a former steel slag disposal site in England [40]. In the Southern Appalachian Mountains, acidic drainage, generally having pH values of 4.5 or lower, was observed as weathering of rocks occurred during road construction [41]. As soil physical characteristics change under the different pH conditions over time during industrialization and urbanization, soil water erosion can be accelerated. The pH of rainwater at a post-mining site in this study was pH = 5.6–6.0, and acid rain with the pH < 5.6 was reported in the area with coal fired power plants in the past study [42], soil pH possibly changes over time in mine site. Thus, soil water erosion model should consider the effects of changing pH over time on the development of soil erosion by water for the risk assessment, especially in the case of clayey soil rich in Al, Ca, and Mg.
Several soil erosion models, such as the Universal Soil Loss Equation (USLE) and the European Soil Erosion Model (EUROSEM), have been developed for assessment of soil erosion. Soil erosion risk has been assessed within a large region by integrating the models with geographic information systems (GIS), digital elevation model (DEM), field data obtained by remote sensing technologies [43,44,45]. Although the effects of pH changes on the physical properties of the soils have to be considered in assessing soil water erosion risk, there are too many factors causing the pH changes, such as rainwater, river water and leachate, thus complicating the model of soil water erosion. Besides, since pH-induced changes in soil physical characteristics develop over time and the changes vary depending on geological conditions, including the presence of clay minerals and metal cations, the factors cannot be directly applied to the soil water erosion model as input parameters. Hence, the physical characteristics of soils such as IP and the particle-size distributions, which correlate with the pH changes through the change in zeta potential as indicated in this study, should be applied to the model of soil water erosion. Moreover, the changes in soil physical properties over time under different pH conditions cannot be obtained by remote sensing technologies within a large region with various factors, including geological conditions, regional climate conditions and various land use. Soil water erosion induced by pH changes should be assessed as a worst-case scenario separately from the existing soil water erosion assessment using experimental results, geological conditions, land-use database.

4. Conclusions

The effects of pH on the development of soil water erosion were investigated in terms of the physical properties of soils, which were evaluated by artificial rainfall tests using simulated soils adjusted to different pH values from 2.0 to 10.0. The zeta potential was entirely shifted to positive direction at each pH condition due to effects of Al, Ca, and Mg in this study, resulting in changes of the physical properties of the soils. When pH changed from 6.0 to 4.0, the aggregation caused by Al3+ released from clay minerals along with the molecular attraction between soil particles resulted in significant decreases in IP and LL. In the pH range of 4.0 to 2.0, the positive charges on soil particles (0–10.1 mV) resulted in electric repulsion between the particles, while Al3+ caused particle aggregation, resulting in increased soil particle size. This also caused lower IP and LL in the pH range compared to that at pH 6.0. The decreases in IP and LL led to the development of soil water erosion. At pH > 6, repulsion between negatively charged soil particles resulted in decreases in IP and LL, leading to the development of soil water erosion. The findings indicate that, in the clayey soil rich in Al, Ca, and Mg, the difference in pH values causes the changes in physical properties of the soils through changes in the zeta potential, leading to the development of soil water erosion. The effects of changing pH on the development of soil erosion by water should be considered in risk assessments of soil water erosion, especially in the clayey soil rich in Al, Ca, and Mg.

Supplementary Materials

The experimental data of each figure is presented as supplementary materials at https://www.mdpi.com/2076-3263/8/4/134/s1: Figure 3: Change of LL, PL, IP at different pH values ranging from 2.0 to 10.0: (a) change of LL; (b) PL; (c) IP. At pH 2.0, the value indicated by white dots was calculated based on the average value, and that indicated by black dots was based on ideal value, according to the changing trends of PL and IP, Figure 4: Particle size distribution at different pH values ranging from 2.0 to 10.0, Figure 8: Annual rate of soil water erosion at different pH values ranging from 2.0 to 10.0.

Acknowledgments

This work was partly supported by JSPS KAKENHI Grant Number 17H07401. We are also grateful to the mine and researchers at Kyushu University for supporting part of the analysis. The authors would like to thank Enago (www.enago.jp) for the English language review.

Author Contributions

Shinji Matsumoto designed and performed the experiments and analyzed the data with Shunta Ogata. Based on the data, Shinji Matsumoto wrote the paper. Prof. Hideki Shimada and Associate Takashi Sasaoka and Akihiro Hamanaka gave helpful ideas for the analysis of the data and supported a part of the experiments. Ginting Jalu Kusuma kindly helped to conduct a field investigation in Indonesian mines.

Conflicts of Interest

The authors declare no conflict of interest.

References

  1. Yusuf, M.; Arisoesilaningsih, E. Exotic plant species attack revegetation plants in post-coal mining areas. AIP Conf. Proc. 2017, 1908, 1–5. Available online: https://doi.org/10.1063/1.5012716 (accessed on 27 January 2018).
  2. Sheoran, V.; Sheoran, A.S.; Poonia, P. Soil reclamation of abandoned mine land by revegetation: A review. Int. J. Soil Sediment Water 2010, 3, 13. [Google Scholar]
  3. Kusumandari, A.; Mitchell, B. Soil erosion and sediment yield in forest and agroforestry areas in West Java, Indonesia. J. Soil Water Conserv. 1997, 52, 376–380. [Google Scholar]
  4. Elsheikh, R.F.A.; Ouerghi, S.; Elhag, A.R. Soil erosion risk map based on geographic information system and universal soil loss equation (case study: Terengganu, Malaysia). Ind. J. Sci. Res. Technol. 2015, 3, 38–43. [Google Scholar]
  5. Phuong, T.T.; Thong, C.V.T.; Ngoc, N.B.; Chuong, H.V. Modeling soil erosion within small mountainous watershed in central Vietnam using GIS and SWAT. Resour. Environ. 2014, 4, 139–147. [Google Scholar]
  6. Hamanaka, A.; Inoue, N.; Shimada, H.; Sasaoka, T.; Matsui, K. An Experimental Study for Assessment of Soil Erosion at Rehabilitation Area in Indonesian Coal Mine. In Proceedings of the International Symposium on Land Reclamation and Ecological Restoration (LRER’14), Beijing, China, 16–19 October 2014; pp. 171–175. [Google Scholar]
  7. Deng, Y.; Cai, C.; Xia, D.; Ding, S.; Chen, J.; Wang, T. Soil atterberg limits of different weathering profiles of the collapsing gullies in the hilly granitic region of southern china. Solid Earth 2017, 8, 499–513. [Google Scholar] [CrossRef]
  8. Sharmeen, S.; Willgoose, G.R. The interaction between Armouring and particle weathering for eroding landscapes. Earth Surf. Process. Landf. 2006, 31, 1195–1210. [Google Scholar] [CrossRef]
  9. Marcus, J.J. Mining Environmental Handbook: Effects of Mining on the Environment and American Environmental Controls on Mining; Imperial College Press: London, UK, 1997; pp. 136–138. [Google Scholar]
  10. El-swaify, S.A.; Dangler, E.W.; Armstrong, C.L. Soil Erosion by Water in the Tropics. Research Extension Series 024; 1982. Available online: http://pdf.usaid.gov/pdf_docs/Pnaar134.pdf (accessed on 13 March 2018).
  11. Zhang, L.; Wang, J.M.; Bai, Z.K.; Lv, C.J. Effects of vegetation on runoff and soil erosion on reclaimed land in an opencast coal-mine dump in a loess area. Catena 2015, 128, 44–53. [Google Scholar] [CrossRef]
  12. Dubey, A.; Nath, R. Erosion Problems of Mine Waste Dump Deposited During Opencast Mining Activity in Highland and Headwater Regions. In Proceedings of the 3rd International Symposium on Headwater Control, New Delhi, India, 6–8 October 1995; pp. 189–198. [Google Scholar]
  13. Matsumoto, S.; Shimada, H.; Sasaoka, T.; Kusuma, G.J.; Gautama, R.S. Construction of dry cover system for prevention of acid mine drainage at mine waste dump in open cast coal mines. J. Environ. Prot. 2016, 7, 160–169. [Google Scholar] [CrossRef]
  14. Matsumoto, S.; Ishimatsu, H.; Shimada, H.; Sasaoka, T.; Matsui, K.; Kusuma, G.J. Prevention of acid mine drainage (AMD) by using sulfur-bearing rocks for a cover layer in a dry cover system in view of the form of sulfur. J. Pol. Miner. Eng. Soc. 2015, 2, 29–35. [Google Scholar]
  15. Kusuma, G.J.; Shimada, H.; Sasaoka, T.; Matsui, K.; Nugraha, C.; Gautama, R.S.; Sulistianto, B. Physical and geochemical characteristics of coal mine overburden dump related to acid mine drainage generation. Mem. Fac. Eng. 2012, 72, 23–38. [Google Scholar]
  16. Gratchev, I.; Towhata, I. Stress-strain characteristics of two natural soils subjected to long-term acidic contamination. Soils Found. 2013, 53, 469–476. [Google Scholar] [CrossRef]
  17. Hasan, M.R.; Hasan, M.H.; Islam, M.R.; Razi, K.A.A.; Alam, S.; Abdullah, T. Changes in geotechnical properties of soil with pH in household and industrial waste dump site. Int. J. Appl. Sci. Eng. Res. 2013, 2, 119–127. [Google Scholar]
  18. Dimitrakopoulos, D.; Vasileiou, E.; Stathopoulos, N.; Dimitrakopoulou, S. Estimation of the Qualitative Characteristics of Post Mining Lakes in Different Lignite Fields in Greece. In Proceedings of the International Mine Water Association Symposium (IMWA) 2016, Freiberg, Germany, 11–15 July 2016; pp. 219–225. [Google Scholar]
  19. Tajnin, R.; Abdullah, T.; Rokonuzzaman, M.D. Study on the salinity and pH and its effect on geotechnical properties of soil in south-west region of Bangladesh. Int. J. Adv. Struct. Geotech. Eng. 2014, 3, 138–147. [Google Scholar]
  20. Matsumoto, S.; Ogata, S.; Shimada, H.; Sasaoka, T.; Kusuma, G.J.; Gautama, R.S. Application of coal ASH to postmine land for prevention of soil erosion in coal mine in Indonesia: Utilization of fly ash and bottom ASH. Adv. Mater. Sci. Eng. 2016, 2016, 8386598. [Google Scholar] [CrossRef]
  21. American Society for Testing and Materials (ASTM). Standard Test Methods for Liquid Limit, Plastic Limit, and Plasticity Index of Soils; ASTM D4318-17; ASTM International: West Conshohocken, PA, USA, 2017. [Google Scholar]
  22. American Society for Testing and Materials (ASTM). Standard Test Method for Particle-Size Analysis of Soils (Withdrawn 2016); ASTM D422-63(2007)e2; ASTM International: West Conshohocken, PA, USA, 2007. [Google Scholar]
  23. Hamanaka, A.; Inoue, N.; Shimada, H.; Sasaoka, T.; Matsui, K.; Miyajima, I. Study on backfilling of soil for revegetation at the rehabilitation area in Indonesian coal mine. In Mine Planning and Equipment Selection; Drebenstedt, C., Singhal, R., Eds.; Springer International Publishing: Cham, Switzerland, 2013; pp. 803–811. [Google Scholar]
  24. Annual Weather Review. 2011. Available online: http://www.nea.gov.sg/training-knowledge/publications/annual-weather-review-2011 (accessed on 29 January 2018).
  25. Hamanaka, A.; Shimada, H.; Sasaoka, T.; Matsui, K.; Miyajima, I.; Ichinose, M. Assessment of Soil Erosion at the Rehabilitation Area in Indonesian Coal Mine. In Proceedings of the Spring Annual Symposium on the Mining and Materials Processing, Tokyo, Japan, 28–30 March 2013; pp. 370–371. [Google Scholar]
  26. Dina, L. Analysis Finansial Jeruk Keprok di Kabupaten Kutai Timur (Prospect of Keprok Orange in Kutai Timur Regency). EPP 2009, 6, 36–43. Available online: http://agb.faperta.unmul.ac.id/wp-content/uploads/2017/04/jurnal-vol-6-no-1-dina.pdf (accessed on 29 January 2018).
  27. Shimada, H.; Matsumoto, S.; Hamanaka, A.; Sasaoka, T.; Kusuma, G.J. Effects of Acid Soil Properties on Soil Erosion at Dumping Site in Open-pit Coal Mine, Indonesia. In Proceedings of the 2nd International Symposium on Land Reclamation and Ecological Restoration, Beijing, China, 20–23 October 2017; pp. 239–244. [Google Scholar]
  28. White, W.A. Atterberg Plastic Limits of Clay Minerals. Report of Investigations—No. 144. 1949. Available online: http://www.minsocam.org/ammin/AM34/AM34_508.pdf (accessed on 29 January 2018).
  29. Cerqueira, A.A.; Marques, M.R.D.C. Electrolytic treatment of wastewater in the oil industry. In New Technologies in the Oil and Gas Industry; Gomes, J.S., Ed.; InTech Publisher: Rijeka, Croatia, 2012. [Google Scholar]
  30. Yukselen-aksoy, Y.; Kaya, A. The zeta potential of a mixed mineral clay in the presence of Cations. J. Eng. Earth Sci. 2016, 1, 14–21. [Google Scholar]
  31. Yong, R.N.; Warkentin, B.P. Introduction to Soil Behavior; The Macmillan Company: New York, NY, USA, 1966. [Google Scholar]
  32. Ritung, S.; Agus, F.; Hidayat, H. Land Suitability Evaluation with a Case Map of Aceh Barat District; Indonesian Soil Research Institute and World Agroforestry Center: Bogor, Indonesia, 2007. [Google Scholar]
  33. Singh, A.; Agrawal, M. Acid rain and its ecological consequences. J. Environ. Biol. 2008, 29, 15–24. [Google Scholar] [PubMed]
  34. Khemani, L.T.; Momin, G.A.; Rao, P.S.P.; Pillai, A.G.; Safai, P.D.; Mohan, K.; Rao, M.G. Atmospheric pollutants and their influence on acidification of rain water at an industrial location on the west coast of India. Atmos. Environ. 1994, 28, 3145–3154. [Google Scholar] [CrossRef]
  35. Zhang, D.D.; Peart, M.R.; Jim, C.Y. Alkaline rains on the Tibetan Plateau and their implication for the original pH of natural rainfall. J. Geophys. Res. 2002, 107, 9-1–9-6. [Google Scholar] [CrossRef]
  36. Khan, M.N.; Sarwar, A. Chemical composition of wet precipitation of air pollutants: A case study in Karachi, Pakistan. Atmosfera 2014, 27, 35–46. [Google Scholar] [CrossRef]
  37. Sumiran, S.G.; Abha, R.; Ranjit, K.; Pal, S.S.; Anita, L.; Maharaj, K.K.; Saran, S.S. Status of Acid Rain in India and Study on Rainwater Composition at Gopalpura (Agra); Bharatiya Vaigyanik evam Audyogik Anusandhan Patrika (BVAAP): New Delhi, India, 2000; pp. 15–22. [Google Scholar]
  38. Bartnik, A.; Moniewski, P. Changes in water quality of a small urban river triggered by deep drainage of a construction site. J. Water Land Dev. 2016, 31, 11–22. [Google Scholar] [CrossRef]
  39. Gomes, H.I.; Mayes, W.M.; Rogerson, M.; Stewart, D.I.; Burke, I.T. Alkaline residues and the environment: A review of impacts, management practices and opportunities. J. Clean. Prod. 2016, 112, 3571–3582. [Google Scholar] [CrossRef]
  40. Hull, S.L.; Oty, U.V.; Mayes, W.M. Rapid recovery of benthic invertebrates 8 downstream of hyperalkaline steel slag discharges. Hydrobiologia 2014, 736, 83–97. [Google Scholar] [CrossRef]
  41. Byerly, D.W. Handling acid-producing material during construction. Environ. Eng. Geosci. 1996, 2, 49–57. [Google Scholar] [CrossRef]
  42. Flues, M.; Hama, P.; Lemes, M.J.L.; Dantas, E.S.K.; Fornaro, A. Evaluation of the rainwater acidity of a rural region due to a coal-fired power plant in Brazil. Atmos. Environ. 2002, 36, 2397–2404. [Google Scholar] [CrossRef]
  43. Gasnari, B.P.; Ramesh, H. Assessment of soil erosion by RUSLE model using remote sensing and GIS—A case study of Nethravathi Basin. Geosci. Front. 2016, 7, 953–961. [Google Scholar]
  44. Sang, D.P.; Kyu, S.L.; Seung, S.S. A statistical soil erosion model for burnt mountain areas in Korea-RUSLE Approach. J. Hydrol. Eng. 2012, 17, 292–304. [Google Scholar]
  45. Prasannakumar, V.; Vijith, H.; Geetha, N. Estimation of soil erosion risk within a small mountainous sub-watershed in Kerala, India, using revised universal soil loss equation (RUSLE) and geoinformation technology. Geosci. Front. 2011, 3, 209–215. [Google Scholar] [CrossRef]
Figure 1. Schematic diagram of the artificial rainfall test [20,27].
Geosciences 08 00134 g001
Figure 2. X-ray diffraction (XRD) patterns of topsoil in the coal mine in Indonesia and simulated topsoil: M, I, K, Q, and A represent Montmorillonite, Illite, Kaolinite, Quartz, and Albite, respectively.
Geosciences 08 00134 g002
Figure 3. Change of LL, PL, IP at different pH values ranging from 2.0 to 10.0: (a) change of LL; (b) PL; (c) IP. At pH 2.0, the value indicated by white dots was calculated based on the average value, and that indicated by black dots was based on ideal value, according to the changing trends of PL and IP.
Geosciences 08 00134 g003
Figure 4. Particle size distribution at different pH values ranging from 2.0 to 10.0.
Geosciences 08 00134 g004
Figure 5. Solutions after adjusting solution pH at 2.0, 3.0, 4.0, 5.0, 6.0, 8.0, and 10.0.
Geosciences 08 00134 g005
Figure 6. Concentration of Al in solution after filtering with a 2 um filter at different pH values ranging from 2.0 to 10.0.
Geosciences 08 00134 g006
Figure 7. Zeta potential of the simulated soils at different pH value from 2.0 to 10.0.
Geosciences 08 00134 g007
Figure 8. Annual rate of soil water erosion at different pH values ranging from 2.0 to 10.0.
Geosciences 08 00134 g008
Figure 9. Summary of the effects of different pH conditions on the change of IP of the simulated soils.
Geosciences 08 00134 g009
Table 1. Soil texture of topsoil in A coal mine in Indonesia and the simulated soils [20].
SampleSand (%)Silt (%)Clay (%)Texture
Topsoil in A coal mines in Indonesia22.0–75.08.0–32.117.0–48.0Light Clay
Sandy Clay Loam
Heavy Clay
Simulated soils36.726.736.6Light Clay
Table 2. Chemical composition of the simulated soils.
Elements(mass %)Elements(mass %)
SiO269.43Na2O2.16
Al2O316.37K2O4.23
Fe2O33.59P2O50.09
MnO0.06H2O0.40
MgO1.46SO30.04
CaO1.58--

