Article

Probabilistic Estimates of Ground Motion in the Los Angeles Basin from Scenario Earthquakes on the San Andreas Fault

by
Ramses Mourhatch
and
Swaminathan Krishnan
*,‡
Mechanical and Civil Engineering Department, California Institute of Technology, Pasadena, CA 91125, USA
*
Author to whom correspondence should be addressed.
Current address: NASA Jet Propulsion Laboratory, Pasadena, CA 91109, USA
Current address: Arup, Los Angeles, CA 90066, USA
Geosciences 2018, 8(4), 126; https://doi.org/10.3390/geosciences8040126
Submission received: 28 December 2017 / Revised: 4 March 2018 / Accepted: 28 March 2018 / Published: 6 April 2018

Abstract

:
Kinematic source inversions of past earthquakes in the magnitude range of 6–8 are used to simulate 60 scenario earthquakes on the San Andreas fault. The unilateral rupture scenario earthquakes are hypothetically located at 6 locations spread out uniformly along the southern section of the fault, each associated with two hypocenters and rupture directions. Probabilities of occurrence over the next 30 years are assigned to each of these earthquakes by mapping the probabilities of 10,445 plausible earthquakes postulated for this section of the fault by the Uniform California Earthquake Rupture Forecast. Three-component broadband ground motion histories are computed at 636 sites in the greater Los Angeles metropolitan area by superposing short-period (0.2–2.0 s) empirical Green’s function synthetics on top of long-period (>2.0 s) spectral element synthetics. The earthquake probabilities and the computed ground motions are combined to develop probabilistic estimates of ground shaking in the region from San Andreas fault earthquakes over the next 30 years. The results could be useful in city planning, emergency management, and building code enhancement.

1. Introduction

The interactions of the north American and the Pacific tectonic plates across much of California have created a network of major and minor active faults in the proximity of major cities such as Los Angeles and San Francisco that are capable of generating earthquakes as large as M w 8.3 or so. Major north-south trending faults in the vicinity of Los Angeles include the San Andreas fault, the San Jacinto fault, the Elsinore fault, and the Newport Inglewood fault. East-west trending faults include the Santa Monica-Hollywood-Raymond fault, the Sierra Madre fault, and the Puente Hills blind-thrust fault. Other yet-to-be discovered blind-thrust faults may be present as well. The proximity of these faults to the Los Angeles metropolitan area, the existence of large number of tall steel structures in the region, and the unexpected brittle failures in several steel buildings during the 1994 Northridge earthquake have prompted several investigations of the performance of these types of buildings (mainly of the steel moment frame variety) under hypothetical earthquake scenarios (e.g., [1,2,3,4,5,6,7]). These studies have focused on one or two events and their effects on structures. While such studies are useful to gain insights into potential outcomes, they are rarely suitable for rational decision-making as such one-off hypothetical events cannot capture the totality of the seismic hazard at the site. Here, we attempt to address this problem for earthquakes on the San Andreas fault.
We select kinematic finite source inversions of past earthquakes on geometrically similar faults and map these onto multiple locations on the southern San Andreas fault. We allow these earthquakes to propagate in two alternate directions, north-to-south and south-to-north. Here, we will refer to these simulated earthquakes as “scenario earthquakes”. We simulate a total of 60 scenario earthquakes spread over a magnitude range of 6–8. For each scenario earthquake, we compute 3-component ground motion histories at 636 “analysis” or “target” sites on a 3.5 km grid in southern California using the spectral element method for the low frequencies (<0.5 Hz) and empirical Green’s functions for the high frequencies ( 0.5 5.0 Hz).
Rupture forecasts such as the Uniform California Earthquake Rupture Forecast (UCERF, [8,9]) combine data from several sources, including local earthquake catalogs, magnitude frequency distributions (usually derived using global earthquake catalogs), paleoseismic observations, and GPS measurements of tectonic movement, and rules about rupture propagation between faults to predict probabilities of all plausible earthquakes on known faults during a specified time interval. UCERF bases these probabilities on four modeling components: (i) a (fault) model of the physical geometry of known California faults; (ii) a deformation model of slip rates and related factors for each fault section; (iii) an earthquake rate model of the region; and (iv) a probability model. It hypothesizes hundreds of thousands of ruptures (referred to as “forecast earthquakes” in this article) on specific seismogenic locations of faults and provides yearly occurrence rates that are most consistent with observations. These rates are transformed to probabilities of occurrence assuming an underlying probability distribution such as the Poisson distribution. Methods to prune this exhaustive set of ruptures down to those that contribute significantly to the hazard at a given site have been under development [10,11]. Here, we describe a rational method to redistribute the UCERF3 forecast earthquake probabilities to the pre-determined (selected) set of scenario earthquakes. Combining the probability of occurrence of the scenario earthquakes with the predicted ground motions, we develop probabilistic estimates of ground shaking over the next 30 years in the Los Angeles basin from San Andreas fault earthquakes.
While the study is conceptually similar to the Southern California Earthquake Center’s CyberShake initiative, the following are critical differences in the methodology: (i) CyberShake utilizes pseudo-dynamic rupture models whereas our source models are kinematic source models of past earthquakes on geometrically similar faults with similar source mechanisms. (ii) The ground motions simulated as part of the last CyberShake release (V15.4) were limited in frequency to 1 Hz (Web Ref: CyberShake (https://scec.usc.edu/scecpedia/Comparison_of_CyberShake_Studies)) whereas the ground motions in this study contain frequencies up to 5 Hz. (iii) While CyberShake source locations and extents follow the UCERF rupture definitions in order to directly use the forecast probabilities therein requiring a far greater number of events (and intensive computational resources) to be simulated, this study describes a method to redistribute the UCERF earthquake probabilities over a smaller set of earthquake sources, significantly lowering the computational demands and making it possible to test and compare alternate approaches. We should also note that the scope of CyberShake is much broader with all known faults being considered, whereas our study is focused on the San Andreas fault.

2. Earthquake Source Models and Associated Probabilities

2.1. Source Models

The San Andreas fault is an almost vertically dipping (dip angle of 90 approximately) right-lateral strike slip fault (rake angle of 180 approximately) with an average seismogenic depth of 20 km approximately. The six earthquakes listed in Table 1, with magnitudes M w 6.0 (2004 Parkfield), 6.58 (1979 Imperial Valley), 6.92 (1995 Kobe), 7.28 (1992 Landers), 7.59 (1999 Izmit), and 7.89 (2002 Denali), occurred on faults that are geometrically similar to the San Andreas fault. It should be noted that except for the Kobe earthquake which is an inland crustal earthquake, all others occurred on plate boundaries. Kinematic finite source inversions of these events, developed by various research groups, are archived in the finite source rupture model database [12]. As evident from Table 1, their source mechanisms are similar to that of a typical earthquake on the San Andreas fault. Seismic source spectrum is closely related to fault geometry and rupture mechanism. Conforming the scenario earthquake source model geometry and rupture mechanism to those observed on the target fault may help produce source spectra that are more representative of earthquakes on the target fault(s). So, we select the source models of these earthquakes as seeds for the scenario earthquakes on the San Andreas fault.
The selected source models are used for both low- and high-frequency contents of the time-histories. The source modelers have made sure that the discretization in these models (Table 1) is sufficiently small to radiate seismic energy at 2 s and longer periods. However, we still have to ensure that these frequencies are coherently propagated to the target sites through the wave-speed model used for the ground motion simulation. Based on the average wave-speed of 3 km/s in the SCEC CVM-H 11.9.0 southern California model and an average rupture speed of 2.5 km/s in all of the source models, we estimate that resampling the source to a finer resolution of 0.5 km would ensure that a 2 s wave (and longer period waves) is reliably propagated to the target sites. This calculation is based on a simplified 1-D source idealization, in which the linear source rupture is divided into segments. The time interval between the wave arrivals at a station from slip on adjacent source segments dictates the shortest wavelength that can be realized at the station. The shorter the time interval, the shorter the wavelength and shorter the wave period. The fact that our source models are 2-D idealizations will only render this estimate conservative as the added discretization of the source along the depth dimension translates to more frequent wave arrivals (from the newly added subfaults along the depth direction) at the station. This, in turn, translates to shorter wavelengths and shorter wave periods being realized at the station. So, we resample each of the source models to a 0.5 km resolution, allocating to the resampled sub-faults the same slips as the original sub-faults (from the original model), and applying a Gaussian filter to marginally smoothen the slip distribution, with 98% of the slip in the original sub-fault being preserved within the resampled sub-faults.
Each of the resampled source models is mapped onto the San Andreas fault at 5 separate locations distributed along the southern section of the fault starting at Parkfield in central California and ending at Bombay Beach in southern California. Two alternate rupture propagation directions are considered at each location, north-to-south and south to north rupture. Figure 1a–j illustrate these mappings for the M w 7.9 scenario earthquake. A total of 60 scenario earthquakes (six magnitudes × five rupture locations × two rupture propagation directions) are simulated here to cover the broad range of potential San Andreas fault earthquakes that could be damaging to tall buildings in the greater Los Angeles region.

2.2. Scenario Earthquake Probabilities

The Uniform California Earthquake Rupture Forecast (UCERF, [8,9]) by the Working Group on California Earthquake Probabilities (WGCEP), a joint effort of the U.S. Geological Survey (USGS), the California Geological Survey (CGS), and the Southern California Earthquake Center (SCEC), postulates a large set of plausible earthquakes on Californian faults and estimates their annual rates of occurrence on the basis of geologic, geodetic, seismic, and paleoseismic data. All the mapped out faults in California are discretized into segments of 2 km to 13 km length. A plausible event (forecast earthquake) is a hypothetical earthquake that ruptures two or more of these segments. Annual rates of occurrence of all forecast earthquakes are estimated from a grand inversion of diverse datasets of measured fault slip-rates, creep rates, historical earthquake timelines from paleoseismic investigations, etc. The model and data uncertainties are accounted for by the use of a logic tree. The weighted average of the forecast earthquake rates from all branches of this logic tree are converted to time-independent probabilities of occurrence over the target time horizon by assuming a Poisson distribution [Note: in this study we use the latest version of UCERF (Version 3) which provides only the long-term time-independent earthquake rates at the present time].
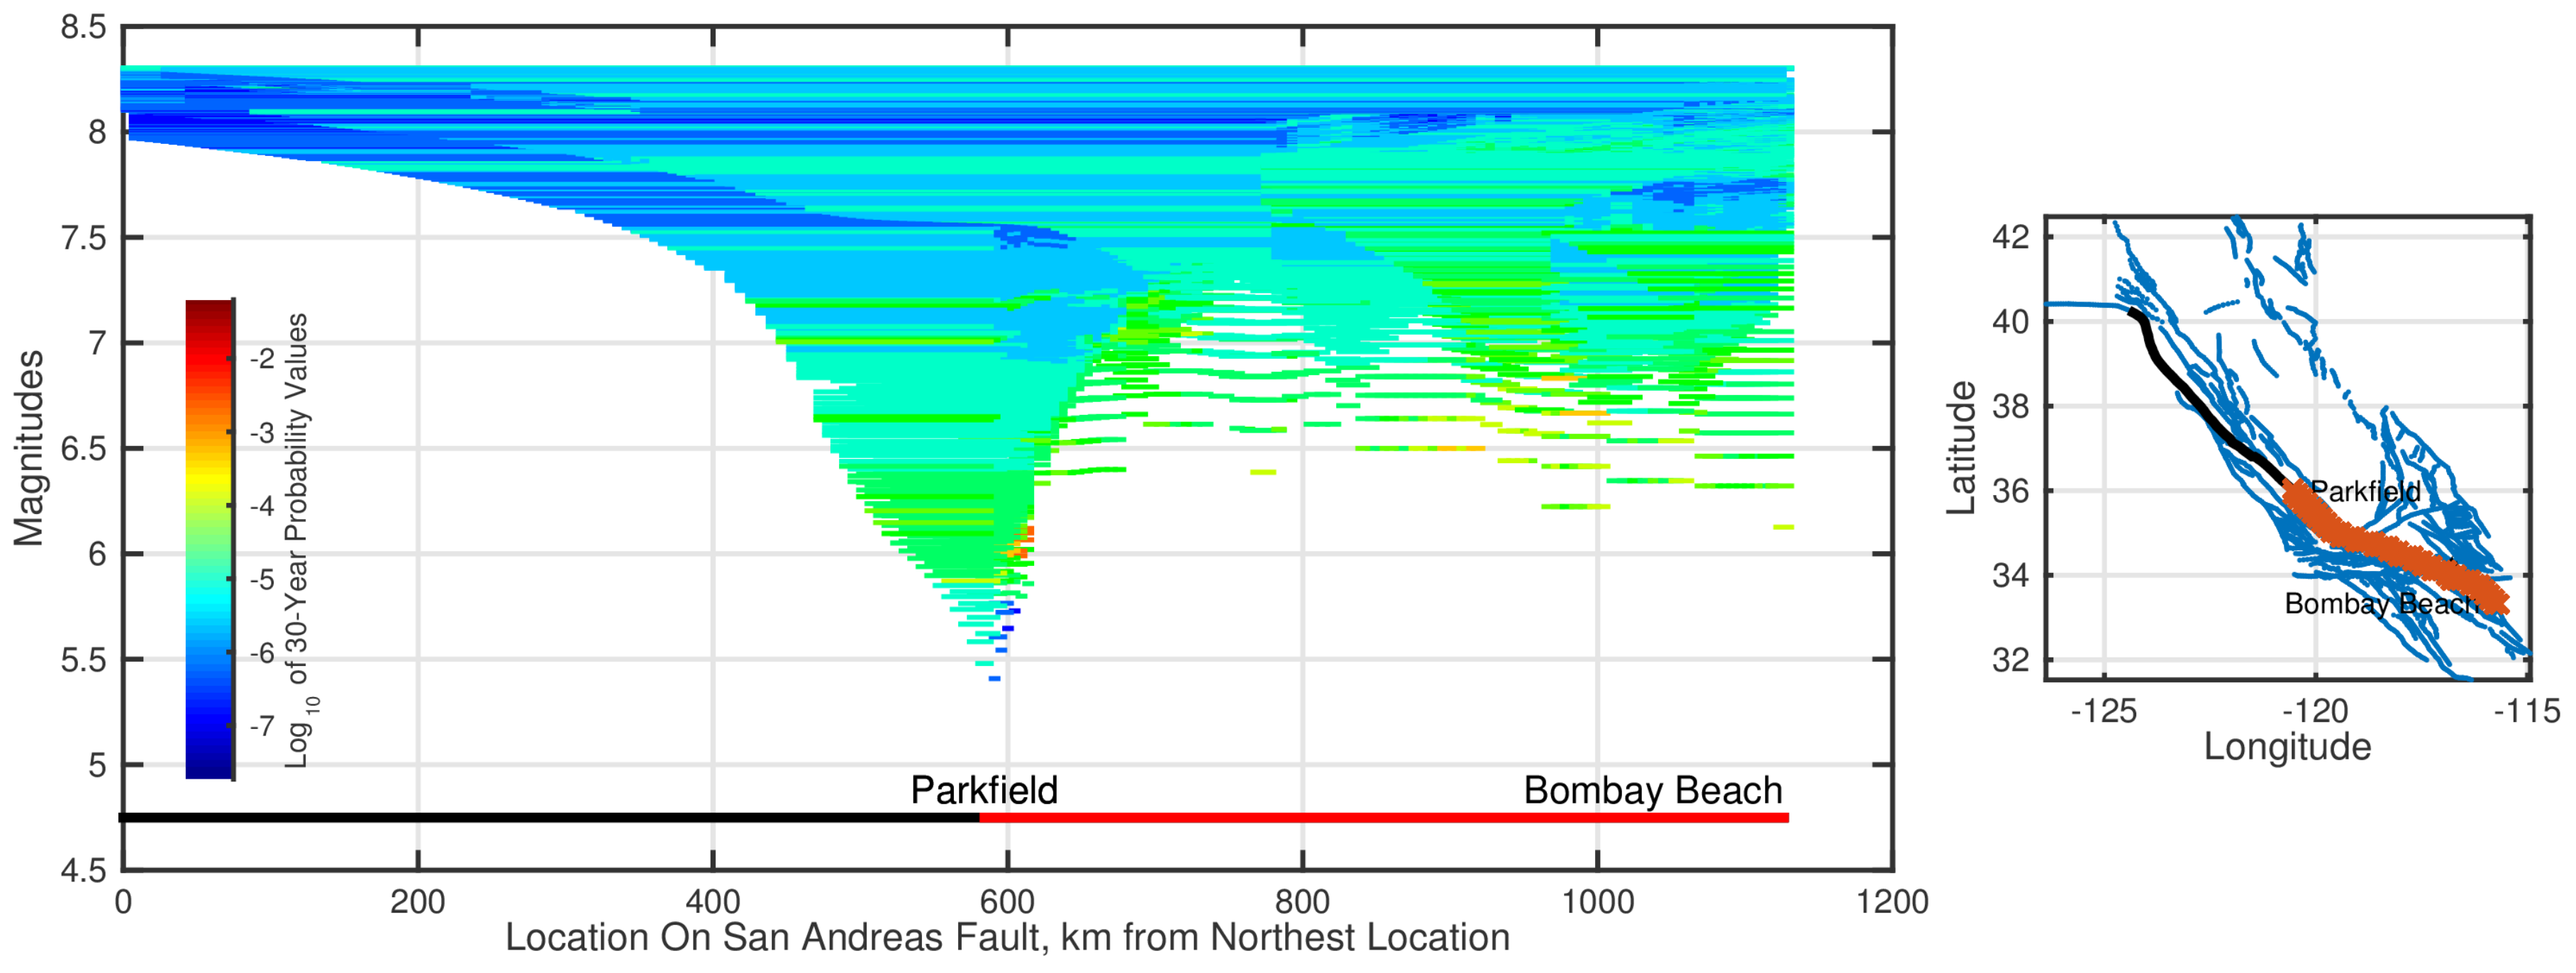
UCERF-3 postulates 10,445 physically plausible earthquakes (forecast earthquakes) on the southern portion of the San Andreas fault starting from Parkfield in central California to Bombay Beach in southern California (Figure 2). It should be noted that some of these have a near-zero probability of occurrence and their contribution to the hazard is negligible. To estimate scenario earthquake probabilities, all forecast earthquakes with magnitudes between 5.90 and 8.34 whose rupture extent occurs wholly or partially within the southern San Andreas fault are allocated to one of the following magnitude bins: [5.90–6.42], (6.42–6.80], (6.80–7.15] , (7.15–7.45], (7.47–7.78], and (7.78–8.34]. Note that the scenario earthquake magnitudes of 6.0, 6.58, 6.92, 7.28, and 7.59 correspond to centers of the first five magnitude bins based on seismic moment. The last bin is extended to a magnitude of 8.34 to include the probability of the largest plausible forecast earthquake. In the current risk framework, the forecast earthquakes in each magnitude bin will be represented by the ten scenario earthquakes (five rupture locations and two rupture directions) matches the bin’s central magnitude. Accordingly, the UCERF yearly rates of the forecast earthquakes in a given magnitude bin are redistributed among the ten scenario earthquakes representing that bin. This involves converting the forecast earthquake yearly rates to seismic moment rates (multiplying by the seismic moment corresponding to forecast earthquake magnitude), deaggregating the moment rates to the segments being ruptured, summing the moment rate contributions of all forecast earthquakes to each segment, assigning the total moment rate of each segment to the closest scenario earthquake, aggregating the moment rate contributions to each scenario earthquake, and converting the scenario earthquake moment rate to a yearly rate (dividing by the seismic moment corresponding to scenario earthquake magnitude). The scenario earthquake yearly rates are converted to 30-year occurrence probabilities using a Poisson distribution [ P ( M w / l o c ) = 1 e r Δ T , where r is the yearly rate and Δ T = 30 ]. The steps involved are as follows:
(i)
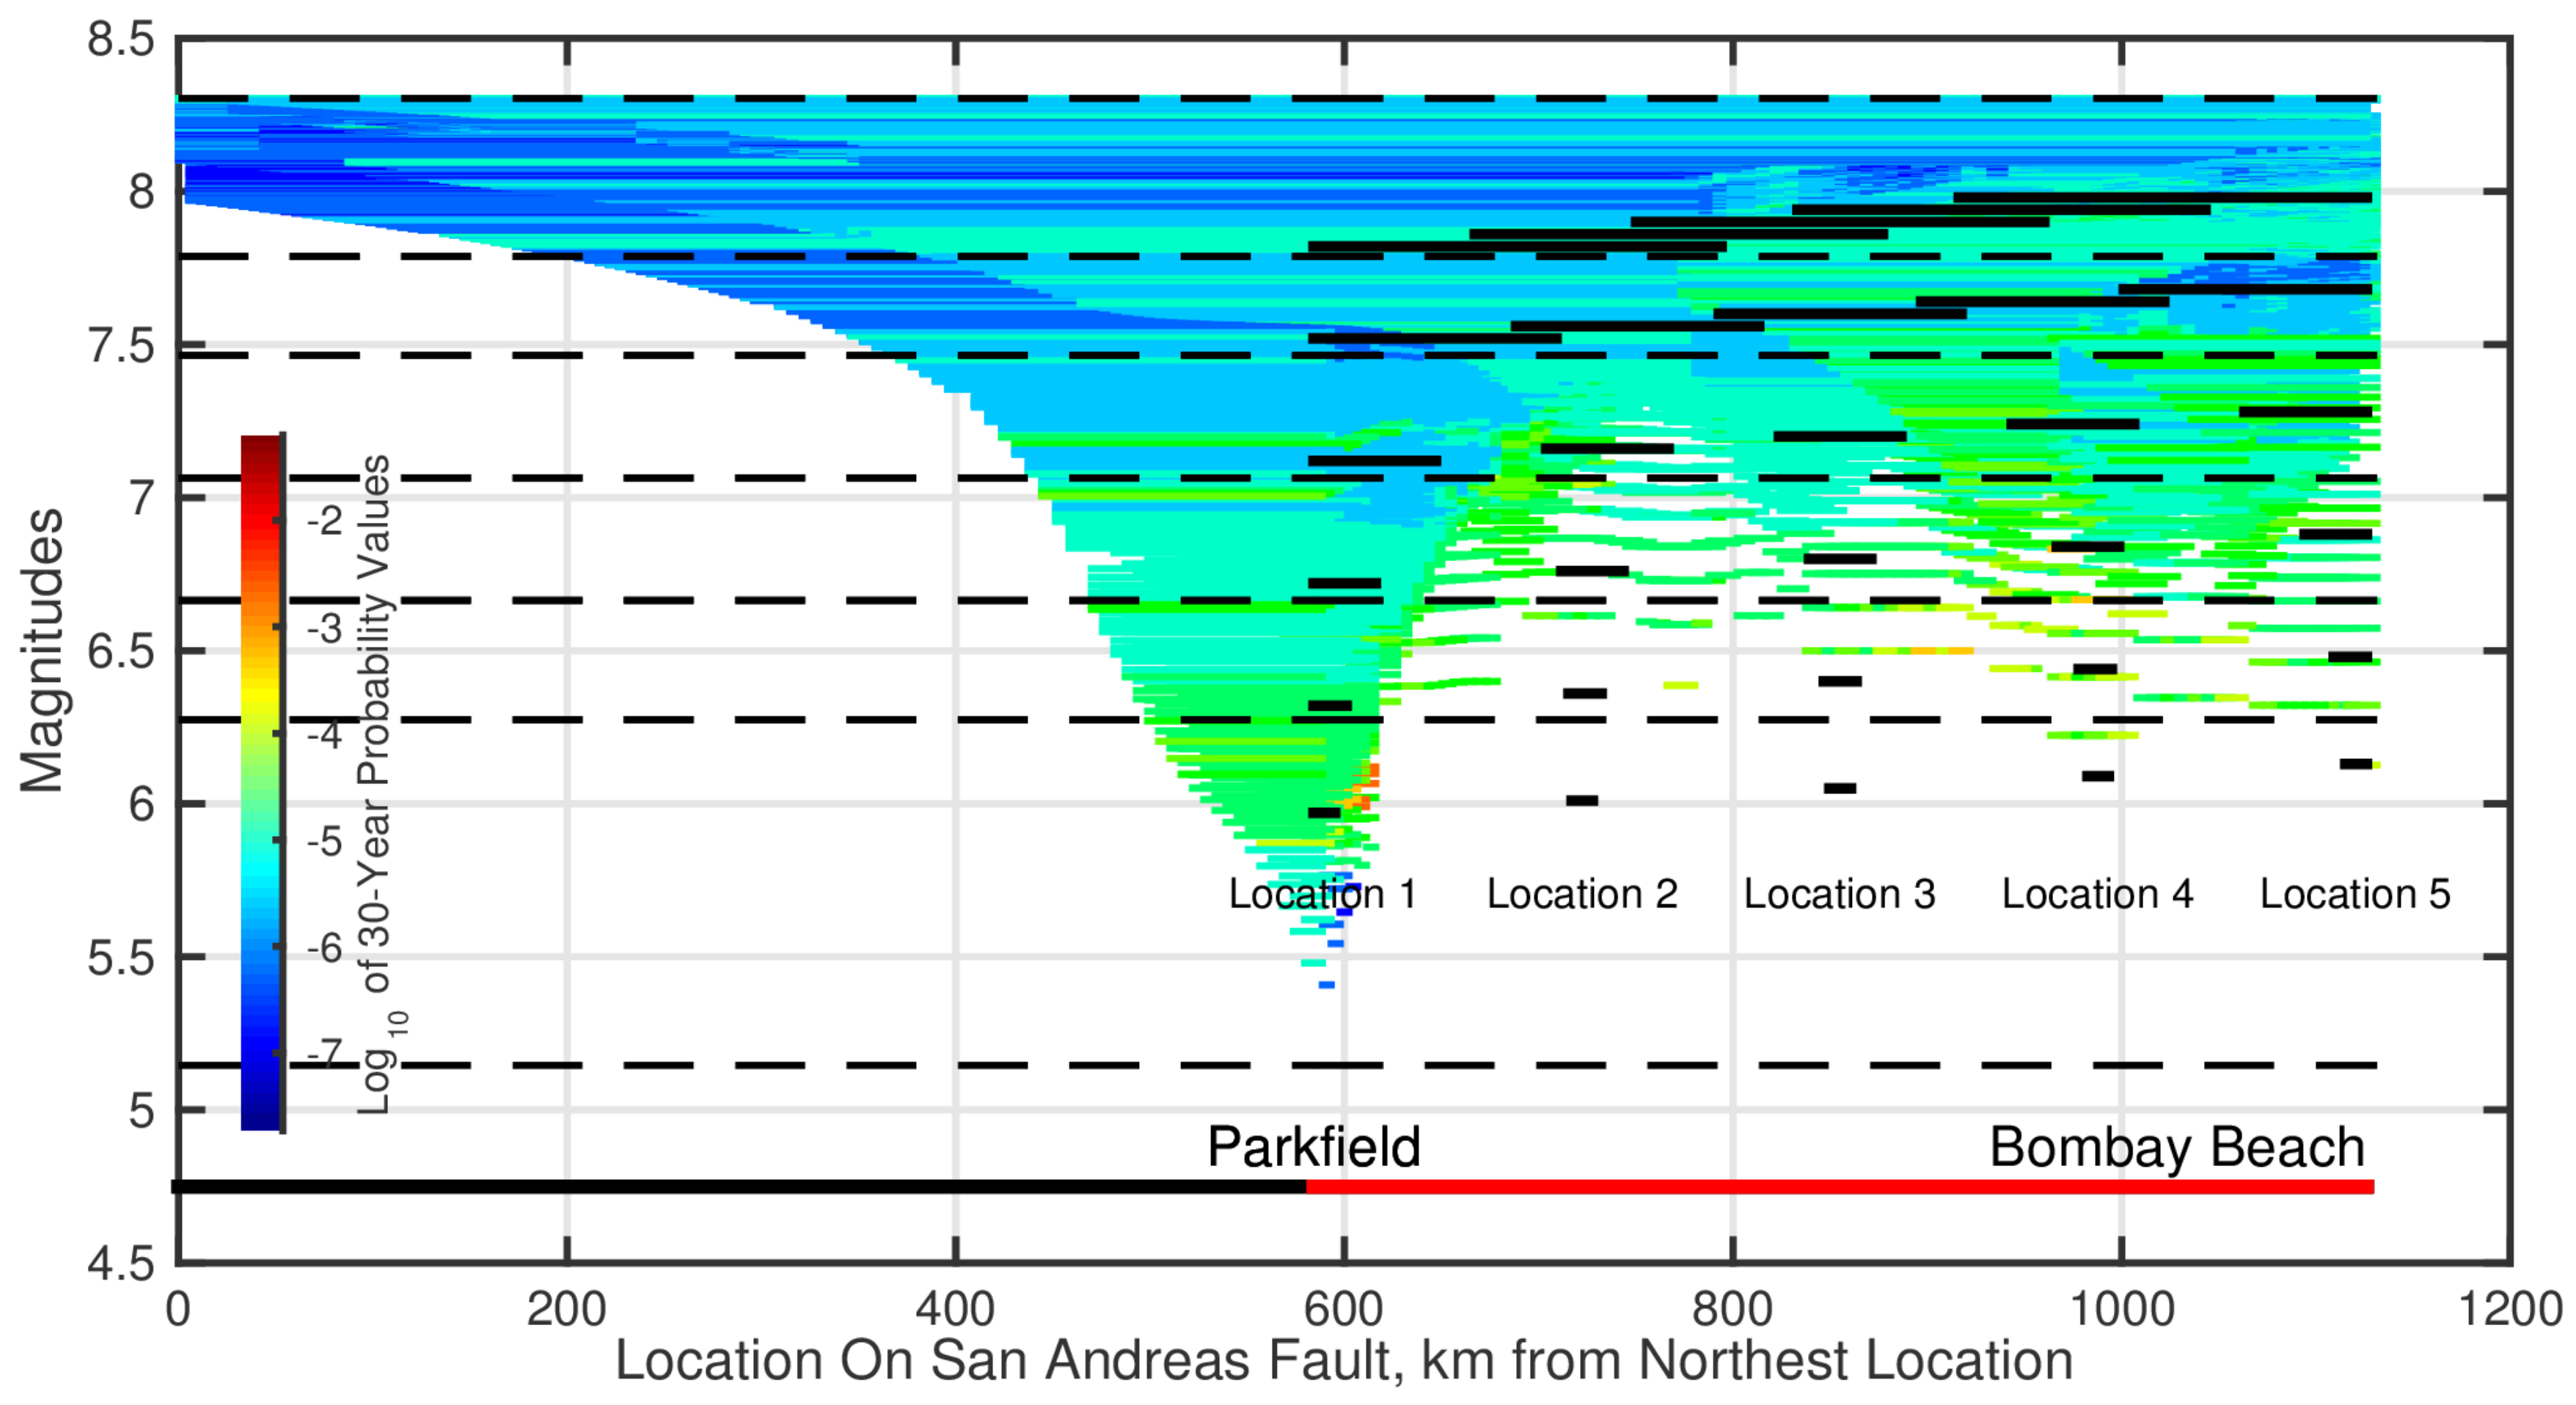
We start with “magnitude binning” of forecast earthquakes. We define as many bins as the number of distinct magnitude scenario earthquakes. The lower and upper magnitude limits of a magnitude bin are the magnitudes derived from the averages of the seismic moments of the corresponding scenario earthquake and the scenario earthquakes tied to the previous and next bins, respectively. Corresponding to the six scenario earthquake magnitudes of 6.00, 6.56, 6.92, 7.28, 7.59, and 7.89, the following six magnitude bins are defined: [5.90–6.42], (6.42–6.80], (6.80–7.15] , (7.15–7.45], (7.47–7.78], and (7.78–8.34]. The seismic moments of the M w 6.00, 6.56, 6.92, 7.28, 7.59, and 7.89 scenario earthquakes correspond to the average of the seismic moments of the upper and lower magnitude limits of the first five bins, respectively. The upper limit of the last bin is assumed higher to include all forecast earthquakes with magnitude greater than 7.89. Each of the forecast earthquakes will be assigned to one of these magnitude bins. For instance, a forecast earthquake with magnitude, say, between 6.42 and 6.80 will be assigned to the magnitude bin tied to the scenario earthquake with magnitude M w 6.56. Its probability of occurrence will be redistributed among the ten M w 6.56 scenario earthquakes (five rupture locations and two rupture directions). The dashed black lines in Figure 3 demarcate the magnitude bins.
(ii)
The seismic moment of forecast earthquake i, M o i , is multiplied by the UCERF yearly occurrence rate r i to arrive at what may be termed as the seismic moment release rate with a unit of “seismic moment/year”. Seismic moment release rates are determined for all forecast earthquakes in this manner.
(iii)
Within each magnitude bin, the seismic moment release rate of a forecast earthquake is distributed among the UCERF segments being ruptured by that forecast earthquake in proportion to their areas. This is based on the fact that seismic moment release rate, given by μ A D ˙ where D ˙ is the average slip rate on the fault, μ is the shear modulus, and A is the area of rupture, scales linearly with segment area (see Equation (4.8) and Appendix G of [19]). Thus the seismic moment release rate contribution of the i t h forecast earthquake to the j t h UCERF segment equals r i M o i A j A i , where A i is the area of forecast earthquake i and A j is the area of the UCERF segment j.
(iv)
Within each magnitude bin, the contributions to fault segment j of all N forecast earthquakes in that bin are summed: i = 1 N r i M o i A j A i . This represents the yearly seismic moment buildup in segment j that is expected to be released periodically by earthquakes with magnitudes lying within the bin. It may be termed as the seismic moment release rate for segment j in earthquakes from that magnitude bin.
(v)
Within each magnitude bin, the cumulative seismic moment release rate of segment j, determined in the previous step, is assigned to the scenario earthquake tied to that bin and whose rupture location is closest to segment j. Then the seismic moment release rate of that scenario earthquake is given by j = 1 M i = 1 N r i M o i A j A i , where M is the number of UCERF segments occurring within the rupture extent of that scenario earthquake. It is possible that the rupture extents of two or more scenario earthquakes may extend over the same fault segment(s). The moment release rates on such segments are evenly distributed among the overlapping scenario earthquakes.
(vi)
The seismic moment release rate, obtained from the last step, for scenario earthquake k is divided by its seismic moment M o S E k to obtain its yearly occurrence rate q k = j = 1 M i = 1 N r i M o i A j A i / M o S E k .
(vii)
The probability of occurrence of scenario earthquake k over a period of Δ T years is then given by the Poisson distribution as: P ( S E k ) = 1 e q k Δ T .
(viii)
Steps (iii)–(vii) are repeated for all magnitude bins and the scenario earthquakes associated with them.
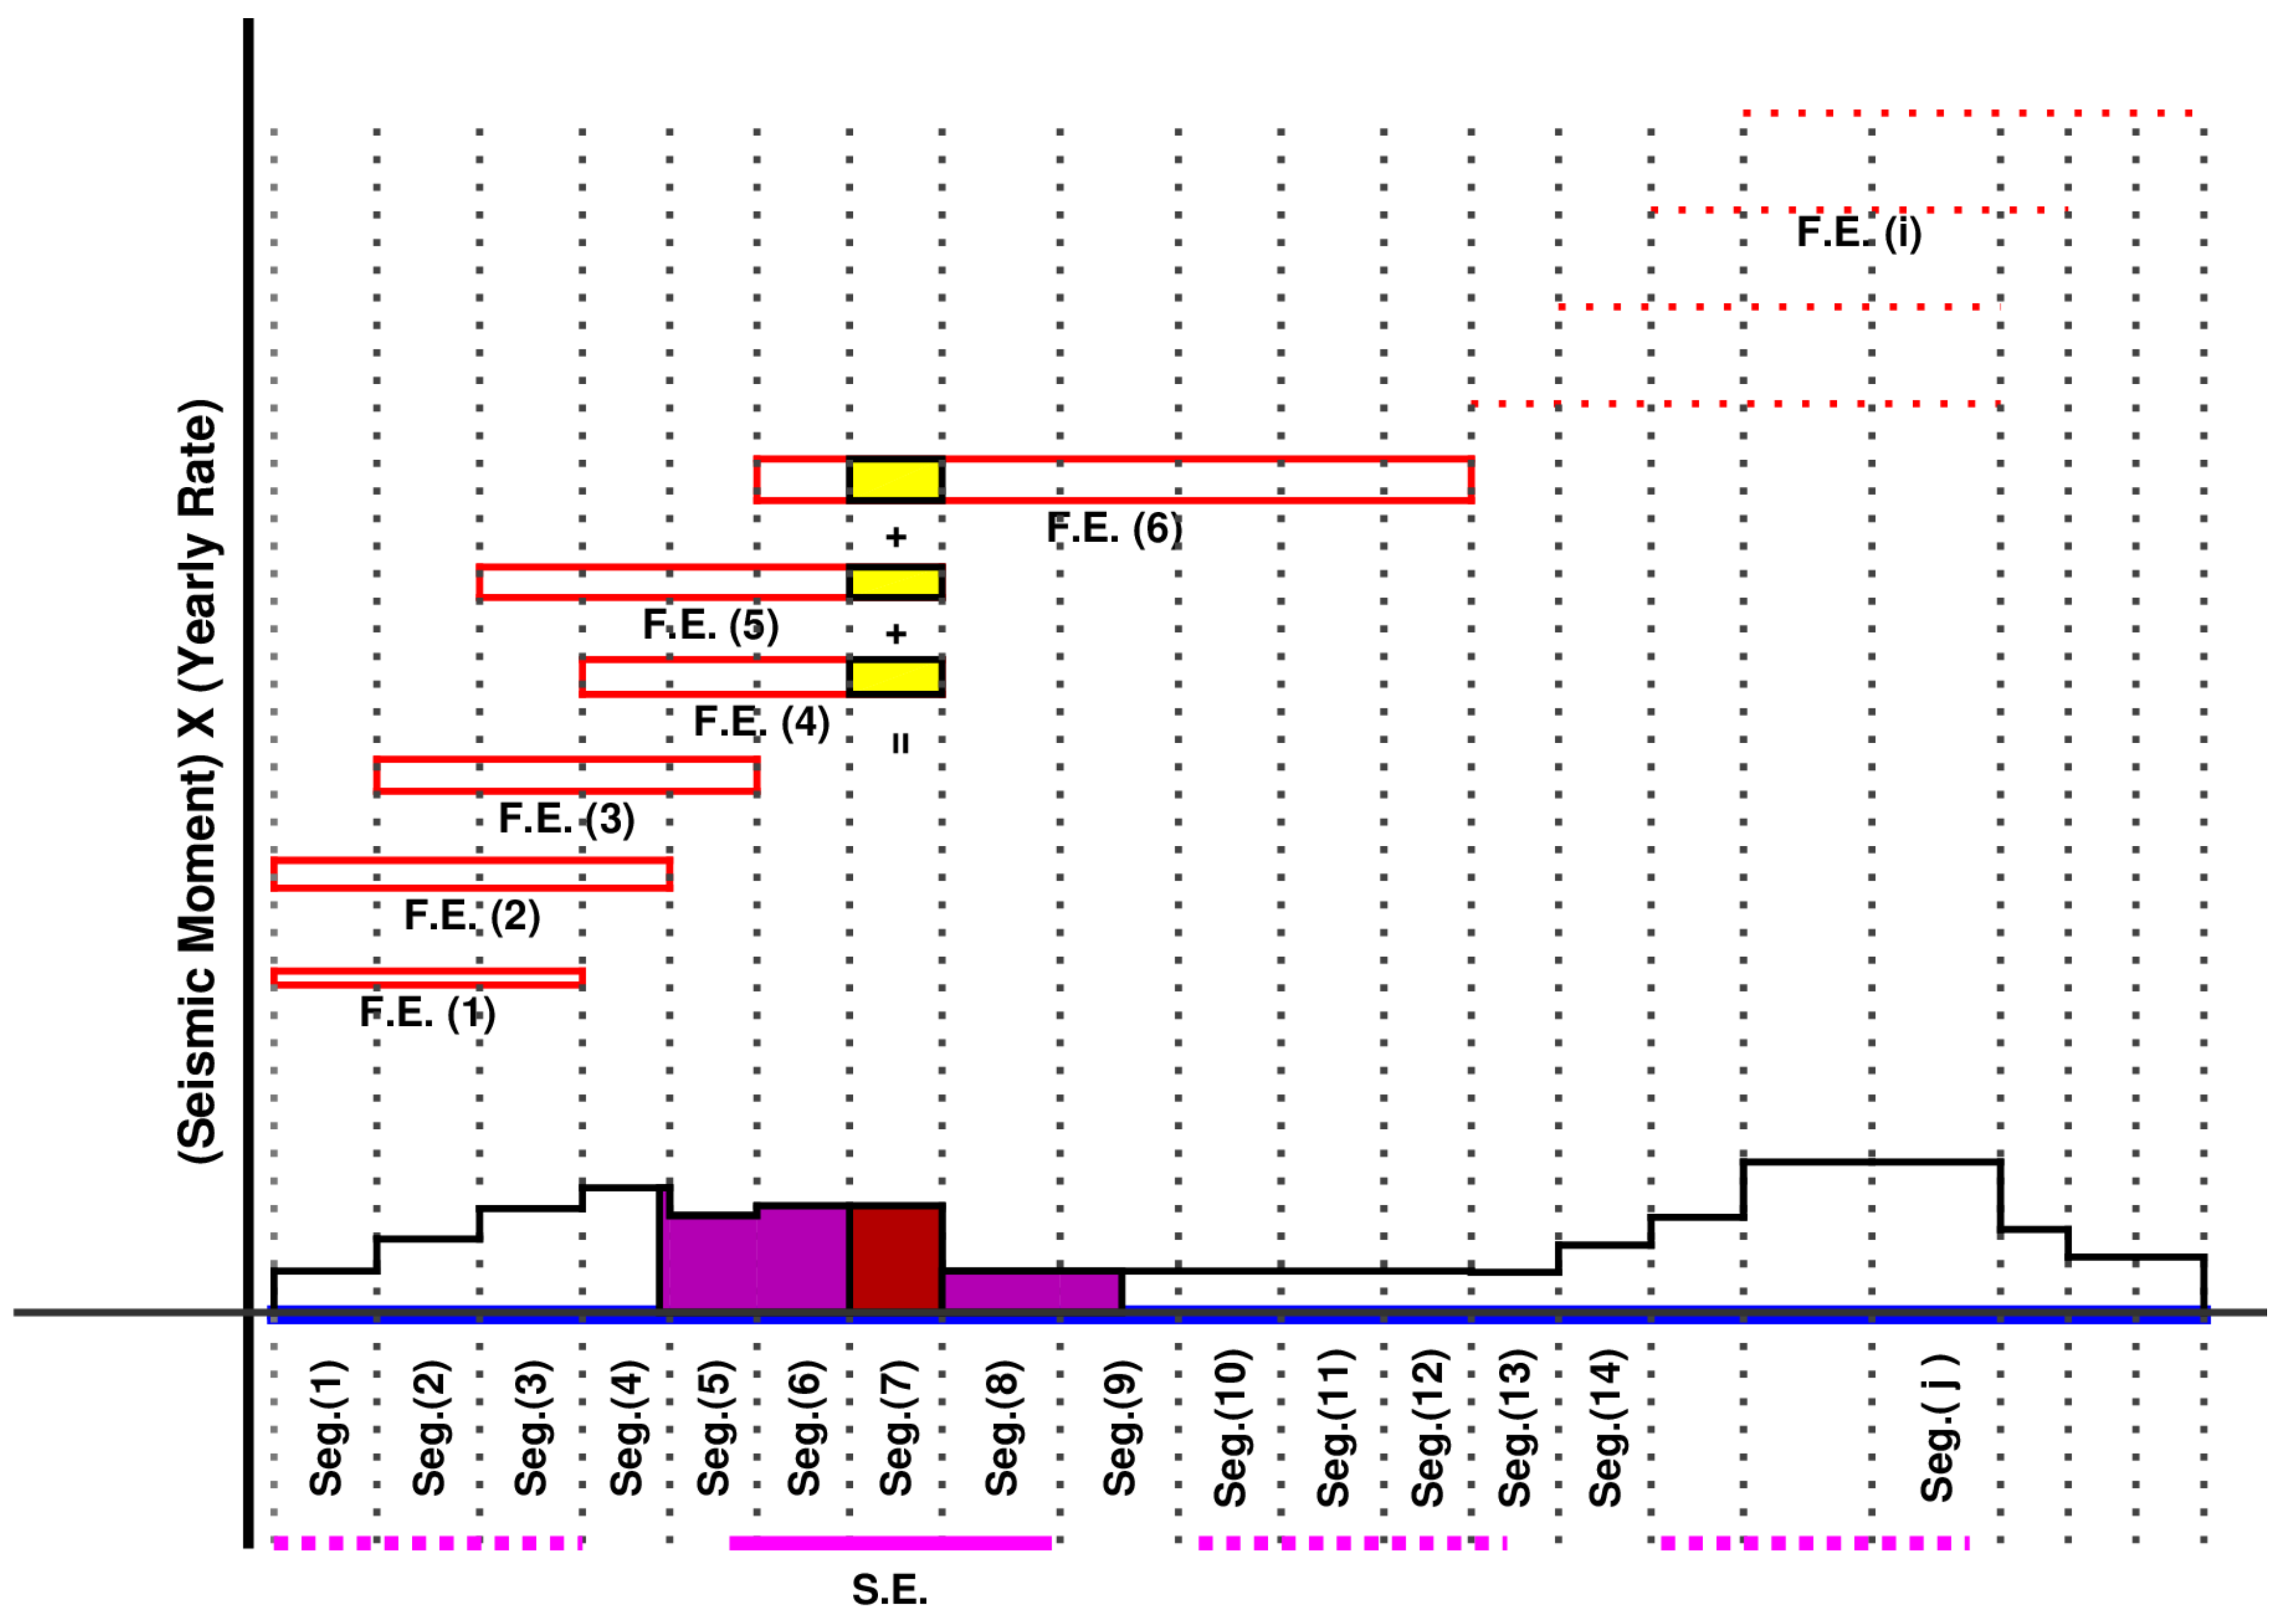
Figure 4 graphically illustrates the results the various steps of the method applied to a hypothetical fault. The horizontal blue line represents the section of the target fault of interest. For the case study this line would represent the southern portion of the San Andreas fault. The dotted black lines show the segmentation (labeled “Seg.”) of the target fault, say from UCERF. The red unfilled rectangles represent forecast earthquakes (labeled “F.E.”). The heights of the rectangles are proportional to the seismic moment release rates of forecast earthquakes (computed in step ii). The yellow shaded regions represent the seismic moment release rate contributions of several forecast earthquakes to a given UCERF segment (computed in step iii). The red shaded region represents their summation (step iv). The magenta colored region represents the sum of all seismic moment release rates for a scenario earthquake determined by summing the moment release rates of all the UCERF segments within the extent of the scenario earthquake rupture (step v). Magenta lines at the very bottom of the figure show scenario earthquake (labeled “S.E.”) rupture extent.
Shown in Table 2 are the 30-year occurrence probabilities of the 30 scenario earthquakes (six earthquake magnitudes and five rupture locations) determined using this approach. Half of these probabilities are assigned to north-to-south propagating ruptures and the other half to south-to-north propagating ruptures. It should be noted that these probabilities are time-independent and should be treated as probabilities of occurrence in any given 30-year period, not just the next 30 years. Furthermore, based on stress renewal models and elastic rebound theory, the occurrence of any of these events will significantly alter the probabilities in this table. This table is valid only up until the next big event occurs. It should not be used for estimating the joint probability distribution of the random variables, magnitude and location, that would cover all time and locations, and would sum up to unity. It applies to a 30-year period (does not cover all time), does not consider all values of the two random variables, and the total probability does not sum to unity. To ensure that the arithmetic of the outlined method is correct, we compare these values against probabilities derived from event return rates found in literature. The return period for a large magnitude 1857 Fort Tejon-like earthquake ( M w 7.89) is around 150–300 years [20]. Taking the yearly rate (1/225) implied by an average return period of 225 years, its 30-year probability of occurrence may be computed as 1 e ( 1 / 225 ) × 30 = 0.125 , which is close to the total probability value of 0.123 for the (7.78–8.34] magnitude bin in our case study. The return period for the magnitude 6 Parkfield earthquake is about 22 years [21]. The 30-year probability of occurrence (independent of the 2004 event) may be evaluated to be 1 e ( 1 / 22 ) × 30 = 0.74 , which is reasonably close to the total probability value of 0.81 for the [5.90–6.42] magnitude bin in our case study.

3. Ground Motion Simulation

In addition to a mathematical description of the earthquake source, a detailed mapping of the earth’s density and elasticity structure is needed to characterize the seismic wave speeds in the region, allowing for the deterministic simulation of site-specific ground motions. The spatial resolution of this mapping dictates the limiting wavelength (and frequency) of the seismic waves that can be reliably propagated through a finite-element/finite-difference/spectral-element model of the earth; the higher the resolution, the shorter the limiting wavelength and the higher the limiting frequency. Two regional wave-speed models of southern California exist, both developed and maintained by the Southern California Earthquake Center (SCEC): (i) the SCEC Community Velocity Model (CVM, [22,23,24]), and (ii) the SCEC-CVM-Harvard or SCEC-CVMH [25,26,27,28,29,30]. Both models are capable of propagating seismic waves with frequencies at least up to 0.5 Hz and have been used in long-period ground motion simulations in the Los Angeles and surrounding basins (for e.g., [1,31,32,33,34,35,36,37,38], etc.). To synthesize the higher frequencies (above 0.5 Hz) in the ground motion, stochastic (e.g., [39,40]) and empirical (e.g., [41]) methods have been developed. Broadband ground motion is produced by combining these with the deterministic low-frequency ground motion from finite-element, finite-difference, or spectral-element simulations.
Here, we follow the [41] methodology to produce broadband ground motions with frequencies up to 5 Hz. High-frequency seismograms generated using a variant of the classical empirical Green’s function (EGF) approach of summing recorded seismograms from small historical earthquakes (with suitable time shifts) are combined with low-frequency seismograms produced using the open-source seismic wave propagation package SPECFEM3D (V2.0 SESAME, [28,35,42,43]) that implements the spectral-element method. SESAME uses Version 11.9 of the SCEC-CVMH seismic wave-speed model, accounting for 3-D variations of seismic wave speeds, densities, topography, bathymetry, and attenuation. The SCEC-CVMH model incorporates tens of thousands of direct velocity measurements that describe the Los Angeles basin and other structures in southern California [25,30]. It includes background crustal tomography down to a depth of 35 km [44,45] enhanced using 3-D adjoint waveform methods [27], the Moho surface [30], and upper mantle teleseismic and surface wave-speed models extending down to a depth of 300 km [26]. The wave-speed model-compatible spectral element mesh of the Southern California region was developed by [46], who adapted the unstructured mesher CUBIT [47] into GeoCUBIT for large-scale geological applications such as this.
The classical empirical Green’s function (EGF) approach involves the use of aftershock earthquake records as the Green’s functions sampling the travel paths from the source to those stations [48,49,50,51,52,53,54,55,56,57,58]. The rupture plane of an event is divided into (uniform or non-uniform) sub-faults. A pre-selected Green’s function (selected on the basis of the closest match to the subfault-to-target site path) is used to represent the seismic wave radiated from a given sub-fault. The EGFs are selected from a pool of thousands of low-magnitude historic events ( M w 2.5–4.5) that have occurred in the vicinity of the San Andreas fault over the past few decades. Selection was based on signal quality and the scanning of the hundreds of thousands of records was automated. The Green’s functions from all sub-faults are time-shifted and summed to yield the ground shaking at a target site. The key challenge in this approach is that it is difficult to replicate Brune’s spectrum [59] in both the high- and low-frequency regimes simultaneously. Scaling based on seismic moments, where the total seismic moment of the EGFs matches that of the simulated event, will correctly reproduce the low-frequency content of the ground motion. On the other hand, scaling based on areas, where the total area of the EGFs matches that of the simulated event, will correctly reproduce the high-frequency content [51,52]. Ref. [41] was recently successful in developing a variant of the EGF summation that allows for the simulation of high-frequency ground motion (0.5–5.0 Hz) without the use of any artificial filters to achieve agreement with Brune’s spectrum. Because energy release from an EGF is typically much smaller than the moment release associated with slip on a single subfault, the EGF has to be summed several times to match the moment release on the subfault. Furthermore, the duration over which EGF energy release occurs must equal the duration of slip on the subfault, i.e., the EGF energy release must occur over the duration of the source-time function. To achieve this, the EGFs have to be time-shifted and summed. Ref. [41] adopts a non-uniform temporal distribution of EGFs over the source time function of each subfault. This temporal distribution of time shifts is sparse at the start and end of the rupture of that subfault and dense in between. He used low-magnitude ( M w 2.5–4.5) earthquakes as EGFs and combined the high-frequency waveforms generated using this approach with low-frequency waveforms from the deterministic spectral element approach (lowpass-filtered using a second order Butterworth filter with corner at 0.5 Hz) to reproduce ground motions at large distances under the M w 6.0 Parkfield and the M w 7.1 Hector Mine earthquakes. We use this hybrid approach to simulate ground motions at the 636 greater Los Angeles sites from the 60 scenario earthquakes on the San Andreas fault.
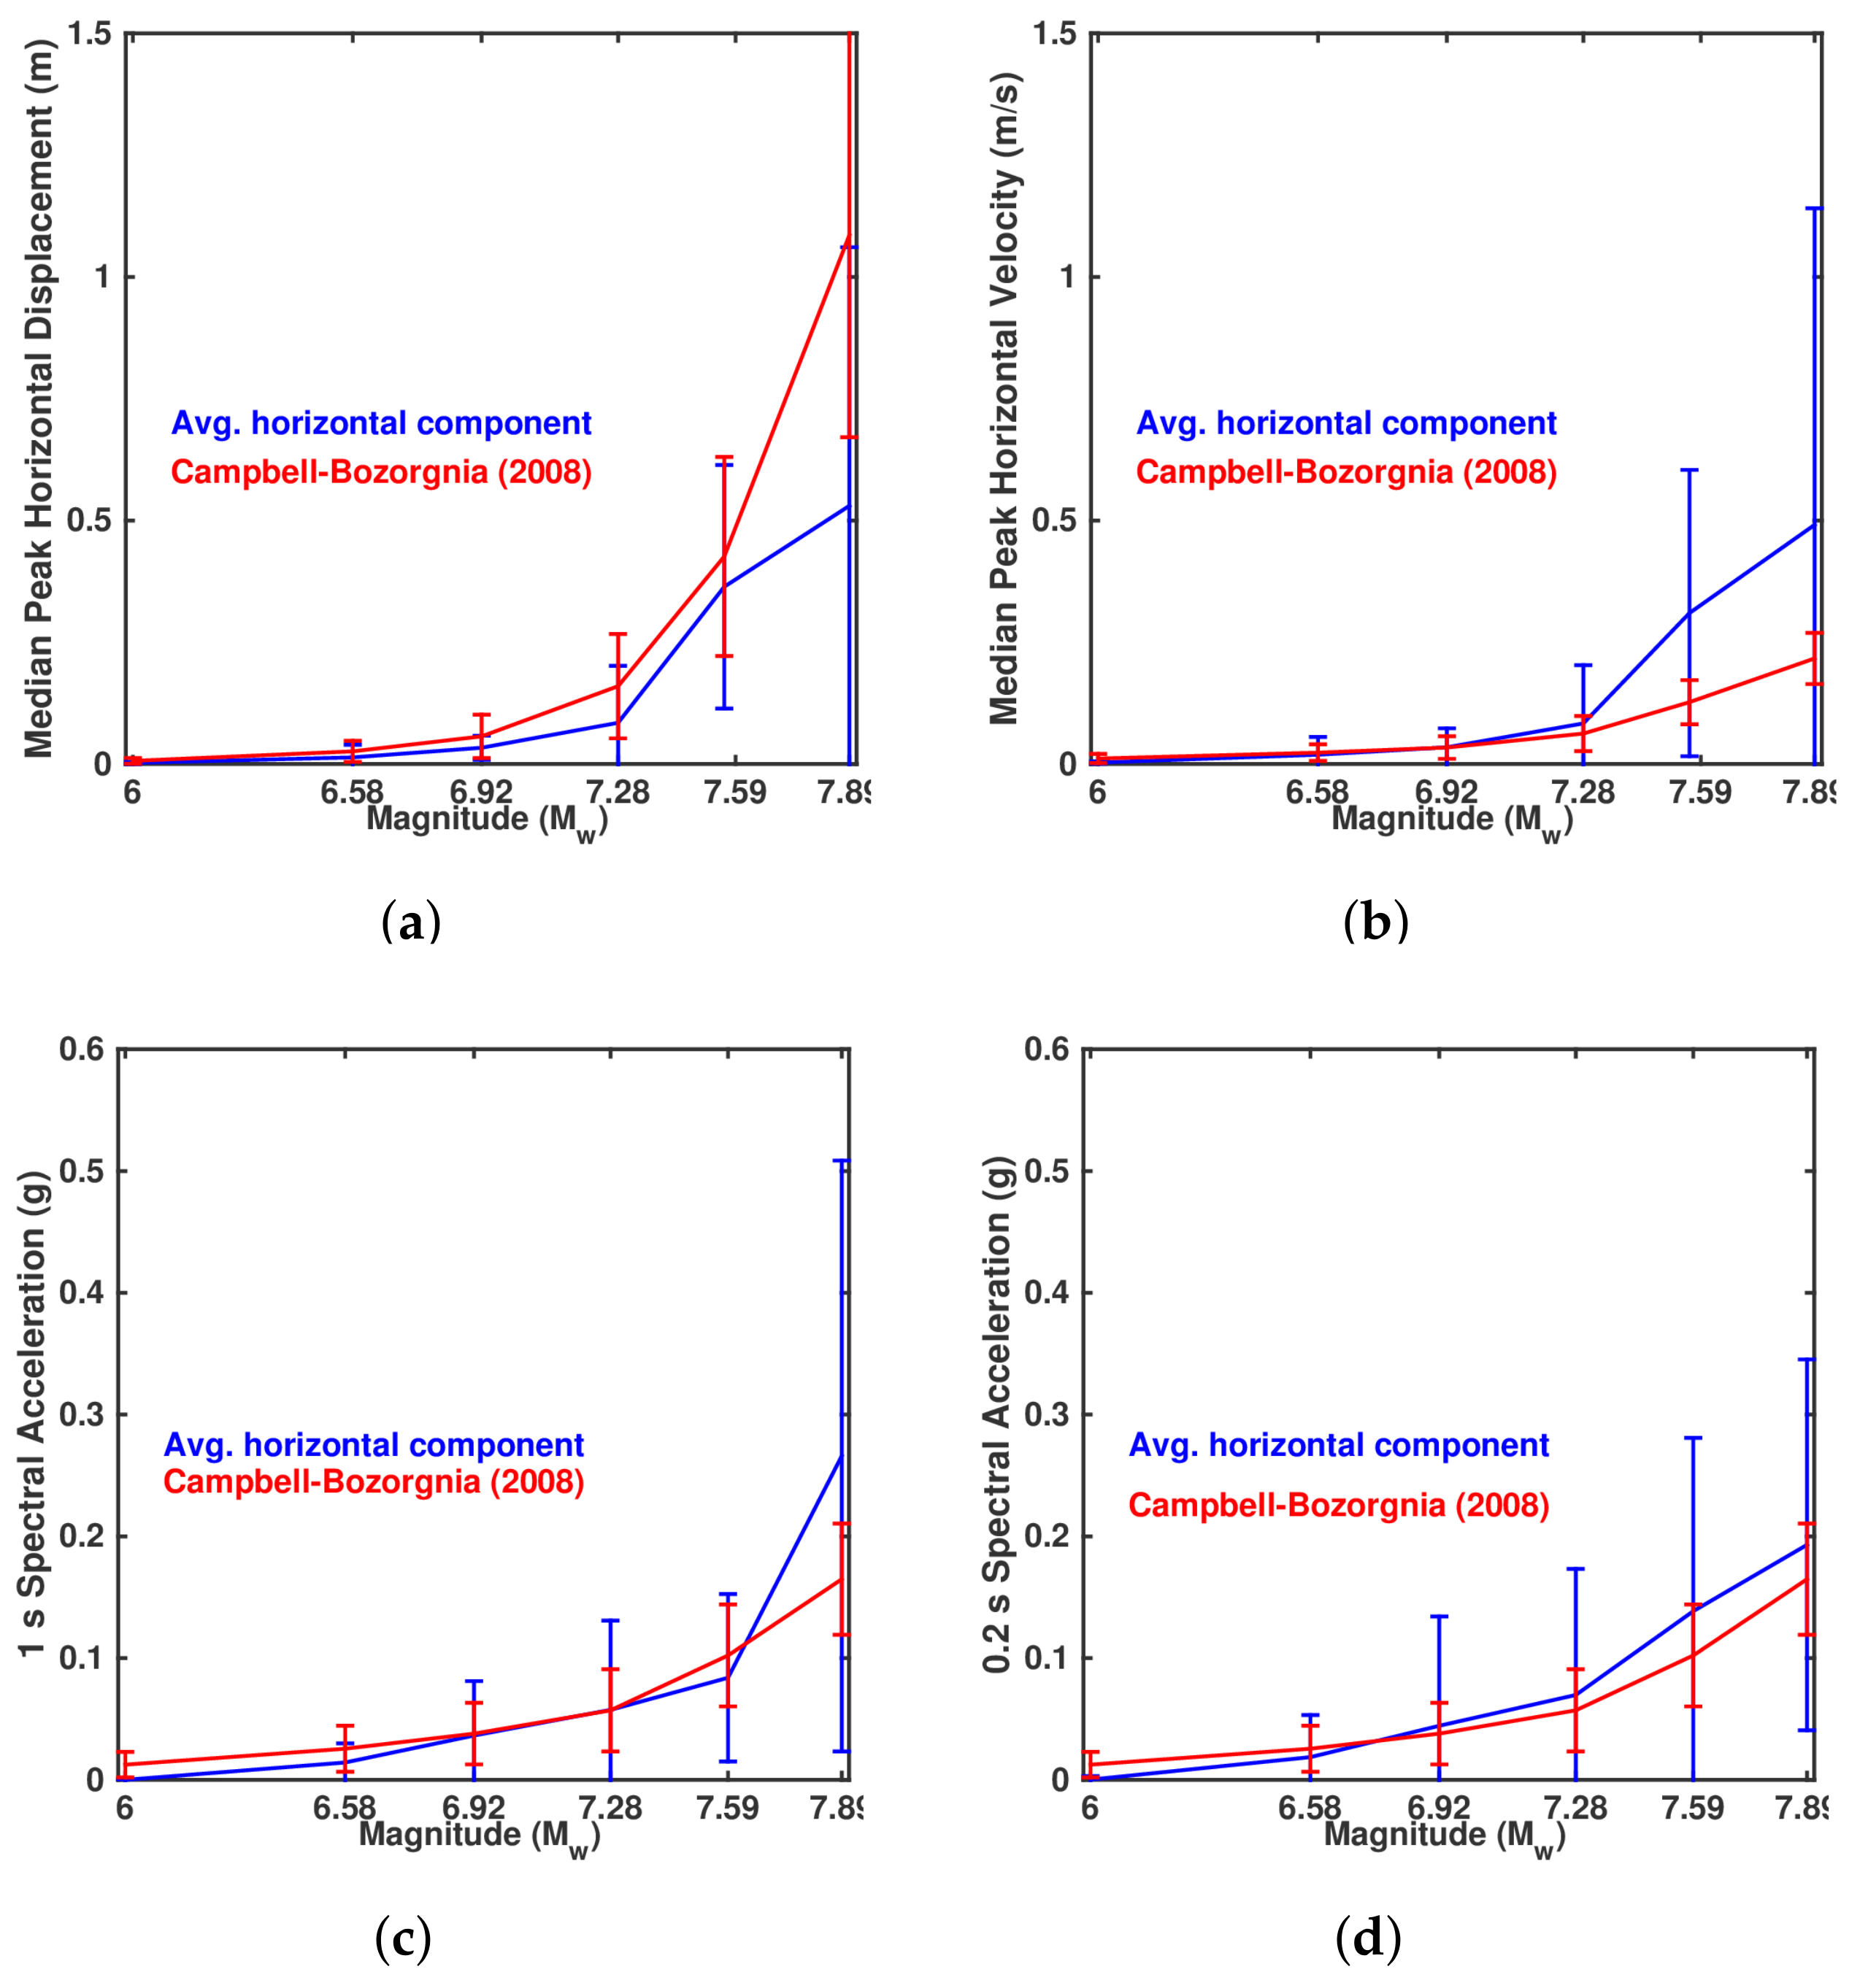
Figure 5 shows the median values of three commonly used ground shaking intensities, peak horizontal displacement, peak horizontal velocity, and 5%-damped spectral acceleration S a at 1 s and 0.2 s periods, for the ten ruptures corresponding to each magnitude level of the scenario earthquakes (see the blue lines). The vertical bars show the one standard deviation spread of the data on either side of the median correspond to median. Also shown for comparison are the corresponding values determined using the Campbell-Bozorgnia (CB-08) Next Generation Attenuation (NGA) relation [60]. The soil properties for the 636 sites, as characterized by the V S 30 values from [61], the basin depths from the SCEC-CVMH model [30], and the Joyner-Boore distance, defined as the shortest distance from a site to the surface projection of the rupture plane, are used as inputs for the NGA computation. The choice of CB-08 over NGA-West2 was driven by the fact that NGA-West2 excludes peak ground displacements (PGD) due to its sensitivity to frequency-filtering parameters and record processing [62]. Large earthquakes generate long-period ground motion that is characterized by large PGDs and it is important to compare our simulations against those predicted by the GMPEs, especially when considering the implications for long-period structures such as tall buildings.
There is good agreement between simulations and CB-08 in the peak velocity and displacement intensity measures for the lower magnitude earthquakes (up to 6.92). For the larger earthquakes, the simulations predict larger peak horizontal velocities (and much larger variances as well), whereas CB-08 predicts higher peak ground displacements (with comparable variances). CB-08 relies on observed near-field permanent displacements to constrain the PGD attenuation relation. The large permanent ground displacements (up to 9 m) observed during the magnitude 7.6 Chi-Chi earthquake of 1999, one of the few large magnitude earthquakes for which seismic, geologic, and geodetic near-source data is available, may have a strong influence on the PGD attenuation relation. On the other hand, CB-08 relies on seismic data alone for the PGV relation. Unfortunately, there is a sparsity of records from large magnitude earthquakes, especially in deep sedimentary basins such as the Los Angeles basin. This may, in part, explain the differences between the predictions by the simulations and the attenuation relations.
The median values of 1 s S a predicted by CB-08 are higher for the magnitude 6.00 and 6.58 earthquakes, about the same for the magnitude 6.92, 7.28, and 7.59 earthquakes, and significantly lower for the magnitude 7.89 earthquakes, when compared against the those predicted by the simulations. CB-08 predictions for 0.2 s S a are higher for the lower magnitude 6.00 and 6.58 earthquakes, but lower for the higher magnitude 6.92, 7.28, 7.59, and 7.89 earthquakes. We should note that the low-magnitude events ( M w 2.5–4.5) used as EGFs are generally deficient in the higher frequencies (higher than about 5 Hz) due to attenuation. Thus, there is a natural tendency for the synthetic ground motions from the hybrid approach to be somewhat deficient in these higher frequencies. Additionally, the two-pass Butterworth filter used in filtering out the higher frequency ground motions has a corner at 0.2 s or 5 Hz. Ground motion intensities fall off smoothly with increasing frequency beyond this filter corner frequency and the values for 0.2 s S a are probably further under-estimated.
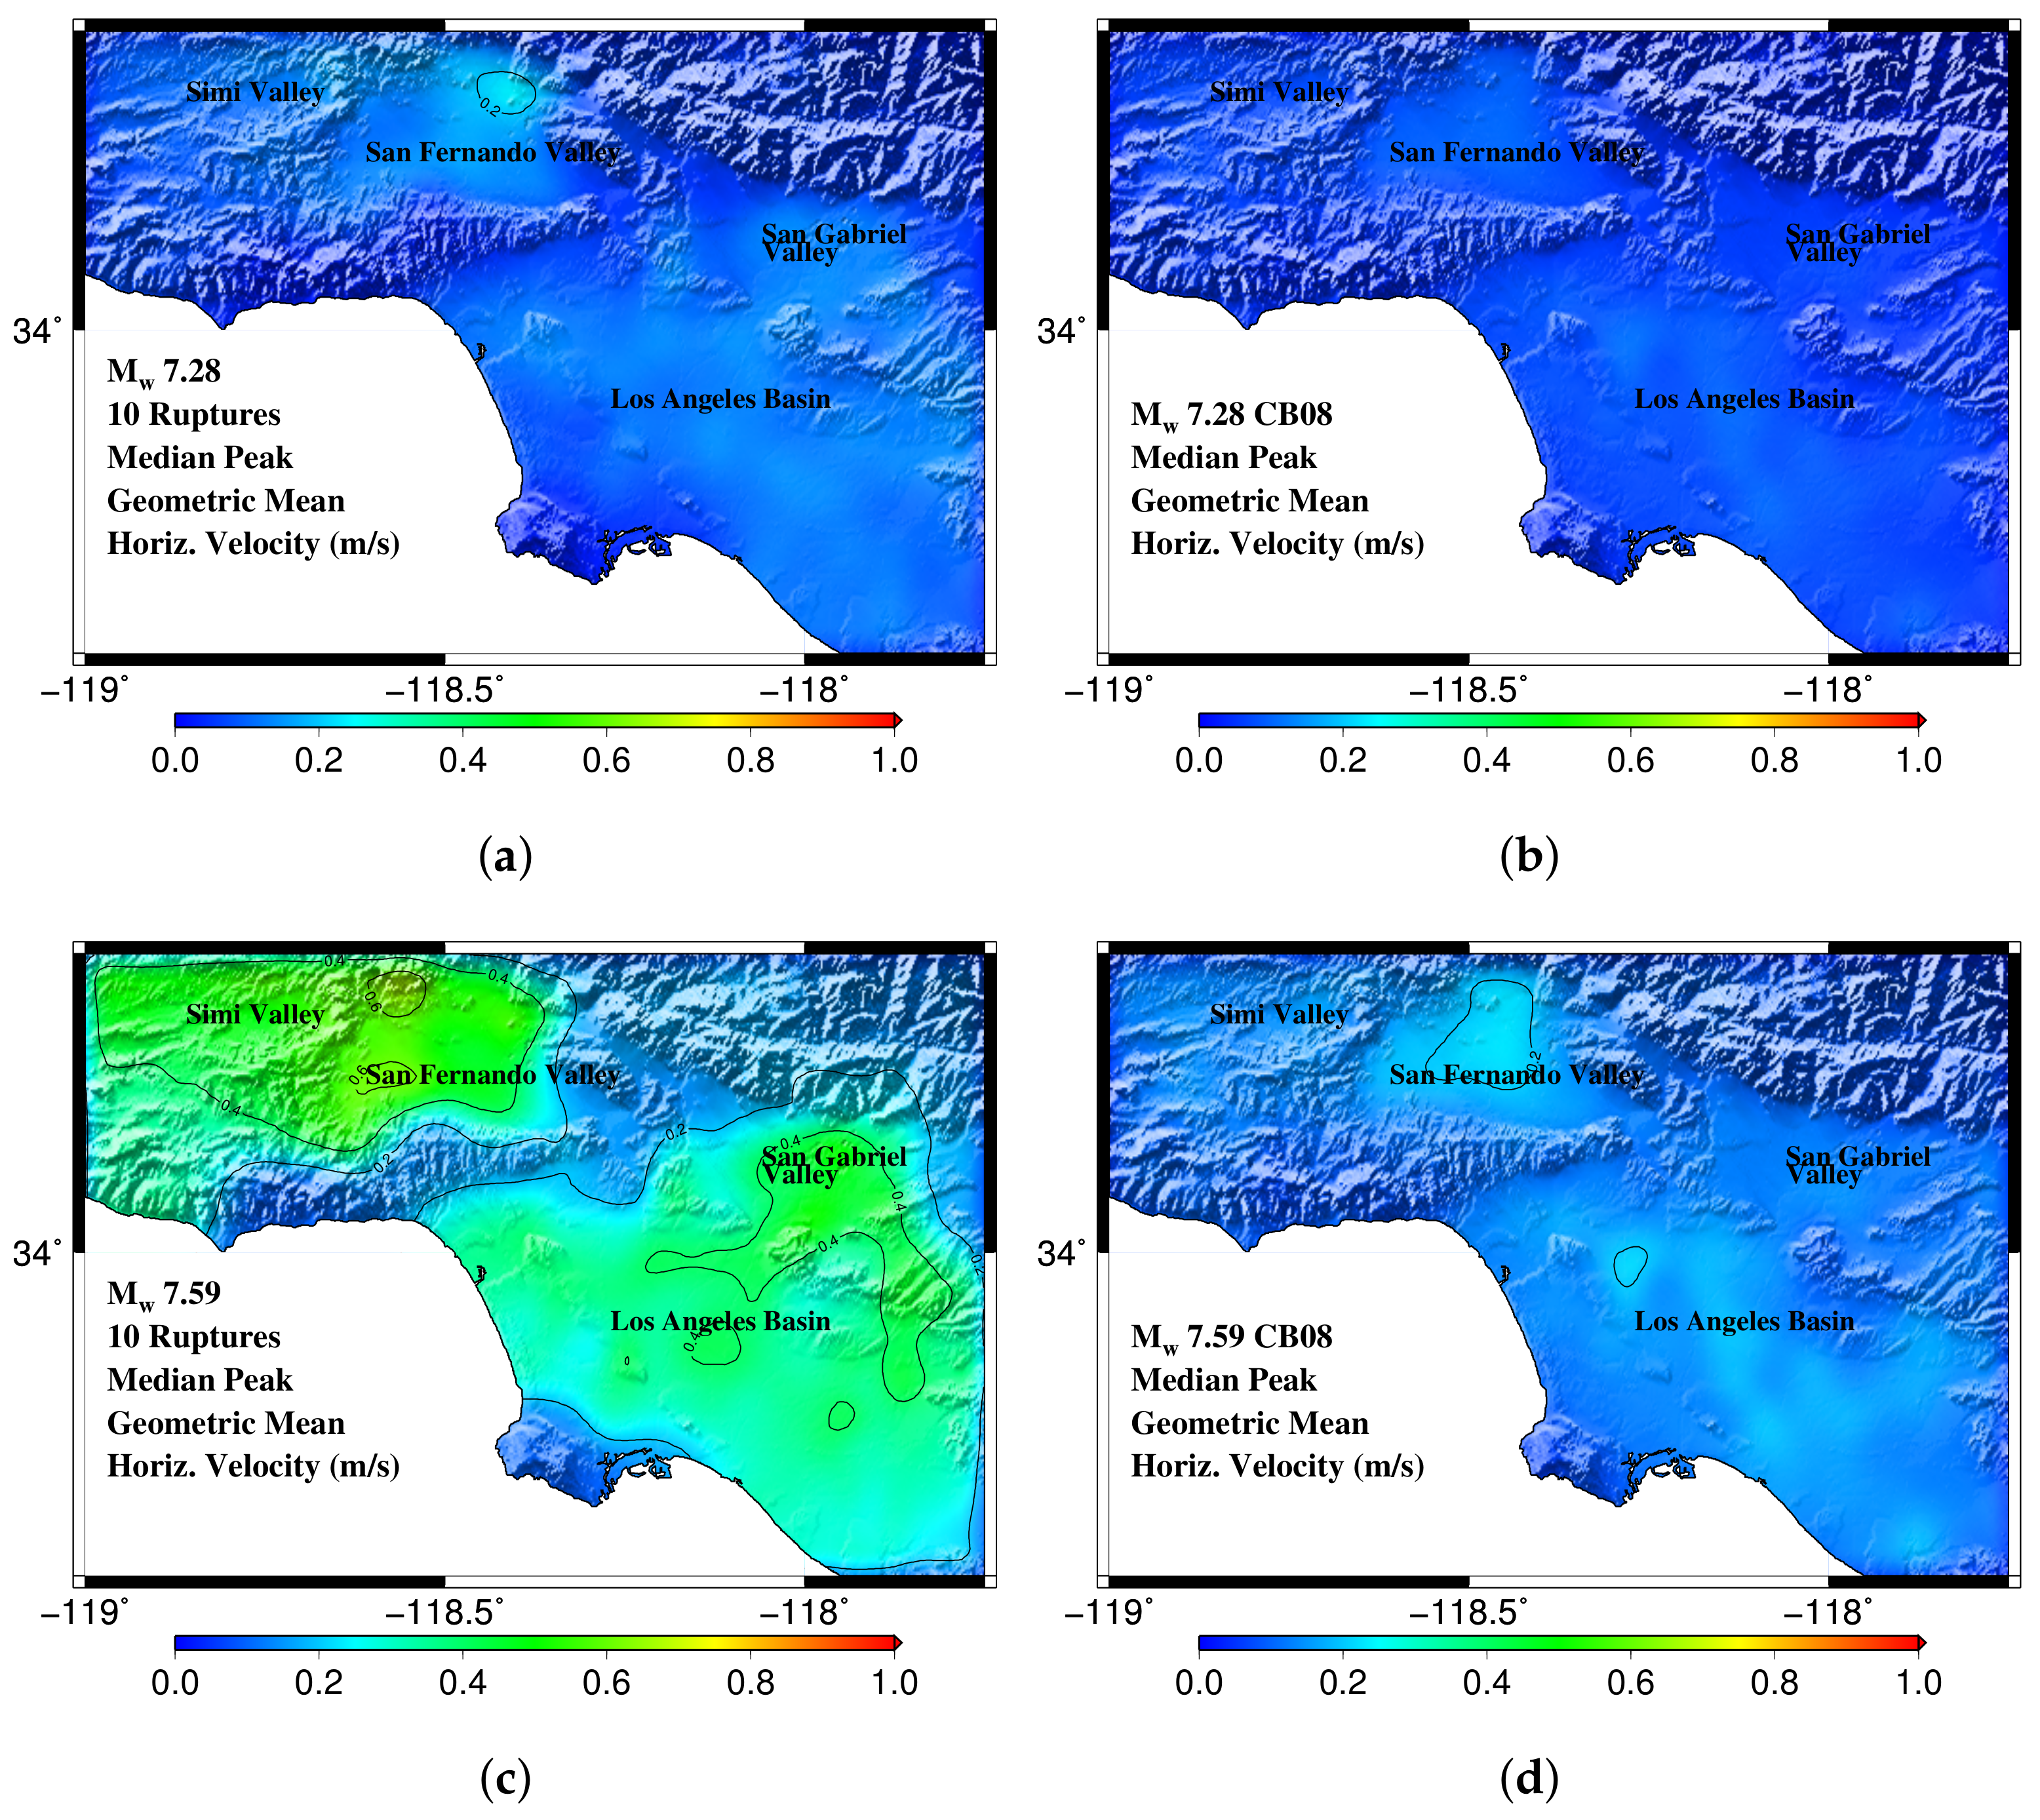
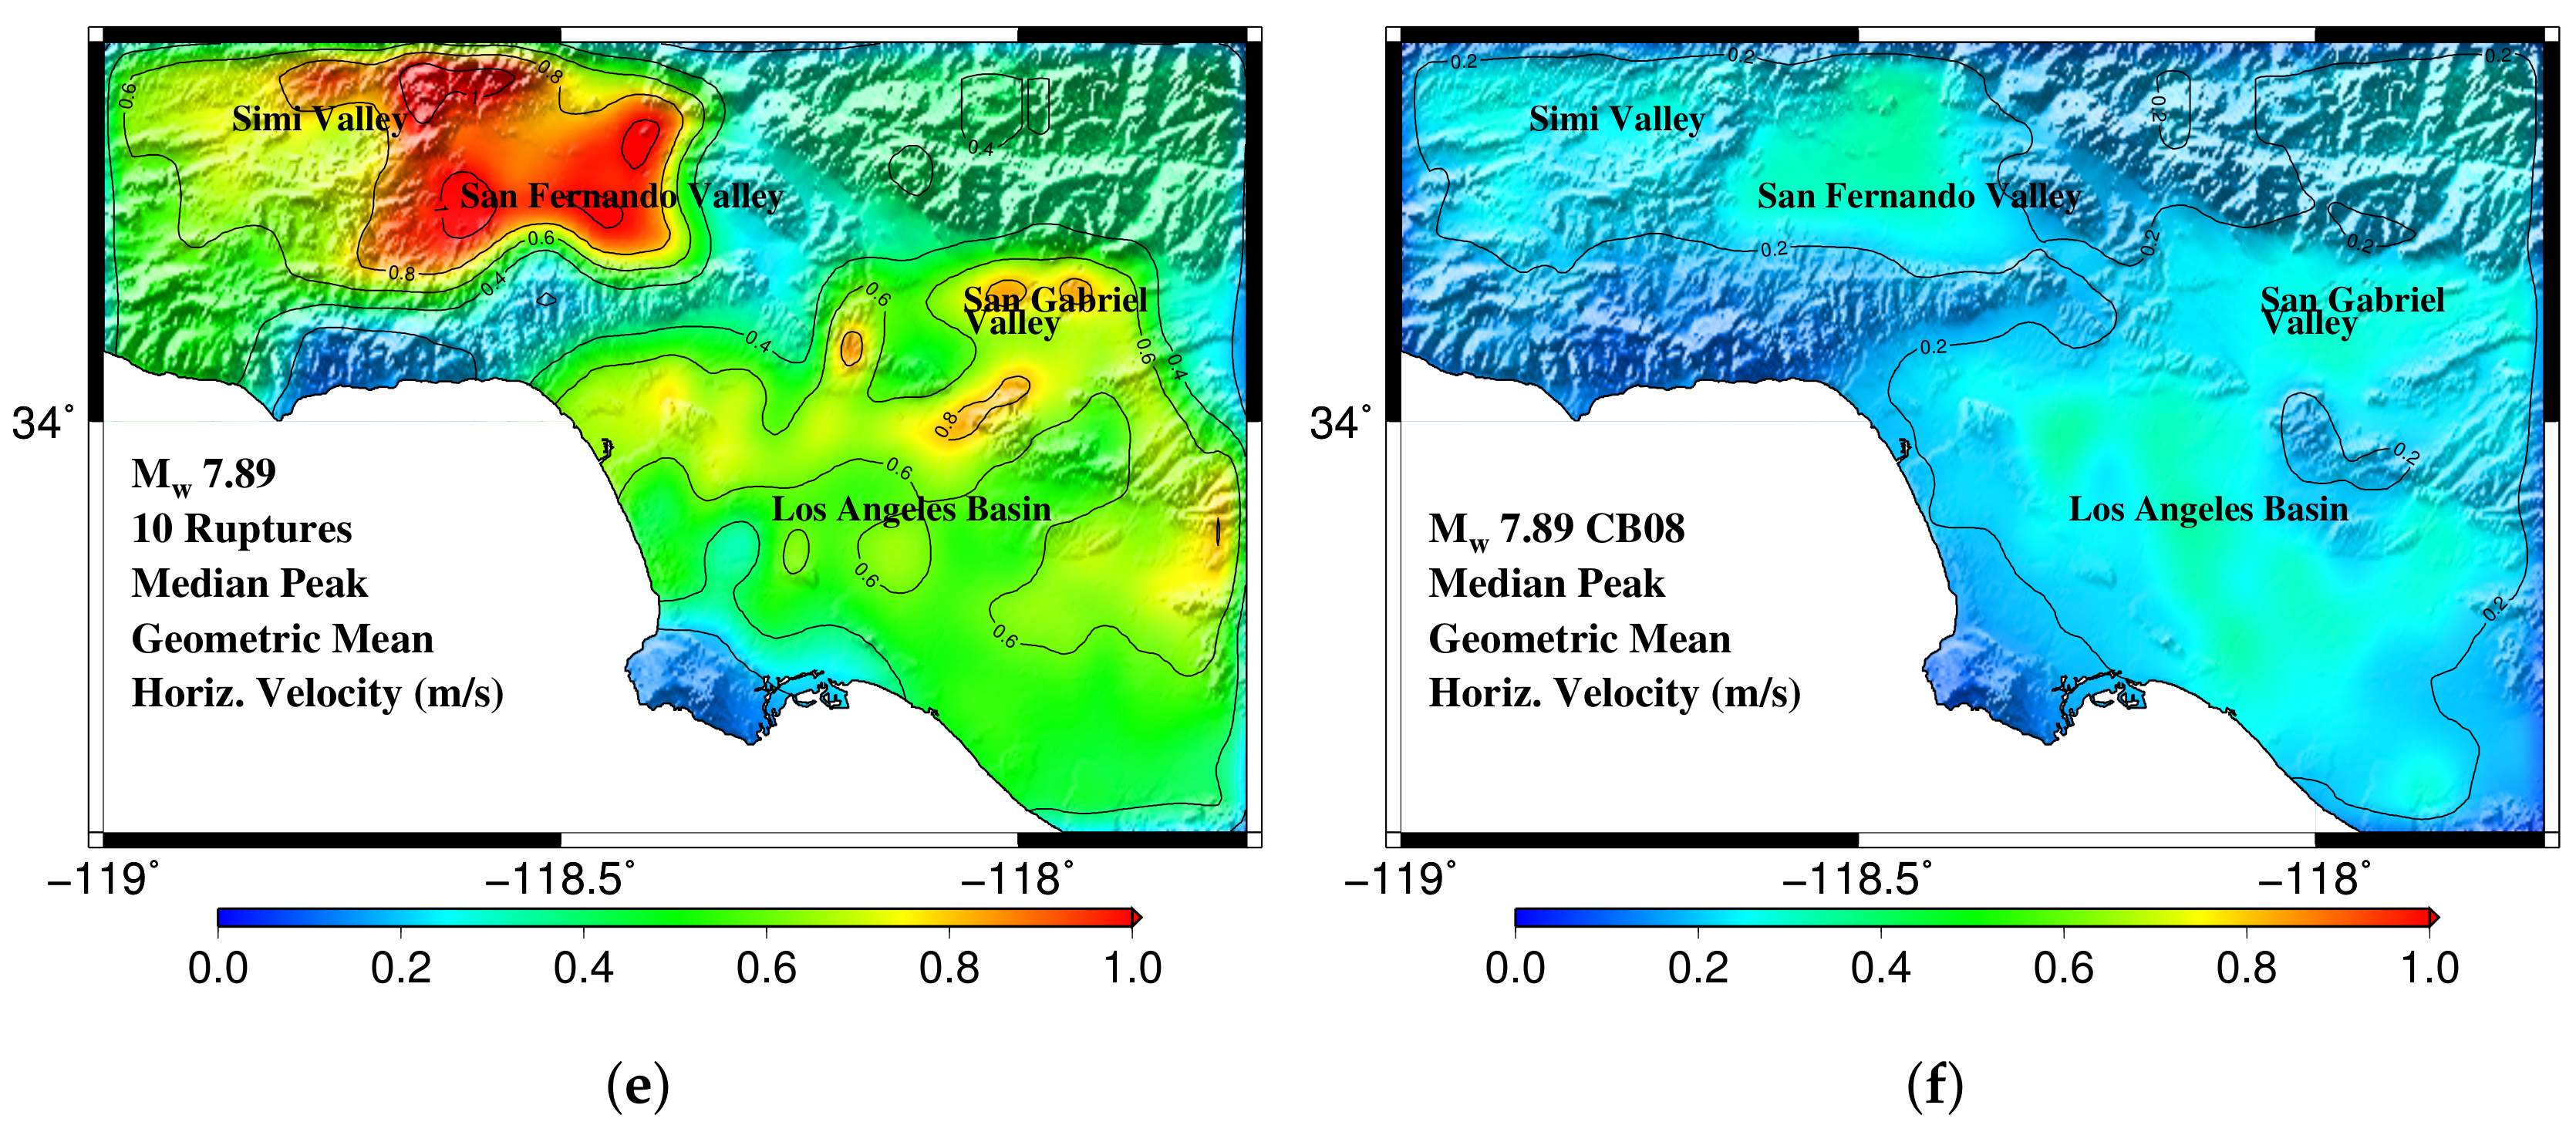
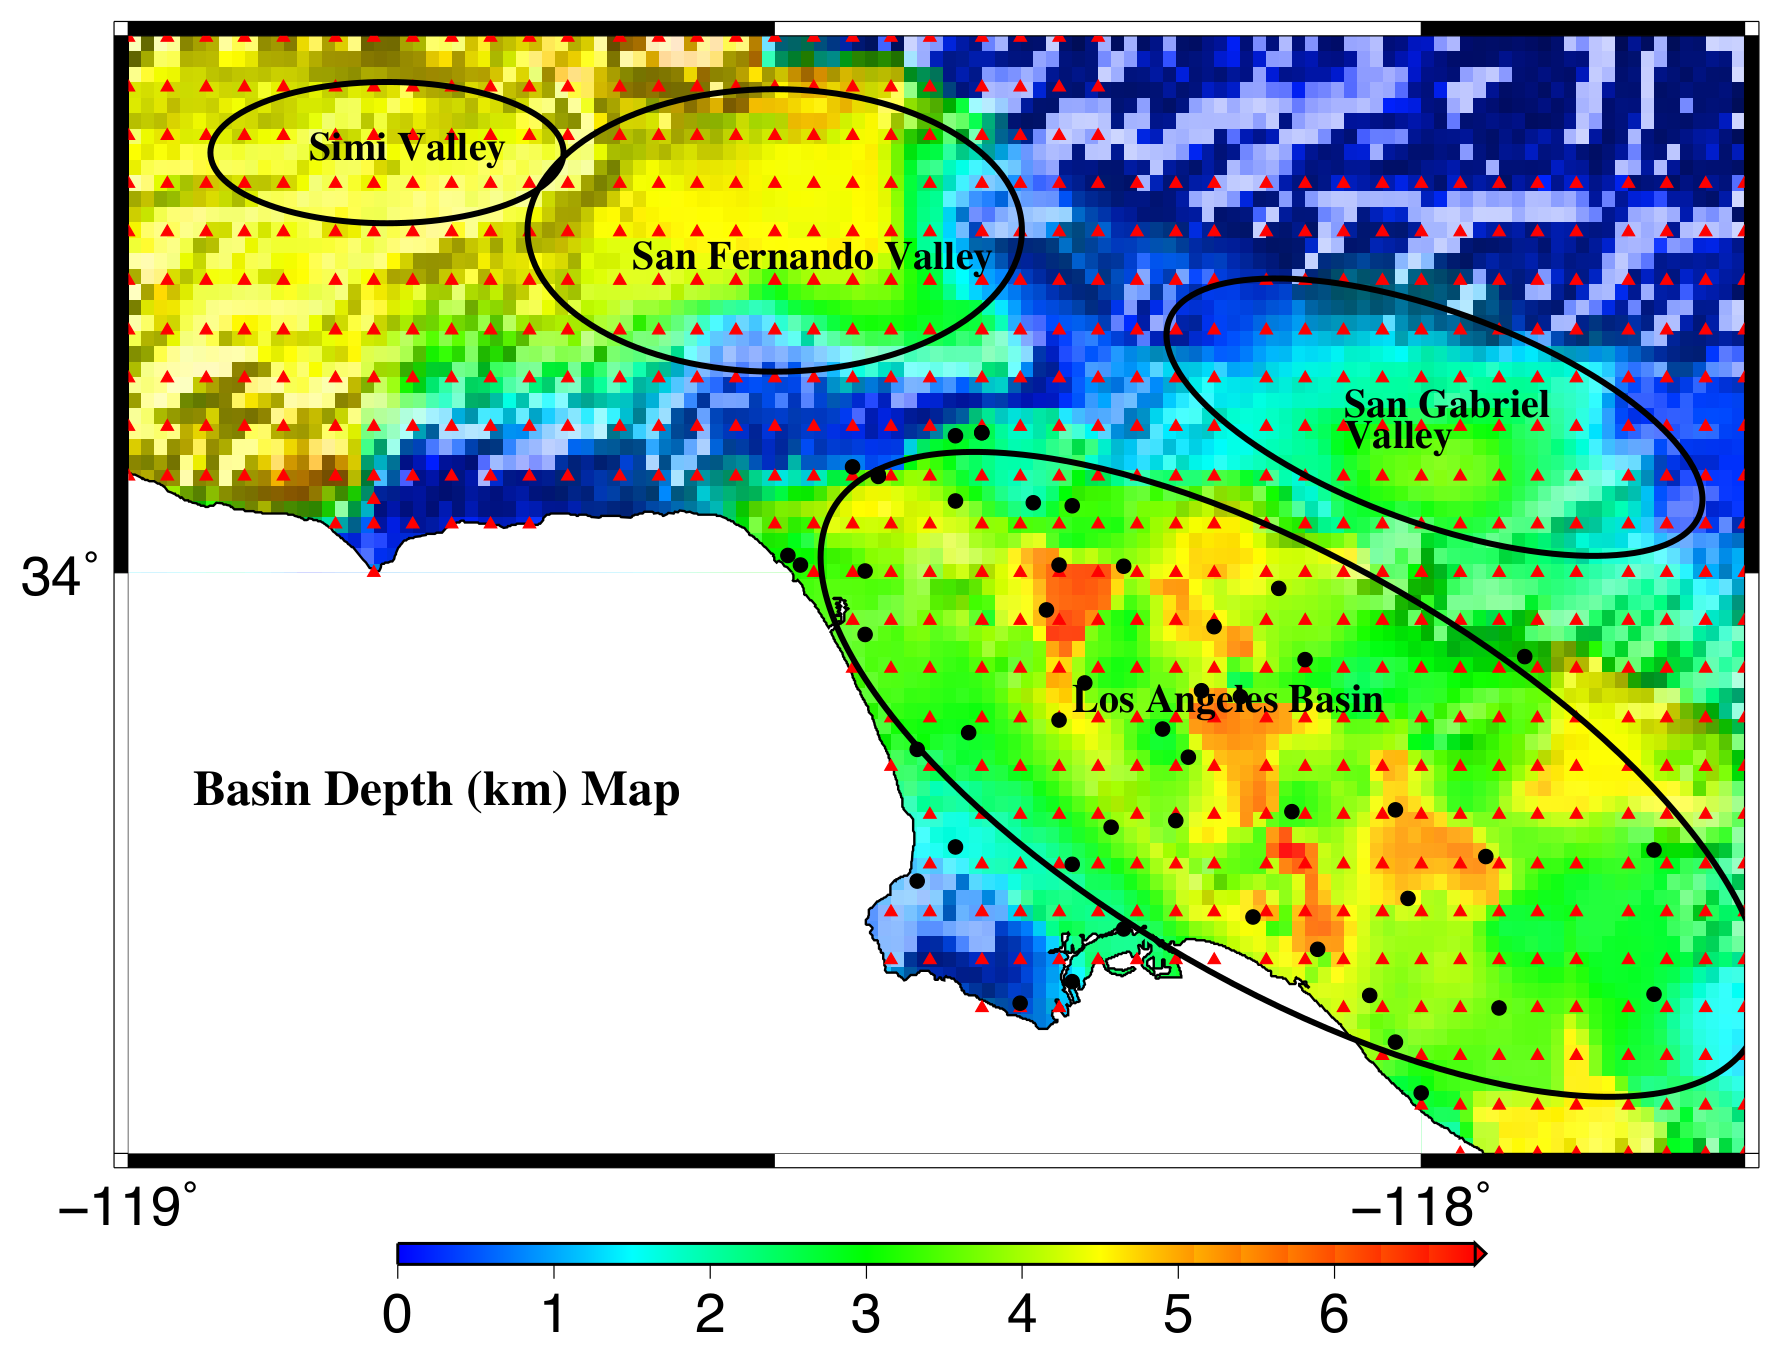
Figure 6a,c,e show maps of the median values of the geometric mean of the horizontal ground velocity under the ten ruptures of the magnitude 7.28, 7.56, and 7.89 scenario earthquakes, respectively. The maps cover the 636 analysis sites in southern California at which ground motions are computed. The corresponding maps, generated using the CB-08 attenuation relations with the site-specific soil and basin depth (Figure 7) information for the 636 analysis sites, are shown in Figure 6b,d,f. The strong influence of the basins is clearly seen. Ground motions are significantly amplified in each of the three basins, San Fernando, Los Angeles (LA), and San Gabriel (SG). The San Fernando valley’s proximity to the San Andreas fault (and perhaps seismic wave-speed structure) results in far more intense shaking there as compared to the LA and SG basins. The simulated ground motions are significantly more intense than the intensities predicted by CB-08, with this difference growing with earthquake magnitude.
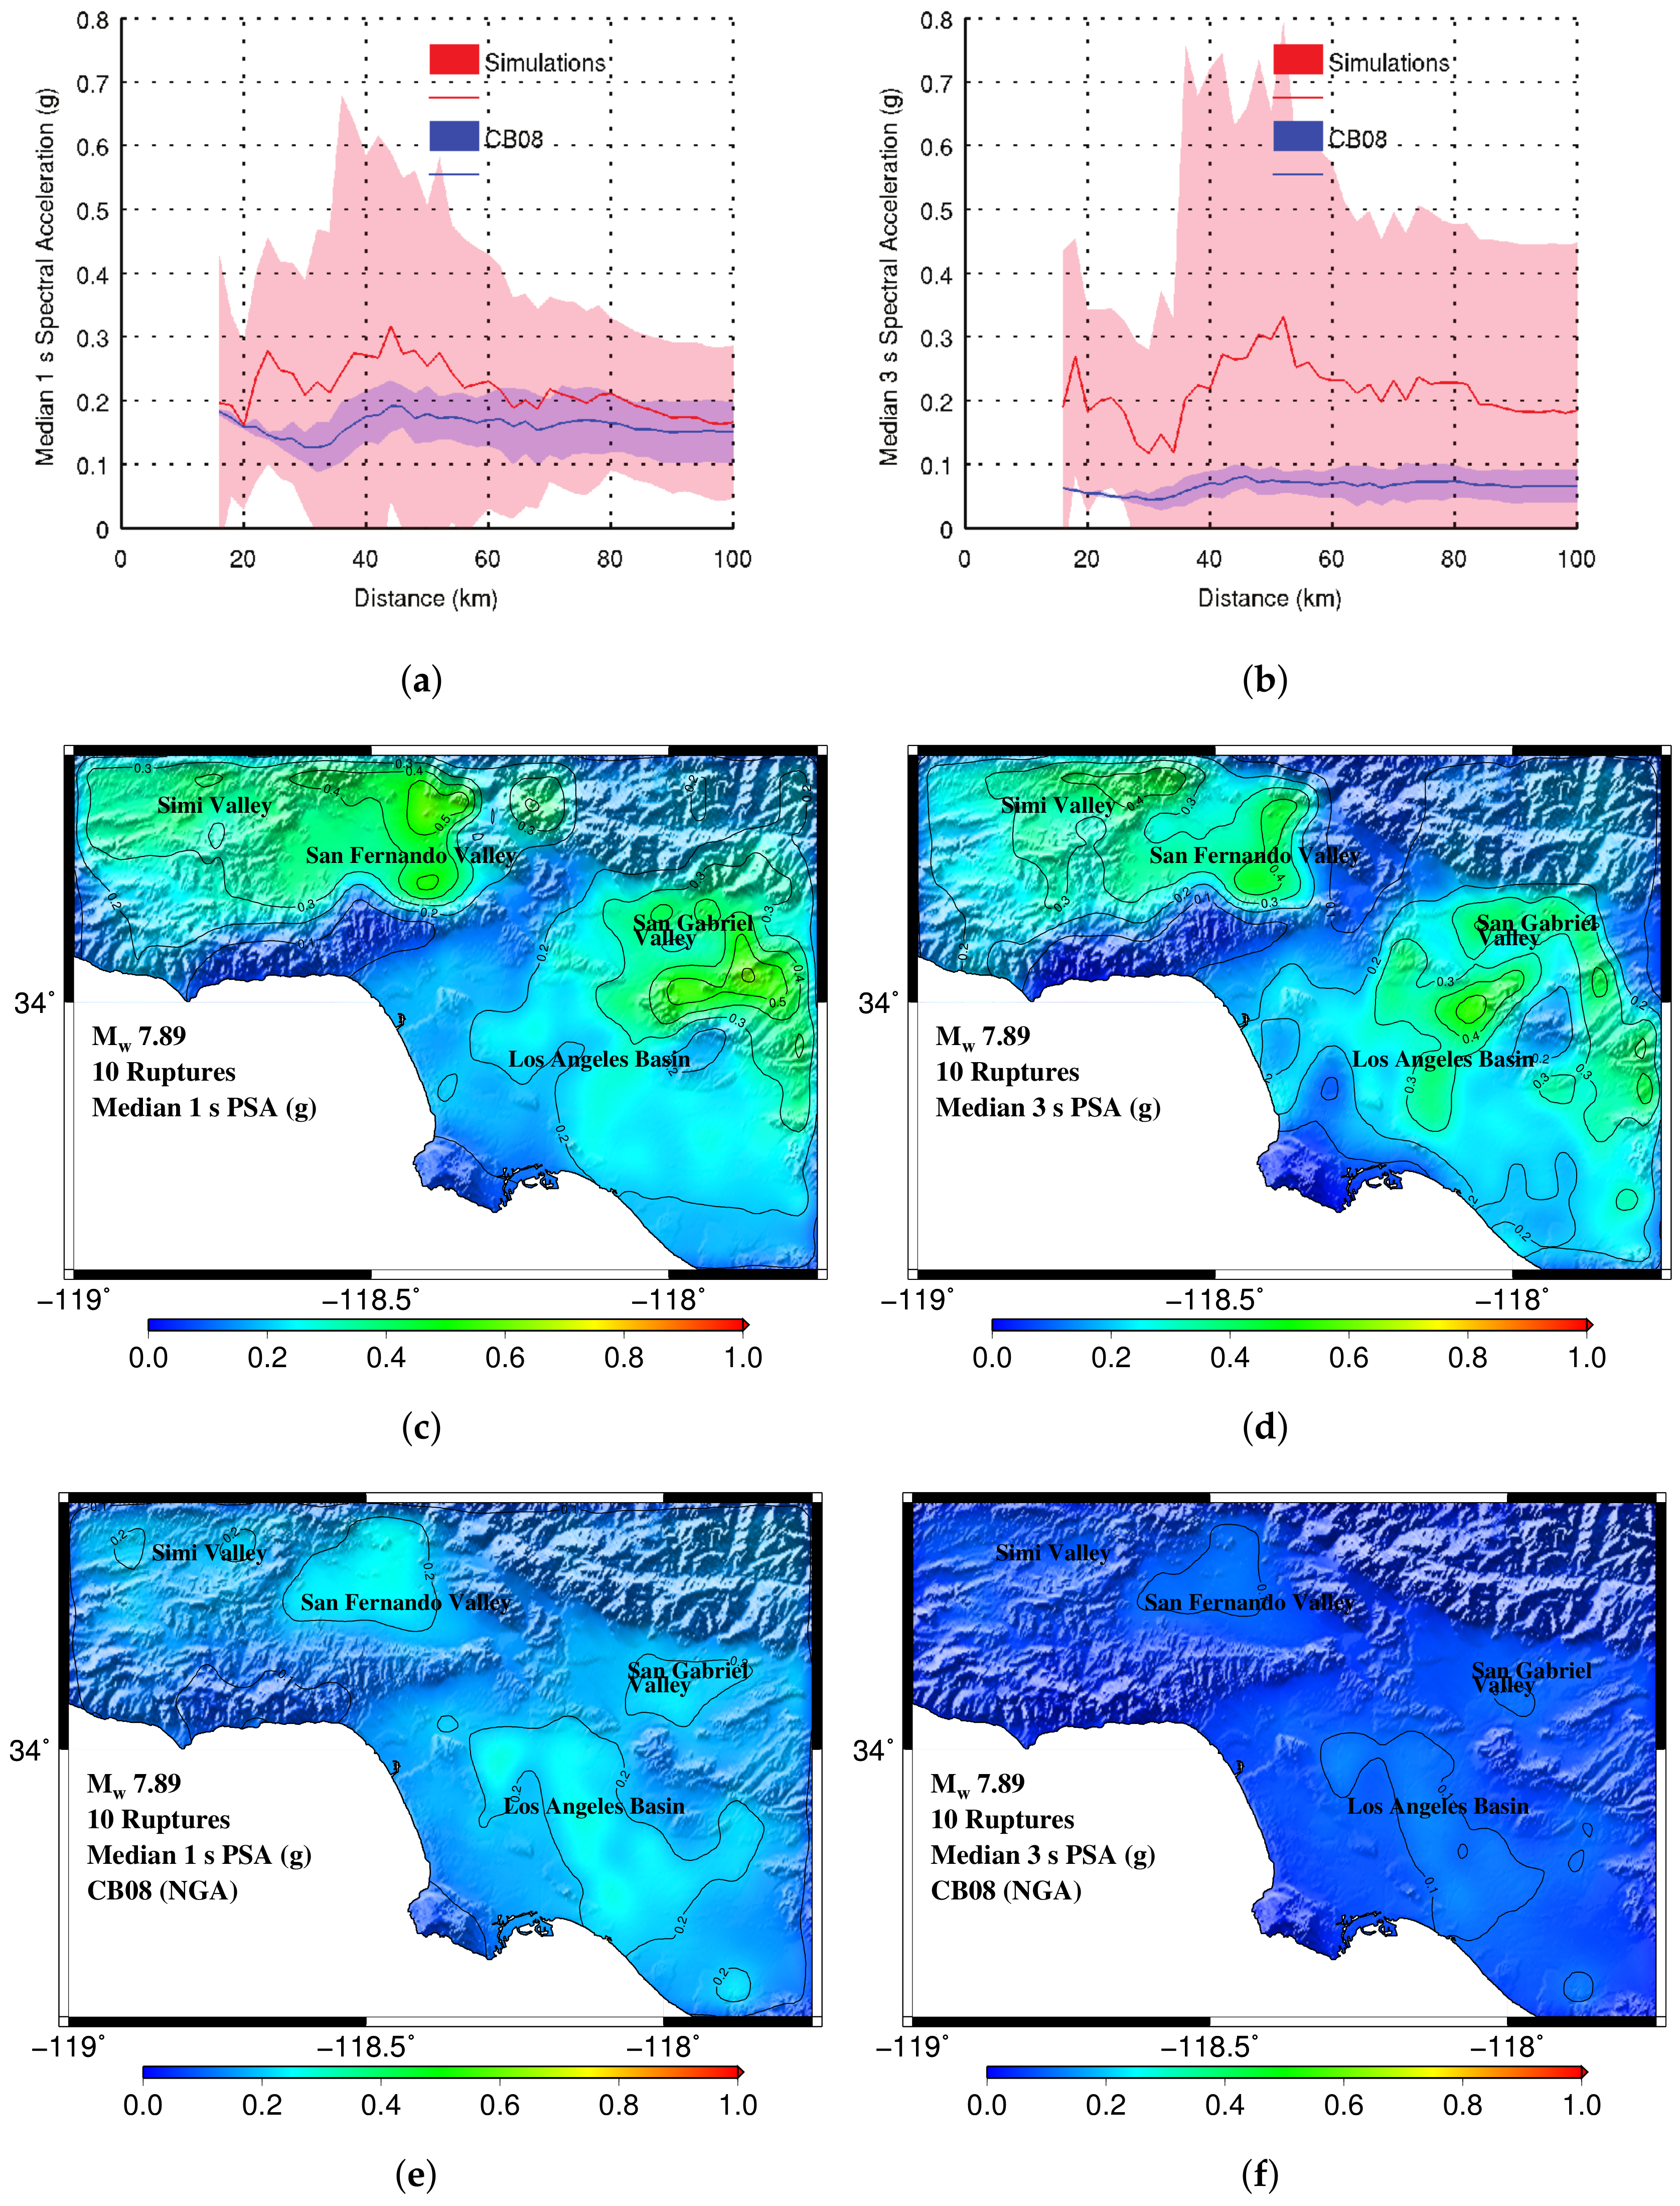
Spectral accelerations at 1 s and 3 s periods from the scenario earthquake simulations are compared against those generated using the CB-08 NGA relations in Figure 8. Mean S a and the one standard deviation spread on either side of the mean are shown plotted as a function of source-to-site distance in Figure 8a,b. The fact that the peaks occur not at shorter distances, but at 35–65 km distances is due to the combined effect of basins (the closest distance to which is about 40 km from the fault) and the Joyner-Boore definition of distance that does not take into account the location of slip asperity on the fault or rupture directivity, being based upon fault proximity alone instead. It is interesting to note that the simulated ground motions carry comparable power at 1 s and 3 s periods. If anything, the peaks in the 3 s S a are higher than those in the 1 s S a plots. This is not the case with the NGA predictions with the 3 s period spectral accelerations being significantly diminished when compared to the 1 s period spectral accelerations.
Ref. [7] identified fourteen locations in the greater Los Angeles region where a significant number of tall buildings exist. These include Irvine, downtown Los Angeles, Anaheim, Long Beach, Hollywood, El Segundo, Santa Monica, Century City, Universal City, and Park La Brea in the Los Angeles basin, Encino, Canoga Park in the San Fernando basin, and Glendale and Pasadena in the San Gabriel basin (see Figure 7 for locations). Table 3 shows the median and standard deviation of the PGV, PGD, S a 1 s , and S a 3 s at these fourteen locations from the ten (five locations and two rupture directions) simulated M w 7.89 scenario earthquakes on the San Andreas fault. Ground motion is particularly strong at downtown LA, Canoga Park, Anaheim, El Segundo, Santa Monica, and Century City. The corresponding tables for the M w 7.59 and 7.28 earthquakes can be found in [41].
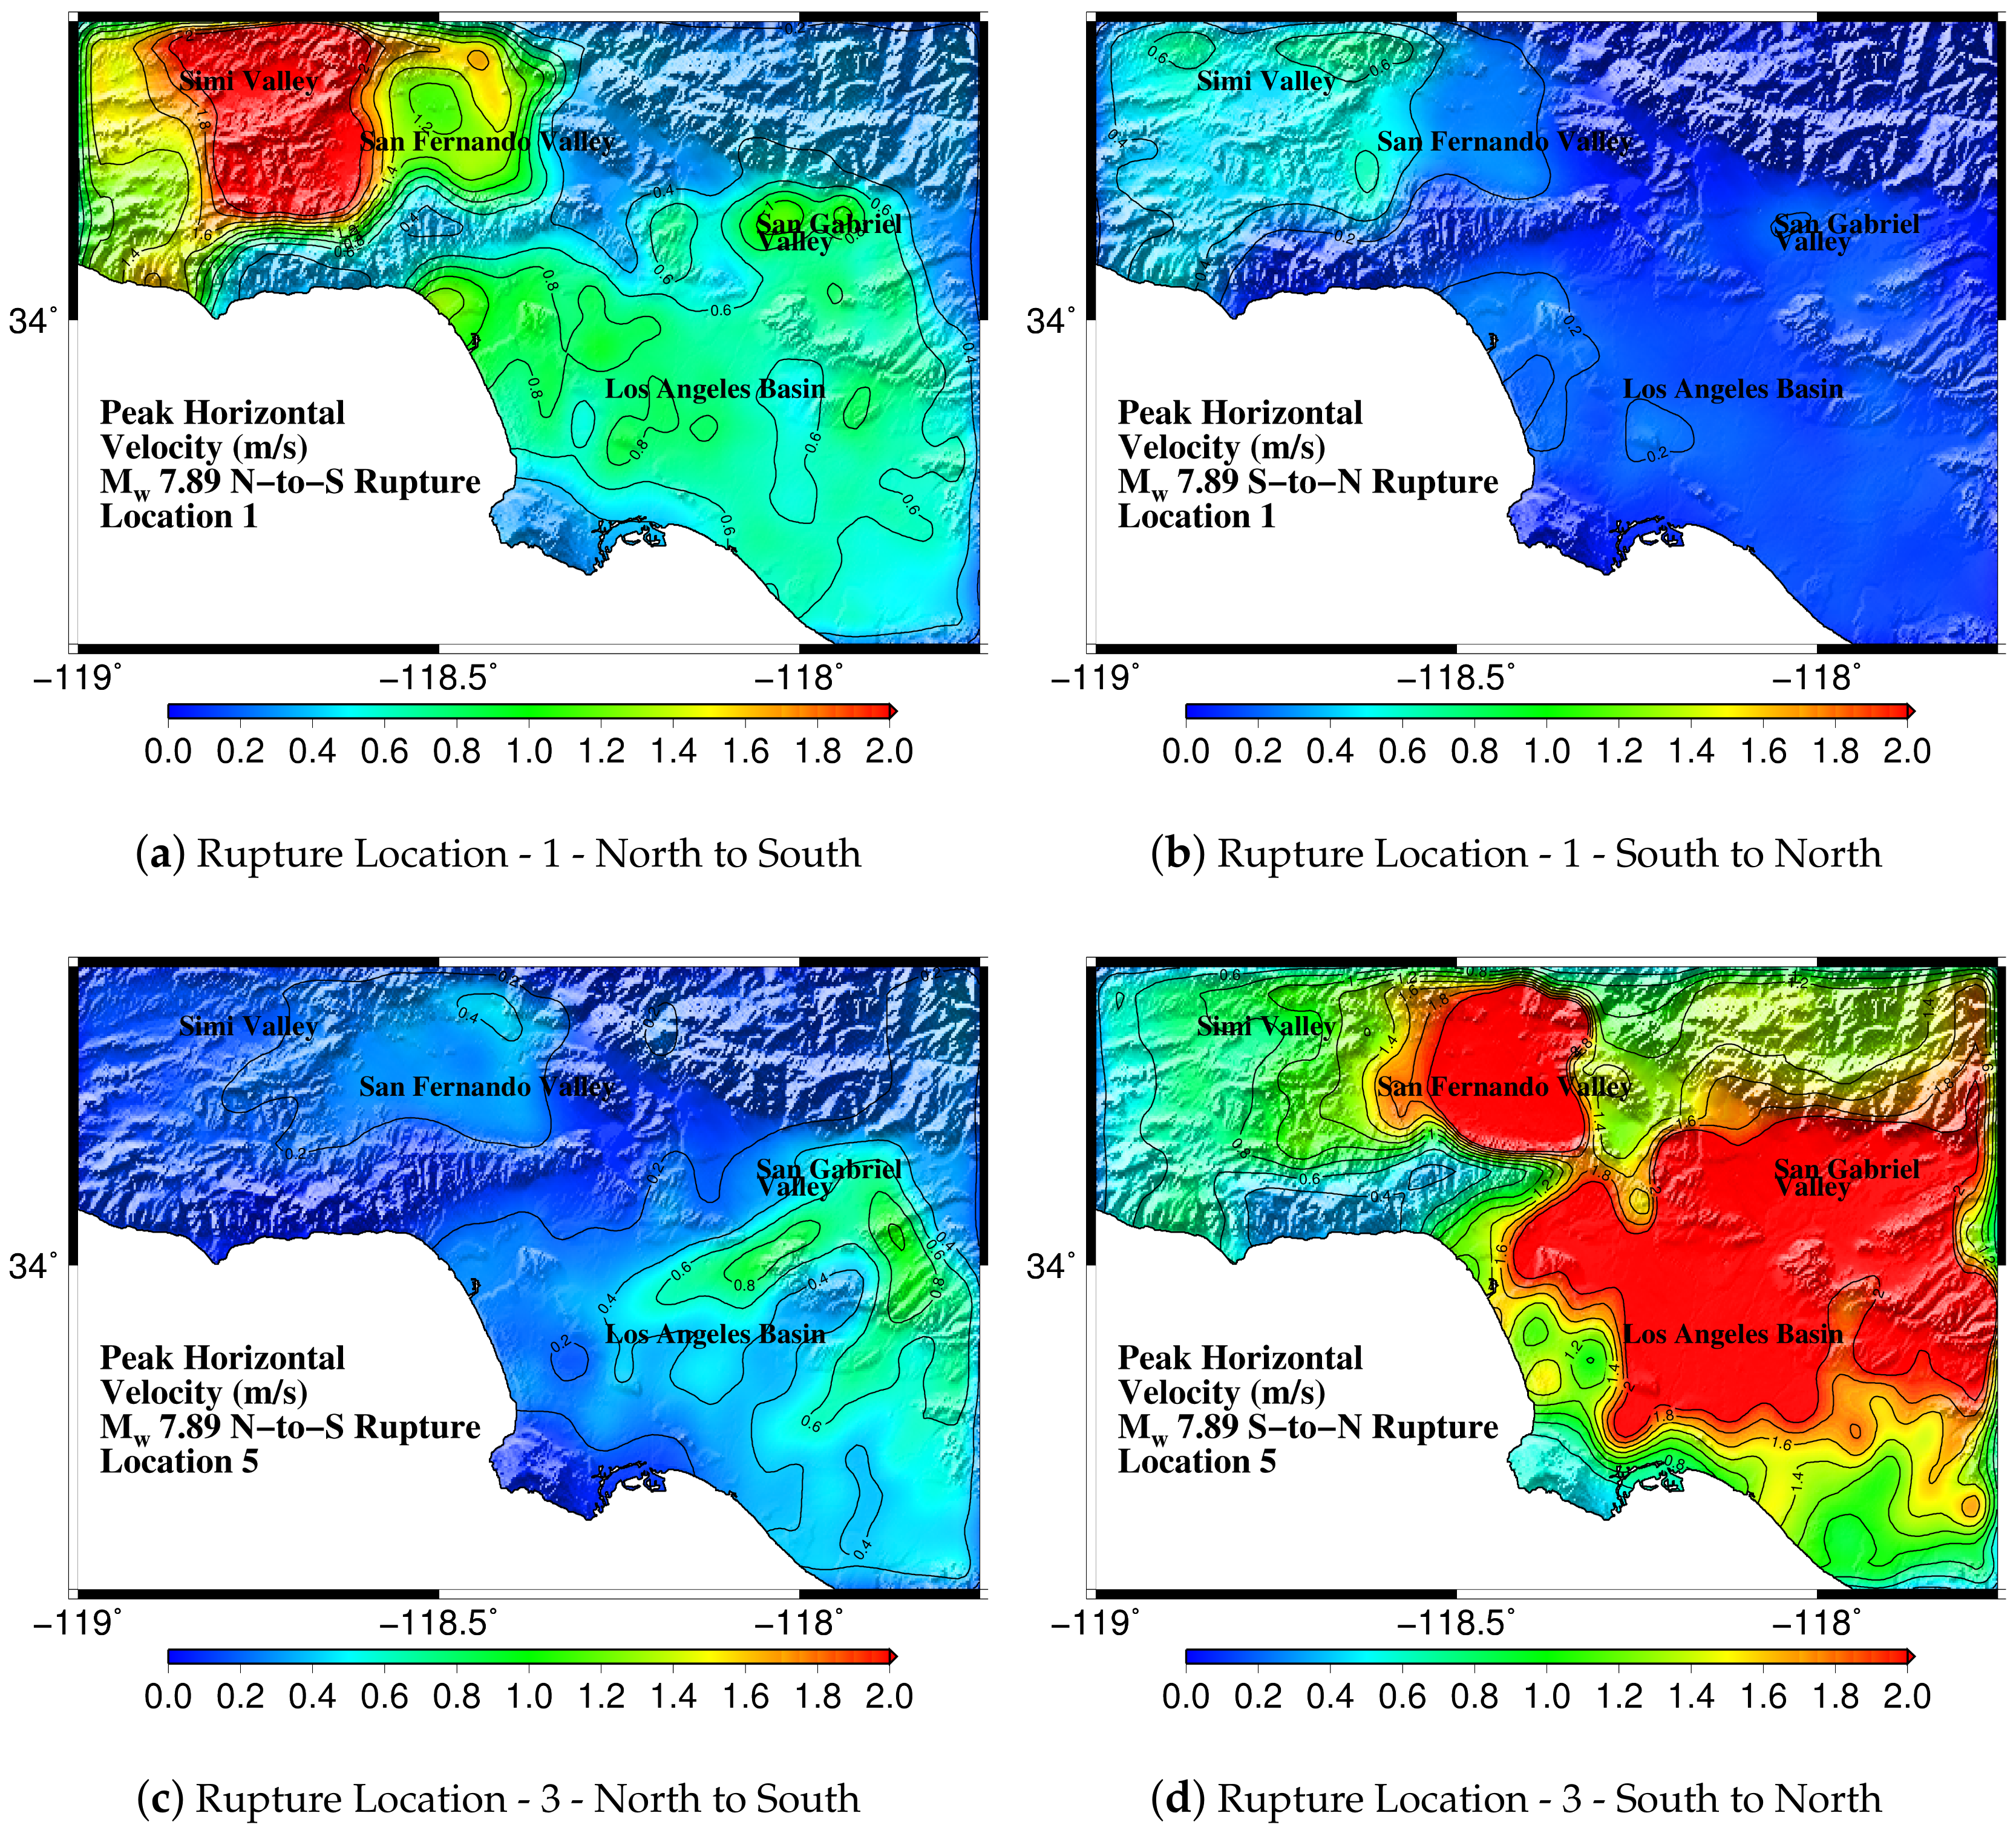
Figure 9 illustrates the effect of source directivity on ground motions. The north-to-south rupture at location 1 (see Figure 1) directs a great amount of energy into the region of forward directivity, which is the San Fernando valley and the Los Angeles beyond. The south-to-north rupture, on the other hand, directs the energy away from the LA basin into the central valley to the north. The focusing effect is enhanced by the added proximity of the target region to the primary slip asperity in the source in the case of the north-to-south rupture scenario, while the opposite is true for the south-to-north rupture scenario. Note that in reversing the rupture direction, the slip distribution is reversed as well, such that an asperity on the south side of the north-to-south rupture is located on the north side of the south-to-north rupture. Peak horizontal velocity in the target region under the north-to-south rupture scenario is two to four times that under the south-to-north rupture scenario. For scenario earthquakes at rupture location 5, it is the south-to-north rupture that produces the stronger ground motions in the target region and the contrast is comparable to that in the location 1 scenario. The consideration of both N-to-S and S-to-N rupture directivities ensure that the results, when considered collectively, are not biased by unilateral rupture considerations. For example, when a source with strong rupture directivity toward the LA basin is flipped to propagate in the other direction, the latter ground motions are much weaker. When the ground motions from the two events are considered collectively, any bias associated with the former rupture is removed.
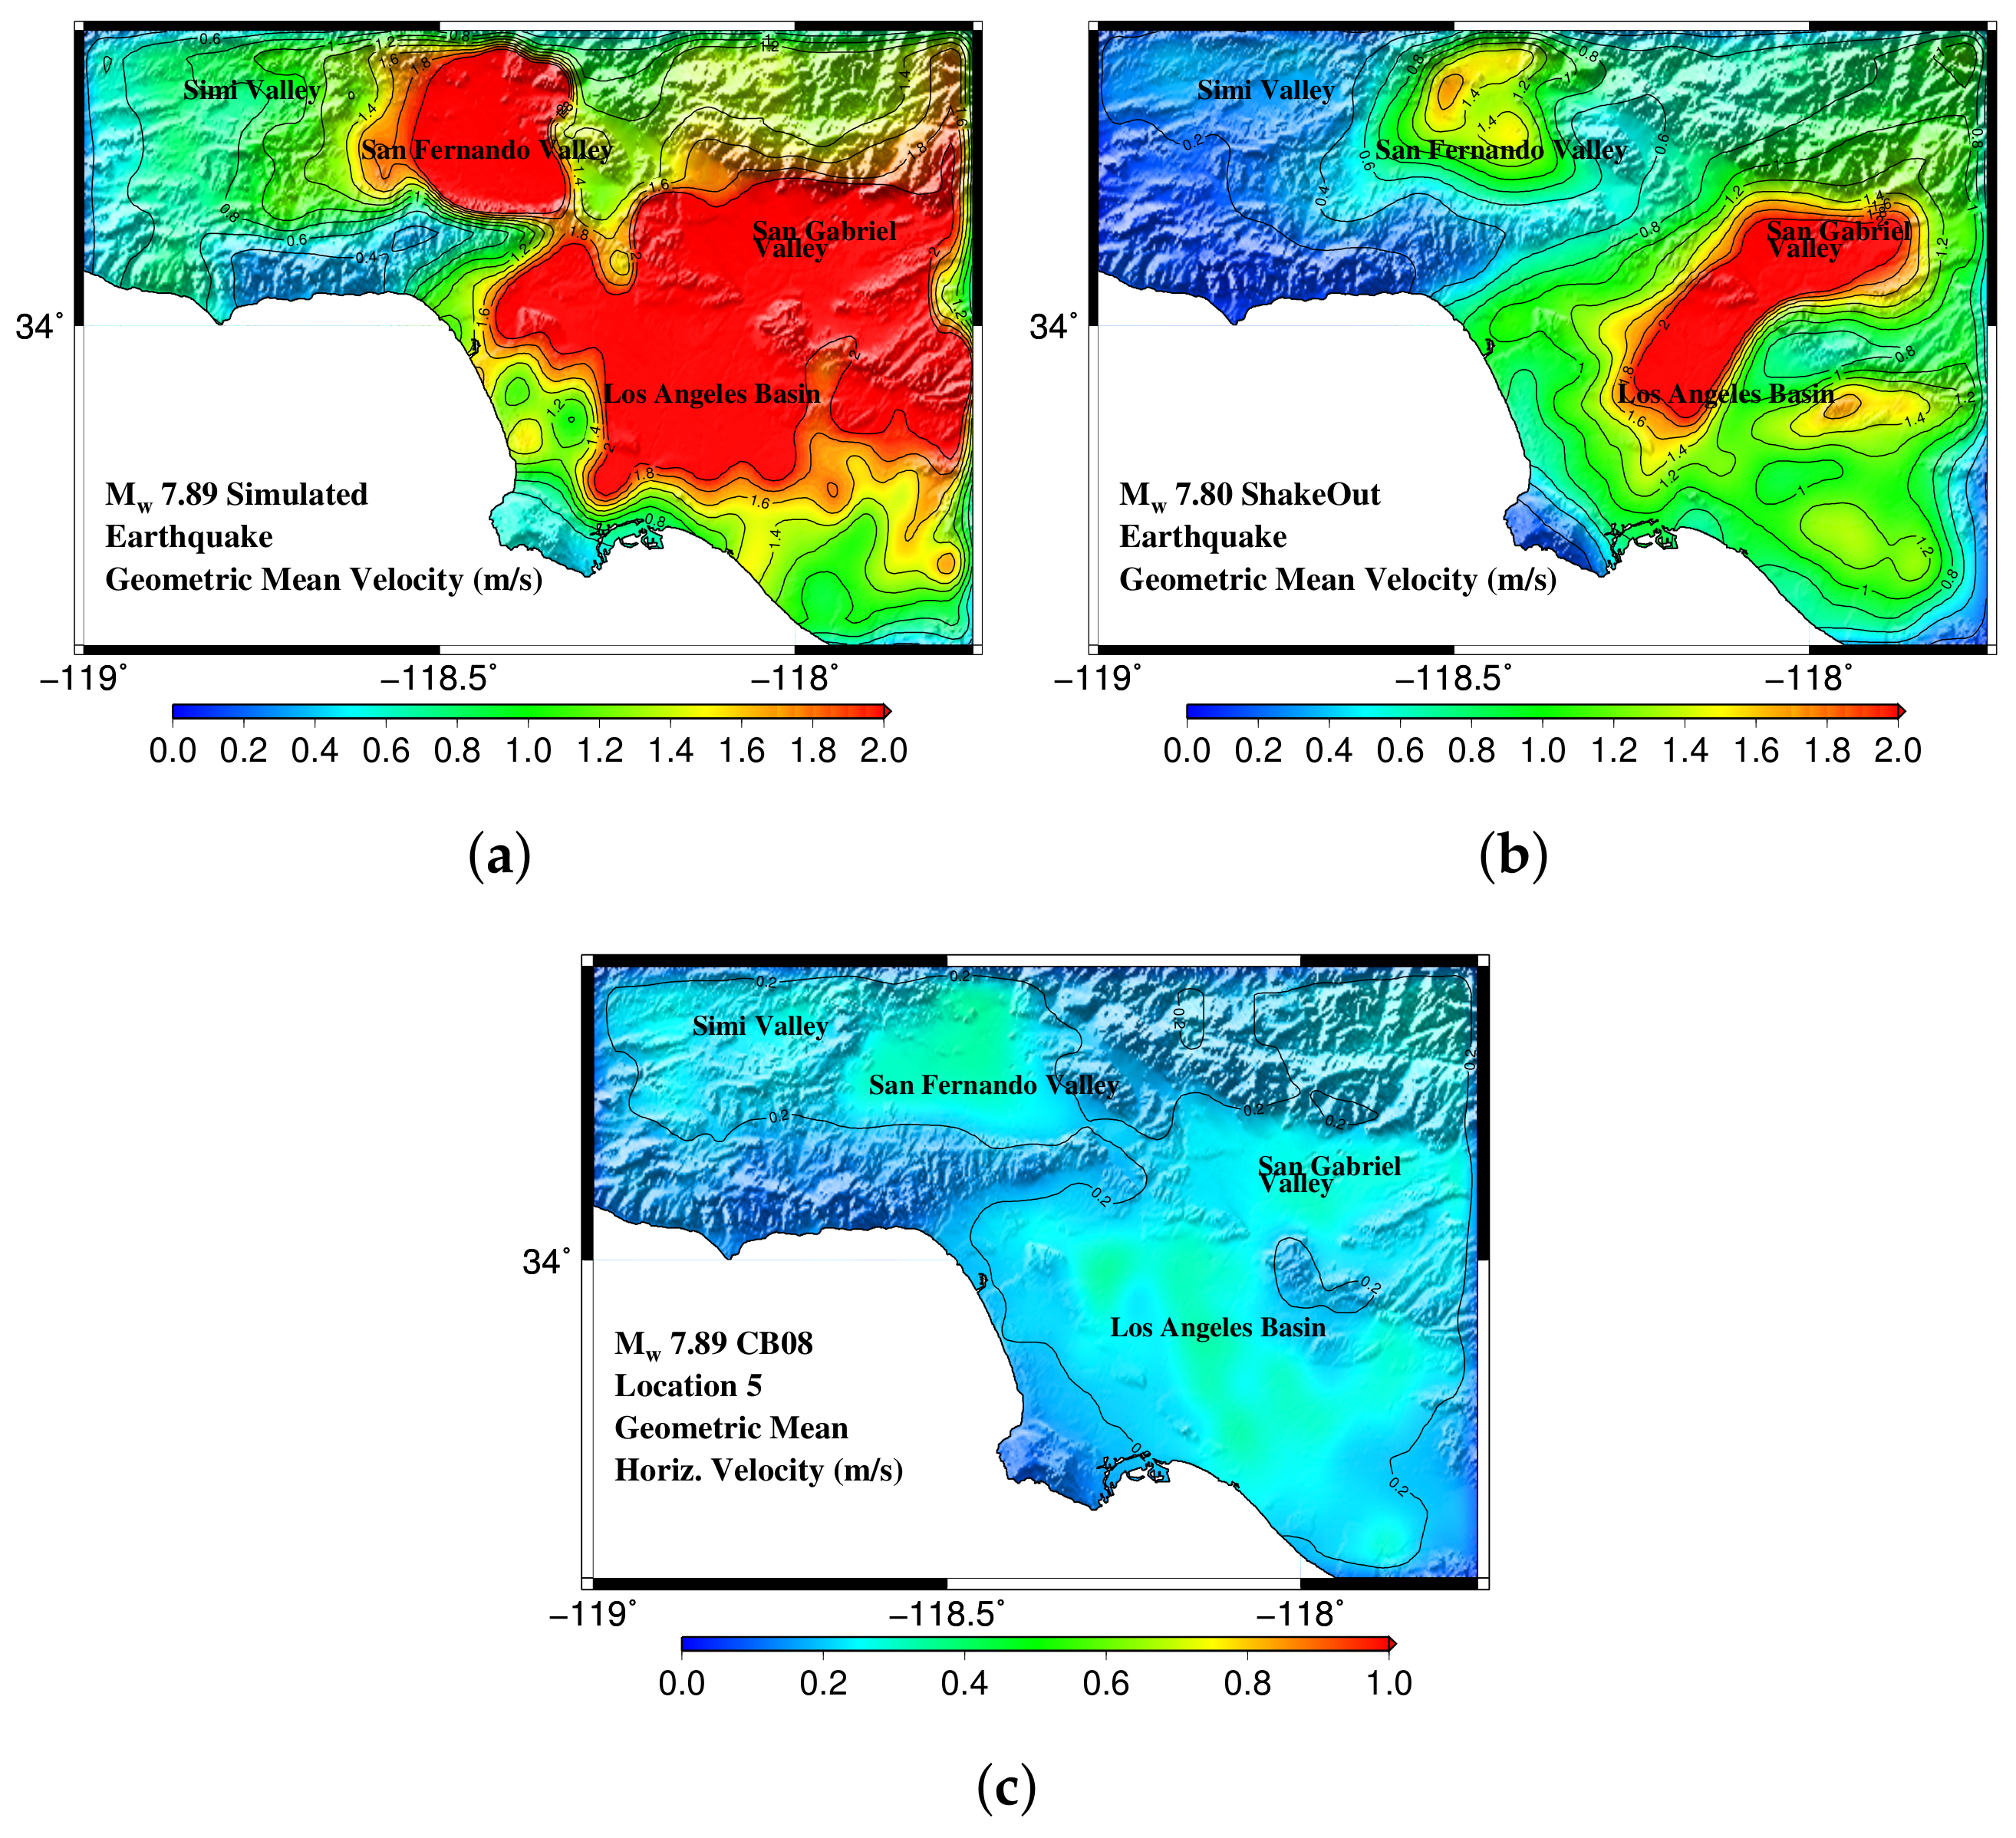
The simulated ShakeOut scenario earthquake, used in the Great California ShakeOut Exercise and Drill, is a M w 7.80 rupture, initiating at Bombay Beach and propagating northwest through the San Gorgonio pass, terminating 304 km away at Lake Hughes in the north. Using a source developed by [63] and the SCEC-CVM wave-speed model [22,23,24], ref. [64] simulated 3-component long-period ground motion waveforms in the greater Los Angeles region. The south-to-north propagating M w 7.89 scenario earthquake at location 5 [Figure 1j] closely resembles this earthquake in as far as location, rupture directivity, and magnitude (with scenario earthquake having a slightly higher moment magnitude) are concerned. The ShakeOut scenario has served as a benchmark for ground motion simulation methodologies [65] and in Figure 10a-b we compare the results of the simulations here against this established benchmark. The ground motions simulated in this study are more intense than those predicted for the ShakeOut scenario. But the overall pattern of basin amplification is quite similar. The differences may be attributed to the slightly lower magnitude of the ShakeOut earthquake (with 30% smaller energy release) as well as the differences in the source (e.g., peak slip of 16 m in the ShakeOut source versus 12 m in the Denali earthquake source used for the earthquake simulated here) and wave-speed (SCEC-CVM versus SCEC-CVMH) models. The predictions by the NGA relations are far lower [Figure 10c]. The large red blob in the ShakeOut motions, attributed to a wave-guide through Whittier-Narrows by [66], cannot be found in the NGA predictions. Rupture directivity and wave-guide focusing, that clearly may have a strong influence on ground motions, are not explicitly accounted for in the NGA relations. In our simulation, a larger feature encompassing the wave-guide-related feature of the ShakeOut earthquake can be seen.

4. Probabilistic Estimates of Ground Shaking

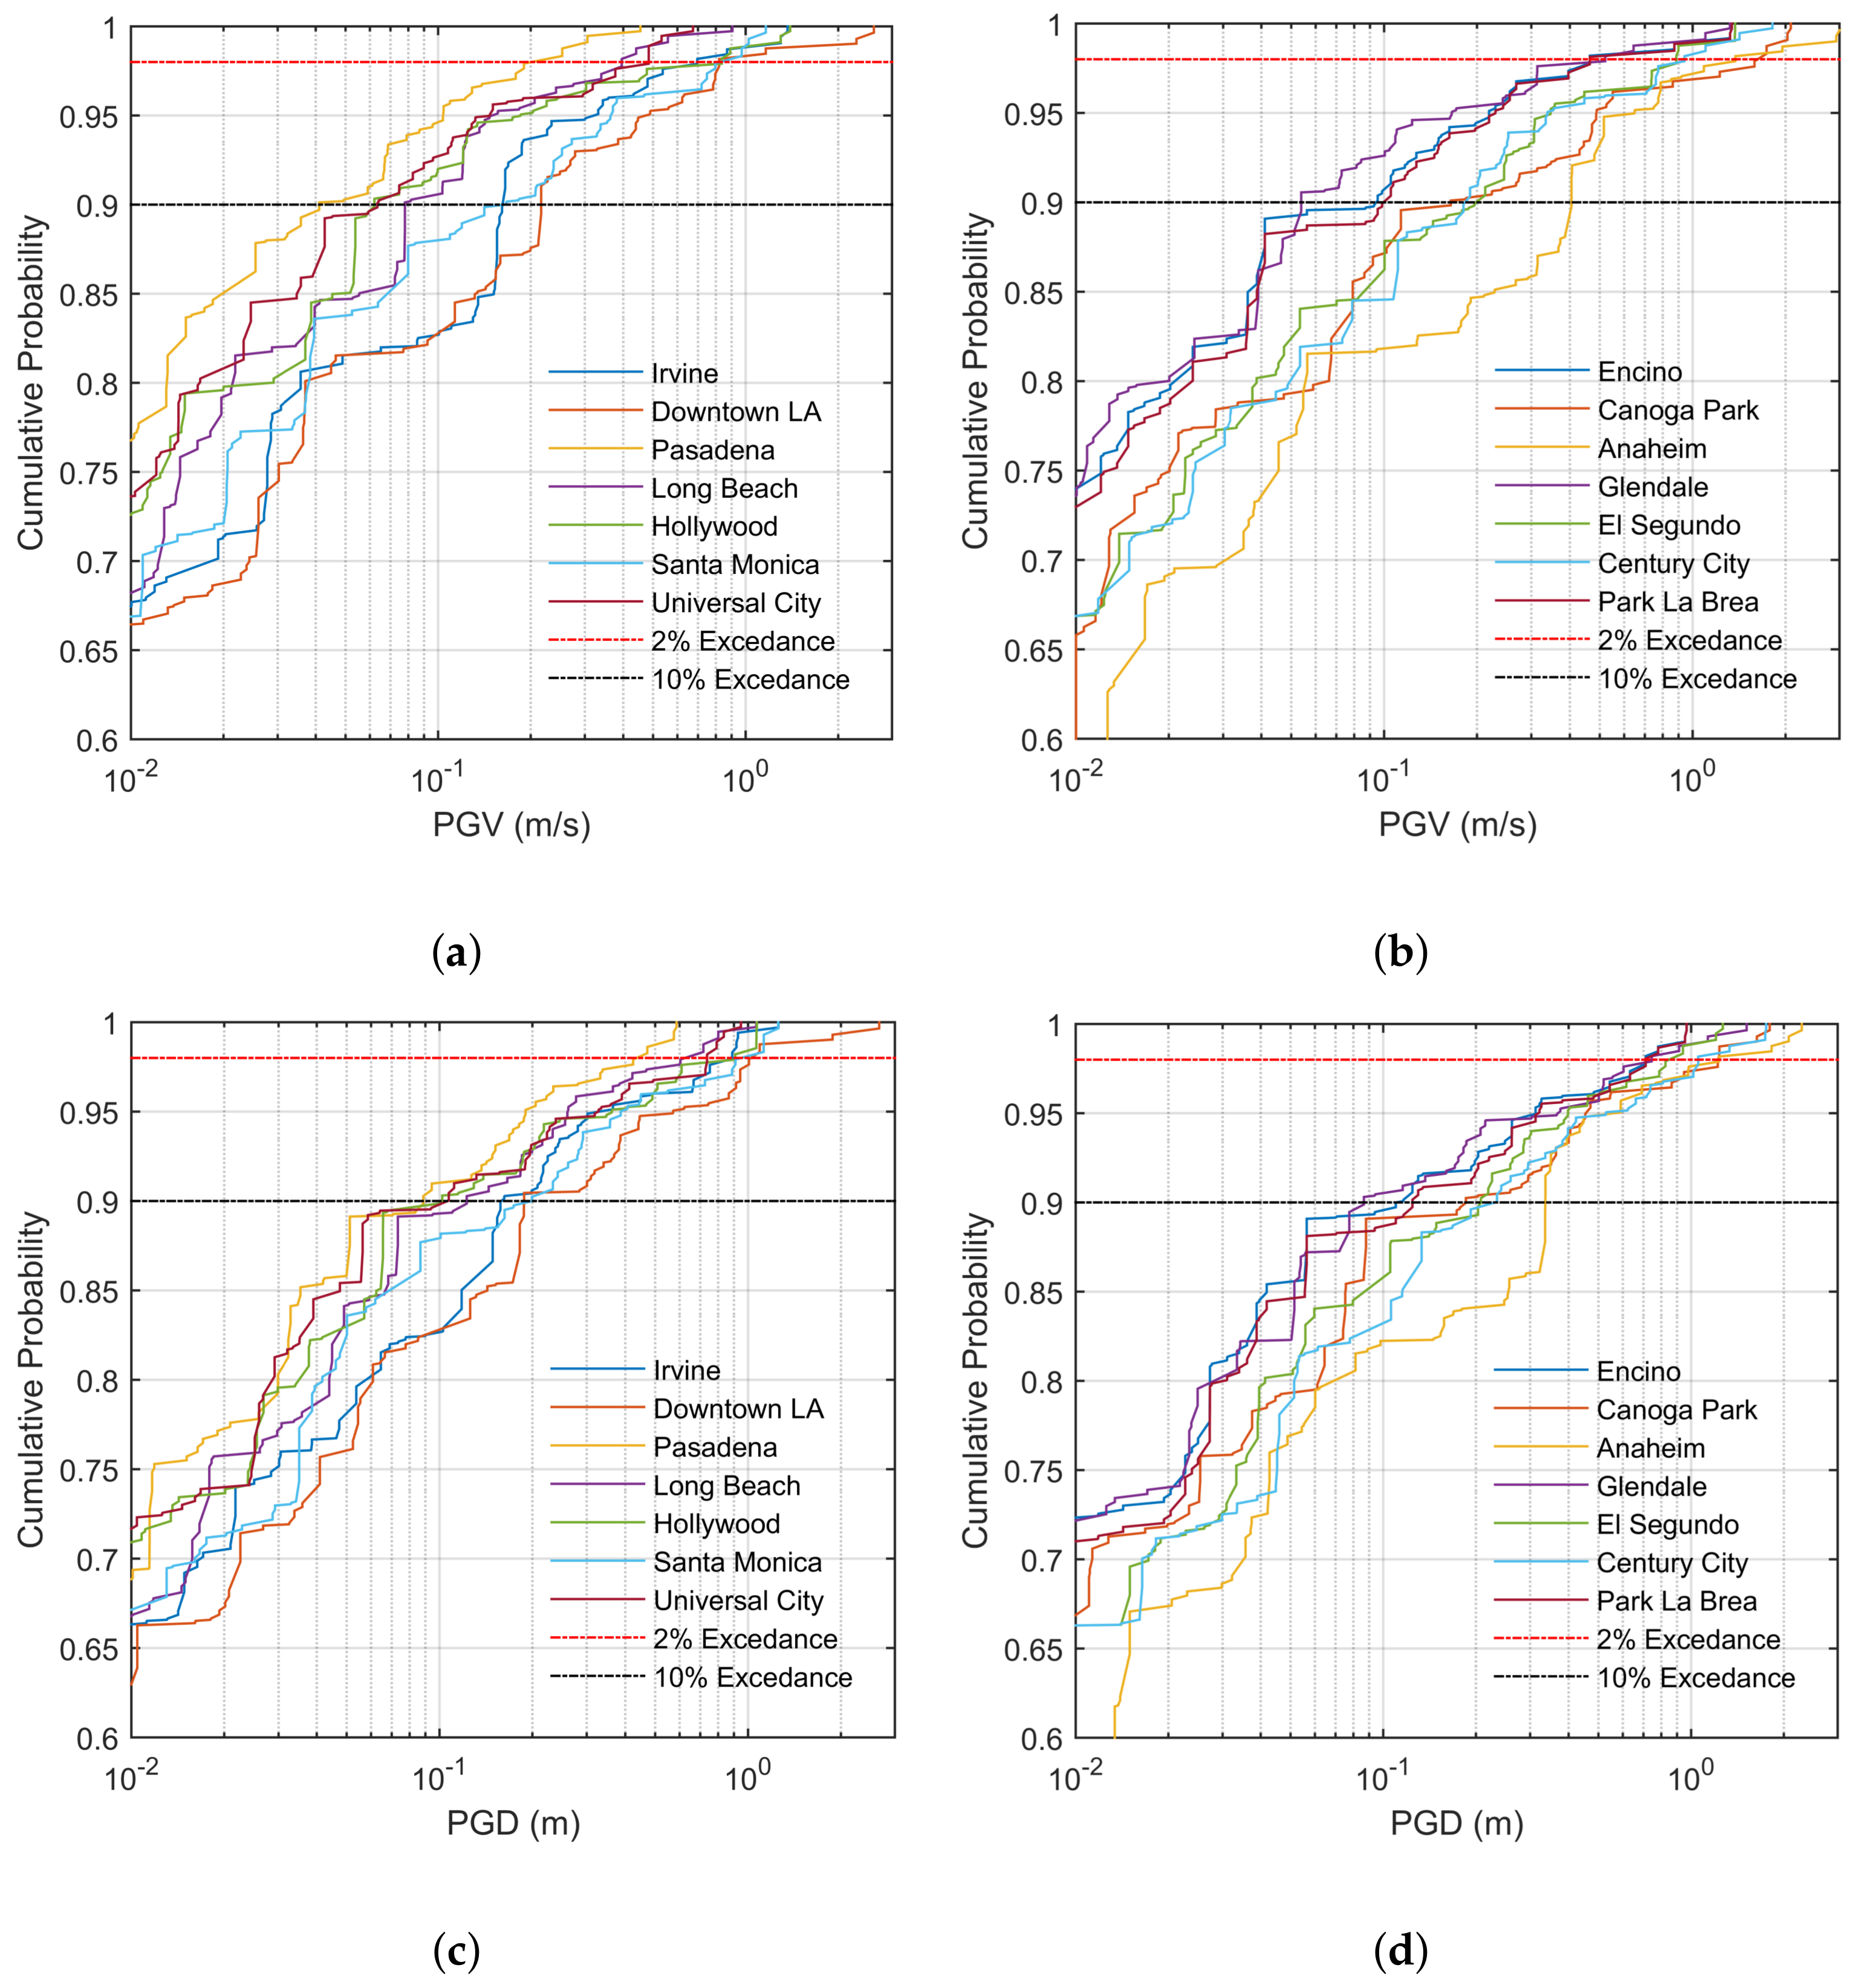
Having computed ground motions from the suite of 60 scenario earthquakes and having mapped the 30-year probability of occurrence of all plausible San Andreas fault earthquakes on to this set of earthquakes, we can now develop cumulative distribution functions (CDFs) of PGV and PGD. PGV and PGD predictions from the 60 earthquakes at the fourteen tall building locations in southern California are sorted in increasing order and their probabilities accumulated to create the CDFs. Shown in Figure 11 are the CDFs for the fourteen locations. Also marked on the figures are the 10% and 2% probabilities of exceedance levels for PGV and PGD. The PGV and PGD intercepts at all fourteen locations are listed in Table 4. The following observations can be made: (i) The PGVs at the 10% probability of exceedance level range from 0.05–0.40 m/s, while at the 2% probability of exceedance level they range from 0.20–1.63 m/s. The corresponding PGD ranges are 0.09–0.34 m and 0.44–1.23 m; (ii) For most stations, the variation in the PGV and PGD values at the 2% level is far greater than those at the 10% level. This is reflective of the contrasting long period ground motions that may be produced by larger events influenced strongly by basin structure, rupture directivity, and details of the seismic source (slip distribution, slip velocity and rupture velocity); (iii) The high 2% level PGV of 1.63 m/s and the correspondingly high PGD of 1.22 m at Canoga Park is a result of its relatively proximal location to the fault as compared to the other stations as well as the basin effect associated with the sedimentary deposit in the San Fernando valley; (iv) The high values of 1.38 m/s and 1.23 m at Anaheim, on the other hand, are associated more with rupture directivity and basin effects with Anaheim being located quite a distance away from the fault; (v) Downtown Los Angeles, being located close to the edge of the basin, escapes the harshest effects of basin amplification with 2% level PGV and PGD estimates of 0.82 m/s and 1.02 m, respectively. However, a few cycles at this level of shaking can be quite damaging to the tall buildings located there [67].

5. Discussion and Limitations

Using a single scenario earthquake to represent all forecast earthquakes within a magnitude bin is error-prone by construction. For instance, in the southern San Andreas case study, a magnitude 7.28 scenario earthquake is used to represent seismic risk from all earthquakes with magnitudes 7.15–7.45. To eliminate bias in the results, we have selected the scenario earthquake magnitude to be at the bin center based on seismic moment. However, if an alternate method is adopted to choose the magnitude of the scenario earthquake to be simulated such that the scenario earthquake happens to have a magnitude closer to the upper (or lower) limit of the bin, the lower (or higher) occurrence probability for the scenario earthquake assigned by our seismic moment release rate-based method automatically compensates for the introduced bias. For example, let there be just two forecast earthquakes, one with magnitude 7.15 and a yearly rate of 0.0010, and the other with magnitude 7.45 and a yearly rate of 0.0005. If we use an M w 7.28 scenario earthquake to represent this bin in our rupture-to-rafters simulations-based case study, our method would result in a scenario earthquake probability of occurrence of 0.045 over the next 30 years. If, on the other hand, an M w 7.40 scenario earthquake is used to represent this bin, the probability of occurrence drops to 0.030. Obviously, our rupture-to-rafters simulations would predict higher ground motions, heavier building damage, and losses when the 7.40 magnitude scenario earthquake is used. Fortunately, the lower probability of occurrence estimated for the M w 7.40 earthquake would at least partially offset these increases, perhaps resulting in comparable 30-year losses. Likewise, if we use a M w 7.18 scenario earthquake to represent this bin, the 30-year probability of occurrence increases to 0.063. This time the lower ground motions and economic losses predicted by the simulations would be at least partially offset by the higher occurrence probability. It is important to note that the errors associated with differences in ground motions from forecast and scenario earthquakes decrease monotonically with increasing density of magnitude and location sampling of scenario earthquakes. This is because the scenario earthquakes sources would monotonically tend to forecast earthquake sources.
The deaggregation of forecast earthquake rates into seismic moment release rates of the segments comprising the rupture solves another commonly encountered problem in PSHA. No matter what domain is chosen for the earthquakes to be considered in the PSHA, at least one or more of the forecast earthquakes will straddle the domain boundary, i.e., only portions of these ruptures will lie within the domain. Where in traditional GMPE-based PSHA, this problem would be circumvented by choosing a region of interest large enough to encompass all of the seismic sources that may contribute significantly to the hazard, it is not practical with rupture-to-rafters simulations-based PSHA. Maintaining the same sampling in rupture location would require many more scenario earthquake simulations and increase the computing resource demand significantly. The question then arises as to what fraction of the probability of occurrence of these earthquakes should be assigned to our closest-occurring scenario earthquake? The deaggregation in our method breaks these ruptures down to the participating segments, and within a small margin of error these segments will lie wholly either inside or outside the domain, thus automatically resolving this problem.
The ground motion estimates in this study have been generated by a limited set of six strike-slip events. The results are likely to be highly influenced by source model selection. To eliminate bias in the results and make them more robust, at each magnitude level, multiple source models from different faults may be used to generate additional scenarios. The size and location of slip asperities, rupture velocity distribution and source-time functions play a critical role in the resulting ground motion in addition to rupture directivity and basin effects considered here. Considering plausible variations in these parameters would lend greater credibility to the ground motion estimates. Likewise, the distribution just 5 rupture locations for the smaller magnitude earthquakes is not dense enough to adequately capture the distribution of shaking from the smaller events. While the sources for the large magnitude events overlap, this is not the case with the small magnitude scenarios. So sampling the full extent of the fault more densely should be a goal for future efforts.
The uniform sampling of scenario earthquakes used in the case study here was chosen for convenience. Sometimes, a non-uniform distribution of earthquakes may be preferred. For instance, one may wish to sample more densely fault regions of high earthquake probability density and/or fault regions whose earthquakes may result in greater variability in basin effects, etc. The outlined method can be used in these cases without any modification.
One of the limitations of our approach is the somewhat incompatible mixing of the highly precise wave propagation simulations using a highly discretized source with the gross nature of the forecast earthquake probabilities in the UCERF model. Three points are to be noted in this context: First, earthquake probabilities, however crude they may be, are needed to make real-world decisions. Only greater data-gathering over time and through ubiquitous instrumentation can help reduce the epistemic uncertainties. Second, the resolution of the data that is used to generate the UCERF model is coarse and good enough to estimate probabilities of occurrence of forecast earthquakes in a smeared manner alone, not high enough to provide recurrence information on fine patches/segments of the source. While this is an inherent limitation of UCERF, it is still the only comprehensive source of earthquake probability information in California. Third, the outlined method does not result in any loss of the existing resolution in earthquake probabilities because segment sizes used in the mapping of the forecast earthquake probability space to the scenario earthquake probability space [in step (iii) of the method] are similar.
Finally, we should note that sometimes there may exist very low probability events that may extend beyond the domain of the rupture-to-rafters simulations. But because their contributions to structural collapse risk may be minuscule it may not be worthwhile to expand the domain of simulation to cover their full rupture extents. Yet their probability of occurrence may be included in the largest magnitude bin of the scenario earthquakes considered. A case in point is a wall-to-wall rupture on the San Andreas fault that extends from the (center of) SAF-Offshore section to the SAF-Coachella section have a recurrence time of 150,000 years. This rupture extends beyond the domain of our simulation to the north. But its probability of occurrence over, say, a period of 30 years is just 2 × 10 4 . Even assuming that the probability of a structure collapsing under ground motions from this event is 1.0, this still means that the probability of collapse of the structure over a 30 year period increases by just 2 × 10 4 . While the full rupture extent of this event is not considered in the study, its probability of occurrence is included as part of the highest magnitude bin of scenario earthquakes (7.78–8.34].

6. Conclusions

Quantitative probabilistic estimates of ground shaking may be produced by combining 3-D seismic wave propagation simulations of scenario earthquakes with earthquake probabilities from rupture forecasts developed using geodetic and paleoseismic data. The method involves choosing a set of scenario earthquakes spanning the fault of interest, mapping the probabilities of the typically vast set (thousands) of plausible earthquakes from the rupture forecast onto the set of scenario earthquakes, performing deterministic ground motion simulations of the scenario earthquakes, and developing CDFs of PGV and PGD over the targeted period of interest. In this paper, we have presented a case study of ground shaking estimates in the Los Angeles basin from earthquakes on the San Andreas fault over the next 30 years, illustrating the steps involved. Based on sixty simulated M w 6–8 scenario earthquakes on the San Andreas fault, we estimate the PGVs with 2% probability of exceedance over the next 30 years at the location of 14 tall building clusters to be 0.20–1.63 m/s. The corresponding PGDs are estimated at 0.44–1.23 m. Future work may involve greater number of rupture locations, multiple seismic source models at each magnitude level, bilateral ruptures, alternate methods of EGF selection, the inclusion of earthquakes on all regional faults (not just the San Andreas) and the consideration of time-dependent earthquake probabilities.

Acknowledgments

We thank Rob Graves (USGS), Chen Ji (UCSB), Dimitri Komatitsch (CNRS/University of Aix-Marseille), Thomas Heaton (Caltech), and Martin Main (KAUST) for their insights into various aspects of source modeling, earthquake mechanisms, and ground motion simulations. We also thank Edward Field (USGS), Morgan Page (USGS), and Kevin Milner (USC) for their assistance with UCERF and earthquake probability data. We are grateful to the Tromp research group for the continued development of SPECFEM3D. Financial support from the U.S. National Science Foundation (NSF-CMMI Award No. 0926962) is gratefully acknowledged.

Author Contributions

The conception of the central idea, development of the methodology, analysis and interpretation of data, and derivation of results and conclusions were performed jointly by Mourhatch and Krishnan. All simulations were carried out by Mourhatch.

Conflicts of Interest

The authors declare no conflicts of interest.

References

  1. Heaton, T.H.; Hall, J.F.; Wald, D.J.; Halling, M.W. Response of High-Rise and Base-Isolated Buildings to a Hypothetical Mw 7.0 Blind Thrust Earthquake. Science 1995, 267, 206–211. [Google Scholar] [CrossRef] [PubMed]
  2. Hall, J.F.; Heaton, T.H.; Halling, M.W.; Wald, D.J. Near-Source Ground Motion and its Effects on Flexible Buildings. Earthq. Spectra 1995, 11, 569–605. [Google Scholar] [CrossRef]
  3. Hall, J.F. Seismic Response of Steel Frame Buildings to Near-Source Ground Motions. Earthq. Eng. Struct. Dyn. 1998, 27, 1445–1464. [Google Scholar] [CrossRef]
  4. Krishnan, S.; Ji, C.; Komatitsch, D.; Tromp, J. Case Studies of Damage to Tall Steel Moment-Frame Buildings in Southern California during Large San Andreas Earthquakes. Bull. Seismol. Soc. Am. 2006, 96, 1523–1537. [Google Scholar] [CrossRef]
  5. Krishnan, S.; Ji, C.; Komatitsch, D.; Tromp, J. Performance of two 18-story steel moment-frame buildings in southern California during two large simulated San Andreas earthquakes. Earthq. Spectra 2006, 22, 1035–1061. [Google Scholar] [CrossRef]
  6. Muto, M.; Krishnan, S.; Beck, J.; Mitrani-Reiser, J. Seismic loss estimation based on end-to-end simulation. In Proceedings of the First International Symposium on Life-Cycle Civil Engineering, Varenna, Lake Como, Italy, 10–14 June 2008; pp. 215–232. [Google Scholar]
  7. Muto, M.; Krishnan, S. Hope for the Best, Prepare for the Worst: Response of Tall Steel Buildings to the ShakeOut Scenario Earthquake. Earthq. Spectra 2011, 27, 375–398. [Google Scholar] [CrossRef]
  8. Field, E.H.; Dawson, T.E.; Felzer, K.R.; Frankel, A.D.; Gupta, V.; Jordan, T.H.; Parsons, T.; Petersen, M.D.; Stein, R.S.; Weldon, R.J.; et al. Uniform California Earthquake Rupture Forecast, Version 2 (UCERF 2). Bull. Seismol. Soc. Am. 2009, 99, 2053–2107. [Google Scholar] [CrossRef]
  9. Field, E.; Biasi, G.; Bird, P.; Dawson, T.; Felzer, K.; Jackson, D.; Johnson, K.; Jordan, T.; Madden, C.; Michael, A.; et al. Uniform California Earthquake Rupture Forecast, Version 3 (UCERF3)—The Time-Independent Model: U.S. Geological Survey Open-File Report 2013-1165; California Geological Survey Special Report 228, and Southern California Earthquake Center Publication 1792; 2013; p. 97. Available online: http://pubs.usgs.gov/of/2013/1165/ (accessed on 15 January 2015).
  10. Biasi, G.; Anderson, J.G. Disaggregating UCERF3 for Site-Specific Applications. Earthq. Spectra 2016, 32, 2009–2026. [Google Scholar] [CrossRef]
  11. Porter, K.; Field, E.; Milner, K. Disaggregating UCERF3 for Site-Specific Applications. Earthq. Spectra 2017, 33, 857–874. [Google Scholar] [CrossRef]
  12. SRCMOD (Finite-Source Rupture Model Database). Finite-Source Rupture Model Database (Initiated by Martin Mai). Available online: http://equake-rc.info/SRCMOD/ (accessed on 15 September 2014).
  13. Ji, C.; Helmberger, D.; Wald, D. Preliminary slip history of the 2002 Denali earthquake. AGU Fall Meet. Abstr. 2002, 1, 1344. [Google Scholar]
  14. Bouchon, M.; Toksöz, M.N.; Karabulut, H.; Bouin, M.P.; Dietrich, M.; Aktar, M.; Edie, M. Space and time evolution of rupture and faulting during the 1999 Izmit (Turkey) earthquake. Bull. Seismol. Soc. Am. 2002, 92, 256–266. [Google Scholar] [CrossRef]
  15. Wald, D.J.; Heaton, T.H. Spatial and Temporal Distribution of Slip for the 1992 Landers, California, Earthquake. Bull. Seismol. Soc. Am. 1994, 84, 668–691. [Google Scholar]
  16. Wald, D.J. Slip History of the 1995 Kobe, Japan, Earthquake Determined from Strong Motion, Teleseismic, and Geodetic Data. J. Phys. Earth 1996, 44, 489–504. [Google Scholar] [CrossRef]
  17. Hartzell, S.H.; Heaton, T.H. Inversion of Strong Ground Motion and Teleseismic Waveform Data for the Fault Rupture History of the 1979 Imperial Valley, California, Earthquake. Bull. Seismol. Soc. Am. 1983, 73, 1553–1583. [Google Scholar]
  18. Custódio, S.; Liu, P.; Archuleta, R.J. The 2004 Mw 6.0 Parkfield, California, earthquake: Inversion of near-source ground motion using multiple data sets. Geophys. Res. Lett. 2005, 32, L23312. [Google Scholar] [CrossRef]
  19. WGCEP (Working Group on California Earthquake Probabilities). Earthquake Probabilities in the San Francisco Bay Region: 2002–2031; U.S. Geological Survey Open-File Report 03-214; Working Group On California Earthquake Probabilities: Los Angeles, CA, USA, 2003. [Google Scholar]
  20. Sieh, K. Prehistoric Large Earthquakes Produced by Slip on the San Andreas Fault at Pallett Creek, California. J. Geophys. Res. Solid Earth 1978, 83, 3907–3939. [Google Scholar] [CrossRef]
  21. Bakun, W.H.; Lindh, A.G. The Parkfield, California, Earthquake PredictionExperiment. Science 1985, 229, 619–624. [Google Scholar] [CrossRef] [PubMed]
  22. Magistrale, H.; McLaughlin, K.; Day, S. A geology-based 3D velocity model of the Los Angeles basin sediments. Bull. Seismol. Soc. Am. 1996, 86, 1161–1166. [Google Scholar]
  23. Magistrale, H.; Day, S.; Clayton, R.W.; Graves, R. The SCEC Southern California Reference Three-Dimensional Seismic Velocity Model Version 2. Bull. Seismol. Soc. Am. 2000, 90, S65–S76. [Google Scholar] [CrossRef]
  24. Kohler, M.D.; Magistrale, H.; Clayton, R.W. Mantle Heterogeneities and the SCEC Reference Three-Dimensional Seismic Velocity Model Version 3. Bull. Seismol. Soc. Am. 2003, 93, 757–774. [Google Scholar] [CrossRef]
  25. Süss, M.P.; Shaw, J.H. P wave seismic velocity structure derived from sonic logs and industry reflection data in the Los Angeles basin, California. J. Geophys. Res. 2003, 108, 1–18. [Google Scholar] [CrossRef]
  26. Prindle, K.; Tanimoto, T. Teleseismic surface wave study for S-wave velocity structure under an array: southern California. Geophys. J. Int. 2006, 166, 601–621. [Google Scholar] [CrossRef]
  27. Tape, C.; Liu, Q.; Maggi, A.; Tromp, J. Adjoint tomography of the southern California crust. Science 2009, 325, 988–992. [Google Scholar] [CrossRef] [PubMed]
  28. Tape, C.; Liu, Q.; Maggi, A.; Tromp, J. Seismic tomography of the southern California crust based on spectral element and adjoint methods. Geophys. J. Int. 2010, 180, 433–462. [Google Scholar] [CrossRef]
  29. Ely, G.; Jordan, T.H.; Small, P.; Maechling, P.J. A V s 30 derived Near-surface Seismic Velocity Model. In Proceedings of the American Geophysical Union Fall Meeting, San Francisco, CA, USA, 13–17 December 2010. [Google Scholar]
  30. Plesch, A.; Tape, C.; Graves, R.; Shaw, J.H.; Small, P.; Ely, G. Updates for the CVM-H including new representations of the offshore Santa Maria and San Bernardino basins and a new Moho surface. In Proceedings of the SCEC 2011 Annual Meeting, Southern California Earthquake Center, Palm Springs, CA, USA, 11–14 September 2011; p. Poster B-128. [Google Scholar]
  31. Olsen, K.; Archuleta, R.; Matarese, J. Three dimensional simulation of a magnitude 7.75 earthquake on the San Andreas fault. Science 1995, 270, 1628–1632. [Google Scholar] [CrossRef]
  32. Bao, H.; Bielak, J.; Ghattas, O.; Kallivokas, L.F.; O’Hallaron, D.R.; Shewchuk, J.R.; Xu, J. Large-scale simulation of elastic wave propagation in heterogeneous media on parallel computers. Comput. Methods Appl. Mech. Eng. 1998, 152, 85–102. [Google Scholar] [CrossRef]
  33. Graves, R.W. Three-dimensional finite-difference modeling of the San Andreas fault: Source parameterization and ground-motion levels. Bull. Seismol. Soc. Am. 1998, 88, 881–897. [Google Scholar]
  34. Akcelik, V.; Bielak, J.; Biros, G.; Epanomeritakis, I.; Fernandez, A.; Ghattas, O.; Kim, E.J.; Lopez, J.; O’Hallaron, D.; Tu, T.; et al. High resolution forward and inverse earthquake modeling on terascale computers. In Proceedings of the IEEE 2003 ACM/IEEE Conference Supercomputing, Phoenix, AZ, USA, 15–21 November 2003; p. 52. [Google Scholar]
  35. Komatitsch, D.; Liu, Q.; Tromp, J.; Süss, P.; Stidham, C.; Shaw, J.H. Simulations of ground motion in the Los Angeles basin based upon the spectral-element method. Bull. Seismol. Soc. Am. 2004, 94, 187–206. [Google Scholar] [CrossRef]
  36. Liu, Q.; Polet, J.; Komatitsch, D.; Tromp, J. Spectral-element moment tensor inversions for earthquakes in Southern California. Bull. Seismol. Soc. Am. 2004, 94, 1748–1761. [Google Scholar] [CrossRef]
  37. Komatitsch, D.; Erlebacher, G.; Göddeke, D.; Michéa, D. High-order finite-element seismic wave propagation modeling with MPI on a large GPU cluster. J. Comput. Phys. 2010, 229, 7692–7714. [Google Scholar] [CrossRef]
  38. Komatitsch, D. Fluid-solid coupling on a cluster of GPU graphics cards for seismic wave propagation. C. R. Mécanique 2011, 339, 125–135. [Google Scholar] [CrossRef]
  39. Mai, P.M.; Imperatori, W.; Olsen, K.B. Hybrid Broadband Ground-Motion Simulations: Combining Long-Period Deterministic Synthetics with High-Frequency Multiple S-to-S Backscattering. Bull. Seismol. Soc. Am. 2010, 100, 2124–2142. [Google Scholar] [CrossRef]
  40. Graves, R.; Pitarka, A. Broadband ground-motion simulation using a hybrid approach. Bull. Seismol. Soc. Am. 2010, 100, 2095–2113. [Google Scholar] [CrossRef]
  41. Mourhatch, R. Quantifying Earthquake Collapse Risk of Tall Steel Braced Frame Buildings Using Rupture-to-Rafters Simulations. Ph.D. Thesis, California Institute of Technology, Pasadena, CA, USA, 2015. [Google Scholar]
  42. Kellogg, L. Computational Infrastructure for Geodynamics. 2011. Available online: http://geodynamics.org. (accessed on 06 April 2018).
  43. Komatitsch, D.; Tromp, J. Introduction to the spectral element method for three-dimensional seismic wave propagation. Geophys. J. Int. 1999, 139, 806–822. [Google Scholar] [CrossRef]
  44. Hauksson, E. Crustal structure and seismicity distribution adjacent to the Pacific and the north America plate boundary in southern California. J. Geophys. Res. 2000, 105, 13875–13903. [Google Scholar] [CrossRef]
  45. Lin, G.; Shearer, P.M.; Hauksson, E.; Thurber, C.H. A three-dimensional crustal seismic velocity model for southern California from a composite event method. J. Geophys. Res. Solid Earth (1978–2012) 2007, 112. [Google Scholar] [CrossRef]
  46. Casarotti, E.; Stupazzini, M.; Lee, S.J.; Komatitsch, D.; Piersanti, A.; Tromp, J. CUBIT and seismic wave propagation based upon the spectral-element method: An advanced unstructured mesher for complex 3D geological media. In Proceedings of the 16th International Meshing Roundtable, Seattle, WA, USA, 2 October 2017; Springer: Berlin, Germany, 2008; pp. 579–597. [Google Scholar]
  47. Sandia National Laboratory. CUBIT: Geometry and Mesh Generation Toolkit. 2011. Available online: http://cubit.sandia.gov. (accessed on 06 April 2018).
  48. Hartzell, S.H. Earthquake Aftershocks as Green’s Functions. Geophys. Res. Lett. 1978, 5, 1–4. [Google Scholar] [CrossRef]
  49. Irikura, K. Semi-empirical estimation of strong ground motions during large earthquakes. Bull. Disaster Prev. Res. Inst. 1983, 33, 63–104. [Google Scholar]
  50. Irikura, K. Prediction of Strong Acceleration Motions Using empirical Green’s Functions. In Proceedings of the Seventh Japan Earthquake Engineering Symposium, Tokyo, Japan, 2–9 August 1986; pp. 151–156. [Google Scholar]
  51. Joyner, W.; Boore, D. On simulating large earthquakes by Green’s-function addition of smaller earthquakes. Earthq. Source Mech. 1986. [Google Scholar] [CrossRef]
  52. Heaton, T.H.; Hartzell, S.H. Estimation of strong ground motions from hypothetical earthquakes on the Cascadia subduction zone, Pacific Northwest. Pure Appl. Geophys. 1989, 129, 131–201. [Google Scholar] [CrossRef]
  53. Hutchings, L.; Wu, F. Empirical Green’s Functions From Small Earthquakes A Waveform Study of Locally Recorded Aftershocks of The San Fernando Earthquake. J. Geophys. Res. 1990, 95, 1187–1214. [Google Scholar] [CrossRef]
  54. Somerville, P.; Sen, M.; Cohee, B. Simulation of strong ground motions recorded during the 1985 Michoacan, Mexico and Valparaiso, Chile earthquakes. Bull. Seismol. Soc. Am. 1991, 81, 1–27. [Google Scholar]
  55. Hutchings, L. Prediction of Strong Ground Motion for the 1989 Loma Prieta earthquake using Empirical Green’s Functions. Bull. Seismol. Soc. Am. 1991, 81, 88–122. [Google Scholar]
  56. Hutchings, L. Kinematic Earthquake Models and Synthesized Ground Motion using empirical Green’s functions. Bull. Seismol. Soc. Am. 1994, 84, 1028–1050. [Google Scholar]
  57. Tumarkin, A.G.; Archuleta, R.J. Empirical ground Motion Prediction. Annali Di Geofisica 1994, XXXVII, 1691–1720. [Google Scholar]
  58. Frankel, A. Simulating Strong motions of large earthquakes using recordings of small earthquakes: The Loma Prieta mainshock as a test case. Bull. Seismol. Soc. Am. 1995, 85, 1144–1160. [Google Scholar]
  59. Brune, J.N. Tectonic Stress and the Spectra of Seismic Shear Waves from Earthquakes. J. Geophys. Res. 1970, 75, 4997–5009. [Google Scholar] [CrossRef]
  60. Campbell, K.W.; Bozorgnia, Y. NGA Ground Motion Model for the Geometric Mean Horizontal Component of PGA, PGV, PGD and 5% Damped Linear Elastic Response Spectra for Periods Ranging from 0.01 to 10 s. Earthq. Spectra 2008, 24, 139–171. [Google Scholar] [CrossRef]
  61. Wald, D.J.; Allen, T.I. Topographic Slope as a Proxy for Seismic Site Conditions and Amplification. Bull. Seismol. Soc. Am. 2007, 97, 1379–1395. [Google Scholar] [CrossRef]
  62. Bozorgnia, Y.; Abrahamson, N.A.; Al Atik, L.; Ancheta, T.D.; Atkinson, G.M.; Baker, J.W.; Baltay, A.; Booreg, D.M.; Campbell, K.W.; Chioui, B.S.J.; et al. NGA-West2 Research Project. Earthq. Spectra 2014, 30, 973–987. [Google Scholar] [CrossRef]
  63. Hudnut, K.; Aagaard, B.; Graves, R.; Jones, L.; Jordan, T.; Star, L.; Stewart, J. ShakeOut Earthquake Source Description, Surface Faulting and Ground Motions. US Geol. Surv. Open File Rep. 2008, 1150, 2008. [Google Scholar]
  64. Graves, R.W.; Aagaard, B.T.; Hudnut, K.W. The ShakeOut Earthquake Source and Ground Motion Simulations. Earthq. Spectra 2011, 27, 273–291. [Google Scholar] [CrossRef]
  65. Bielak, J.; Graves, R.W.; Olsen, K.B.; Taborda, R.; Ramírez-Guzmán, L.; Day, S.M.; Ely, G.P.; Roten, D.; Jordan, T.H.; Maechling, P.J.; et al. The ShakeOut earthquake scenario: Verification of three simulation sets. Geophys. J. Int. 2010, 180, 375–404. [Google Scholar] [CrossRef]
  66. Olsen, K.; Day, S.; Dalguer, L.; Mayhew, J.; Cui, Y.; Zhu, J.; Cruz-Atienza, V.; Roten, D.; Maechling, P.; Jordan, T.; et al. ShakeOut-D: Ground Motion Estimates Using an Ensemble of Large Earthquakes on the Southern San Andreas Fault with Spontaneous Rupture Propagation. Geophys. Res. Lett. 2009, 36. [Google Scholar] [CrossRef]
  67. Krishnan, S.; Muto, M. Sensitivity of the Earthquake Response of Tall Steel Moment Frame Buildings to Ground Motion Features. J. Earthq. Eng. 2013, 17, 673–698. [Google Scholar] [CrossRef]
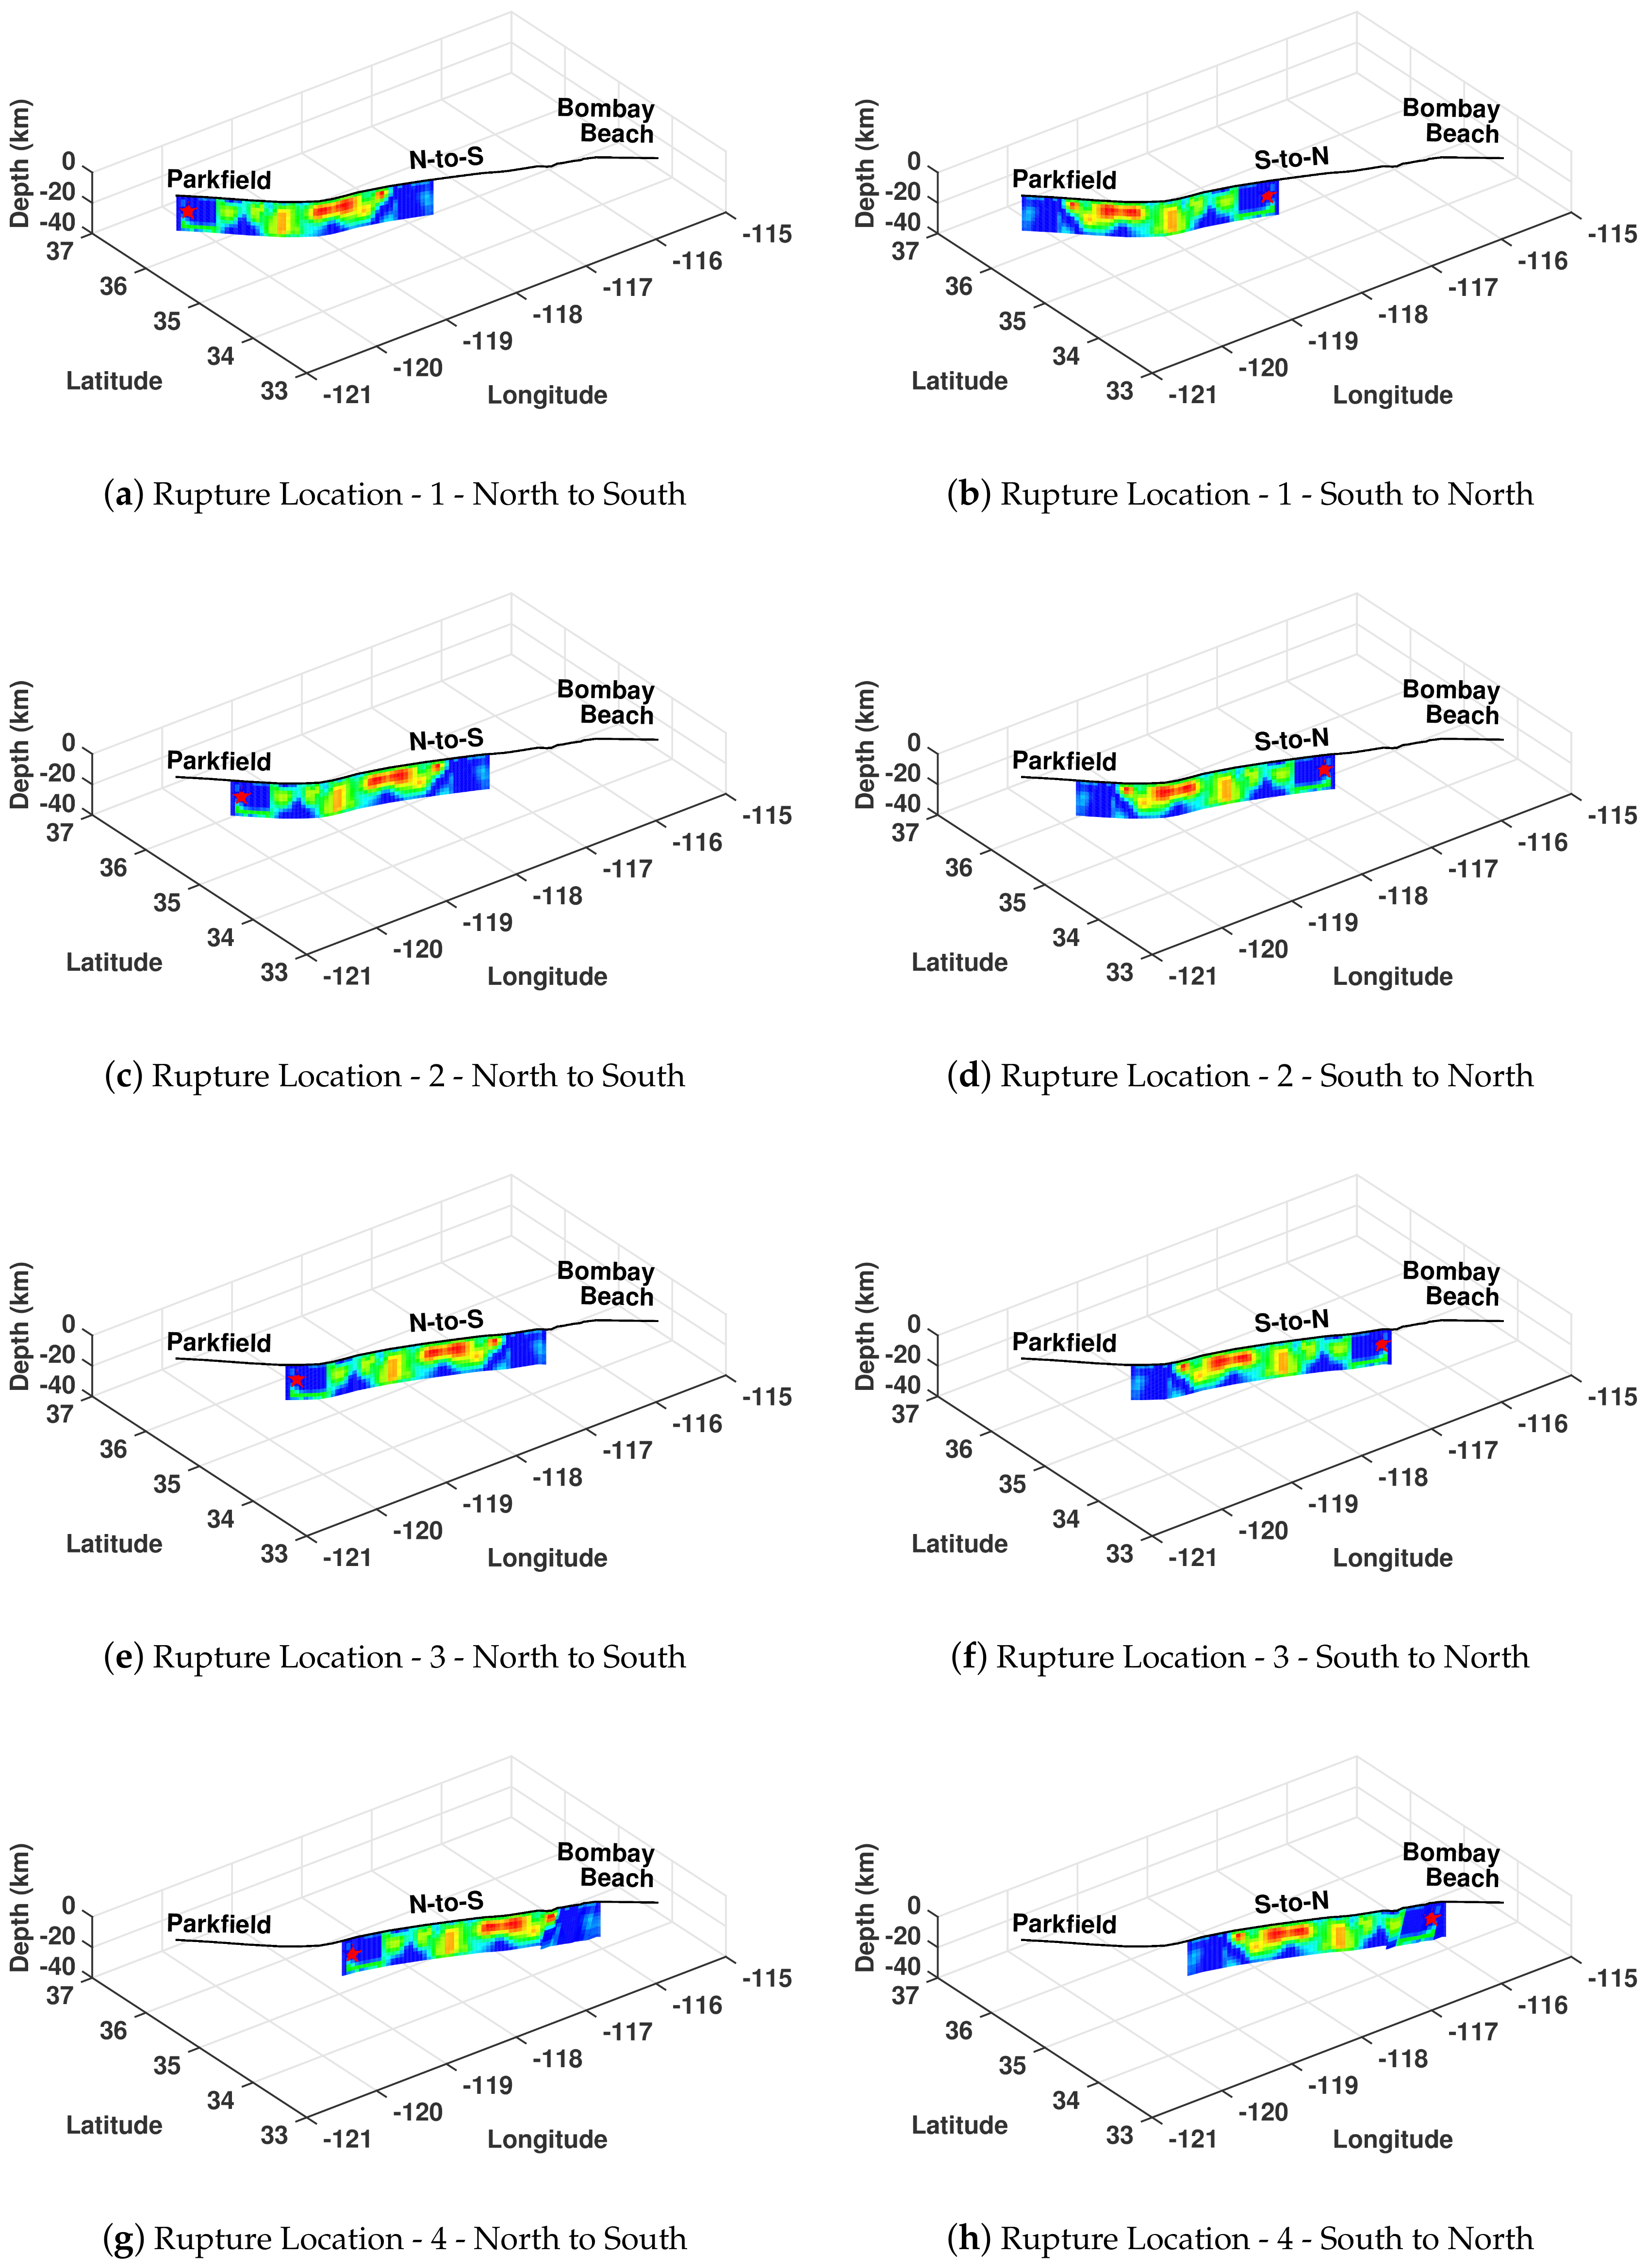
Figure 1. Kinematic finite source model of the 2002 Mw 7.9 Denali earthquake mapped on the southern San Andreas fault at five locations. Blue areas represent regions of small slip and red areas represent regions of large slip (peak slip of about 12 m). The left column illustrates the five north-to-south propagating scenario earthquakes whereas the right column illustrates the south-to-north propagating earthquakes. Note that in reversing the rupture direction, the slip distribution is flipped as well. The red stars correspond to the hypocenters.
Geosciences 08 00126 g001aGeosciences 08 00126 g001b
Figure 2. All plausible (or “forecast”) earthquakes that rupture at least one segment of the southern section of the San Andreas fault (from Parkfield in central California to Bombay Beach in southern California, shown in red). The X axis identifies the extent of rupture of a forecast earthquake and the Y axis identifies its magnitude. Line colors indicate forecast earthquake occurrence probabilities, with warmer colors (red, orange) indicative of higher probability of occurrence and colder colors (blue) indicative of lower probability of occurrence.
Geosciences 08 00126 g002
Figure 3. The 30 scenario earthquakes (shown in black) superposed on top of the forecast earthquakes from Figure 2. Two rupture directions are considered for each, bringing the total number of scenario earthquakes to 60. Dashed black lines demarcate the magnitude bins adopted in the case study. Colored lines demarcate UCERF’s plausible (“forecast”) earthquakes.
Geosciences 08 00126 g003
Figure 4. Illustrative example of the method used to derive scenario earthquake probabilities from forecast earthquake probabilities. Horizontal blue line: target fault. Dotted black lines: fault segmentation. Red unfilled rectangles: forecast earthquakes (F.E.) with seismic moment rates indicated by rectangle heights [step (ii) of method]. Yellow shaded region: seismic moment rate contributions of several forecast earthquakes to a given segment (step iii). Red shaded region: summation of yellow shaded regions (step iv). Magenta colored region: seismic moment rate of a scenario earthquake (S.E.) by summing the moment rates of all the segments (step v). Magenta lines: rupture extent of S.E.s.
Geosciences 08 00126 g004
Figure 5. (a,b) Median peak geometric mean horizontal displacement (m) and velocity (m/s). (c,d) 5%-damped spectral acceleration at 1 s and 0.2 s periods, in units of “g”, plotted as a function of earthquake magnitude from scenario earthquake simulations (blue lines) and the Campbell-Bozorgnia NGA (red lines). The vertical bars correspond to the one standard deviation spread above and below the median values.
Geosciences 08 00126 g005
Figure 6. Comparison of maps of median peak geometric mean horizontal velocities (m/s) in the Los Angeles basin from simulations of ten scenario San Andreas fault earthquakes at three magnitude levels to predictions using the CB-08 NGA relations. (a,b) Magnitude Mw 7.28, (c,d) Magnitude Mw 7.59, and (e,f) Magnitude Mw 7.89.
Geosciences 08 00126 g006aGeosciences 08 00126 g006b
Figure 7. Basin depth (km) map for southern California. Red triangles indicate the geographical distribution of the 636 southern California sites where ground motions from the scenario earthquakes are computed. The ellipses identify the basins in southern California: Simi valley, San Fernando valley, San Gabriel valley and Los Angeles basin.
Geosciences 08 00126 g007
Figure 8. Predictions of spectral accelerations at 1 s and 3 s periods for the ten M w 7.89 scenario earthquakes (five locations and two rupture directions) by simulations and the CB-08 Next Generation Attenuation (NGA) relations. (a,b) Median values as a function of the Joyner-Boore source-to-site distance; (c,d) Median S a maps from simulations; (e,f) Median S a maps from CB-08 NGA relations.
Geosciences 08 00126 g008
Figure 9. Directivity effect: Comparison of simulated peak horizontal velocity from north-to-south and south-to-north ruptures of the magnitude 7.89 scenario earthquake at locations 1 (a,b) and 5 (c,d).
Geosciences 08 00126 g009
Figure 10. Geometric mean of peak horizontal ground velocities under the (a) simulated M w 7.89 south-to-north propagating scenario earthquake at location 5, (b) the south-to-north propagating M w 7.80 ShakeOut scenario earthquake rupturing the San Andreas fault from Bombay Beach in the south to Lake Hughes in the north, and (c) the predictions by the CB-08 NGA relations.
Geosciences 08 00126 g010
Figure 11. Cumulative Distribution Functions of (a,b) PGV and (c,d) PGD at the fourteen tall building cluster locations in southern California from San Andreas fault earthquakes over the next 30 years.
Geosciences 08 00126 g011
Table 1. List of past earthquakes with fault geometry and rupture mechanisms closely matching earthquakes on the San Andreas fault whose kinematic finite source inversions are used in this study. The salient source parameters are listed as well.
NameDateLocation M w Length (km)Depth (km)Dip ( )Rake ( )Reference
1Denali2002AK, USA7.89290.020.090.0180.0[13]
2Izmit1999Turkey7.59155.018.090.0180.0[14]
3Landers1992CA, USA7.2878.015.089.0180.0[15]
4Kobe1995Japan6.9260.020.085.0180.0[16]
5Imperial Valley1979CA, USA6.5842.010.490.0180.0[17]
6Parkfield2004CA, USA6.0040.014.583.0180.9[18]
Table 2. UCERF3 time-independent 30-year occurrence probabilities for the 30 scenario earthquakes (six magnitudes and five rupture locations). Half of these probabilities are assigned to north-to-south propagating ruptures and the other half to south-to-north propagating ruptures.
M w [Bin]Location 1Location 2Location 3Location 4Location 5Total Probability
(Parkfield) (Bombay Beach)(All Locations)
6.00 [5.90–6.42]0.64490.04590.19100.24850.06850.8081
6.58 (6.42–6.80]0.00510.01000.08540.12800.01830.2288
6.92 (6.80–7.15]0.01800.01710.00600.07640.02710.1380
7.28 (7.15–7.45]0.02110.01820.00590.01530.03650.0935
7.59 (7.47–7.78]0.01240.01210.00610.00820.01920.0568
7.89 (7.78–8.34]0.03390.02810.02360.02250.02150.1231
Total Probability
M w [5.90–8.34]0.67600.12490.29040.42210.17730.8553
Table 3. Comparison of ground motion intensities from the ten (five locations and two rupture directions) simulated M w 7.89 scenario earthquakes against CB-08 NGA predictions at fourteen locations in southern California where a significant number of tall buildings exist.
Site LocationLatitudeLongitudeSimulatedCB-08Soil Type
PGV (m/s)PGD (m) S a 1 s (g) S a 3 s (g)PGV (m/s)PGD (m) S a 1 s (g) S a 3 s (g)UBCUBC
Md σ Md σ Md σ Md σ Md Md Md Md 9497
Irvine33.67117.800.460.350.560.290.210.170.150.180.211.180.170.08 S 3 S d
Encino34.16118.500.300.460.430.240.120.190.130.270.190.890.140.06 S 2 S c
Downtown LA34.05118.250.790.750.790.600.260.150.380.430.281.700.230.10 S 3 S d
Canoga Park34.20118.600.940.530.700.410.380.240.300.370.180.870.140.06 S 2 S c
Pasadena34.16118.130.130.090.200.130.040.100.010.030.150.770.120.05 S 3 S d
Anaheim33.84117.890.730.610.700.480.260.180.420.410.221.160.170.07 S 2 S c
Long Beach33.77118.190.260.210.330.270.140.100.080.090.231.380.190.09 S 3 S d
Glendale34.17118.250.260.330.400.300.150.090.080.150.200.930.150.06 S 2 S c
Hollywood34.10119.330.310.410.490.270.160.120.190.290.180.850.140.06 S 2 S c
El Segundo33.92118.410.630.390.600.290.180.130.220.190.201.090.160.07 S 3 S d
Santa Monica34.02118.480.660.320.680.300.170.100.160.120.190.940.140.06 S 2 S c
Century City34.08118.420.660.410.680.450.160.100.210.160.200.990.150.06 S 2 S c
Universal City34.14118.350.270.130.380.190.060.050.060.060.140.540.100.04 S 2 S c
Park La Brea34.06118.350.300.460.430.240.120.190.130.270.190.890.140.06 S 2 S c
Table 4. Probabilistic estimates of PGV and peak ground displacements (PGD) at 14 stations in southern California with probabilities of exceedance of 10% and 2% in 30 years from earthquakes on the San Andreas fault.
LocationPGV (m/s)PGD (m)
10%2%10%2%
Irvine0.160.700.160.89
Encino0.090.460.110.71
Downtown LA0.220.820.191.02
Canoga Park0.161.630.191.22
Pasadena0.040.200.090.44
Anaheim0.401.380.341.23
Long Beach0.080.400.120.63
Glendale0.050.520.090.74
Hollywood0.060.840.100.91
El Segundo0.200.890.210.85
Santa Monica0.160.830.200.95
Century City0.180.940.231.05
Universal City0.060.480.110.74
Park La Brea0.090.460.110.71