Formation MicroScanner Providing Better Answers for Carbonate Secondary Porosity in Alamein Dolomite Formation, NW Desert, Egypt


Abstract
1. Introduction
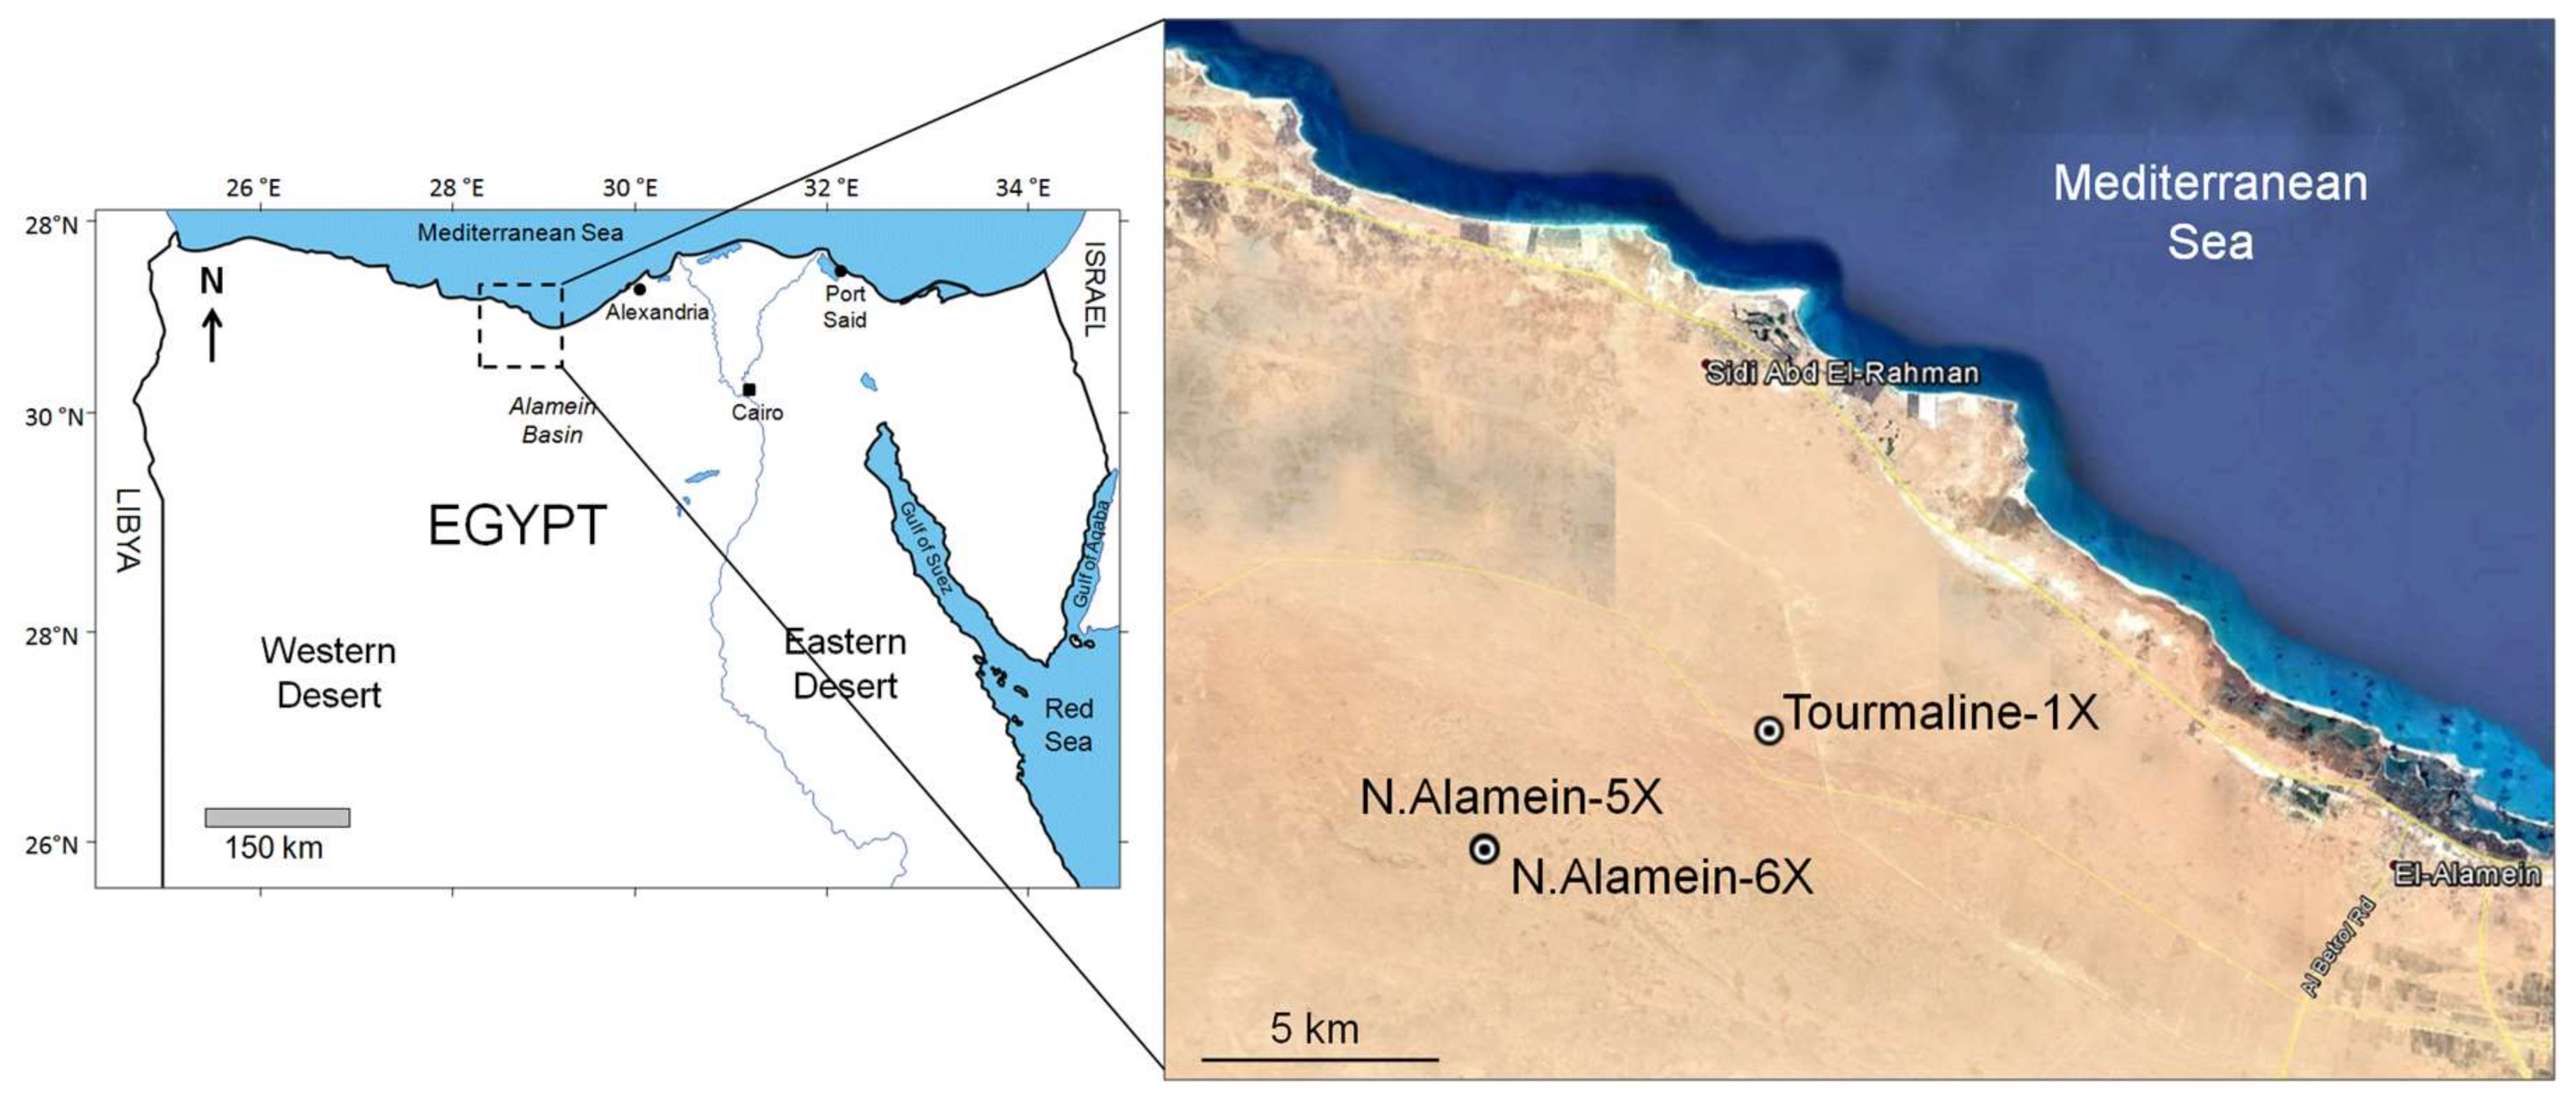
2. Study Area
2.1. Lithostratigraphy
2.2. Hydrocarbon Potential
3. Materials and Methods
3.1. Well Logging and Petrophysical Data
3.2. Formation MicroScanner
3.3. Core Photographs under White and UV Light
4. Results
4.1. Interpreted Well Logs and Petrophysical Results
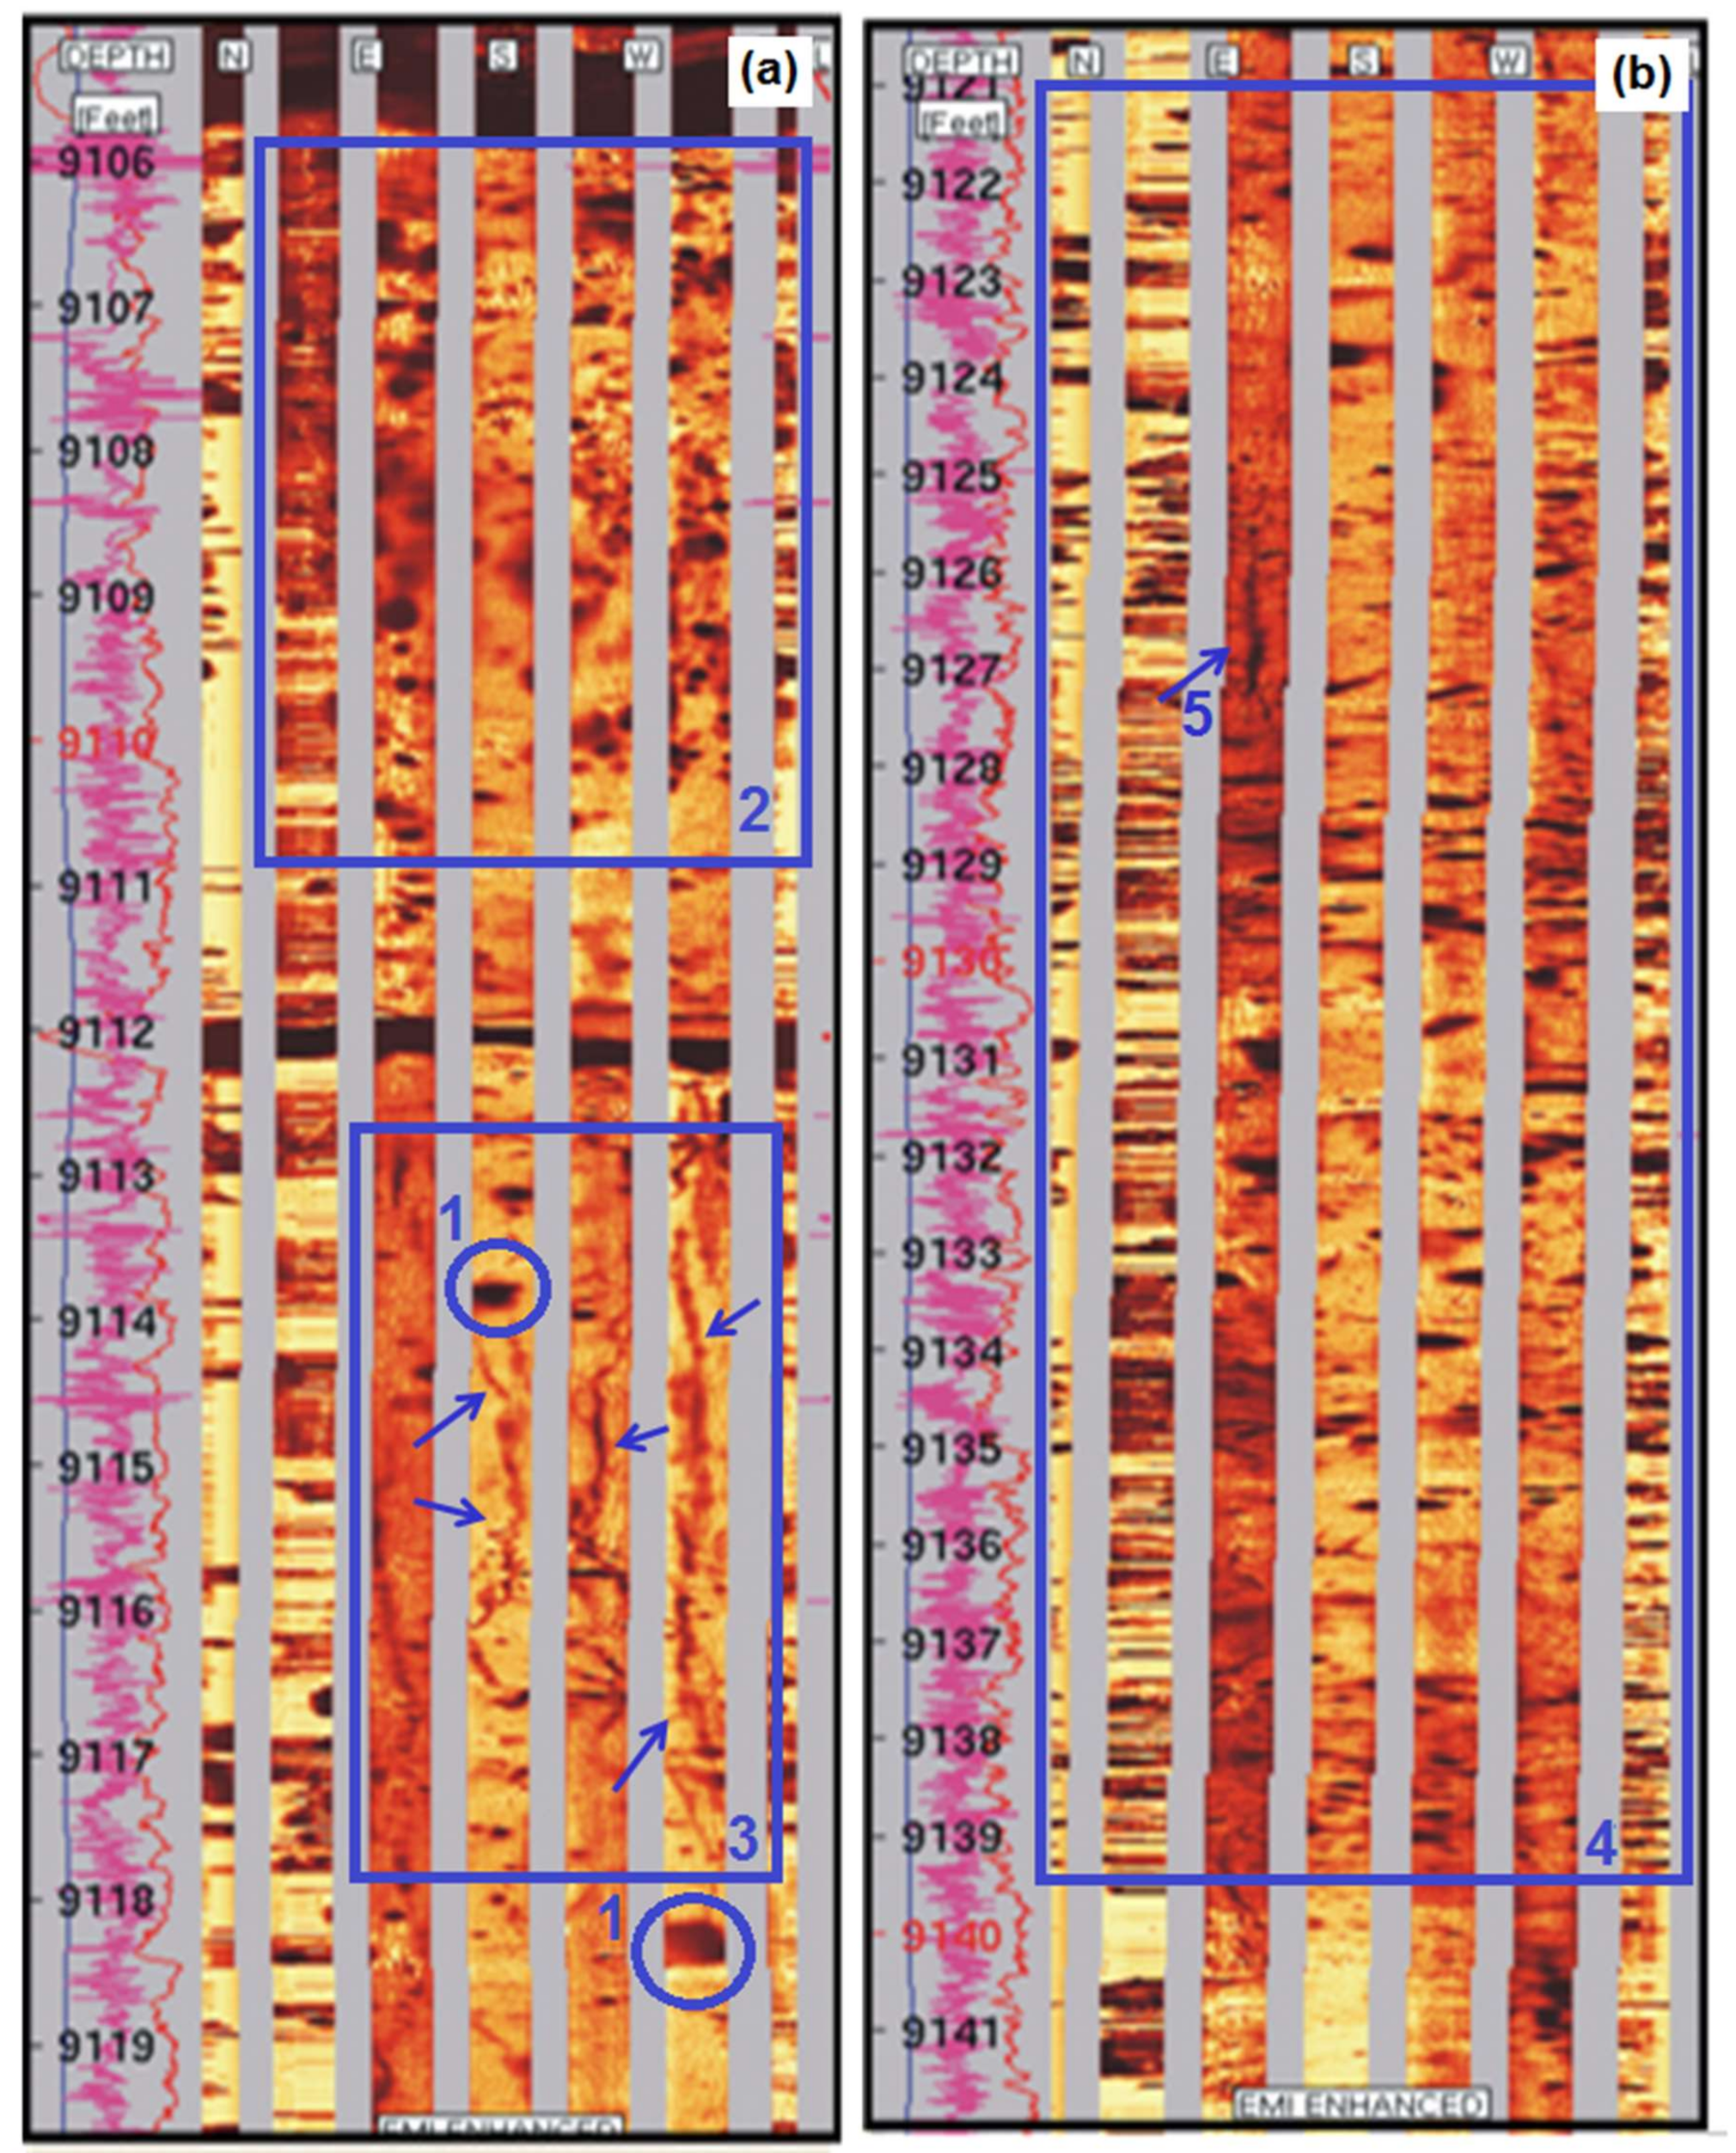
4.2. Secondary Porosity Derived from FMS
- (A)
- VugsIn the Tourmaline-1X well, FMS indicates that vuggy pores are very abundant and dominant across the whole studied interval (Figure 7 and Figure 8). These vugs vary in size and exist in forms of isolated and interconnected vugs. For example, a majority of isolated vugs is located in the interval of 9113.7–9118.4 ft (see Figure 7a). However, considering the two-dimensional nature of the FMS image, this assumed poorly-connected pore may well be connected. A large vug network is located in the interval between 9106 and 9111 ft. A number of poorly-interconnected smaller vugs also exist in intervals 9180–9182.5 ft and 9189–9191 ft. Besides these observations, however, most of the vugs in the studied Alamein Formation are well-connected. This fact correlates with the results of the petrophysical interpretation which yields high effective porosity values (Table 1). For example, vugs of various sizes are located in the zone 9121 ft–9139 ft (Figure 7b). Good quality carbonate reservoir sections containing abundant secondary porosity structures are observed at 9182.5–9189 ft and between 9357 ft and 9362 ft (Figure 8b). These vuggy intervals are in parallel agreement with the secondary porosity information obtained from well logs (Figure 3 and Figure 4), indicating good agreement between the two methods.
- (B)
- FracturesDrilling-induced vertical fractures can be seen in Tourmaline-1X well at the interval between 9113 ft and 9119 ft (Figure 7a) and are almost parallel to the borehole.
- (C)
- Channels
4.3. Core Evaluation Using White Light and UV Light
5. Discussion
5.1. Interpreted Well Logs and Petrophysical Results
5.2. Secondary Porosity Derived from FMS
5.3. Core Evaluation Using White Light and UV Light
6. Conclusions
Acknowledgments
Author Contributions
Conflicts of Interest
References
- Roehl, P.O.; Choduette, P.W. Carbonate Petroleum Reservoirs; Spring: New York, NY, USA, 1985; p. 622. [Google Scholar]
- Khoshbakht, F.; Azizzadeh, M.; Memarian, H.; Nourozi, G.H.; Moallemi, S.A. Comparison of electrical image log with core in a fractured carbonate reservoir. J. Petrol. Sci. Eng. 2012, 86–87, 289–296. [Google Scholar] [CrossRef]
- Abd El-Gawad, E.A. The use of well logs to determine the reservoir characteristics of Miocene rocks at the Bahar Northeast Field, Gulf of Suez, Egypt. J. Petrol. Geol. 2007, 30, 175–188. [Google Scholar] [CrossRef]
- Hakimi, M.H.; Shalaby, M.R.; Abdullah, W.H. Application of well log analysis to assess the petrophysical patterns of the Lower Cretaceous Biyad Formation, East Shabowah Oilfields, Masila Basin, Yemen. World Appl. Sci. J. 2012, 16, 1227–1238. [Google Scholar]
- Lahsin, A.; Morgen, S. Analysis of well log and pressure data of the gas-bearing sand reservoirs of Kafr El-Sheikh formation: Case study from the off-shore Nile Delta-Egypt. Int. J. Phys. Sci. 2012, 7, 5353–5366. [Google Scholar]
- Ahmed Abdel-Rahman, A.Y. Well log analysis and hydrocarbon potential of the Khoman Formation, GPT Field, North Western Desert, Egypt. World Appl. Sci. J. 2013, 28, 2288–2301. [Google Scholar]
- Shalaby, M.R.; Islam, M.A. Fracture detection using conventional well logging in carbonate Matulla Formation, Geisum Oilfield, Gulf of Suez, Egypt. J. Petrol. Explor. Prod. Technol. 2017, 7, 977–989. [Google Scholar] [CrossRef]
- Jumat, N.; Shalaby, M.R.; Islam, M.A. Integrated reservoir characterization of the Paleocene Farewell Formation, Taranaki Basin, New Zealand, using petrophysical and petrographical analyses. J. Petrol. Expl. Prod. Technol. 2017, 1–17. [Google Scholar] [CrossRef]
- Swee, P.D.; Shalaby, M.R.; Islam, M.A. Integrated Reservoir Characterization Study of the McKee Formation, Onshore Taranaki Basin, New Zealand. Geosciences 2018, 8, 105. [Google Scholar]
- Nurmi, R.; Charara, M.; Waterhouse, M.; Park, R. Heterogeneities in carbonate reservoirs: Detection and analysis using borehole electrical imagery. In Geological Applications of Wireline Logs; Hurst, A., Lovell, M.A., Morton, A.C., Eds.; Geological Society of London Special Publication: London, UK, 1990; Volume 48, pp. 95–111. [Google Scholar]
- Akbar, M.; Vissapragada, B.; Alghamdi, A.H.; Allen, D.; Herron, M.; Carnegie, A.; Dutta, D.; Olesen, J.R.; Chourasiya, R.D.; Logan, D.; et al. A snapshot of carbonate reservoir evaluation. Schlumberger Oilfield Rev. 2000, 12, 20–41. [Google Scholar]
- Russell, S.D.; Akbar, M.; Vissapragada, B.; Walkden, G.M. Rock types and permeability prediction from dipmeter and image logs: Shuaiba reservoir (Aptian), Abu Dhabi. AAPG Bull. 2002, 86, 1709–1732. [Google Scholar]
- Ahr, W.M.; Allen, D.; Boyd, A.; Bachman, H.N.; Smithson, T.; Clerke, E.A.; Gzara, K.B.M.; Hassal, J.K.; Murty, C.R.K.; Zubari, H.; Ramamoorthy, R. Confronting the carbonate conundrum. Schlumberger Oilfield Rev. Spring 2005, 17, 18–29. [Google Scholar]
- Wilson, M.E.; Lewis, D.; Yogi, O.; Holland, D.; Hombo, L.; Goldberg, A. Development of Papua New Guinean onshore carbonate reservoir: A comparative borehole image (FMI) and petrographic evaluation. Mar. Petrol. Geol. 2013, 44, 164–195. [Google Scholar] [CrossRef]
- Aadnoy, B.S. Inversion technique to determine the in-situ stress field from fracturing data. J. Petrol. Sci. Eng. 1990, 4, 127–141. [Google Scholar] [CrossRef]
- Brace, W.F. Permeability of crystalline and argillaceous rocks. Int. J. Rock Mech. Min. Sci. Geomech. 1980, 17, 241–251. [Google Scholar] [CrossRef]
- Aydin, A. Fractures, faults, and hydrocarbon entrapment, migration and flow. Mar. Petrol. Geol. 2000, 17, 797–814. [Google Scholar] [CrossRef]
- Gudmundsson, A. Fracture dimensions, displacements and fluid transport. J. Struct. Geol. 2000, 22, 1221–1231. [Google Scholar] [CrossRef]
- Michie, E.A.H.; Haines, T.J.; Healy, D.; Neilson, J.E.; Timms, N.E.; Wibberley, C.A.J. Influence of carbonate facies on fault zone architecture. J. Struct. Geol. 2014, 65, 82–99. [Google Scholar] [CrossRef]
- Michie, E.A.H. Influence of host lithofacies on fault rock variation in carbonate fault zones: A case study from the Island of Malta. J. Struct. Geol. 2015, 76, 61–79. [Google Scholar] [CrossRef]
- Trippetta, F.; Carpenter, B.M.; Mollo, S.; Scuderi, M.M.; Scarlato, P.; Collettini, C. Physical and Transport Property Variations within Carbonate-Bearing Fault Zones: Insights from the Monte Maggio Fault (Central Italy). Geochem. Geophys. Geosyst. 2017. [Google Scholar] [CrossRef]
- Sestini, G. Egypt. In Regional Petroleum Geology of the World, Part II: Africa, America, Australia and Antartica; Kulke, H., Ed.; Gebrüder Borntraeger: Berlin/Stuttgart, Germany, 1995; pp. 57–87. [Google Scholar]
- Elzarka, M.H. Mode of hydrocarbon generation and prospects of the northern part of the Western Desert, Egypt. J. Afr. Earth Sci. 1983, 14, 294–318. [Google Scholar] [CrossRef]
- Zein El-Din, M.Y.; Matbouly, S.I.; Moussa, S.M.; Kralik, M.A. Geochemistry and oil-oil correlations in the Western Desert; Abstract. In Proceedings of the 10th Egyptian Petroleum Conference, Cairo, Egypt, 7–19 November 1990. [Google Scholar]
- Abu el Naga, M. Paleozoic and Mesozoic depocentres and hydrocarbon generating areas, Northern Western Desert. In Proceedings of the EGPC 7th Exploration and Production Conference; EGPC: Cairo, Egypt, 1984; pp. 269–287. [Google Scholar]
- Metwalli, M.H.; Abd El-Hady, Y.E. Petrographic characteristics of oil-bearing rocks in Alamein oil field: Significance of source reservoir relations in North Western Desert, Egypt. AAPG Bull. 1975, 59, 510–523. [Google Scholar]
- Said, R. The Geology of Egypt; AA Balkerma: Rotterdam, The Netherlands, 1990; p. 734. [Google Scholar]
- Ahmed, M.A. Geodynamic Evolution and Petroleum System of Abu Gharadig Basin, North Western Desert, Egypt. Ph.D. Thesis, Institute of Geology and Geochemistry of Petroleum and Coal (LEK), RWTH-Aachen University Germany, Aachen, Germany, 2008; p. 255. [Google Scholar]
- Egypt Oil & Gas. Egypt Production Report; Egypt Oil & Gas: Cairo Governorate, Egypt, 2012; p. 143. [Google Scholar]
- Badr, A.R.; Ayoub, M.R. Study of a complex carbonate reservoir using the Formation MicroScanner (FMS) Tool. In Proceedings of the SPE Middle East Oil Technical Conference and Exhibition, Manama, Bahrain, 25–28 September 1989; pp. 507–516. [Google Scholar]
- Abdou, A. Deep wells in Khalda West: A brief review. In Proceedings of the 14th EGPC Petroleum Conference, Cairo, Egypt, 12–15 October 1998; pp. 517–533. [Google Scholar]
- Ekstrom, M.P.; Dahan, C.; Chen, M.Y.; Lloyd, P.; Rossi, D.J. Formation imaging with microelectrical scanning arrays. In Proceedings of the SPWLA 27th Annual Logging Symposium, London, UK, 29 June–2 July 1987; Volume 28, pp. 294–306. [Google Scholar]
- Serra, O. Formation Micoscanner Image Interpretation; Schlumberger Educational Service: Houston, TX, USA, 1989; p. 177. [Google Scholar]
- Beckman, H. Geological Prospecting of Petroleum; Halted Press: New York, NY, USA, 1918; pp. 97–111. [Google Scholar]
- Bowers, R.J. Rotary drilling investigative techniques and tools. In Hydrocarbon Contaminated Soils, Volume III; Kostecki, P.T., Calabrese, E.J., Eds.; Lewis Publishers: Chelsea, MI, USA, 1993; pp. 89–105. [Google Scholar]
- Kasaab, M.A.; Abdou, A.A.; El Gendy, M.G.; Shehata, M.G.; Abuhagaza, A.A. Mutual relations between petrographical and petrophysical properties of Cretaceous rock samples for some wells in the North Western Desert, Egypt. Egypt. J. Petrol. 2013, 22, 73–90. [Google Scholar] [CrossRef][Green Version]
- Exploration Logging, Inc. Mud Logging: Principles and Interpretations; IHRDC: Boston, MA, USA, 1985; p. 92. [Google Scholar]


| Thickness/Net | Porosity | Fluids | |||||||
|---|---|---|---|---|---|---|---|---|---|
| Borehole Wells | Top (ft) | Bottom (ft) | Gross (ft) | Net Reservoir (ft) | Net Pay (ft) | Ave PHIE (%) | Vsh (%) | Ave Sw (%) | Ave Sh (%) |
| Tourmaline-1X | 9070 | 9370 | 300 | 172.8 | 158.8 | 8 | 6.2 | 24.6 | 75.4 |
| N.Alamein-6X | 8988.5 | 9278 | 289.5 | 64.6 | 63.9 | 11.4 | 4.7 | 27.4 | 72.6 |
© 2018 by the authors. Licensee MDPI, Basel, Switzerland. This article is an open access article distributed under the terms and conditions of the Creative Commons Attribution (CC BY) license (http://creativecommons.org/licenses/by/4.0/).
Share and Cite
Shalaby, M.R.; Jumat, N.; Islam, M.A. Formation MicroScanner Providing Better Answers for Carbonate Secondary Porosity in Alamein Dolomite Formation, NW Desert, Egypt. Geosciences 2018, 8, 118. https://doi.org/10.3390/geosciences8040118
Shalaby MR, Jumat N, Islam MA. Formation MicroScanner Providing Better Answers for Carbonate Secondary Porosity in Alamein Dolomite Formation, NW Desert, Egypt. Geosciences. 2018; 8(4):118. https://doi.org/10.3390/geosciences8040118
Chicago/Turabian StyleShalaby, Mohamed R., Nurhazwana Jumat, and Md. Aminul Islam. 2018. "Formation MicroScanner Providing Better Answers for Carbonate Secondary Porosity in Alamein Dolomite Formation, NW Desert, Egypt" Geosciences 8, no. 4: 118. https://doi.org/10.3390/geosciences8040118
APA StyleShalaby, M. R., Jumat, N., & Islam, M. A. (2018). Formation MicroScanner Providing Better Answers for Carbonate Secondary Porosity in Alamein Dolomite Formation, NW Desert, Egypt. Geosciences, 8(4), 118. https://doi.org/10.3390/geosciences8040118