Lithogenic and Anthropogenic Components in Surface Sediments from Lake Limboto as Shown by Magnetic Mineral Characteristics, Trace Metals, and REE Geochemistry

 ,
,  , , , and
Abstract
1. Introduction
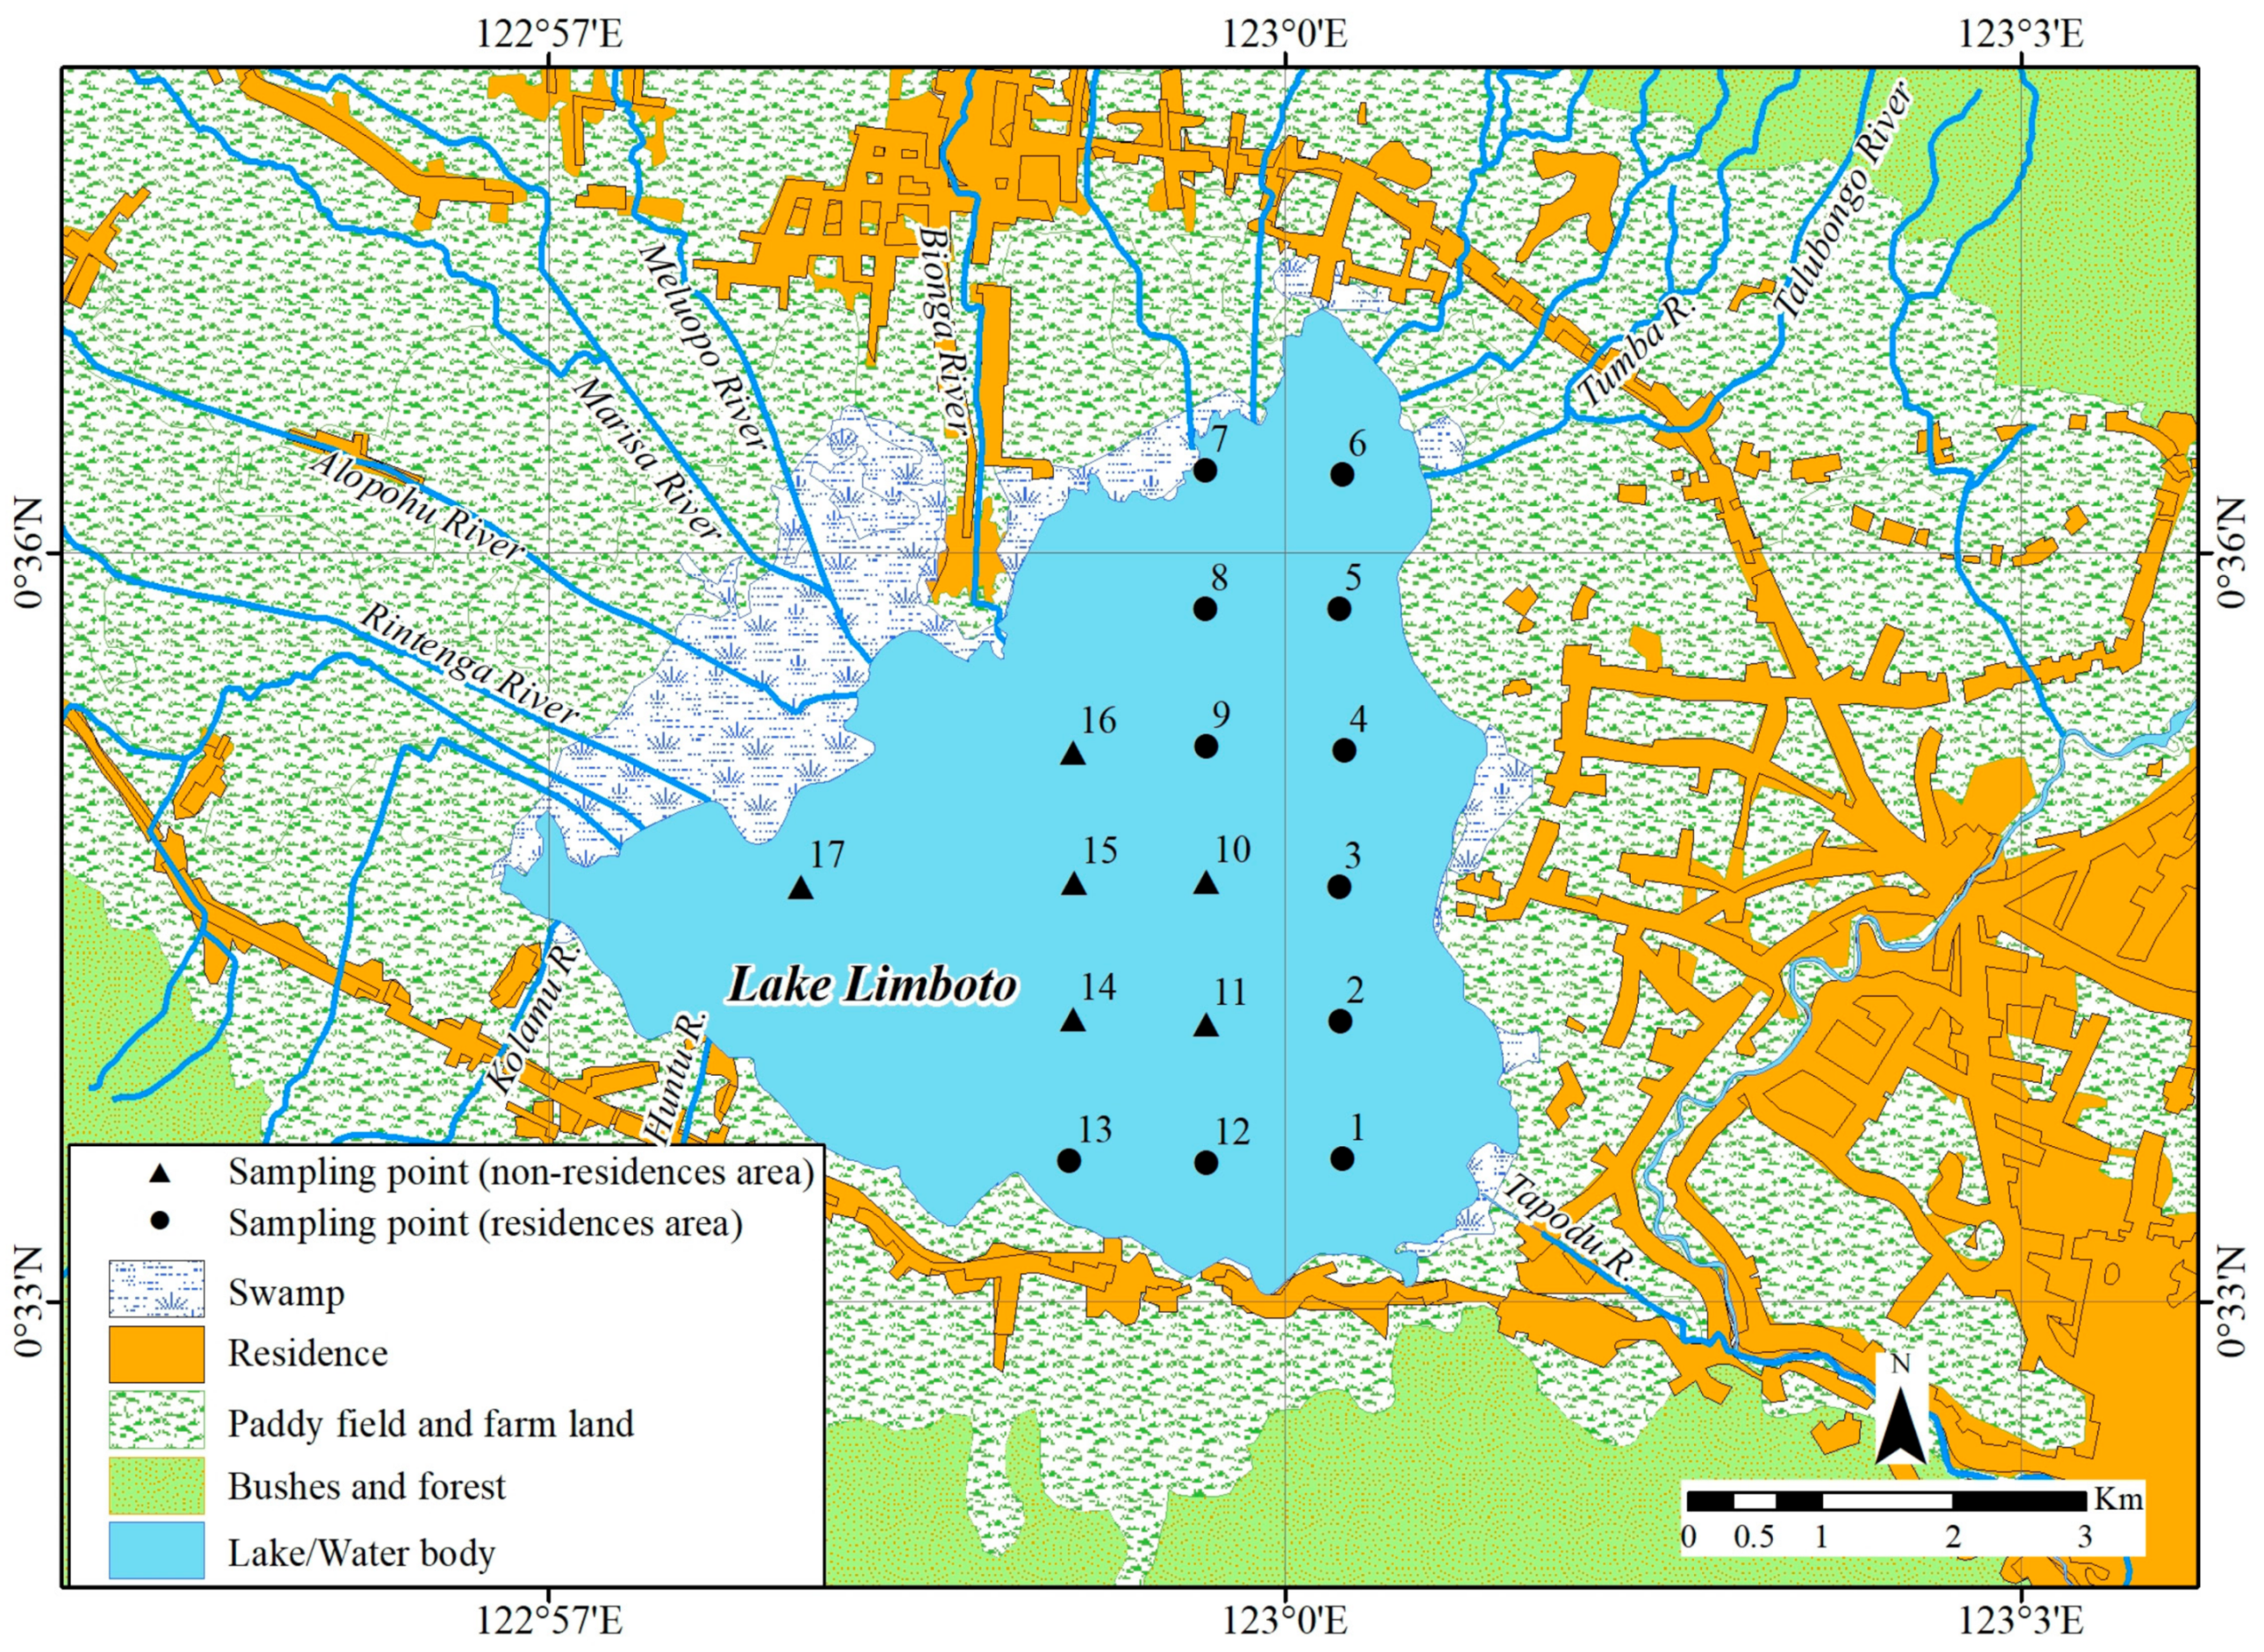
2. Materials and Methods
3. Results and Discussion
3.1. Results
3.2. Discussion
4. Conclusions
Acknowledgments
Author Contributions
Conflicts of Interest
References
- Putra, S.S.; Hasan, C.; Djudi; Suryatmojo, H. Reservoir saboworks solutions in Limboto Lake sedimentations, Northern Sulawesi, Indonesia. J. Procedia Environ. Sci. 2013, 17, 230–239. [Google Scholar] [CrossRef]
- Evans, M.E.; Heller, F. Environmental Magnetism: Principles and Application of Environmagnetics; Academic Press: Burlington, MA, USA, 2003; pp. 9–164. ISBN 0122438515. [Google Scholar]
- Dunlop, D.J.; Özdemir, Ö. Rock Magnetism Fundamental and Frontiers; Cambridge University Press: Cambridge, UK, 1997; pp. 5–445. ISBN 052100098X. [Google Scholar]
- Williamson, D.; Jelinowska, A.; Kissel, C.; Tucholka, P.; Gibert, E.; Gsse, F.; Massault, M.; Taib, M.; Van Compo, E.; Wieckowski, K. Mineral magnetic proxies of erosion/oxidation cycles in topical maar lake sediments (Lake Tritrivakely, Madagascar); paleoenvironmental Implication. Earth Planet. Sci. Lett. 1998, 155, 205–219. [Google Scholar] [CrossRef]
- Kabata-Pendias, A. Behavioural properties of trace metals in soils. Appl. Geochem. 1993, 8, 3–9. [Google Scholar] [CrossRef]
- Kabata-Pendias, A.; Mukherjee, A.B. Trace Elements from Soil to Human; Springer: Berlin, Germany, 2007; pp. 1–2. ISBN 3540327134. [Google Scholar]
- Hunt, C.P.; Moskowitz, B.M.; Banerjee, S.K. Magnetic properties of rock and minerals. In Rock Physics and Phase Relation—A Handbook of Physical Constant; Ahrens, T.J., Ed.; American Geophysical Union: Washington, DC, USA, 1995; pp. 189–204. ISBN 0875908535. [Google Scholar]
- Tamuntuan, G.; Bijaksana, S.; King, J.; Russell, J.; Fauzi, U.; Maryunani, K.; Aufa, N.; Safiuddin, L.O. Variation of magnetic properties in sediments from Lake Towuti, Indonesia, and its paleoclimate significance. Palaeogeogr. Palaeoclimatol. Palaeoecol. 2015, 420, 163–172. [Google Scholar] [CrossRef]
- Mecray, E.L.; King, J.W.; Appleby, P.G.; Hunt, A.S. Historical trace metal accumulation in the sediments of an urbanized region of the Lake Champlain watershed, Burlington, Vermont. Water Air Soil Pollut. 2001, 125, 201–230. [Google Scholar] [CrossRef]
- Yang, T.; Liu, Q.; Chan, L.; Liu, Z. Magnetic signature of heavy metals pollution of sediments: Case study from the East Lake in Wuhan, China. Environ. Geol. 2007, 52, 1639–1650. [Google Scholar] [CrossRef]
- Zeng, L.; Ning, D.; Xu, L.; Mao, X.; Chen, X. Sedimentary evidence of environmental degradation in Sanliqi Lake, Daye City (A Typical Mining City, Central China). Bull. Environ. Contam. Toxicol. 2015, 95, 317–324. [Google Scholar] [CrossRef] [PubMed]
- Yang, T.; Liu, Q.; Zeng, Q.; Chan, L. Environmental magnetic responses of urbanization processes: Evidence from lake sediments in East Lake, Wuhan, China. Geophys. J. Int. 2009, 179, 873–886. [Google Scholar] [CrossRef]
- Bao, L.J.; Hu, C.F.; Hui, C.J.; Sheng, X.D.; Hai, X.Q. Humid Medieval warm period recorded by magnetic characteristic of sediments from Gonghai Lake, Shanxi, North China. Chin. Sci. Bull. 2011, 56, 2464–2474. [Google Scholar]
- Famera, M.; Babek, O.; Grygar, T.M.; Novakova, T. Distribution of heavy metal contamination in Regulated River-channel deposits: A magnetic susceptibility and grain-size approach; River Morava, Czech Republic. Water Air Soil Pollut. 2013, 224, 1525. [Google Scholar] [CrossRef]
- Jordanova, D.; Hoffmann, V.; Fehr, K.T. Mineral magnetic characterization of anthropogenic magnetic phases in the Danube River sediments (Bulgarian part). Earth Planet. Sci. Lett. 2004, 221, 71–89. [Google Scholar] [CrossRef]
- Xu, Y.; Sun, Q.; Yi, L.; Yin, X.; Wang, A.; Li, Y.; Chen, J. The source of natural and anthropogenic heavy metals in the sediments of the Minjiang Rivers Estuary (SE China): Implications for historical pollution. Sci. Total Environ. 2014, 493, 729–736. [Google Scholar] [CrossRef] [PubMed]
- Aidona, E.; Grison, H.; Petrovsky, E.; Kazakis, N.; Papadopoulou, L. Magnetic characteristics and trace elements concentration in soils from Anthemountas River basin (North Greece): Discrimination of different sources of magnetic enhancement. Environ. Earth Sci. 2016, 75, 1375. [Google Scholar] [CrossRef]
- Blaha, U.; Appel, E.; Stanjek, H. Determination of anthropogenic boundary depth in industrially polluted soil and semi-quantification of heavy metal loads using magnetic susceptibility. Environ. Pollut. 2008, 156, 278–289. [Google Scholar] [CrossRef] [PubMed]
- Lu, S.G.; Bai, S.Q.; Xue, Q.F. Magnetic properties as indicators of heavy metals pollution in urban topsoils: A case study from the city of Luoyang, China. Geophys. J. Int. 2007, 171, 568–580. [Google Scholar] [CrossRef]
- Zong, Y.; Xiao, Q.; Lu, S. Magnetic signature and source identification of heavy metal contamination in urban soils of steel industry city, Northeast China. J. Soils Sediments 2017, 17, 190–203. [Google Scholar] [CrossRef]
- Bijaksana, S.; Huliselan, E.K. Magnetic properties and heavy metal content of sanitary leachate sludge in two landfill sites near Bandung, Indonesia. Environ. Earth Sci. 2010, 60, 409–419. [Google Scholar] [CrossRef]
- Huliselan, E.K.; Bijaksana, S.; Srigutomo, W.; Kardena, E. Scanning electronic microscopy and magnetic characterization of iron oxides in solid waste landfill leachate. J. Hazard. Mater. 2010, 179, 701–708. [Google Scholar] [CrossRef] [PubMed]
- Kirana, K.H.; Aufa, N.; Huliselan, E.K.; Bijaksana, S. Magnetic and Electrical Properties of Leachate. ITB J. Sci. 2011, 43, 165–178. [Google Scholar] [CrossRef]
- Katili, J.A. Past and present geotectonic position of Sulawesi, Indonesia. Tectonophysics 1978, 45, 289–322. [Google Scholar] [CrossRef]
- Bachri, S.; Sukido, S.; Ratman, N. Geological Map of the Tilamuta Quadrangle, Sulawesi, 1:250,000; Geological Research and Development Centre: Bandung, Indonesia, 2012. [Google Scholar]
- Bachri, S.; Sidarto, S. Tektonik Sulawesi. In Geologi Sulawesi; Surono, S., Hartono, U., Eds.; LIPI Press: Bandung, Indonesia, 2013; pp. 303–324. ISBN 978-9797997571. (in Indonesian with English abstract). [Google Scholar]
- Sudarningsih, S.; Bijaksana, S.; Ramdani, R.; Hafidz, A.; Pratama, A.; Widodo, W.; Iskandar, I.; Dahrin, D.; Fajar, S.J.; Santoso, N.A. Variation in the concentration of magnetic minerals and heavy metals in suspended sediments from Citarum River and tributaries, West Java, Indonesia. Geosciences 2017, 7, 66. [Google Scholar] [CrossRef]
- Dearing, J.A. Environmental Magnetic Susceptibility Using the Bartington MS2 System; Chi Publishing: Kenilworth, UK, 1994; pp. 5–48. ISBN 0952340909. [Google Scholar]
- Dearing, J.A.; Dann, R.J.L.; Hay, K.; Lees, J.A.; Loveland, P.J.; Maher, B.A.; O’Grady, K. Frequency-dependent susceptibility measurements of environmental materials. Geophys. J. Int. 1996, 124, 228–240. [Google Scholar] [CrossRef]
- Hannigan, R.E.; Sholkovitz, E.R. The development of middle rare earth element enrichments in freshwaters: Weathering of phosphate minerals. Chem. Geol. 2001, 175, 495–508. [Google Scholar] [CrossRef]
- Song, H.; Shin, W.J.; Ryu, J.S.; Shin, H.S. Anthropogenic rare earth elements and their spatial distributions in the Han River, South Korea. Chemosphere 2017, 172, 155–165. [Google Scholar] [CrossRef] [PubMed]
- Tamuntuan, G.; Bijaksana, S.; Gaffar, E.; Russell, J.; Safiuddin, L.O.; Huliselan, E. The magnetic properties of Indonesia lake sediment: A case study of a Tectonic Lake in South Sulawesi and Maar Lakes in East Java. ITB J. Sci. 2010, 42, 31–48. [Google Scholar] [CrossRef]
- Venkatachalapathy, R.; Rajeswari, V.; Basavaiah, N.; Balasubramanian, T. Environmental magnetic studies on surface sediments: A proxy for metal and hydrocarbon contamination. Int. J. Environ. Sci. Technol. 2014, 11, 2061–2074. [Google Scholar] [CrossRef][Green Version]
- Reyes, B.A.; Bautista, F.; Goguitchaichvili, A.; Conteres, J.J.M.; Owen, P.Q.; Carvallo, C.; Battu, J. Rock-magnetic properties of topsoils and urban dust from Morelia (>80,000 inhabitants), Mexico: Implication for anthropogenic pollution monitoring in Mexico’s medium size cities. Geofis. Int. 2013, 52, 121–133. [Google Scholar]
- Li, Y.X.; Yu, Z.; Kodama, K.P.; Moeller, R.E. A 14,000-year environmental change history revealed by mineral magnetic data from White Lake, New Jersey, USA. Earth Planet. Sci. Lett. 2006, 246, 27–40. [Google Scholar] [CrossRef]
- Cao, L.; Appel, E.; Hu, S.; Yin, G.; Lin, H.; Rösler, W. Magnetic response to air pollution recorded by soil and dust-loaded leaves in a changing industrial environment. Atmos. Environ. 2015, 119, 304–313. [Google Scholar] [CrossRef]
- Mariyanto, M.; Bijaksana, S. Magnetic properties of Surabaya River sediments, East Java, Indonesia. AIP Conf. Proc. 2017, 1861, 030045. [Google Scholar] [CrossRef]
- Wang, X.S.; Qin, Y. Magnetic properties of urban top soils and correlation with heavy metals: A case study from the city of Xuzhou, China. Environ. Geol. 2006, 49, 897–904. [Google Scholar] [CrossRef]
- Chakarvorty, M.; Dwivedi, A.K.; Shukla, A.D.; Kumar, S.; Niyoga, A.; Usmani, M.; Pati, J.K. Geochemistry and magnetic measurements of suspended sediment in urban sewage water vis-à-vis quantification of heavy metal pollution in Ganga and Yamuna Rivers, India. Environ. Monit. Assess. 2015, 187, 604. [Google Scholar] [CrossRef] [PubMed]
- Attia, O.E.A.; Ab Khadra, A.M.; Nawwar, A.H.; Radwan, G. Impacts of human activities on the sedimentological and geochemical characteristics of Mabahiss Bay, North Hurghada, Red Sea, Egypt. Arab. J. Geosci. 2012, 5, 481–499. [Google Scholar] [CrossRef]
- Naimi, S.; Ayoubi, S. Vertical and horizontal distribution of magnetic susceptibility and metal contents in an industrial district of central Iran. J. Appl. Geophys. 2013, 96, 55–66. [Google Scholar] [CrossRef]
- Zhang, C.; Qiao, Q.; Appel, E.; Huang, B. Discriminating sources of anthropogenic heavy metals in urban street dusts using magnetic and chemical methods. J. Geochem. Explor. 2012, 119–120, 60–75. [Google Scholar] [CrossRef]
- Hissler, C.; Hostache, R.; Iffly, J.F.; Pfister, L.; Stille, P. Anthropogenic rare earth element fluxes into floodplains: Coupling between geochemical monitoring and hydrodynamic sediment transport modeling. C. R. Geosci. 2015, 327, 294–303. [Google Scholar] [CrossRef]
- Fernandes, L.L.; Kessarkar, P.M.; Parthiban, G.; Purnachandra Rao, V. Changes in depositional environment for the past 35 years in the Thane Creek, central west coast of India: Inferences from REEs, metals and magnetic properties. Environ. Earth Sci. 2017, 76, 189. [Google Scholar] [CrossRef]
- Sklyarova, O.A.; Sklyarov, E.V.; Och, L.; Pastukhov, M.V.; Zagorulko, N.A. Rare earth elements in tributaries of Lake Baikal (Siberia, Russia). Appl. Geochem. 2017, 82, 164–176. [Google Scholar] [CrossRef]
- Šmuc, N.R.; Serafimovski, T.; Dolenec, T.; Delenec, M.; Vrhovnik, P.; Vrabec, M.; Jačimović, R.; Zorn, V.L.; Komar, D. Mineralogical and geochemical study of Lake Dojran sediments (Republic of Macedonia). J. Geochem. Explor. 2015, 150, 73–83. [Google Scholar] [CrossRef]
- Klaver, G.; Verheul, M.; Bakker, I.; Girauld, E.P.; Nėgrel, P. Anthropogenic rare earth elements in rivers: Gadolinium and Lanthanum partitioning between the dissolved and particulate phase in the Rhine River and spatial propagation through the Ryne—Meuse delta (The Netherlands). Appl. Geochem. 2014, 47, 186–197. [Google Scholar] [CrossRef]
- Girauld, E.P.; Klaver, G.; Negrel, P. Natural versus anthropogenic sources in the surface-and groundwater dissolved load of the Dommel River (Meuse basin): Constraints by boron and strontium isotopes and gadolinium anomaly. J. Hydrol. 2009, 369, 336–349. [Google Scholar]


| Zones | Sampling Points | χLF (10−8 m3/kg) | χFD % | SIRM (10−6 Am2/kg) | % Magnetite (‰) | SIRM/χLF (Am−1) |
|---|---|---|---|---|---|---|
| R area | 1 | 64.92 | 5.39 | 181.87 | 0.20 | 280.24 |
| 2 | 64.10 | 2.65 | 216.86 | 0.24 | 338.31 | |
| 3 | 57.94 | 3.80 | 182.98 | 0.20 | 316.03 | |
| 4 | 50.82 | 4.74 | 204.98 | 0.22 | 403.50 | |
| 5 | 45.84 | 5.46 | 109.10 | 0.12 | 238.21 | |
| 6 | 53.88 | 3.15 | 108.70 | 0.12 | 201.68 | |
| 7 | 72.00 | 4.03 | 166.48 | 0.18 | 231.23 | |
| 8 | 57.30 | 4.89 | 133.24 | 0.14 | 232.53 | |
| 9 | 48.82 | 5.12 | 122.00 | 0.13 | 250.01 | |
| 12 | 44.16 | 5.20 | 64.19 | 0.07 | 145.22 | |
| 13 | 45.54 | 1.76 | 120.85 | 0.13 | 265.61 | |
| Max | 72.00 | 5.46 | 216.86 | 0.24 | 403.50 | |
| Min | 44.16 | 1.76 | 64.19 | 0.07 | 145.22 | |
| Mean | 55.02 | 4.20 | 146.48 | 0.16 | 263.87 | |
| NR area | 10 | 55.28 | 6.30 | 84.98 | 0.09 | 153.67 |
| 11 | 52.42 | 5.73 | 74.51 | 0.08 | 142.19 | |
| 14 | 51.00 | 5.88 | 67.27 | 0.07 | 131.91 | |
| 15 | 67.40 | 4.75 | 116.55 | 0.13 | 172.92 | |
| 16 | 68.00 | 4.26 | 112.36 | 0.12 | 165.23 | |
| 17 | 81.94 | 3.79 | 143.23 | 0.16 | 174.89 | |
| Max | 81.94 | 6.30 | 143.23 | 0.16 | 174.89 | |
| Min | 51.00 | 3.79 | 67.27 | 0.07 | 131.91 | |
| Mean | 62.67 | 5.12 | 99.82 | 0.11 | 156.80 |
| Zones | Sampling Points | Trace Metal Concentrations (ppm) | REE Concentrations (ppm) | (REEs)NASC | (La/Gd)NASC | |||||||||||||||
|---|---|---|---|---|---|---|---|---|---|---|---|---|---|---|---|---|---|---|---|---|
| Fe | Mn | Zn | Cu | Ni | La | Ce | Pr | Nd | Sc | Gd | Y | La | Ce | Pr | Nd | Sc | Gd | |||
| R area | 1 | 85.71 | 3.84 | 0.33 | 0.18 | - | 12.76 | 18.32 | 9.17 | 26.92 | 15.09 | 8.05 | 8.84 | 0.41 | 0.27 | 1.83 | 0.98 | 1.01 | 1.61 | 0.25 |
| 2 | 68.19 | 3.35 | 0.27 | 0.12 | - | 13.24 | 17.85 | 8.09 | 26.34 | 14.41 | 9.27 | 8.78 | 0.43 | 0.27 | 1.62 | 0.96 | 0.97 | 1.85 | 0.23 | |
| 3 | 100.10 | 9.04 | 0.60 | 0.26 | 0.03 | 13.96 | 19.40 | 7.81 | 24.98 | 13.23 | 9.89 | 9.58 | 0.45 | 0.29 | 1.56 | 0.91 | 0.89 | 1.98 | 0.23 | |
| 4 | 68.42 | 4.79 | 0.51 | 0.14 | - | 12.39 | 12.17 | 7.31 | 15.87 | 9.06 | 10.74 | 7.14 | 0.40 | 0.18 | 1.46 | 0.58 | 0.61 | 2.15 | 0.19 | |
| 5 | 77.83 | 3.83 | 0.41 | 0.17 | 0.02 | 11.93 | 11.77 | 6.92 | 16.60 | 9.44 | 9.82 | 7.05 | 0.38 | 0.18 | 1.38 | 0.61 | 0.63 | 1.96 | 0.20 | |
| 6 | 90.00 | 0.35 | 0.83 | 0.33 | - | 13.39 | 19.47 | 6.76 | 28.67 | 13.61 | 5.61 | 9.14 | 0.43 | 0.29 | 1.35 | 1.05 | 0.91 | 1.12 | 0.38 | |
| 7 | 88.13 | 7.59 | 0.44 | 0.21 | 0.06 | 16.67 | 18.73 | 9.77 | 24.47 | 11.77 | 17.08 | 11.84 | 0.54 | 0.28 | 1.95 | 0.89 | 0.79 | 3.42 | 0.16 | |
| 8 | 90.93 | 8.74 | 0.41 | 0.20 | 0.03 | 13.94 | 14.09 | 10.75 | 22.73 | 11.97 | 11.62 | 9.02 | 0.45 | 0.21 | 2.15 | 0.83 | 0.80 | 2.32 | 0.19 | |
| 9 | 91.44 | 9.40 | 0.40 | 0.16 | - | 15.54 | 12.26 | 8.49 | 18.88 | 10.75 | 19.36 | 7.89 | 0.50 | 0.18 | 1.70 | 0.69 | 0.72 | 3.87 | 0.13 | |
| 12 | 77.02 | 2.56 | 0.46 | 0.17 | - | 9.42 | 17.23 | 7.03 | 23.63 | 15.18 | 2.82 | 7.01 | 0.30 | 0.26 | 1.41 | 0.86 | 1.02 | 0.56 | 0.54 | |
| 13 | 79.46 | 3.85 | 0.30 | 0.10 | - | 13.22 | 12.35 | 8.71 | 19.26 | 11.53 | 10.66 | 6.43 | 0.43 | 0.19 | 1.74 | 0.70 | 0.77 | 2.13 | 0.20 | |
| Max | 100.10 | 9.40 | 0.83 | 0.33 | 0.06 | 16.67 | 19.47 | 10.75 | 28.67 | 15.18 | 19.36 | 11.84 | 0.54 | 0.29 | 2.15 | 1.05 | 1.02 | 3.87 | 0.54 | |
| Min | 68.19 | 0.35 | 0.27 | 0.10 | 0.02 | 9.42 | 11.77 | 6.76 | 15.87 | 9.06 | 2.82 | 6.43 | 0.30 | 0.18 | 1.35 | 0.58 | 0.61 | 0.56 | 0.13 | |
| Mean | 83.38 | 5.21 | 0.45 | 0.19 | 0.04 | 13.31 | 15.79 | 8.26 | 22.58 | 12.37 | 10.45 | 8.43 | 0.43 | 0.24 | 1.65 | 0.82 | 0.83 | 2.09 | 0.24 | |
| NR area | 10 | 89.32 | 4.84 | 0.45 | 0.14 | 0.02 | 9.45 | 20.49 | 5.26 | 30.49 | 16.45 | 2.33 | 8.33 | 0.30 | 0.31 | 1.05 | 1.11 | 1.10 | 0.47 | 0.65 |
| 11 | 87.09 | 4.19 | 0.43 | 0.16 | - | 9.52 | 20.96 | 4.98 | 28.39 | 16.99 | 0.00 | 8.14 | 0.31 | 0.31 | 1.00 | 1.04 | 1.14 | 0.00 | - | |
| 14 | 90.76 | 3.67 | 0.35 | 0.13 | 0.05 | 8.37 | 20.68 | 6.51 | 27.18 | 16.36 | 1.14 | 7.08 | 0.27 | 0.31 | 1.30 | 0.99 | 1.10 | 0.23 | 1.18 | |
| 15 | 115.00 | 4.77 | 0.65 | 0.17 | 0.08 | 7.71 | 19.60 | 7.04 | 28.25 | 16.57 | 0.00 | 7.27 | 0.25 | 0.29 | 1.41 | 1.03 | 1.11 | 0.00 | - | |
| 16 | 106.00 | 4.36 | 0.52 | 0.20 | 0.03 | 8.81 | 22.22 | 4.29 | 32.70 | 17.53 | 0.00 | 8.53 | 0.28 | 0.33 | 0.86 | 1.19 | 1.18 | 0.00 | - | |
| 17 | 115.00 | 5.98 | 0.50 | 0.22 | 0.08 | 10.05 | 22.18 | 5.49 | 30.00 | 17.16 | 0.57 | 9.35 | 0.32 | 0.33 | 1.10 | 1.09 | 1.15 | 0.11 | 2.83 | |
| Max | 115.00 | 5.98 | 0.65 | 0.22 | 0.08 | 10.05 | 22.22 | 7.04 | 32.70 | 17.53 | 2.33 | 9.35 | 0.32 | 0.33 | 1.41 | 1.19 | 1.18 | 0.47 | 2.83 | |
| Min | 87.09 | 3.67 | 0.35 | 0.13 | 0.02 | 7.71 | 19.60 | 4.29 | 27.18 | 16.36 | 0.00 | 7.08 | 0.25 | 0.29 | 0.86 | 0.99 | 1.10 | 0.00 | 0.65 | |
| Mean | 100.53 | 4.64 | 0.48 | 0.17 | 0.05 | 8.99 | 21.02 | 5.60 | 29.50 | 16.84 | 0.67 | 8.12 | 0.29 | 0.32 | 1.12 | 1.08 | 1.13 | 0.13 | 0.78 | |
| Parameters | Fe | Cu | Zn | Mn | La | Ce | Pr | Nd | Sc | Gd | |
|---|---|---|---|---|---|---|---|---|---|---|---|
| R area | χLF | 0.21 | 0.22 | −0.09 | 0.24 | 0.58 | 0.64 | 0.54 | 0.60 | 0.33 | 0.27 |
| Fe | 0.67 | 0.42 | 0.54 | 0.51 | 0.35 | 0.33 | 0.35 | 0.14 | 0.28 | ||
| Cu | 0.88 | −0.05 | 0.19 | 0.62 | −0.16 | 0.57 | 0.25 | −0.20 | |||
| Zn | −0.20 | 0.01 | 0.39 | −0.46 | 0.29 | 0.03 | −0.28 | ||||
| Mn | 0.63 | −0.18 | 0.60 | −0.24 | −0.33 | 0.75 | |||||
| La | 0.10 | 0.57 | 0.10 | −0.27 | 0.85 | ||||||
| Ce | 0.08 | 0.93 | 0.84 | −0.37 | |||||||
| Pr | 0.13 | 0.31 | 0.52 | ||||||||
| Nd | 0.87 | −0.37 | |||||||||
| Sc | −0.56 | ||||||||||
| NR area | χLF | 0.91 | 0.92 | 0.65 | 0.84 | 0.23 | 0.50 | −0.07 | 0.44 | 0.56 | −0.35 |
| Fe | 0.77 | 0.80 | 0.65 | −0.19 | 0.19 | 0.23 | 0.26 | 0.39 | −0.48 | ||
| Cu | 0.50 | 0.71 | 0.36 | 0.70 | −0.37 | 0.57 | 0.83 | −0.54 | |||
| Zn | 0.46 | −0.38 | −0.21 | 0.22 | 0.25 | 0.24 | −0.54 | ||||
| Mn | 0.52 | 0.32 | −0.07 | 0.33 | 0.29 | 0.04 | |||||
| La | 0.63 | −0.64 | 0.34 | 0.39 | 0.25 | ||||||
| Ce | −0.74 | 0.65 | 0.83 | −0.20 | |||||||
| Pr | −0.78 | −0.74 | 0.04 | ||||||||
| Nd | 0.72 | −0.01 | |||||||||
| Sc | −0.60 |
© 2018 by the authors. Licensee MDPI, Basel, Switzerland. This article is an open access article distributed under the terms and conditions of the Creative Commons Attribution (CC BY) license (http://creativecommons.org/licenses/by/4.0/).
Share and Cite
Yunginger, R.; Bijaksana, S.; Dahrin, D.; Zulaikah, S.; Hafidz, A.; Kirana, K.H.; Sudarningsih, S.; Mariyanto, M.; Fajar, S.J. Lithogenic and Anthropogenic Components in Surface Sediments from Lake Limboto as Shown by Magnetic Mineral Characteristics, Trace Metals, and REE Geochemistry. Geosciences 2018, 8, 116. https://doi.org/10.3390/geosciences8040116
Yunginger R, Bijaksana S, Dahrin D, Zulaikah S, Hafidz A, Kirana KH, Sudarningsih S, Mariyanto M, Fajar SJ. Lithogenic and Anthropogenic Components in Surface Sediments from Lake Limboto as Shown by Magnetic Mineral Characteristics, Trace Metals, and REE Geochemistry. Geosciences. 2018; 8(4):116. https://doi.org/10.3390/geosciences8040116
Chicago/Turabian StyleYunginger, Raghel, Satria Bijaksana, Darharta Dahrin, Siti Zulaikah, Abd Hafidz, Kartika Hajar Kirana, Sudarningsih Sudarningsih, Mariyanto Mariyanto, and Silvia Jannatul Fajar. 2018. "Lithogenic and Anthropogenic Components in Surface Sediments from Lake Limboto as Shown by Magnetic Mineral Characteristics, Trace Metals, and REE Geochemistry" Geosciences 8, no. 4: 116. https://doi.org/10.3390/geosciences8040116
APA StyleYunginger, R., Bijaksana, S., Dahrin, D., Zulaikah, S., Hafidz, A., Kirana, K. H., Sudarningsih, S., Mariyanto, M., & Fajar, S. J. (2018). Lithogenic and Anthropogenic Components in Surface Sediments from Lake Limboto as Shown by Magnetic Mineral Characteristics, Trace Metals, and REE Geochemistry. Geosciences, 8(4), 116. https://doi.org/10.3390/geosciences8040116