Comparison of the Performance of Six Drought Indices in Characterizing Historical Drought for the Upper Blue Nile Basin, Ethiopia
Abstract
1. Introduction
2. Study Area and Data
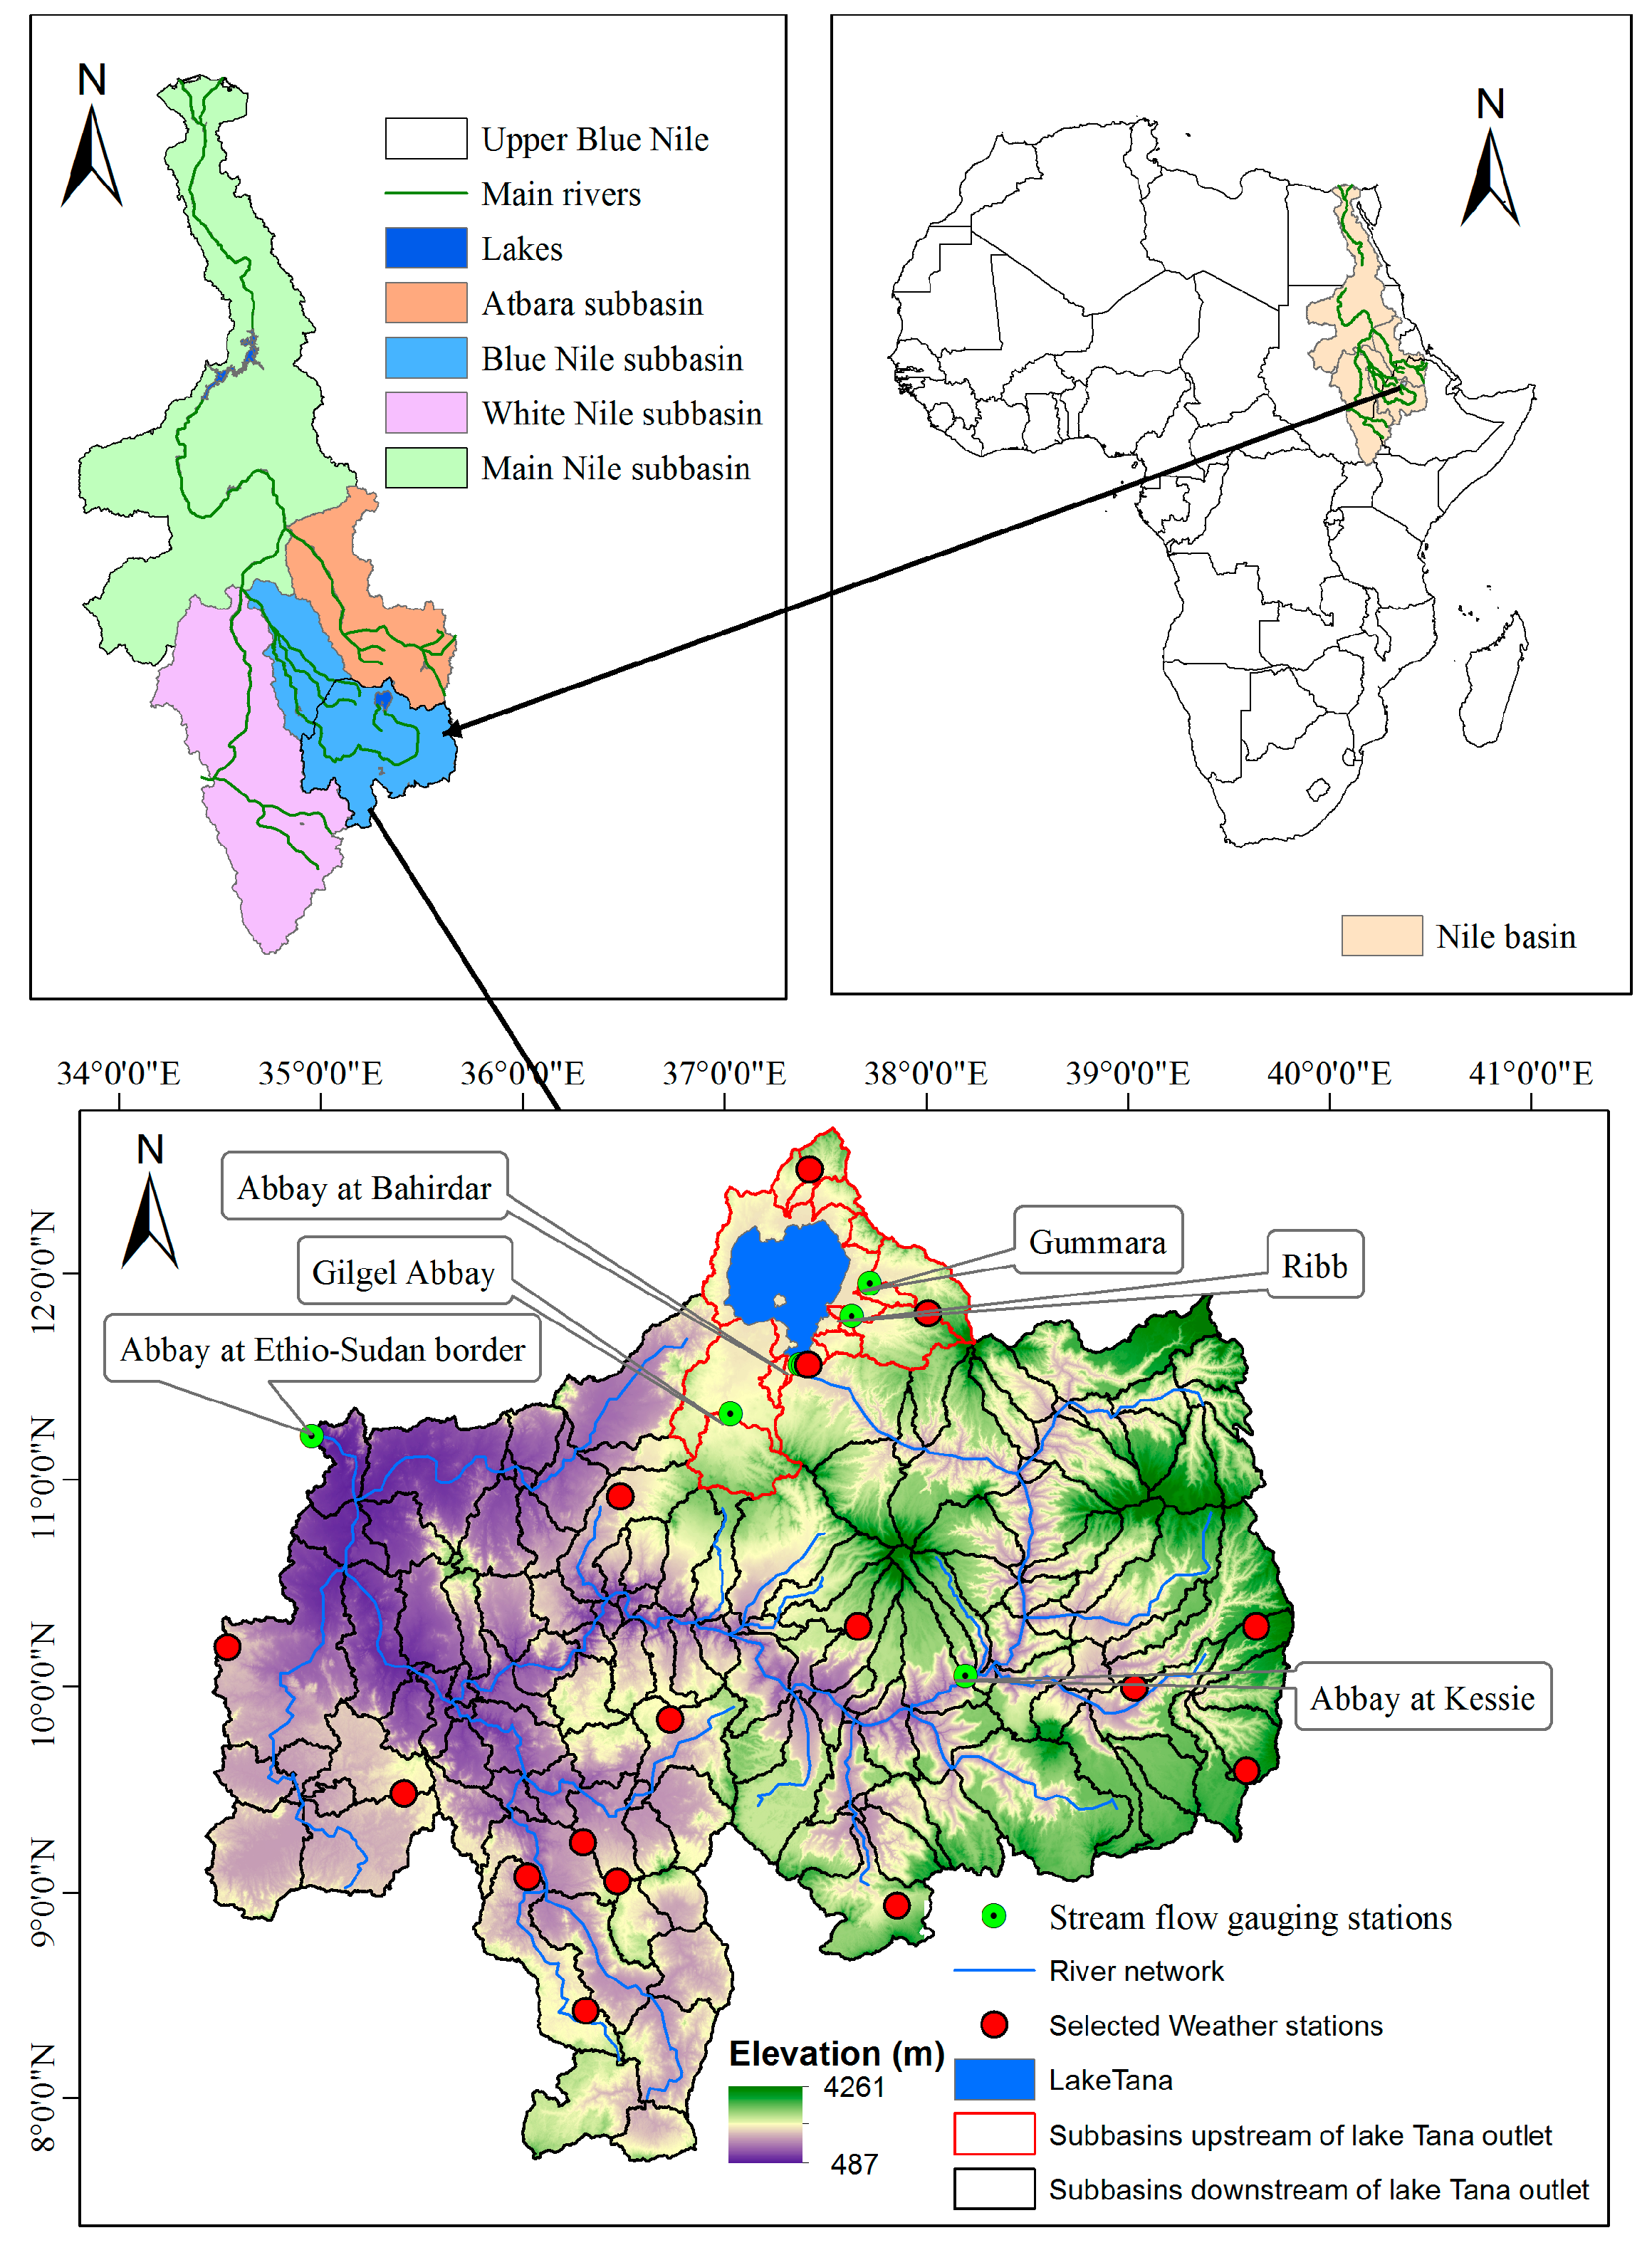
2.1. Study Area: Upper Blue Nile Basin (UBN)
2.2. Data Used
2.2.1. Historical Drought Events
2.2.2. Actual Evapotranspiration (ET) and Soil Moisture Data
2.2.3. Rainfall and Temperature Data
2.2.4. River Discharge Data
3. Drought Indicators
3.1. Meteorological Drought Indicator
3.2. Agricultural Drought Indicators
3.3. Hydrological Drought Indicator
3.4. Aggregate Drought Index (ADI)
4. Methods
4.1. Correlation between Drought Indices
4.2. Comparison of Drought Indices Based on Drought Onset, Duration, and Severity
5. Results and Discussion
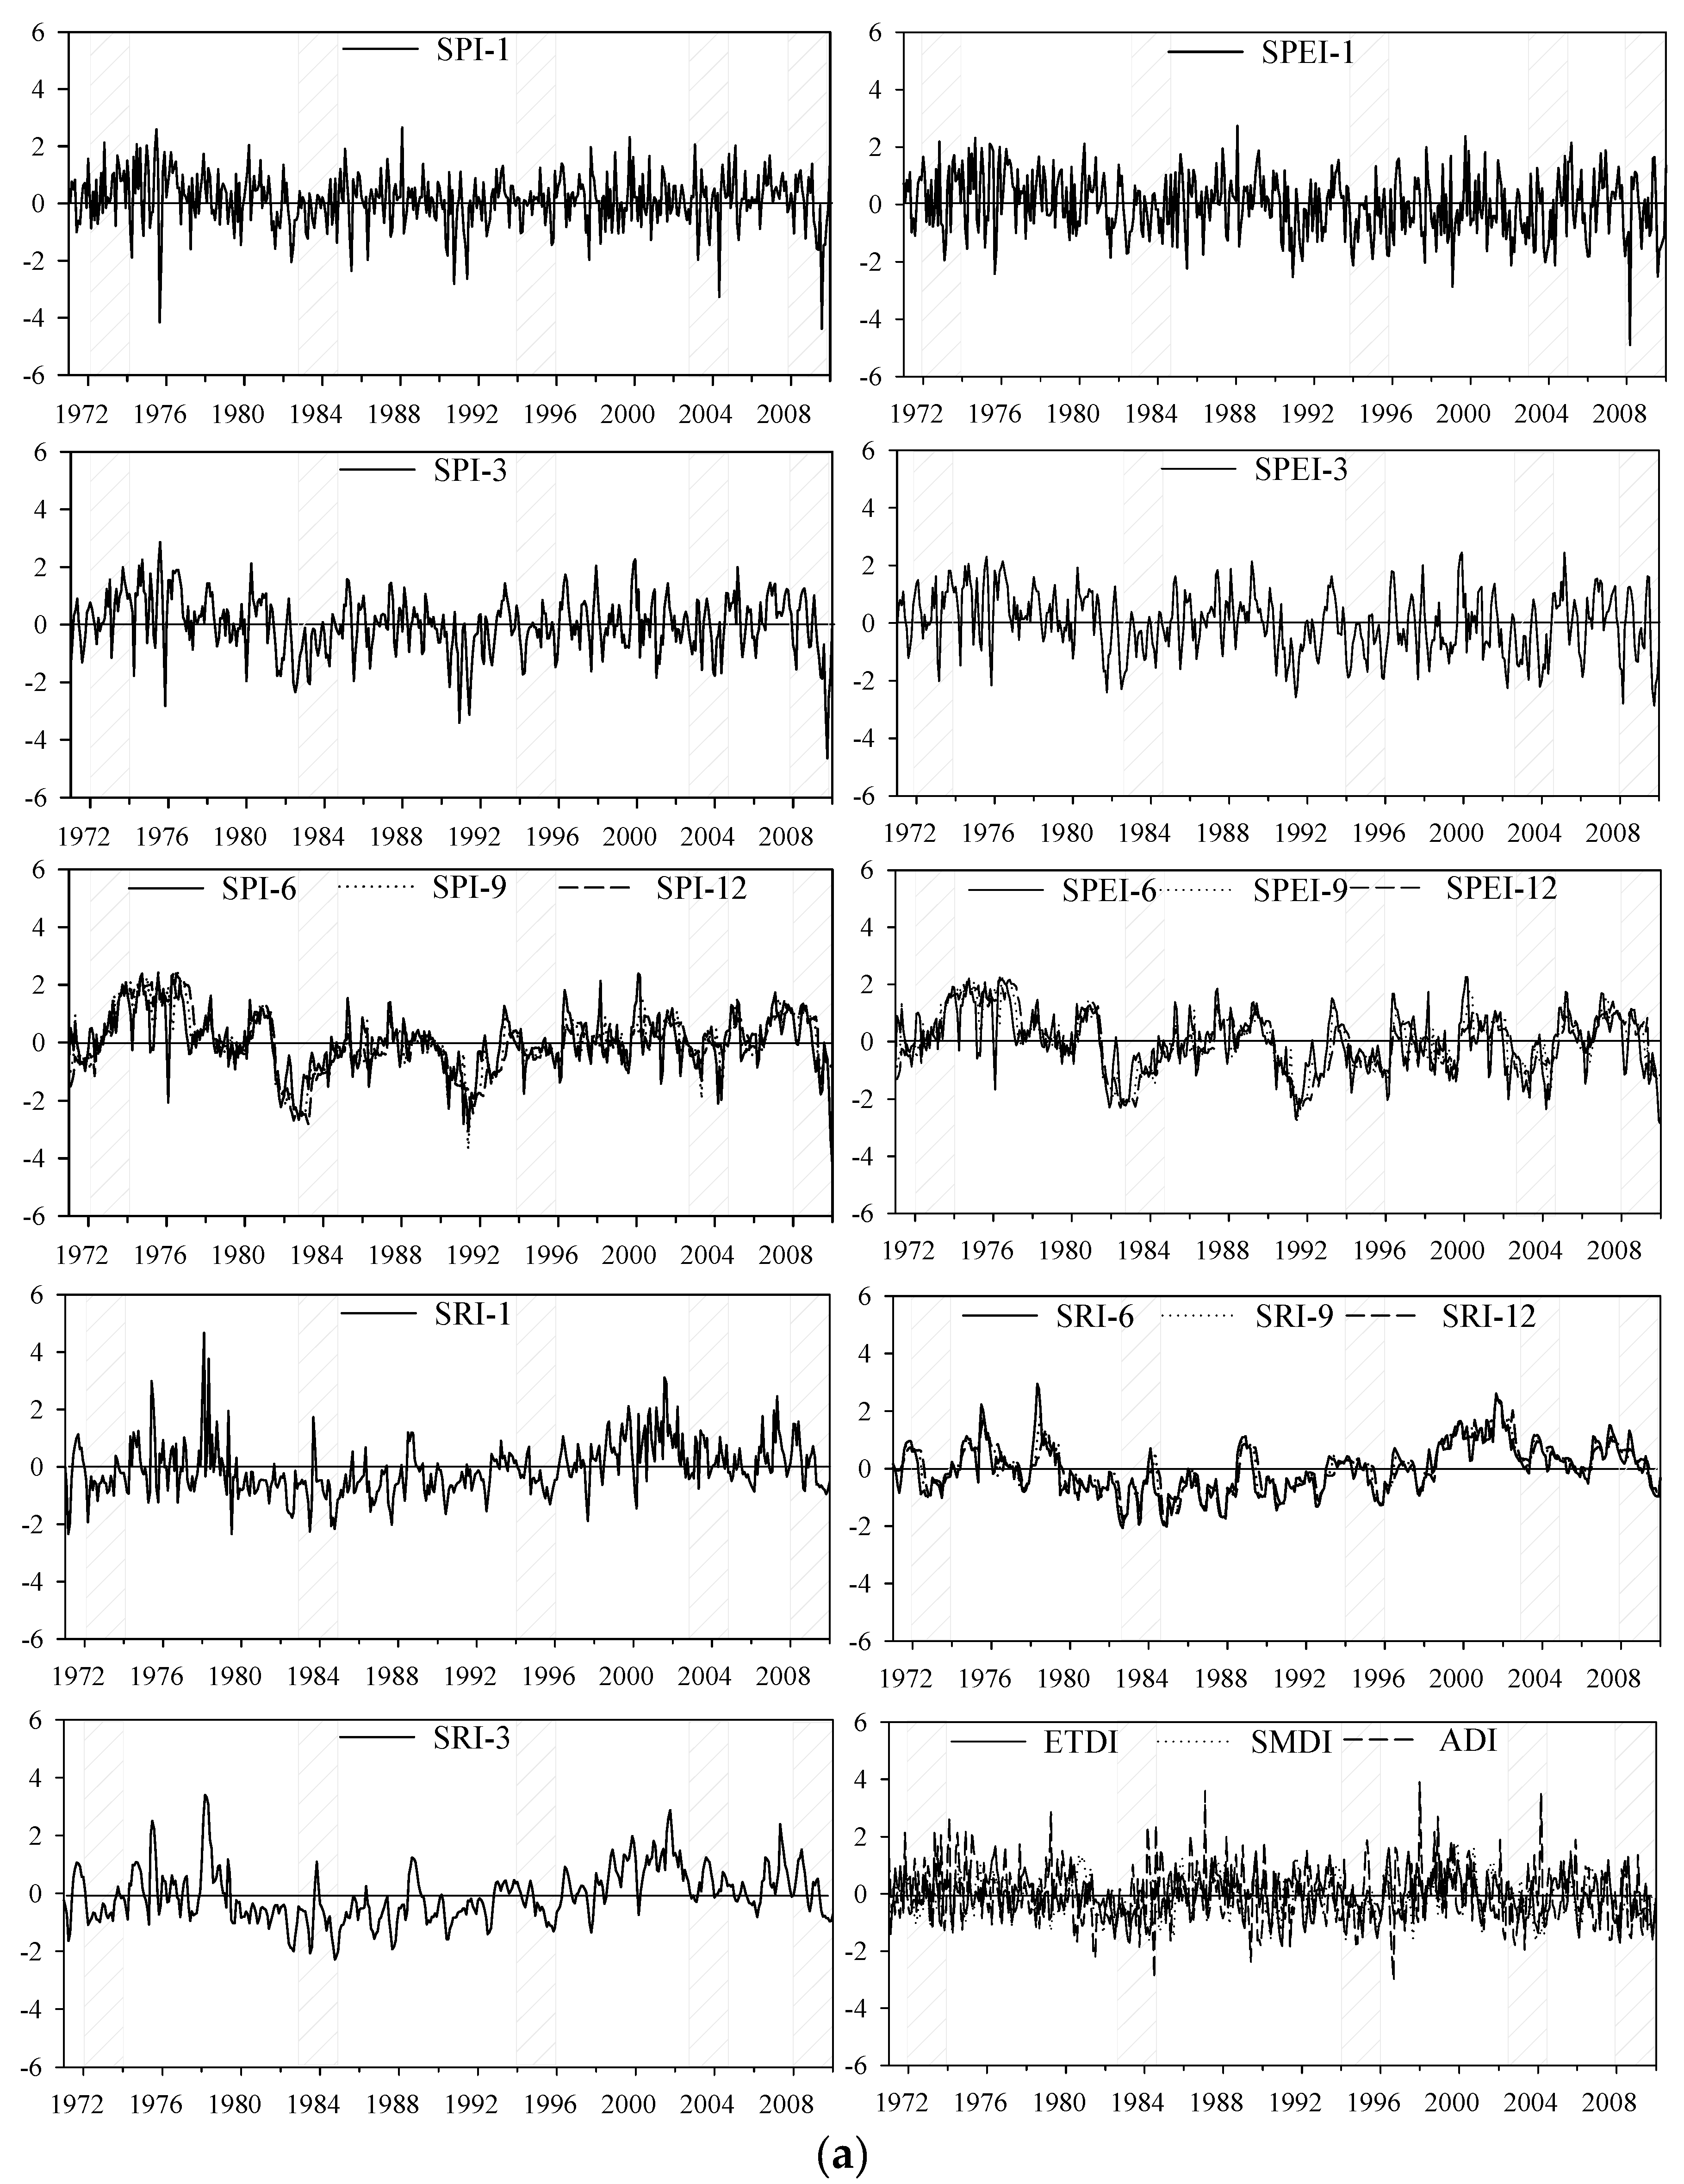
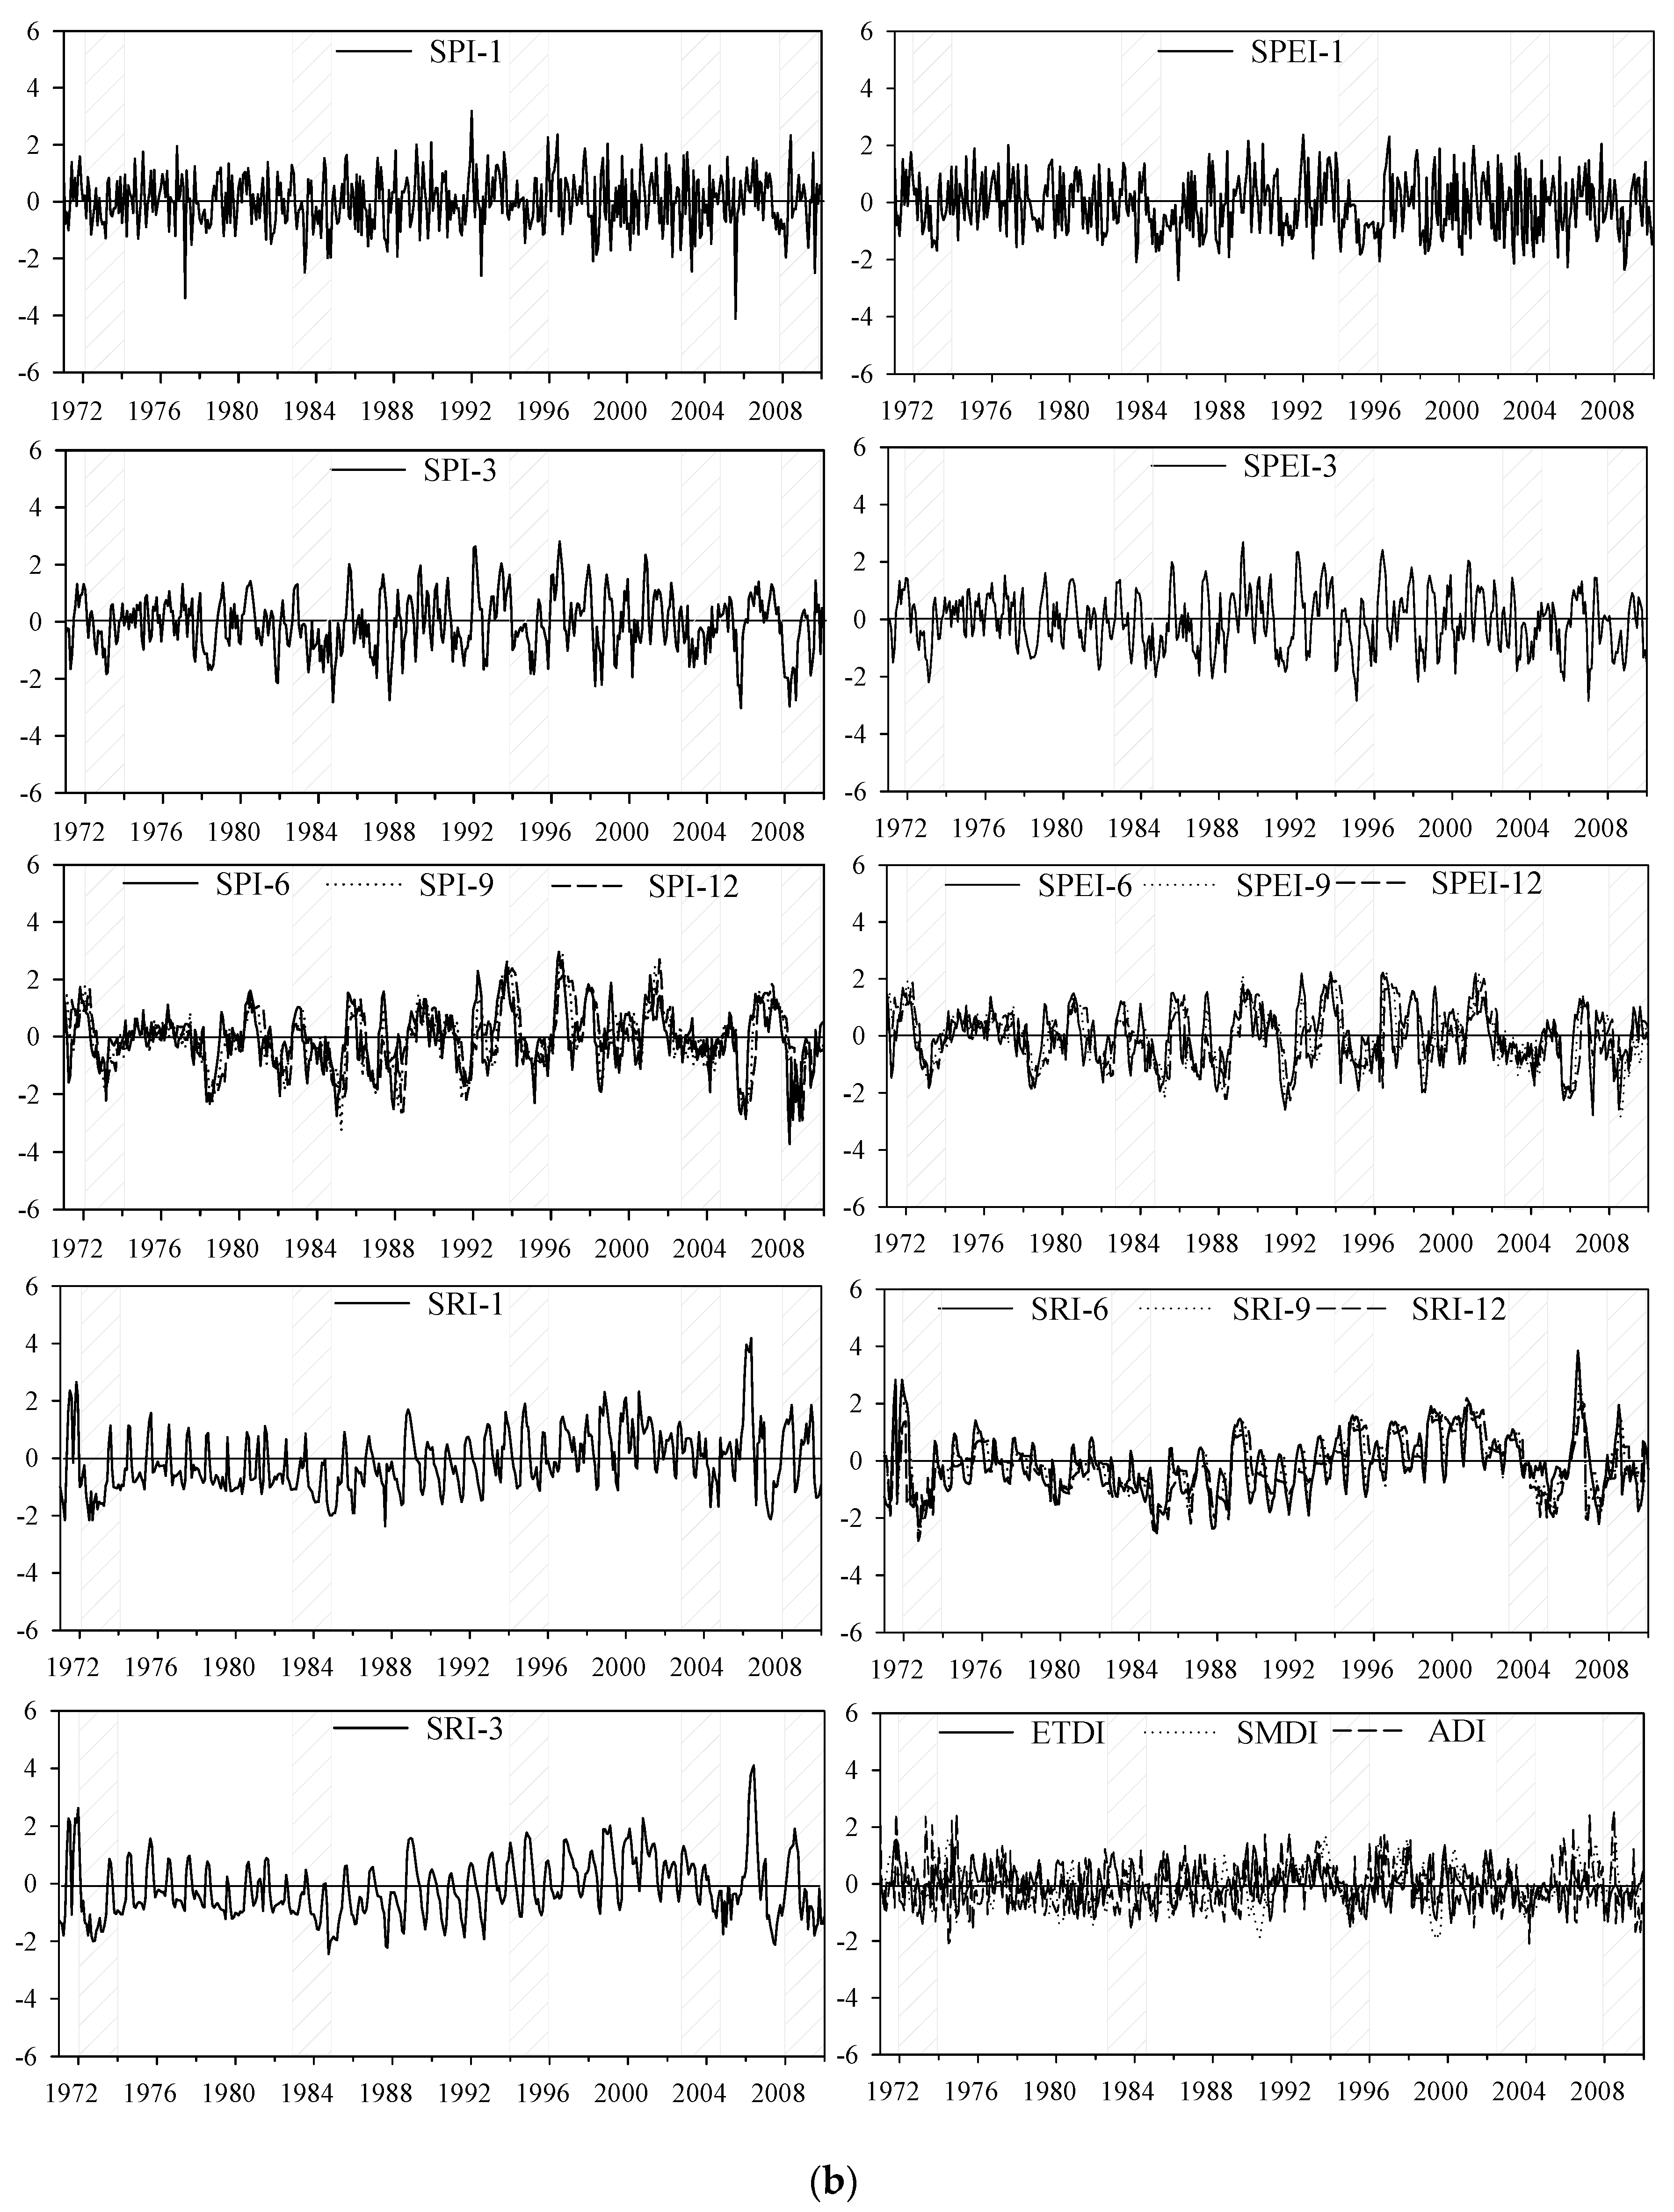
5.1. Time Series of the Drought Indices
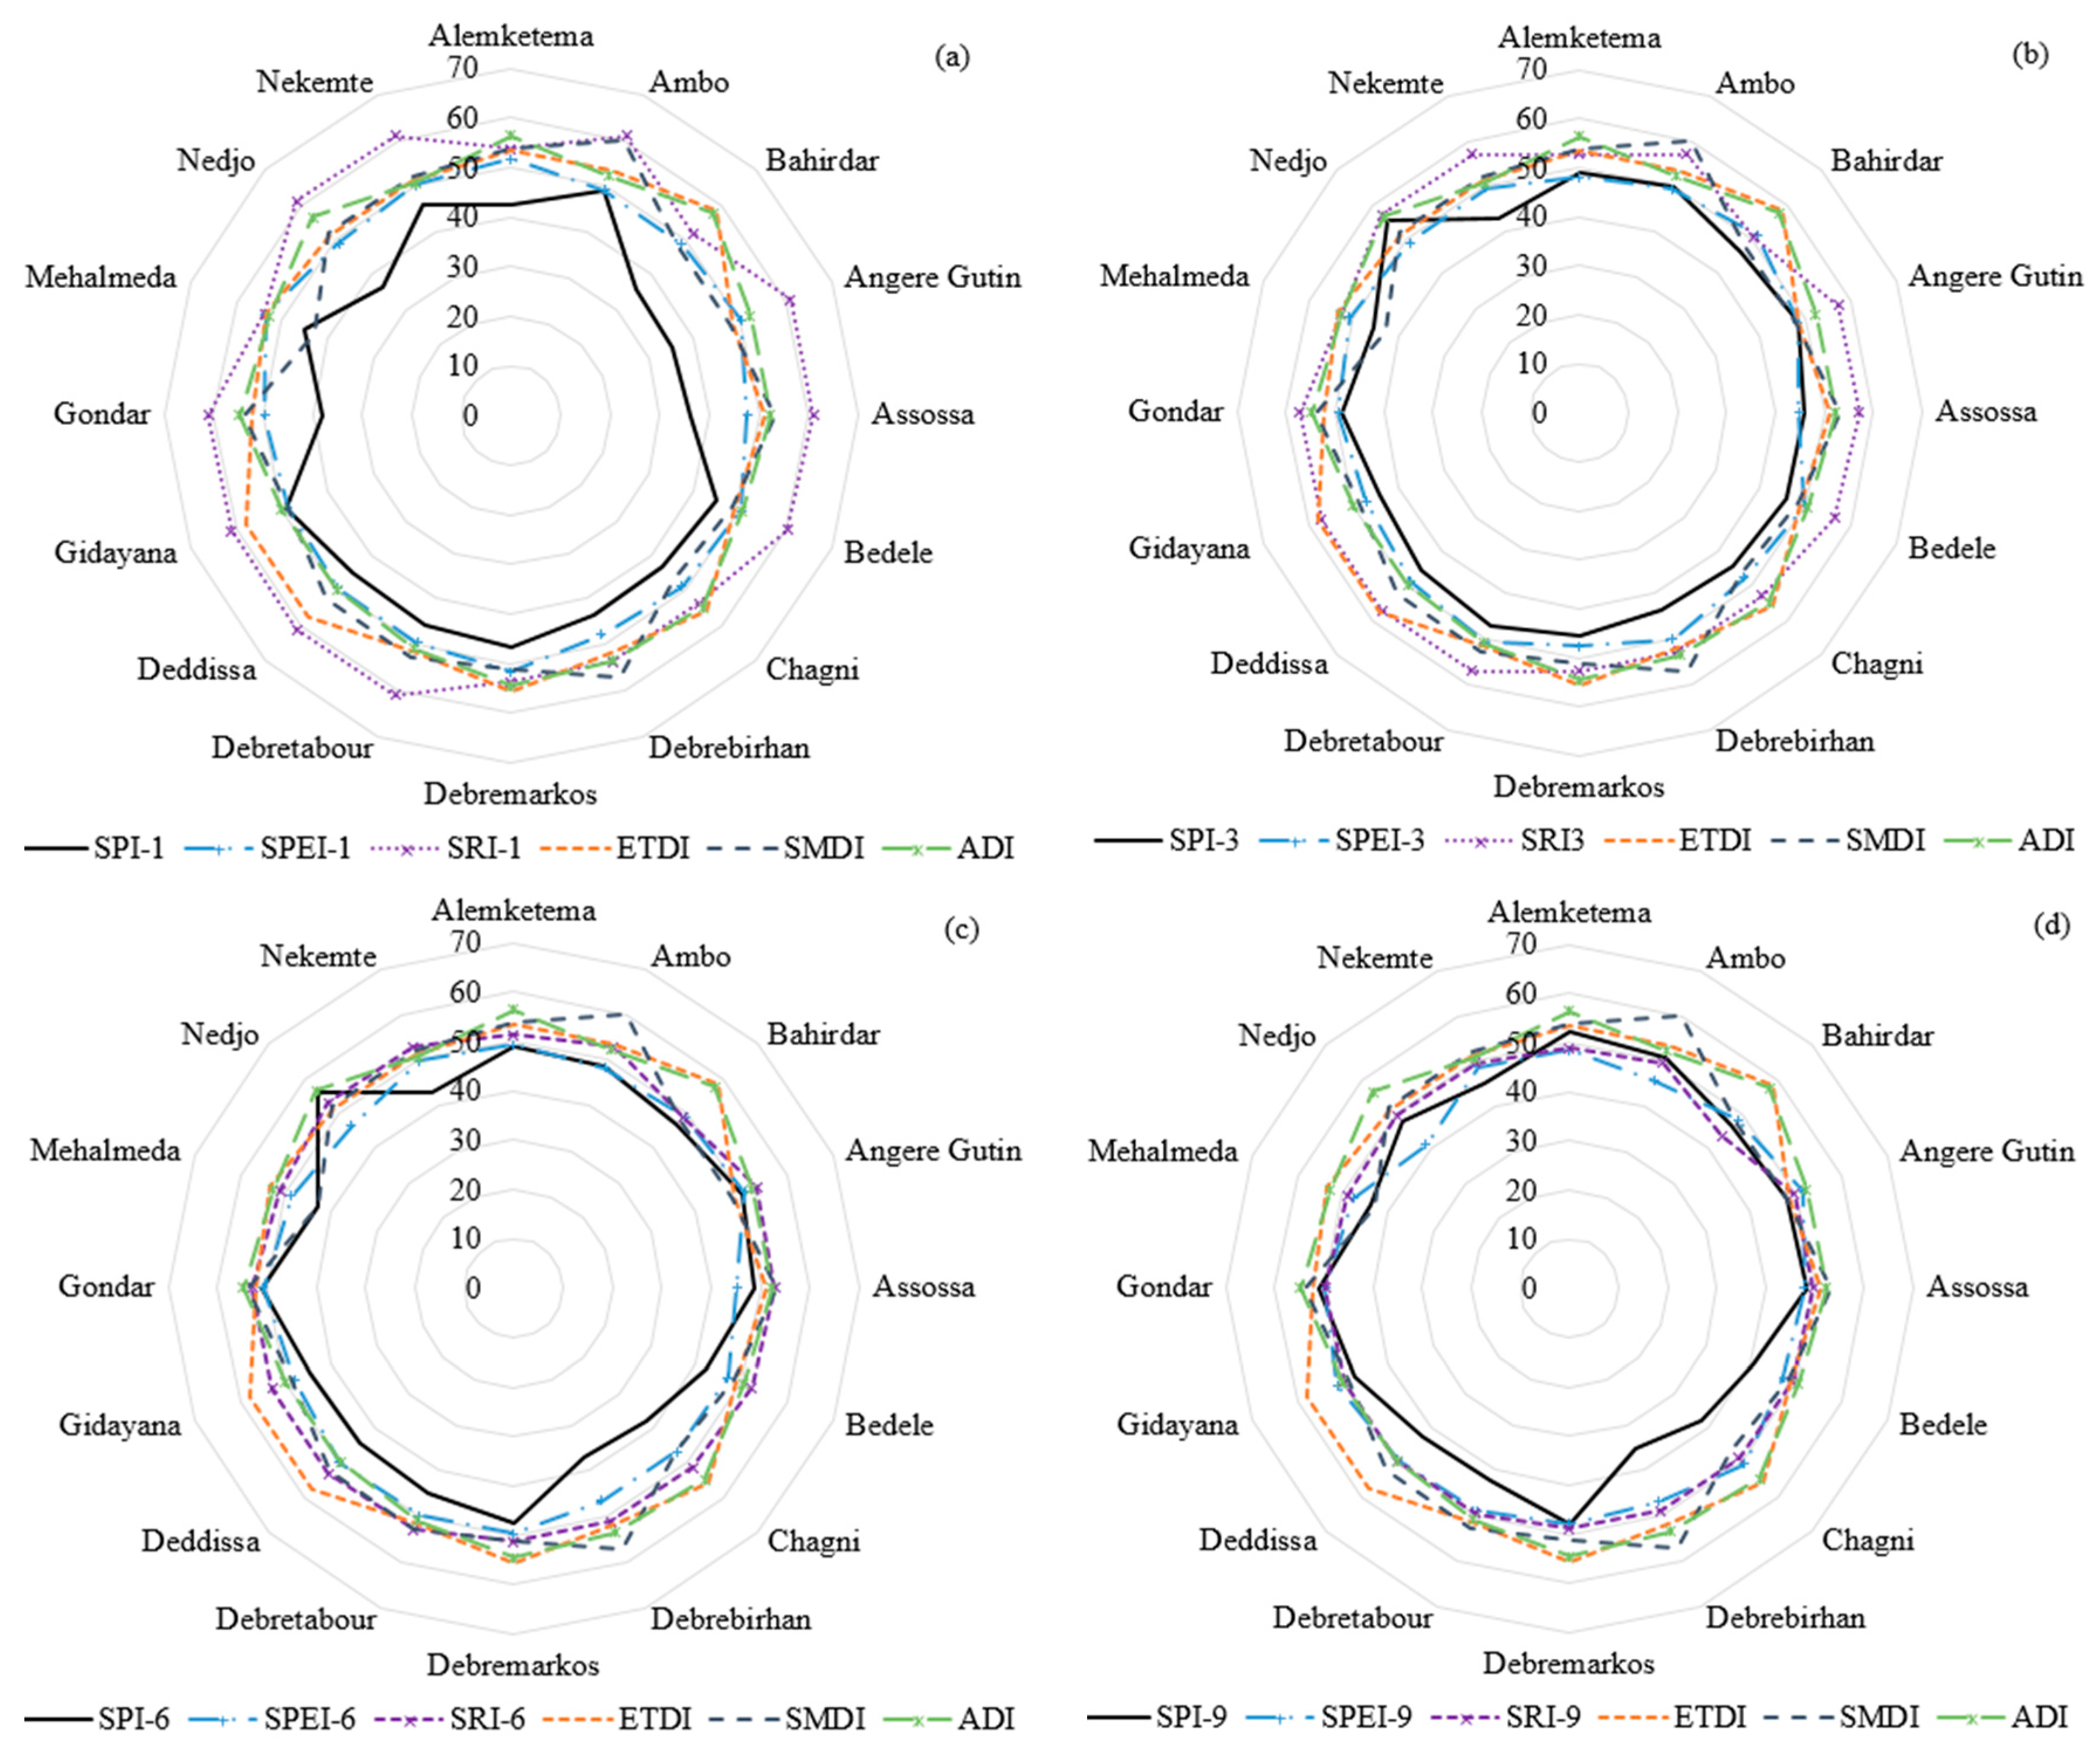
5.2. Correlation between Drought Indices
5.3. Comparison of Drought Indices Based on Drought Characteristics
5.4. Comparison of Drought Indices through Characterizing the Hhistoric Drought Events
6. Conclusions
Supplementary Materials
Acknowledgments
Author Contributions
Conflicts of Interest
References
- Wilhite, D.A. Drought as a natural hazard: Concepts and definitions. In Drought: A Global Assessment. Wilhite; Routledge: London, UK, 2000; Volume 1, pp. 3–18. [Google Scholar]
- Wilhite, A.; Svoboda, D.; Hayes, J. Understanding the complex impacts of drought: A key to enhancing drought mitigation and preparedness. Water Resour. Manag. 2007, 21, 763–774. [Google Scholar] [CrossRef]
- Sheffield, J.; Wood, E.F. Drought: Past Problems and Future Scenarios; Earthscan: London, UK, 2012. [Google Scholar]
- Tagel, G.; Van Der Veen, A.; Maathuis, B. Spatial and temporal assessment of drought in the northern highlands of Ethiopia. Int. J. Appl. Earth Obs. Geoinf. 2011, 13, 309–321. [Google Scholar]
- Bayissa, Y.; Semu, A.; Yunqing, X.; Schalk, A.; Shreedhar, M.; Dimitri, S.; Griensven, A.; Tadesse, T. Spatio-temporal assessment of meteorological drought under the influence of varying record length: The case of Upper Blue Nile Basin, Ethiopia. Hydrol. Sci. J. 2015, 60, 1927–1942. [Google Scholar] [CrossRef]
- Wilhite, D.; Buchanan-Smith, M. Drought as hazard: Understanding the natural and social context. In Drought and Water Crises: Science, Technology, and Management Issues; Wilhite, D.A., Ed.; CRC Press: Boca Raton, FL, USA, 2005; pp. 3–29. [Google Scholar]
- Valliyodan, B.T.; Nguyen, H.T. Understanding regulatory networks and engineering for enhanced drought tolerance in plants. Curr. Opin. Plant Biol. 2006, 9, 189–195. [Google Scholar] [CrossRef] [PubMed]
- Mishra, A.K.; Singh, V.P. A review of drought concepts. J. Hydrol. 2010, 391, 202–216. [Google Scholar] [CrossRef]
- Narasimhan, B.; Srinivasan, R. Development and evaluation of Soil Moisture Deficit Index (SMDI) and Evapotranspiration Deficit Index (ETDI) for agricultural drought monitoring. Agric. For. Meteorol. 2005, 133, 69–88. [Google Scholar] [CrossRef]
- Kogan, F.N. Global drought watch from space. Bull. Am. Meteorol. Soc. 1997, 78, 621–636. [Google Scholar] [CrossRef]
- Palmer, W.C. Meteorological Drought, 1st ed.; U.S. Weather Bureau: Washington, DC, USA, 1965.
- Guttman, N.B. Comparing the Palmer Drought Index and the Standardized Precipitation Index. J. Am. Water Resour. Assoc. 1998, 34, 113–121. [Google Scholar] [CrossRef]
- McKee, T.B.; Doesken, N.J.; Kleist, J. The relationship of drought frequency and duration to time scales. In Proceedings of the 8th Conference on Applied Climatology, Anaheim, CA, USA, 17–22 January 1993; pp. 179–184. [Google Scholar]
- McKee, T.B.; Doesken, N.J.; Kleist, J. Drought monitoring with multiple time scales. In Proceedings of the Ninth Conference on Applied Climatology, Dallas, TX, USA, 15–20 January 1995; pp. 233–236. [Google Scholar]
- Wu, H.; Hayes, M.J.; Weiss, A.; Hu, Q. An evaluation the standardized precipitation index, the China-Z index and the statistical Z-score. Int. J. Climatol. 2001, 21, 745–758. [Google Scholar] [CrossRef]
- Vicente-Serrano, S.M.; Beguería, S.; López-Moreno, J.I. A multiscalar drought index sensitive to global warming: The standardized precipitation evapotranspiration index. J. Clim. 2010, 23, 1696–1718. [Google Scholar] [CrossRef]
- Shukla, S.; Wood, A.W. Use of a standardized runoff index for characterizing hydrologic drought. Geophys. Res. Lett. 2008, 35, 1–7. [Google Scholar] [CrossRef]
- Shafer, B.A.; Dezman, L.E. Development of a surface water supply index (SWSI) to assess the severity of drought conditions in snowpack runoff areas. In Proceedings of the Western Snow Conference, Colorado State University, Fort Collins, CO, USA, 19–23 April 1982; pp. 164–175. [Google Scholar]
- Gibbs, W.J.; Maher, J.V. Rainfall Deciles as Drought Indicators; Bureau of Meteorology: Melbourne, Australia, 1967; p. 29.
- Brown, J.F.; Wardlow, B.D.; Tadesse, T.; Hayes, M.J.; Reed, B.C. The vegetation drought response index (VegDRI): A new integrated approach for monitoring drought stress in vegetation. GISci. Remote Sens. 2008, 45, 16–46. [Google Scholar] [CrossRef]
- Zargar, A.; Sadiq, R.; Naser, B.; Khan, F.I. A review of drought indices. Environ. Rev. 2011, 19, 333–349. [Google Scholar] [CrossRef]
- Keyantash, J.A.; Dracup, J.A. An aggregate drought index: Assessing drought severity based on fluctuations in the hydrologic cycle and surface water storage. Water Resour. Res. 2004, 40. [Google Scholar] [CrossRef]
- Ntale, H.K.; Gan, T. Drought Indices and their Application to East Africa. Int. J. Climatol. 2003, 23, 1335–1357. [Google Scholar] [CrossRef]
- Morid, S.; Smakhtin, V.; Moghaddasi, M. Comparison of seven meteorological indices for drought monitoring in Iran. Int. J. Climatol. 2006, 26, 971–985. [Google Scholar] [CrossRef]
- Barua, S.; Perera, B.J.C.; Ng, A.W.M. A comparative drought assessment of Yarra River Catchment in Victoria, Australia. In Proceedings of the 18th World IMACS/MODSIM Congress, Cairns, Australia, 13–17 July 2009; pp. 13–17. [Google Scholar]
- Dogan, S.; Berktay, A.; Singh, V.P. Comparison of multi-monthly rainfall based drought severity indices, with application to semi-arid Konya closed basin Turkey. J. Hydrol. 2012, 470, 255–268. [Google Scholar] [CrossRef]
- Trambauer, P.; Maskey, S.; Werner, M.; Pappenberger, F.; Van Beek, L.; Uhlenbrook, S. Identification and simulation of space-time variability of past hydrological drought events in the Limpopo river basin, Southern Africa. Hydrol. Earth Syst. Sci. Discuss. 2014, 11, 2639–2677. [Google Scholar] [CrossRef]
- Jain, V.K.; Pandey, R.P.; Jain, M.K.; Byun, H.R. Comparison of drought indices for appraisal of drought characteristics in the Ken River Basin. Weather Clim. Extrem. 2015, 8, 1–11. [Google Scholar] [CrossRef]
- Okpara, J.N.; Tarhule, A. Evaluation of drought indices in the Niger Basin, West Africa. J. Geogr. Earth Sci. 2015, 3, 1–32. [Google Scholar]
- Naumann, G.; Dutra, E.; Barbosa, P.; Pappenberger, F.; Wetterhall, F.; Vogt, J.V. Comparison of drought indicators derived from multiple data sets over Africa. Hydrol. Earth Syst. Sci. 2013, 18, 1625–1640. [Google Scholar] [CrossRef]
- Wang, J.; Li, Y.; Ren, Y.; Liu, Y. Comparison among several drought indices in the Yellow River Valley. J. Nat. Resour. 2013, 28, 1337–1349. [Google Scholar]
- Houcine, A.; Bargaoui, Z. Comparison of rainfall based SPI drought indices with SMDI and ETDI indices derived from a soil water budget model. J. Geophys. Res. 2012, 14, EGU2012-2666. [Google Scholar]
- Heim, R.R. A review of Twentieth-Century drought indices used in the United States. Bull. Am. Meteorol. Soc. 2002, 83, 1149–1165. [Google Scholar] [CrossRef]
- Viste, E.; Korecha, D.; Sorteberg, A. Recent drought and precipitation tendencies in Ethiopia. Theor. Appl. Climatol. 2013, 112, 535–551. [Google Scholar] [CrossRef]
- Edossa, D.; Babel, S.; Gupta, D. Drought analysis in the Awash River Basin, Ethiopia. Water Resour. Manag. 2009, 24, 1441–1460. [Google Scholar] [CrossRef]
- Dessie, M.D.; Verhoest, N.; Pauwels, V.; Negatu, T.A.; Poesen, J.; Adgo, E.; Deckers, J.; Nyssen, J. Analyzing runoff processes through conceptual hydrological modeling in the Upper Blue Nile Basin, Ethiopia. Hydrol. Earth Syst. Sci. 2014, 18, 5149–5167. [Google Scholar] [CrossRef]
- Conway, D. The climate and hydrology of the Upper Blue Nile River. Geograph. J. 2000, 166, 49–62. [Google Scholar] [CrossRef]
- Tekleab, S.; Mohamed, Y.; Uhlenbrook, S. Hydro-Climatic trends in the Abay/Upper Blue Nile basin, Ethiopia. Phys. Chem. Earth 2013, 61, 32–42. [Google Scholar] [CrossRef]
- Kebede, S.; Travi, Y.; Alemayehu, T.; Marc, V. Water balance of Lake Tana and its sensitivity to fluctuations in rainfall, Blue Nile basin, Ethiopia. J. Hydrol. 2006, 316, 233–247. [Google Scholar] [CrossRef]
- Characterization and Atlas of the Blue Nile Basin and Its Sub Basins. Available online: http://publications.iwmi.org/pdf/H042502.pdf (accessed on 24 February 2018).
- Mellander, P.; Gebrehiwot, S.; Gärdenäs, A.; Bewket, W.; Bishop, K. Summer rains and dry seasons in the Upper Blue Nile Basin: the predictability of half a century of past and future spatiotemporal patterns. PLoS ONE 2013, 8, e68461. [Google Scholar] [CrossRef] [PubMed]
- Gebremicael, T.G.; Mohamed, Y.A.; Betrie, G.D.; van der Zaag, P.; Teferi, E. Trend analysis of runoff and sediment fluxes in the Upper Blue Nile basin: A combined analysis of statistical tests, physically-based models and landuse maps. J. Hydrol. 2013, 482, 57–68. [Google Scholar] [CrossRef]
- Betrie, G.D.; Mohamed, Y.A.; van Griensven, A.; Srinivasan, R. Sediment management modelling in the Blue Nile Basin using SWAT model. Hydrol. Earth Syst. Sci. 2011, 15, 807–818. [Google Scholar] [CrossRef]
- Annual Disaster Statistical Review 2010: The Numbers and Trends. Available online: http://www.cred.be/downloadFile.php?file=sites/default/files/ADSR_2010.pdf (accessed on 24 February 2018).
- Guha-Sapir, D.; Below, R. The Quality and Accuracy of Disaster Data: A Comparative Analyse of 3 Global Data Sets; Working Paper ID 191; World Bank: Washington, DC, USA, 2002. [Google Scholar]
- Hargreaves, G.H.; Samani, Z.A. Estimating potential evapotranspiration. J. Irrig. Drain. Div. 1982, 108, 225–230. [Google Scholar]
- MARD. Land Use/Cover Classification of Ethiopia; Ministry of Agriculture and Rural Development: Addis Ababa, Ethiopia, 2004.
- Bceom French Engineer Consultant. Abay River Basin Integrated Master Plan, Main Report; Ministry of Water Resources (MOWR): Addis Ababa, Ethiopia, 1999.
- Mengistu, D.; Sorteberg, A. Validation of SWAT simulated streamflow in the Eastern Nile and sensitivity to climate change. Hydrol. Earth Syst. Sci. Discuss. 2011, 8, 9005–9062. [Google Scholar] [CrossRef]
- Setegn, S.G.; Srinivasan, R.; Dargahi, B. Hydrological modelling in the Lake Tana Basin, Ethiopia using SWAT model. Open Hydrol. J. 2008, 2, 49–62. [Google Scholar] [CrossRef]
- Easton, Z.M.; Fuka, D.R.; White, E.D.; Collick, A.S.; Biruk, A.B.; McCartney, M.; Awulachew, S.B.; Ahmed, A.A.; Steenhuis, T.S. A multi basin SWAT model analysis of runoff and sedimentation in the Blue Nile, Ethiopia. Hydrol. Earth Syst. Sci. 2010, 14, 1827–1841. [Google Scholar] [CrossRef]
- Van Griensven, A.; Ndomba, P.; Yalew, S.; Kilonzo, F. Critical review of SWAT applications in the upper Nile basin countries. Hydrol. Earth Syst. Sci. 2012, 16, 371–3381. [Google Scholar] [CrossRef]
- Steenhuis, T.S.; Collick, A.S.; Easton, Z.M.; Leggesse, E.S.; Bayabil, H.K.; White, E.D.; Awulachew, S.B.; Adgo, E.; Ahmed, A.A. Predicting discharge and sediment for the Abay (Blue Nile) with a simple model. Hydrol. Process. 2009, 23, 3728–3737. [Google Scholar]
- Khan, S.; Gabriel, H.; Rana, T. Standard precipitation index to track drought and assess impact of rainfall on watertables in irrigation areas. Irrig. Drain. Syst. 2008, 22, 159–177. [Google Scholar] [CrossRef]
- Moreira, E.E.; Coelho, C.A.; Paulo, A.A.; Pereira, L.S.; Mexia, J.T. SPI-based drought category prediction using loglinear models. J. Hydrol. 2008, 354, 116–130. [Google Scholar] [CrossRef]
- Kalcic, M.M.; Chaubey, I.; Frankenberger, J. Defining soil and water assessment tool (SWAT) hydrologic response units (HRUs) by field boundaries. Int. J. Agric. Biol. Eng. 2015, 8, 69–80. [Google Scholar]


| Start Date | End Date | Location | Total Affected Population (106) | Total Number of Population in Ethiopia (106) | Ratio b/n Column 4 and 5 (%) |
|---|---|---|---|---|---|
| December 1973 | 1978 | Wollo, North Shoa, Tigray, Kangra province | 3 | 32.57 | 9 |
| May 1983 | 1984 | Wollo, Gondar, Gore, Tigray, Shoa, Harerge, Sidamo | 7.75 | 35.24 | 22 |
| June 1987 | 1987 | Ogaden, Tigray, Wollo, Shewa, Gamo Gofa, Sidama, Gondar, Bale | 7 | 48.06 | 15 |
| October 1989 | 1994 | Northern Ethiopia, Tigray, Wollo, Gondar, Harerge | 6.5 | 48.06 | 14 |
| 2003 | 2004 | Tigray, Oromia, Amhara, Somali, Afar province | 12.6 | 76.61 | 16 |
| May 2008 | October 2009 | Oromia, Somali, Amhara, Afar, Tigray, SNNPR province | 6.4 | 87.56 | 7 |
| Variables | Data Length | Resolutions | Source | |
|---|---|---|---|---|
| Temporal | Spatial | |||
| Actual Evapotranspiration | 1970–2010 | Monthly | HRU | SWAT based |
| soil moisture data | 1970–2010 | Monthly | HRU | SWAT based |
| Rainfall | 1970–2010 | Daily | Point | NMA Ethiopia |
| Temperature | 1970–2010 | Daily | Point | NMA Ethiopia |
| Relative Humidity | 1970–2010 | Daily | Point | NMA Ethiopia |
| Solar Radiation | 1970–2010 | Daily | Point | NMA Ethiopia |
| Wind Speed | 1970–2010 | Daily | Point | NMA Ethiopia |
| River discharge | 1970–2010 | Daily/monthly | Point | NMA Ethiopia |
| DEM | 90 m | SRTM | ||
| Land Use | 2000 | 5 km | MARD | |
| SPI Value | Drought Category |
|---|---|
| −2.00 and less | Extreme |
| −1.50 to −1.99 | Severe |
| −1.00 to −1.49 | Moderate |
| 0 to −0.99 | Near normal or mild |
| Above 0 | No drought |
| above 0.92 | Wet |
| −0.95 to 0.92 | Near normal |
| −1.40 to −0.96 | Moderate drought |
| −1.69 to −1.41 | Severe drought |
| −1.70 or less | Extreme drought |
| Drought Index | Variable | Distribution Fitted |
|---|---|---|
| SPI | Precipitation | Gamma |
| SPEI | Precipitation, PET | Log-logistic |
| SRI | Runoff | CDF standardized to Gaussian values |
| ETDI | Actual evapotranspiration | |
| SMDI | Soil moisture | |
| ADI | Precipitation, actual evapotranspiration, and soil moisture |
| (a) | ||||||||||||||||||
| SPI-1 | 1 | |||||||||||||||||
| SPI-3 | 0.65 | 1 | ||||||||||||||||
| SPI-6 | 0.53 | 0.77 | 1 | |||||||||||||||
| SPI-9 | 0.48 | 0.73 | 0.77 | 1 | ||||||||||||||
| SPI-12 | 0.45 | 0.68 | 0.72 | 0.96 | 1 | |||||||||||||
| SPEI-1 | 0.85 | 0.55 | 0.36 | 0.28 | 0.26 | 1 | ||||||||||||
| SPEI-3 | 0.49 | 0.89 | 0.61 | 0.48 | 0.45 | 0.63 | 1 | |||||||||||
| SPEI-6 | 0.35 | 0.59 | 0.93 | 0.72 | 0.65 | 0.42 | 0.69 | 1 | ||||||||||
| SPEI-9 | 0.32 | 0.53 | 0.75 | 0.94 | 0.83 | 0.33 | 0.55 | 0.79 | 1 | |||||||||
| SPEI-12 | 0.30 | 0.51 | 0.69 | 0.83 | 0.94 | 0.31 | 0.52 | 0.72 | 0.89 | 1 | ||||||||
| SRI-1 | 0.20 | 0.28 | 0.33 | 0.40 | 0.41 | 0.16 | 0.23 | 0.16 | 0.21 | 0.25 | 1 | |||||||
| SRI-3 | 0.22 | 0.31 | 0.31 | 0.44 | 0.48 | 0.11 | 0.26 | 0.25 | 0.26 | 0.30 | 0.81 | 1 | ||||||
| SRI-6 | 0.20 | 0.24 | 0.37 | 0.49 | 0.52 | 0.07 | 0.19 | 0.31 | 0.31 | 0.33 | 0.70 | 0.88 | 1 | |||||
| SRI-9 | 0.24 | 0.32 | 0.43 | 0.51 | 0.53 | 0.08 | 0.16 | 0.26 | 0.33 | 0.34 | 0.63 | 0.80 | 0.93 | 1 | ||||
| SRI-12 | 0.21 | 0.31 | 0.41 | 0.52 | 0.55 | 0.04 | 0.15 | 0.24 | 0.30 | 0.36 | 0.57 | 0.74 | 0.87 | 0.95 | 1 | |||
| ETDI | 0.53 | 0.67 | 0.59 | 0.43 | 0.45 | 0.59 | 0.49 | 0.34 | 0.28 | 0.28 | 0.23 | 0.21 | 0.22 | 0.28 | 0.27 | 1 | ||
| SMDI | 0.44 | 0.65 | 0.45 | 0.38 | 0.29 | 0.43 | 0.55 | 0.37 | 0.32 | 0.32 | 0.25 | 0.28 | 0.21 | 0.18 | 0.17 | 0.68 | 1 | |
| ADI | 0.75 | 0.59 | 0.40 | 0.32 | 0.30 | 0.78 | 0.59 | 0.39 | 0.38 | 0.36 | 0.33 | 0.23 | 0.15 | 0.12 | 0.13 | 0.68 | 0.63 | 1 |
| (b) | ||||||||||||||||||
| SPI-1 | 1 | |||||||||||||||||
| SPI-3 | 0.55 | 1 | ||||||||||||||||
| SPI-6 | 0.35 | 0.65 | 1 | |||||||||||||||
| SPI-9 | 0.27 | 0.48 | 0.74 | 1 | ||||||||||||||
| SPI-12 | 0.20 | 0.39 | 0.61 | 0.81 | 1 | |||||||||||||
| SPEI-1 | 0.87 | 0.54 | 0.33 | 0.26 | 0.20 | 1 | ||||||||||||
| SPEI-3 | 0.48 | 0.89 | 0.59 | 0.43 | 0.34 | 0.59 | 1 | |||||||||||
| SPEI-6 | 0.30 | 0.58 | 0.91 | 0.66 | 0.53 | 0.36 | 0.66 | 1 | ||||||||||
| SPEI-9 | 0.24 | 0.44 | 0.69 | 0.92 | 0.73 | 0.29 | 0.49 | 0.74 | 1 | |||||||||
| SPEI-12 | 0.18 | 0.35 | 0.56 | 0.75 | 0.91 | 0.22 | 0.39 | 0.60 | 0.81 | 1 | ||||||||
| SRI-1 | 0.10 | 0.18 | 0.17 | 0.14 | 0.16 | 0.07 | 0.15 | 0.15 | 0.08 | 0.07 | 1 | |||||||
| SRI-3 | 0.10 | 0.19 | 0.23 | 0.17 | 0.18 | 0.05 | 0.14 | 0.20 | 0.12 | 0.08 | 0.86 | 1 | ||||||
| SRI-6 | 0.08 | 0.20 | 0.28 | 0.26 | 0.23 | 0.05 | 0.13 | 0.21 | 0.20 | 0.13 | 0.63 | 0.83 | 1 | |||||
| SRI-9 | 0.06 | 0.19 | 0.29 | 0.32 | 0.30 | 0.05 | 0.14 | 0.22 | 0.24 | 0.21 | 0.49 | 0.67 | 0.87 | 1 | ||||
| SRI-12 | 0.05 | 0.16 | 0.27 | 0.32 | 0.36 | 0.03 | 0.12 | 0.21 | 0.23 | 0.24 | 0.48 | 0.56 | 0.71 | 0.84 | 1 | |||
| ETDI | 0.27 | 0.51 | 0.39 | 0.25 | 0.22 | 0.29 | 0.49 | 0.37 | 0.27 | 0.26 | 0.01 | 0.00 | 0.03 | 0.04 | 0.09 | 1 | ||
| SMDI | 0.24 | 0.42 | 0.35 | 0.30 | 0.28 | 0.23 | 0.37 | 0.28 | 0.23 | 0.22 | 0.14 | 0.13 | 0.12 | 0.13 | 0.08 | 0.38 | 1 | |
| ADI | 0.07 | 0.10 | 0.08 | 0.06 | 0.03 | 0.09 | 0.06 | 0.05 | 0.01 | 0.03 | 0.16 | 0.14 | 0.09 | 0.02 | 0.08 | 0.04 | 0.00 | 1 |
| SPI-1 | SPI-3 | SPI-6 | SPI-9 | SPI-12 | SPEI-1 | SPEI-3 | SPEI-6 | SPEI-9 | SPEI-12 | SRI-1 | SRI-3 | SRI-6 | SRI-9 | SRI-12 | ETDI | SMDI | |
|---|---|---|---|---|---|---|---|---|---|---|---|---|---|---|---|---|---|
| SPI-3 | |||||||||||||||||
| SPI-6 | |||||||||||||||||
| SPI-9 | |||||||||||||||||
| SPI-12 | |||||||||||||||||
| SPEI-1 | |||||||||||||||||
| SPEI-3 | |||||||||||||||||
| SPEI-6 | |||||||||||||||||
| SPEI-9 | |||||||||||||||||
| SPEI-12 | |||||||||||||||||
| SRI-1 | |||||||||||||||||
| SRI-3 | |||||||||||||||||
| SRI-6 | |||||||||||||||||
| SRI-9 | |||||||||||||||||
| SRI-12 | |||||||||||||||||
| ETDI | |||||||||||||||||
| SMDI | |||||||||||||||||
| ADI |
 p < 0.01,
  p < 0.1,
  p > 0.1.
| Drought Index | SPI-3 | SPEI-3 | SRI-3 | ETDI | SMDI | ADI |
|---|---|---|---|---|---|---|
| 1973–1978 drought (Onset on December according to EM-DAT) | ||||||
| Starting date | Before 01/1973 | Before 01/1973 | 03/1973 | 11/1973 | 07/1973 | 07/1976 |
| Ending date | 04/1973 | 04/1973 | 06/1974 | 06/1974 | 05/1974 | 04/1977 |
| Mean Intensity, M | −1.21 | −1.23 | −0.75 | −0.48 | −0.42 | −0.94 |
| Maximum intensity, Mmax | −2.57 | −2.33 | −1.36 | −1.47 | −1.19 | −2.43 |
| Duration, D (months) | 4 | 4 | 16 | 8 | 11 | 10 |
| Severity, S | −4.84 | −4.91 | −11.94 | −3.85 | −4.57 | −9.38 |
| 1983–1984 drought (Onset on May according to EM-DAT) | ||||||
| Starting date | Before 01/1983 | Before 01/1983 | Before 01/1983 | 12/1983 | Before 01/1983 | 09/1983 |
| Ending date | 05/1984 | 07/1983 | After 12/1984 | After 12/1984 | After 12/1984 | 04/1984 |
| Mean Intensity, M | −0.99 | −0.86 | −1.36 | −-0.66 | −0.53 | −0.46 |
| Maximum intensity, Mmax | −2.45 | −1.95 | −2.53 | −1.53 | −1.78 | −1.98 |
| Duration, D (months) | 17 | 7 | 24 | 13 | 24 | 8 |
| Severity, S | −16.82 | −6.02 | −32.59 | −8.62 | −12.79 | −3.68 |
| 1989–1994 drought (Onset on October according to EM-DAT) | ||||||
| Starting date | 06/1989 | 07/1989 | 12/1989 | 04/1990 | 02/1990 | 12/1993 |
| Ending date | 08/1990 | 08/1990 | 12/1990 | 02/1991 | 01/1991 | After 12/1994 |
| Mean Intensity, M | −0.69 | −0.65 | −0.70 | −0.85 | −0.46 | −0.57 |
| Maximum intensity, Mmax | −2.49 | −2.09 | −1.38 | −1.92 | −1.18 | −1.57 |
| Duration, D (months) | 15 | 14 | 13 | 9 | 11 | 13 |
| Severity, S | −10.30 | −9.13 | −-9.06 | −7.62 | −5.08 | −7.38 |
| 2003–2004 drought (Onset not defined according to EM-DAT) | ||||||
| Starting date | Before 01/2003 | 02/2004 | 07/2004 | Before 01/2003 | Before 01/2003 | Before 01/2003 |
| Ending date | 10/2004 | 12/2004 | 12/2004 | After 12/2004 | After 12/2004 | 12/2003 |
| Mean Intensity, M | −0.59 | −0.71 | −1.61 | −0.51 | −0.45 | −0.92 |
| Maximum intensity, Mmax | −1.95 | −2.63 | −2.13 | −1.23 | −1.36 | −2.27 |
| Duration, D (months) | 22 | 11 | 6 | 24 | 24 | 12 |
| Severity, S | −12.95 | −7.79 | −9.64 | −12.26 | −10.85 | −11.09 |
© 2018 by the authors. Licensee MDPI, Basel, Switzerland. This article is an open access article distributed under the terms and conditions of the Creative Commons Attribution (CC BY) license (http://creativecommons.org/licenses/by/4.0/).
Share and Cite
Bayissa, Y.; Maskey, S.; Tadesse, T.; Van Andel, S.J.; Moges, S.; Van Griensven, A.; Solomatine, D. Comparison of the Performance of Six Drought Indices in Characterizing Historical Drought for the Upper Blue Nile Basin, Ethiopia. Geosciences 2018, 8, 81. https://doi.org/10.3390/geosciences8030081
Bayissa Y, Maskey S, Tadesse T, Van Andel SJ, Moges S, Van Griensven A, Solomatine D. Comparison of the Performance of Six Drought Indices in Characterizing Historical Drought for the Upper Blue Nile Basin, Ethiopia. Geosciences. 2018; 8(3):81. https://doi.org/10.3390/geosciences8030081
Chicago/Turabian StyleBayissa, Yared, Shreedhar Maskey, Tsegaye Tadesse, Schalk Jan Van Andel, Semu Moges, Ann Van Griensven, and Dimitri Solomatine. 2018. "Comparison of the Performance of Six Drought Indices in Characterizing Historical Drought for the Upper Blue Nile Basin, Ethiopia" Geosciences 8, no. 3: 81. https://doi.org/10.3390/geosciences8030081
APA StyleBayissa, Y., Maskey, S., Tadesse, T., Van Andel, S. J., Moges, S., Van Griensven, A., & Solomatine, D. (2018). Comparison of the Performance of Six Drought Indices in Characterizing Historical Drought for the Upper Blue Nile Basin, Ethiopia. Geosciences, 8(3), 81. https://doi.org/10.3390/geosciences8030081


