Article

Interception of Rainfall in Successional Tropical Dry Forests in Brazil and Costa Rica

by
Julio César Calvo-Alvarado
1,*,
César Dionisio Jiménez-Rodríguez
1,2,
Ana Julieta Calvo-Obando
1,
Mário Marcos do Espírito-Santo
3 and
Thiago Gonçalves-Silva
3
1
Escuela de Ingeniería Forestal, Tecnológico de Costa Rica, Barrio Los Ángeles, P.O. Box 159-7050 Cartago, Costa Rica
2
Water Resources Section, Delft University of Technology, 2628 CN Delft, The Netherlands
3
Laboratório de Ecologia Evolutiva, Universidade Estadual de Montes Claros, Campus Darcy Ribeiro, Minas Gerais 39401-089, Brazil
*
Author to whom correspondence should be addressed.
Geosciences 2018, 8(12), 486; https://doi.org/10.3390/geosciences8120486
Submission received: 5 November 2018 / Revised: 7 December 2018 / Accepted: 11 December 2018 / Published: 14 December 2018
(This article belongs to the Special Issue Advances in Rainfall and Evaporation Partitioning)

Abstract

:
Tropical dry forests (TDF) are endangered ecosystems characterized by a matrix of successional forest patches with structural differences across the Neotropics. Until now, there have been few studies that analyze the partitioning of rainfall by forest interception in TDF. To contribute to the understanding of the TDF impact on the hydrological dynamic at the ecosystem and landscape levels, a rainfall interception study was conducted in Santa Rosa National Park in Costa Rica (SRNP) and in Mata Seca State Park in Brazil (MSSP). In each site, three plots per successional stage were studied. The successional stages were early, intermediate, and late. In each plot the rainfall, throughfall, and stemflow were monitored during one rainy season. The relationship between gross rainfall and water fluxes was evaluated using linear regression models. In general, net rainfall oscillated from 79.3% to 85.4% of gross rainfall in all the plots in MSSP without any trend related to forest succession, due to the effect of a high density of lianas in the intermediate and late stage plots. In SRNP, there was a clear trend of net rainfall among successional stages: 87.5% (early), 73.0% (intermediate), and 63.4% (late). Net rainfall correlated negatively only with plant area index in SRNP (r = −0.755, p < 0.05). This study highlights the need to study rainfall interception in successional stages to estimate net rainfall that reaches the soil. This would provide better hydrological information to understand water balance and water fluxes at the level of forest ecosystems and landscapes.

1. Introduction

According to the Holdridge life zone system [1], tropical dry forests (TDF) have a bio-temperature greater than 17 °C, an annual rainfall of 500–2000 mm yr−1 and a dry season that lasts 4–6 months. Last forest cover assessments concluded that the total potential extent of TDF in the Americas was 1,520,659 km2, but there was only 519,597 km2 (34%) in 2010. Sadly, only 4.5% (23,417 km2) of the total TDF currently in the Americas is under protection by conservation areas. Remnants of TDF that are not protected are now highly fragmented across the continent and are under high anthropogenic pressures. As a result, most TDF cannot longer be considered pristine old-growth forests, but rather as a mosaic of successional stages. On the positive side, during recent decades, several studies have shown that TDF are recovering in some areas through natural restoration [2,3].
TDF landscapes are densely populated, because agriculture development is favored by good climate and soil conditions for cropping; therefore, there is a high dependency on the availability of surface or underground water resources. Recent analysis indicated that >44% of the cities of the Neotropics are located within dry ecoregions and >66% of reservoirs and dams in the Neotropics are located within these dry ecoregions [4]. Consequently, it is necessary to avoid greater negative effects from soil erosion, pollution, and sedimentation of rivers, streams, and reservoirs. It is important to understand that conservation of TDF maintains and enhances ecosystem services by increasing the landscape’s resilience to hydrological impacts from climate change. Hence, more research is needed on the hydrological dynamics of TDF landscapes and their interaction with land use and climate change scenarios to generate suitable strategies to reduce a myriad of detrimental consequences.
Forest ecosystems have a direct influence on the spatial and temporal distribution of precipitation because of their canopy structure [5]. This layer is highly heterogeneous due to the angle, size, and location of twigs, branches, leaves, species composition, tree density, and heights [6]. Thus, interception of rainfall in forest ecosystems plays an important role in the hydrology by capturing water on plant surfaces, increasing evaporation losses, and delaying the response of streams to rainfall events. Tropical forests have a high capacity to reduce significantly the effective or net rainfall that reaches the soil, and this could modify water fluxes [7,8,9].
In the meantime, the effects of forest age or successional forest stages on rainfall interception have only been studied widely in forest plantations, temperate forests, and a few tropical rain forests [8,10]. The interception capacity of TDF successional stages has not been studied with the same effort, except in Costa Rica, Panama, and Brazil [11,12,13]. Therefore, the evaluation of rainfall interception by successional stages of TDF is indispensable for estimating the net rainfall that reaches the soil to provide better hydrological information to understand water balance and water fluxes at the level of forest ecosystems and landscapes.
Within this introductory framework, the first aim of our study was to evaluate and to compare the rainfall interception fluxes of three successional stages of TDF in Costa Rica and Brazil. Our second aim was to develop and to evaluate linear regression equations to estimate these water fluxes in each forest successional stage by country.

2. Materials and Methods

2.1. Study Sites

The selected experimental plots were located in Brazil and Costa Rica; both sites are TDF and experience a strong seasonality with an extended dry period, which can last up to six months. The Brazilian site is located within the Mata Seca State Park (MSSP) in Minas Gerais (14°56′59″ S and 44°04′12″ W) at an elevation of 452 masl The Costa Rican site is within the Santa Rosa National Park (SRNP) in Guanacaste (10º53′1.0″ N, 85º46′30″ W) at 597 masl (Figure 1). Both locations include TDF with a complex matrix of successional stages [12,14].
Climatic conditions for SRNP are described based on data from its weather station for 1980–2010. The average annual temperature is 26.7 °C (monthly range: December 25.6 °C and April 28.5 °C), average annual rainfall is 1623.7 mm yr−1 (monthly range: October (697 mm month−1) and March (0.4 mm month−1)), with an average of 56 rainy days per year and a record maximum daily rainfall of 261.6 mm d−1. The most common soil orders in the SRNP are Entisols and Vertisols (USDA Soil Taxonomy), which are both associated with poorly drained sites with slopes <3%.
The climate of MSSP is based on data from the Mocambinho weather station (15°05′S, 44°01′W, 452 masl) for 1976–2012, which is 26 km from MSSP. The average annual temperature is 24.6 °C (monthly range: October with 26.8 °C and July with 21.8 °C), and the average annual rainfall is 904.6 mm yr−1 (rainiest month December with 206 mm month−1), with an average of 61 rainy days per year and a record maximum daily rainfall of 132.9 mm d−1. The plots were located in Fluvisol soils (FAO Soil Classification) or Fluvents (USDA Soil Taxonomy) and are characterized by being deep and well drained.
Following the Tropi-Dry project protocols [15], in 2006 we established nine and 18 permanent plots of 1000 m2 (20 m × 50 m) in the SRNP and MSSP respectively, to study forest structure and tree growth of TDF successional stages. The successional stages were selected according to their vertical structure [16,17], and we defined three stages of secondary forest: early, intermediate, and late. These plots were established and monitored by the faculty of Biology of Unimontes University (Brazil) and by the School of Forestry of the Costa Rican Institute of Technology. The plots were measured yearly at the end of the dry season. All trees with diameter at breast height (DBH) >5 cm were measured for tree diameter (cm) and height (m).
In MSSP the early successional stage had only one stratum of trees with a very open canopy. This area was covered with pasture for 20 years, and cattle were not removed until the year 2000. The intermediate successional stage had two stratum of trees 10–12 m high and some emergent trees up to 15 m. The second stratum was a dense understory of young trees with abundant lianas. This area was also pasture land for an unknown period and was abandoned in the 1980s. The late successional stage had a stratum of trees 18–20 m high with a closed canopy. The second stratum was formed by a scattered understory with low light penetration and a low density of young trees. There are no records of logging in this area over the last 50 years [17].
In SRNP the early stage was characterized by the presence of shrubs, grasses and herbs plants that was surrounded by patches of bare soil; the forest had only one stratum with a discontinuous canopy with tree heights <5 m. The early-stage forests grew after several intensive pasture fires that took place before the 1980s. The intermediate stage had two strata dominated by deciduous trees with some lianas and the emergence of shade-tolerant species in the understory. The intermediate forest stage was affected by logging and less intense fires early in the 1970s. The late stage was comprised of deciduous and evergreen tree species with a high cover of shade-tolerant species in the understory. The late stages were located in areas where the last reported selective timber harvesting took place in the 1920s [16].

2.2. Experimental Design

Due to logistic limitations, the study evaluated only one rainy season and three plots per stage in each site (nine plots per country). The sampling periods were November 2012–January 2013 and August–October 2013 in MSSP and SRNP, respectively. The sampling protocol described by Jiménez-Rodríguez and Calvo-Alvarado [12] was adapted for both sites. All samples were collected before 8:00 am after every rainy day to prevent evaporation losses from the gauges and the stemflow containers in the following order: early, intermediate, and late successional stages.
Each plot was equipped with one rain gauge at 1.5 m above the ground that was placed in a nearby open area to measure gross rainfall (PGr). Due to the absence of large canopy gaps, most of the plots required to place a funnel at least 2 m above the canopy and connected to a hose towards a 5 L container which was placed at ground level for daily measurements. Due to the reduced time available for measuring the nine plots in each site, we placed 20 funnel type gauges to sample throughfall (PTF) in each plot. A revolving sampling technique was implemented to reduce the standard error of the estimation caused by the high variability in the horizontal distribution of the tree crowns [18]. Hence, the throughfall gauges were distributed on the forest floor at 2.5 m from each other along the central axis of the plot. After measuring five events, the sampling line was moved 5 m to either side of the central axis, and then it was moved 10 m, 15 m, and 20 m away from the central axis for subsequent sampling to cover the entire plot area. Once one rotation was completed, the trial was reset again from the central axis. The volume of water collected by each rain gauge (PGr and PTF) was converted into mm d−1 with respect to the funnel collection area.
The assignment of only 20 funnel gauges to measure throughfall per plot might have an impact on the precision of the estimates. By evaluating the historical record for each weather station, it was found that in both sites >90% of the total annual rainfall volume was comprised of events >5 mm d−1. According to Jiménez-Rodríguez and Calvo-Alvarado [12], by placing 20 gauges plot−1, the following precision for all events ≥5 mm d−1 was achieved: early (10–15%), intermediate (±20%), and late (20–30%).
Stemflow (PSF) was measured by selecting four trees per plot in SRNP that corresponded to the 20, 40, 60, and 80 percentiles of the distribution of plot tree diameters for a total sample of 12 trees per stage. For each selected tree, the projected crown area was estimated with the average tree crown diameter using the longest and shorter diameter of the crown. In MSSP, the distances among plots were large and, therefore, we decided to select only six trees per stage to evaluate stemflow that corresponded to 15, 30, 45, 60, 75, and 90 percentiles of the distribution of stage tree diameter (two trees per plot). The trees were chosen with no regard to species (Table 1), but rather to the required diameter class, straightness of the stem, and with uniform distribution of branches. The stemflow was collected through a spiral collar attached to the trunks with nails and sealed with silicone paste. Each spiral collar conducted the stemflow to a polyethylene container of 50–200 L depending on the tree size and placed at the foot of the tree. The collected volume of water in L per tree was converted into mm d−1 with respect to tree crown area. Stemflow was projected to an area of 1 m2 by calculating the average stemflow (mm) of all evaluated trees and multiplying it by the mean number of trees per square meter per plot (SRNP) or stage (MSSP) [19].

2.3. Data Analysis

Forest composition was evaluated using the number of tree species in each plot. Forest structure was evaluated through the plot basal area (m2 0.1 ha−1), mean tree height (m), stem density (trees 0.1 ha−1), Holdridge Complexity Index (HCI), and the plant area index (PAI), which was measured during the rainy season using hemispherical photographs analyzed with the software Gap Light Analyzer [20]. Holdridge Complexity Index [1] is determined with Equation (1) where H is the canopy height (m), G is the tree basal area (m2 0.1 ha−1), D is the tree density and S is the number of species in a 0.1 ha−1. For this study, net rainfall (PNet) was defined as the water that reached the forest floor, and it corresponded to the sum of throughfall and stemflow per plot. On the other hand, the intercepted rainfall (PInt) was the difference between gross rainfall (PGr) and net rainfall (PNet). This variable was estimated with Equation (2), where PInt is the intercepted water (mm d−1), PGri is the daily gross rainfall (mm d−1), PTFi is the daily rainfall collected as throughfall (mm d−1), and PSFi is the rainfall collected as stem flow (mm d−1).
H CI = HGDS 1000
P Int i = P Gr i ( P TF i + P SF i )
The relationship among gross rainfall and the other fluxes was evaluated through linear regression models. Linear regression models applied to each successional stage were defined by y = α + β x ± εi, where α is the interception with the y axis, β is the slope of the equation that represents the proportion of water retained by the canopy, and εi is the error associated with the estimate. Both the regression coefficient and the intercept were tested to determine if they were statistically different from zero (p < 0.05 and p < 0.10). For those regressions that produced non-significant intercepts, we made no attempt to remove them from the model to maintain all equations equal.
Comparison of regression coefficients of net rainfall at forest stage level between both countries was performed with the Z test proposed by Paternoster, Brame, Mazerolle, and Piquero [21] using Equation (3). This test is based on the differences between regression coefficients and their standard errors. The Z value was compared against the t value on the t student distribution, where β is the regression coefficient and SE is the standard error of the coefficient.
Z = β 1 β 2 S E β 1 2 + S E β 2 2
Finally, a Pearson correlation matrix was obtained to study the relationship of net rainfall with forest structural parameters by pooling all data from the 18 plots of all stages from Costa Rica and Brazil. Statistical significance was fixed at p < 0.05 and p < 0.01. Each significant correlation was examined graphically by plotting the two correlated variables to determine the validity of the relationship. If the trend revealed that the significance of the correlation was from the influence of outliers, then it was discarded.

3. Results and Discussion

3.1. Meteorological Conditions

The meteorological station of Mocambinho, which was close to the MSSP, registered an annual rainfall of 602.2 mm yr−1 during the hydrological year 2013–2014, and it was distributed among three periods of convective rains. Daily temperatures oscillated between 21.1 °C to 30.5 °C, with a mean annual temperature of 25.8 ± 1.8 °C. Mean annual relative humidity was 62.3% (monthly range: September (45.2%) and March (72.7%)) and was strongly influenced by rain events; humidity decreased almost automatically with the absence of rains. During the sampling period in MSSP, total rainfall was 294.4 mm for the early successional stage, 229.3 mm for the intermediate stage, and 174.4 mm for the late stage; there was a maximum daily rainfall of 70.5 mm d−1 (from November 2012 to January 2013).
SRNP had an annual rainfall during the hydrological year 2013–2014 of 1118.0 mm yr−1. Daily temperature fluctuated between 22.4 °C and 27.4 °C, with a mean annual temperature of 25.1 ± 0.9 °C, and temperature did not exhibit strong changes throughout the year. The relative humidity increased from a minimum of 51.4% in March to a maximum of 98.4% in the rainy season, with small daily changes that were contrary to the Brazil site. During the sampling period, SRNP recorded 372.7 mm of rain in the early successional stage, 385.2 mm in the intermediate stage, and 327.8 mm in the late stage, with a maximum daily rainfall of 83.5 mm d−1.
In general, temperatures at both sites showed comparable ranges of values during this study. However, relative humidity was notably drier in MSSP than in SRMP as a direct consequence of total rainfall measured during the hydrological year: 602.2 mm yr−1 for MSSP and 1118.0 mm yr−1 for SRSP. It is important to mention that despite the geographical proximity among plots in each site, there was significant heterogeneity in gross rainfall among stages and plots (Table 2), which reinforced the need to measure gross rainfall in each plot to reduce the estimation error. In addition, total sampled days during this study were greater for SRNP (89 to 78 days) than for MSSP (34 to –36 days), which is an expected result due to the lower annual rainfall in MSSP (Table 3).

3.2. Structural Characteristics of Forests

In spite of the similar life zone classification at both sites (Tropical Dry Forest), forest structure for all stages differed notably between sites. MSSP had higher values for the Holdridge Complexity Index, number of tree species, and tree density, whereas SRNP had higher values for tree height, plant area index, and basal area (Table 4). These marked differences were associated with climatic conditions. It is well know that species richness is higher in drier sites like MSSP [2]. On the other hand, height, basal area, and PAI were higher for SRNP due to the rainier conditions.

3.3. Water Fluxes and Forest Structure

Rates of throughfall for SRNP followed the expected decline with increasing complexity of forest structure from early successional stage (87.3%) to intermediate (72.7%) to late (63.2%) (Table 2). This implies that as the forest structure became more complex, the capacity to intercept water increased (Table 3). At MSSP, there was no such trend: early (85.2%), intermediate (79.2%), and late (84.3%). One possible explanation is that the structural differences in forests between intermediate and late stages were not as strong as at SRNP. For example, the difference in average tree height (Table 4) between intermediate and late stages in Brazil was only 0.3 m (15.9 m, 16.2 m), but at SRNP the difference of 5.9 m (16.5, 22.4) was remarkably higher. In addition, a high density of lianas could affect interception capacity in MSSP. Madeira et al. [17] reported for MSSP in plots of 1000 m2 that there were no lianas in the early stage and an outstanding density of lianas in the intermediate stage (32 lianas plot−1) compared with the late stage (15 lianas plot−1). In addition, the basal area of lianas in the intermediate stage was 55% greater than in the late stage (0.56 m2 plot−1 compared with 0.36 m2 plot−1). These explanations justify also the same trend differences observed for net rainfall and interception between both sites (Table 2).
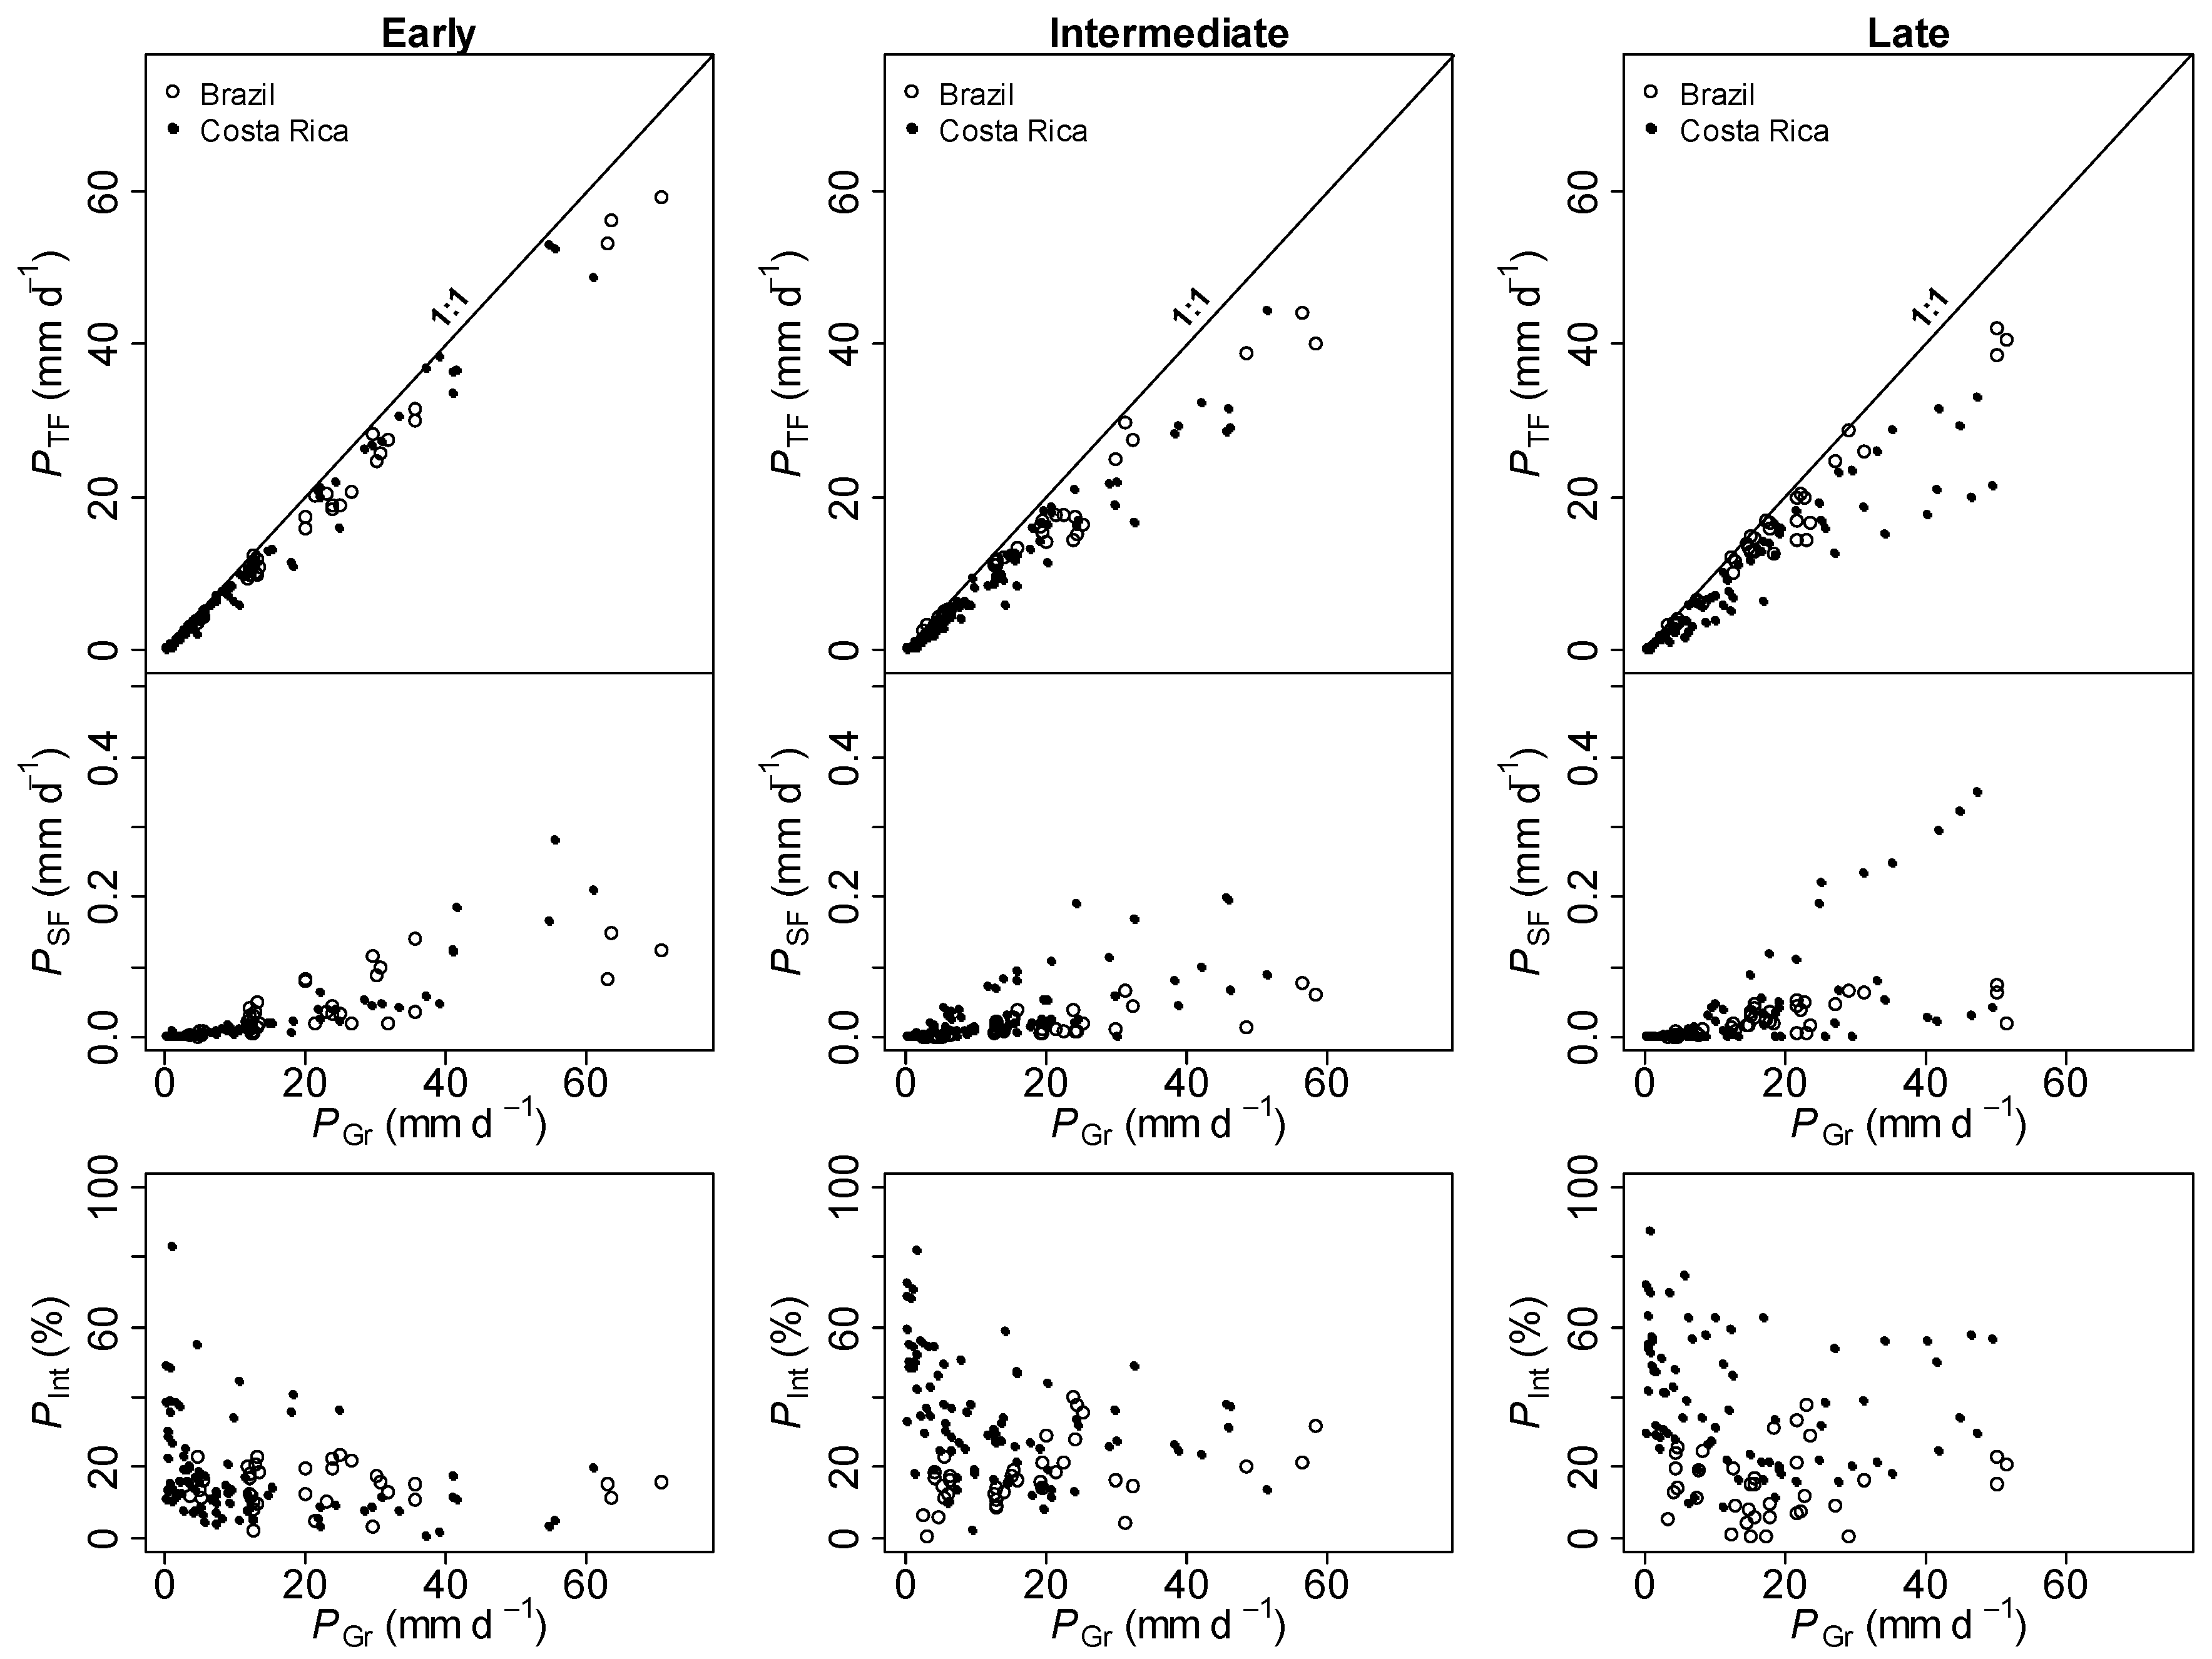
Throughfall (PTF) and stemflow (PSF) fluxes increased with gross rainfall (PGr) in all stages at both sites (Figure 2). As expected, forest interception (PInt) was higher when the gross rainfall events were low, and it was lower when the gross rainfall events were higher, due to a decline in the interception capacity as the foliage and bark became saturated during the rainfall event. It is important to note that the dispersion of points for PTF and PSF have a nearly linear trend in all stages at both sites. However, the dispersion of the points increased as it progressed from the early to the late stages, especially at SRNP. This dispersion reflected the high variability in forest structure among the SRNP plots, particularly in the late stage.
The trend of stemflow with respect to successional stages also differed between sites. At SRNP, stemflow was lowest in the early stage (0.2%) and highest in the intermediate and late stages (0.3%). These results were expected due to the dominance of larger trees in the advanced stages that had higher collecting capacity due to more developed crowns, branches, and trunks. At MSSP, the trend was reversed, with the highest collecting capacity in the early stage (0.2%) and the lowest in intermediate and late stages (0.1%). These results contradict previous studies developed in Brazil in TDF that showed the same stemflow trend as the SRNP site [11,22]. Therefore, the results from MSSP were unforeseen and difficult to interpret in this study. One possible explanation for the low rates of stemflow in the intermediate and late stages in MSSP was the outstanding abundance of lianas found in both stages, which could alter the flow of water from tree crowns and branches to the stems. Madeira et al. [17] indicated that the intermediate and late stages at MSSP had a high density of lianas, but in the early stage, lianas were almost absent.

3.4. Regression Models for Forest Interception Fluxes

The coefficients of determination (R2) of throughfall were > 0.93 in all stages at each site, using the gross daily rainfall as the independent variable (Table 3). These good linear regression adjustments were the result of the sampling technique and the selected sample size for this study. Because throughfall represented the highest proportion of net rainfall, the coefficients of determination for equations for net rainfall had also almost identical values of R2 and levels of statistical significance compared with the equations for throughfall.
Coefficients of determination (R2) for stemflow were >0.70 in all stages at each site, except for the late stage at SRNP, which had the lowest R2 (0.56) (Table 3). Hence, in comparison to equations for throughfall, results for stemflow had lower linear regression adjustments (R2) because of the small sample size and higher dispersion of data (Figure 2). The lower R2 for the late stage at SRNP was due to the high variability in structural characteristics among the late stage plots. Plot CR1L3 (Table 4) was the oldest, and it included several remnant trees of outstanding dimensions (height, diameter, crowns).
In general terms, most of the intercepts (α) in all the equations were not significantly different from zero with p < 0.05 and p < 0.10. Regardless of these results and as stated in the methodology, the models were not forced through the origin, so that all equations were equal and allowed a fair comparison of the slopes (β) among stages and between sites. In all equations, the slopes (β) were statistically significant at p < 0.05, hence, these models provided a tool to estimate the water fluxes in successional TDF of Costa Rica and Brazil.
Because the study sites have different climates and tree species composition, we tested if it was feasible to generate generalized equations to estimate net rainfall for successional TDF that would be applicable for any site within the ranges of climate and forest structural characteristics of this study. Following the test indicated in the methodology to compare equations between sites, we found that the equations for early and intermediate stages were statistically the same (p < 0.05). Therefore, the two generalized equations to estimate net rainfall for the early and intermediate successional stages of TDF are included (Table 3). In the case of late successional stages, the equations were not equal; therefore, we recommend that the investigator choose one equation that best represents the biophysical characteristics (climate and forest structure) of the site of interest. It is important to point out that according to literature review, the slopes (β) of the equations for net rainfall with gross rainfall are the best estimation of the rainfall interception of the forest stages that we analyzed [23].

3.5. Relationship between Net Rainfall and Forest Structural Parameters

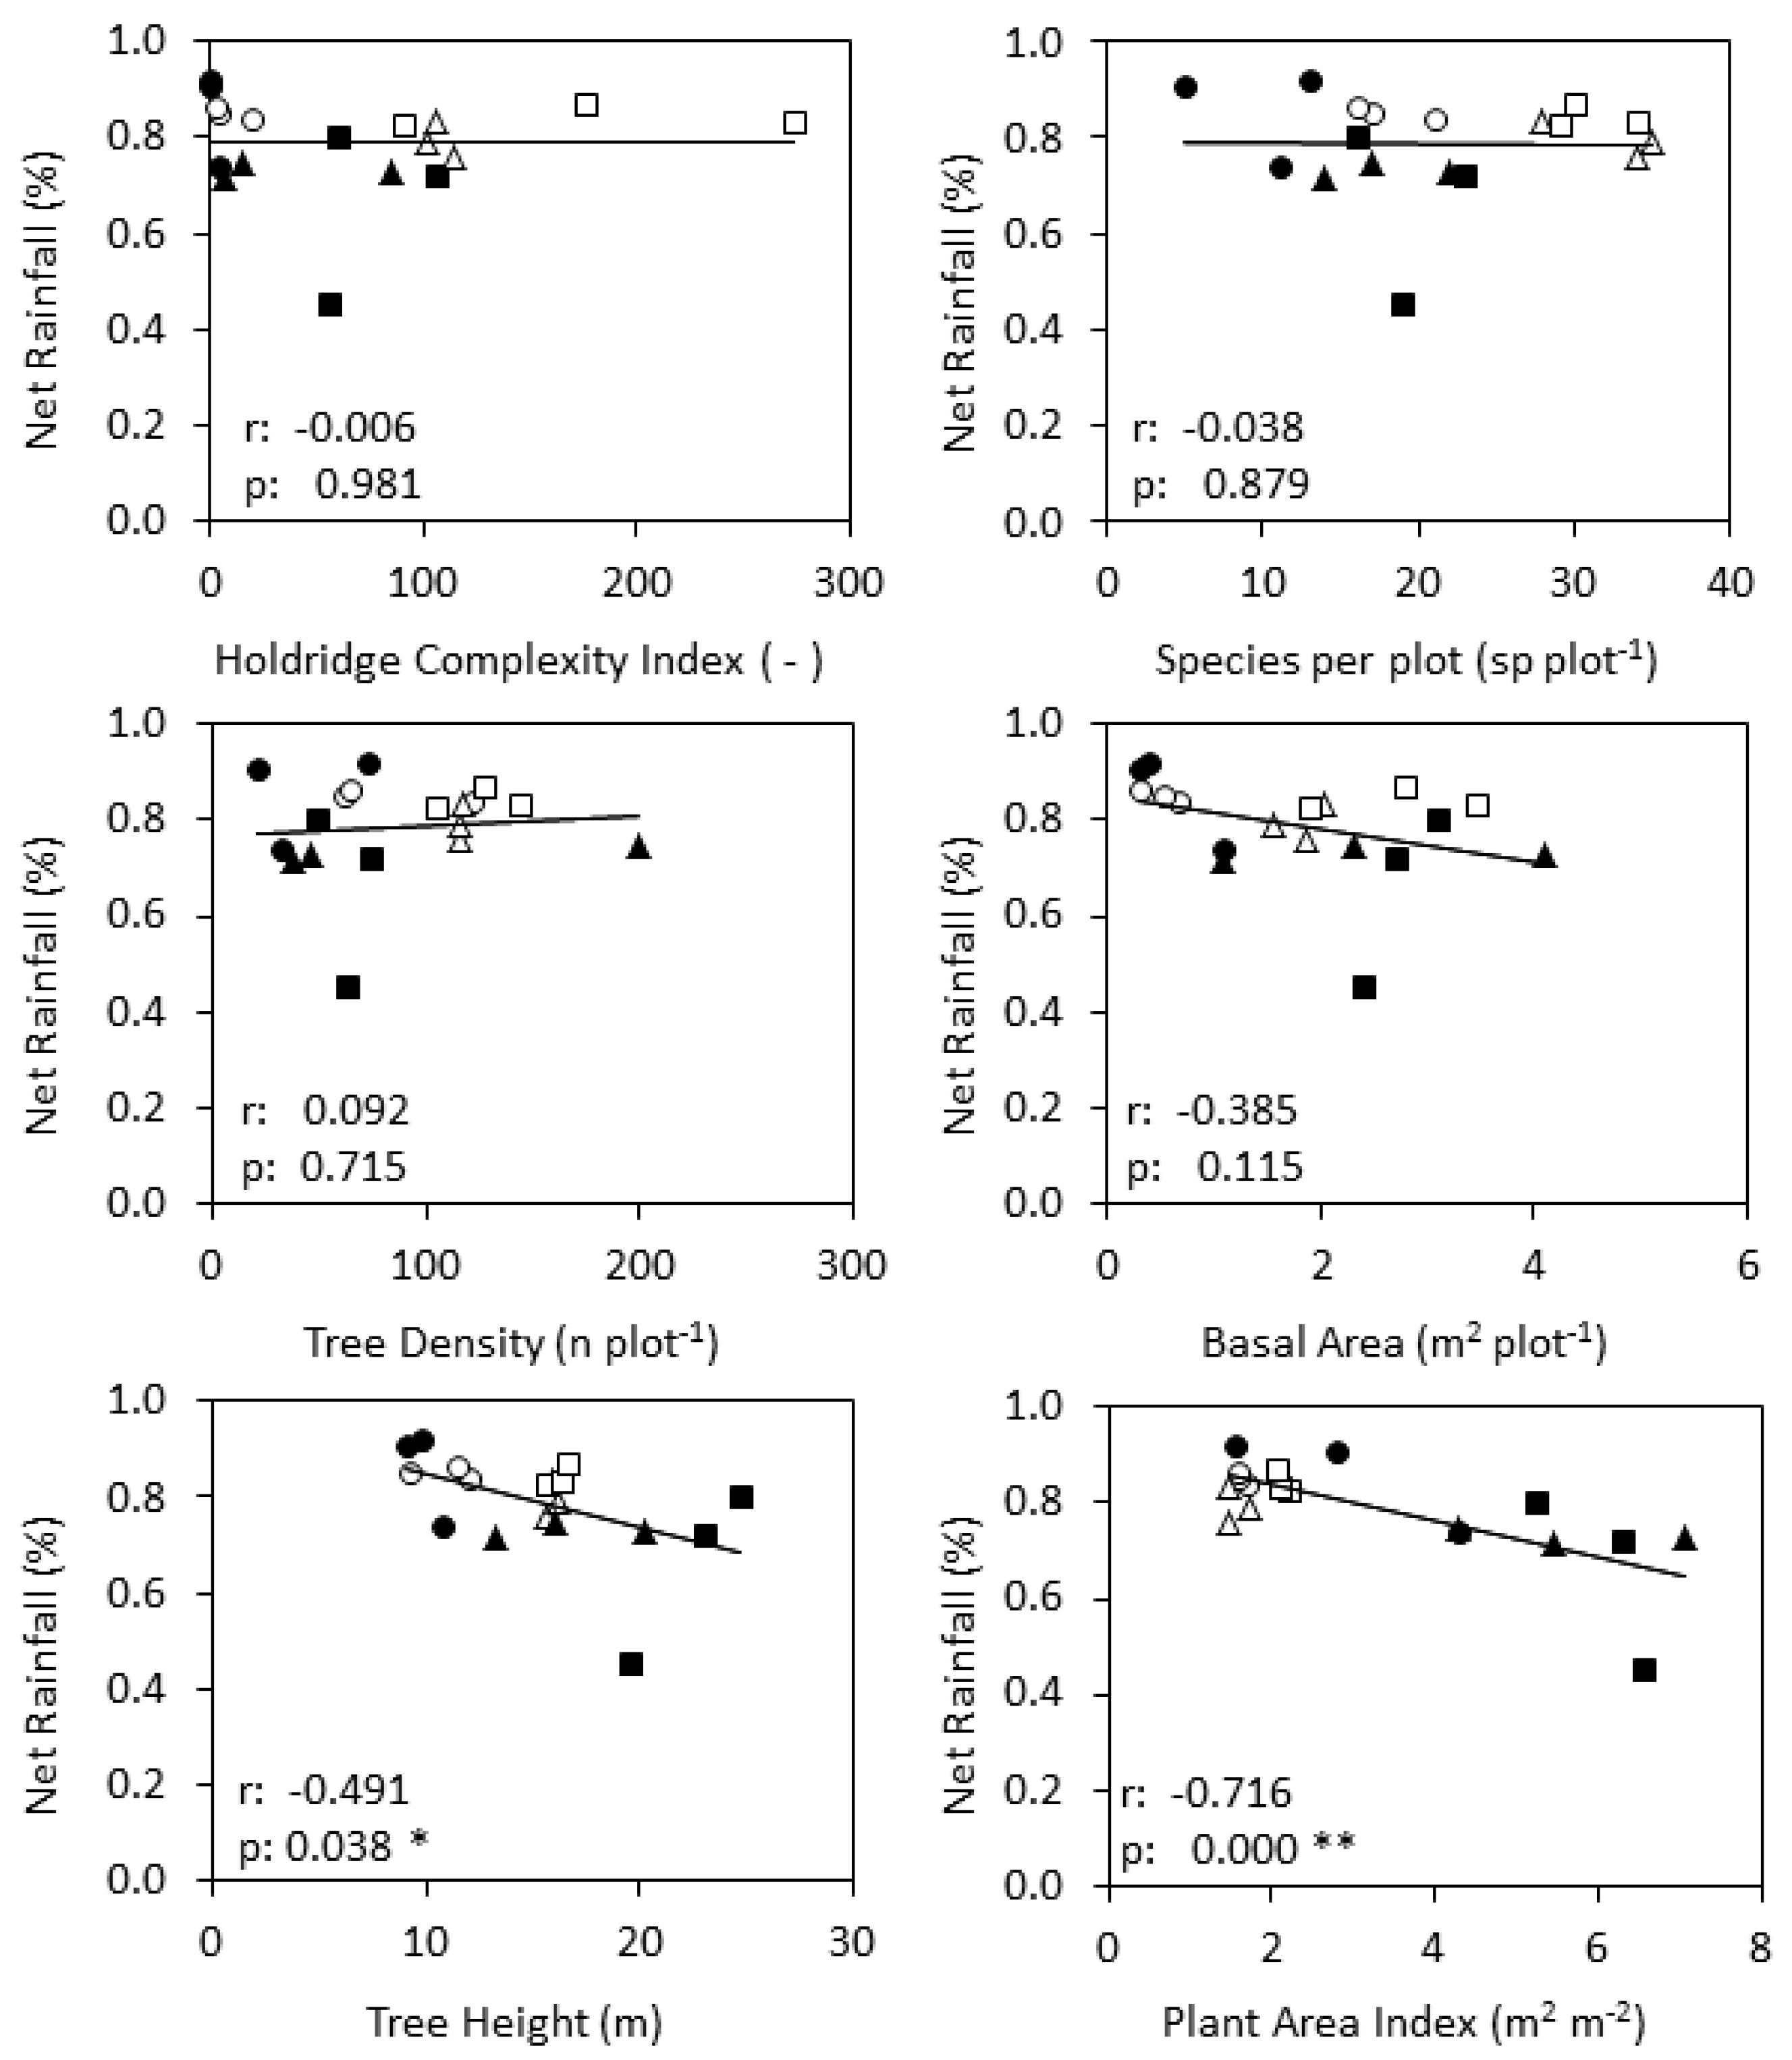
According to Table 4 net rainfall resulted in significant correlations at regional level only with the variables height (H, r = −0.491, p < 0.05) and plant area index (PAI, r = –0.717, p < 0.01). However, when analyzing Figure 3 and Table 4, it is clearly observed that the linear relationship for PAI is only valid for SRNP and not so for MSSP. In Figure 3 it can also be observed how the plot CR1L2 in SRNP has a determining effect on the correlations between net rainfall and height, so that if this plot is removed from Figure 3 the relationship is insignificant for both sites (Table 5). Hence the only valid correlation is found in SRNP with PAI (r = –0.755, p < 0.05), proving that more complex TDF structures in Costa Rica can retain more water than simpler forest stands. On the other hand, none of the structural variables in Brazil correlates significantly with net rainfall.
There are few studies in the literature that analyze the partitioning of rainfall by forest interception in TDF, and it is even more difficult to find information that considers the effect of successional stages. However, we found two relevant studies from Brazil, which were from the same state of Minas Gerais in Mata do Paraíso-Viçosa, with an annual average rainfall of 1500–2000 mm yr−1 (more similar than the Costa Rica site). Oliveira et al. [11] found that throughfall rates in early stages of 79.3% and in intermediate stages of 72.6%, and Lorenzon et al. [22] reported 84.39% and 73.04% for throughfall for the same region in early and intermediate successional stages. These findings differ slightly from our site in MSSP with 85.2% and 79.2% for intermediate stage (Table 2).
Oliveira et al. [11] found stemflow rates of 0.44% and 1.52% for the early and intermediate stages, whereas Lorenzon et al. [22] found 0.68% and 1.8%, respectively. These results differ strongly from our stemflow values for MSSP of 0.2% (early) and 0.1% (intermediate and late). According to a review by Cavelier and Vargas [8], stemflow rates ranged from 0.3% to 1.8% in 15 studies conducted in Brazil and Colombia in dry to moist tropical forests (1500 mm yr−1 to 3140 mm yr−1). Hence, our estimates for stemflow for SRNP were within the reported range of estimates in the literature, but not for MSSP; this was probably due to the effect of high density of lianas in the intermediate and late stages and because MSSP is far drier (840 mm yr−1) than any other reported study site.
This study used 20 funnel-type gauges, which provided acceptable precision for measuring throughfall. If the sample size is increased in search of higher precision, then researchers must consider the time required for one person to measure the entire trial from dawn to 8:00 am. For both MSSP and SRNP, the time available to measure the trial was rather tight for one person.
For the applied sampling design in this study, we concluded that the number of sampled trees to evaluate stemflow must be greater in future studies and, to the extent possible, tree sampling must consider the effect of tree bark types of the most dominant species. Several studies had pointed out that specific stand characteristic such as tree morphology influence the interception capacity [24].
A practical objective of this study was to generate linear regression equations to estimate water fluxes such as throughfall, stemflow, interception, and net rainfall. These equations are required to complement studies of nutrient dynamics in forest ecosystems, to study the impact of climate change, and to determine the influence of changes in forest cover in the hydrological cycle at the landscape and ecosystem levels, among other applications. Given the lack of equations to estimate net rainfall in almost all countries, we developed two generalized equations for the early and intermediate stages. These equations must be applied with caution in other sites, and they should be based on the similarity in forest structure and climate characteristics. Because it was not possible to develop a generalized equation for the late stage, it is recommended to select one of the two equations, SRNP or MSSP, that best corresponds to the biophysical characteristics of the site of interest.
Finally, this study makes an important contribution to understanding the impact of successional stages of TDF on the hydrology of the landscape, especially considering the alteration of rainfall and temperature regimes due to climate change. This study provides robust data to encourage the use of hydrological models to simulate the effects of changes in forest cover and climate change in the hydrology of the landscape.

Author Contributions

Project administration, J.C.A.; conceptualization, J.C.A. and M.E.S.; methodology, J.C.A., C.J.R., A.C.O. and T.G.S.; formal analysis, C.J.R., J.C.A. and T.G.S.; data curation, C.J.R., A.C.O. and T.G.S.; writing—original draft preparation, C.J.R. and J.C.A.; writing—review and editing, J.C.A. and C.J.R.; funding acquisition, J.C.A., M.E.S. and C.J.R.

Funding

This research was funded by Inter American Institute for Global Change Research (IAI) CRN3025 that is supported by the US National Science Foundation, grant number GrantGEO-128040. We also received support from the Research Office of the Technological Institute of Costa Rica, University of Alberta, Guanacaste Conservation Area, and PINN-MICITT (contract: PED-032-2015-1).

Acknowledgments

We thank the staff from Santa Rosa National Park, Mata Seca State Park, Tecnológico de Costa Rica and Universidade Estadual de Montes Claros for their administrative and logistic support.

Conflicts of Interest

The authors declare no conflict of interest.

References

  1. Holdridge, L.R.; Tosi, J.A. Life Zone Ecology; Tropical Science Center: San Jose, Costa Rica, 1967. [Google Scholar]
  2. Calvo-Alvarado, J.; Sánchez-Azofeifa, A.; Portillo-Quintero, C. Neotropical Seasonally Dry Forests. In Encyclopedia of Biodiversity, 2nd ed.; Levin, S., Ed.; Academic Press: New York, NY, USA, 2013; pp. 488–500. [Google Scholar] [CrossRef]
  3. Portillo-Quintero, C.; Sánchez-Azofeifa, G. Extent and conservation of tropical dry forests in the Americas. Biol. Conserv. 2010, 143, 144–155. [Google Scholar] [CrossRef]
  4. Portillo-Quintero, C.; Sánchez-Azofeifa, A.; Calvo-Alvarado, J.; Quesada, M.; Espírito-Santo, M.M. The role of tropical dry forests for biodiversity, carbon and water conservation in the neotropics: Lessons learned and opportunities for its sustainable management. Reg. Environ. Chang. 2015, 15, 1039–1049. [Google Scholar] [CrossRef]
  5. Guswa, A.J. Canopy vs. Roots: Production and Destruction of Variability in Soil Moisture and Hydrologic Fluxes. Vadose Zone J. 2012, 11. [Google Scholar] [CrossRef] [Green Version]
  6. Pypker, T.; Levia, D.; Staelens, J.; Van Stan, J. Canopy structure in relation to hydrological and biogeochemical fluxes. In Forest Hydrology and Biogeochemistry. Ecological Studies (Analysis and Synthesis); Levia, D.F., Carlyle-Moses, D., Tanaka, T., Eds.; Springer: Dordrecht, The Netherlands, 2011; pp. 371–388. [Google Scholar] [CrossRef]
  7. Bruijnzeel, L.A. Hydrological functions of tropical forests: Not seeing the soil for the trees? Agric. Ecosyst. Environ. 2004, 104, 185–228. [Google Scholar] [CrossRef]
  8. Cavelier, J.; Vargas, G. Procesos hidrológicos. In Ecología y Conservación de Bosques Neotropicales; Guariguata, M.R., Kattan, G.H., Eds.; Libro Universitario Regional (LUR): Cartago, Costa Rica, 2002; pp. 145–165. [Google Scholar]
  9. Gerrits, A. The Role of Interception in the Hydrological Cycle. Doctoral Thesis, Delft University of Technology, TU-Delf, The Netherlands, 2010. [Google Scholar]
  10. Crockford, R.; Richardson, D. Partitioning of rainfall into throughfall, stemflow and interception: Effect of forest type, ground cover and climate. Hydrol. Process. 2000, 14, 2903–2920. [Google Scholar] [CrossRef]
  11. Oliveira-Freitas, J.P.; Teixeira-Dias, C.; Silva, E.; Tonello, K.C. Net precipitation in a semideciduous forest fragment in Vicosa city, MG. Rev. Árvore 2016, 40, 793–801. [Google Scholar] [CrossRef]
  12. Jiménez-Rodríguez, C.; Calvo-Alvarado, J.C. An Evaluation of Chapter 14: Rainfall Interception in Secondary Tropical Dry Forests. In Tropical Dry Forests in the Americas: Ecology, Conservation and Management; Sanchez-Azofeifa, A., Powers, J.S., Fernandes, G.W., Quesada, M., Eds.; CRC Press: Boca Raton, FL, USA, 2013; pp. 249–265. [Google Scholar]
  13. Zimmermann, B.; Zimmermann, A.; Scheckenbach, H.; Schmid, T.; Hall, J.; van Breugel, M. Changes in rainfall interception along a secondary forest succession gradient in lowland Panama. Hydrol. Earth Syst. Sci. 2013, 17, 4659–4670. [Google Scholar] [CrossRef]
  14. Calvo-Rodríguez, S.; Calvo-Alvarado, J.; Do Espírito-Santo, M.M.; Nunes, Y.R. Changes in forest structure and composition in a successional dry forest of Brazil. Rev. For. Mesoam. Kurú 2017, 14, 12–23. [Google Scholar] [CrossRef]
  15. Álvarez, M.; Cançado Anaya, F.; Ávila-Cabadilla, L.D.; Berbara, R.; Calvo-Alvarado, J.C.; Castillo Álvarez, A.; Quesada, M.; Rivard, B.; Sanza, V.; Stoner, K.; et al. Manual of Methods. Human, Ecological and Biophysical Dimensions of Tropical Dry Forests; Nassar, J.M., Rodríguez, J.P., Sánchez-Azofeifa, A., Garvin, T., Quesada, M., Eds.; Instituto Venezolano de Investigaciones Científicas (IVIC): Caracas, Venezuela, 2008.
  16. Kalacska, M.; Sanchez-Azofeifa, A.; Calvo-Alvarado, J.C.; Quesada, M.; Rivard, B.; Janzen, D. Species composition, similarity and diversity in three successional stages of a seasonally dry tropical forest. For. Ecol. Manag. 2004, 200, 227–247. [Google Scholar] [CrossRef]
  17. Madeira, B.G.; Espírito-Santo, M.M.; D’Ângelo Neto, S.; Nunes, Y.R.; Sánchez-Azofeifa, G.A. Changes in tree and liana communities along a successional gradient in a tropical dry forest in south-eastern Brazil. Plant Ecol. 2009, 201, 291–304. [Google Scholar] [CrossRef]
  18. Lloyd, C.R.; Marques ó, A. Spatial variability of throughfall and stemflow measurements in Amazonian rainforest. Agric. For. Meteorol. 1988, 42, 63–73. [Google Scholar] [CrossRef]
  19. Gerrits, A.; Savenije, H.; Veling, E.; Pfister, L. Analytical derivation of the Budyko curve based on rainfall characteristics and a simple evaporation model. Water Resour. Res. 2009, 45. [Google Scholar] [CrossRef] [Green Version]
  20. Frazer, G.; Canham, C.; Lertzman, K. Gap Light Analyzer (GLA), Version 2.0: Imaging Software to Extract Canopy Structure and Gap Light Transmission Indices from True-Colour Fisheye Photographs, Users Manual and Program Documentation; Simon Fraser University: Burnaby, BC, Canada; Institute of Ecosystem Studies: Millbrook, NY, USA, 1999. [Google Scholar]
  21. Paternoster, R.; Brame, R.; Mazerolle, P.; Piquero, A. Using the Correct Statistical Test for Equality of Regression Coefficients. Criminology 1998, 36, 859–866. [Google Scholar] [CrossRef]
  22. Lorenzon, A.S.; Dias, H.T.; Leite, H. Precipitação efetiva e interceptação da chuva em um fragmento florestal com diferentes estágios de regeneração. Rev. Árvore 2013, 37, 619–627. [Google Scholar] [CrossRef] [Green Version]
  23. Carlyle-Moses, D.E.; Gash, J.H. Rainfall Interception Loss by Forest Canopies. In Forest Hydrology and Biogeochemistry; Ecological Studies (Analysis and Synthesis); Levia, D., Carlyle-Moses, D., Tanaka, T., Eds.; Springer: Dordrecht, The Netherlands, 2011; Volume 216, pp. 407–423. [Google Scholar]
  24. Spencer, S.; van Meerveld, H. Double funnelling in a mature coastal British Columbia forest: Spatial patterns of stemflow after infiltration. Hydrol. Process. 2016, 30, 4185–4201. [Google Scholar] [CrossRef]
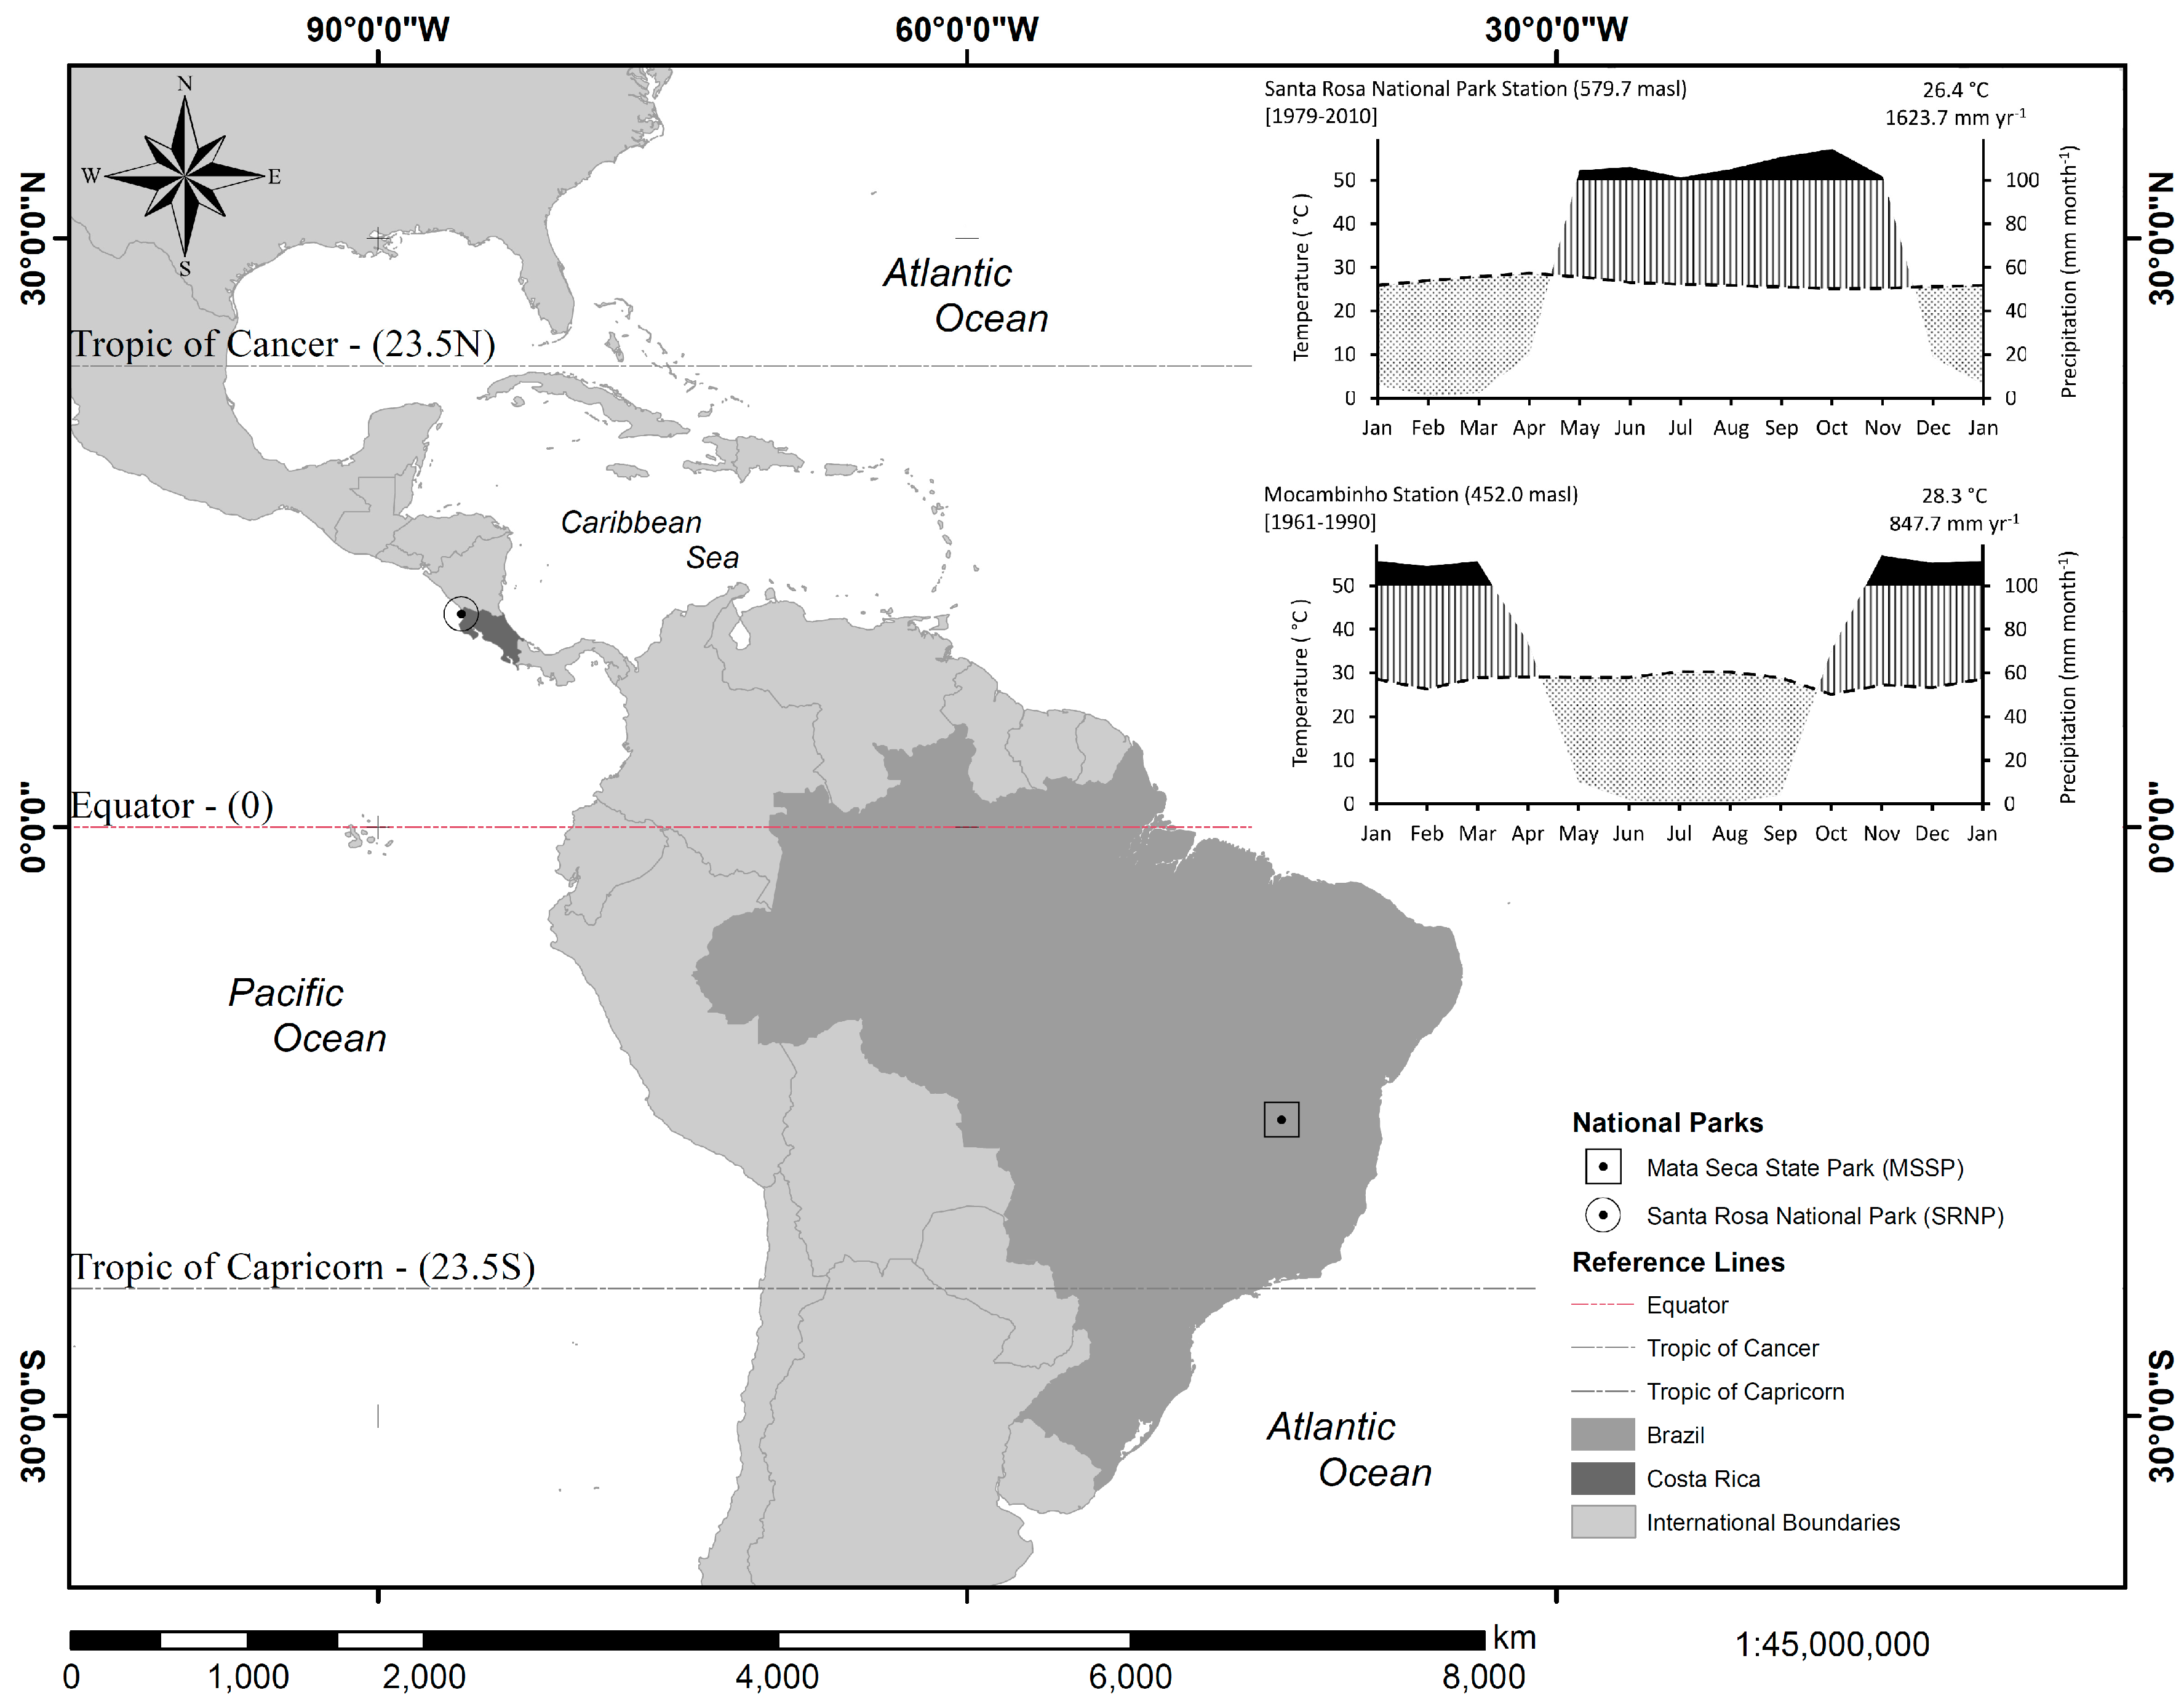
Figure 1. Geographical location of the study sites and the climate diagram of the nearest meteorological station in Costa Rica and Brazil. The solid black area, the vertical line, and the dotted areas in the climate diagrams represent the wettest months, water excess, and water deficits, respectively; the dotted line represents the mean monthly temperature.
Geosciences 08 00486 g001
Figure 2. Daily fluxes of throughfall and stemflow fluxes with respect to rainfall among successional stages of tropical dry forest in Costa Rica and Brazil.
Geosciences 08 00486 g002
Figure 3. Net rainfall distribution in respect to forest structural parameters of the three successional stages (early: circles, intermediate: triangles, and late: squares) from Costa Rica (solid symbols) and Brazil (hollow symbols). Tendency solid lines include the 18 plots, while dashed tendency lines exclude the plot CR1L2 according with the document. The p-values (p) are significant at p < 0.05 (*) and p < 0.01 (**).
Geosciences 08 00486 g003
Table 1. List of the tree species selected for stemflow measurements per successional stage in both countries.
StageBrazilCosta Rica
EarlyMyracrodruon urundeuvaCochlospermum vitifolium
Senegalia polyphyllaGenipa americana
Gliricidia sepium
Luehea candida
Machaerium biovulatum
Quercus oleoides
Rehdera trinervis
IntermediateCnidoscolus pubescensAstronium graveolens
Cochlospermum vitifoliumAteleia hebert-smithii
Handroanthus reticulatusBursera simarouba
Cochlospermum vitifolium
Cordia panamensis
Lonchocarpus minimiflorus
Spondias mombin
Trophis racemosa
LateCasearia selloanaChrysophyllum brenesii
Combretum duarteanumExostema mexicanum
Handroanthus chrysotrichusGuettarda macrosperma
Pseudopiptadenia contortaLysiloma divaricatum
Sapranthus palanga
Semialarium mexicanum
Table 2. Gross rainfall (mm) and fluxes (% and mm) recorded among successional stages of tropical dry forest in Brazil and Costa Rica.
FluxesBrazilCosta Rica
EarlyIntermediateLateEarlyIntermediateLate
Rainfall248.2218.8219.5330.1400.9376.2
Throughfall211.4 (85.2%)173.4 (79.2%)185.1 (84.3%)288.2 (87.3%)291.4 (72.7%)237.6 (63.2%)
Stemflow0.5 (0.2%)0.2 (0.1%)0.3 (0.1%)0.6 (0.2%)1.1 (0.3%)1.0 (0.3%)
Net Rainfall211.9 (85.4%)173.6 (79.3%)185.4 (84.4%)288.8 (87.5%)292.5 (73.0%)238.6 (63.4%)
Interception36.3 (14.6%)45.2 (20.7%)34.2 (15.6%)41.3 (12.5%)108.4 (27.0%)137.6 (36.6%)
Note: values between brackets represent the percentage of the flux in rainfall.
Table 3. Summary of the linear regression analyses of forest interception water fluxes in three successional stages of tropical dry forests in Costa Rica and Brazil.
FluxesForest StageCountrynRegression ParametersRegression Coefficients
R2FPSEαβ
ThroughfallEarlyCosta Rica890.9925512.90.0001.564−0.285 0.899***
Brazil340.9974733.10.0001.186−0.131 0.858***
IntermediateCosta Rica890.9802133.40.0002.264−0.670**0.776***
Brazil360.9831002.50.0001.9440.903 0.743***
LateCosta Rica780.940574.20.0003.2290.938*0.567***
Brazil360.982898.70.0001.9470.750 0.802***
StemflowEarlyCosta Rica890.888322.70.0000.022−0.012***0.003***
Brazil340.76246.80.0000.0270.001 0.002***
IntermediateCosta Rica890.75939.60.0000.0520.005 0.002***
Brazil360.76442.10.0000.013−0.002 0.001***
LateCosta Rica780.56535.60.0000.064−0.002 0.003***
Brazil360.70831.70.0000.0160.004 0.001***
Net RainfallEarlyCosta Rica890.9925537.10.0001.565−0.298 0.902***
Brazil340.9974701.80.0001.193−0.129 0.860***
IntermediateCosta Rica890.9802160.10.0002.257−0.665*0.779***
Brazil360.9831002.10.0001.9480.901 0.744***
LateCosta Rica780.939566.70.0003.2670.936*0.570***
Brazil360.981892.80.0001.9570.754 0.803***
InterceptionEarlyCosta Rica890.65665.80.0001.5650.298 0.098***
Brazil340.893125.40.0001.1930.129 0.140***
IntermediateCosta Rica890.817174.30.0002.2570.665*0.221***
Brazil360.882118.70.0001.948−0.901 0.256***
LateCosta Rica780.90071.00.0003.267−0.936*0.430***
Brazil360.78253.60.0001.957−0.754 0.197***
Generalized equations
Net RainfallEarly1230.9889706.20.000 1.513−0.220 0.881***
Intermediate1250.9623129.70.000 2.212−0.323 0.774***
Note: n= sample size, * is statistically significant (p < 0.10), ** is statistically significant (p < 0.05), *** is statistically significant (p < 0.001), SE = standard error.
Table 4. Summary of the main structural parameters measured in different forest stages of dry forests in Costa Rica and Brazil.
StageCountryPlotHeight (m)Tree Density (trees plot−1)Species (sp plot−1)Basal Area (m2 plot−1)Holdridge Complexity IndexPlant Area Index (m2 m−2)
EarlyBrazilCC311.9121210.720.01.7
CC49.261170.54.91.6
CC511.464160.33.61.6
Average10.882180.59.51.6
Costa RicaCR1E19.02150.30.32.8
CR1E29.872130.43.71.5
CR1E310.832111.14.44.3
Average9.941.79.70.62.72.9
Early Average10.461.813.80.56.12.2
IntermediateBrazilIC115.6116341.9114.81.5
IC216.2116351.6102.11.7
IC715.9117282.0106.11.5
Average15.9116.332.31.8107.71.5
Costa RicaCR1I120.346224.184.27.1
CR1I416.0199172.3125.64.3
CR1I513.338141.17.85.5
Average16.594.317.72.572.55.6
Intermediate Averge16.2105.3252.290.13.6
LateBrazilMC515.6105291.990.72.2
MC616.3143343.5273.92.1
MC716.6127302.8176.02.0
Average16.2125312.7180.22.1
Costa RicaCR1L123.074232.7105.76.3
CR1L219.563192.456.06.6
CR1L324.749163.160.05.2
Average22.46219.32.773.96.0
Late Average19.393.525.22.7127.14.1
Table 5. Pearson correlation matrix among rainfall interception and structural variables in tropical dry forests (TDFs) in Costa Rica and Brazil.
Regional [Costa Rica + Brazil]
Regional Costa Rica + BrazilTree HeightTree DensitySpeciesBasal AreaHCIPAIRainfall Interception
Tree Height1.000
Tree Density0.1281.000
Species0.3830.619 **1.000
Basal Area0.847 **0.2710.494 *1.000
HCI0.4560.4620.812 **0.694 **1.000
PAI0.608 **−0.373−0.3070.518 *−0.1131.000
Rainfall Interception0.491 *0.0920.0380.3850.0060.717 **1.000
Only Costa Rica
Tree Height1.000
Tree Density0.1371.000
Species0.808 **0.3211.000
Basal Area0.886 **0.1990.835 **1.000
HCI0.888 **−0.0210.851 **0.841 **1.000
PAI0.767 *−0.0550.766 *0.820 **0.783 *1.000
Rainfall Interception0.4630.0850.5590.4560.4230.755 *1.000
Only Brazil
Tree Height1.000
Tree Density0.809 **1.000
Species0.918 **0.800 **1.000
Basal Area0.843 **0.806 **0.801 **1.000
HCI0.790 *0.797 *0.787 *0.977 **1.000
PAI0.4300.4280.3450.5870.5631.000
Rainfall Interception0.4090.3410.6620.1740.1860.2731.000
Note: * p < 0.05, ** p < 0.01.