1. Introduction
The quarrying industry produces a large amount of waste material mainly due to natural rock discontinuities characterized by different geologic forms, classes, and sizes [
1,
2]. Generally speaking, considering the worldwide average of ornamental stone excavation, only one third of the exploited raw material reaches the global market as a finished product, while the remaining two thirds are waste [
3]. From a commercial viewpoint, ornamental stones are considered a main economic resource for many countries worldwide [
4]. Therefore, since ornamental stones are natural non-renewable resources, they need to be quarried sustainably in order to reduce their environmental and economic impact. This can be carried out through a 3D detection and deterministic modeling of the fractures present in the rock mass, followed by optimized production planning aiming to optimize the coefficient of utilization [
5,
6]. The robustness of the production optimization strongly depends on the accuracy of 3D fracture modeling, which should be deterministic for this kind of application.
The Ground Penetrating Radar (GPR) is widely used and trusted for the detection of fractures in rock masses. Several studies dealing with GPR detection and characterization of fractures are present in the literature, addressing limestone [
7,
8], marble [
9,
10,
11], gneiss [
12], sandstone [
13,
14,
15], and granite quarries [
16,
17]. In addition, a number of publications have taken into consideration the use of GPR to detect and model fractures in quarried stone blocks [
7,
9,
18,
19,
20,
21]. The theoretical background for GPR can be found in [
22,
23,
24].
The most noticeable contributions on 3D deterministic modeling of fractures from a GPR survey in quarries have been given by [
25,
26,
27]. Recently, research presented by [
1] tried to improve the methods proposed by [
25,
26,
27] by mainly minimizing the uncertainty in modeling fractures deterministically as 3D surfaces based on a GPR survey. The modeling approach of [
1] was tested and validated on a small area of a bench in a sandstone quarry.
The objective of this paper is to investigate the applicability and workability of the fracture modeling approach presented in [
1] in a large area of a quarry bench with different types of rock (limestone) and geological characteristics (horizontal or semi-horizontal layers with two sets of fractures). Moreover, the large-scale implementation presented in this paper can help the geo-engineering community to assess the applicability of the fracture modeling approach in other geo-engineering fields, not only in quarrying.
2. Site Description
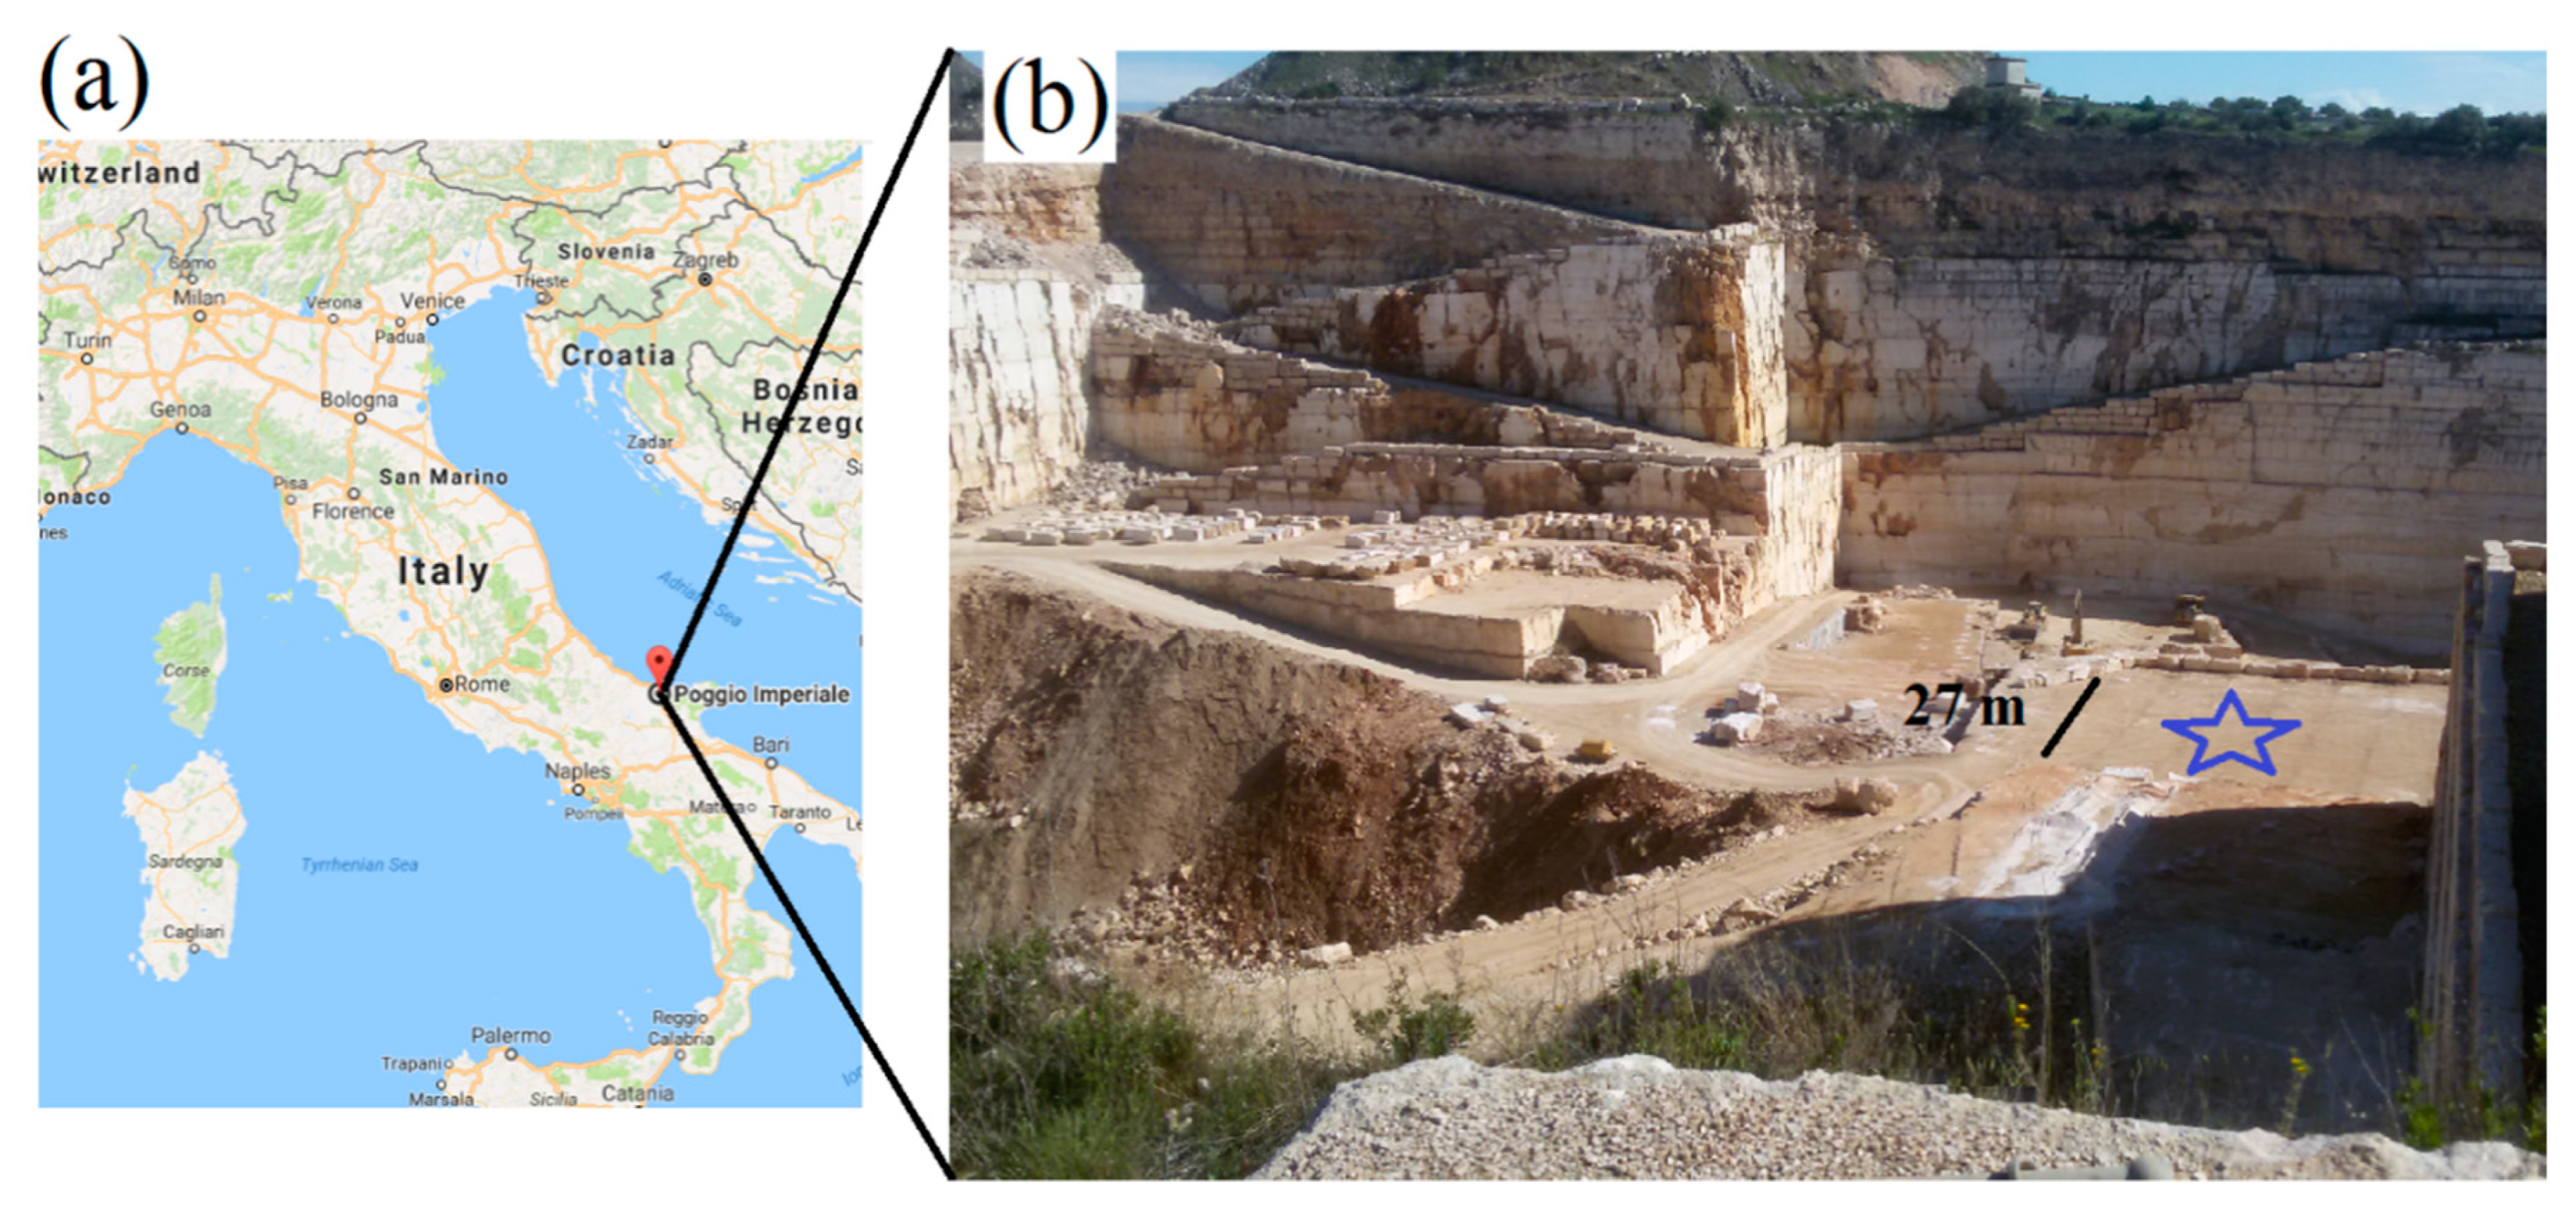
This study was carried out in a bench of a limestone quarry located in Poggio Imperiale, Foggia, Italy (
Figure 1). The quarried area belongs to the Apricena quarrying basin which includes the towns of Apricena, Poggio Imperiale, and Lesina. The Apricena quarrying basin is the largest mining area in the Italian Region of Apulia, covering over 24.1 km
2. The limestone deposit consists of a series of successions called “Fiorito Succession,” “Biancone Succession”, and “Serpeggiante Succession.” The limestone deposit in the bench object of this study is made up of fine and ultra-fine-grained beige-white micritic limestone belonging to the “Fiorito Succession” [
28]. In this quarry, various quarrying methods are used depending on the zones, ranging from the drilling and blasting method utilized in the bench under study, to the diamond wire cutting method.
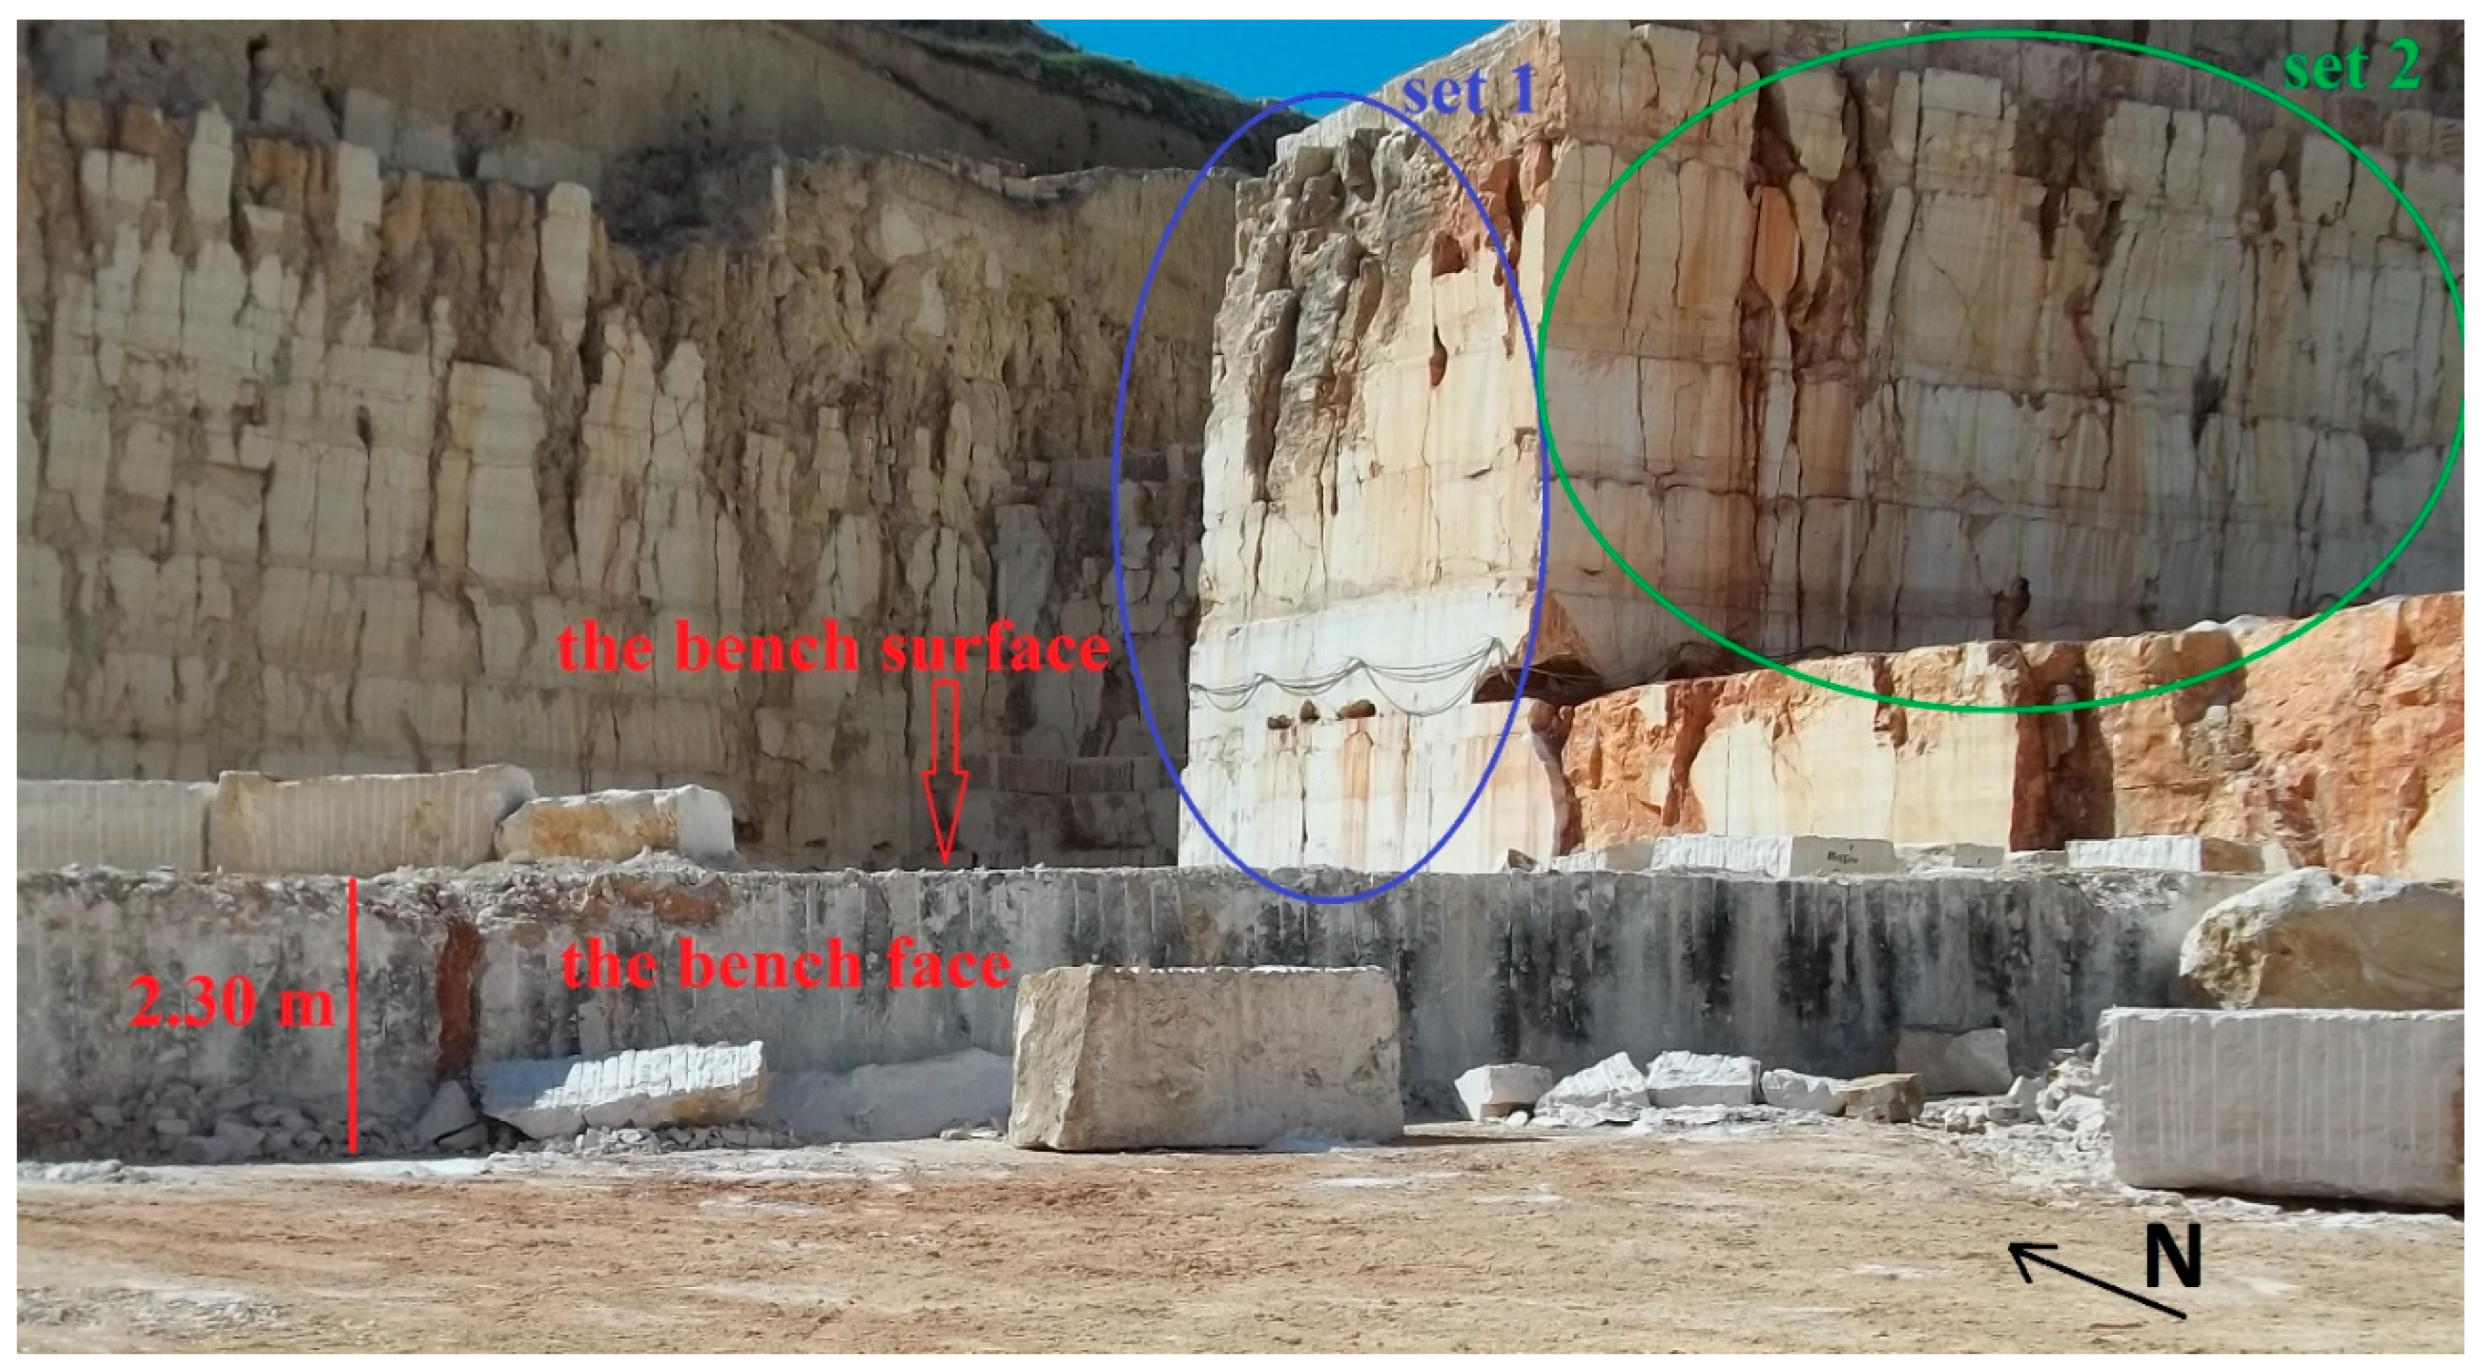
The rock mass of the bench was characterized by two sub-vertical sets of fractures, identified as Set 1 and Set 2 (
Figure 2). Set 1 refers to the fractures propagating parallel to the bench face under study (strike direction to North-West), whereas Set 2 refers to the fractures propagating perpendicularly to the bench face under study (strike direction to South-West). As evident in
Figure 2, the spacing of the fractures in Set 1 was larger than that in Set 2, allowing the quarried blocks in this bench to have a marketable size. The aperture size of the out-cropping fractures ranged from about 0.2 cm to 3.0 cm. The rock mass layering could not be observed visually on the bench face, whose height was 2.30 m, due to the chemical blasting effect (black and white stripes) on the appearance of the bench face (
Figure 2) and to the thin-aperture bedding planes between the layers, as shown in the side view of the bench (
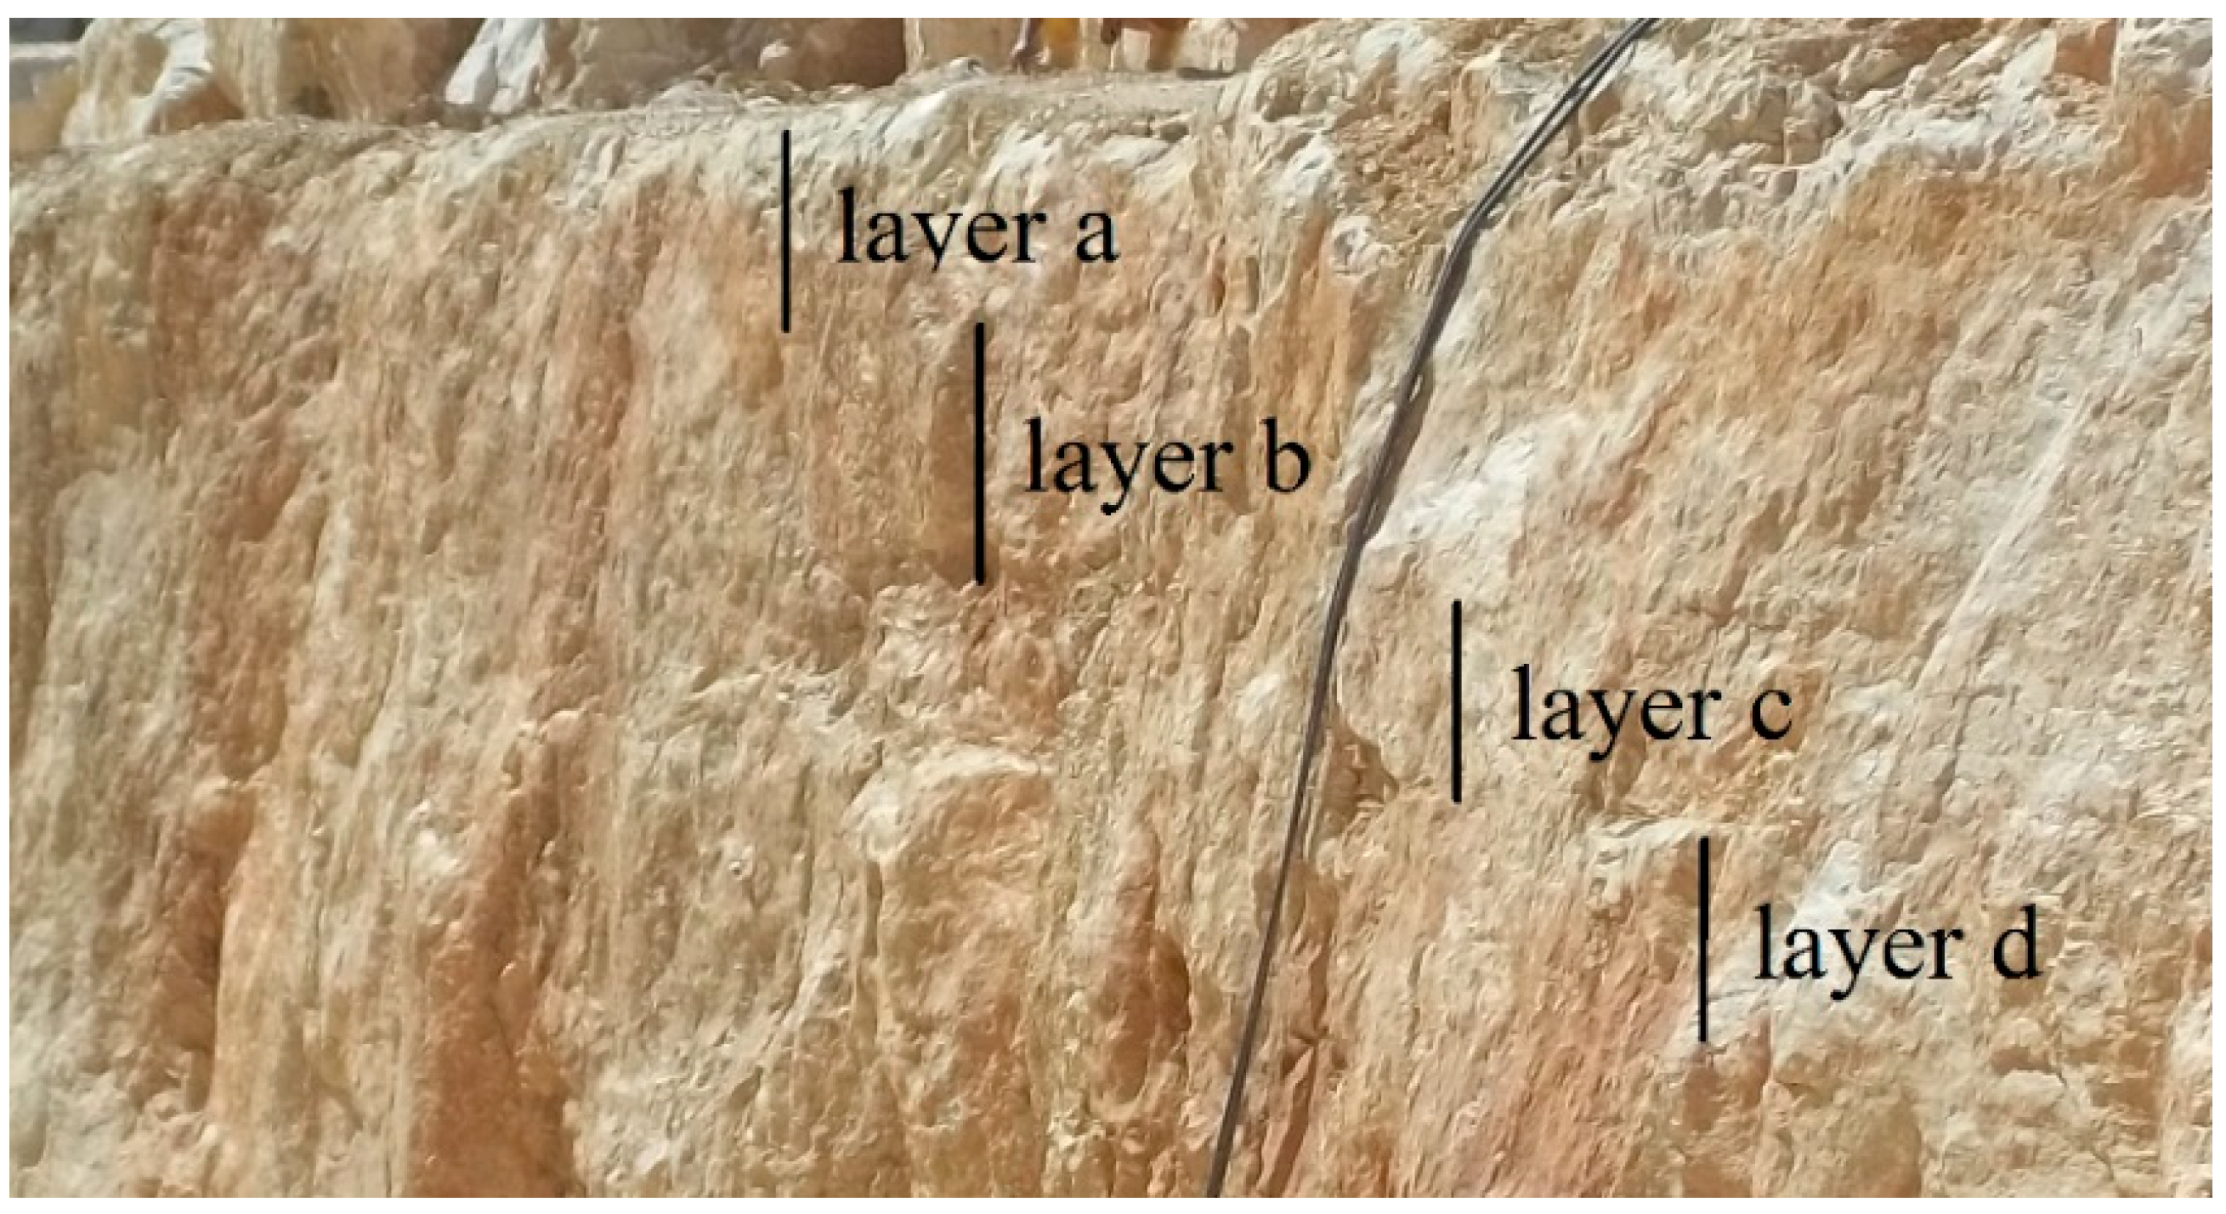
Figure 3). However, the layers in this quarry were clearly stratified parallel to the bench surface.
The bench surface was reasonably flat, and thus suitable for the GPR survey activities. The rock mass of the bench was slightly wet since the GPR survey was carried out 8 h after the end of 10-h of light rain. However, the surface of the bench was dry due to the sun drying the area after the rain. The surveying was carried out on a day characterized by a temperature of 14 °C and a relative humidity of 71%.
3. The GPR Survey Design
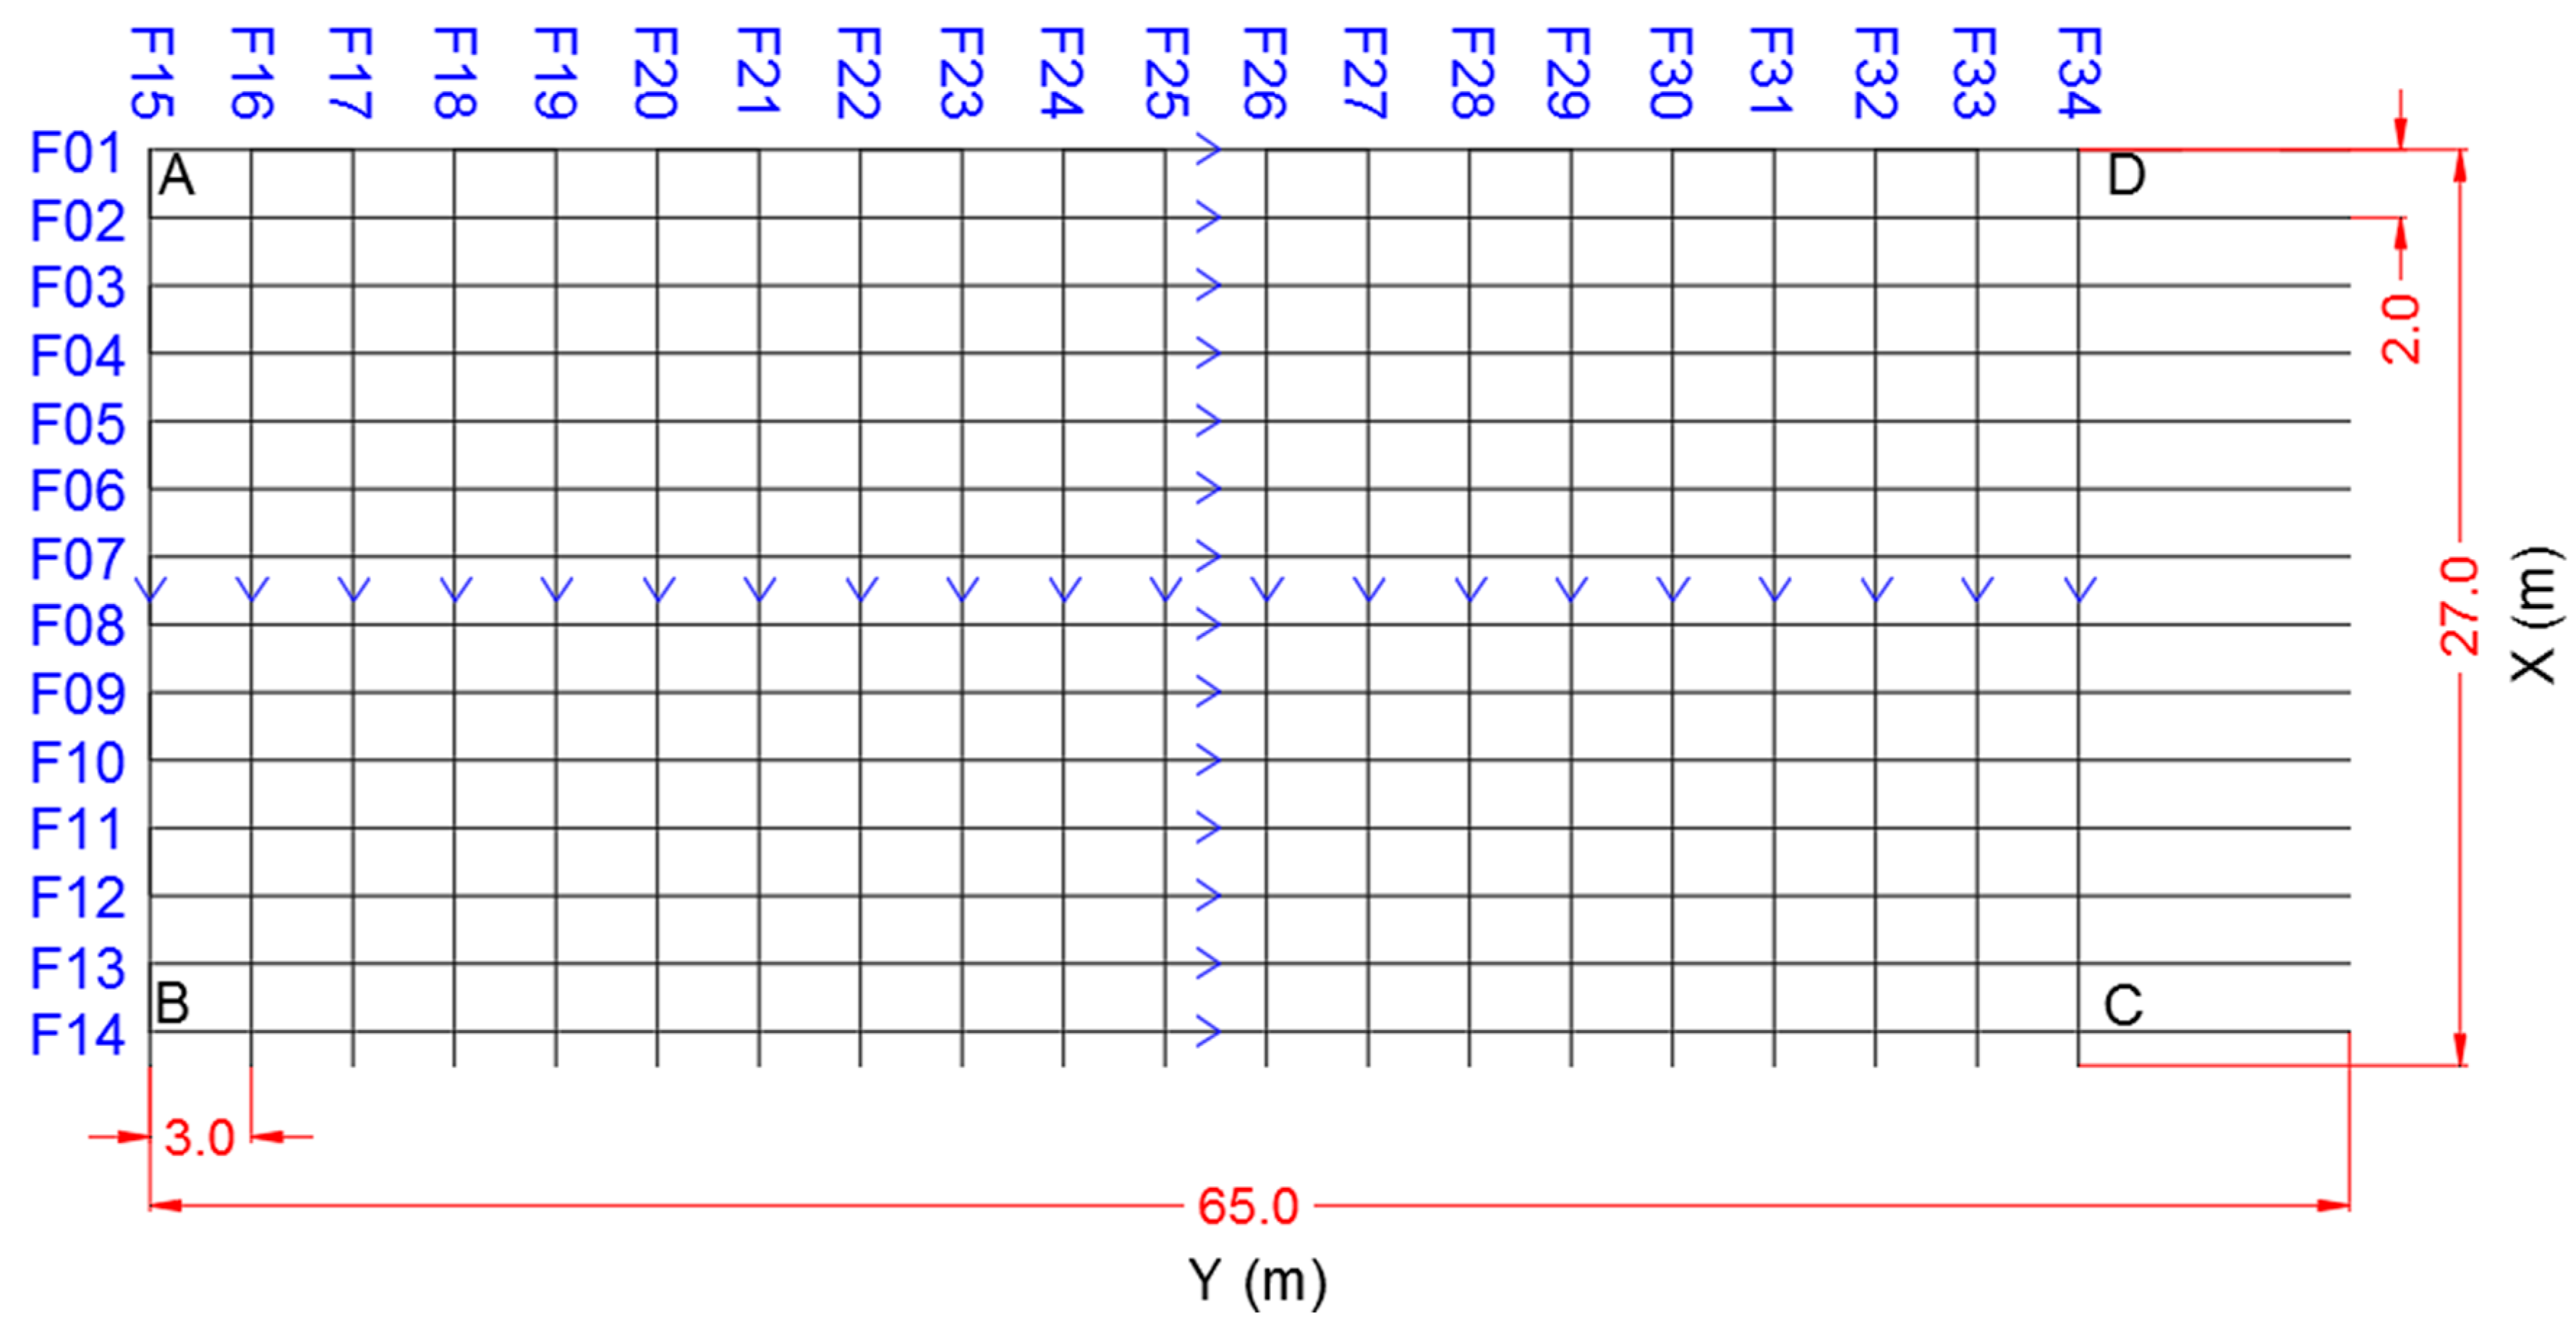
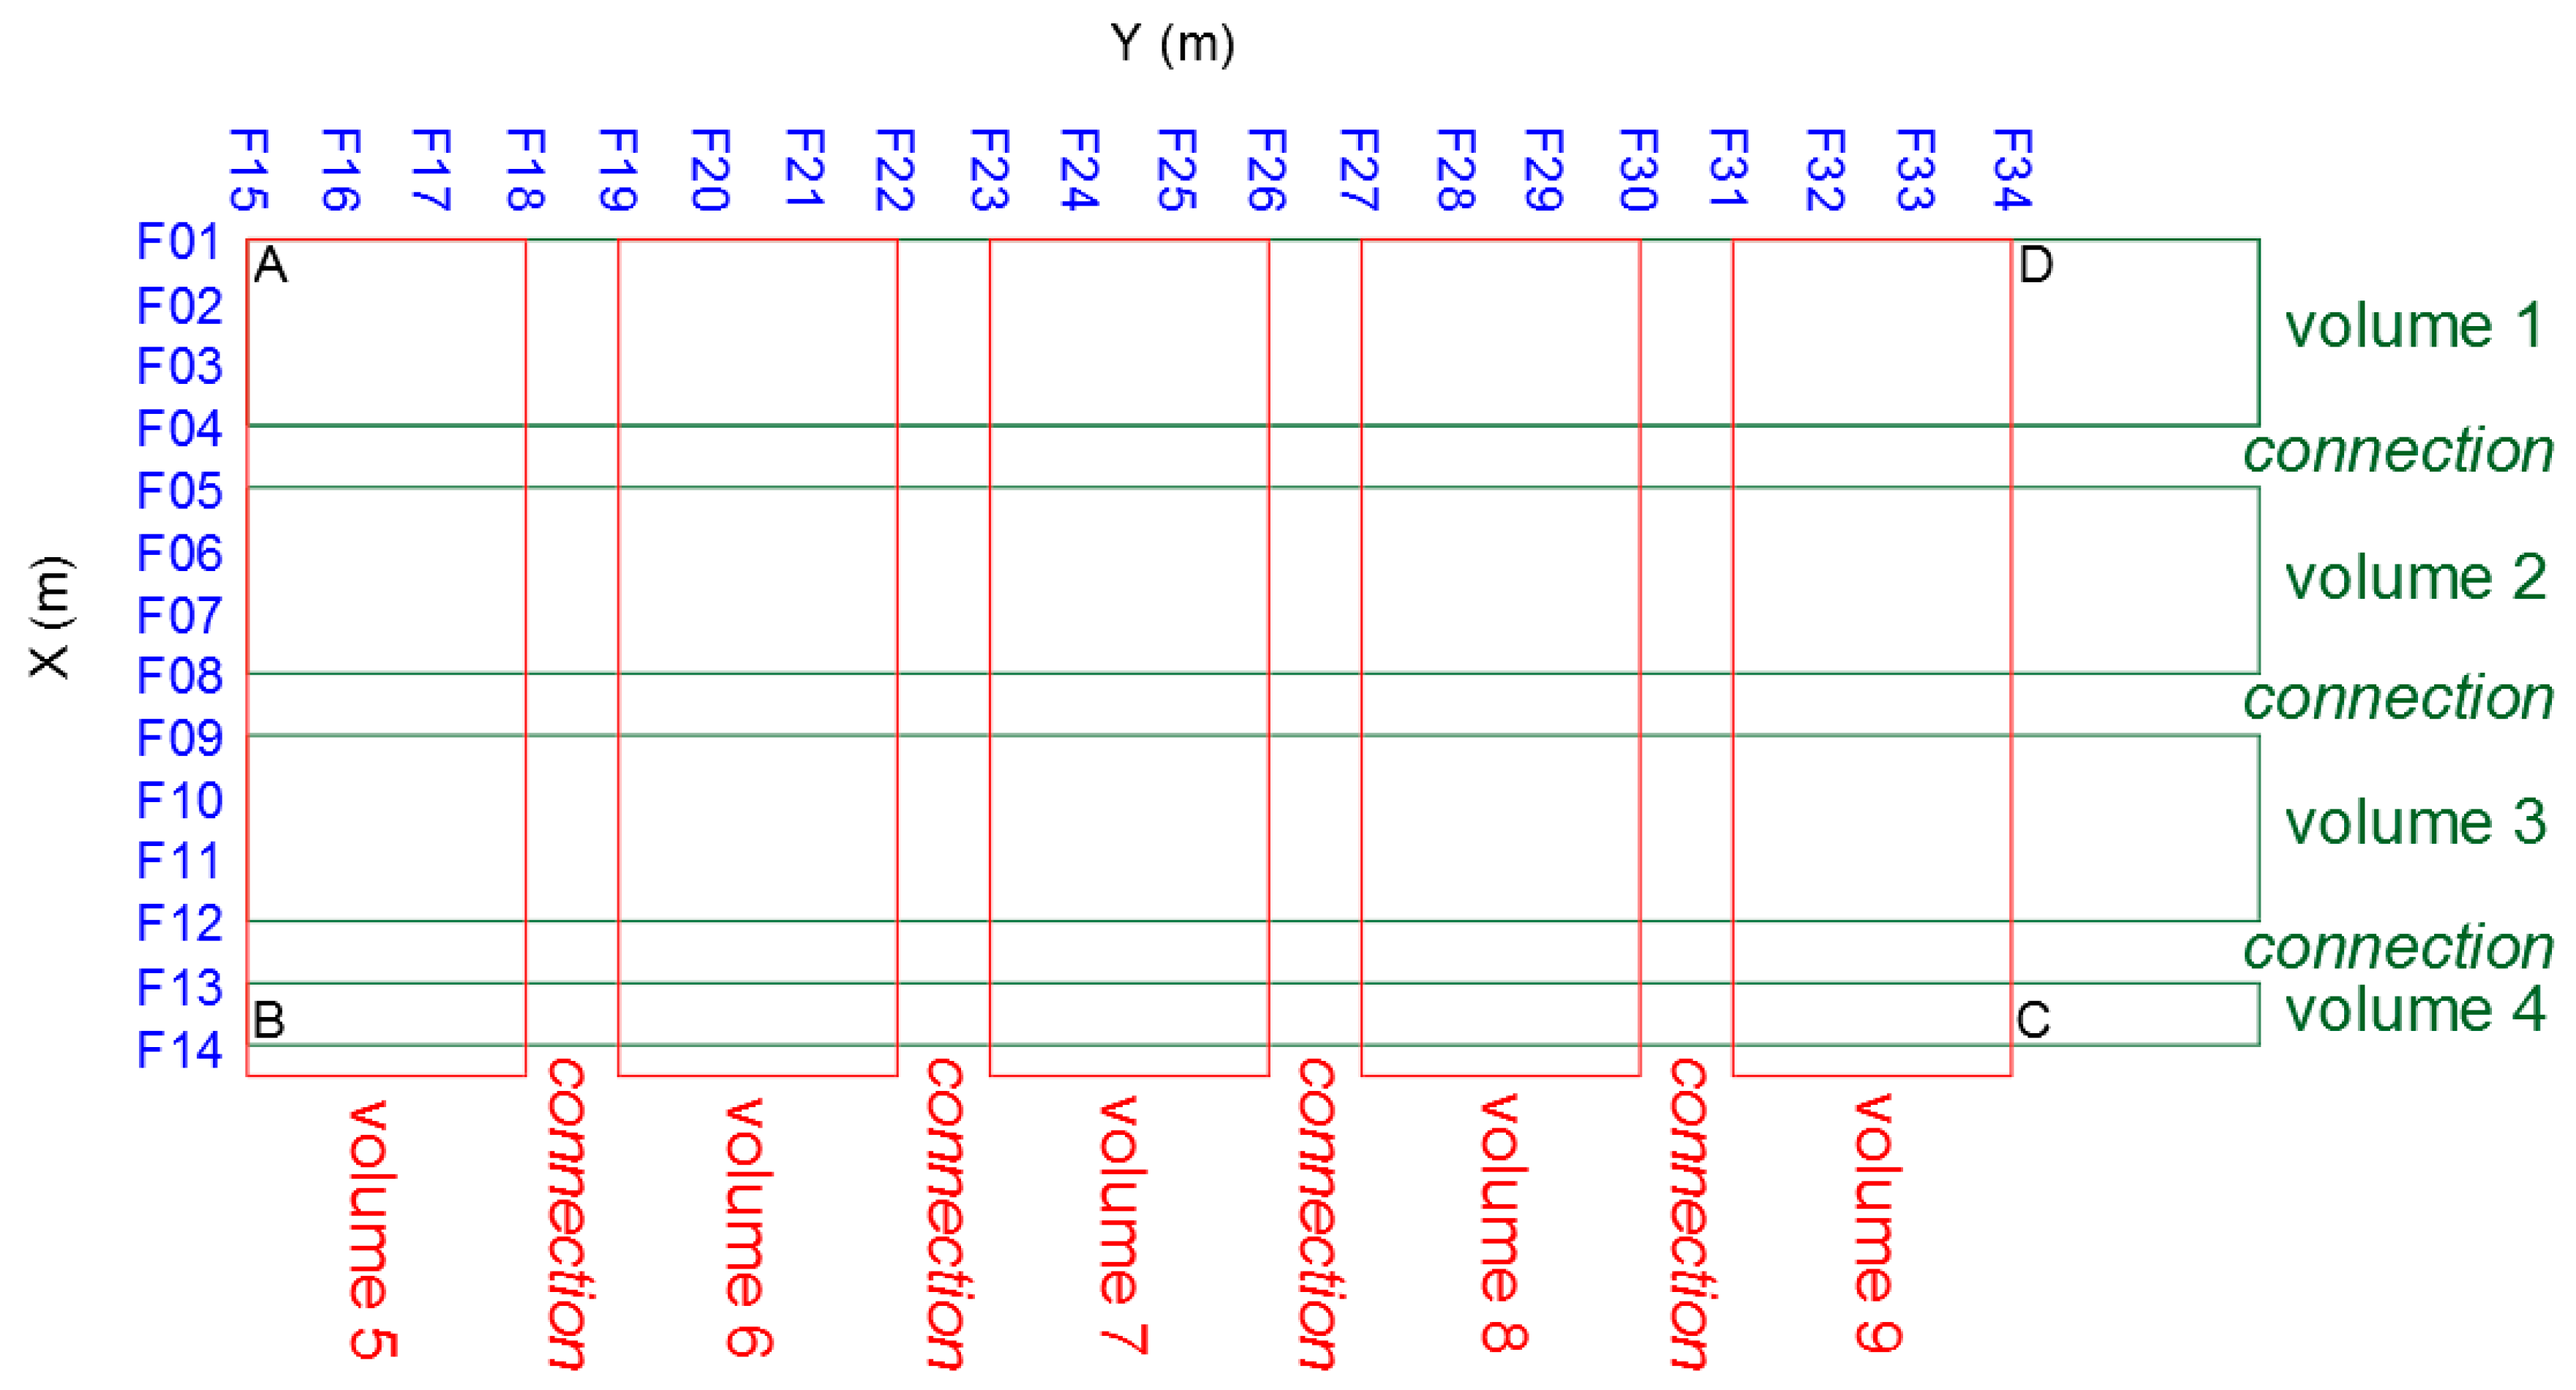
A three-dimensional rectangular GPR survey grid was designed with four vertices named A, B, C, and D, as shown in
Figure 4. The A–B vertex was parallel and 3.0 m away from the bench face, since most of the neglected area within these 3.0 m was full of stone debris. The bearing of the A–B side was 345.0° from the North. The dimensions of the rectangular grid were measured through a 1.0 cm accuracy tape. An arithmetical check was performed on the lengths of the diagonals, A–C and B–D, before the survey, to make sure that the rectangular was geometrically correct. We collected 14 profiles (from F01 to F14) with 2.0 m spacing along the X direction, and 21 profiles (from F15 to F34) with 3.0 m spacing along the Y direction. The length of each survey line in the X direction was equal to 27.0 m; whereas, in the Y direction it was equal to 65.0 m. During the survey, the locations of each antenna bumping were recorded in hand-writing in the field notes, to then be later considered in data processing and interpretation.
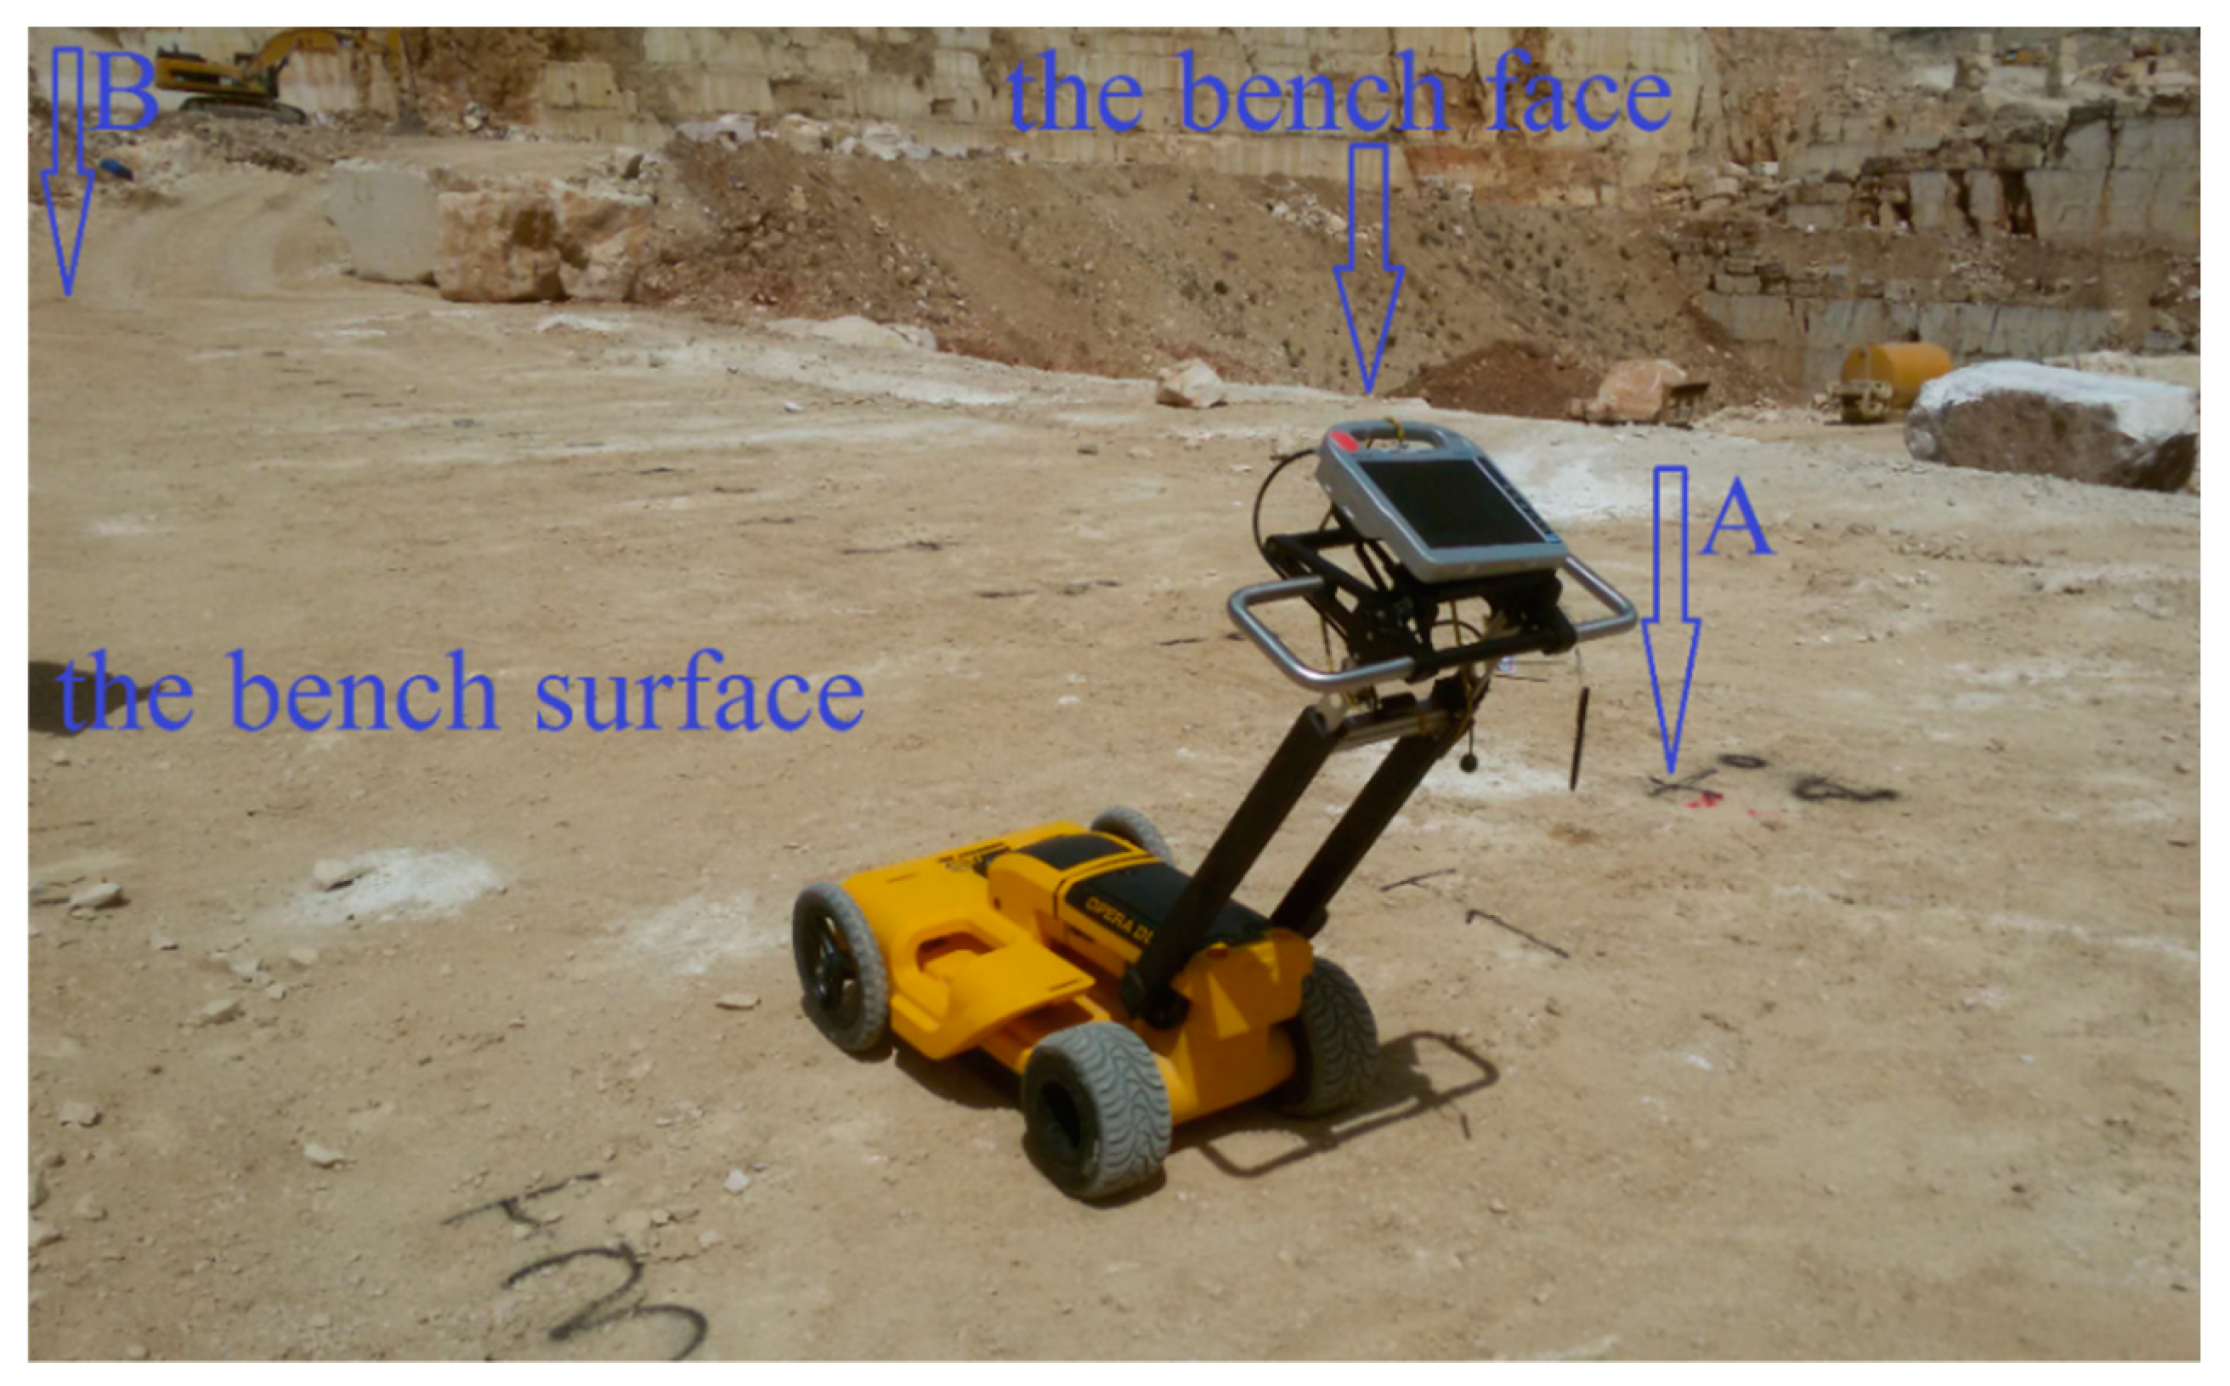
The bench surface was surveyed through a GPR instrument of a four-wheel mounted dual frequency antenna (250 and 700 MHz) (
Figure 5). The model of the instrument, Opera Duo, was manufactured by IDS GeoRadar s.r.l., Pisa, Italy. The grid was marked on the bench surface every meter, as shown in
Figure 5, to ease the correct movement from one survey line to another.
4. Data Processing and Velocity Estimation
In this case study, only the 700 MHz radargrams were considered since such frequency provided enough penetration depth with a higher resolution compared to the 250 MHz radargrams. Standard signal processing functions were applied to the 700 MHz radargrams using the signal processing software package GREDTM (manufactured by IDS GeoRadar s.r.l., Pisa, Italy). Firstly, the zero time was corrected manually. The background noise was eliminated by applying a horizontal background removal filter. This command applies the Clear-Y filtering algorithm to remove continuous components along the Y axis (horizontal direction) using two preset parameters to identify the depth of implementation in the radargram. The minimum value of the preset parameters was equal to 0.0 m (depth), and the maximum value was equal to 4.0 m (depth). The frequencies were filtered vertically through a vertical bandpass filters tool. Data were bandpass filtered in the 200 to 1500 MHz band. A power equalization of the amplitudes on the basis of an automatically estimated linear attenuation was carried out through the linear gain function, followed by an automatic smoothing gain filter to equalize the power along a sweep for a moving window. Finally, by selecting a proper color scale and adjusting the display gain, it was possible to spot some lower amplitude regions.
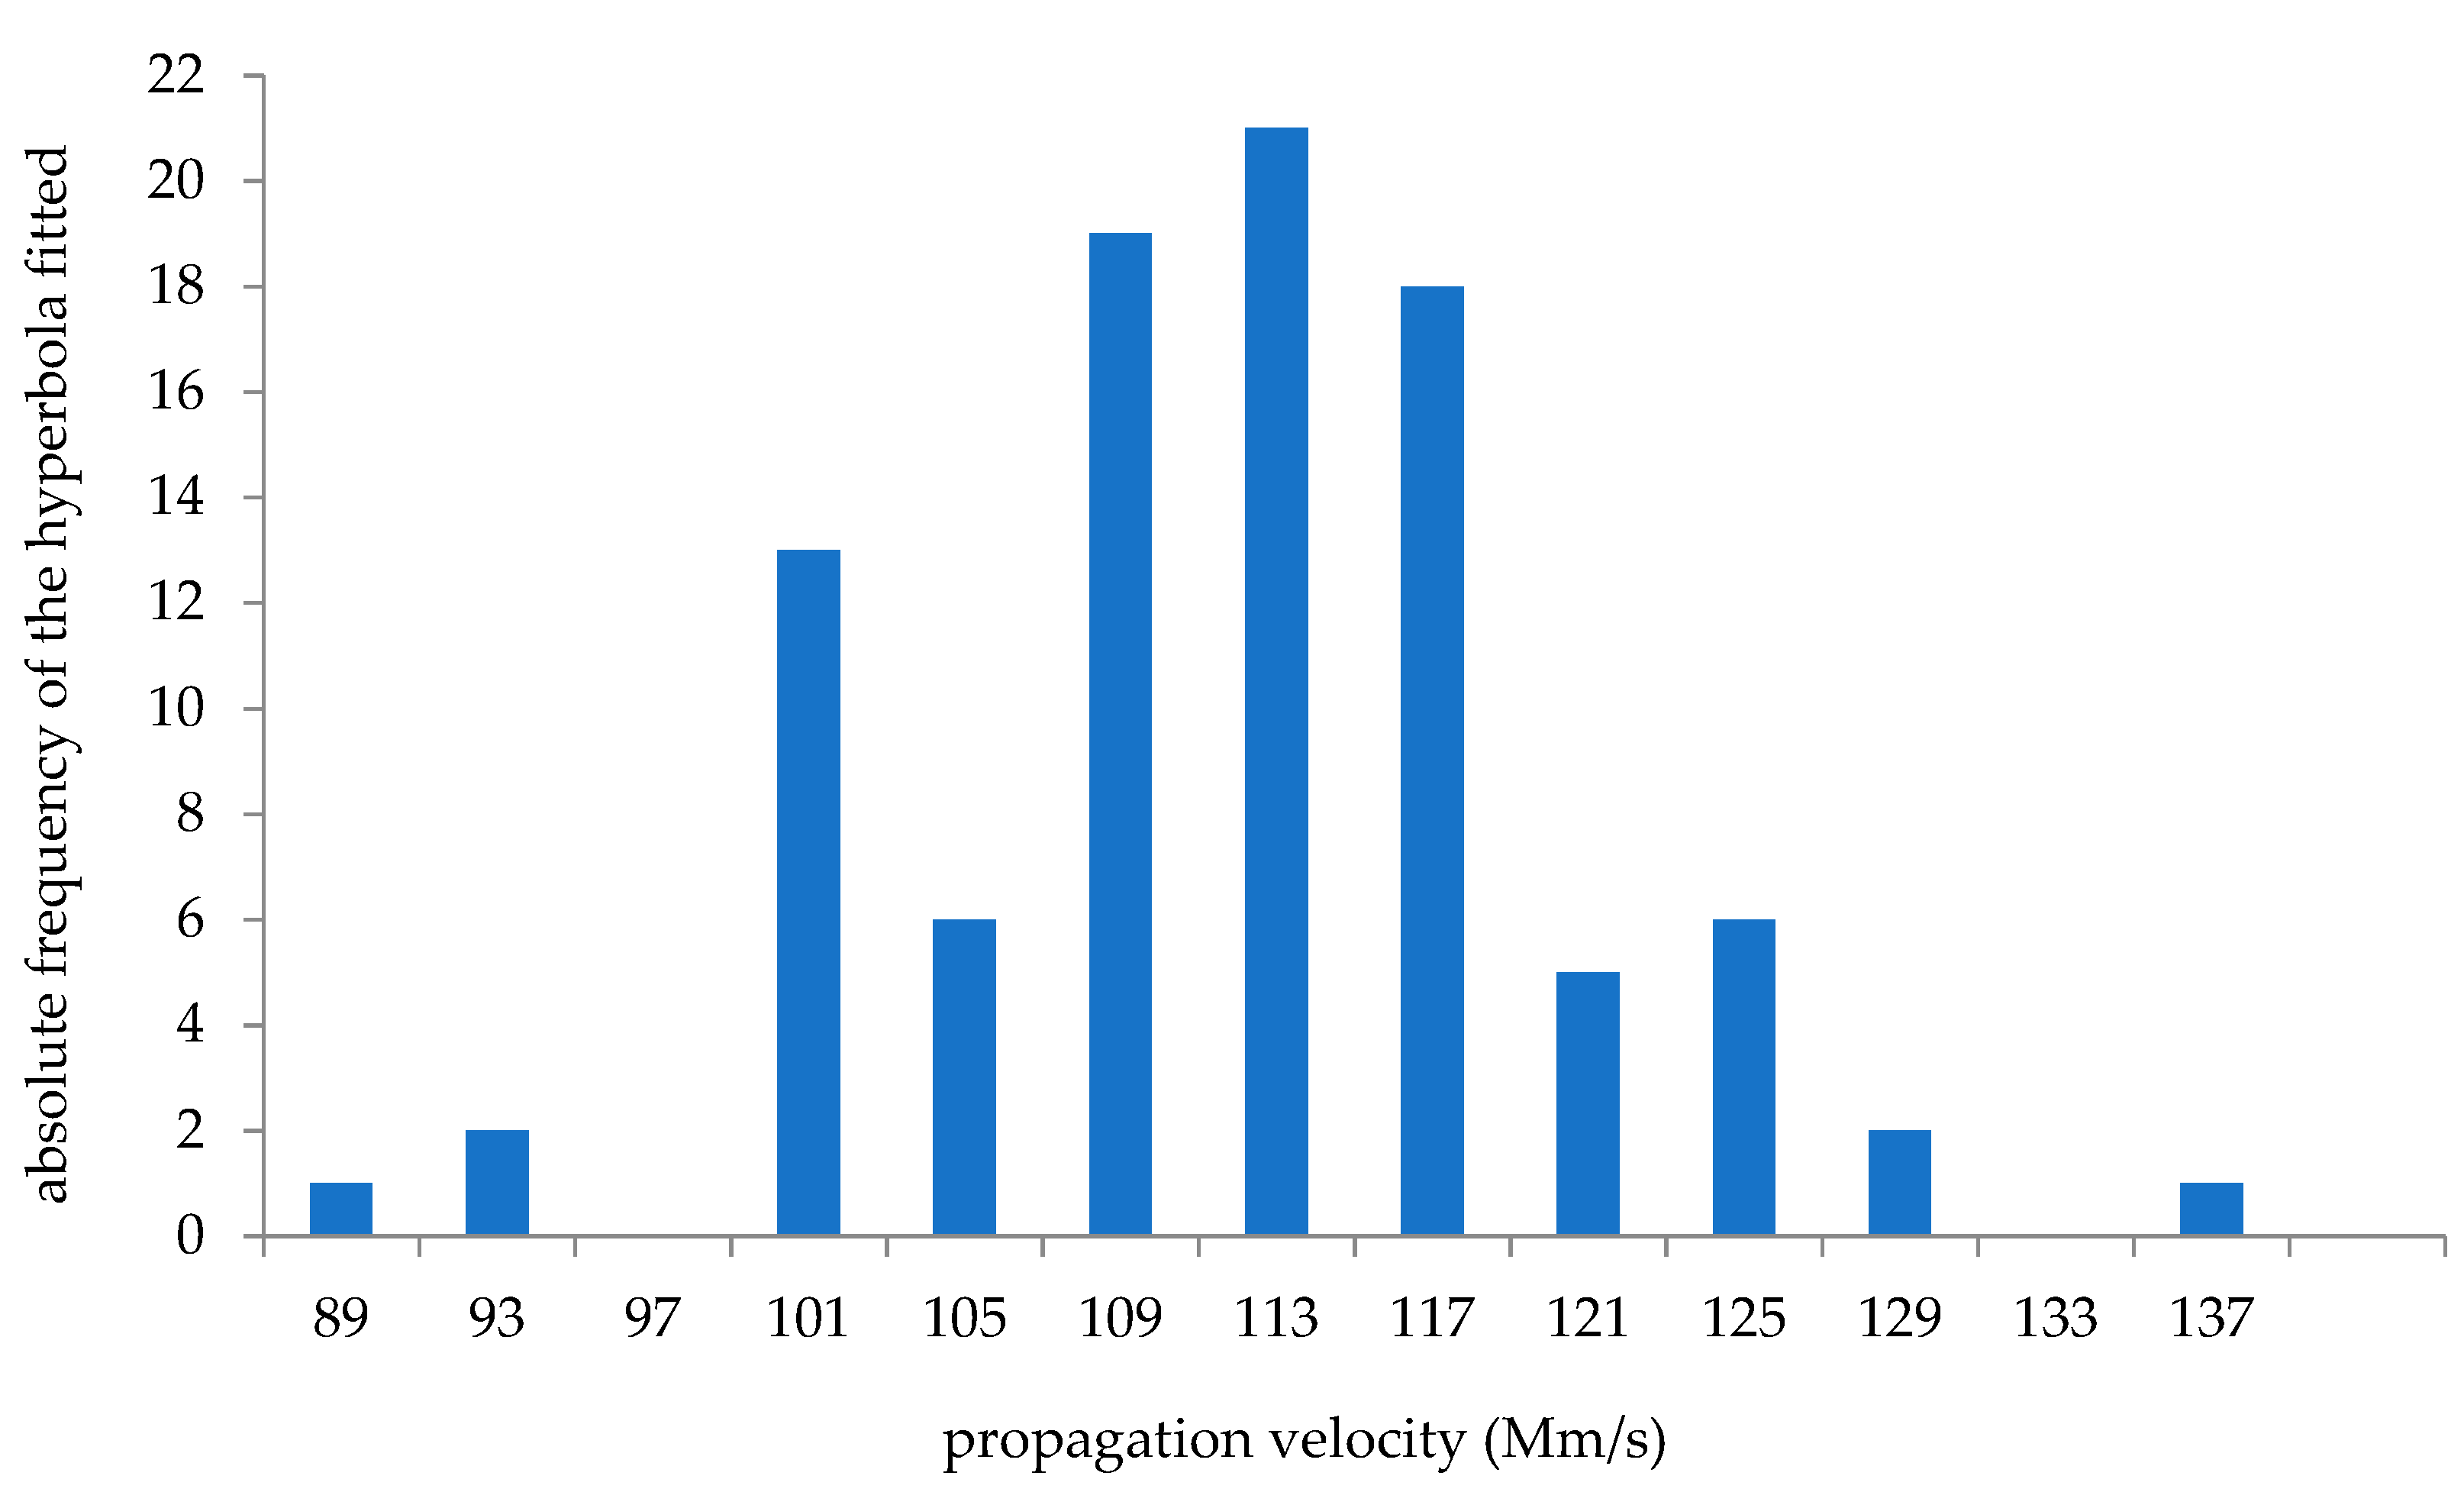
The bulk propagation velocity was estimated from the hyperbolic diffractions of the sub-vertical fractures in different radargrams from the X and Y directions and within different subsurface depths. It was not possible to use the “depth to a known reflector” calculation [
1,
29] to estimate the average propagation velocity. Using the fitting hyperbola tool, 94 hyperbolic diffractions were fitted using the software package GRED™ (
Figure 6). It was found that the propagation velocity varied significantly in the surveyed rock mass body of the bench confirming the finding in [
30]. The maximum and minimum propagation velocities identified were equal to 136.0 Mm/s (Megameter/s) and 89.0 Mm/s, respectively. This study considered the average propagation velocity of 110.0 Mm/s. Consequently, the estimated bulk dielectric constant of the limestone rock mass of the bench was equal to 7.4. This estimated dielectric constant value is consistent with expectations, given that, from bibliography data, the dielectric constant of limestone, in dry conditions, should range from 4.0 to 8.0, whilst in wet conditions it should range from 6.0 to 15.0 [
31]. Using the estimated value of propagation velocity, the two-way travel time was converted into true depth in the 34 radargrams giving a maximum penetration depth of about 4.0 m in the 700 MHz radargrams.
Since the GPR data were affected by a large amount of pseudo-vertical fractures, the reconstruction of the true shape and geometry of the detected fractures was carried out by applying data migration. Data migration requires an accurate estimate of the average propagation velocity of the waves in the rock medium. The estimated average propagation velocity (110.0 Mm/s) was used for the data migration in order to collapse the diffractions and to re-position the sub-vertical and dipping fractures. The propagation velocity used was sufficient to collapse the diffractions defining the sub-vertical fractures. The implementation of data migration was significant in this study not only due to collapsing diffractions, but also because many hyperbolic diffractions of fractures were intersected making it difficult to interpret the fractures in the non-migrated radargrams.
5. Interpretations and Modeling
This study used the interpretation and modeling method presented in [
1]. The surveyed area of the bench was divided into nine volumes referring to the radargrams in the X and Y directions, as shown in
Table 1 and
Figure 7. The fractures in each volume were interpreted and modeled separately. The fractures were then traced and modeled in the connections between the volumes.
Appendix A shows two volumes interpreted from the radargrams in the X and Y directions. It is worth mentioning that, in this case study where vertical or sub-vertical fractures intersect with the bedding planes, interpretation of a vertical or sub-vertical fracture may not belong to one fracture but to several fractures (usually one fracture per mechanical layer): One starts very close to the point where the other ends.
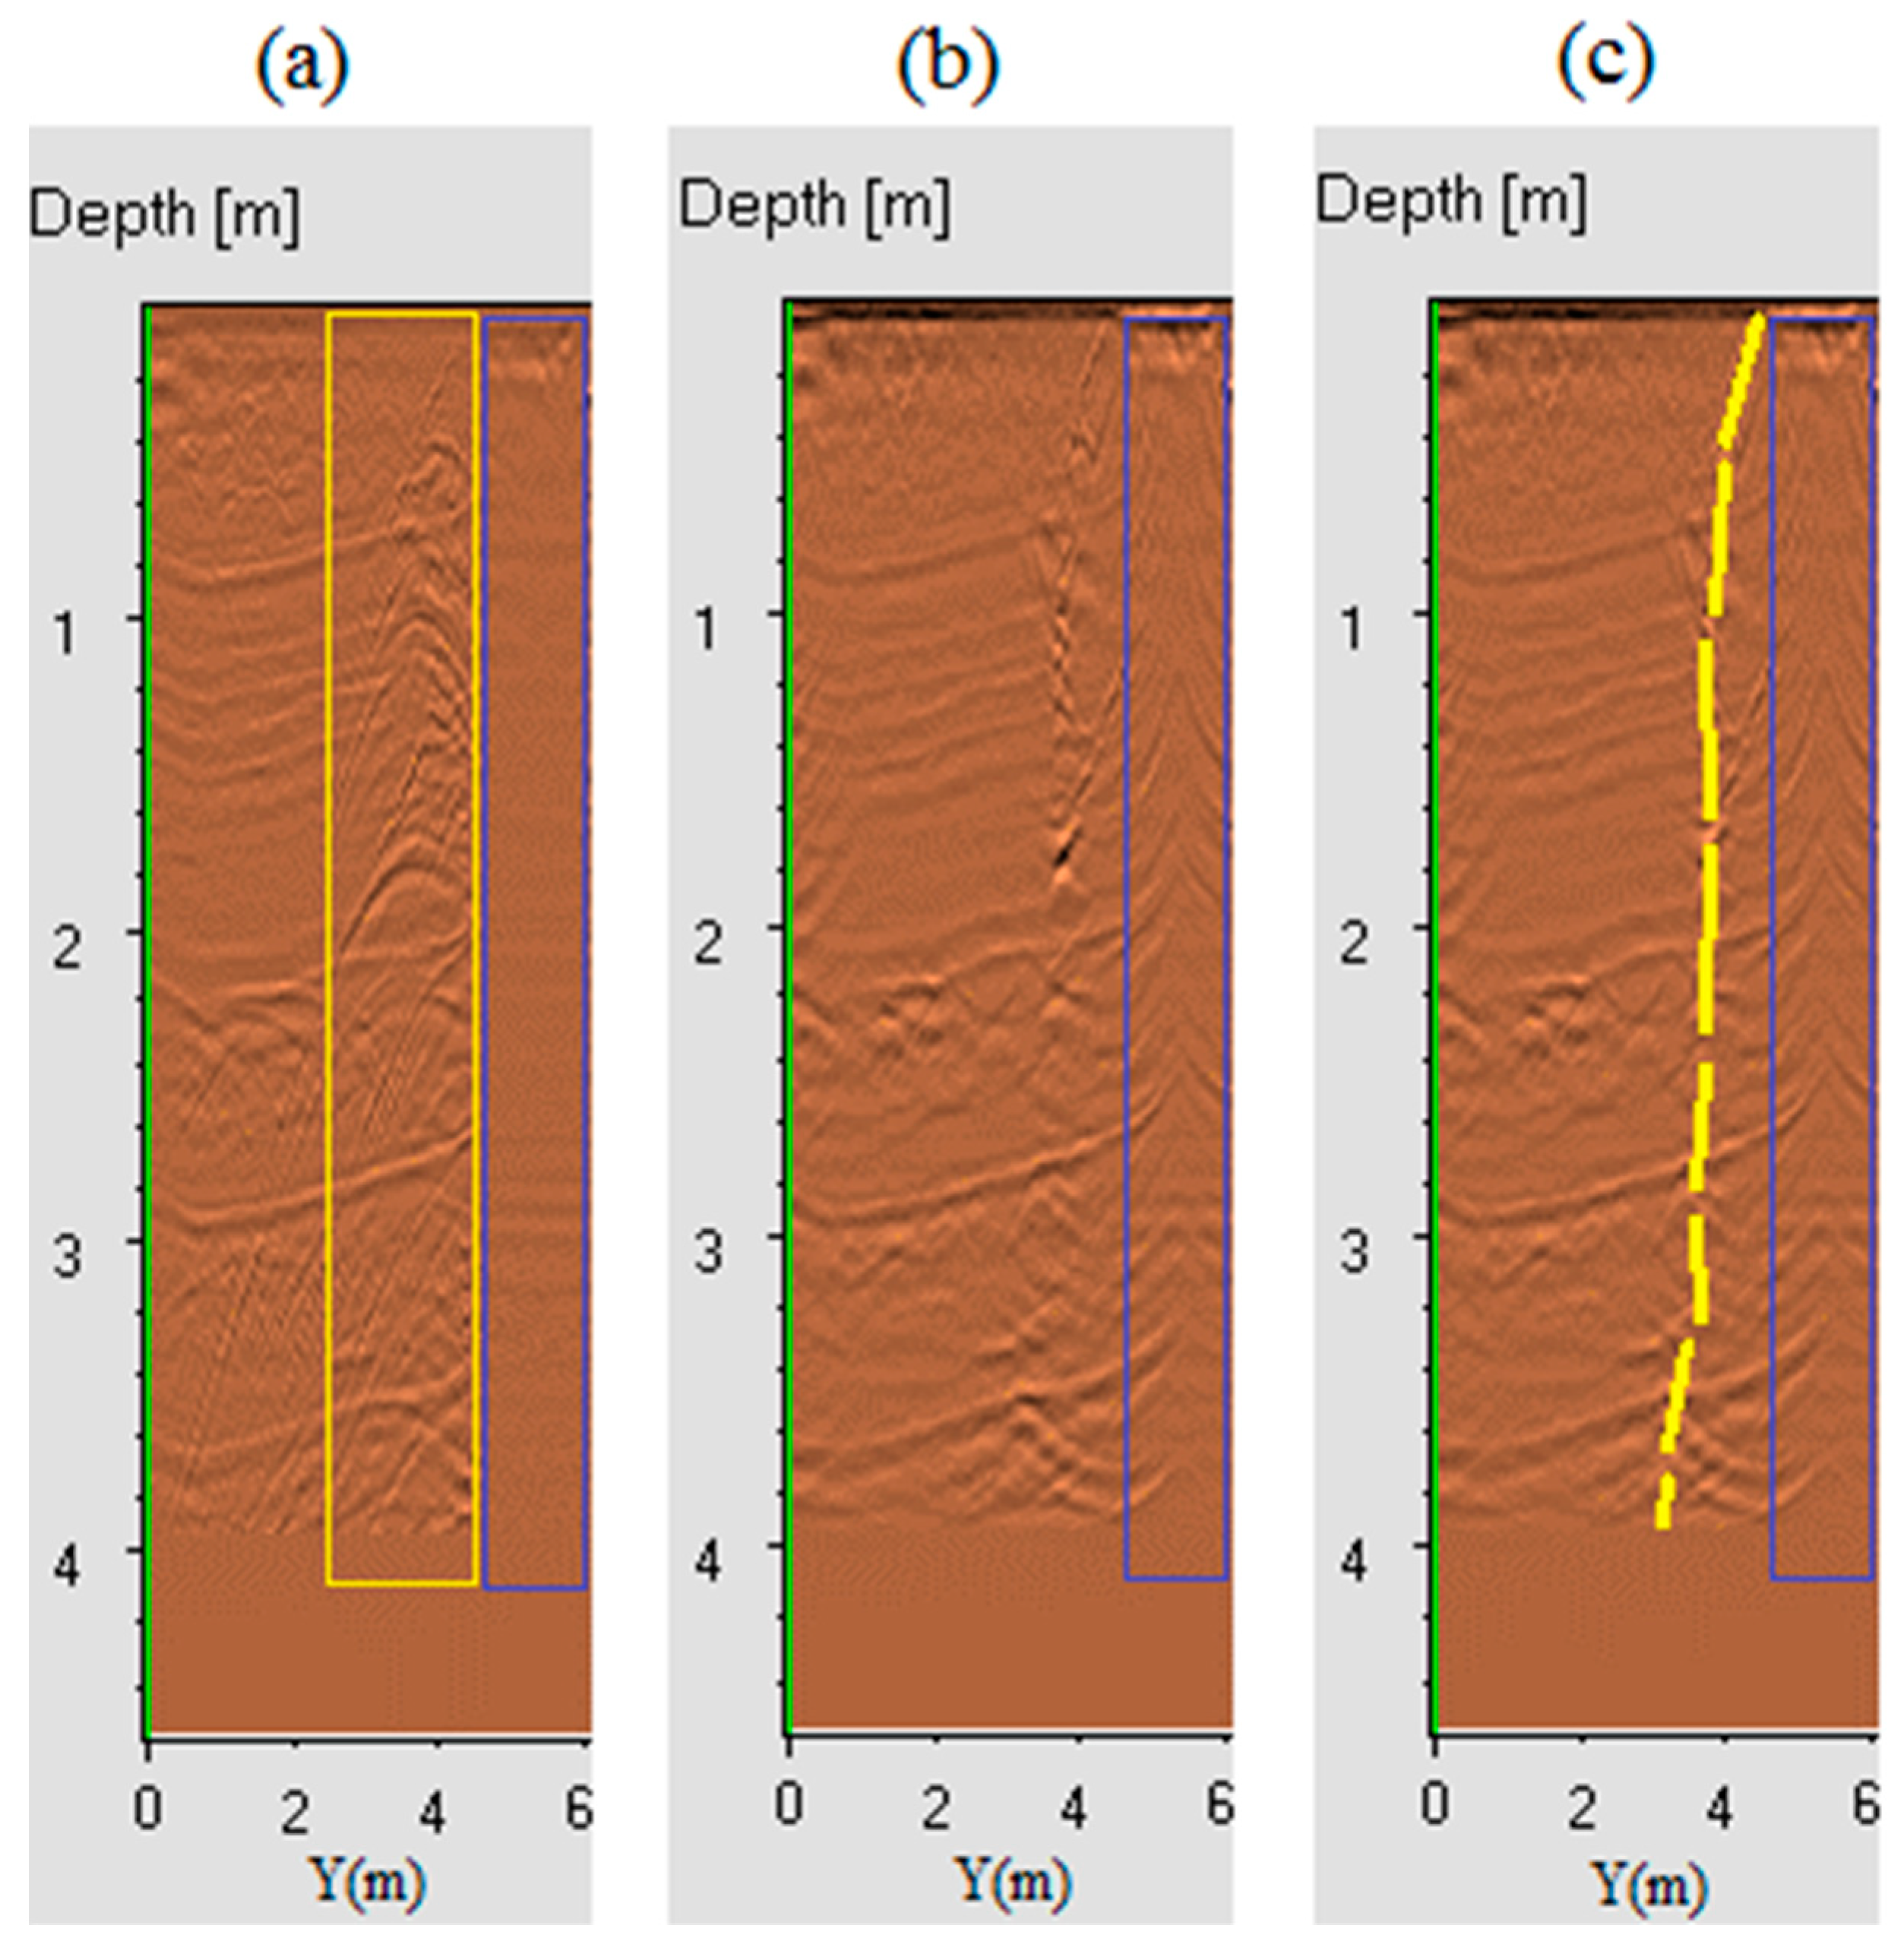
During the survey, an operator marked on a printed paper grid where the antenna mechanically vibrated (antenna bumping) due to the stone debris or the uneven ground surface in a few locations. This was necessary to avoid incorrect interpretation of the fractures in the radargrams, particularly after data migration (
Figure 8), since the mechanical vibration of the antenna causes a ringing noise in the radargrams.
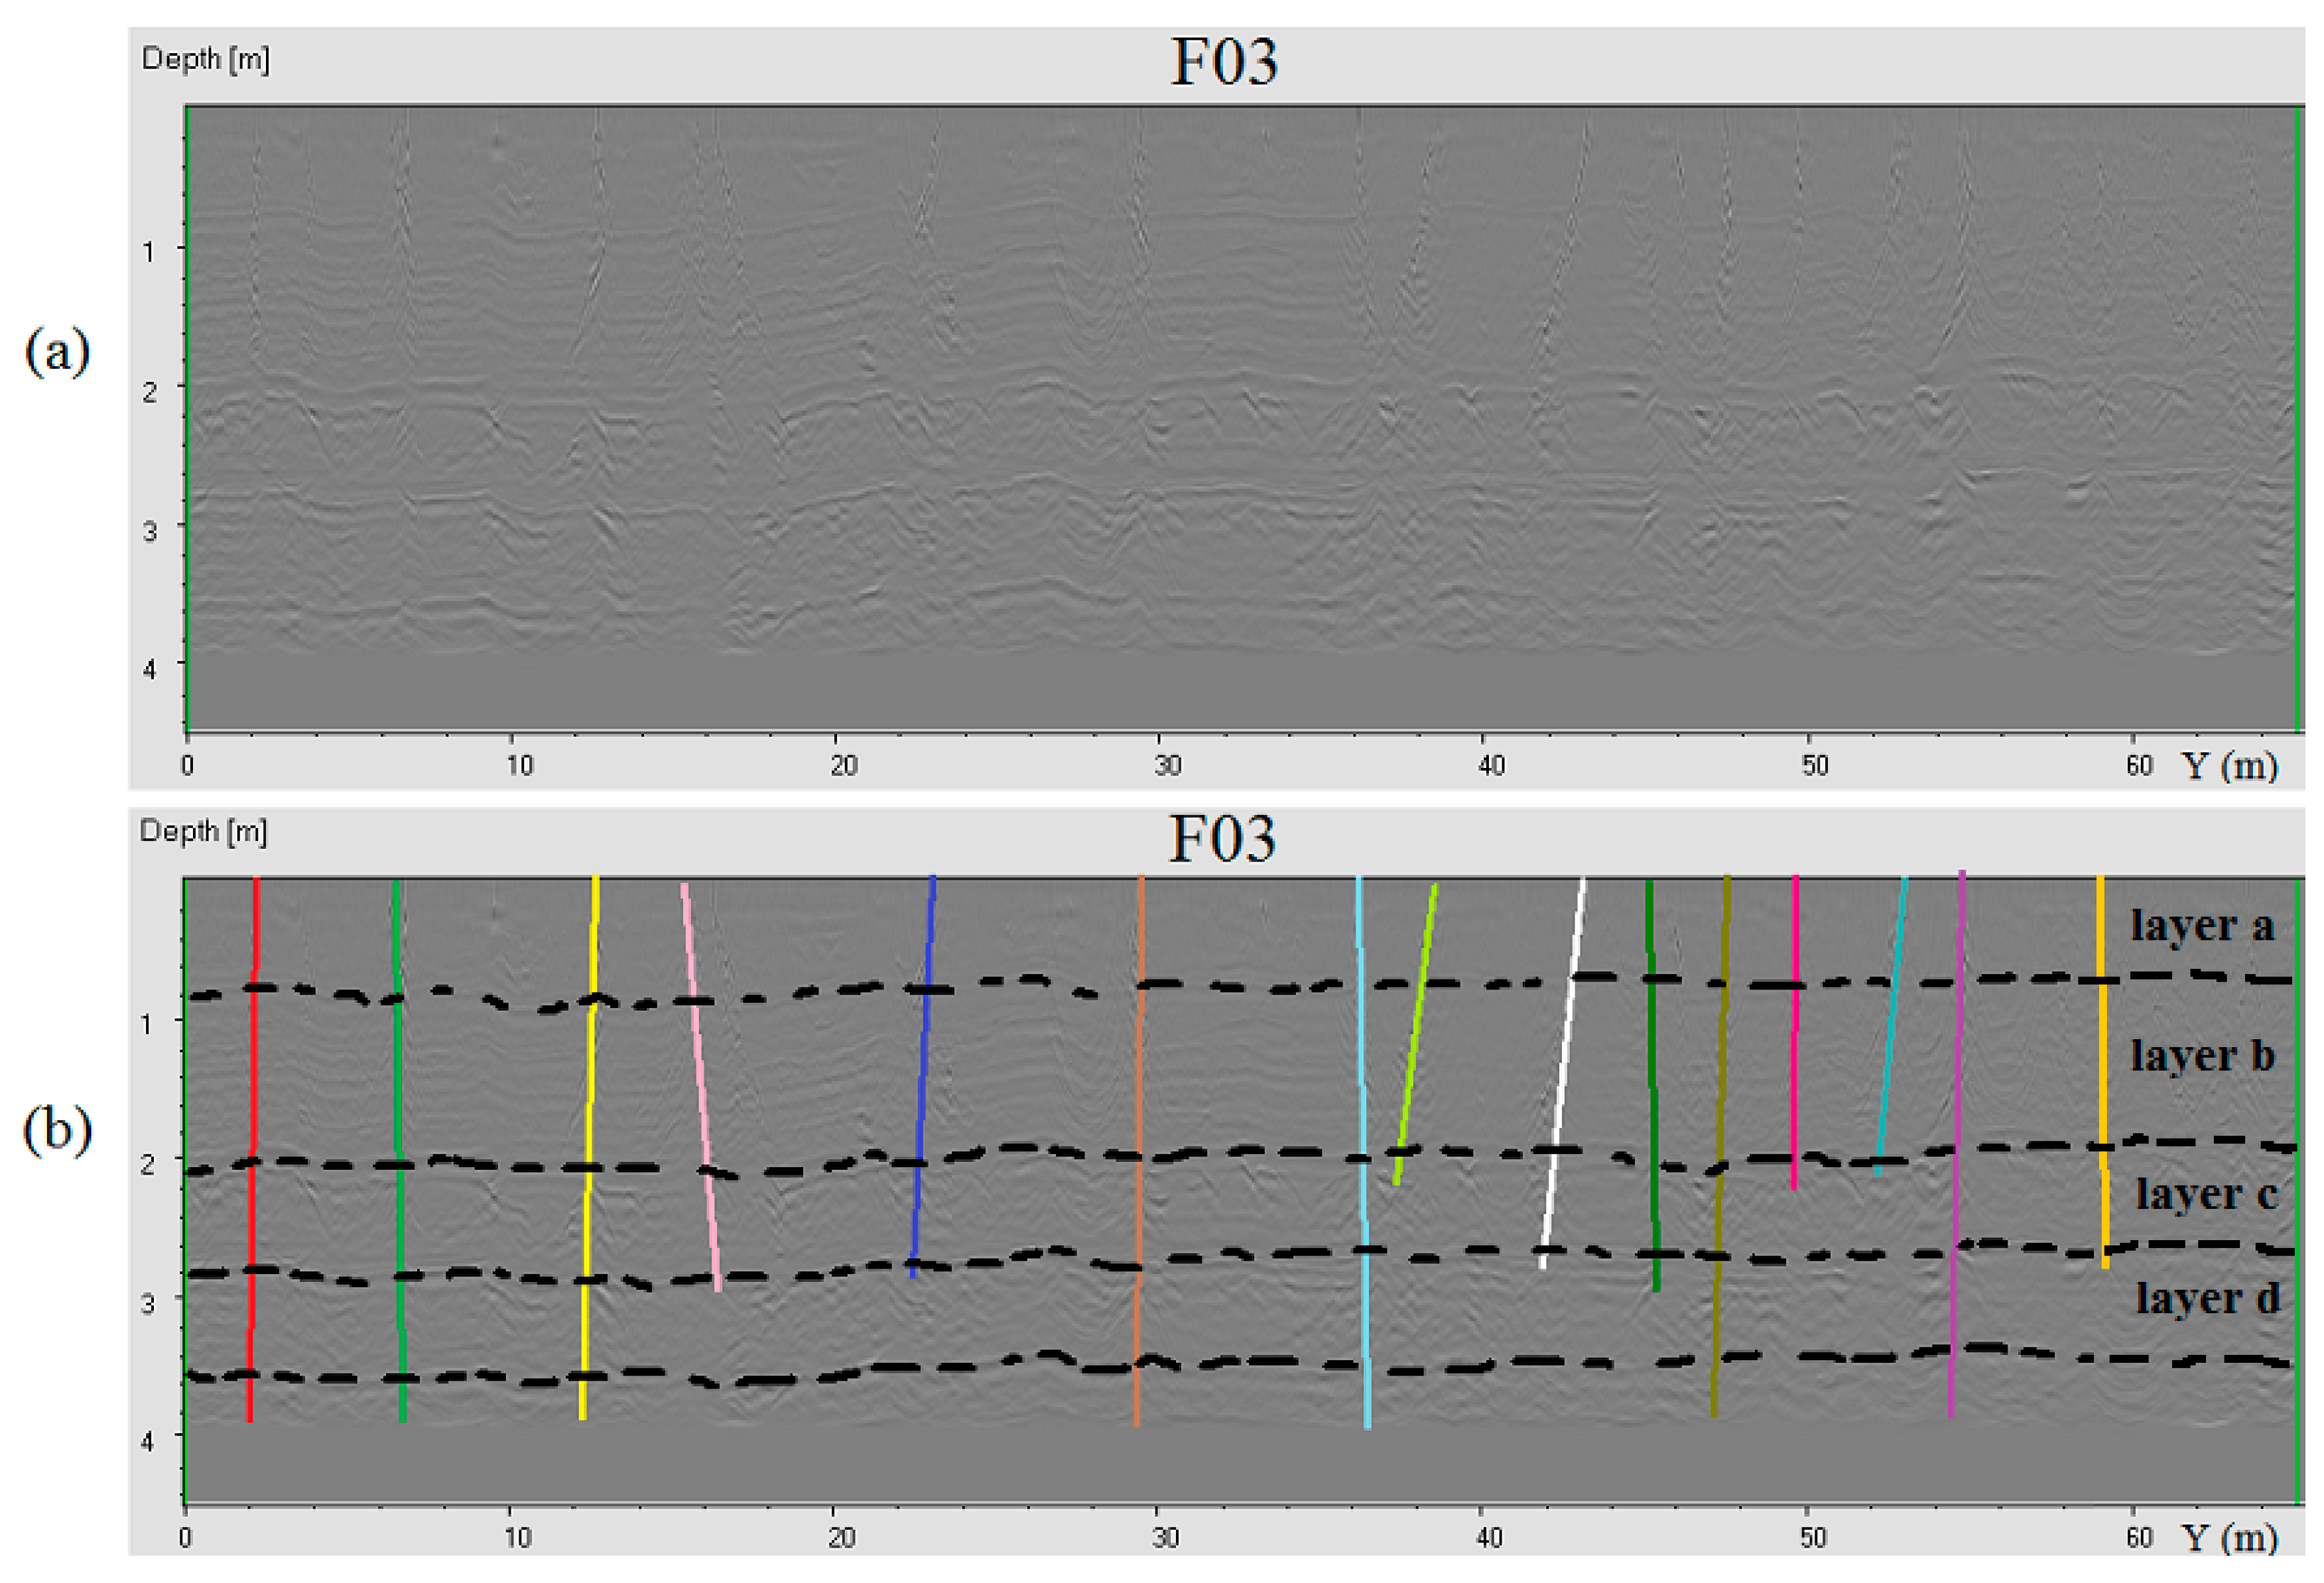
In all the radargrams, a layering of the surveyed rock mass body was detected. The radargrams allowed us to observe that the upper and lower surfaces of the detected four rock layers were not flat. Furthermore, the method allowed us to detect the wavy feature of the layers’ surfaces (see an example in
Figure 9). However, the average thicknesses of the layers were considered (
Table 2).
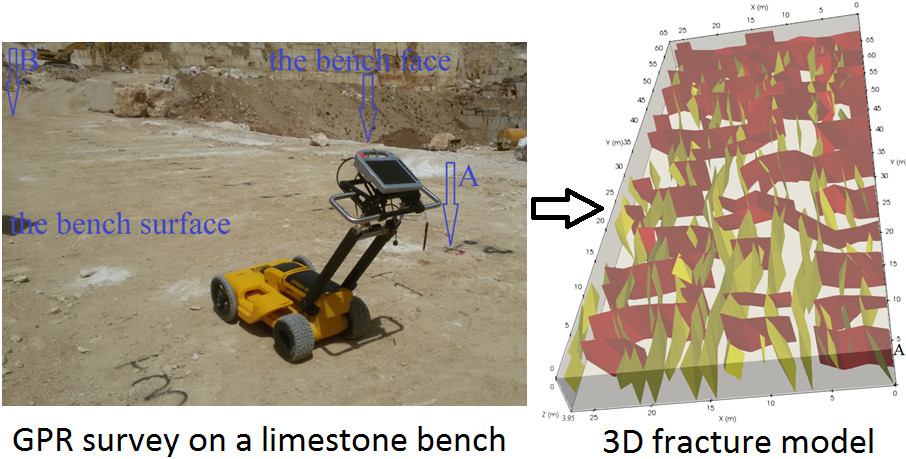
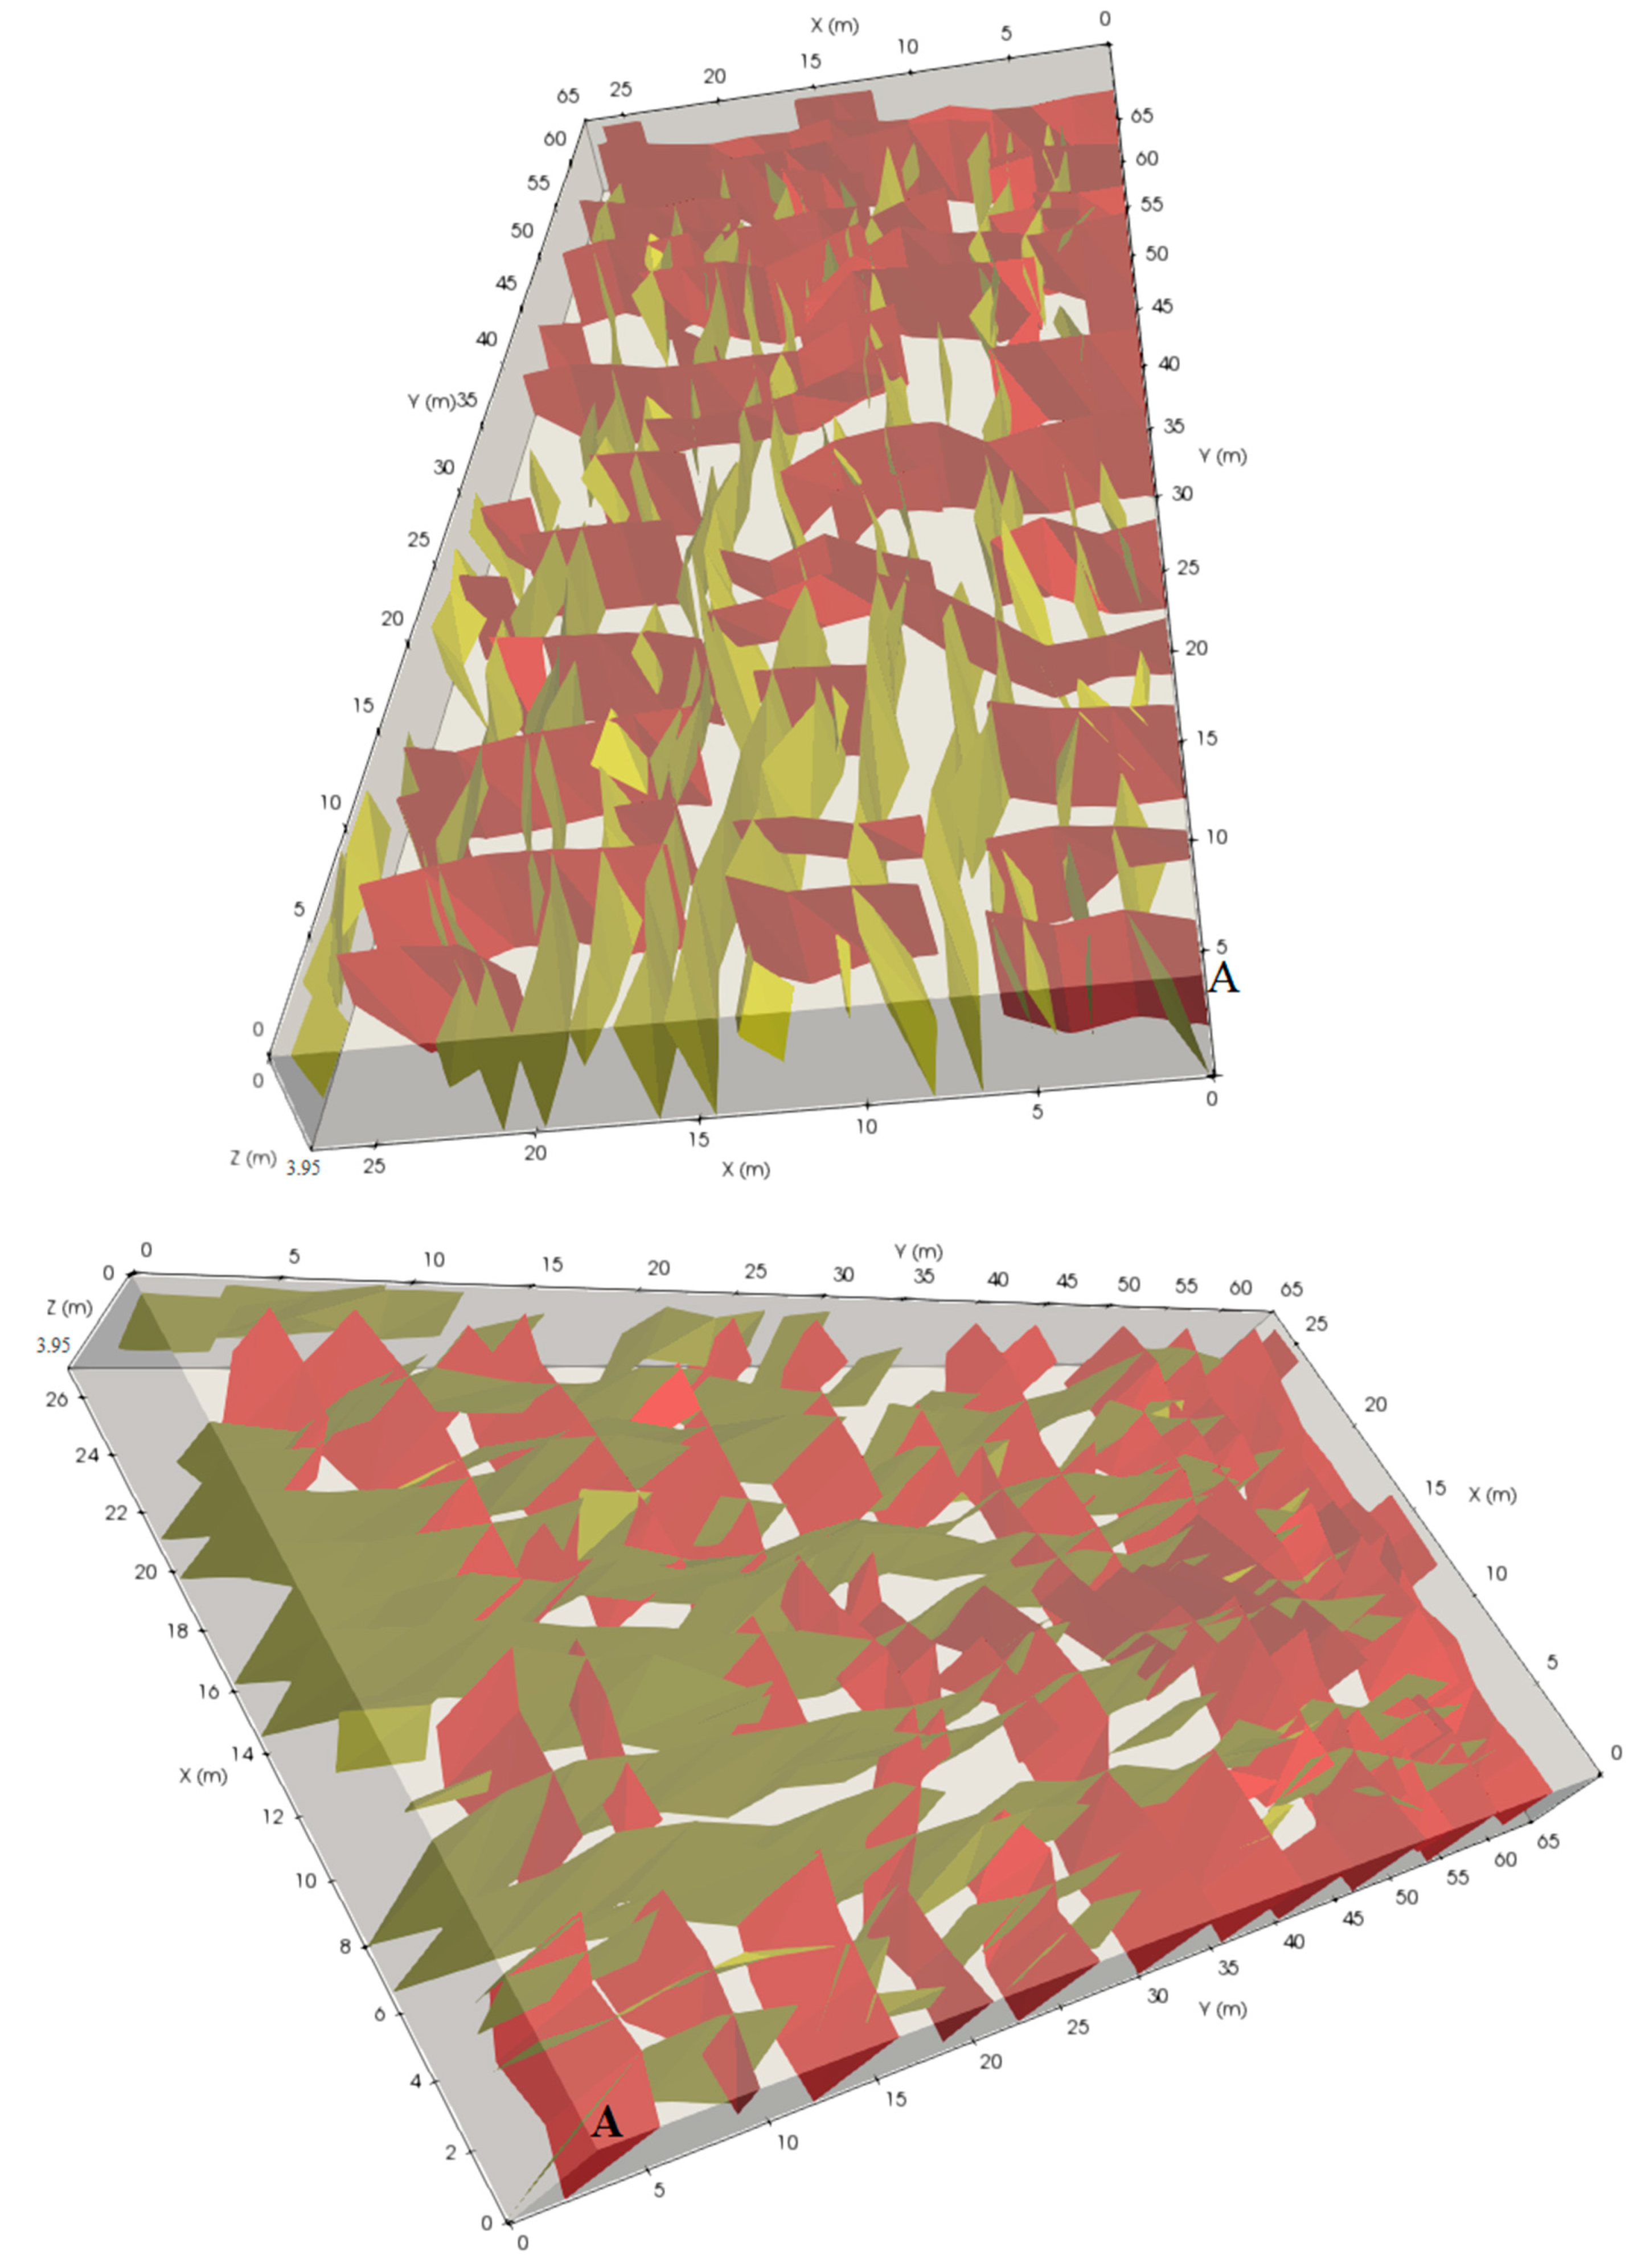
The fractures were modeled in a rock mass body measuring 27.0 m X, 65.0 m Y, and 4.0 m Z. The polygon file format (PLY) [
32] of the fracture data and the surveyed volume were imported in ParaView [
33] for a 3D visualization (
Figure 10). As shown in
Figure 10, the two sets of fractures were somehow orthogonally intersected. The fractures detected in the radargrams of the X and Y directions are represented in the model in yellow (Set 2) and red (Set 1), respectively. As shown in the visualized model, fractures belonging to a fracture set had noticeable variations in space. However, the general trend of the dip direction, dip angle, and spacing still clearly defined the two fracture sets. The visualized model provided some indications that Set 2 was the dominant one.
6. Discussion
The tests and analysis performed demonstrated that the use of GPR in quarries can be technically feasible even in stratified and orthogonally fractured benches. The use of high frequency antennas in compacted dry materials can lead to a high penetration depth. The 3D variation of the dielectric constant vertically and horizontally in rock masses is a critical issue in GPR measurements. Minimization of the resulting error is required, when possible, by the depth to a known reflector calculation or averaging many hyperbolic diffractions at different locations. Division of the whole area surveyed into volumes is necessary for large area interpretation and modeling so as to minimize human error. The Paraview program is still successful in visualizing modeled fracture data in a large area. The implemented fracture modeling strategy in a large area of bench is promising, considering the geologic conditions of the bench studied. However, the limitation of missing small fractures in the non-surveyed cells of the grid exists. When possible, intensive survey grid is much more favorable.
The most common method of fracture detection in quarrying applications is the manual method that assumes all fracture planes are persistent, giving advantage to relatively less time consumption in the modeling phase. The modeling strategy used in this paper aimed at modeling 3D surfaces of fractures, rather than planes, as is usually the case. The assumption that fractures are persistent can be feasible in other applications. In the application for quarrying production optimization, the irregularity of curved fracture surfaces, being persistent or not based on the detected reflections, can play a significant role in quantification of non-fractured blocks that can vary from one layer to another when the cutting direction changes, as our current research indicates.
The issue of time consumption in the implementation of the fracture model on a large area of a bench is a critical aspect, particularly with regard to the manual picking of the coordinates of the detected fractures from the radargrams. The aim is to integrate all of the components of the method (data processing, fracture interpretation, and model formulation) into a single software package, as this would reduce time consumption.
From the resulting 3D fracture model, it is possible to roughly estimate the dimensions of the exploitable non-fractured blocks from the studied bench. The average spacing of the fractures in Set 1 and Set 2 was estimated to be about 3.0 m and 2.0 m, respectively. Here, there is no relation between the spacing between survey lines selected for the survey grid and the estimated spacing of fracture sets. The spacings of survey lines were 3.0 m and 2.0 m for radargrams orthogonal to Set 2 and Set 1, respectively. The spacing of survey lines mainly controls the accuracy (more geometric details) of modeling 3D curved surfaces of fractures. Since the technical manager of this quarry reported that the target is to cut blocks with the largest surface area possible (X–Y plane), and due to the variable thickness of the layers, any reasonable thickness (Z) of the extracted blocks can be acceptable. Since the radargrams allow for the estimation of the thickness of the layers, the expected average size of the exploitable block for each layer is equal to about 3.0 X (m), 2.0 Y (m), Z (m) of the layer. This is quite a rough estimation when considered in regards to quarrying. Therefore, the authors are developing a quarrying optimization algorithm based on the mentioned GPR fracture modeling strategy to find the optimum size of a non-fractured block as a function of the optimal cutting pattern in order to maximize production and minimize waste.
7. Conclusions
In this study, a dual-frequency GPR system (250 MHz and 700 MHz) was used to survey a large-scale area of a limestone bench. The 700 MHz antenna proved to be effective in penetrating rock material studied at a large depth (4.0 m), providing a high resolution. This allowed us to image the thickness of the different rock layers in the studied bench and to detect the position, geometry, and dip of the fracture traces in the radargrams. The bulk dielectric constant of the rock mass was calculated by fitting several hyperbolic diffractions of the fractures detected at different depths as an alternative solution, since the “depth to know reflector” method could not be applied. The modeling approach implemented in this paper allowed us to deterministically model and visualize fractures on a large area by dividing volumes. The implementation of the modeling strategy in this paper can highlight further implementations, either in small or large areas, in different GPR applications, not only in quarrying, where subsurface planner anomalies exist. The resulting 3D model in the case study allowed us to roughly estimate the average exploitable size of non-fractured blocks within the rock layers of the bench: 3.0 X (m), 2.0 Y (m), Z (m) of layer.
The development of a large area 3D deterministic model of fractures before cutting benches into blocks can be strategic, as it can help us to maximize quarrying production whilst minimizing waste. This work proves that a 3D fracture model can be obtained through a GPR survey. Moreover, the authors are currently conducting further research with the aim to make a step forward: The realization of a production optimization algorithm to find the optimum cutting pattern capable of maximizing the number of non-fractured blocks for each layer.
Author Contributions
M.E. is the main contributor of the paper, he contributed in conceptualization, investigation, GPR survey, data processing, modeling, software design, 3D visualizations, analysis, and writing the first draft. F.T. contributed in GPR survey from both administrative and technical sides, project administration and instrumentation. S.K. contributed in GPR survey from both administrative and technical sides. F.G. contributed in investigation, project administration and instrumentation. S.B. contributed in conceptualization, investigation, modeling, software design and implementation, 3D visualizations, project administration and instrumentation. R.B. supervised the work. All authors contributed in reviewing and editing the paper.
Funding
This research received no external funding.
Acknowledgments
The authors are grateful to Michele Augelli, “Augelli Marmi” quarrying company, for allowing the GPR test in their quarry area and to Carlo Cormio (SERENGEO Srl, a spin-off company of the University of Bologna) for the technical suggestions provided. A special word of thanks goes to the EU-METALIC II—ERASMUS MUNDUS program that funded the lead author’s PhD scholarship.
Conflicts of Interest
The authors declare no conflicts of interest.
Appendix A
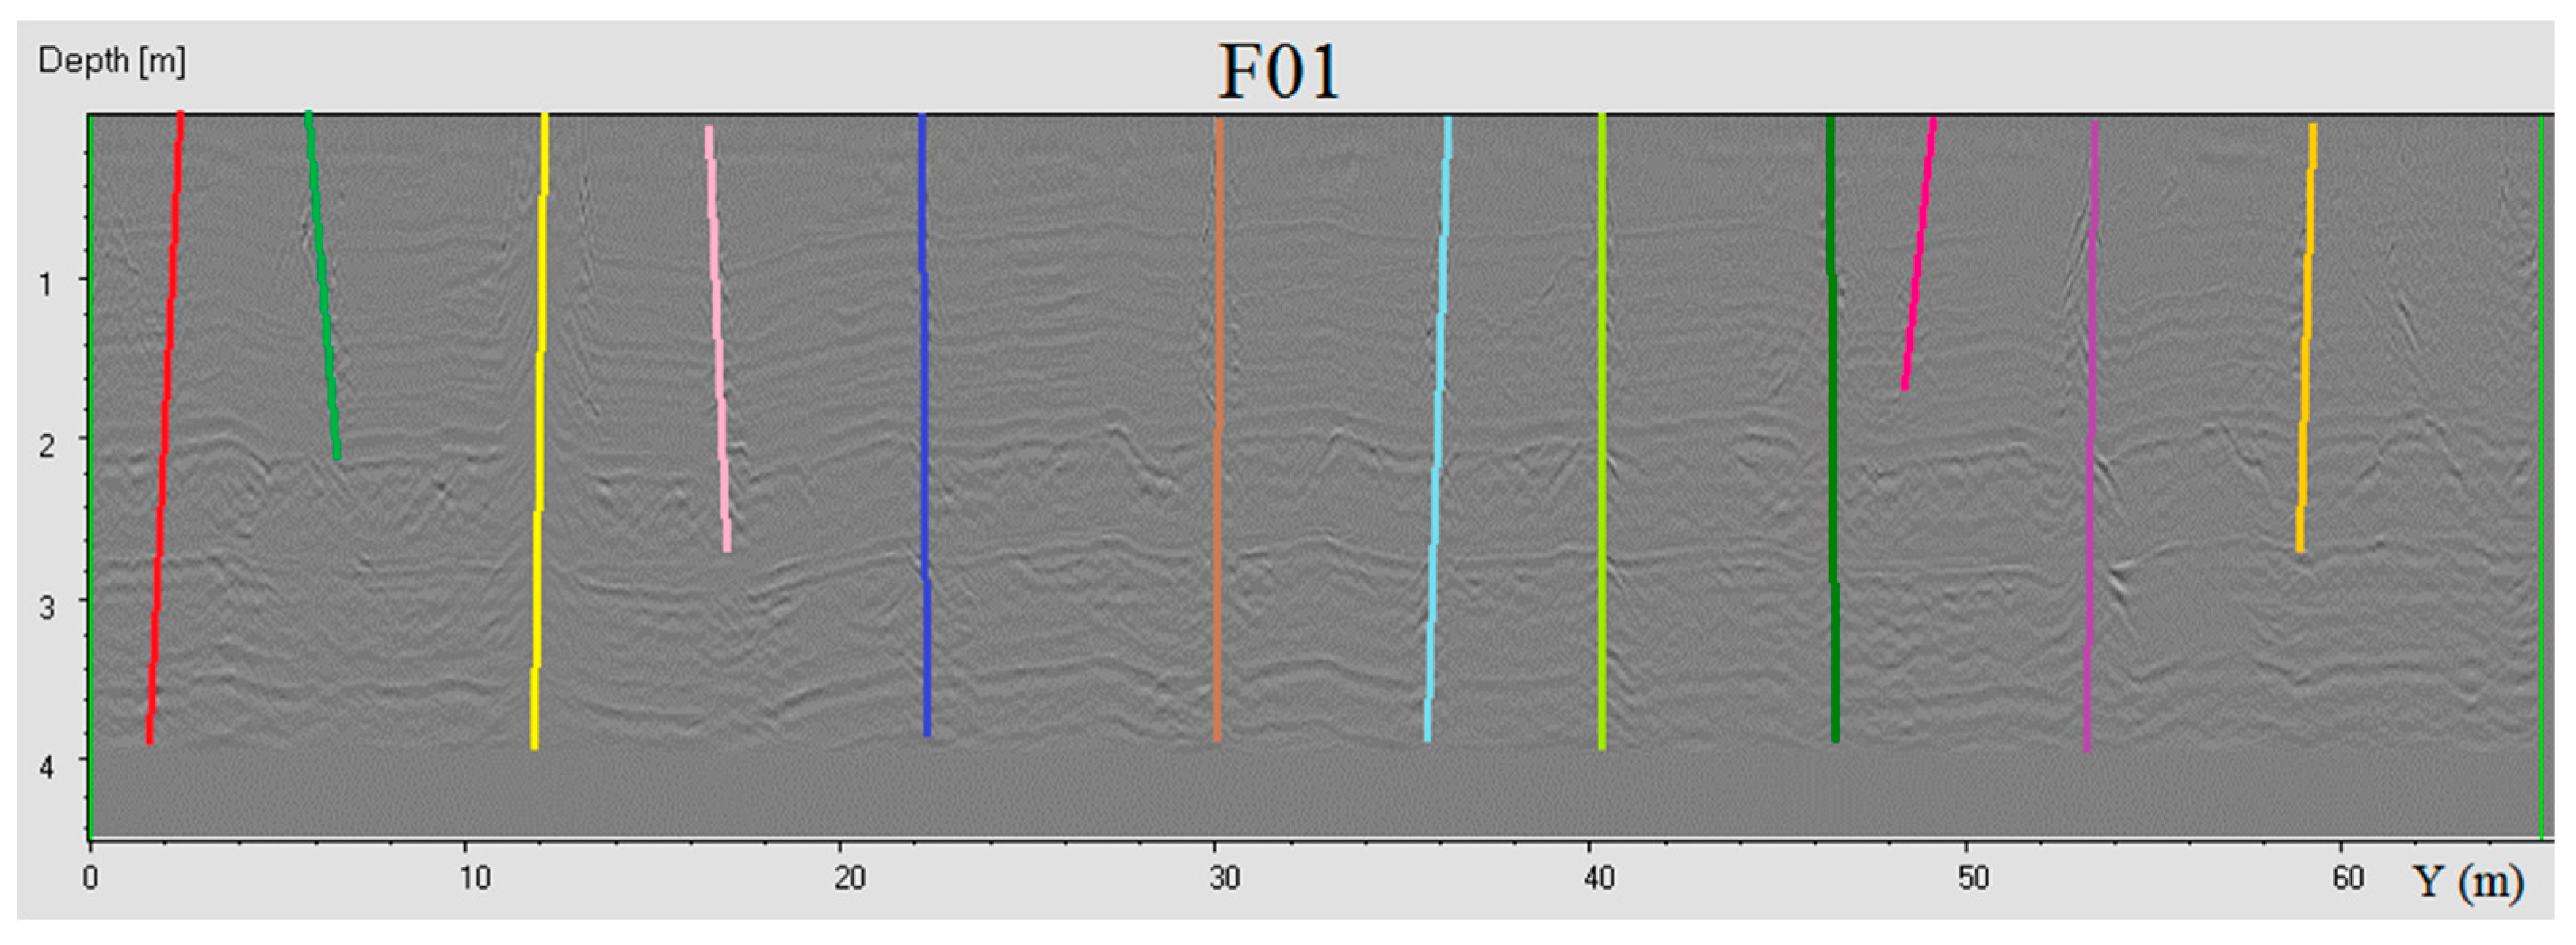
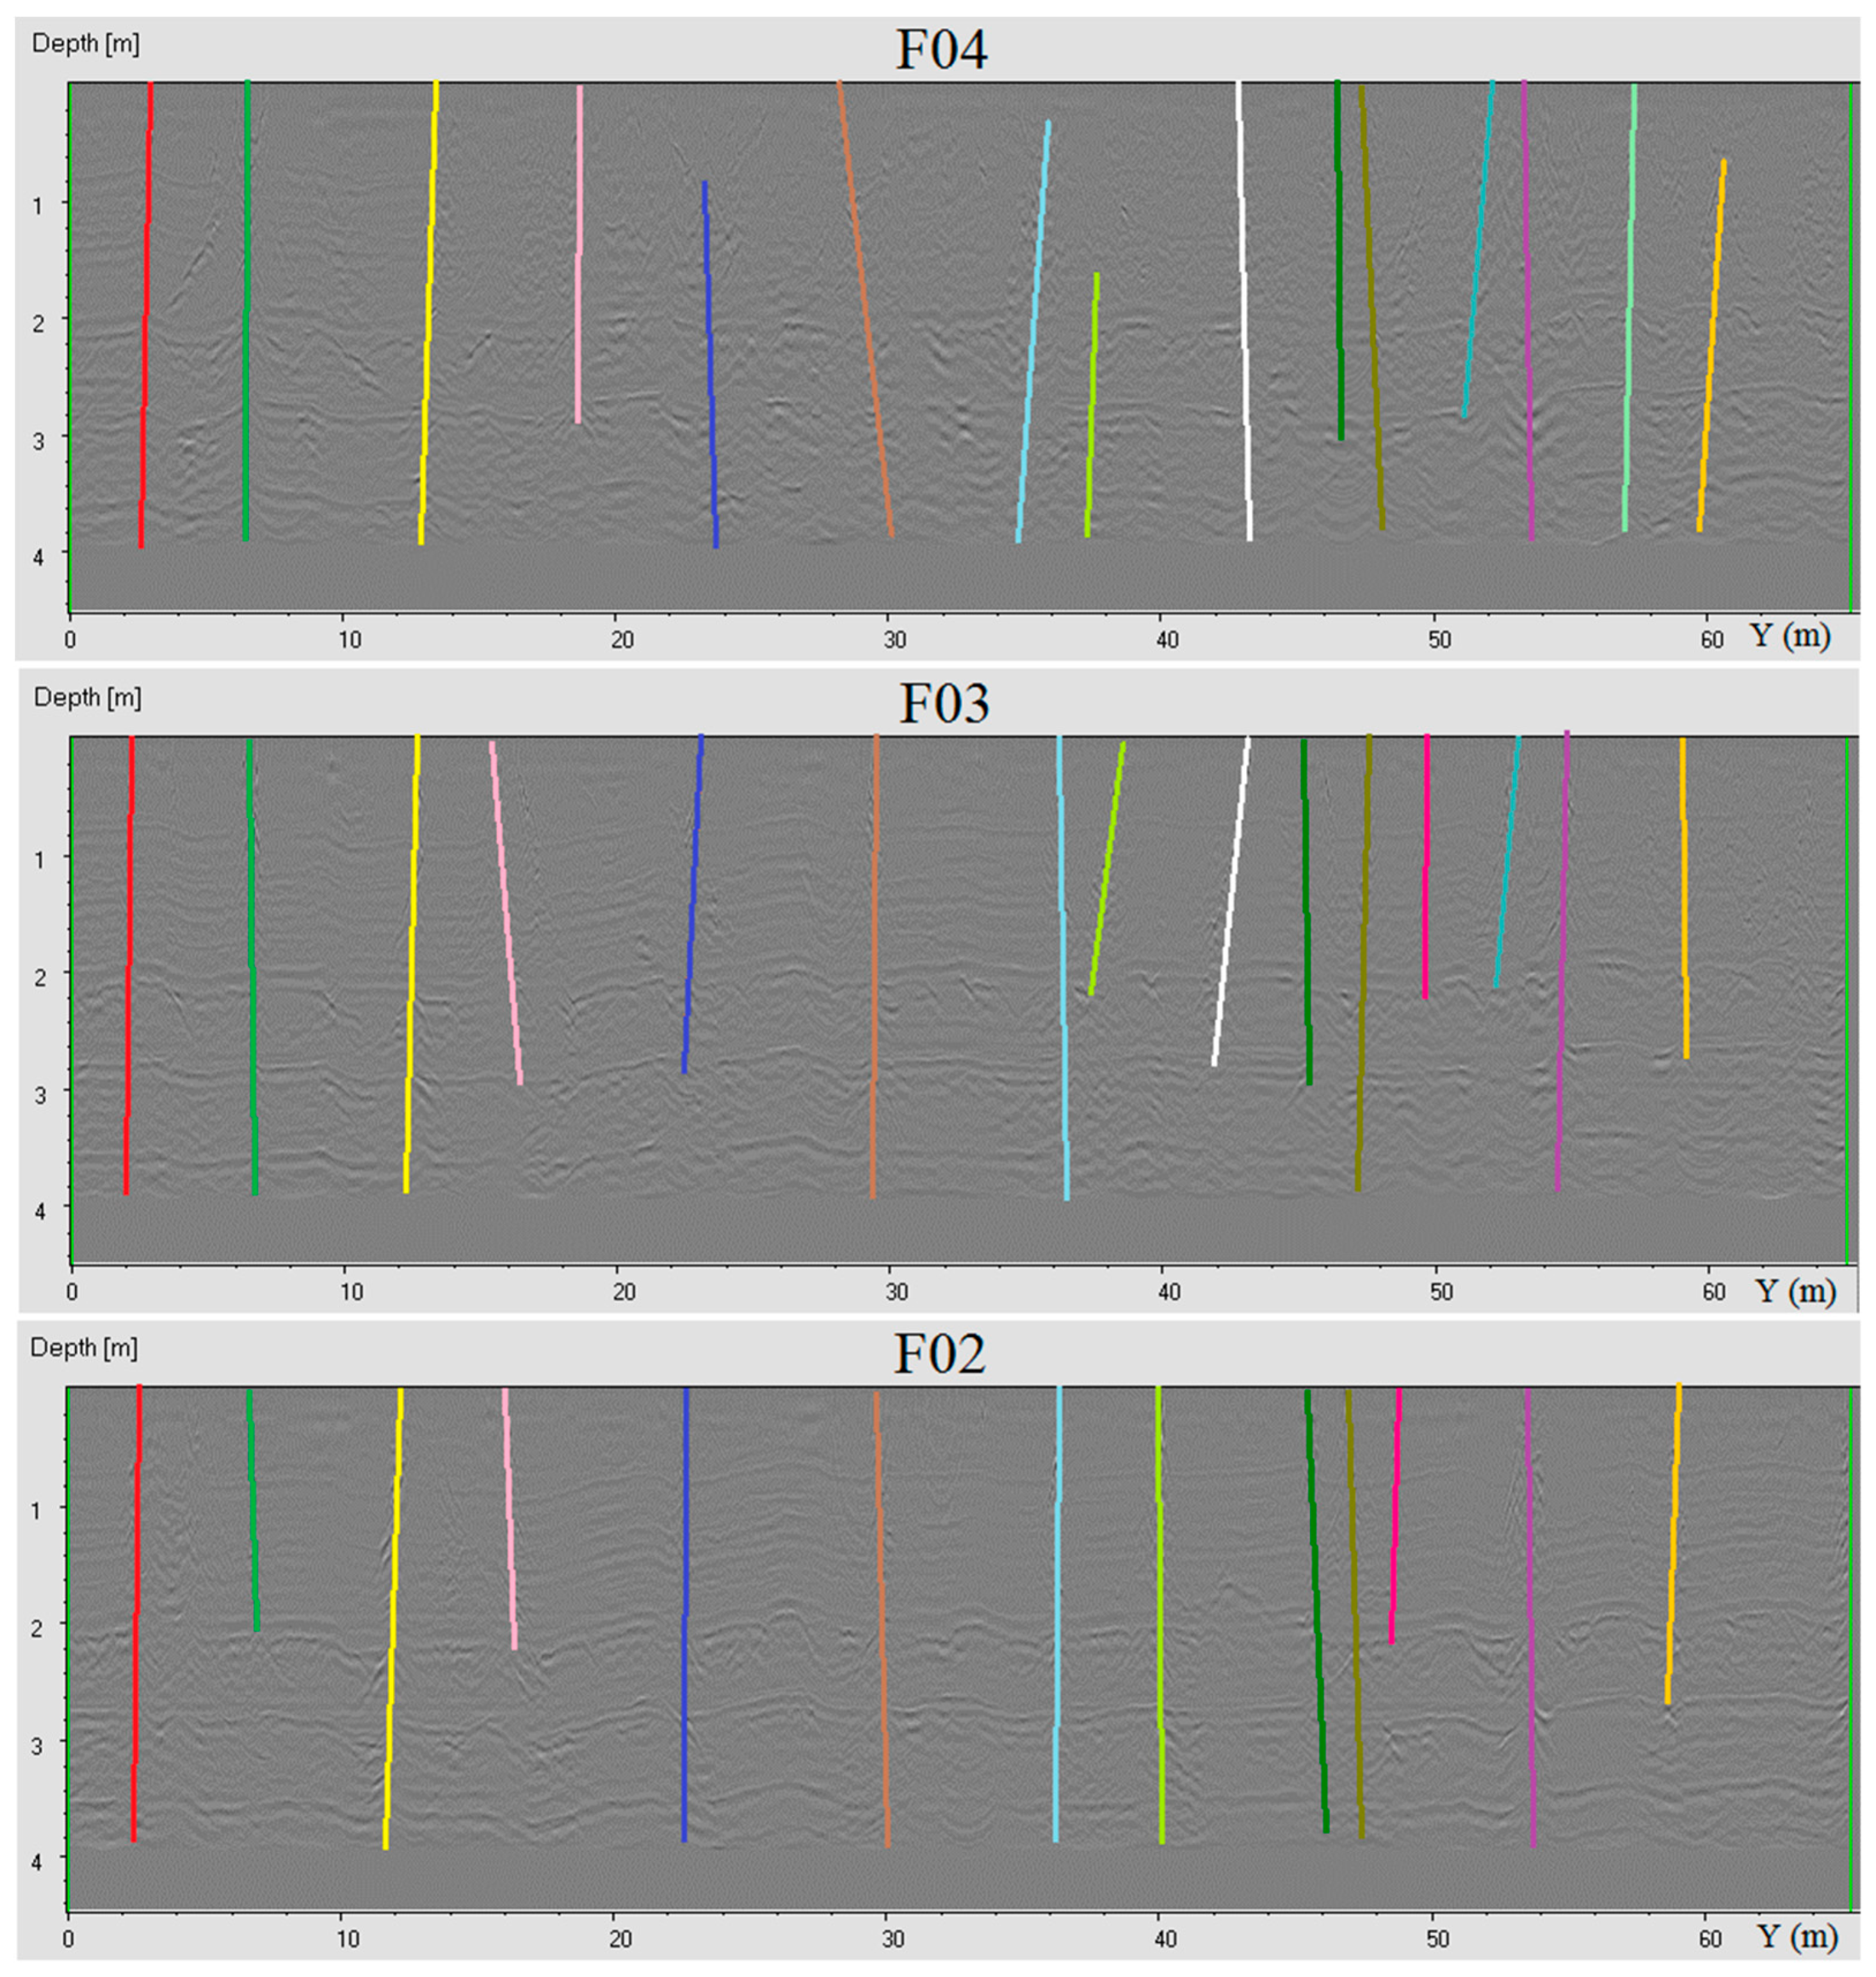
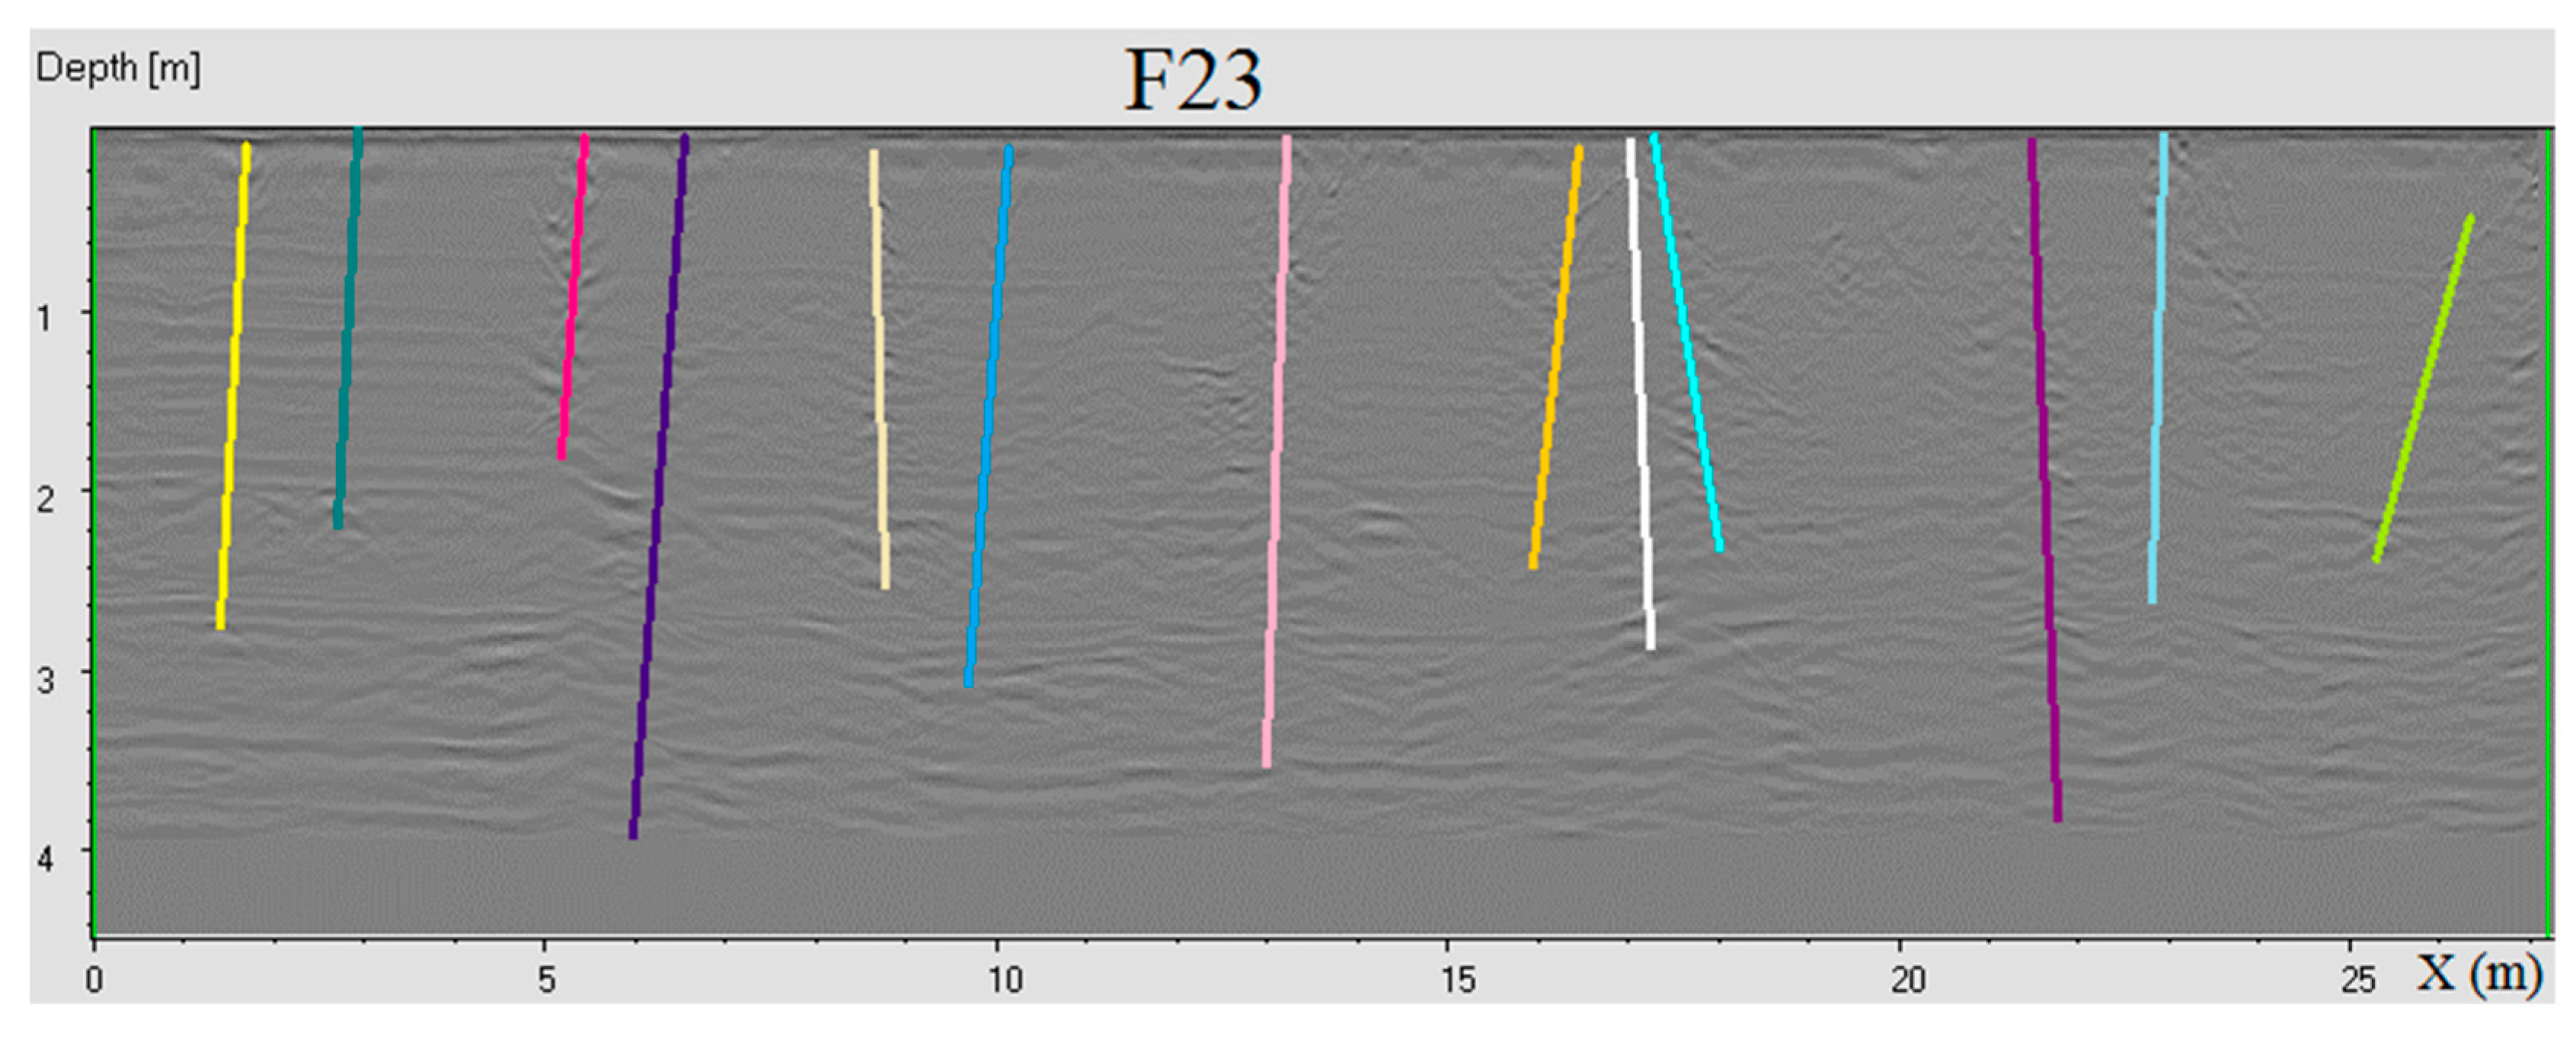
The interpretations of the fractures in the radargrams of the 700 MHz antenna in two volumes, in the X and Y directions, are provided below.
Figure A1.
Volume 1: The interpreted radargrams F01, F02, F03, and F04.
Figure A1.
Volume 1: The interpreted radargrams F01, F02, F03, and F04.
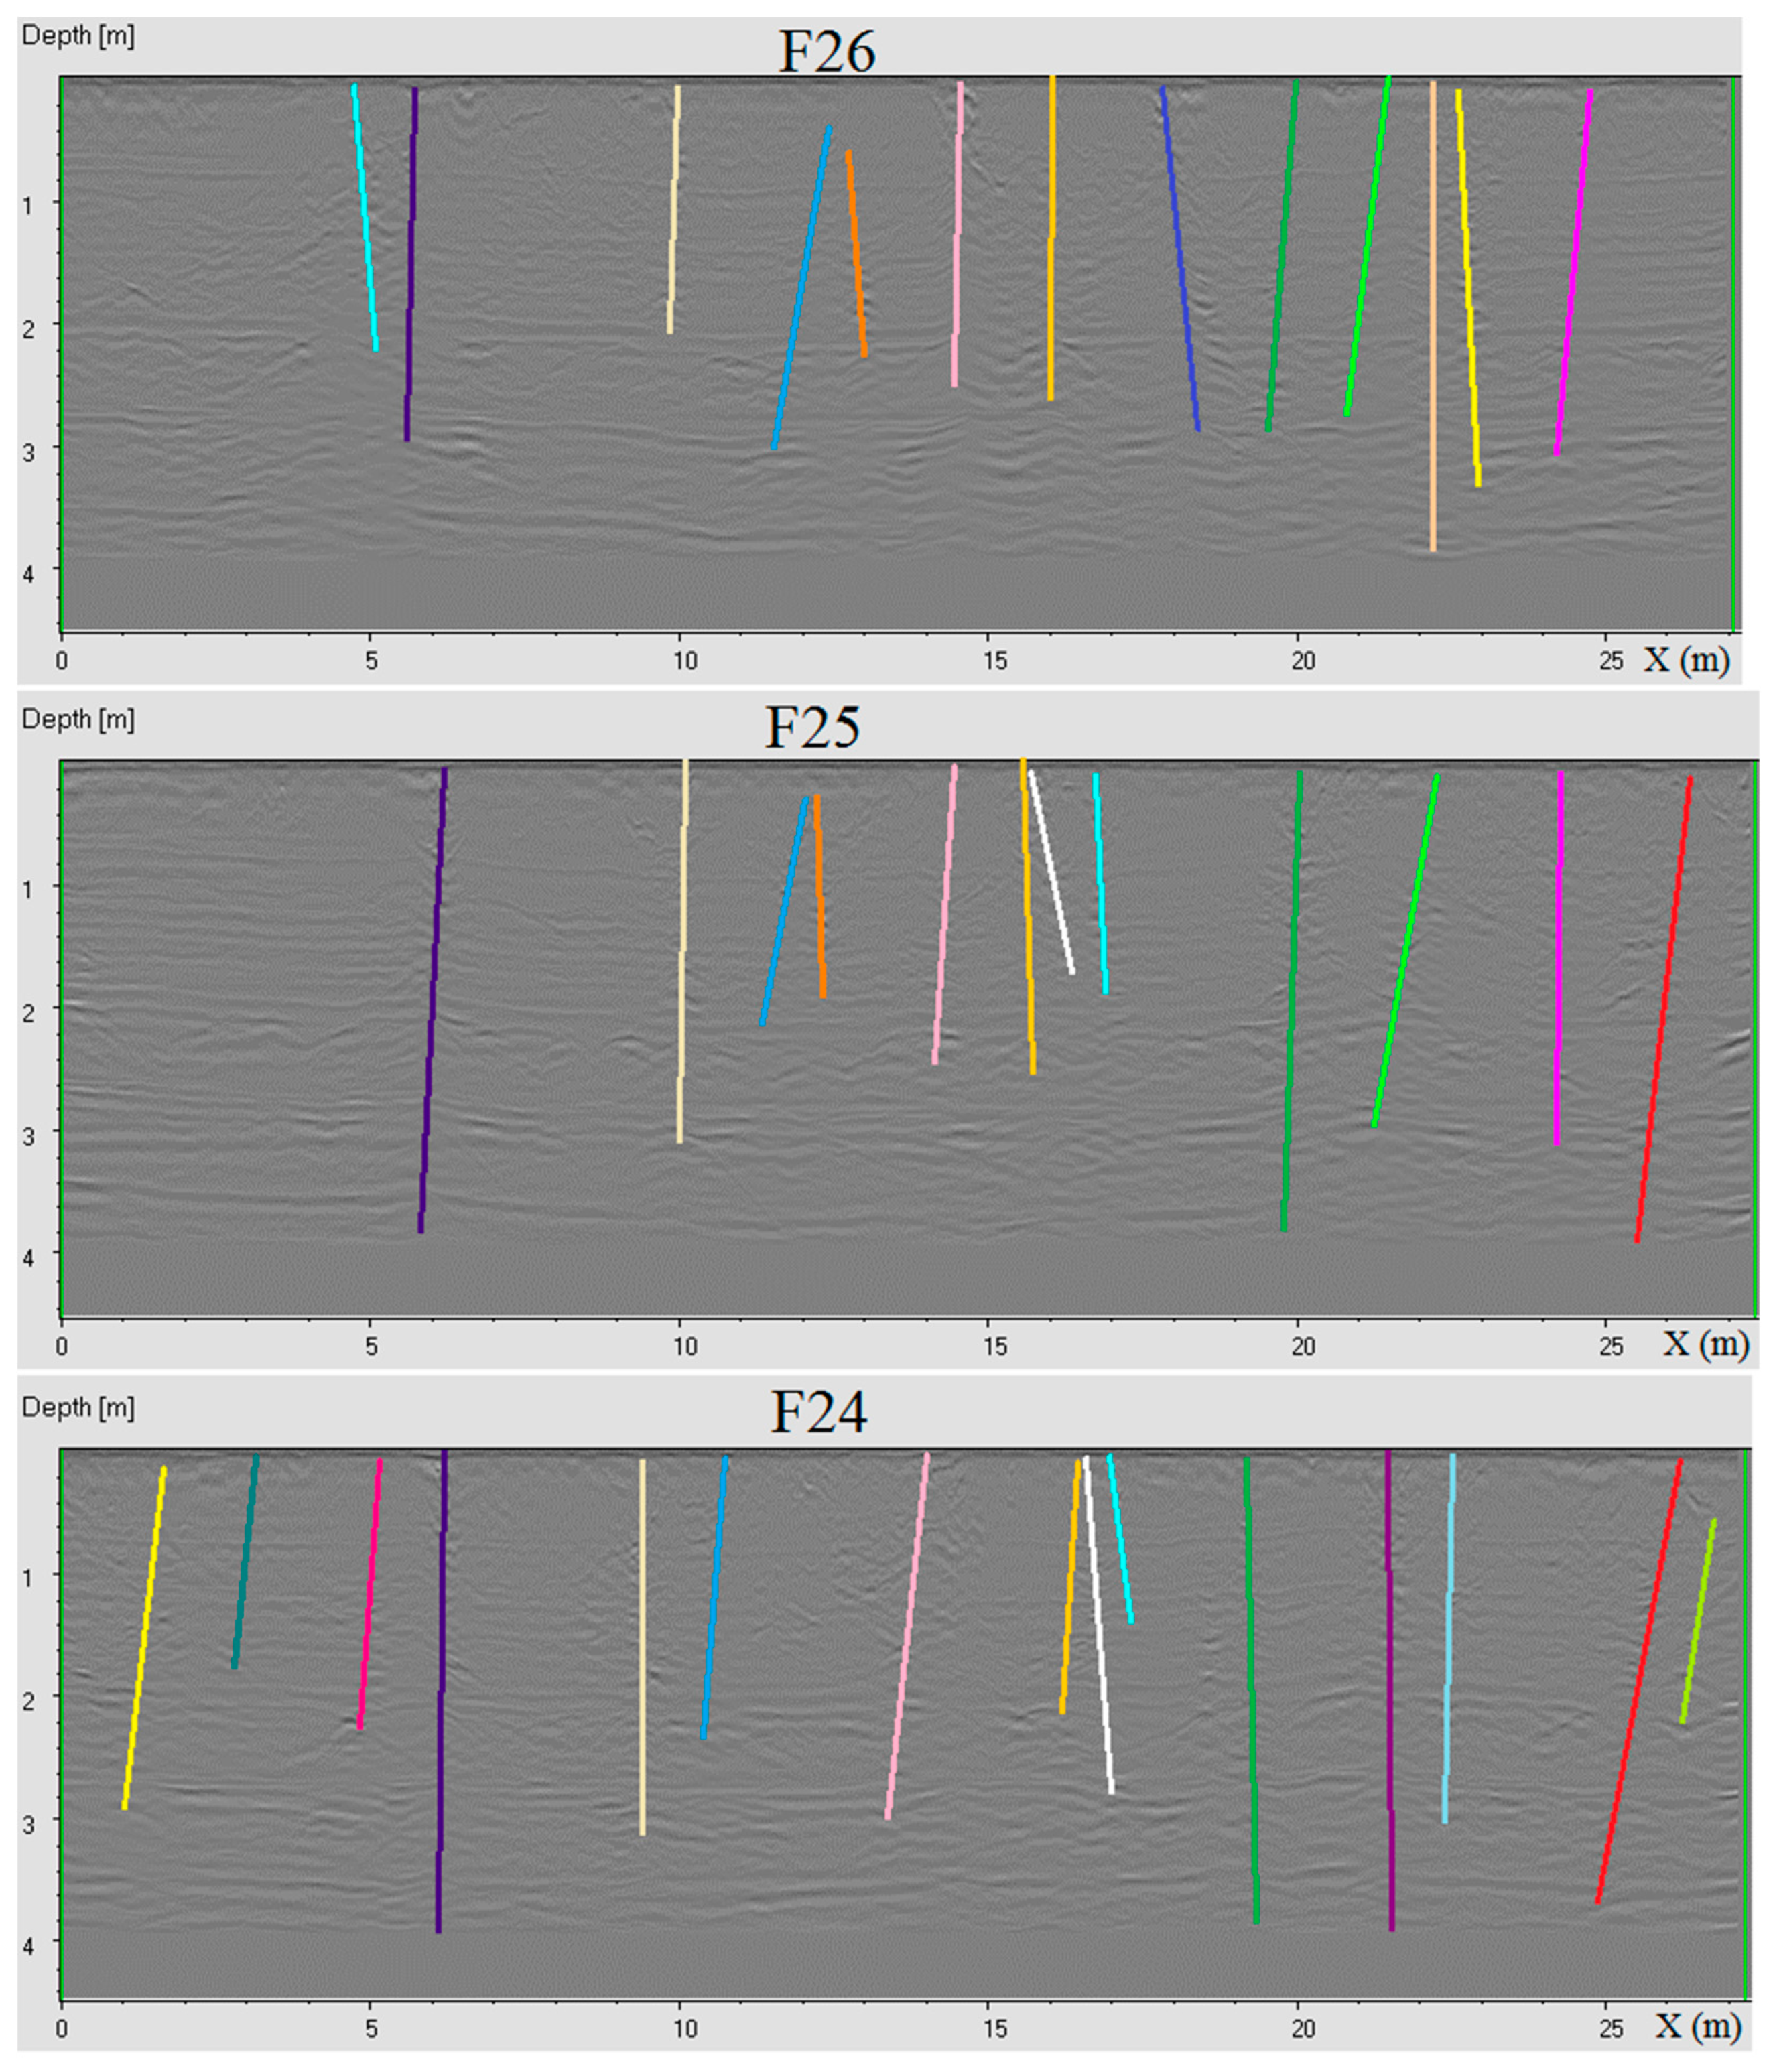
Figure A2.
Volume 7: The interpreted radargrams F23, F24, F25, and F26.
Figure A2.
Volume 7: The interpreted radargrams F23, F24, F25, and F26.
References
- Elkarmoty, M.; Colla, C.; Gabrielli, E.; Bonduà, S.; Bruno, R. Deterministic three-dimensional rock mass fracture modeling from geo-radar survey: A case study in a sandstone quarry in Italy. Environ. Eng. Geosci. 2017, 23, 314–331. [Google Scholar] [CrossRef]
- Gillespie, M.R.; Barnes, R.P.; Milodowski, A.E. British Geological Survey Scheme for Classifying Discontinuities and Filings; Keyworth: Nottingham, UK, 2011. [Google Scholar]
- Montani, C. Stone 2002—World Marketing Handbook; Gruppo Editoriale Faenza Editice: Faenza, Italy, 2003. [Google Scholar]
- Montani, C. Stone 2008—World Marketing Handbook; Gruppo Editoriale Faenza Editice: Faenza, Italy, 2008. [Google Scholar]
- Vidić, D.; Galić, I.; Farkaš, B. The profitability of dimension stone deposit exploitation in relation to the coefficient of utilization. Min.-Geol.-Pet. Eng. Bull. 2012, 25, 123–130. [Google Scholar]
- Galić, I.; Vidić, D.; Jembrich, Ž. The influence of the coefficient of utilization of reservoir feasibility of dimension stone production and improvement opportunities. Min. Geol. Bull. 2011, 15, 117–130. [Google Scholar]
- Zanzi, L.; Hojat, A.; Ranjbar, H.; Karimi-Nasab, S.; Azadi, A.; Arosio, D. GPR measurements to detect major discontinuities at Cheshmeh-Shirdoosh limestone quarry, Iran. Bull. Eng. Geol. Environ. 2017, 1–10. [Google Scholar] [CrossRef]
- Lualdi, M.; Zanzi, L. 2D and 3D experiments to explore the potential benefit of GPR investigations in planning the mining activity of a limestone quarry. In Proceedings of the Tenth International Conference on Ground Penetrating Radar (GPR2004), Delft, The Netherlands, 2004; pp. 613–616. [Google Scholar]
- Rey, J.; Martínez, J.; Vera, P.; Ruiz, N.; Cañadas, F.; Montiel, V. Ground-penetrating radar method used for the characterisation of ornamental stone quarries. Constr. Build. Mater. 2015, 77, 439–447. [Google Scholar] [CrossRef]
- Martínez, J.; Montiel, V.; Rey, J.; Cañadas, F.; Vera, P. Utilization of Integrated Geophysical Techniques to Delineate the Extraction of Mining Bench of Ornamental Rocks (Marble). Remote Sens. 2017, 9, 1322. [Google Scholar] [CrossRef]
- Seol, S.J.; Kim, J.-H.; Song, Y.; Chung, S.-H. Finding the strike direction of fractures using GPR. Geophys. Prospect. 2001, 49, 300–308. [Google Scholar] [CrossRef]
- Luodes, H.; Selonen, O.; Pääkkönen, K. Evaluation of dimension stone in gneissic rocks—A case history from southern Finland. Eng. Geol. 2000, 52, 209–223. [Google Scholar] [CrossRef]
- Elkarmoty, M.; Colla, C.; Gabrielli, E.; Bonduà, S.; Bruno, R. A combination of GPR survey and laboratory rock tests for evaluating an ornamental stone deposit in a quarry bench. Procedia Eng. 2017, 191, 999–1007. [Google Scholar] [CrossRef]
- Elkarmoty, M.; Colla, C.; Gabrielli, E.; Kasmaeeyazdi, S.; Tinti, F.; Bonduà, S.; Bruno, R. Mapping and modelling fractures using ground penetrating radar for ornamental stone assessment and recovery optimization: Two case studies. Min.-Geol.-Pet. Eng. Bull. 2017, 32, 63–76. [Google Scholar] [CrossRef]
- Elkarmoty, M.; Colla, C.; Gabrielli, E.; Bonduà, S.; Bruno, R. Application of low frequency GPR antenna to fractures detection and 3D visualization in a new quarry bench (E-poster). In Proceedings of the International Conference on Geophysics, Orlando, CO, USA, 6–7 October 2016. And Published Abstract in J. Geol. Geophys. 2016, 5, 47. [Google Scholar] [CrossRef]
- Luodes, H.; Sutinen, H. Evaluation and modelling of natural stone rock quality using Ground Penetrating Radar (GPR). In Geoscience for Society: 125th Anniversary Volume; Nenonen, K., Nurmi, P.A., Eds.; Special Paper 49; Geological Survey of Finland: Espoo, Finland, 2011; pp. 83–90. [Google Scholar]
- Porsani, J.L.; Sauck, W.A.; Júnior, A.O.S. GPR for mapping fractures and as a guide for the extraction of ornamental granite from a quarry: A case study from southern Brazil. J. Appl. Geophys. 2006, 58, 177–187. [Google Scholar] [CrossRef]
- Arosio, D.; Deparis, J.; Zanzi, L.; Garambois, S. Fracture characterization with GPR: A comparative study. In Proceedings of the 16th International Conference Ground Penetrating Radar, Hong Kong, China, 13–16 June 2016. [Google Scholar] [CrossRef]
- Arosio, D.; Munda, S.; Zanzi, L. Quality control of stone blocks during quarrying activities. In Proceedings of the 14th International Conference Ground Penetrating Radar, Shanghai, China, 4–8 June 2012; pp. 822–826. [Google Scholar] [CrossRef]
- Arosio, D. Rock fracture characterization with GPR by means of deterministic deconvolution. J. Appl. Geophys. 2016, 126, 27–34. [Google Scholar] [CrossRef]
- Elkarmoty, M.; Tinti, F.; Kasmaeeyazdi, S.; Bonduà, S.; Bruno, R. 3D modeling of discontinuities using GPR in a commercial size ornamental limestone block. Constr. Build. Mater. 2018, 166, 81–86. [Google Scholar] [CrossRef]
- Daniels, D.J. Ground Penetrating Radar; The Institute of Electrical Engineers: London, UK, 2004. [Google Scholar]
- Reynolds, J.M. An Introduction to Applied and Environmental Geophysics; John Wiley & Sons, Ltd.: West Sussex, UK, 2011. [Google Scholar]
- Yelfm, R.J. Application of ground penetrating radar to civil and geotechnical engineering. Electromagn. Phenom. 2007, 7, 103–117. [Google Scholar]
- Grandjean, G.; Gourry, J.C. GPR data processing for 3D fracture mapping in a marble quarry (Thassos, Greece). J. Appl. Geophys. 1996, 36, 19–30. [Google Scholar] [CrossRef]
- Grasmueck, M. 3-D ground-penetrating radar applied to fracture imaging in gneiss. Geophysics 1996, 61, 1050. [Google Scholar] [CrossRef]
- Grasmueck, M.; Quintà, M.C.; Pomar, K.; Eberli, G.P. Diffraction imaging of sub-vertical fractures and karst with full-resolution 3D Ground-Penetrating Radar. Geophys. Prospect. 2013, 61, 907–918. [Google Scholar] [CrossRef]
- Reina, A.; Loi, M. Environmental background in Apricena quarries (Apulia, Southern Italy). In Engineering Geology for Society and Territory—Volume 5. Urban Geology, Sustainable Planning and Landscape Exploitation; Lollino, G., Manconi, A., Guzzetti, F., Culshaw, M., Bobrowsky, P., Luino, F., Eds.; Springer International Publishing: Cham, Switzerland, 2015; pp. 1–1400. [Google Scholar] [CrossRef]
- Maerz, N.H.; Aqeel, A.M.; Anderson, N. Measuring orientations of individual concealed sub-vertical discontinuities in sandstone rock cuts integrating ground penetrating radar and terrestrial LIDAR. Environ. Eng. Geosci. 2015, XXI, 293–309. [Google Scholar] [CrossRef]
- Elkarmoty, M.; Colla, C.; Gabrielli, E.; Papeschi, P.; Bonduà, S.; Bruno, R. In-situ GPR test for three-dimensional mapping of the dielectric constant in a rock mass. J. Appl. Geophys. 2017, 146, 1–15. [Google Scholar] [CrossRef]
- Cassidy, N.J. Electrical and magnetic properties of rocks, soils and fluids. In Ground Penetrating Radar Theory and Applications; Elsevier: Amsterdam, The Netherlands, 2009; pp. 41–72. [Google Scholar] [CrossRef]
- Bourke, P. PLY-Polygon File Format. 2011. Available online: http://paulbourke.net/dataformats/ply/ (accessed on 19 March 2018).
- ParaView Website. n.d. Available online: http://www.paraview.org/ (accessed on 1 May 2018).
Figure 1.
(a) A map of Italy showing the location of Poggio Imperiale (Google Maps), (b) A panoramic view of the quarry; the blue star refers to the surface of the bench under study.
Figure 1.
(a) A map of Italy showing the location of Poggio Imperiale (Google Maps), (b) A panoramic view of the quarry; the blue star refers to the surface of the bench under study.
Figure 2.
A view of the studied bench (under the arrow) highlighting the two sets of out-cropping fractures in two large normal rock faces. The orientation of the rock face, where Set 2 is highlighted in the figure, is parallel to the studied bench face.
Figure 2.
A view of the studied bench (under the arrow) highlighting the two sets of out-cropping fractures in two large normal rock faces. The orientation of the rock face, where Set 2 is highlighted in the figure, is parallel to the studied bench face.
Figure 3.
A left-side view of the bench face where horizontal layers were observed visually (named a, b, c, and d).
Figure 3.
A left-side view of the bench face where horizontal layers were observed visually (named a, b, c, and d).
Figure 4.
The Ground Penetrating Radar (GPR) survey design. The blue arrows refer to the direction of the survey lines.
Figure 4.
The Ground Penetrating Radar (GPR) survey design. The blue arrows refer to the direction of the survey lines.
Figure 5.
The GPR unit used, and the indications of points A and B on the bench surface.
Figure 5.
The GPR unit used, and the indications of points A and B on the bench surface.
Figure 6.
Histogram of the propagation velocities measured through the fitting hyperbola method. The propagation velocities in the X axis of the chart were plotted in a bin of 4.0 Mm/s.
Figure 6.
Histogram of the propagation velocities measured through the fitting hyperbola method. The propagation velocities in the X axis of the chart were plotted in a bin of 4.0 Mm/s.
Figure 7.
Graphical illustration of the volumes used for the interpretation (top view).
Figure 7.
Graphical illustration of the volumes used for the interpretation (top view).
Figure 8.
The antenna bumping effect shown through an example extracted from the first six meters of radargram F13 (original length equal to 65 m). (a) Radargram F13 processed without data migration, showing the hyperbolic diffractions of a sub-vertical fracture surface highlighted in the yellow rectangle. The blue rectangles refer to the zone of the antenna bumping. (b) The radargram after data migration. (c) Interpretation of the fracture surface. The reflection in the bumping zone is not considered.
Figure 9.
(a) Radargram F03 processed without any interpretation; (b) Radargram F03 processed with the interpretation of the detected layering (black dashed lines) and the detected sub-vertical fractures (different colors).
Figure 9.
(a) Radargram F03 processed without any interpretation; (b) Radargram F03 processed with the interpretation of the detected layering (black dashed lines) and the detected sub-vertical fractures (different colors).
Figure 10.
The 3D fracture model visualized in two different orientations inside the surveyed bench body. Vertex A of the survey grid is indicated in the model. The bedding planes were filtered for better visualization of the fracture model.
Figure 10.
The 3D fracture model visualized in two different orientations inside the surveyed bench body. Vertex A of the survey grid is indicated in the model. The bedding planes were filtered for better visualization of the fracture model.
Table 1.
The volumes used for the interpretation.
Table 1.
The volumes used for the interpretation.
| Volume | Radargrams | Direction |
|---|
| 1 | F01-F02-F03-F04 | Y |
| 2 | F05-F06-F07-F08 | Y |
| 3 | F09-F10-F11-F12 | Y |
| 4 | F13-F14 | Y |
| 5 | F15-F16-F17-F18 | X |
| 6 | F19-F20-F21-F22 | X |
| 7 | F23-F24-F25-F26 | X |
| 8 | F27-F28-F29-F30 | X |
| 9 | F31-F32-F33-F34 | X |
Table 2.
The thickness of the detected rock layers.
Table 2.
The thickness of the detected rock layers.
| Rock Layer | from Z(m) to Z(m) | Thickness (m) |
|---|
| layer a | 0.0 m–0.8 m | 0.8 m |
| layer b | 0.8 m–2.0 m | 1.2 m |
| layer c | 2.0 m–2.8 m | 0.8 m |
| layer d | 2.8 m–3.6 m | 0.8 m |
© 2018 by the authors. Licensee MDPI, Basel, Switzerland. This article is an open access article distributed under the terms and conditions of the Creative Commons Attribution (CC BY) license (http://creativecommons.org/licenses/by/4.0/).

 ,
, 


