Article

High Resolution Drone Surveying of the Pista Geoglyph in Palpa, Peru

Department of Geomatics, Faculty of Civil Engineering, Czech Technical University in Prague, Thakurova 7, Prague 6 16629, Czech Republic
*
Author to whom correspondence should be addressed.
Geosciences 2018, 8(12), 479; https://doi.org/10.3390/geosciences8120479
Submission received: 3 November 2018 / Revised: 8 December 2018 / Accepted: 10 December 2018 / Published: 13 December 2018

Abstract

:
Currently, satellite images can be used to document historical or archaeological sites in areas that are distant, dangerous, or expensive to visit, and they can be used instead of basic fieldwork in several cases. Nowadays, they have final resolution on 35–50 cm, which can be limited for searching of fine structures. Results using the analysis of very high resolution (VHR) satellite data and super resolution data from drone on an object nearby Palpa, Peru are discussed in this article. This study is a part of Nasca project focused on using satellite data for documentation and the analysis of the famous geoglyphs in Peru near Palpa and Nasca, and partially on the documentation of other historical objects. The use of drone shows advantages of this technology to achieve high resolution object documentation and analysis, which provide new details. The documented site was the “Pista” geoglyph. Discovering of unknown geoglyphs (a bird, a guinea pig, and other small drawings) was quite significant in the area of the well-known geoglyph. The new data shows many other details, unseen from the surface or from the satellite imagery, and provides the basis for updating current knowledge and theories about the use and construction of geoglyphs.

1. Introduction

Remote sensing and Google Earth using satellite images became an instrument for archaeological documentation and research at the beginning of the new millennium [1]. New types of multispectral and stereoscopic data with very high resolution are an important source of data; in many projects, Google Earth can be used as a tool for the searching of new potential archaeological sites. The long-term usage of an aerial archaeological survey is very popular. RPAS (remotely piloted aircraft system) also known as UAV (unmanned aircraft vehicle) or drones, are nowadays gaining importance [2]. Very high resolution (VHR) satellite data with a ground sampling distance (GSD) better than 1 m have been at disposal for civilian purposes since 1999. They support a new analytical possibility in archaeology and historical object documentation. Current civilian satellite images with GSD 0.35–1.0 m in panchromatic or pan-sharpened images serve as a perfect source for the documentation of known objects or finding possible newly detected archaeological sites or objects [3]. Satellite imagery can be used in some cases instead of basic fieldwork for searching for new objects and generally for documentation or mapping of an area of interest. Our possibility to detect a new object from satellite data ends in the case of linear objects by their thickness at 30–50 cm (0.7–1.0 pixels), in the case of 3D or point objects, some pixels (depend on object, but at least four pixels) are necessary for statistically appropriate detection. This means that linear objects with a thickness smaller than 30 cm and a point object smaller than 50 cm in diameter are invisible to us and for this reason unknown. Outputs with a better GSD can be obtained using aerial methods; however, they are not at their disposal or they are too expensive for small projects in many countries. There is a gap between remotely sensed data with GSD 50 cm and GSD 5 cm; however, the better resolution can be important in special cases—e.g., searching of fine details in orthophoto or in shaded digital surface model.
This problem can solve use of RPAS (remotely piloted aircraft system or simple “drones”), they typically provide data with a GSD better than 5 cm. It has been possible to use data from RPAS since 2010. However, it is not easy to use it in some cases, because of a meteorological, safety, or bureaucratic point of view. However, surface large archaeological objects are very well visible from height such as subsurface objects based on crop marks [3,4,5,6,7].
In particular, they are objects that are not overshadowed by growing vegetation—i.e., object in desert or semi-desert areas. Such an area is Peru, where more advanced civilizations existed in the dry coastal areas before the conquest.

1.1. Geoglyphs and Lines: State-of-the-Art

Near Nasca city, approximately 400 km southeast from the Peruvian capital city Lima (Figure 1), there is a famous archaeological area, which contains thousands of world-known geoglyphs and lines. The Nasca city is located 40 km from the Pacific coast in a dry landscape, interwoven with fertile valleys with occasional rivers. The first scientific information about geoglyphs and lines in Peruvian desert was brought by P. Kosok, who later collaborated with M. Reiche. Dr. Maria Reiche, a charismatic scientist born in Dresden/Germany, worked in the Peruvian desert near Nasca city to document and explain interesting geoglyphs and lines in the city neighbourhood since WW II. Based on her work, the Nasca lines and geoglyphs were added to the UNESCO (United Nations Educational, Scientific and Cultural Organization) world heritage list in 1995 and they are preserved by Peruvian law [8,9,10,11]. Other areas were not under auspices of law and they are in very bad condition, such as cases [10,11]. The origin of geoglyphs and lines is not clear, with many scientists and laics trying to explain the origin and reason [11,12]. The main hypothesis, which attempts to explain the origin of geoglyphs and lines, talks about the astronomical reason (calendar) [8,9,12], the designation of water resources [13], and religious rituals [9,14,15,16]. There are also technical theories that they were areas for weaving or spinning long ropes [17,18,19]. There are also bizarre theories about extra-terrestrials, pre-Columbian Olympia games, art, etc. [11,20].
Some lines and objects were analysed as astronomically oriented [8,9,11,12,20,21,22,23], with many lines or geoglyphs neither of known origin nor original use. It is not the goal to argue about the origin or purposes of geoglyphs; however, the result of detailed documentation may serve other professionals [16]. Unfortunately, simply explained theories are always sought. Apparently, there is no uniform use of geoglyphs and lines, which is due to long-term land use. It should be noted that the geoglyphs are of different types and they could have been created by different civilizations, which used geoglyphs and lines differently. From both, the satellite imagery and the ground survey, it is obvious that they previously covered a much larger area, which was later destroyed by the episodes of El Niño; line remnants or erosion scars are visible in the area. Thanks to the still intact area that resists El Niño, the geoglyphs and lines remain visible in the Nasca neighbourhood, but they are still threatened [11,24].
Thanks to the scientific work of M. Reiche [9,10] and the popular books of E. von Däniken [20], geoglyphs and lines around Nasca and Palpa have become world-renowned. They have come to the forefront of the interest of historians, archaeologists, cartographers, and experts from other disciplines. A major breakthrough in knowledge occurred after 2000, when commercially available satellite imagery with sub-meter resolution was already available [25].
Geoglyphs and lines have been investigated by all available methods. Significant is the “Nasca GIS” project at the Dresden University of Applied Sciences [21] or documentation of Palpa geoglyphs and lines from aerial images [26]. Many other projects have used optical VHR satellites in the form of orthophoto or DSM (digital surface model [27,28], it can be created from at least two different image data sets based on image correlation technique) [29]. Other projects have focused on the use of radar recordings from satellites and creating of digital relief model (DRM) using InSAR technology (an interferometric analysis of SAR data) [30,31,32].
Of course, ground research was also done. The German (M. Reindl and others) [33], Italian (G. Orefici, N. Massini, R. Lasaponara, and others) [14] and American (Ch. Conley and others) [34] archaeological missions have been working in this locality in cooperation with Peruvian archaeologists (J. Isla, director of Management for the Territory of Nasca and Palpa and others) [35] and conservation experts from INC (Instituto Nacional de Cultura del Perú). However, the archaeologists are more concerned with excavations (objects, cities, pyramids, and graves), and not geoglyphs and lines, which are especially surface structures that cannot be routinely excavated and examined by classical archaeological methods (perhaps only the possibility of surface collections of potsherds that are almost everywhere). For this reason, conservators, geographers, cartographers, and, in general, other scientists are focused more on geoglyphs and lines; of course, cooperation with archaeologists is necessary. There are hypotheses that connect geoglyphs and lines with excavations (e.g., the Nazca culture center Cahuachi near Nasca city) [14].
Terrestrial research has focused on documentation and protection of geoglyphs and lines, but also on the technology of their creation and associated with their problematic dating. Some projects have also used geophysical methods. In the last decade, there was a great boom in the use of unmanned aerial vehicles (drones) that allow safe and low-cost mapping of individual parts in this area. Their official use is often problematic in terms of different permissions and subordination [5,3,36]. There is a general problem connected with scientific documentation of geoglyphs: what is old and original and what is new (falsification, graffiti, etc.). Graffiti (names, new themes) are, of course, recognizable. A big problem is dating of geoglyphs and lines. It is not simple, as they were made from purely natural materials; simply by removing the upper eroded and oxidized material thereby a light background was exposed. It is even harder to attribute the geoglyphs to a historical epoch. The situation, when it is necessary to define a historical epoch, is even more complicated (Nasca and Palpa region was inhabited by several civilizations). Typically, the iconography—likeness of desert drawings with drawings on dated ceramic or textile findings is used for basic dating. Based on different sources, the Nazca culture is dated from 200 BC to about AD 800, the Paracas culture approximately between 1200 BC and 100 BC [11,35,37]. Physical dating using archaeological findings (ceramics, wooden parts, etc.) on geoglyphs and lines is not certain—these findings may have no connection with geoglyphs and lines. Even archaeological finds on geoglyph such as tombs or constructions cannot define the epoch of geoglyphs because they can be from a different time. However, geoglyphs and lines may even come from different periods (exact dating of all geoglyphs and lines is not possible until now). The recently presented method—the use of thermoluminescence—might accurately determine the age of some geoglyphs. Especially optically stimulated thermoluminescence technology, that was founded by the University of Heidelberg, may be effective [38]. Based on the analysis of samples taken directly from geoglyphs, their relative age was calculated. The principle is the time of exposure of individual stones to sunlight when the solid material was moved. Sample material was taken on geoglyphs’ faces from their sides under the surface—original material was shaded by the upper layer. Some examples have an age of tens of thousands of years, and are therefore the natural movements of the alluvial area, while others show an age of change in their last position between [38,39,40].

1.2. HTW-CTU Project
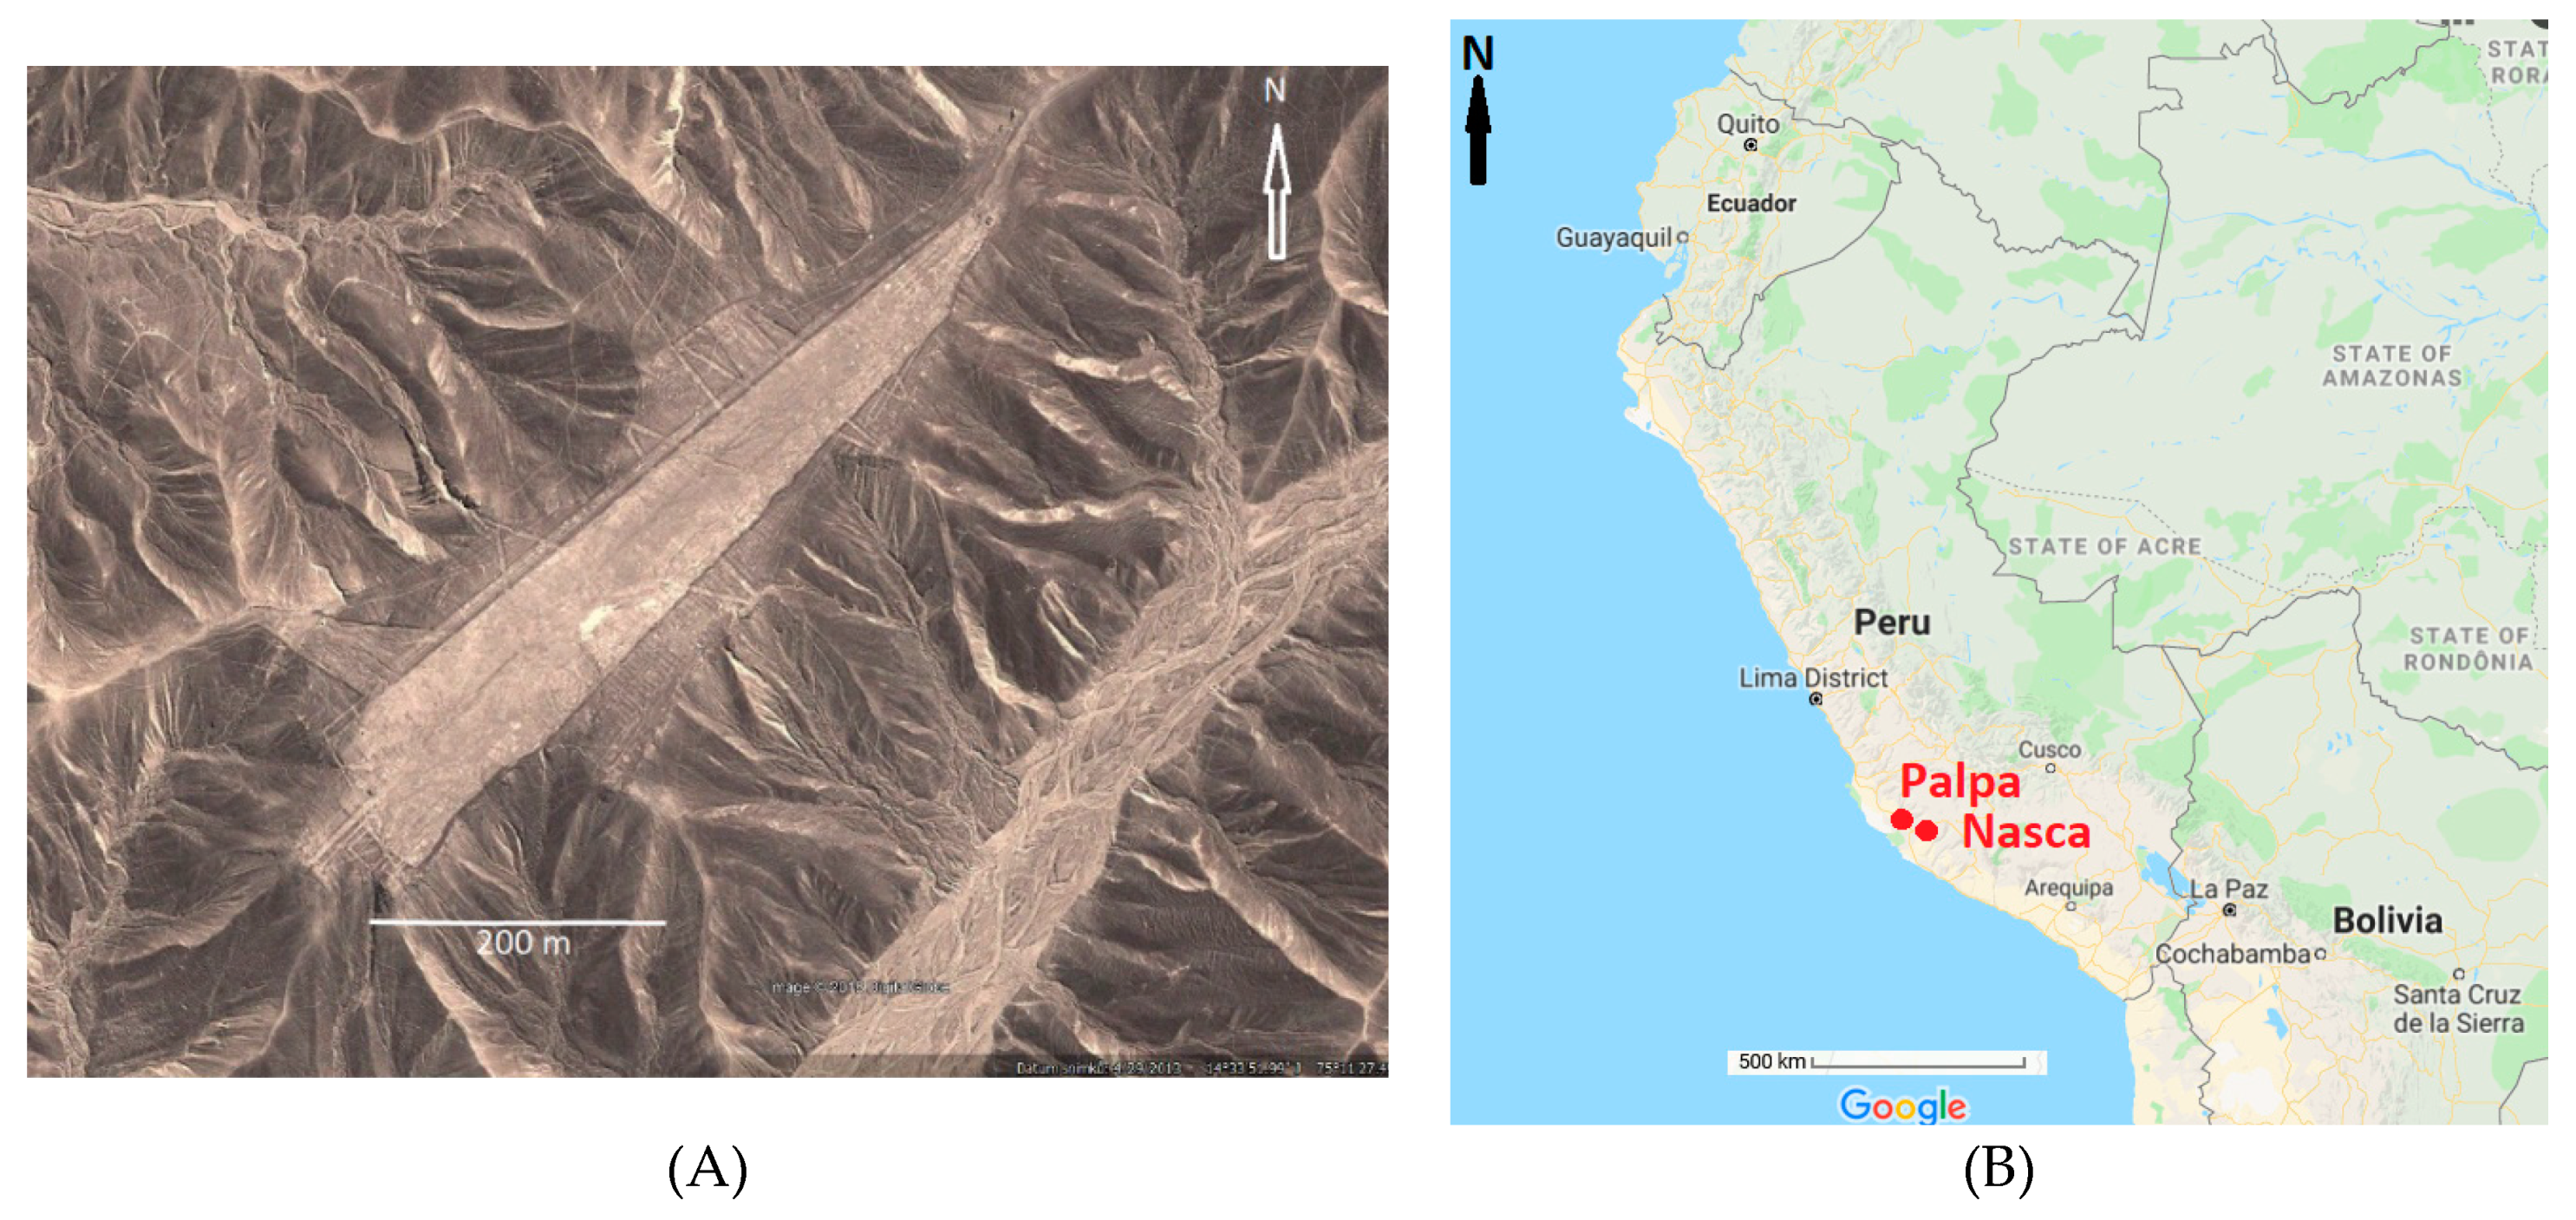
In 1994, the Maria Reiche Association was established in Dresden, Germany. The main goal was to extend and continue the science work of Dr. Maria Reiche in the Nasca and Palpa regions. To extend Maria Reiche’s work, several expeditions to the Nasca region in Peru were done. In 1995, the Nasca project started at the Dresden University of Applied Sciences (HTW Dresden, B. Teichert, and Ch. Richter). The main goals of the Nasca project are to collect information from Nasca cultural heritage site and its neighbourhood and to store and preserve it in a digital form [5,21].
At the CTU in Prague (Czech Technical University), a long-term research for the use of drones started in 2011. The main goals were developing and testing of low-cost photogrammetrical technology for the mapping and monitoring of small areas, such as the documentation of archaeological sites [2,4]. In this project, many types of drones were tested und used. Multicopters are very good at small local areas or objects modelling (like historical constructions) [36]; winged drones seem to be better at the mapping of larger areas [2,4].
In 2004, a German—Czech cooperation on the documentation of historical objects and monuments in Peru was started. After many expeditions, the team has collected a lot of scientific material. VHR images were used as an important basic material in the research and documentation of objects and possible astronomical orientations of geoglyphs and lines in Peru [1,8,11,12]. In 2016, a small German (HTW Dresden)—Czech (CTU in Prague) expedition to the Nasca and Palpa neighbourhood took place. The main project aim was the documentation of aqueducts [5], based on collaboration with the Nasca town hall. In the frame of this project, the measurement of the geoglyph Pista was done as the second project goal using EBee drone (Figure 2).
Some known geoglyphs are not visible in satellite images because of their contrast and width in decimetres only. If there are some known but invisible geoglyphs or lines, there should also be unknown geoglyphs or lines because of their width, place and extent.

2. Study Area

The additional project of our small expedition in 2016 was a detailed documentation of the selected large area geoglyph. For this purpose, a geoglyph with the local name “Pista” (the Llipata site, Nr. PP01-36) was selected. It is a few kilometers away from Palpa city in a mountainous, dry, stony landscape (Figure 1). The Pista geoglyph is a trapezoid at first glance but after zooming it consists of many other elements (zig-zag lines, spiral, other lines) [26,40,41,42,43]. Individual elements overlap, which leads us to believe that the shape of the geoglyph evolved over a longer time period. Its area is really large (0.5 km2), on the first impression it acts as an artificially flattened mountain peak. Similar geoglyphs are nearby (for example, just above the cemetery of Palpa). As the protection of these geoglyphs is not significant, they are damaged by modern graffiti; on the geoglyphs above the Palpa cemetery there are tracks after huaqueros—grave robbers (we think that these graves were probably not a part of the original geoglyph; as ordinary graves are usually not situated on the geoglyphs) [11].

2.1. Investigation of Geoglyphs and Lines near Palpa

Many projects have dealt with archaeological research near Nasca and Palpa using aerial or satellite data [14,15,16,25,27,28,30,43,44]. It is logical, that more projects were connected to the more famous Pampa de Nazca. The last comprehensive documentation specialized on Palpa geoglyphs and lines using aerial data was conducted in 2006 [26,28,33]. A photo set of black-and-white aerial photographs taken by photogrammetric company in nineties of twentieth century was used. As a partial result, an orthophoto with GSD 28 cm and vector maps of all geoglyphs in Palpa area were created (Figure 3). Even before the era of the drones started, the archaeological settlement near Palpa had been documented using a remote-controlled helicopter in 2004 [3].

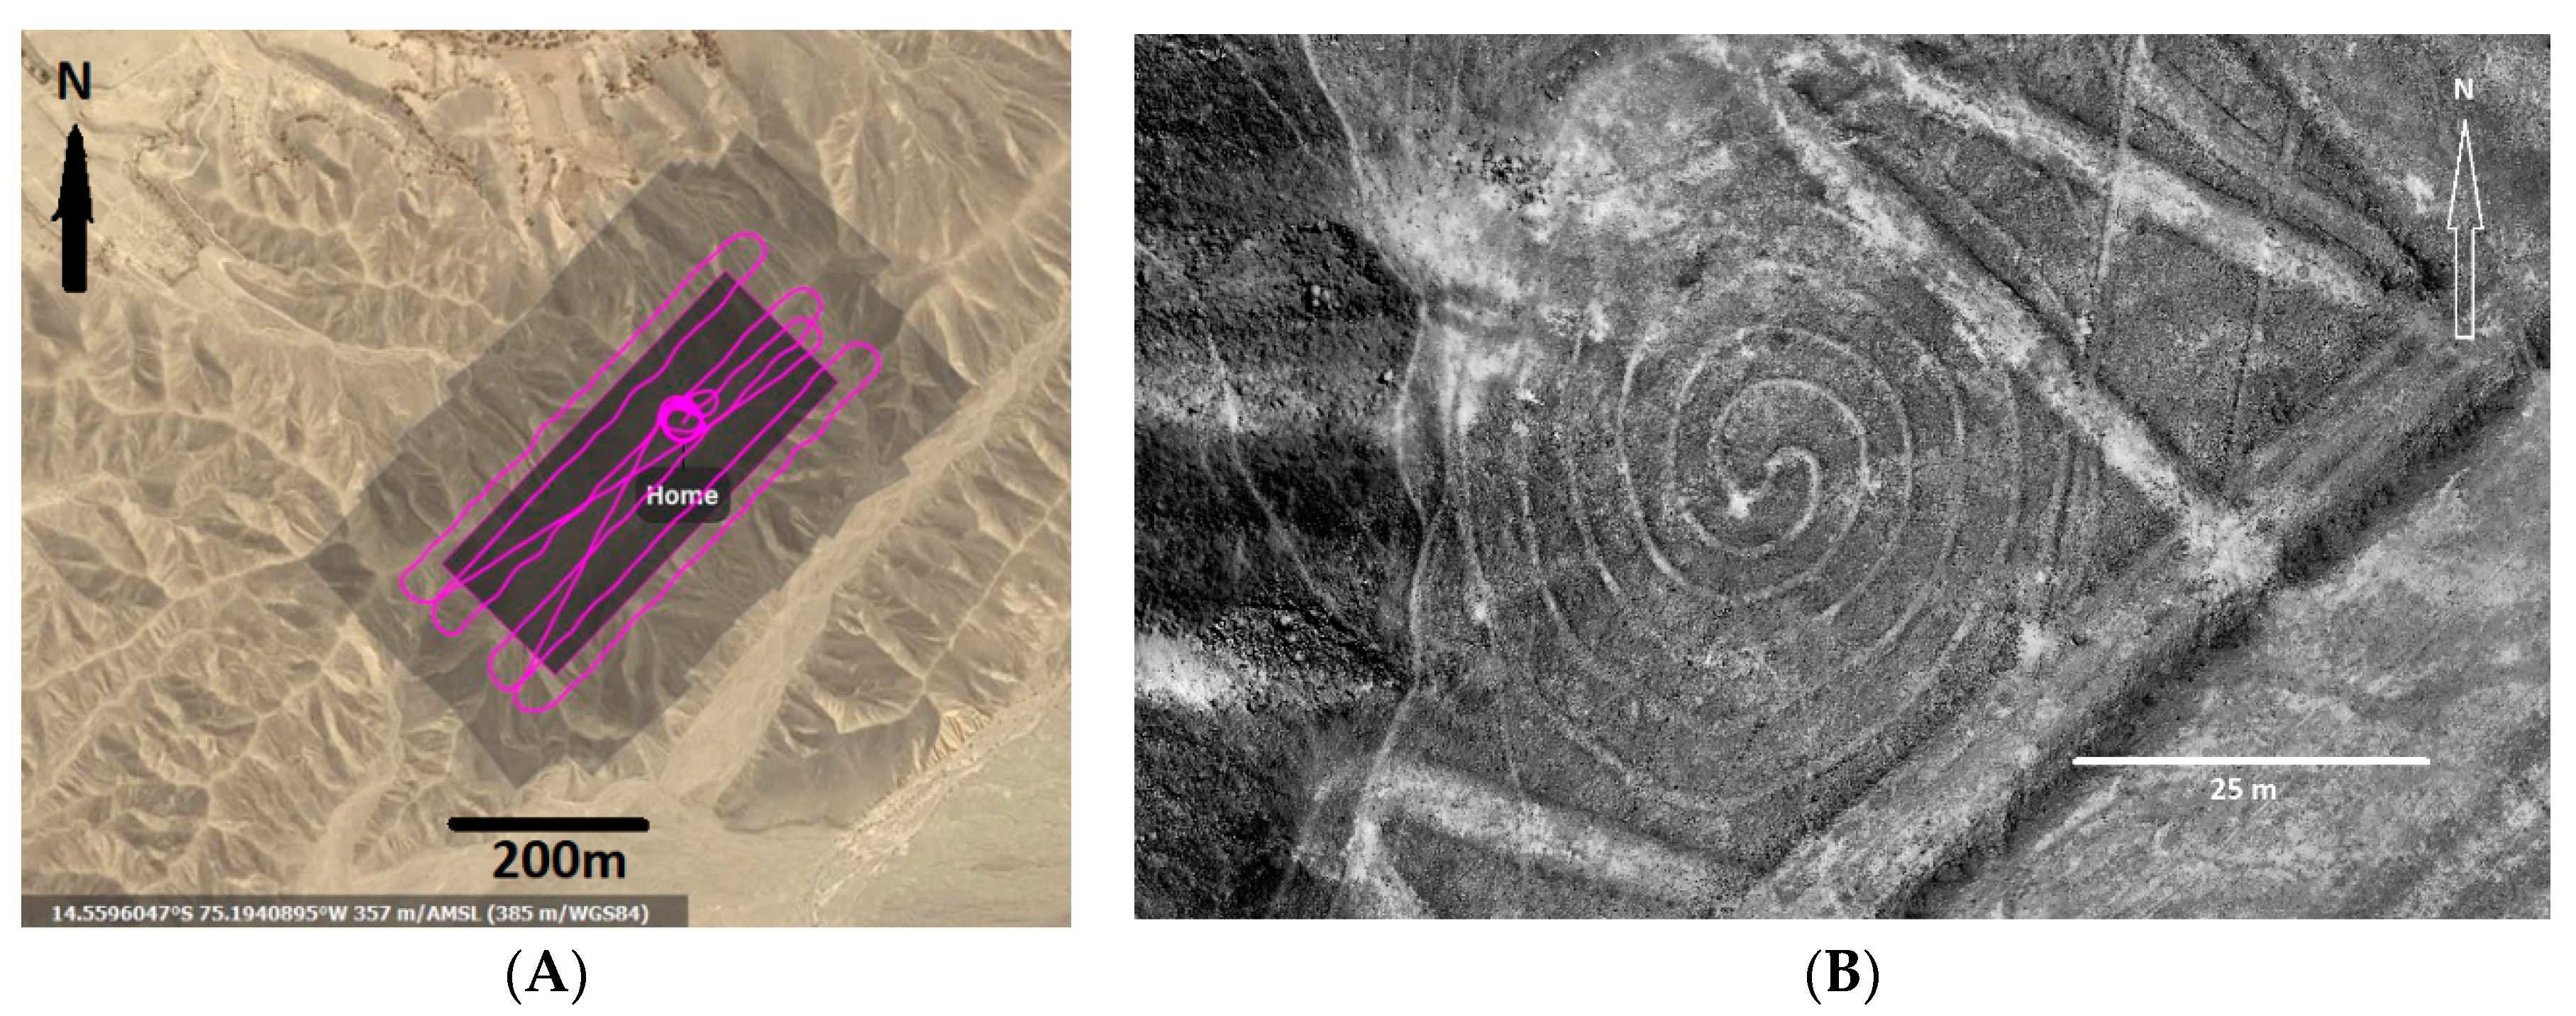
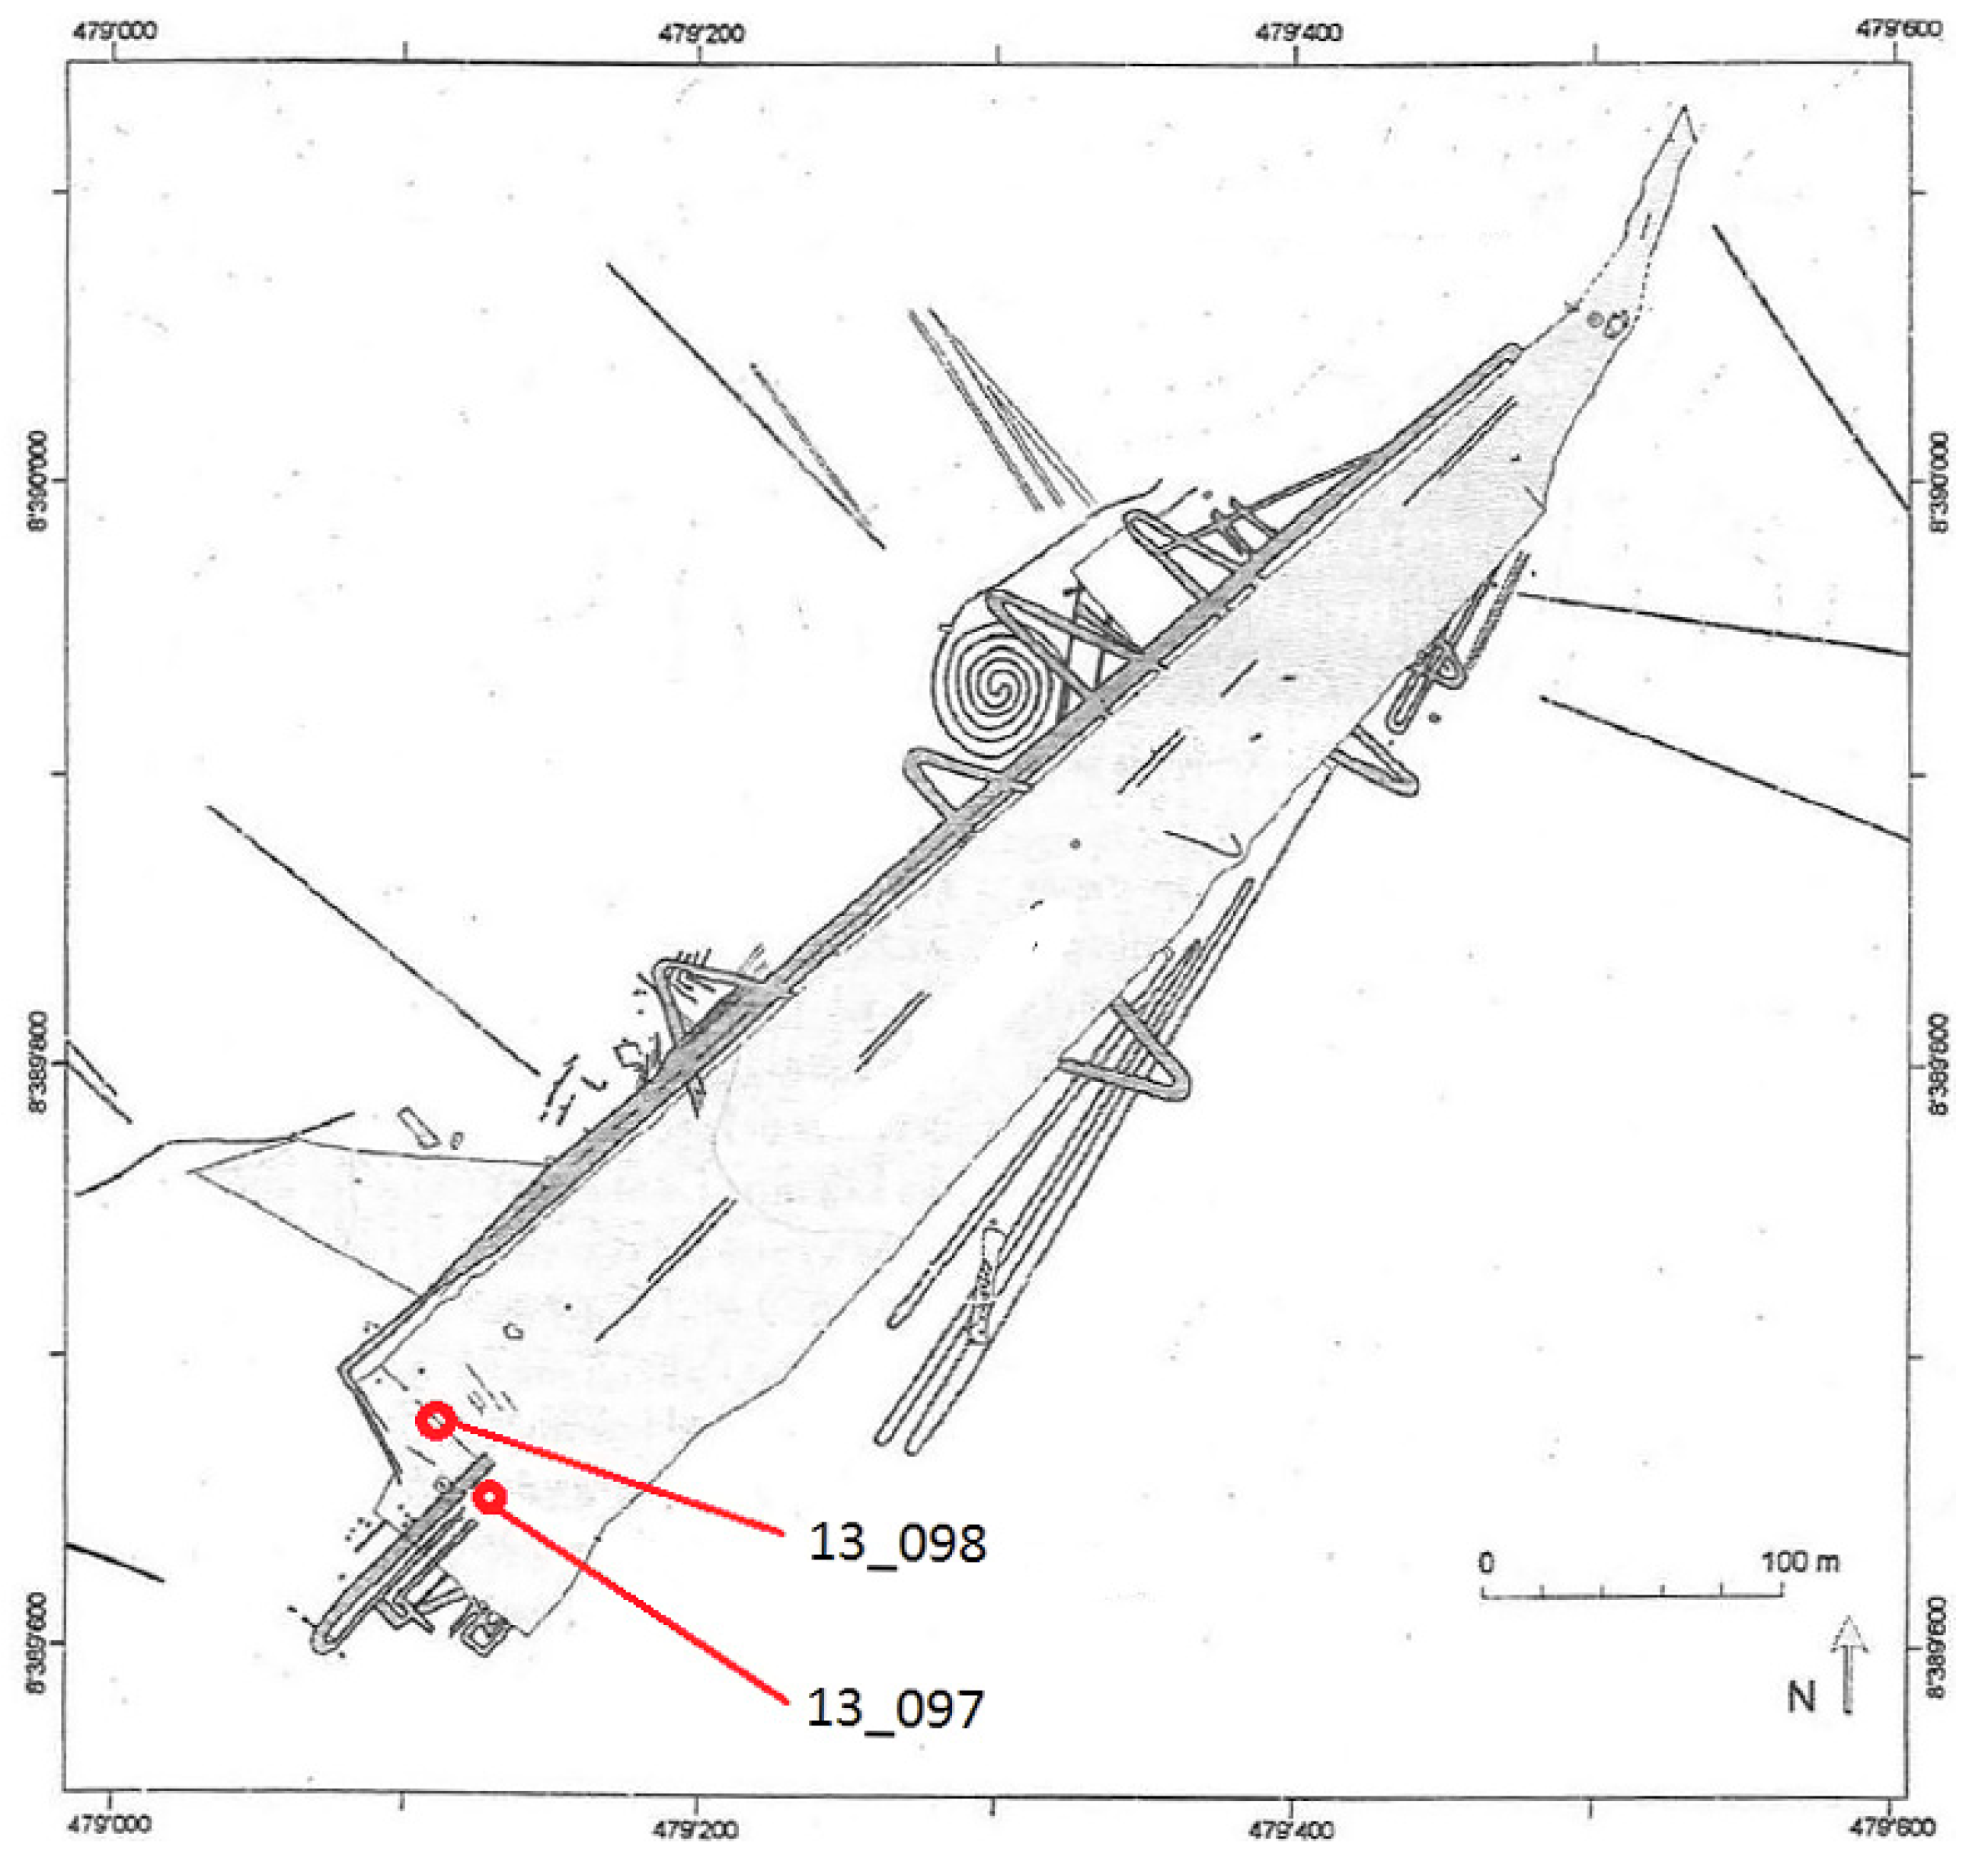
2.2. Pista Geoglyph Past Survey and Research

Geoglyph Pista (the Llipata site, PP01-36) has been researched several times. Complex research has been carried out by prominent archaeologists, who speak about “Open-air temples” [33,34,35,43]. The theory is based on the archaeological excavations of the small stone hills on the Pista geoglyph, where ceramic finds and remains of Spondylus shells linked to rituals associated with water were found [40,41,43]. These finds support the opinion that this site was used for ceremonies for a certain period.
However, there are several similar trapezoids in the neighbourhood of Pista geoglyph. From the technical point of view, an appropriate access road or staircase for a large number of people to the ceremonial site should be visible, but nothing similar was found (maybe, it should be a triangular part on the north-west part of geoglyph, but it is questionable). This is the argument for other researchers who claim that the area was not intended for a large number of people. For example, J. Sonnek considers the trapezoids to be a technical work for spinning ropes [11,17,18]. He demonstrates it with practical tests and experiments.
A geophysical (magnetometric) research has been used within archaeological and conservation research. The result has not shown unknown subsurface features like unknown constructions, but older stratigraphic layers of the geoglyph constructional could be detected [38,40,41]. Some places with traces of fire were found [41]. It explains in particular the geology of the substrate. It is also worth mentioning that DDSM (differential digital surface model—the subtraction output of original DSM and filtered DSM) technology based on drone survey detected significant erosion of the Pista geoglyph. Comprehensive documentation of geoglyphs and lines in the Palpa area dealt with older and newer projects that used aerial images and later also satellite imagery [3,27,35]. It can be said that most of the larger geoglyphs and lines have already been discovered; so unknown objects are probably only remaining objects that are under the resolution of satellite images or classic aerial data. The newest technology uses drones [2,5]. The success of drone mapping, survey method and discovering of new objects is documented by this article based on our work in 2016 and other recent findings of geoglyphs near Palpa city using a multicopter in 2018 [3,4,37].

2.3. Dating of Geoglyphs near Palpa

There were some geoglyphs investigated near Palpa city. Logical procedures (younger geoglyphs lie over the older ones), or iconographic similarities can be typically used for the dating. There are also physical dating methods—thermoluminescence and 14C isotope analysis. In the case of the “Pista” geoglyph (the Llipata site, PP01-36, Figure 1), the age was calculated as a time span between 100 BC and 1100 AD [11,38,40,42]. Age variation is widespread; ages of the possible last exposure to Sun-radiation point to multiple cultures (Paracas, Nasca, and Wari culture) [39,42]. An additional dating is based on 14C method and correlated to the period 1360–1410 AD [39,40]. Dating using 14C is an acknowledged method, but the analysed artefacts cannot be 100% matched with the geoglyph. This is evident from the findings when their age variance is considerable. It certainly depends on the analysed sample [11,42]. For other geoglyphs in the neighbourhood (Goddess of fertility and Cerro Carrapo) it was the time span of between 1100 AD and 1560 AD [11,38,40,41,42]. This would not support the often quoted hypothesis that geoglyphs were created by Nazca cultures (the peak of which had occurred around 400–600 AD) and the older Paracas culture [38], and it would indicate that different types of geoglyphs are fundamentally different in nature, that they originated in different cultures and served therefore for a variety of purposes [11]. Some wooden artifacts could have been brought to the geoglyph later. One cannot eliminate possible material recycling—in a dry climate with a low number of timbers it was certainly possible to use the material several times. It cannot be assumed that organic residues (wood, corn residues) would reach the geoglyph by wind or water (geoglyph is a sort of high plateau). Dispersion in dating can mean that the area was used diversely for many centuries.
Other research [38,39] based on thermoluminiscence also shows that some geoglyphs near Palpa (San Ignatio and Sacramento) can be from the period 450–650 AD, which corresponds with pottery found [35,37,40], late Nazca culture and with frequent opinion of some scientists [38,42,43]. However, the thermoluminescence method has an error margin of up to several hundred years. The problem of finding the age of the geoglyphs is still not resolved. However, most scientists attribute them to the Nazca culture (100 BC to 800 AD) and Paracas culture (1200–800 BC to 100 BC). Dating through 14C [11,42] is also uncertain in this case and inconclusive if organic (wooden) evidence is not found directly in the geoglyphs as a part of them. Dating was done successfully only in the “Mandala” geoglyph, which is after analysing the wooden parts (evidently used by geoglyph construction) using 14C method, detected as evidently new [11,45]). This could serve not only as a guideline for dating but also for defining the use of some geoglyphs (Table 1).
Some wooden artefacts found directly on the “Pista” geoglyph by the Czech expedition to the Nasca region in 2012 could be probably a part of the geoglyph or original technical equipment, but it is not possible to prove it [11,19].
If the situation permits so, the documentation and subsequent research of geoglyphs can be done from the surface, from the air and from Earth’s orbit. The results can be captured cartographically and can be analysed in a suitable environment, e.g., GIS.

3. Documentation Technologies

For the basic documentation of geoglyphs and selected lines (there are some lines several kilometres long), a contactless areal documentation technology is very suitable. It can provide a general overview of the investigated territory and also help us with the searching and detecting of new objects. This can be advantageously used for areas with low levels of vegetation in locations with archaeological sites like in Peru near cities of Nasca and Palpa.

3.1. Aerial and Satellite Imaging

The best overview and analyse of the whole investigated area is provided by aerial and satellite imagery. The old, available black and white aerial photographs from Palpa are not of sufficient quality for the today’s point of view, as they cover only part of the territory and access to them is not easy, or they do not exist anymore [26,33]. Selected parts were even military areas at a certain time [9,10,11]. In some cases, satellite images do not have the sufficient geometric resolution (several lines have a width of only 10–30 cm), although this disadvantage has recently been receding with better geometric resolution of modern VHR (very high resolution) satellites like WorldView-3 with GSD 31 cm or WorldView-1, 2, GeoEye-1, Pleiades, and others with GSD 50 cm [25,27,44,46]. The easiest way to get appropriate local and detailed image data is to get it with the help of smaller airlines that operate from Nasca airport. It is also possible to use the above mentioned modern drone technology; but this can be very problematic in terms of official authorization and a nearby airport.
Of course, existing satellite or aerial data is a perfect tool, but they cannot be considered completely perfect for all purposes. A final geometric resolution is still too small for fine details or it is too expensive. It is necessary to combine property with terrain exploration, if possible (in many locations or far countries it is not possible; for example, Pampa de Nasca with most known geoglyphs can be visited personally only with a special permission, with appropriate footwear and by accompaniment of a specialist from INC). Documentation or mapping is the only one part of the complex research. However, information can be obtained only by a personal visit of the site, samples collection, study of historical sources and their analysis and other scientific methods.

3.2. RPAS (Drones)

The newly-used abbreviation for drones, RPAS, explains accurately the nature of the device. It is a remotely piloted instrument equipped with various sensors (in particular, it is important to note that there is a person—the pilot, responsible for the equipment which is necessary by law). However, RPAS is often called UAV (unmanned aircraft vehicle) or UAS (unmanned aircraft system, it means UAV with terrestrial control system) or simple in slang “drone” [2,4,5]. These popular instruments serve for the non-contact mapping and monitoring of small areas. It is important to say, that RPAS technology combines close range photogrammetry with aerial photogrammetry and remote sensing and it can produce very accurate outputs in comparison with classical aerial photogrammetry, of course, on limited areas.
Based on the miniaturization sensors and control parts, RPAS provide typical photographic data, but also other data types such as multispectral, thermal, or laser scanned data can be taken. Due to this, it is possible to supply remotely sensed data for small areas very quickly and at a low cost. In comparison to photogrammetry or remote sensing, RPAS give us image data with GSD in cm. From overlapped images, DSM can be derived with a GSD better than one decimetre. RPAS are nowadays used in a wide field of usage; they can be used well in culture heritage for objects documentation, or in archaeological surveying. In this study, we show an archaeologically focused case project, where the outputs from RPAS are excellent [6,7].
We found a good solution in the eBee drone (model 2015); it is simple to use, and relatively obtainable for our university research and it is easy transportable. The main body and demountable wings consist of styropore foam. The drone contains an electrically powered engine with a pusher propeller, battery pack, inertial navigation system (INS), which includes GNSS and IMU (inertial measurement unit), radio-modem and piloting control system. A laptop or tablet with navigation software can be used for navigation and piloting.
The initial necessary information is pixel size (GSD), image overlapping, flight time, monitored area given by rectangle or polygon dimensions. The typical flight covers one square kilometre from an altitude of 100–200 m. Maximal flight time reaches 40 min. GSD depends on the flight altitude and sensor, and can be set from 2 cm for very low flights (normally 4–5 cm from a flight high 120–130 m).
As an output, a set of overlapped images is generated with an approximately known external orientation of photos from changeable cameras. Based on image correlation, DSM and orthophotos can be automatically generated. EBee weighs less than 1 kg and it is easily transportable and safe to use.

3.3. Measurement

An infrared camera was used due to the mild turbidity of the atmosphere and a haze. Altogether, 94 images using the Canon NIR camera ELPH 110 HS with 16 MPx resolution) were taken (Table 2 and Table 3), Figure 2.
The image data was processed in Agisoft Photoscan software to a sparse and dense point cloud [2,27] and in Pix4D software directly to an orthophoto and DSM (Figure 4 and Figure 5). From the dense point cloud, the high resolution DSM and orthophoto were derived with a pixel size (GSD) of 5 cm. The orthophoto was processed in ArcGIS to a very precise orthophoto map based on the GNSS receiver on-board the eBee drone. The GSD reaches 5 cm, but of course, the absolute position is not so high, because there was not an RTK (real-time kinematic—it is a technique of real-time corrections, providing up to centimeter-level accuracy based on measurement of a reference station) system at disposal. From time and technical problems, no GCP (ground control points) were used for the geolocation of all images and a created model. For this reason, the absolute accuracy was calculated in selected software Pix4D and it is approximately 4–5 m. However, the absolute accuracy in position is not so important in this case—the main objective was to analyse the previously invisible structure of the geoglyph.

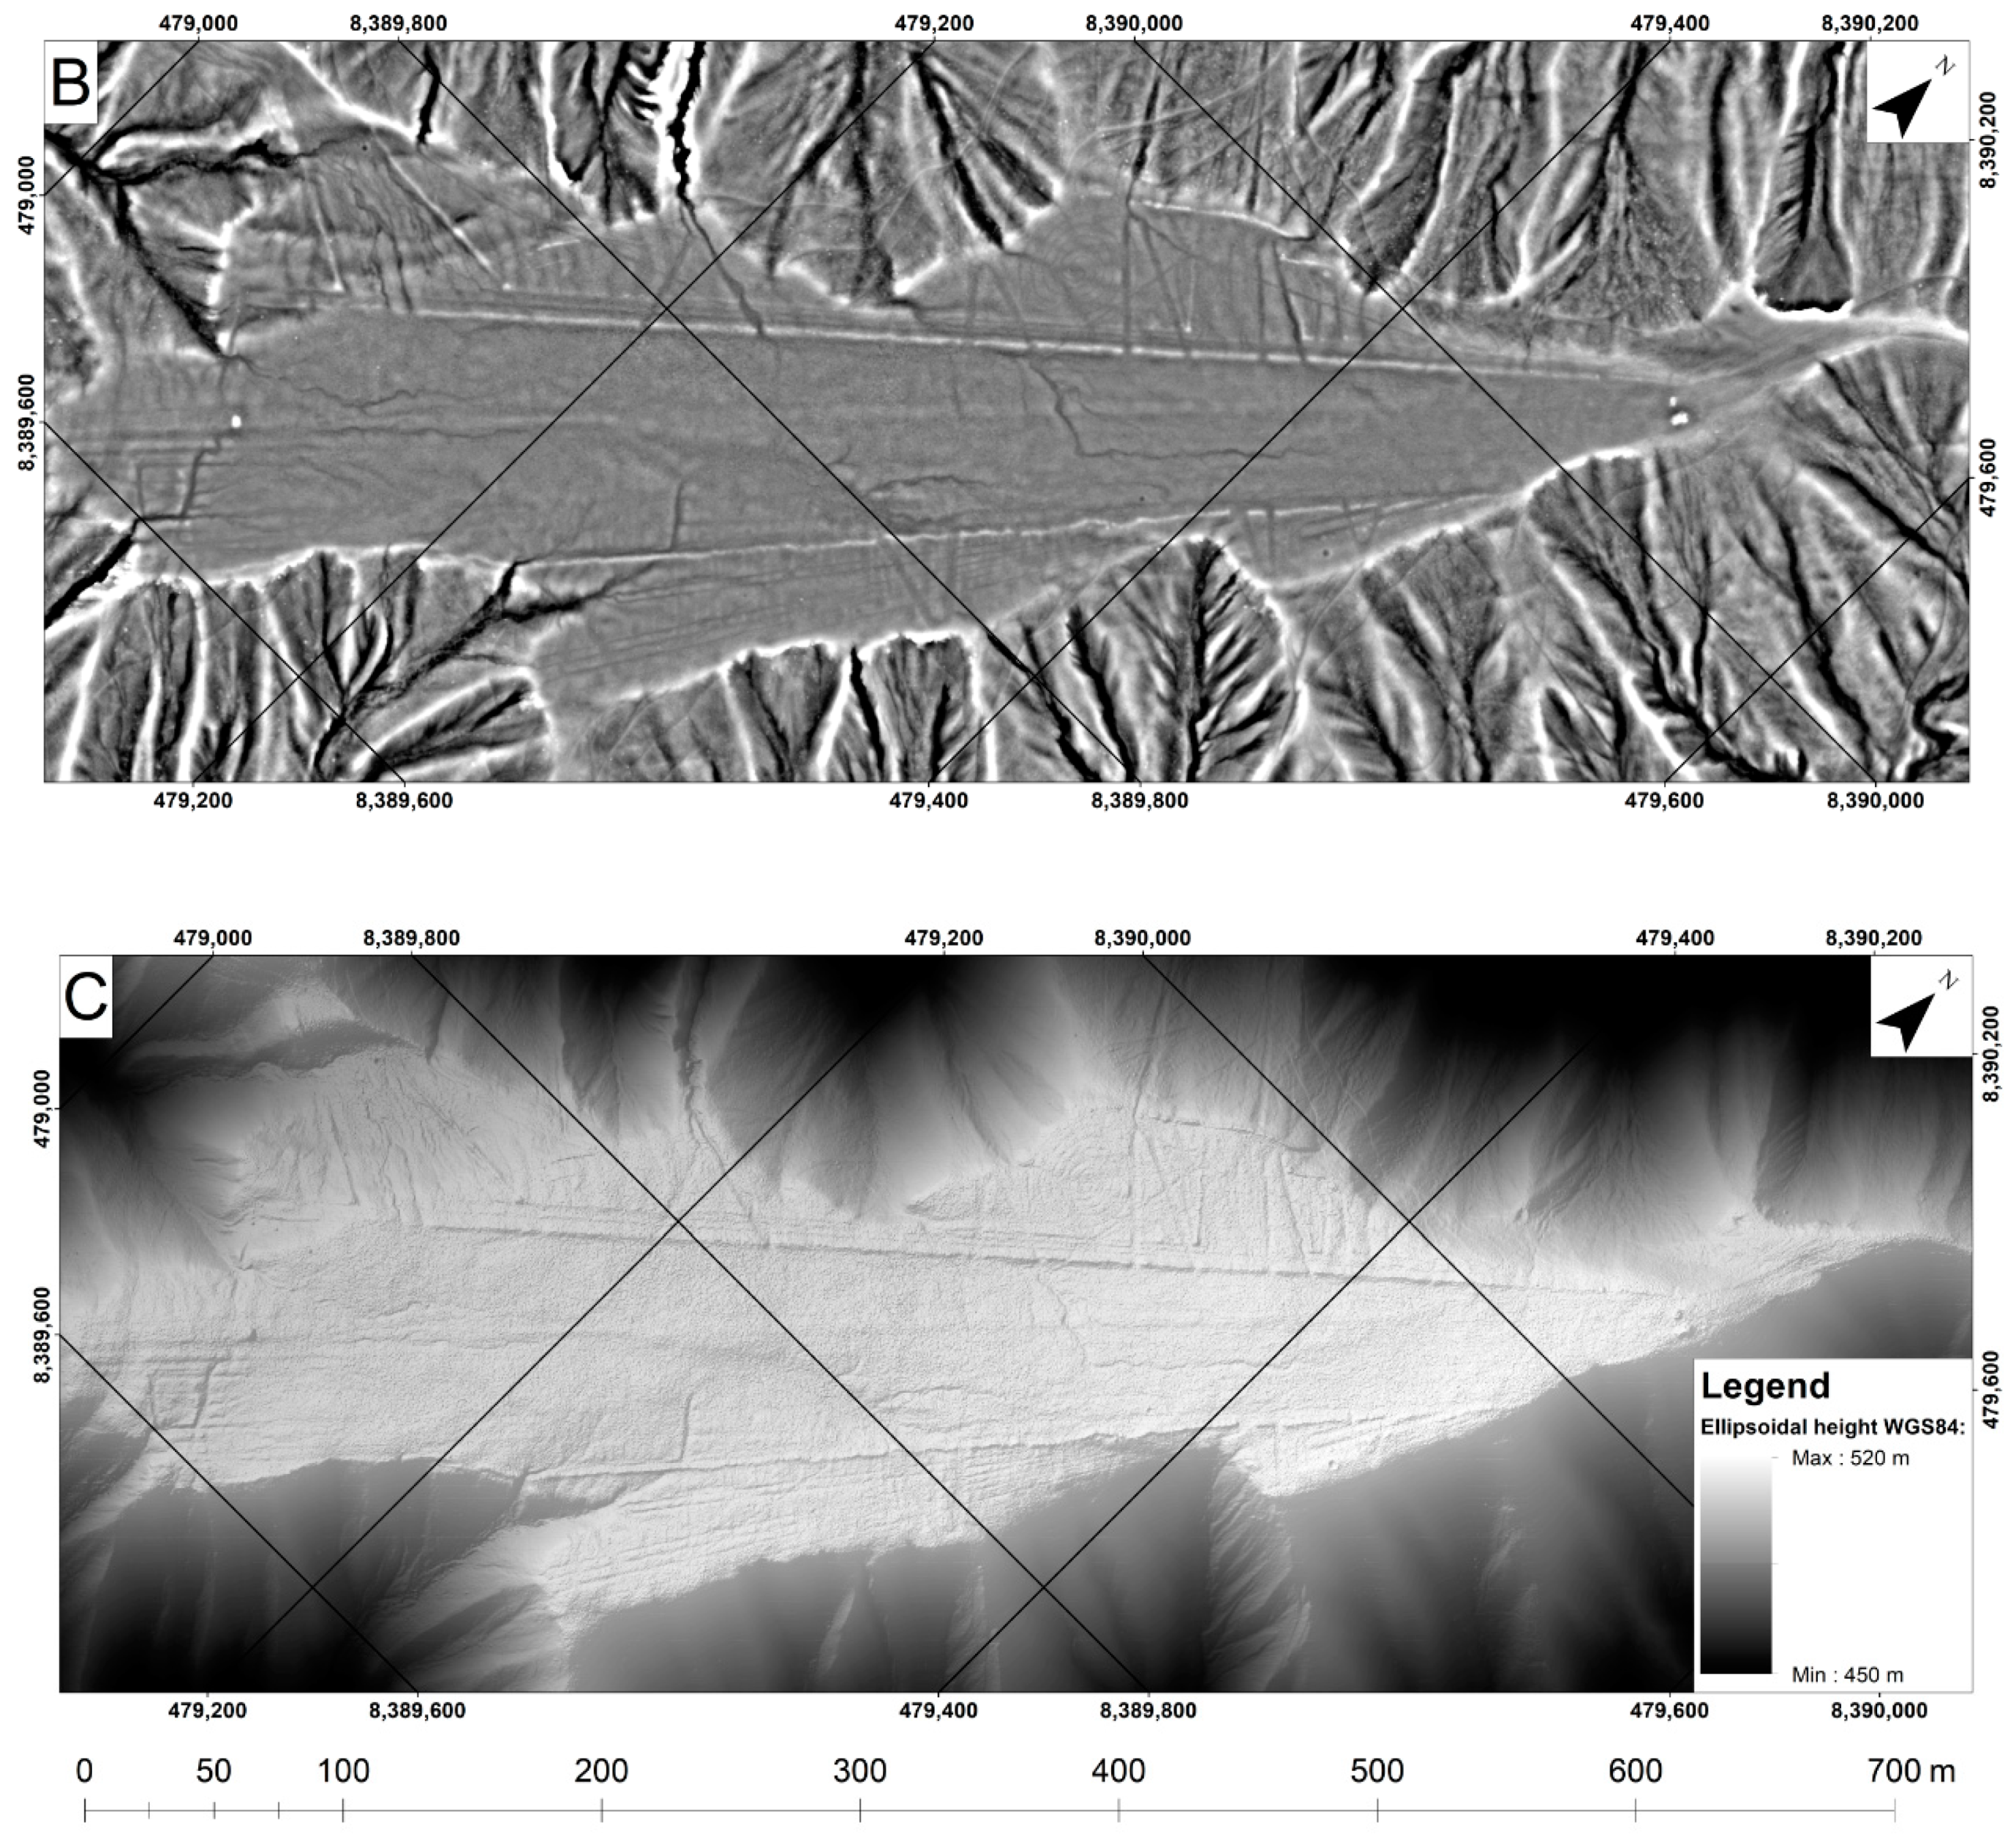
3.4. DDSM—A Valuable Product

An orthophoto is the most used output from drones, but this type of image data has other capabilities in the creation of DSM [2,4,29]. A typical DSM in raster form and grey scale shows only little details. It is better to use coloured hypsometry, which is a shaded relief of differential DSM (DDSM) for example, which enhances small terrain details. There is not a common procedure how the DDSM can be computed—it depends on the scale of details, GSD, terrain and searched features. After some experiments, two different DDSM were created in ArcGIS software. Both were computed as the difference between the original DSM and the filtered DSM (with filter window 20 pixels and 50 pixels). Final DDSM and DSM have a GSD of 10 cm after filtration and resampling (Figure 4 and Figure 5).

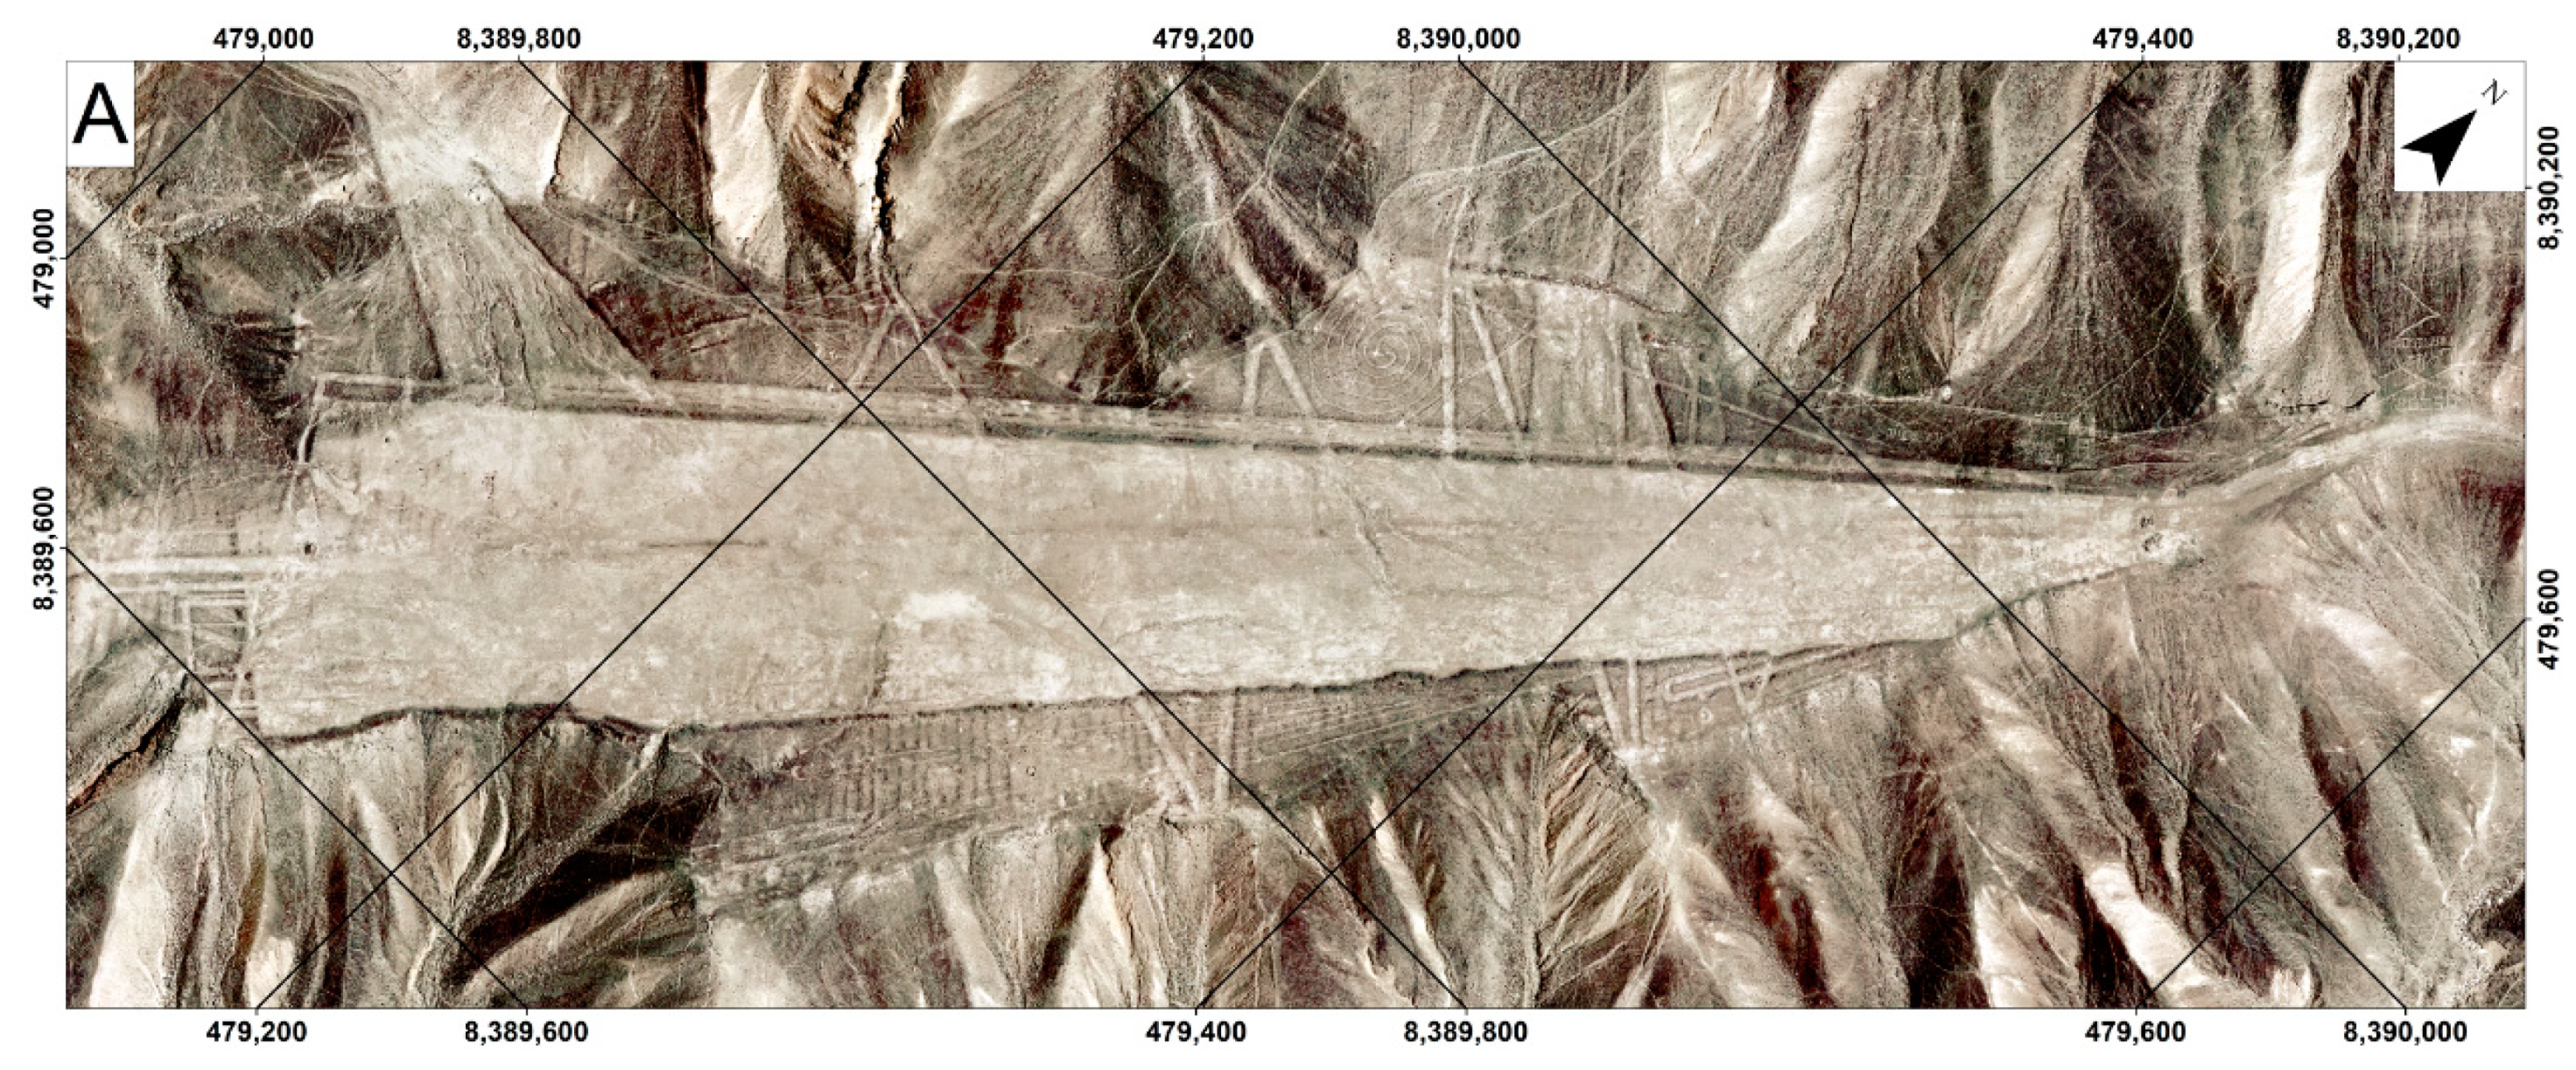
3.5. RPAS Orthophoto

A new very high resolution orthophoto was computed from the RPAS photo set. Currently, these orthophoto and DSM are the most detailed cartographic outputs of the Pista geoglyph. The results have an important documentation value, showing the gradual destruction of the geoglyph and its destruction by the attacks of tourists and vandals who create their own drawings on the geoglyph or in its neighborhood. A detailed orthophoto (with a GSD of 5 cm) has been created, which revealed many previously unknown details. Unexpected new geoglyphs inside the main geoglyph were found).

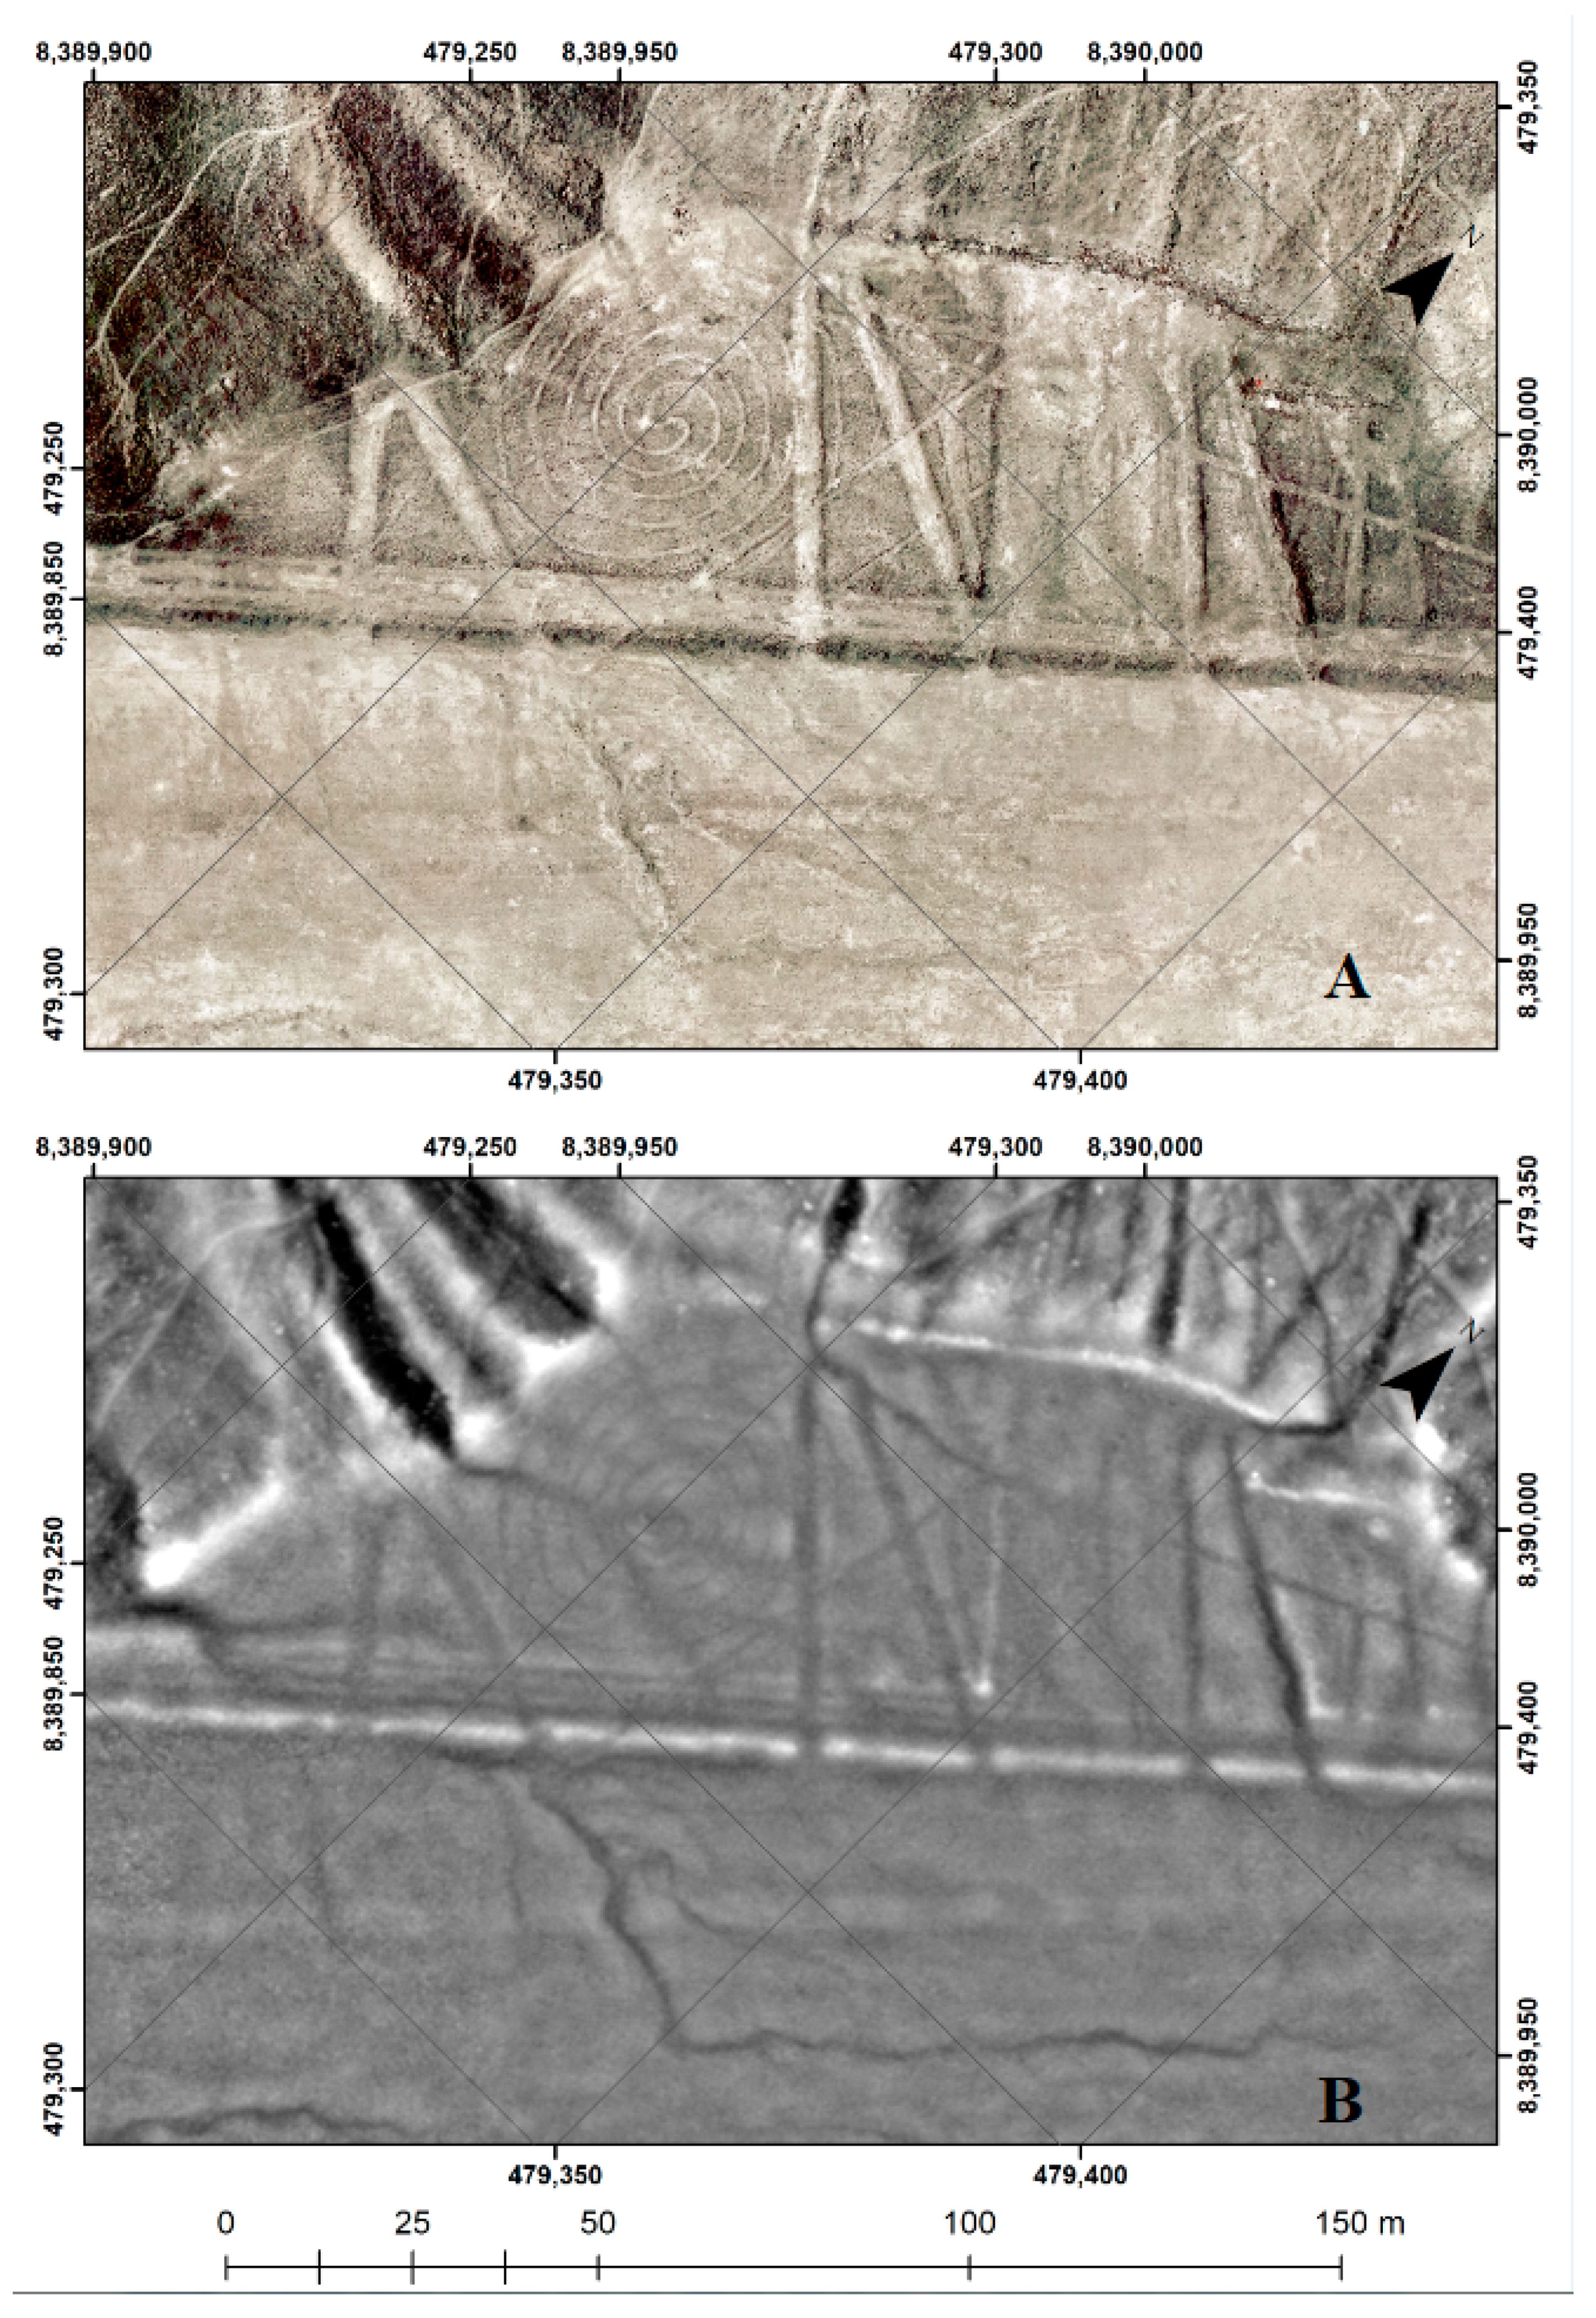
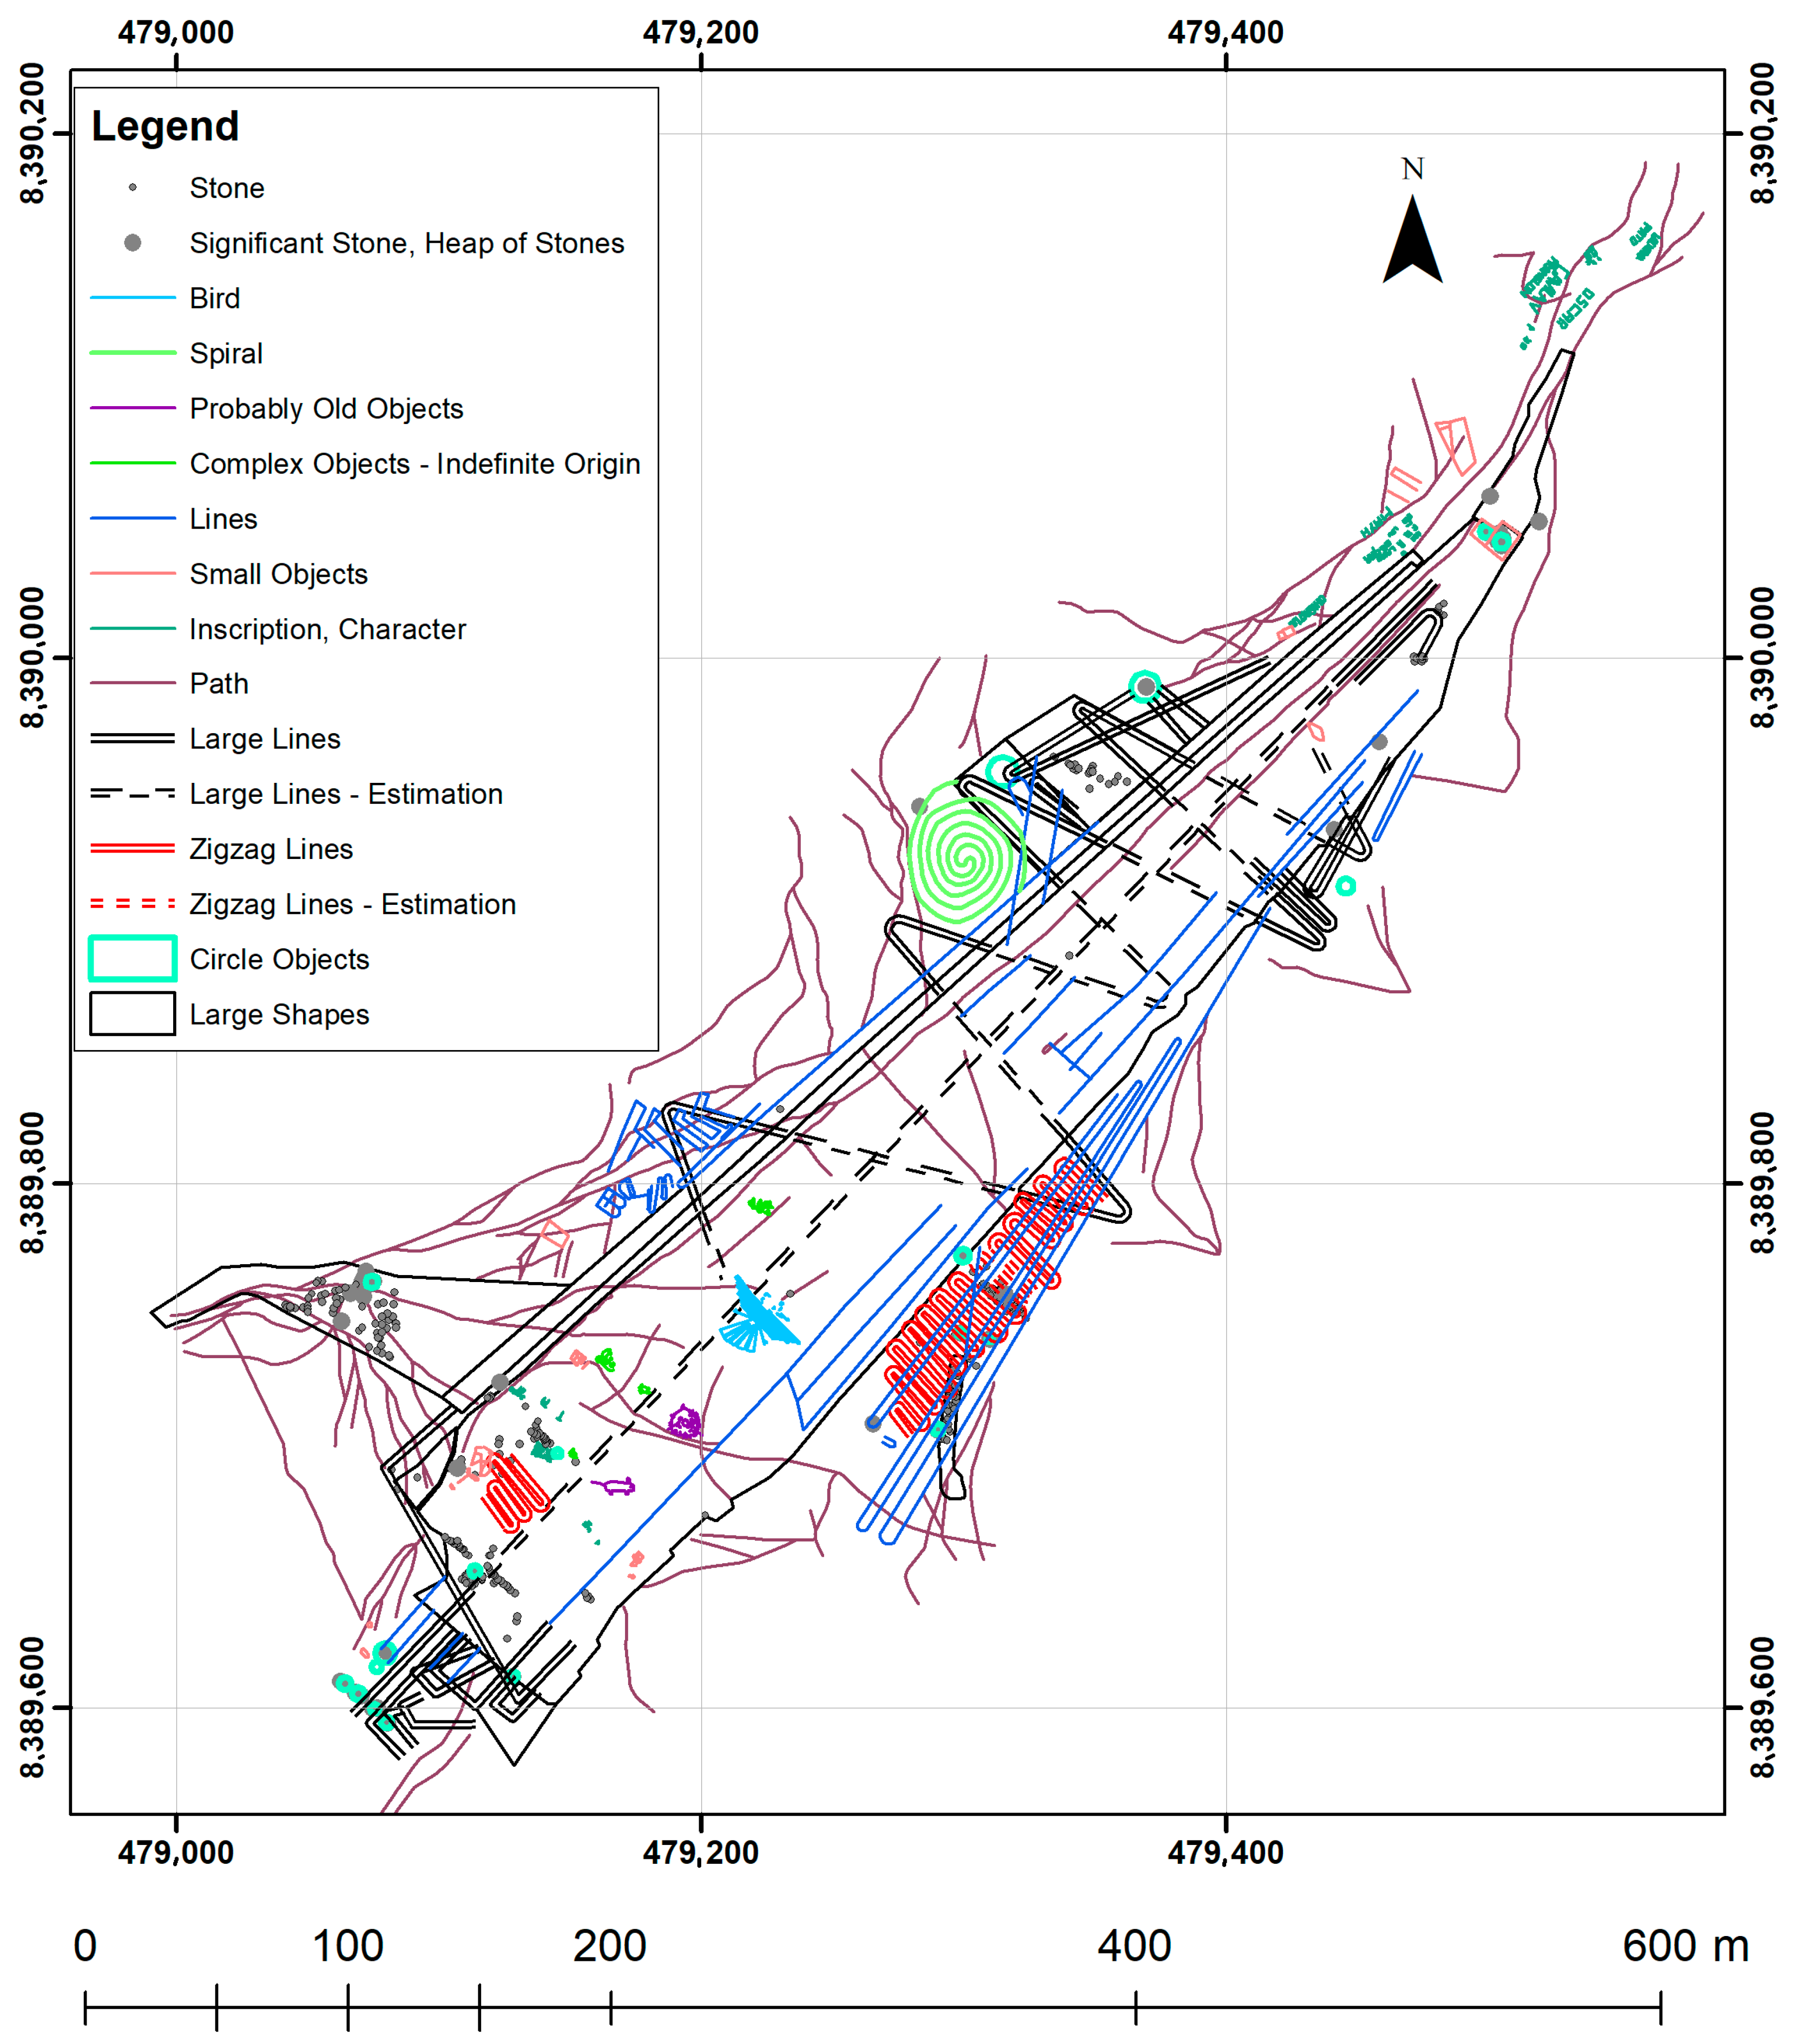
3.5.1. Orthophoto Interpretation

The geoglyph Pista has good visibility in VHR satellite images after 2000. For example, the QuicBird-2 satellite supplied data with the GSD of 60 cm in panchromatic range from 2001 to 2014; QuickBird-2 was followed by other VHR satellites like OrbView, Pleiades, GeoEye, and others. This geometrical resolution allowed the creation of orthophotos during that time with an unprecedented very high resolution. Many archaeological sites were thus researched remotely based on satellite imagery [1,11,21,25,27,29,31,32,47]. However, there are features, which cannot be observed by satellites. The reason is their very small thickness, especially in their linear structures. Using satellite data, a vector map of geoglyph Pista was created, with visible linear and flat structure. The resolution of this output is limited by linear structures of approximately 40–50 cm [1,11], (see Figure 3).
Based on our documentation and research in 2016, an orthophoto with super resolution (GSD 5 cm) was computed. Canon NIR camera ELPH 110 was used for taking 94 images from a flight altitude of 130 m; the NIR camera was used, because it had better resolution compared to a second RGB camera, which was at our disposal, but at this time it was disturbing because of internal pollution by fine dust during past measurements and in a hazed atmosphere it gave better image quality (infrared rays pass more easily through the atmosphere). However, on the created orthophoto at high magnification it can be seen that the cheap camera that was used does not have the quality of a professional device—the image is blurred in colour and it is generally fuzzy The documented area with the Pista geoglyph and near neighbourhood was 0.6 km2.
After the vectorising of visible features, a vector map was created which shows more detail than older outputs made from satellite or old aerial data (Figure 6).

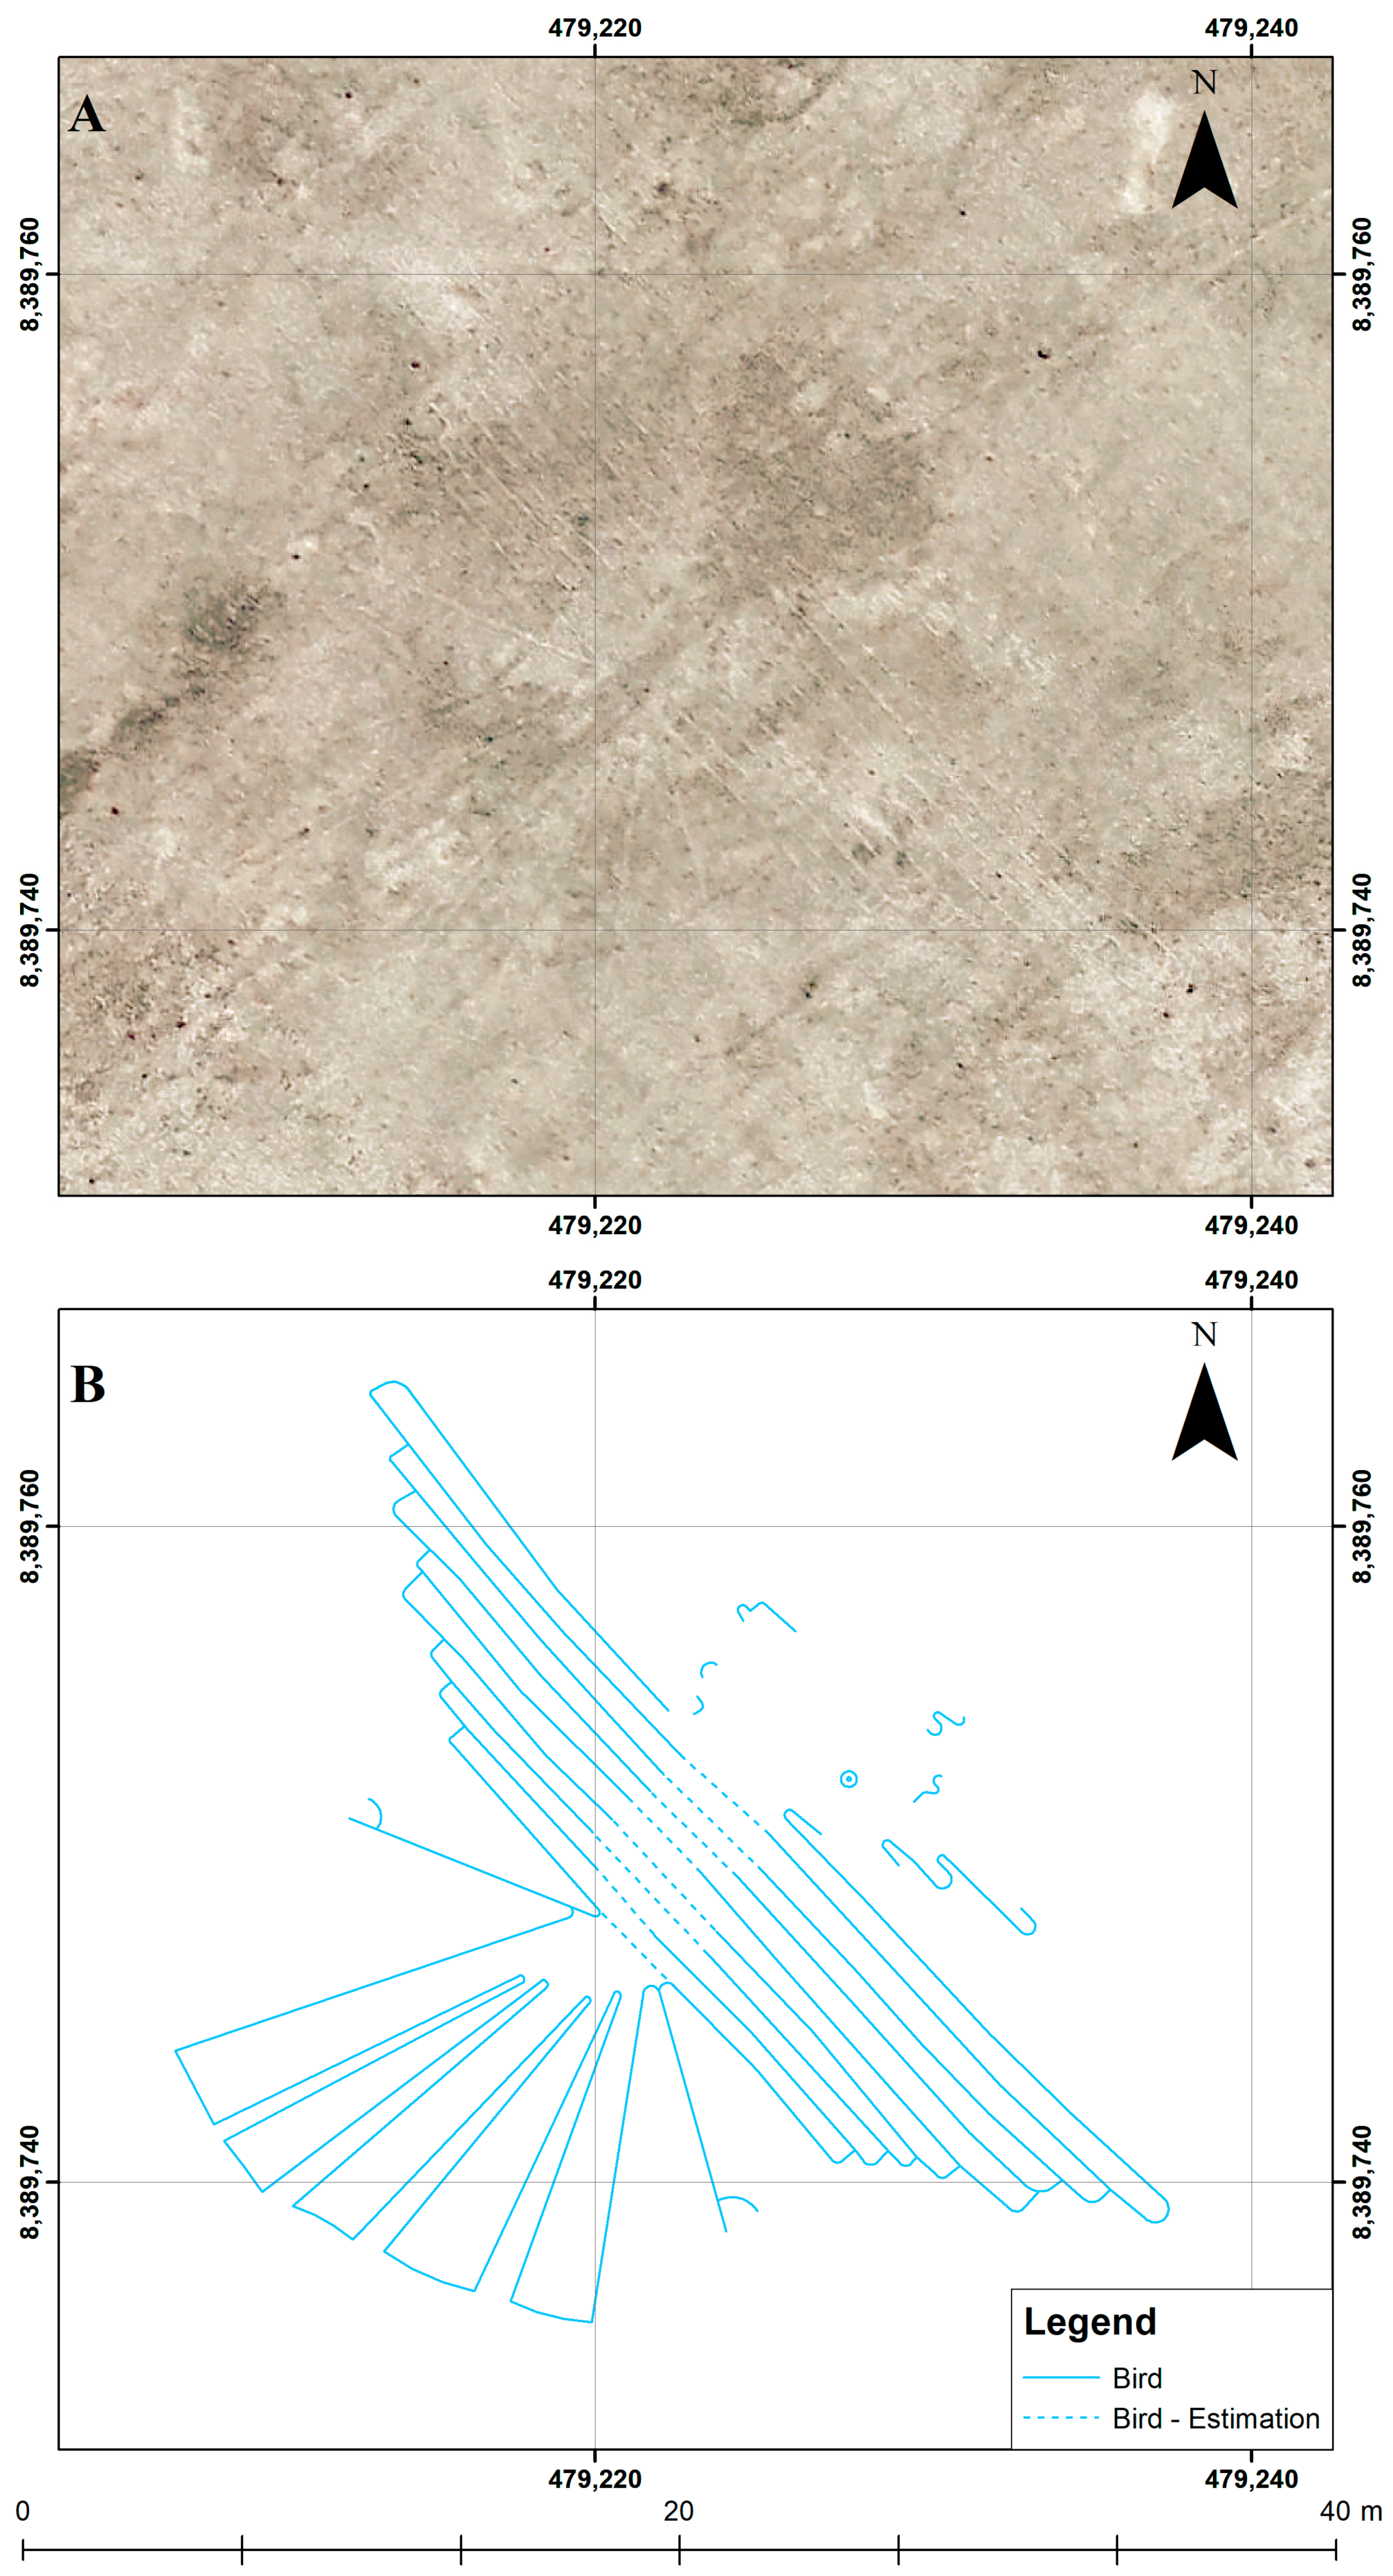
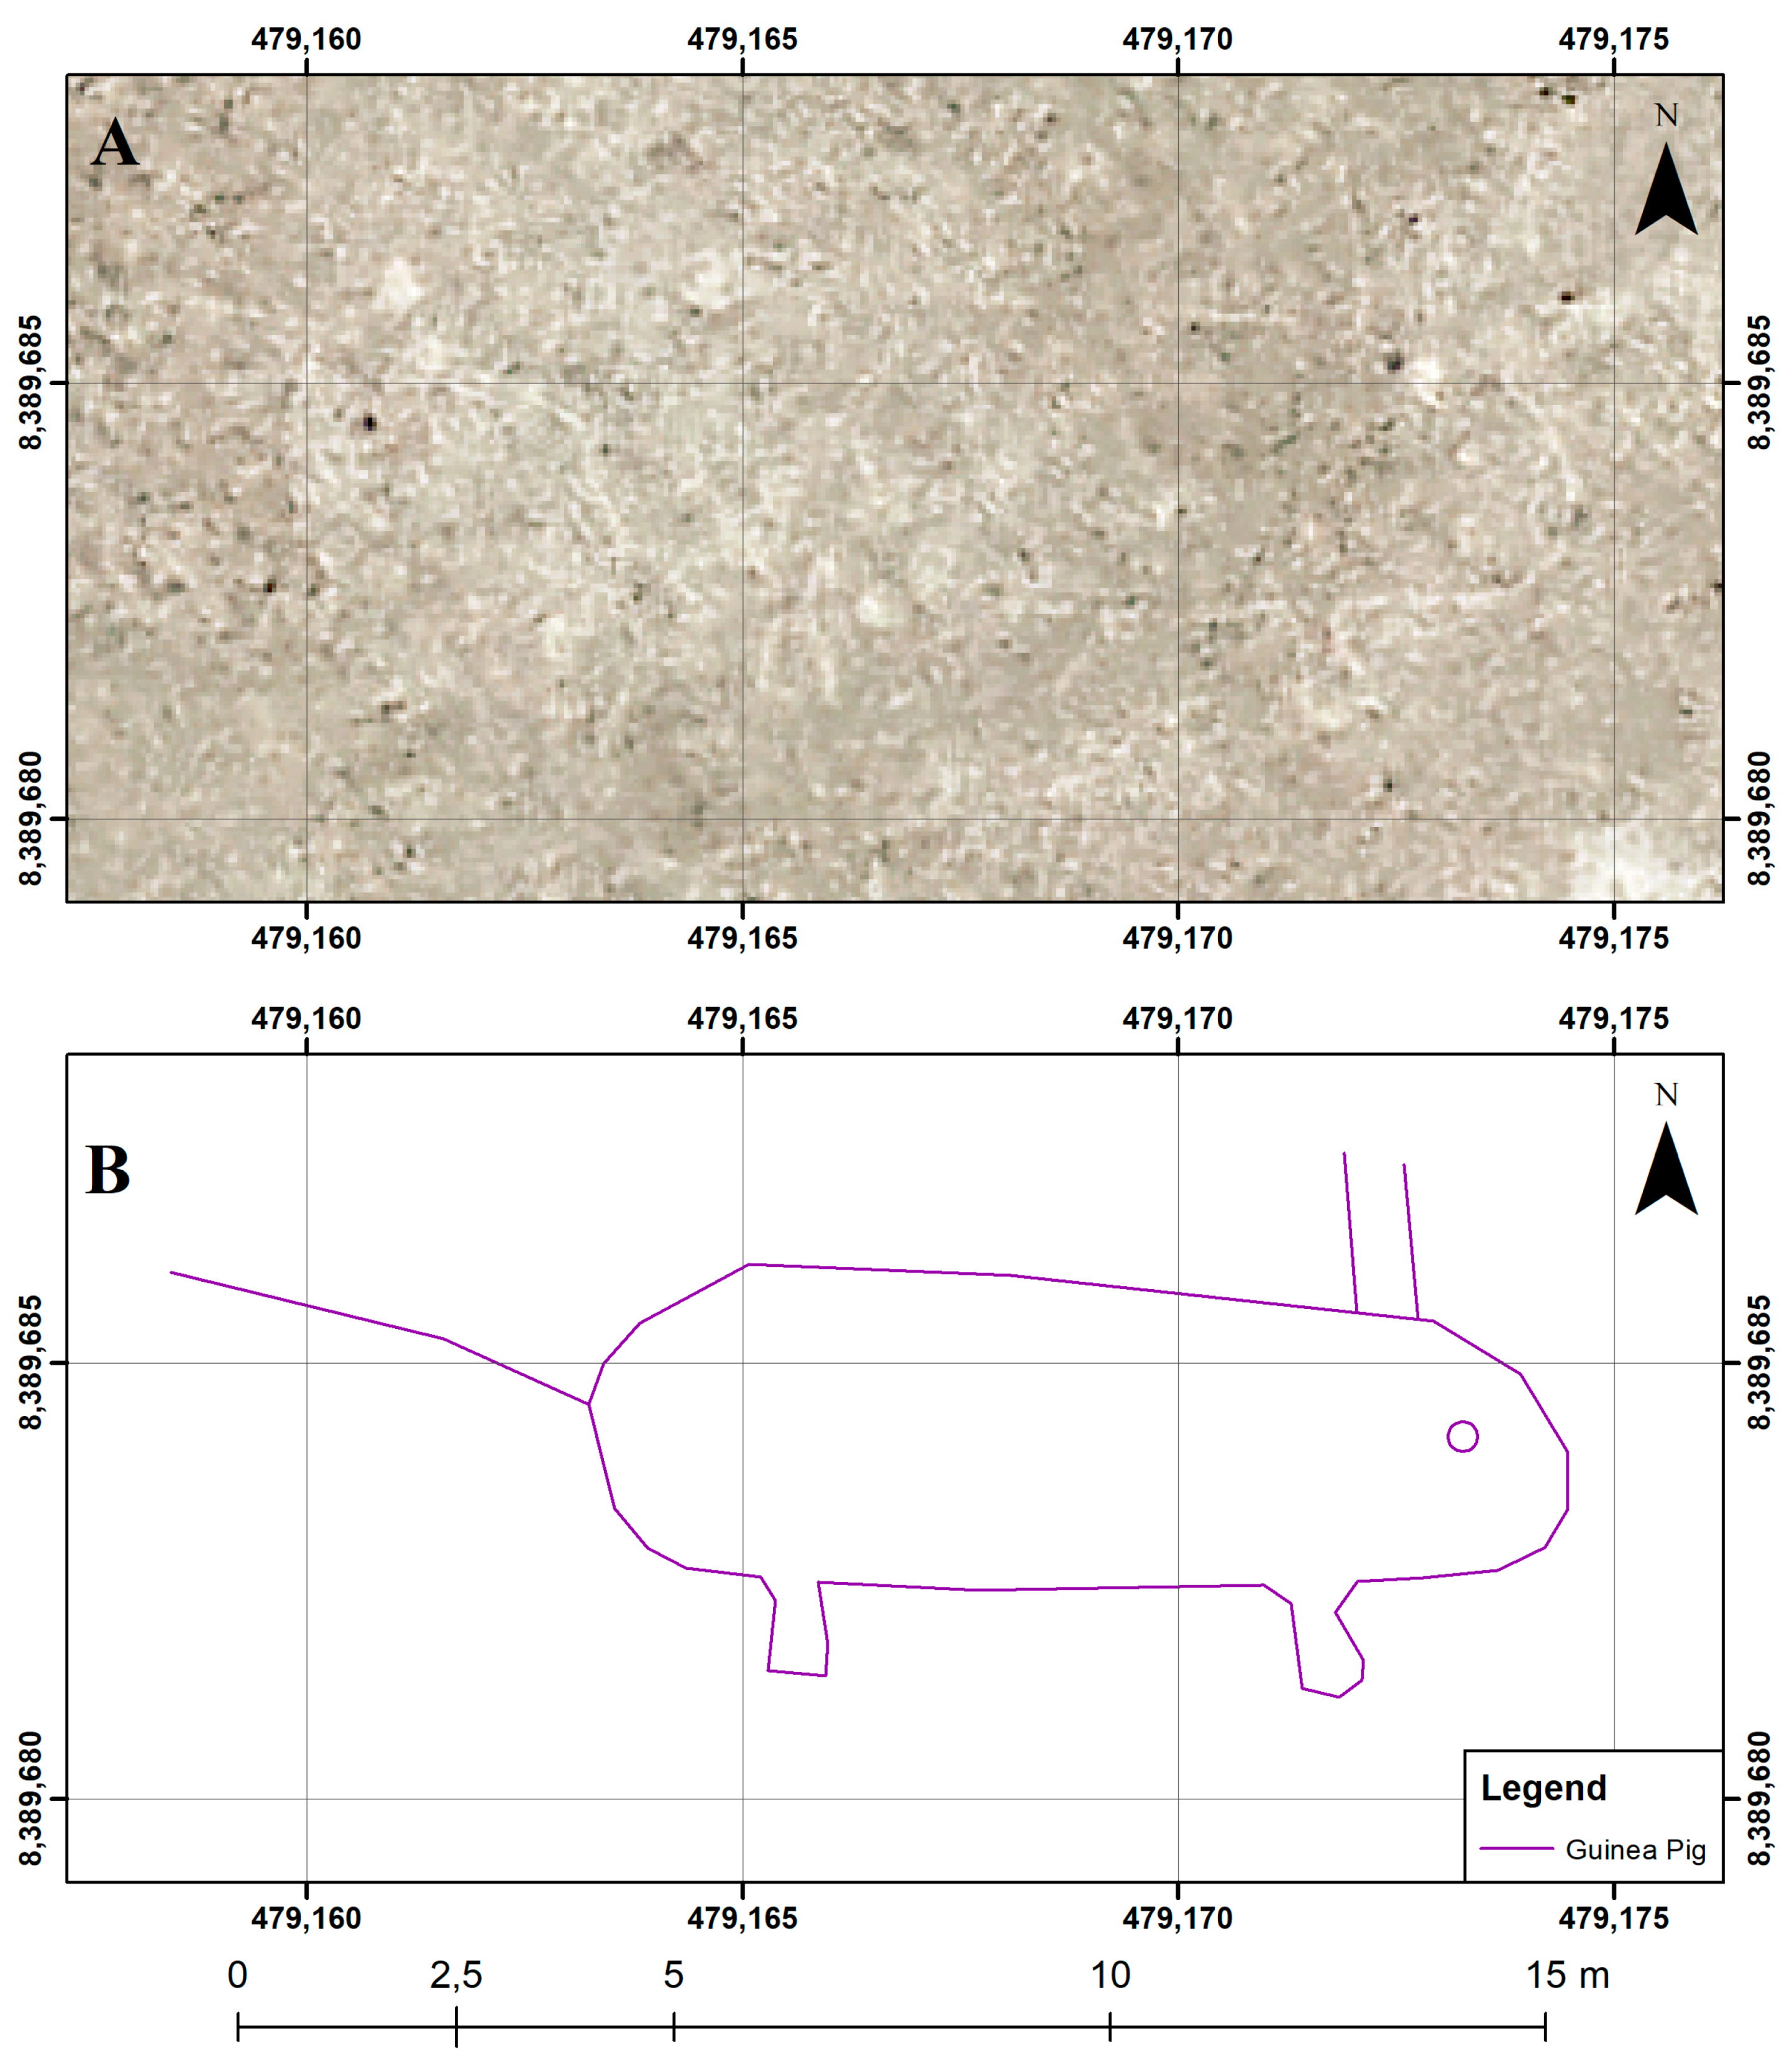
3.5.2. New Discovered Features

In the created precise orthophoto, especially yet unknown geoglyph of a flying bird was discovered (dimension 30 × 30 m, thickness of the line 10–15 cm only, Figure 7), which is very similar to the well-known geoglyph [11] “El Condor” or “Hummingbird” from Pampa Nasca (Figure 8A, B). Discovering new geoglyphs was possible just thanks to a very detailed survey with RPAS. In a detailed analysis of a created orthophoto, a number of other geoglyphs can be found, and unfortunately a lot of modern works as well, particularly inscriptions or graffiti that destroy this remarkable monument. Unfortunately, this area is not under UNESCO and it is protected only by a local law.
Another interesting newly found small geoglyph apparently shows a guinea pig (Kecuan “cui”, Figure 9). The guinea pigs were reared in the Andes as a source of meat already in pre-Columbian times and later they spread around the world. For some new findings, it is uncertain whether they are original geoglyphs or modern creations. The solitary stone at the beginning of the geoglyph Pista, containing many petroglyphs is definitely interesting; close to this stone a small geoglyph can be found, it was documented from the surface as the only one in 2012 during the inexpensive Czech university expedition. According to the technique and typology, one can say, that some newly found geoglyphs are original, some cannot be decided unambiguously and some are obviously modern (inscriptions, graffiti).

4. Final Remarks

Previous measurements that used satellite imagery or older aerial photography had limited geometric resolution that ends currently at approximately 0.3–0.5 m (Figure 3). There was no information about geoglyphs that exist as a part of previously documented and described ones. Overlapping lines and geoglyphs generally exist mainly in the Pampa Nasca and Palpa area. Linear shape objects with a thickness less than 10–15 cm are not visible on this data [1,11].
New documentation and research measurements using RPAS give practically better detailed results in an order of magnitude. In particular, it bought more detailed DSM and orthophoto. The created orthophoto has a radiometrically inferior quality, which is given by the type of ordinary cheap camera used in the RPAS and also by the flight plan and atmospheric haze (the results would be better for overflight in two perpendicular directions, but it was not possible due to time and weather conditions) [48].
Interpretation of new findings is not easy; some newly found geoglyphs are similar to the known geoglyphs and also can have similar meaning (the bird, the guinea pig, and several lines). As described above, it is very difficult to date geoglyphs. However, it is possible to use the recognized iconography. For example, there is a significant likeness of the newly found bird geoglyph with the well-known geoglyph “El condor” on Pampa de Nasca (Figure 8A) or with other geoglyph, which depict a bird (for example by M. Reiche called “Kosock’s bird” [8,9] or with the “Hummingbird” geoglyph, Figure 8B) [9,21].
Newly found geoglyphs must be younger than the original Pista. They are from the time when Pista had not already fulfilled its original (may be religious) purpose. It can be assumed that the religious site could not be covered with graffiti. They show for example bird and guinea-pig, which are the typical observed objects; the guinea-pig is still kept in Peru as a domestic animal. A very detailed orthophoto from RPAS shows not only new geoglyphs, but also geoglyph destruction (modern graffiti and erosion). Some objects are difficult to decide whether they are new or historical. According to the technique and typology, one can say, that some newly found geoglyphs can be original (the Bird, the Guinea pig, and some lines), some cannot be decided unambiguously (small figures and remnants of drawings) and some are obviously modern (inscriptions, graffiti).
Some works refer to the occurrence of stone-houses, towers or simple stone-structures on a geoglyph [40,41]. According to the description, they were stone-houses, they would rather be shelters for few people and this fact would support Sonnek’s theory of the technical use of the geoglyph [17,18]. Whoever created a megalithic geoglyph for religious purpose, would probably not build simple shelters on it, but rather altars, which is the most cited theory today [34,35,49]. These stone structures were discovered and investigated on the surrounding geoglyphs (trapezoids) [33,35]. It is also possible that these structures may be younger; dating with 14C may bind to recycled (collected and found) material. However, todays recognized theory views these structures really as altars [34,35].
When using drones, many other discoveries in this locality can be expected. It is certain, that dating methods are improving in the similar way as documentation imaging and geophysical technologies, which can also bring about a change in our view of historical objects.

5. Conclusions

Satellite images can be used for the basic mapping of historical or archaeological sites around the world without personally participating in the site. Data from satellites can be processed to an orthophoto (today with GSD 50 cm) or to a digital relief or digital surface model (DRM and DSM), but based on experiences, it is evident that the resolution of satellite DSM (typically reaches GSD 1 m or worse) is not usually sufficient for archaeological purposes for fine structure detection. For this reason, RPAS mapping and documentation capability was tested and successfully used for the creation of a very detailed orthophoto and DSM. DDSM derived from DSM seems to be very helpful because it shows more details than ordinary DSM. In the above mentioned project, it was normally hardly visible interesting erosion furrows that were uncovered. In the case of documentation of the Pista geoglyph near Palpa in Peru, unexpectedly unknown geoglyphs inside the well-known Pista geoglyph were found. RPAS technology is reported to be very successful in archaeology (for small areas), because it is low cost, mobile, variable and gets very detailed DSM and orthophotos in an order of magnitude more accurate than typical VHR satellite images. This is very important, because some features are small or they are very thin. A great development of this technology in the future and improvements of sensors can be predicted; however, there is a big problem with the safety of RPAS and legislation, which can be totally varied in different countries of the world. It is also worth noting that there is competition to keep improving satellite and standard aerial data. It is obvious, that modern, more detailed research based in this case on RPAS technology still brings new insights. New geoglyphs found from very high resolution RPAS data may change existing interpretations of documented objects.

Author Contributions

Conceptualization, K.P. and J.Š.; methodology, K.P.; software, K.P. and J.Š.; validation, K.P., J.Š., and E.M.; formal analysis, K.P.; writing—original draft preparation, K.P.; writing—review and editing, E.M.; visualization, J.Š.; supervision, K.P.; project administration, E.M.

Funding

This research received no external funding.

Acknowledgments

This preparation of this paper was partly supported by an internal grant of the CTU in Prague, SGS18/056/OHK1/1T/11. We would like to acknowledge the support of the Instituto Nacional de Cultura del Perú (INC) and town hall of Nasca city (mayor Alfonso Canales Velarde, 2016).

Conflicts of Interest

The authors declare no conflict of interest.

References

  1. Klokočník, J.; Kostelecký, J.; Pavelka, K. Google earth: Inspiration and instrument for the study of ancient civilizations. Geoinform. FCE CTU 2011, 6, 193–211. [Google Scholar] [CrossRef]
  2. Raeva, P.; Šedina, J.; Dlesk, A. Monitoring of crop fields using multispectral and thermal imagery from UAV. Eur. J. Remote Sens. 2018. [Google Scholar] [CrossRef]
  3. Eisenbeiss, H.; Lambers, K.; Sauerbier, M.; Zhang, L. Photogrammetric documentation of an archaeological site (Palpa, Peru) using an autonomous model helicopter. In Proceedings of the International Archives of Photogrammetry, Remote Sensing and Spatial Information Sciences, Riva del Garda, Italy, 23–25 June 2014; Volume XXXIV-5/C34, pp. 238–243. [Google Scholar]
  4. Pavelka, K.; Šedina, J.; Matoušková, E.; Faltýnová, M.; Hlaváčová, I. Using remote sensing and RPAS for archaeology and monitoring in Western Greenland. In Proceedings of the International Archives of the Photogrammetry, Remote Sensing and Spatial Information Sciences, 2016 XXIII ISPRS Congress, Prague, Czech Republic, 12–19 July 2016; Copernicus Publications: Göttingen, Germany, 2016; pp. 979–983. [Google Scholar]
  5. Šedina, J.; Hůlková, M.; Pavelka, K.; Pavelka, K., Jr. RPAS for documentation of Nazca aqueducts. Eur. J. Remote Sens. 2018. [Google Scholar] [CrossRef]
  6. Cowley, D.C.; Moriarty, C.; Geddes, G.; Brown, G.L.; Wade, T.; Nichol, C.J. UAVs in Context: Archaeological Airborne Recording in a National Body of Survey and Record. Drones 2018, 2, 2. [Google Scholar] [CrossRef]
  7. Campana, S. Drones in Archaeology. State-of-the-art and Future Perspectives. Archaeol. Prospect. 2017, 24, 4. [Google Scholar] [CrossRef]
  8. Kosok, P. Life, Land and Water in Ancient Peru; Long Island University Press: Brooklyn, NY, USA, 1965; 256p. [Google Scholar]
  9. Reiche, M. Mystery on the Desert. Nazca (Peru); Offizindruck AG: Stuttgart, Germany, 1968; p. 92. [Google Scholar]
  10. Schulze, D.; Zetzsche, V. Bilderbuch der Wüste. Maria Reiche und die Bodenzeichnung von Nasca (Picture Book of the Desert. Maria Reiche and the Geoglyph of Nasca); Mitteldeutscher Verlag: Halle, Germany, September 2005; ISBN 3-89812-98-0. (In German) [Google Scholar]
  11. Pavelka, K.; Klokočník, J.; Kostelecký, J. Astronomical-Historical Question Marks of Mesoamerican and Peru; Czech Technical University in Prague: Prague, Czech Republic, 2013; p. 235. ISBN 978-80-01-05219-8. (In Czech) [Google Scholar]
  12. Teichert, B. Astronomical investigations of the Nasca Lines. In Proceedings of the Nasca Symposium, Bielefeld, Germany, 21–23 June 2006; pp. 87–101. [Google Scholar]
  13. Johnson, D.W.; Proulx, D.A.; Mabee, S.B. The correlation between geoglyphs and subterranean water resources in the Rio Grande de Nasca drainage. In Andean Archaeology II: Art, Landscape, and Society; Silvermann, H., Isbell, W.H., Eds.; Kluwer Academic: New York, NY, USA, 2002; pp. 307–332. [Google Scholar]
  14. Masini, N.; Orefici, G.; Danese, M.; Pecci, A.; Scavone, M.; Lasaponara, R. Cahuachi and Pampa de Atarco: Towards Greater Comprehension of Nasca Geoglyphs. In The Ancient Nasca World New Insights from Science and Archaeology; Lasaponara, R., Masini, N., Orefici, G., Eds.; Springer International Publishing: Cham, Switzerland, 2016; pp. 239–278. [Google Scholar]
  15. Aveni, A.F. Between the Lines: The Mystery of the Giant Ground Drawings of Ancient Nasca, Peru; University of Texas Press: Austin, TX, USA, 2000; p. 88. ISBN 978-0-292-70496-1. [Google Scholar]
  16. Aveni, A.F. (Ed.) The Lines of Nazca; American Philosophical Society: Philadelphia, PA, USA, 1990; ISBN 0-87169-183-3. [Google Scholar]
  17. Sonnek, J. From the Buttonhole to Unravel the Nazca Mystery; EAN: Hlučín, Czech Republic, 2015; 148p, ISBN 978-80-260-8105-0. (In Czech) [Google Scholar]
  18. Sonnek, J. The Nasca Plains without Mysteries. Živá Archeologie (Living Archaeol.) 2011, 63–67. Available online: https://anzdoc.com/obrazy-planiny-nazca-jii-sonnek-bez-zahad.html (accessed on 26 October 2018).
  19. Klokočník, J.; Sonnek, J.; Hanzalová, K.; Pavelka, K. Hypotheses about geoglyphs at nasca, Peru: New discoveries. Geoinform. FCE CTU 2016, 15, 85. [Google Scholar] [CrossRef]
  20. Däniken, E.V. Arrival of the Gods: Revealing the Alien Landing Sites of Nazca; Tantor eBook: Old Saybrook, CT, USA, 1998; ISBN 978-1-86204-353-4. [Google Scholar]
  21. Richter, C. Nasca GIS—An Application for Cultural Heritage Conservation. In Proceedings of the Nasca Symposium, Bielefeld, Germany, 21–23 June 2006; pp. 115–126. [Google Scholar]
  22. Hanzalová, K.; Pavelka, K. Archaeo-astronomical investigation of historical objects in Peru. In Volume I Informatics, Geoinformatics and Remote Sensing. In Proceedings of the 13th International Multidisciplinary Scientific Geoconference, Bulgaria, Albena, 16–22 June 2013; pp. 321–328, ISBN 978-954-91818-9-0. [Google Scholar] [CrossRef]
  23. Gullberg, S.R. Inca Solar Orientation in Southeastern Peru. J. Cosmol. 2010, 9, 2078–2091. [Google Scholar]
  24. Hanzalová, K.; Pavelka, K. Documentation and virtual reconstruction of historical objects in Peru damaged by an earthquake and climatic events. Adv. Geosci. 2013, 35, 67–71. [Google Scholar] [CrossRef] [Green Version]
  25. Pavelka, K.; Matoušková, E.; Hanzalová, K. New generation of satellite data and GoogleEarth: Instrument for the study of ancient civilization in Peru. EARSel Workshop. In Proceedings of the 4th Workshop on Cultural and Natural Heritage, Matera, Italy, 6–7 June 2013. [Google Scholar]
  26. Lambers, K. The Geoglyphs of Palpa, Peru: Documentation, Analysis, and Interpretation; Lindensoft Verlag: Aichwald, Germany, 2006; ISBN 3-929290-32-4. [Google Scholar]
  27. Matoušková, E.; Hanzalová, K. Documentation of geoglyphs on Nazca Plain, Peru using remotely sensed data. In Proceedings of the 23rd CIPA Symposium, Prague, Czech Republic, 12–16 September 2011; Faculty of Civil Engineering, Czech Technical University in Prague: Prague, Czech Republic, 2011; pp. 358–365, ISBN 978-80-01-04885-6. [Google Scholar]
  28. Sauerbier, M.; Lambers, K. A 3D model of the Nasca Lines at Palpa (Peru). In Proceedings of the International Archives of Photogrammetry, Remote Sensing and Spatial Information Sciences, Visualization and Animation of Reality-based 3D Models, Tarasp-Vulpera, Engadin, Switzerland, 24–28 February 2003. XXXIV-5/W10 (CD-ROM). [Google Scholar]
  29. Sauerbier, M.; Schrotter, G.; Eisenbeiss, H.; Lambers, K. Multi-resolution image-based visualization of archaeological landscapes in Palpa (Peru). From Space to Place: BAR International Series 1568. In Proceedings of the 2nd International Conference on Remote Sensing in Archaeology, CNR, Rome, Italy, 2–4 December 2006; Oxford Archaeopress: Oxford, UK, 2006; pp. 353–359. [Google Scholar]
  30. Pavelka, K.; Hanzalová, K.; Hlaváčová, I. Using radar data in archaeological sites. In Proceedings of the SGEM 2014, International Multidisciplinary Scientific GeoConference, Albena, Bulgaria, 17–26 June 2014; pp. 383–390. [Google Scholar]
  31. Cigna, F.; Tapete, D. Tracking Human-Induced Landscape Disturbance at the Nasca Lines UNESCO World Heritage Site in Peru with COSMO-SkyMed InSAR. Remote Sens. 2018, 10, 572. [Google Scholar] [CrossRef]
  32. Comer, D.C.; Chapman, B.D.; Comer, J.A. Detecting Landscape Disturbance at the Nasca Lines Using SAR Data Collected from Airborne and Satellite Platforms. Geosciences 2017, 7, 106. [Google Scholar] [CrossRef]
  33. Reindel, M.; Gruen, A. The Nasca-Palpa Project: A cooperative approach of archaeology, archaeometery and photogrammetry. In Recording, Modeling and Visualization of Cultural Heritage; Baltsavias, E., Gruen, A., van Gool, L., Pateraki, M., Eds.; Balkema: Rotterdam, The Netherlands, 2006; pp. 21–32. [Google Scholar]
  34. Conlee, C. The Mystery of the Nazca Geoglyphs. 2010. Available online: https://www.ceskatelevize.cz/porady/10314142270-tajemstvi-obrazcu-nazca/ (accessed on 10 October 2018).
  35. Isla, J.; Reindel, M. New Studies on the Settlements and Geoglyphs in Palpa, Peru. Andean Past 2005, 7, 8. Available online: https://digitalcommons.library.umaine.edu/andean_past/vol7/iss1/8 (accessed on 26 October 2018).
  36. Greshko, M. Exclusive: Massive Ancient Drawings Found in Peruvian Desert. National Geographic. 5 April 2018. Available online: https://news.nationalgeographic.com/2018/04/new-nasca-nazca-lines-discovery-peru-archaeology/ (accessed on 26 October 2018).
  37. Silverman, H. Paracas in nazca: New data on the early horizon occupation of the rio grande de nazca drainage, peru. Lat. Am. Antiq. 1994, 5, 359–382. [Google Scholar] [CrossRef]
  38. Greilich, S.; Wagner, G.A. Light Thrown on History—The Dating of Stone Surfaces at the Geoglyphs of Palpa Using Optically Stimulated Luminescence. In New Technologies for Archaeology. Natural Science in Archaeology; Reindel, M., Wagner, G.A., Eds.; Springer: Berlin/Heidelberg, Germany, 2009; pp. 271–283. [Google Scholar]
  39. Rink, W.J.; Bartoll, J. Dating the geometric nasca lines in the peruvian desert. Antiquity 2005, 79, 390–401. [Google Scholar] [CrossRef]
  40. Fassbinder, J.; Unkel, I.; Lambers, K. Nasca: A Tiny Tool for a Large Line. Magnetometry and dating of Nasca Lines in Palpa, Southern Peru; Small Samples, Big Objects; Eu-ARTECH Seminar: Munich, Germany, 2007; pp. 27–39. [Google Scholar]
  41. Gorka, T.; Fassbinder, J. Geophysical survey with caesium magnetometry on the geoglyphs of Palpa/Nasca, southern Peru. In Metalla; Hauptmann, A., Stege, H., Eds.; Deutsches Bergbau-Museum Bochum: Bochum, Germany, 2009; pp. 45–47. [Google Scholar]
  42. Unkel, I. AMS—14C Analyzes on the Reconstruction of Landscape and Cultural History in the Palpa Region (Peru). Original in German Language: AMS—14C Analysen zur Rekonstruktion der Landschaft-und Kulturgeschichte in der Region Palpa (S-Peru). Ph.D. Thesis, Ruprecht-Karls Universität Heidelberg, Heidelberg, Germany, 2006; p. 212. [Google Scholar]
  43. Reindel, M.; Wagner, G.A. (Eds.) New Technologies for Archaeology: Multidisciplinary Investigations in Nasca and Palpa, Peru; Springer: Heidelberg/Berlin, Germany, 2009. [Google Scholar]
  44. Hanzalová, K.; Pavelka, K. Map of Nazca geoglyphs. In Volume XL-5/W2 ISPRS Archives. In Proceedings of the TC V XXIV International CIPA Symposium, Strasbourg, France, 2–6 September 2013; Copernicus GmbH: Göttingen, Germany, 2013; Volume 2013, pp. 309–311. [Google Scholar] [CrossRef]
  45. Pavelka, K.; Matoušková, E.; Faltýnová, M. Dating of Artefacts from Nasca Region and Falsification of “Mandala” Geoglyph. In Proceedings of the 16th International Multidisciplinary Scientific GeoConference SGEM 2016, Albena, Bulgaria, 30 June–6 July 2016; Volume 1, pp. 165–172, ISBN 978-619-7105-58-2. [Google Scholar]
  46. Richter, C.; Teichert, B.; Hanzalová, K.; Pavelka, K. The Nasca Project—A German-Czech cooperation. In Proceedings of the 23rd CIPA Symposium, Prague, Czech Republic, 12–16 September 2011; ISBN 978-80-01-04885-6. [Google Scholar]
  47. Nickell, J. Unsolved History: Investigating Mysteries of the Past; The University Press of Kentucky: Lexington, KY, USA, 2005; pp. 9–17. ISBN 978-0-8131-9137-9. [Google Scholar]
  48. Marčiš, M. Quality of 3D models generated by SFM technology. Slovak J. Civ. Eng. 2014, 21, 13–24. [Google Scholar] [CrossRef]
  49. Reindel, M.; Isla, J.; Lambers, K. Altares en el desierto: Las estructuras de piedra sobre los geoglifos Nasca en Palpa. Arqueología y Sociedad 2006, 17, 179–222. Available online: http://kops.uni-konstanz.de/handle/123456789/20392 (accessed on 26 October 2018).
Figure 1. (A) Geoglyph Pista near Palpa, (Google Earth, satellite image from 2013) and (B) localization of cities Palpa and Nasca in Peru (Google maps).
Geosciences 08 00479 g001
Figure 2. (A) Flight over Geoglyph Pista near Palpa and (B) a detail of the great spiral near the main geoglyph Pista.
Geosciences 08 00479 g002
Figure 3. Interpretation of Pista geoglyph based on aerial images (original by K. Lambers, 2006), [26,42]. Red points are samples positions (for 14C analysis, expedition 2012, Table 1), [19].
Geosciences 08 00479 g003
Figure 4. (A) Map of the “Pista” geoglyph in false colors, pixel size 5 cm, flight height approx. 120 m; (B) differential DSM (digital surface model) geoglyph “Pista”, pixel size 10 cm, with visible erosion disturbances due to enormous precipitation in the episode El-Niño; and (C) original DSM geoglyph “Pista”, pixel size 10 cm (software ArcGIS).
Geosciences 08 00479 g004aGeosciences 08 00479 g004b
Figure 5. (A) Detail of the resulting colored orthophoto with the great spiral and (B) differential DSM shows otherwise invisible details—there are visible typical erosion rills (erosion rills are the result of torrential rainfall that is common during El-Niño’s episodes; drainage water removes the surface material; in the next episode, the rills are further deepened. There is clearly visible damage of the geoglyph by this phenomenon).
Geosciences 08 00479 g005
Figure 6. New vector interpretation of Pista geoglyph, based on a remotely piloted aircraft system (RPAS) orthophoto, shows other details unknown before.
Geosciences 08 00479 g006
Figure 7. (A) Newly found geoglyph inside the well-known geoglyph Pista, similar to the “El Condor” or the “Hummingbird” geoglyph on the Pampa Nasca; line thickness 10–15 cm only (a detailed part of the original orthophotomap, created from aerial images taken by the eBee drone; false color) and (B) vector interpretation of the newly found geoglyph.
Geosciences 08 00479 g007
Figure 8. (A) Schema of the well-known geoglyph “El Condor” (Google Earth); (B) the “Hummingbird” geoglyph on the Pampa Nasca, hand held photo taken by K. Pavelka with approximate scale and orientation; 2004.
Geosciences 08 00479 g008
Figure 9. (A) Newly found geoglyph inside the well-known geoglyph Pista (may be Guinea pig): a detailed part of the original orthophotomap, created from aerial images taken by the eBee drone) and (B) a part of the orthophoto in false color (left) and vector interpretation of the geoglyph (right).
Geosciences 08 00479 g009
Table 1. An example of samples dating. During expedition in 2012, several samples from Nasca and Palpa locality were collected. 14C age is derived from samples gathered on pampa Palpa, Peru (Pista), in 2012, and the same samples were processed later by better 14C AMS technology (Accelerator Mass Spectrometry) in 2015. This analysis shows that e.g., sample Nr.13-098 is from the pre-Columbian age, but it is not evident if this sample has a relationship with “the Pista” geoglyph [19]. We cannot prove it. However, it is interesting why a 500-year-old piece of wood (in the desert area) lays on the geoglyph.
SampleDescriptionConventional Radiocarbon Age (BP)Calibrated Age (AD)P (%) Probability
13_097Palpa, 1,
geoglyph Pista
76 ± 881666–1783
1796–1949
1666–1949
39(2σ)
61(2σ)
96(2σ)
13_098Palpa, 2,
geoglyph Pista
434 ± 741440–1511
1572–1622
1415–1643
58 (σ)
35(σ)
95(2σ)
13_098 (AMS)Palpa, 2,
geoglyph Pista
473 ± 321420–149992
Table 2. Absolute Geolocation Variance (Pix4D software) in all coordinates (WGS-84).
X [m]Y [m]Z [m]
Mean −0.003030−0.0049910.122334
σ0.7069820.4446771.748451
RMS Error0.7069880.4447051.752725
Table 3. Flight and processing parameters based on photo set above the Pista geoglyph (Piux4D software).
Number of 3D points12.563.698
Point density (per m2)21.06
DSM and orthophoto resolution (GSD)5.05 cm/pixel
Output coordinate systemWGS84/UTM zone 18S

