Abstract
The 2013–14 winter storms were the most energetic storms in the European Atlantic on record since at least 1948. They caused intense erosive processes along the coast, similar to those described previously in places such as the United Kingdom and France. In this study, an analysis is conducted of the historical evolution (1956–2017) of four dune systems in the region of Cantabria (northern Spain) and their response to such storms. The analysis uses aerial images (from 1956, 2002, 2010, 2014, and 2017) implemented in ArcGIS, and the Digital Shoreline Analysis System (DSAS) model for the estimation of a series of statistical parameters relative to the historical behavior of the shoreline. The DSAS model allows a geometric structure to be calculated that is flexible and can be adapted to the morphological conditions of the coast. The results obtained from the model for the entire historical period and the pre-storm analysis show clear variability in the evolution of the dune systems, while the post-storm analysis yields homogeneous results that indicate significant erosion, with no signs of recovery. The limited time elapsed since the 2013–14 winter storm clustering and the high interannual energy variability of the subsequent winters seem to be behind the absence of evidence of dune system recovery and even the increase in the erosion processes observed in some cases.
1. Introduction
Climate change causes two alterations in coastal and environmental processes that affect the evolution and use of coastal zones and their vulnerability. First, climate change is causing a global sea level rise, [1] which at the end of this century [2] may equal those estimated for the initial and middle period of the Holocene (5–10 mm year−1). Jackson and Jevrejeva [3] estimate sea level rise ranging from 0.35 to 1.15 m at the end of 21st century. Secondly, associated with an increase in climate variability during the 20th century, it is estimated that climatic conditions will become more variable and extreme, in such a way that changes in the maritime climate will occur both regionally and globally [4,5,6]. One of the most important changes to the maritime climate affects the intensity and frequency of marine storms [7,8], and, more specifically, the reduction of the return period associated with extreme sea levels. It is evident that this last aspect must be closely linked to sea level rise and to the progressive increase in the capacity of the waters to reach higher topographic levels [9], which directly increases the impact of these storms on the coast. In multiple coastal regions, both factors (sea level rise and changing patterns of marine storms) may result in increased coastal erosion and an increase in the frequency and intensity of coastal flooding.
Western European coastlines are exposed to winter storms, which are strong extratropical cyclones associated with low pressure systems that track westward across the North Atlantic Ocean. As a result, the storms are associated with high-energy ocean waves coming from the W–NW. These extreme European storms tend to occur in clusters, with storm peaks separated by only two to three days [10]. This clustering and maximized wave energy arriving in the bay of Biscay typically occur under the combination of moderately positive North Atlantic Oscillation (NAO) phases [11,12] and more importantly highly positive WEPA (West Europe Pressure Anomaly) index [13].
Under a moderately positive NAO phase but a highly positive WEPA phase, the 2013–14 winter was characterized by a striking pattern of temporal and spatial extreme storm clustering. During the period from December 2013 to March 2014, the Spanish Cantabrian coast was hit by a series of large storms (some of which are among the most severe on record for the area). In recent decades, there have been winters with a high frequency of marine storms (1983, 1989, and 2008) on the northern Spanish coast, but none approaches the exceptional clustering of storms that was recorded during the 2013–14 winter.
This clustering was not an event that was unique to the Cantabrian coast of the Iberian Peninsula, but rather a pattern that was repeated with slight modifications along most of the European Atlantic coast. Coastal erosive processes and morphological changes were a common phenomenon across the European Atlantic. Examples of these phenomena can be found in multiple works [14,15,16,17,18].
The morphological impact of storms on beach-dune systems is well documented [19,20,21]. It is speculated that the largest morphological changes occur on these high-energy coastlines when locally sourced storms are directed onshore, they mobilize large quantities of sediment, and they coincide with high tide. Williams et al. [22] identified storm duration as an important facet of this sequence. Results from their modeling study on Rossbehy suggest that when high sea-levels (spring tides) and large storm waves occur concurrently, which is more likely when storm duration increases, the magnitude of storm impact is greatest. Spencer et al. [16] determined that storm surge may result in a pulse of dune retreat equivalent to about 10 years of ‘normal’ shoreline recession based on historical analyses. Those values are highly conditioned by shoreline configuration and geological constraints, which may play a significant role as the position of features such as headlands may distort the incident wave field [23,24].
A large number of research methodologies are available for monitoring extreme storm responses along dynamic coastlines, including deployment of ‘rapid response’ units that record individual storm processes and impacts [25], beach surveys [26], video monitoring [27], airborne LiDAR [28], satellite imagery [14], and the more commonly-used aerial photographs [29,30].
In this paper, based on the use of aerial images and orthoimages, an analysis is conducted of the effect of the 2013–14 winter marine storms on the historical evolution (1956–2017) of the main beach-dune systems of a sector of the Spanish Cantabrian coast (corresponding to the region of Cantabria). To achieve this objective, the position of the shoreline was analyzed examining three time intervals: the pre-storm period (1956–2010); the post-storm period (2010–2017); and, finally, the entire time period (1956–2017). The delimitation of the shoreline was done following the criteria of the dune vegetation line and the analysis of its spatial evolution over time was carried out using the “Digital Shoreline Analysis System (DSAS)” software. This procedure allows us to estimate rates (m year−1) of shoreline advance or retreat at multiple points along the coastline, and thus compare the trend shown by each segment in the different time intervals considered. The comparison of these trends makes it possible to analyze the effect of the 2013–14 winter storms on the historical evolution of the coastline. If a recovery period of three years is taken into account, these storms can effectively be considered a catastrophic event for the Cantabrian region’s dune systems.
2. Study Site
The region of Cantabria is located on the northern coast of the Iberian Peninsula, where the Atlantic Ocean is regionally known as the Cantabrian Sea (Figure 1). In general, this section of the Spanish coast has a cliff-like morphology, with an abrupt coastline, in which small-sized beach systems are developed and, in many cases, their development and location depend on the geology of the area. These beach systems present a greater development when their location coincides with the large river mouths on this stretch of coast. The contribution of sediments of fluvial origin allows for greater beach development, which in many cases results in beach-dune systems. These dune systems, whose orientation and development are influenced by coastal drift currents (usually from W to E), close in and protect the estuaries that develop at the mouths of the river channels.
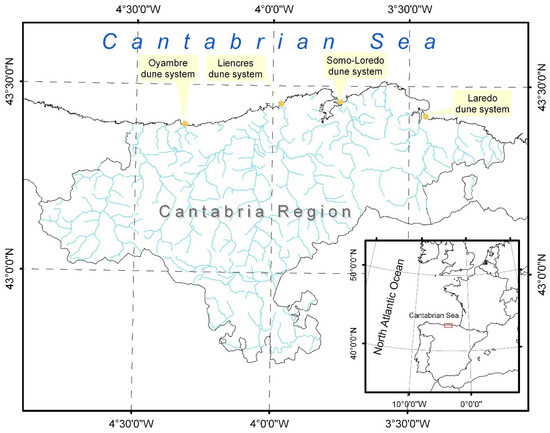
Figure 1.
Map of the Cantabrian region and the four beach-dune systems selected.
Within the limits of the Cantabria region, four beach-dune systems have been selected for this study. From east to west, they are: Laredo, Somo-Loredo, Liencres, and Oyambre (Figure 1). These four dune systems vary somewhat in their orientation towards the sea; for Laredo, the orientation is NNE; Liencres’ faces the NNW; and, finally, Somo-Loredo and Oyambre are oriented towards the N. In the case of Oyambre, the beach presents a general NE orientation; but most of the dune system located at the eastern end of the beach faces N. In the four examples studied, the dune system forms a sandspit whose end is not connected to earth closing the mouth of the associated river channels. This configuration allows for the development of sandy tidal plains of variable extension behind the back of the dune system.
These sections of the coast have a mesotidal range (with an average tidal range close to 3 m), with maximum values around 5 m at high tide. The wave system is characterized by Hs (significant wave height) values around 2 m and Tp (wave peak time period) values between 8–12 s. The maximum Hs value recorded in the historical data (1958–2018, Figure 2a–d) is close to 12 m, although the maximum annual average value is slightly above six meters in height. It is observed from this historical record of Hs values that the maximum monthly Hs value has exceeded eight meters only six times; five of these events occurred after 2007. The wave direction in open water is mostly from the NW (around 80%, Figure 2e), and the other main components come from the W, N, and NE. The dominant wind directions show greater variability, although the W-NW quadrant (Figure 2f) accounts for around 30% of the measurements.
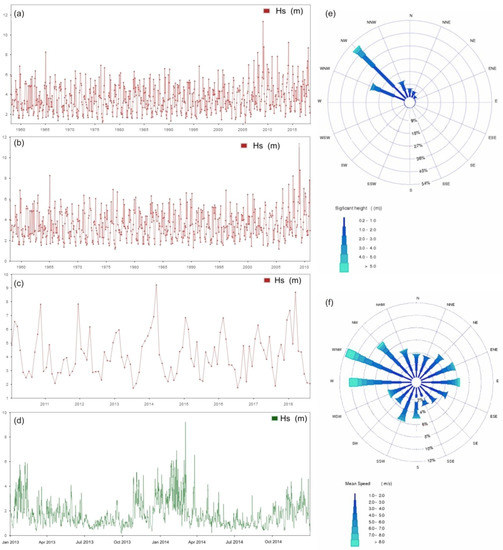
Figure 2.
Maritime climate in the Cantabrian region. Significant wave height historical record (maximum monthly value) for the entire time period of analysis (a), pre-storm period (b) and post-storm period (c). Significant hourly wave height for the 2013–14 winter storms (d). Significant wave height incident direction (e) and wind direction and magnitude (f). All data available from http://www.puertos.es/es-es/oceanografia/Paginas/portus.aspx.
Due to the urban development that has taken place during the period analyzed (1956–2017) and the recreational use of these coastal areas, the four dune systems have suffered a certain degree of anthropic alteration during this time. However, with the exception of the Laredo dune system (where the 2002 image already shows significant urban development with respect to the 1956 image), the level of urban disruption of the system can be considered to be medium-low (Somo-Loredo and Liencres) or low (Oyambre). Higher disruption has been experienced by the main rivers flowing towards these coastal areas, which have suffered the effects of human regulation of their flow regimes due to dams of varying sizes. This alteration in the flow regime could have modified the dragging capacity of the rivers and therefore the volume of sediment contributed to their outlet.
3. Data and Methods
To carry out the historical evolution analysis of the dune systems selected, aerial images and aerial orthoimages (National Geographic Institute, Ministry of Development of the Government of Spain: all data available from “http://centrodedescargas.cnig.es/CentroDescargas/index.jsp”) from different dates between 1956 and 2017 have been used. Specifically, the orthoimages correspond to the years 1956, 2002, 2010, and 2014 and those for 2017 (the most recent for the study area) are aerial images. The spatial resolution of the orthoimages used varies between 0.5–0.25 m, while for aerial images it is 0.22 m. In all cases the planimetric accuracy of the images is ≤0.5 m. The coordinate reference system used for the orthoimages is the European Terrestrial Reference System 1989 (ETRS89)—UTM Zone 30N, which will also be used for the geo-referencing of the aerial images from 2017. The aerial images from 2017 were geo-referenced by establishing control points that met previously established criteria [31,32], along with uniform spatial distribution in the aerial image using man-made elements as location markers.
Using all of this geo-referenced graphic data, the analysis of the shoreline’s historical evolution was carried out using the software DSAS v4.4 (Digital Shoreline Analysis System, U.S. Geological Survey: Woods Hole, MA, USA [33]), which works within the ArcGIS 10.4 software (Esri Geosystems©, Redlands, CA, USA). DSAS was developed by the US Geological Survey with TPMC Environmental Services [34]. The DSAS software allows users to estimate different statistical parameters related to temporal (or historical) evolution using a geodatabase that must contain the defined shorelines for each historical image used, as well as the date associated with those images. To generate the geodatabase, the shoreline was digitized on the geo-referenced aerial images and orthoimages, using the vegetation line on the dune system as the criterion for identifying shoreline position. This criterion [30] is viewed as having greater spatial precision and less uncertainty when the dominant process on the coast is erosion [35], although it can pose problems when the dominant trend on the coast is accretion. Boak and Turner [35] offer a compilation of the main criteria used to define the shoreline, grouping them into three main categories: those based on visually identifiable elements on the coast; those that are based on a tidal datum-based shoreline indicator; and finally (and more recent) those based on the automatic extraction of the shoreline from image processing techniques.
The statistical parameters related to the historical evolution of the shoreline estimated by the DSAS software are calculated for a series of points located along the coastline, with a user-defined interval. At each of these points, the program generates a transect with a user-defined length (the lengths needed to cover the position of the shoreline in all the images used) that is perpendicular to another line defined by the user and called the “Baseline” (which must represent the general form and direction of the coastline in the study area). Subsequently, the distance interval between calculation points can be modified, by digitally editing the position and direction of the transects generated by the program in the ArcGIS environment, according to the needs associated with the morphological complexity of the coastline.
These statistical parameters estimated by the DSAS software refer mainly to annual average values or total distances based on the change rates of time series data. A detailed description of each parameter can be found in the program’s user manual [33]. This study mainly used the values offered by three of the estimated parameters: EPR (End Point Rate); LRR (Linear Regression Rate); and NSM (Net Shoreline Movement). EPR estimates an average annual evolution rate (m year−1) by directly diving the distance measured between the position of the oldest and most current shoreline and the time period covered by these images. LRR shows the slope of a direct linear regression fit on the set of dates analyzed; this slope is associated with the annual average evolution rate (m year−1). Finally, NSM indicates the distance in meters between the position of the oldest and most current shoreline at each of the calculation points.
With the aim of highlighting the effect of the storms that occurred during the 2013–14 winter, the analysis of the historical evolution of the shoreline in the four dune systems has been performed considering three different time intervals: first, the interval that covers the entire time period of the images used (1956–2017); second, the period prior to the occurrence of the 2013–14 storms (1956–2010); and, finally, an interval that covers the most recent time period, which would show the effect caused by the storms and the possible subsequent recovery of the dune systems (2010–2017).
All the spreadsheets with the results obtained through the DSAS software are again integrated into ArcGIS together with the aerial images used in the study. Thus, the alphanumerical information can be associated with a transect and therefore related to a specific point of the coast. Finally, the values of the statistical parameters are divided into classes or intervals, which allows for easier interpretation of the results and the definition of coastal zones that present homogeneous behaviors, as well as the location of the boundaries between them. Thus, all of this information allows us to link the historical evolution of different segments of the coastline to their degree of wave exposure, their orientation with respect to the incident wave field, their position within the dune system, or their level of anthropic alteration in the period analyzed.
4. Results
In order to carry out the analysis of the shoreline’s historical evolution in the dune systems, the results offered by the DSAS software have been classified into five intervals: high accretion (>1 m year−1), moderate accretion (0.5–1 m year−1), mainly stable (0.5–−0.5 m year−1), moderate erosion (−0.5–−1 m year−1), and high erosion (<−1 m year−1). From the results, it is observed that the distribution of zones with erosion, stability or sedimentation does not vary significantly when using the EPR or LRR rate for the analysis (although there are differences in the estimated value rates for each statistical parameter).
The Laredo dune system, the easternmost of the four chosen, shows the presence of two zones with clearly differentiated historical evolution trends. This is true both when analyzing the entire period (1956–2017) and for the period before the 2013–14 winter storms. In this historical change to the shoreline (Figure 3a), the eastern half of the dune system shows a clear advance towards the sea (accretion), which is most pronounced at the eastern end (where the modal values are >1 m year−1) and decreases as we move west (prevailing values between 0.5–1 m year−1). In the western half, there is a clear change in the historical trend, and after a limited area of relative stability (values between 0.5–−0.5 m year−1), erosion of the shoreline comes to dominate the historical trend. In this western zone, the first differences appear between the results related to the entire time period and those associated with the pre-storm period; in the latter, the western end of the dune system (associated with the extreme of the sandspit) shows a predominance of values related to relative stability over time.
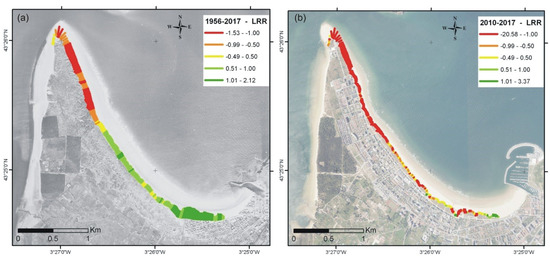
Figure 3.
Digital Shoreline Analysis System (DSAS) results for the Linear Regression Rate (LRR) statistical parameter (m year−1) at the Laredo dune system, for the entire time period (a) and post-storm period (b).
The pattern of historical evolution described thus far undergoes great changes when the post-storm period is analyzed. In this period, erosional rate values (Figure 3b) are dominant throughout the entire dune system. However, there are zones of relative stability and some that even have a sedimentary tendency at the eastern end.
Moving westward, we find the Somo-Loredo dune system, which underwent significant growth towards the west between 1956 and 2002 (although this could not be reflected properly in the DSAS model, as it was impossible to reproduce a shoreline, that had not yet formed in 1956 using the DSAS Baseline). This growth process can be clearly identified by observing the aerial orthoimages from these years (Figure 4a), and results in the absence of shoreline at the western end of the dune system for the orthoimage from 1956. The results of the DSAS model for this area (with the 2002–2017 interval used for the full time period, and 2002–2010 for the pre-storm period) show high variability, with areas where accretion predominates, areas where erosion dominates, and relatively stable areas. For the rest of the dune system, as is the case in Laredo, the results of the analysis of the complete period and the pre-storm period are quite similar. Thus, from east to west, there is a first zone where relative stability dominates, with small sub-zones with an erosive tendency. Moving westward, the results show a fairly homogeneous area where the retreat of the shoreline is dominant. At the central part of the dune system we find an area where the evolutionary trend is reversed, and the process of shoreline seaward displacement predominates; this zone does not show the homogeneity of the previous one, with interspersed values of stability and even erosion. Finally, in the westernmost part of the dune system, the LRR values are associated with relative stability in the historical evolution of the shoreline. A pattern similar to that indicated for this last zone (Figure 4b) can be found along the entire back side of the dune (and therefore without the direct influence of the swell).
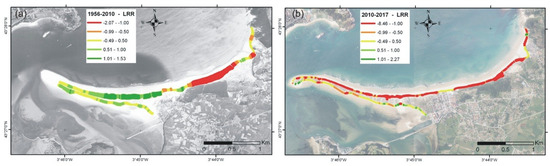
Figure 4.
DSAS results for the Linear Regression Rate (LRR) statistical parameter (m year−1) at the Somo-Loredo dune system, for the pre-storm (a) and post-storm periods (b).
These trends in the historical evolution of the shoreline change completely when the post-storm time period is analyzed. The results of this analysis (Figure 4) show a general erosive trend for the entire foredune, with small interruptions in this trend associated with areas of relative stability. Fewer differences are found in the back side of the dune system, where relative stability still prevails, although with an increase in areas with an erosive tendency.
The third dune system, Liencres, undoubtedly shows the greatest homogeneity in the results, both on a spatial and temporal scale. In all cases, a historical erosive trend is observed for the dune system (Figure 5a), which intensifies when the analysis focuses on the post-storm period. Thus, when the time period covered is the total or the pre-storm period, the dune system shows a moderate erosive trend (values between 0.5–−1 m year−1) and this tendency moves towards high erosion (values < −1 m year−1) when analyzing only the period after the 2013–14 winter storms (Figure 5b).
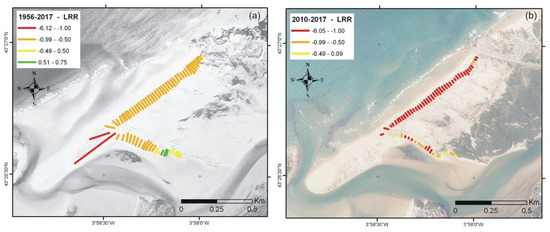
Figure 5.
DSAS results for the Linear Regression Rate (LRR) statistical parameter (m year−1) at the Liencres dune system, for the entire time period (a) and post-storm period (b).
In the Liencres dune system, as in the case of Somo-Loredo, there are aspects (like the one explained below) that can be identified from the visual analysis of the aerial images that are not easy to include within the DSAS model. In this dune system, there is a sandy spit to the west of its main body (Figure 5) (with variable vegetation) that is interrupted in its longitudinal growth by wash-over channels. The position of these channels changes randomly over the images analyzed, so their inclusion within the DSAS model was controversial. In its development towards the west, this sandspit shows a lower degree of temporal stability than the rest of the dune system, and may be affected more frequently by incident waves.
The last of the dune systems analyzed (the westernmost) is Oyambre, the smallest in terms of area. The historical evolution of the shoreline for the entire period shows a great degree of homogeneity, and could be classified as relatively stable (values between 0.5–−0.5 m year−1); this trend only breaks in the transects located at the eastern end of the dune system (Figure 6a), which limit the expanse of the mouth of the La Rabia estuary, where the trend is moderately erosive (−0.5—−1 m year−1). When analyzing the pre-storm period, a similar pattern (relative stability) can be observed, even in those transects located at the eastern sandspit. This homogeneity is also seen when analyzing the post-storm period (Figure 6b), although in this case the dominant values are high erosion (<−1 m year−1). In this time period, LRR values of moderate erosion (−0.5–−1 m year−1) are observed, even in areas on the back side of the dune system (which continues into a sandy tidal flat); however, in the other two time periods considered, the relative stability of the coastline was dominant.
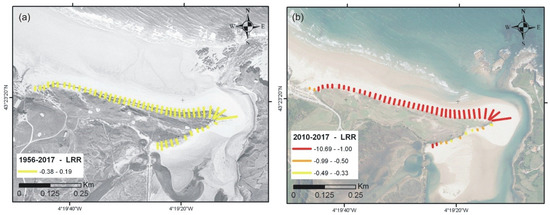
Figure 6.
DSAS results for the Linear Regression Rate (LRR) statistical parameter (m year−1) at the Oyambre dune system, for the entire time period (a) and post-storm period (b).
The results obtained in the four dune systems analyzed are not homogeneous. Thus, in Laredo and Somo-Loredo alongshore variability in dune erosion can be seen, while in Liencres and Oyambre there is alongshore-uniform erosion. Those differences may be the result of varying wave exposure, as the locations with alongshore erosion variability are sheltered by Cape Santoña and Cape Mayor. This sheltering changes the direction of incident wave trains and cross-shore and alongshore coastal currents, thereby controlling the energy exposure of the beach-dune system. Moreover, in the Laredo dune system the expansion of the marina may play a key role in the accretionary trend on the eastern side of the beach-dune system. Direct exposure to incident waves promotes a more uniform erosion trend in the Liencres and Oyambre dune systems.
5. Discussion
The first aspect that must be considered when conducting an analysis of the historical evolution of the shoreline is the accuracy of the source data, in this case the aerial images and orthoimages. Inaccuracies could arise due to the inherent optical deformations of analog cameras, or from the use of different topographic data for the data sources. In this regard, Crowell et al. [36] analyzed the average errors associated with historical data used by FEMA and proposed values close to 2 m of positional error for aerial images and maps from the mid-20th century. However, Moore [31] already suggests that these errors can be significantly reduced by applying new techniques in cartography and photogrammetry. This is the case for the data used in this study, whose planimetric precision (or positional error) is less than 0.5 m. Thus, this value of planimetric precision has been adopted as a general uncertainty value in the delimitation of the shoreline; it was also taken into account that the spatial resolution of the images used was always the same or smaller (values between 0.5 and 0.22 m in pixel size) than said planimetric precision value.
The planimetric precision of the source data has also been used when defining the different classification intervals of the shoreline’s historical evolution trends. Thus, the shoreline has been considered to be relatively stable when the rates determined by the DSAS model were within this limit (between 0.5 and −0.5 m year−1). However, the use of a wider range for relative stability could mask gentle historical erosive or sedimentary trends. To try to evaluate this effect, a second classification of the historical evolution trends has been performed, in which the relative stability interval is defined by a limit of ±0.25 m year−1 (modal value of the data sources’ spatial resolution). The results of this second classification (Figure 7) do not show large differences compared to the first proposal. Only in the case of Somo-Loredo (Figure 7b) can we see an increase in variation in the historical trend, where, in general, areas previously classified as relatively stable show a moderate sedimentary trend (mainly in the transects located on the back side of the sandspit), although in other cases (these are fewer and of limited length), the variation points in the opposite direction.
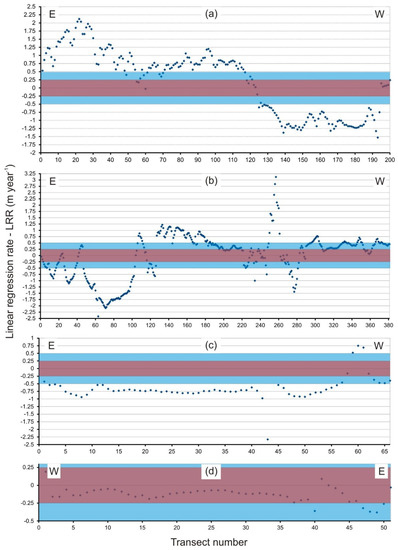
Figure 7.
Differences in dune historical trends using two different “relative stability” class limits: ±0.5 m year−1 (blue area) and ±0.25 m year−1 (red area) for the four dune systems analyzed, Laredo (a), Somo-Loredo (b), Liencres (c), and Oyambre (d).
The historical shoreline analysis carried out shows four dune systems with different evolutionary trends, an aspect that had already been pointed out as a general pattern for most of the northern coast of the Iberian Peninsula [37]. In the case of Laredo, the results point toward a modification in the shape of the dune system, with southward displacement of the western end and a general rotation of the sandspit (whose main axis would rotate from NW towards WNW). In Somo-Loredo, the historical trend of the shoreline shows a general growth of the dune system (which is clearer when the limits of the relative stability interval are reduced), which may be fed in part by the sediment produced by the erosion that is taking place at the eastern end of the sandspit. The Liencres dune system indicates a generalized retreat of the shoreline, although the rate is slowing. Finally, the historical evolution of the dune system of Oyambre indicates relative stability over time.
However, these patterns are drastically altered by the 2013–14 winter storms. Thus, at the end of April 2014, the four dune systems show significant erosion processes, with maximum retreats of the shoreline greater than those indicated by Castelle et al. [14] on the Gironde coast or Pye and Blott [18] in the vicinity of Liverpool Bay. These retreats reach values of up to 50–60 m at the eastern end of the Oyambre dune system. Shoreline retreat values between 5–20 m are common along the entire length of the foredune at the study sites. This variation in the historical trend of the shoreline has a direct effect on the results obtained, in which the adjustment value (R2) of the LRR statistical parameter usually shows very low values (Figure 8) conditioned by this change in the historical trend.
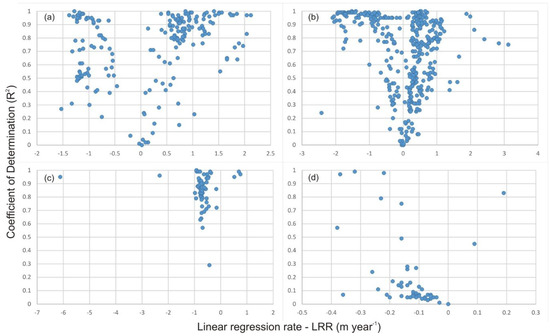
Figure 8.
Relationship between the LRR statistical parameter and its coefficient of determination (R2) for the dune systems analyzed: Laredo (a), Somo-Loredo (b), Liencres (c), and Oyambre (d).
It should be considered that during the period analyzed there have been changes in the vegetation (mainly from the river basins that drain to the study sites); changes in the sediment supply from rivers (due to their regulation by dams); and a limited urbanization of some of the dune systems. All of these disruptions with respect to the initial conditions may have had some influence on the evolution of the dune systems. However, the influence of all these factors is likely rather limited, since the evolution of the dune systems did not show a clear erosive tendency until 2010, and it is not until the 2013–14 winter storm clustering that a great disturbance occurred in those dune systems. Therefore, the factors mentioned above, and others such as sea level rise, or the geomorphological orientation and configuration of the coast may have predisposed the dune systems to suffer significant erosion, but the entire system was not activated until the weather conditions associated with winter 2013–14 occurred.
The 2013–14 winter storms are the largest on record [14,15]. It is generally considered [7] to be the most energetic winter on the European Atlantic coast (where the study area is included) since at least 1948, from a study based on data from the Wave Watch III model. Although the 2013–14 winter is viewed as the most energetic, this does not mean that it included the largest storm recorded in the region based on maximum Hs values; the largest storm according to this measurement occurred during the 2008–09 winter. However, unlike the 2013–14 storms, those that occurred during the 2008–09 winter did not produce intense erosive processes on the coast, as can be seen from the results obtained. This situation may be explained by two circumstances that occurred during the 2013–14 storms and that were mentioned previously [15]: on the one hand, the southward displacement of the storms’ track with respect to the general trend; and on the other, the presence of a significant temporal clustering of high-energy storms that winter. This second circumstance, extremely important in dune erosion due to the cumulative impact of several severe storms, coincides with what happened on the Cantabrian coast, where there was a clear clustering of high-energy storms (Figure 2d) between January and March 2014. This storm clustering did not occur during the 2008–09 winter, nor in the two winters prior to the dates of the images used in this study. Therefore, this clustering of storms could be considered to be a unique phenomenon (at least in the study area) that intensified the erosive effects associated with the 2013–14 storms, mainly toward the end of winter, as previously noted [14,15]. In addition, it has been indicated [38] that storm-induced beach erosion resulting from a cluster of storms can be much higher than that due to a single storm with wave power that is equivalent to the wave power of the storm cluster.
Another factor to be taken into account in the analysis of the storms’ impact on the coast is the Tp value [15], due to its direct relationship with the wave energy flux estimation. However, the Tp values associated with the 2013–14 winter storms do not represent an anomaly within the historical series beyond the slight increase in the mean value of observable Tp (Figure 9a,b) starting in the 2006–2007 period. This increase in the Tp mean value correlates with the increase in the average value of observable Hs (Figure 2a), which also begins in the 2006–2007 period. These variations, as proposed by recent studies [8], may be conditioned by the WEPA index, and their variability and extreme values may continue to increase over the next decades. Thus, the increase observed in these two variables points towards an increase in the impact of storms on the coast from those dates onward, although it is not until the 2013–14 winter when it becomes evident (possibly due to the appearance of a third factor, such as the temporary clustering of high-energy storms). Finally, the possible cumulative effect on the capacity of storms to impact the coast associated with sea level rise cannot be ruled out. This sea level rise in the Cantabria area has been estimated around 2 mm year−1 [39] for the historical series 1946–2001. However, this value is not observed as a constant rate throughout the period analyzed, in which there were phases of higher and lower rates of sea level rise that the authors relate to the evolution of the NAO index. This average value of sea level rise can be considered comparable to those obtained by Hay et al. [40]. Said study obtained slightly lower values (1.2 mm year−1) on a global scale for the period 1901–1990, while obtaining slightly higher values (3.0 mm year−1) in the most recent time period, 1993–2010.
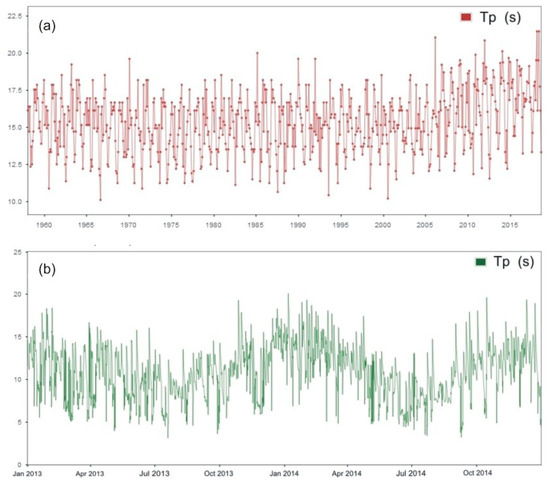
Figure 9.
Maximum monthly value (a) for the wave crest time period (seconds), Tp; and hourly values (b) of Tp variable in the 2013–14 winter season.
The effect of the 2013–14 winter storms is manifested as an anomaly within the historical evolutionary trend of the dune systems analyzed. Thus, the effect of the 2013–14 storms marks a drastic change in the historical trend, resulting in generalized erosive behavior that has not yet been compensated for by natural recovery processes. The natural regeneration of dune systems after significant erosive events does not have a clear timeframe, and, as pointed out by Houser et al. [41], can vary considerably and presents a weak positive correlation with the height and development of the dune system prior to the occurrence of the erosive event. This recovery period can also be affected by the typology of the coast [42], and is not associated with periods of calm, but rather, as these authors indicate, the occurrence of high energy events is also essential to the recovery process. Winter climate conditions have been considered to be a key factor [43] for dune recovery, and the authors indicate that a period of low energy (mainly in the winter months) is necessary to promote said recovery. However, after the 2013–14 winter storms, both the high- and low-energy winters have occurred, with 2013–14 and 2015–16 as high-energy winters, and 2014–15 and 2016–17 as accretionary winters. This energetic variability is unlikely to have favored the dune systems’ recovery. In accordance with the above, 2013–2016 has been identified as the most recent potential erosive period [44], characterized by a high frequency of extreme water levels. Regarding the timeframe of the recovery period, Morton et al. [45] propose, in their study on the southeast coast of Texas, average recovery periods of four to five years in which the beach-dune systems can recover around 67% of the eroded sand. Longer recovery periods are also suggested by other authors [41,42,46]. Very different recovery periods are associated with beach systems. So, in areas of the French coast [47] that underwent significant erosive processes associated with the 2013–14 storms, sand volume returned to its pre-storm level in a period of only one and a half years. Other authors [48] have stated that recovery in beach systems can occur in days, although in general it may take months.
In the case of the four dune systems analyzed, post-storm behavior is not homogeneous, such that in the case of Laredo and Somo-Loredo, no significant changes are observed between the shoreline position in the September 2014 image and the July 2017 image, beyond small variations in both directions (recovery or increased erosion). In the case of Oyambre, no significant variations are observed except on the eastern side of the foredune, where a clear increase in erosion is noticeable, with the resulting retreat of the shoreline. Finally, in the case of the Liencres dune system, there is a general increase in erosion between 2014 and 2017, linked to the retreat of the shoreline. The absence of evidence of dune system recovery may be conditioned, as proposed by Burvingt et al. [43], by the climatic variability of the winters after 2013–14; moreover, the high energy associated with the 2015–16 winter may have eliminated any recovery that had taken place in previous years.
The orientation of these dune systems with respect to the preferred wave incidence direction may play a role in their recovery, although a clear pattern cannot be established from the results obtained. It is true that Liencres, the dune system oriented most perpendicularly to the wave incidence direction, is in the worst condition, with a generalized increase in erosion (retreat of the shoreline). However, it is also true that part of the Somo-Loredo system is exposed directly to the action of the swell and it does not show a clear retreat of the shoreline; it does not even show clear differences along the beach-dune system between the area exposed directly to the waves and the one that is protected from it by Cape Mayor.
All these arguments point toward two main factors in the absence of evidence of dune system recovery in the sites analyzed. On the one hand, the time elapsed (three years) since the extreme erosive processes occurred does not seem to be sufficient [41,42,45,46] for these dune systems to have recovered to their situation prior to the extreme 2013–14 winter storm clustering. Second, the energy variability of subsequent winters [8,13,43] has not favored recovery processes, and the high energy associated with the 2015–16 winter storms may have eliminated incipient evidence of recovery. This second factor would be confirmed by increased erosive processes in the dune systems exposed more directly to incident wave action, such as Oyambre and Liencres.
6. Conclusions
The 2013–14 winter storms caused significant erosion processes throughout the European Atlantic coast. These storms are considered the most energetic on record since 1948, and their significant temporal clustering has been identified as one of the main causes of their great erosive potential.
The analysis (implemented in ArcGIS using the Digital Shoreline Analysis System software) of the historical shoreline evolution in four dune systems in the Cantabria region (northern Spain) from aerial images and orthoimages, shows important variations in their historical trends. However, their response to the 2013–14 storms was homogenous. The results show that the severe 2013–14 winter storm waves caused unprecedented erosion of the dune systems in the study area. These erosive processes are manifested in retreats of the foredune that exceed several tens of meters, and a dune erosion scarp height often exceeding 5 m. These effects are unprecedented in the historical record (1956–2017), and a subsequent recovery phase has not been observed. On the contrary, the evidence from the 2013–14 winter storms shows, in many cases, an increase of the erosive processes that could be associated with the general instability of these dune systems, and the climate variability of the subsequent winters, which has not allowed the dune systems to recover.
Therefore, the results point toward the combination of two different factors. On the one hand, the time needed for the dune systems to return to their condition prior to the 2013–14 winter storms may be greater than the time elapsed after these storms. This point is consistent with the recovery times noted previously by other authors. However, currently there are no signs that indicate that the systems have begun to recover. On the second hand, this point could be explained by the high variability of climate energy during subsequent winters. Thus, the annual alternations between (according to the WEPA index data) high-energy winters (2013–14, 2015–16) and low-energy winters (2014–15, 2016–17) with an accretionary trend, would not have allowed for consistent recovery action over time in the Cantabrian dune systems.
Author Contributions
All authors have a significant contribution to final version of the paper. Conceptualization, J.G. and G.G.H.; Formal analysis, A.D.-Á. and H.V.N.; Investigation, J.G.; Methodology, J.G.; Writing—original draft, J.G.; Writing—review & editing, A.D.-Á., H.V.N. and G.G.H.
Funding
This research received no external funding.
Acknowledgments
The authors (J.G. and H.V.N.) wish to acknowledge the Government of Mozambique for the financial support for the completion of the H.V.N.’s Master’s Degree at the Complutense University of Madrid. Two anonymous reviewer are gratefully acknowledged for their constructive criticism and insightful comments that greatly improved the manuscript.
Conflicts of Interest
The authors declare no conflict of interest.
References
- Nicholls, R.J.; Marinova, N.; Lowe, J.A.; Brown, S.; Vellinga, P.; De Gusmão, D.; Hinkel, J.; Tol, R.S.J. Sea-level rise and its possible impacts given a ‘beyond 4 °C world’ in the 21st century. Philos. Trans. R. Soc. A 2011, 369, 161–181. [Google Scholar] [CrossRef] [PubMed]
- Woodroffe, C.D.; Murray-Wallace, C.V. Sea-level rise and coastal change: The past as a guide to the future. Quat. Sci. Rev. 2012, 54, 4–11. [Google Scholar] [CrossRef]
- Jackson, L.P.; Jevrejeva, S. A probabilistic approach to 21st century regional sea-level projections using RCP and High-end scenarios. Glob. Planet. Chang. 2016, 146, 179–189. [Google Scholar] [CrossRef]
- Dodet, G.; Bertin, X.; Taborda, R. Wave climate variability in the North-East Atlantic Ocean over the last six decades. Ocean Model 2010, 31, 120–131. [Google Scholar] [CrossRef]
- Knutson, T.R.; McBride, J.L.; Chan, J.; Emanuel, K.; Holland, G.; Landsea, C.; Held, I.; Kossin, J.P.; Srivastava, A.K.; Sugi, M. Tropical cyclones and climate change. Nat. Geosci. 2010, 3, 157–163. [Google Scholar] [CrossRef]
- Wang, X.L.; Feng, Y.; Compo, G.P.; Swail, V.R.; Zwiers, F.W.; Allan, R.J.; Sardeshmukh, P.D. Trends and low frequency variability of extra-tropical cyclone activity in the ensemble of twentieth century reanalysis. Clim. Dyn. 2012, 40, 2775–2800. [Google Scholar] [CrossRef]
- Masselink, G.; Castelle, B.; Scott, T.; Dodet, G.; Suanez, S.; Jackson, D.; Floc’h, F. Extreme wave activity during 2013/2014 winter and morphological impacts along the Atlantic coast of Europe. Geophys. Res. Lett. 2016, 43, 2135–2143. [Google Scholar] [CrossRef]
- Castelle, B.; Dodet, G.; Masselink, G.; Scott, T. Increased winter-mean wave height, variability, and periodicity in the northeast Atlantic over 1949–2017. Geophys. Res. Lett. 2018, 45, 3586–3596. [Google Scholar] [CrossRef]
- Fiore, M.M.E.; D’Onofrio, E.E.; Pousa, J.L.; Schnack, E.J.; Bértola, G.R. Storm surges and coastal impacts at Mar del Plata, Argentina. Cont. Shelf Res. 2009, 29, 1643–1649. [Google Scholar] [CrossRef]
- Vitolo, R.; Stephenson, D.; Cook, I.; Mitchell-Vallace, K. Serial clustering of intense European windstorms. Meteorol. Z. 2009, 18, 411–424. [Google Scholar] [CrossRef]
- Donat, M.G.; Leckebusch, G.C.; Pinto, J.G.; Ulbrich, U. Examination of wind storms over Central Europe with respect to circulation weather types and NAO phases. Int. J. Clim. 2010, 30, 1289–1300. [Google Scholar] [CrossRef]
- Gomara, I.; Rodriguez-Fonseca, B.; Zurita-Gotor, P.; Pinto, J.G. On the relation between explosive cyclones affecting Europe and the North Atlantic Oscillation. Geophys. Res. Lett. 2014, 41, 2182–2190. [Google Scholar] [CrossRef]
- Castelle, B.; Dodet, G.; Masselink, G.; Scott, T. A new climate index controlling winter wave activity along the Atlantic coast of Europe: The West Europe Pressure Anomaly. Geophys. Res. Lett. 2017, 44, 1384–1392. [Google Scholar] [CrossRef]
- Castelle, B.; Marieu, V.; Bujana, S.; Splinter, K.D.; Robinet, S.; Sénéchal, N.; Ferreira, S. Impact of the winter 2013–2014 series of severe Western Europe storms on a double-barred sandy coast: Beach and dune erosion and megacusp embayments. Geomorphology 2015, 238, 135–148. [Google Scholar] [CrossRef]
- Masselink, G.; Scott, T.; Poate, T.; Russell, P.; Davidson, M.; Conley, D. The extreme 2013/2014 winter storms: Hydrodynamic forcing and coastal response along the southwest coast of England. Earth Surf. Proc. Land 2015, 41, 378–391. [Google Scholar] [CrossRef]
- Spencer, T.; Brooks, S.M.; Tempest, J.A.; Moller, I. Southern North Sea storm surge event of 5 December 2013: Water levels, waves and coastal impacts. Earth Sci. Rev. 2015, 146, 120–145. [Google Scholar] [CrossRef]
- Kandrot, S.; Farrell, E.; Devoy, R. The morphological response of foredunes at a breached barrier system to winter 2013/2014 storms on the southwest coast of Ireland. Earth Surf. Proc. Land 2016, 41, 2123–2136. [Google Scholar] [CrossRef]
- Pye, K.; Blott, S.J. Assessment of beach and dune erosion and accretion using LiDAR: Impact of the stormy 2013–2014 winter and longer term trends on the Sefton Coast, UK. Geomorphology 2016, 266, 146–167. [Google Scholar] [CrossRef]
- Cooper, J.A.G.; Jackson, D.W.T.; Navas, F.; McKenna, J.; Malvarez, G. Identifying storm impacts on an embayed, high-energy coastline; examples from western Ireland. Mar. Geol. 2004, 210, 261–280. [Google Scholar] [CrossRef]
- Dissanayake, D.M.P.K.; Ranasinghe, R.; Roelvink, J.A. Effect of sea level rise in tidal inlet evolution: A numerical modelling approach. J. Coast. Res. 2009, 56, 942–946. [Google Scholar]
- Suanez, S.; Cariolet, J.M.; Cancouët, R.; Ardhuin, F.; Delacourt, C. Dune recovery after storm erosion on a high-energy beach: Vougot beach, Brittany (France). Geomorphology 2012, 139–140, 16–33. [Google Scholar] [CrossRef]
- Williams, J.J.; Esteves, L.S.; Rochford, L.A. Modelling storm responses on a high-energy coastline with XBeach. Model. Earth Syst Environ. 2015, 1. [Google Scholar] [CrossRef]
- Burningham, H. Contrasting geomorphic response to structural control: The Loughros estuaries, northwest Ireland. Geomorphology 2008, 97, 300–320. [Google Scholar] [CrossRef]
- O’Connor, M.C.; Cooper, J.A.G.; Jackson, D.W.T. Decadal behavior of tidal inlet–associated beach systems, northwest Ireland, in relation to climate forcing. J. Sediment Res. 2011, 81, 38–51. [Google Scholar] [CrossRef]
- Brodie, K.L.; McNinch, J.E. Measuring bathymetry, runup, and beach volume change during storms: New methodology quantifies substantial changes in cross-shore sediment flux. In Proceedings of the American Geophysical Union, Fall Meeting, San Francisco, CA, USA, 14–18 December 2009. [Google Scholar]
- Stephan, P.; Suanez, S.; Fichaut, B. Long-term morphodynamic evolution of the Sillon de Talbert gravel barrier (Brittany, France). Shore Beach 2012, 80, 19–36. [Google Scholar]
- Poate, T.G.; Masselink, G.; Russell, P.E.; Austin, M.J. Morphodynamic variability of high-energy macrotidal beaches, Cornwall, UK. Mar. Geol. 2014, 350, 97–111. [Google Scholar] [CrossRef]
- Houser, C. Alongshore variation in the morphology of coastal dunes: Implications for storm response. Geomorphology 2013, 199, 48–61. [Google Scholar] [CrossRef]
- Priest, G.R. Coastal shoreline change study: Northern and central Lincoln County, Oregon. J. Coast. Res. 1999, 28, 140–157. [Google Scholar]
- Moore, L.J.; Benumof, B.T.; Griggs, G.B. Coastal erosion hazards in Santa Cruz and San Diego. J. Coast. Res. 1999, 28, 121–139. [Google Scholar]
- Moore, L.J. Shoreline mapping techniques. J. Coast. Res. 2000, 16, 111–124. [Google Scholar]
- Hughes, M.L.; McDowell, P.F.; Marcus, W.A. Accuracy assessment of georectified aerial photographs: Implications for measuring lateral channel movement in a GIS. Geomorphology 2006, 74, 1–16. [Google Scholar] [CrossRef]
- Thieler, E.R.; Himmelstoss, E.A.; Zichichi, J.L.; Ergul, A. Digital Shoreline Analysis System (DSAS) Version 4.0—An ArcGIS Extension for Calculating Shoreline Change; ver. 4.4, July 2017; U.S. Geological Survey Open-File Report 2008-1278; U.S. Geological Survey: Woods Hole, MA, USA, 2017; pp. 1–81.
- Thieler, E.R.; Danforth, W.W. Historical Shoreline Mapping (II): Application of the Digital Shoreline Mapping and Analysis Systems (DSMS/DSAS) to Shoreline Change Mapping in Puerto Rico. J. Coast. Res. 1994, 10, 600–620. [Google Scholar]
- Boak, E.H.; Turner, I.L. Shoreline Definition and Detection: A Review. J. Coast. Res. 2005, 21, 688–703. [Google Scholar] [CrossRef]
- Crowell, M.; Leatherman, S.P.; Buckley, M.K. Historical shoreline change—Error analysis and mapping accuracy. J. Coast. Res. 1991, 7, 839–852. [Google Scholar]
- Flor, G.; Flor-Blanco, G. An introduction to the erosion and sedimentation problems in the coastal regions of Asturias and Cantabria (NW Spain) and its implications on environmental management. J. Coast. Res. 2005, 49, 58–63. [Google Scholar]
- Karunarathna, H.; Pender, D.; Ranasinghe, R.; Short, A.D.; Reeve, D.E. The effects of storm clustering on beach profile variability. Mar. Geol. 2014, 348, 103–112. [Google Scholar] [CrossRef]
- Marcos, M.; Gomis, D.; Monserrat, S.; Álvarez-Fanjul, E.; Pérez, B.; García-Lafuente, J. Consistency of long sea-level time series in the northern coast of Spain. J. Geophys. Res. 2005, 110, C03008. [Google Scholar] [CrossRef]
- Hay, C.C.; Morrow, E.; Kopp, R.E.; Mitrovica, J.X. Probabilistic reanalysis of twentieth-century sea-level rise. Nature 2015, 517, 481–484. [Google Scholar] [CrossRef]
- Houser, C.; Wernette, P.; Rentschlar, E.; Jones, H.; Hammond, B.; Trimble, S. Post-storm beach and dune recovery: Implications for barrier island resilience. Geomorphology 2015, 234, 54–63. [Google Scholar] [CrossRef]
- Scott, T.; Masselink, G.; O’Hare, T.; Saulter, A.; Poate, T.; Russell, P.; Davidson, M.; Conley, D. The extreme 2013/2014 winter storms: Beach recovery along the southwest coast of England. Mar. Geol. 2016, 382, 224–241. [Google Scholar] [CrossRef]
- Burvingt, O.; Masselink, G.; Scott, T.; Davidson, M.; Russell, P. Climate forcing of regionally-coherent extreme storm impact and recovery on embayed beaches. Mar. Geol. 2018, 401, 112–128. [Google Scholar] [CrossRef]
- Stéphan, P.; Dodet, G.; Suanez, S.; Tardieu, I.; David, L. Dynamique pluri-décennale du trait de côte en lien avec les variations des forçages météo-océaniques au nord de la Bretagne (baie de Goulven, France). Geomorphologie 2018, 24, 79–102. [Google Scholar] [CrossRef]
- Morton, R.; Paine, J.G.; Gibeaut, J.C. Stages and Durations of Post-Storm Beach Recovery, Southeastern Texas Coast, U.S.A. J. Coast. Res. 1994, 10, 884–908. [Google Scholar]
- Mathew, S.; Davidson-Arnott, R.G.D.; Ollerhead, J. Evolution of a beach–dune system following a catastrophic storm overwash event: Greenwich Dunes, Prince Edward Island, 1936–2005. Can. J. Earth Sci. 2010, 47, 273–290. [Google Scholar] [CrossRef]
- Castelle, B.; Bujan, S.; Ferreira, S.; Dodet, G. Foredune morphological changes and beach recovery from the extreme 2013/2014 winter at a high-energy sandy coast. Mar. Geol. 2017, 385, 41–55. [Google Scholar] [CrossRef]
- Birkemeier, W.A. The effects of the 19 December 1977 coastal storm on beaches in North Carolina and New Jersey. Shore Beach 1979, 47, 7–15. [Google Scholar]
© 2018 by the authors. Licensee MDPI, Basel, Switzerland. This article is an open access article distributed under the terms and conditions of the Creative Commons Attribution (CC BY) license (http://creativecommons.org/licenses/by/4.0/).