Article

Imaging and Characterization of Extrasolar Planets with the Next Generation of Space Telescopes

by
Ana I. Gómez de Castro
AEGORA Research Group, Fac. CC. Matemáticas, Universidad Complutense, Plaza de Ciencias 3, 28040 Madrid, Spain
Geosciences 2018, 8(12), 442; https://doi.org/10.3390/geosciences8120442
Submission received: 14 November 2018 / Revised: 21 November 2018 / Accepted: 22 November 2018 / Published: 27 November 2018
(This article belongs to the Special Issue Detection and Characterization of Extrasolar Planets)

Abstract

:
The study and characterization of the exoplanets’ atmospheres and composition is in its infancy. The large facilities that will make feasible to image an exo-Earth are currently under study. This contribution to the special issue on “detection and characterization of extrasolar planets” is a summary on the current status of the design studies to build large space-based facilities working in the 100–3000 nm range for this purpose. The three basic designs: Fresnel imagers, starshades, and coronagraphs on large space telescopes are described. An outline of the pros and cons for each design is provided. The relevance of transmission spectroscopy to characterize exoplanets atmospheres is pointed out.

1. Introduction

Exoplanetary systems are very common. The statistical analysis of the results from the NASA’s Kepler mission has enabled sound estimates on the expected rates of occurrence of exoplanetary systems in the Galaxy; as an example, 16.5 ± 3.6% of the solar-like stars (stars with spectral type FGK) are expected to host planets with radii similar to Earth’s (between 0.8 and 1.25 Earth radii) and with orbital periods smaller than 85 days [1]. Kepler observed several wide fields on the sky during its 9.6-year mission lifetime and detected exoplanets by monitoring the intensity of stellar sources, to detect the flux decrements produced by the transit of possible exoplanets in front of the stellar disk. To be detectable, the inclination of the planet orbit must be close to 90° however, in spite of this constraint, the end of the mission budget of exoplanets found is 2662 exoplanets, a 69% of the 3875 exoplanets known today (Source: exoplanets.eu/catalog); these systems are uniformly distributed in the Kepler field, as shown in Figure 1.
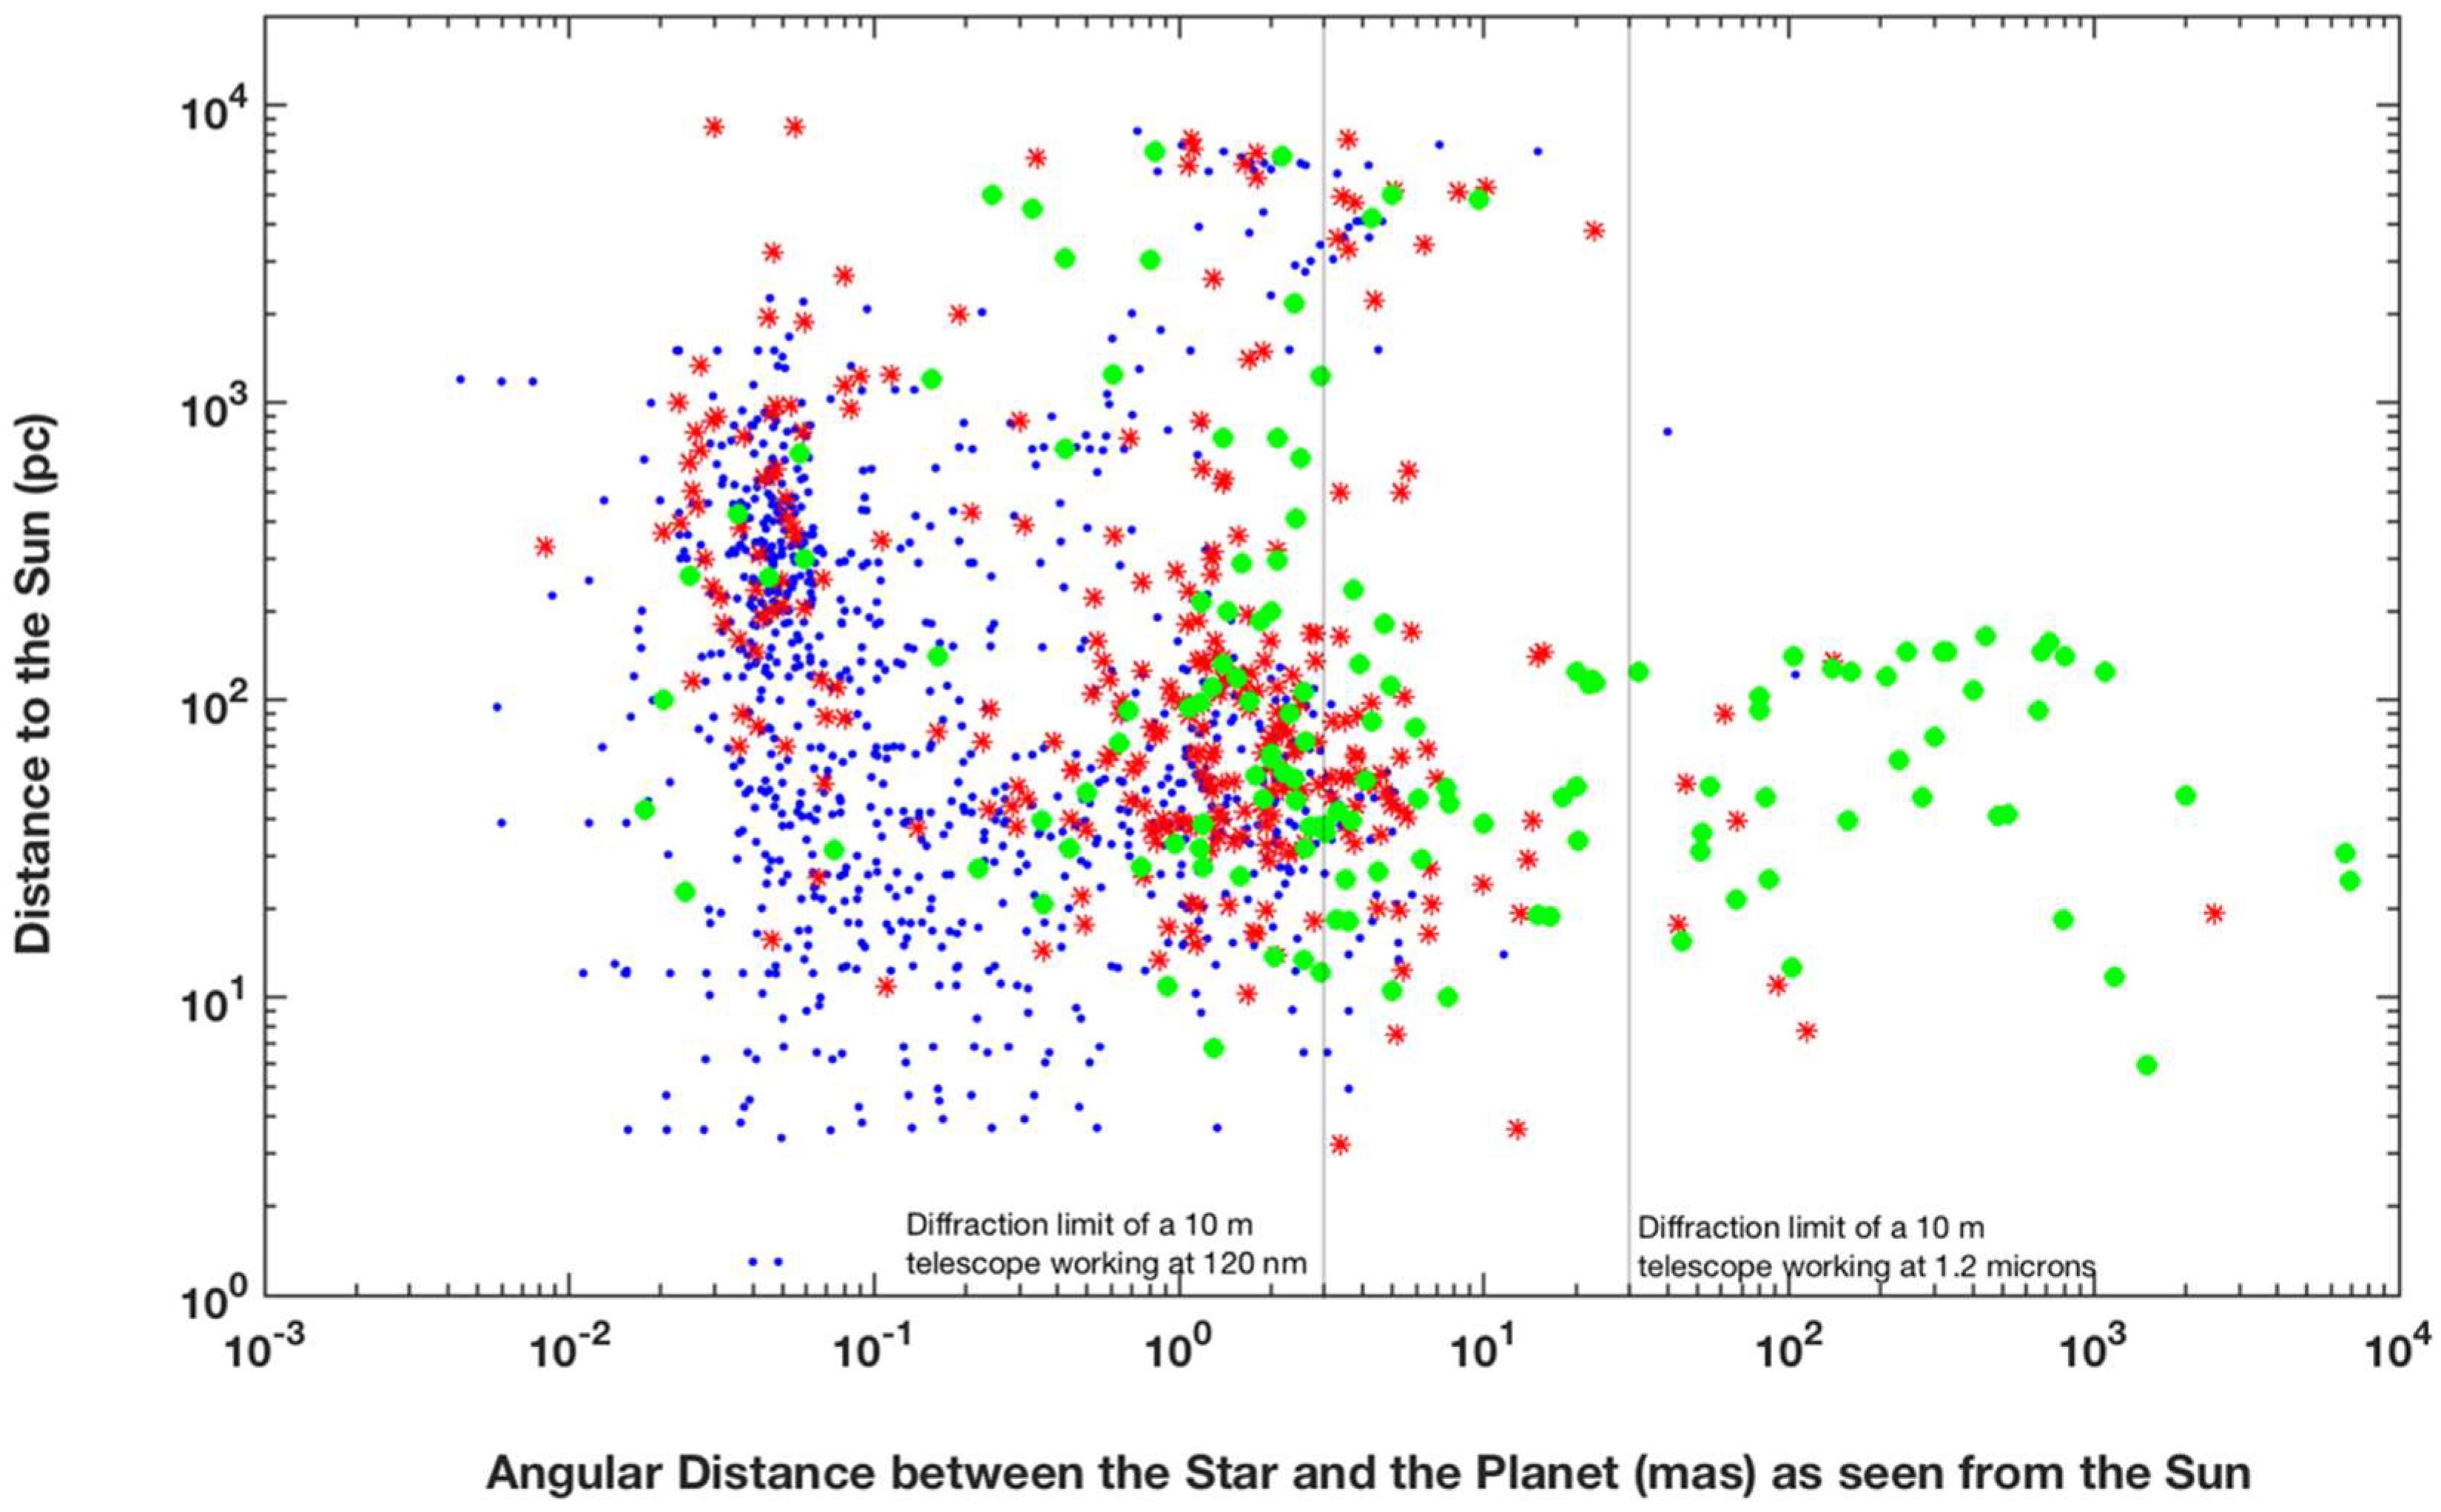
After this realization, there are two main lines of research: (1) characterizing exoplanets (atmospheres, composition, volcanic activity, magnetic fields…); and (2) observing Earth twins to investigate the emergence of life. Addressing these lines of research requires developing instrumentation to study faint objects located very close to bright (and variable) sources. The angular resolution required to resolve the exoplanets known to date is shown in Figure 2. The vast majority of them are at angular distances smaller than 10 milliarcseconds (mas) from their parent star. Most of the planets with masses below two times the mass of the Earth (2 ME) are angular distances below 0.1 mas from their parent star (see Figure 2). The angular resolution provided by diffraction-limited optical systems is proportional to the radiation wavelength, λ. A 10-m aperture telescope working in the infrared range (1.2 microns wavelength) may reach an angular resolution of 30 mas while at UV wavelengths (120 nm), the same aperture provides an angular resolution ten times better (3 mas). To achieve sub-mas resolution, either huge apertures are used or interferometric techniques are applied.
An additional challenge results from a planet’s luminosity; planets are intrinsically faint objects. At optical and ultraviolet wavelengths, their atmospheres scatter back into space the radiation received from the star; this is the weak signal that modern facilities aim at detecting. The ratio between the flux received at Earth from the planet, Fp, and from its parent star, F*, is roughly given by Equation (1),
F p F a ( λ ) g ( t , i ,   e ) ( R p a p ) 2
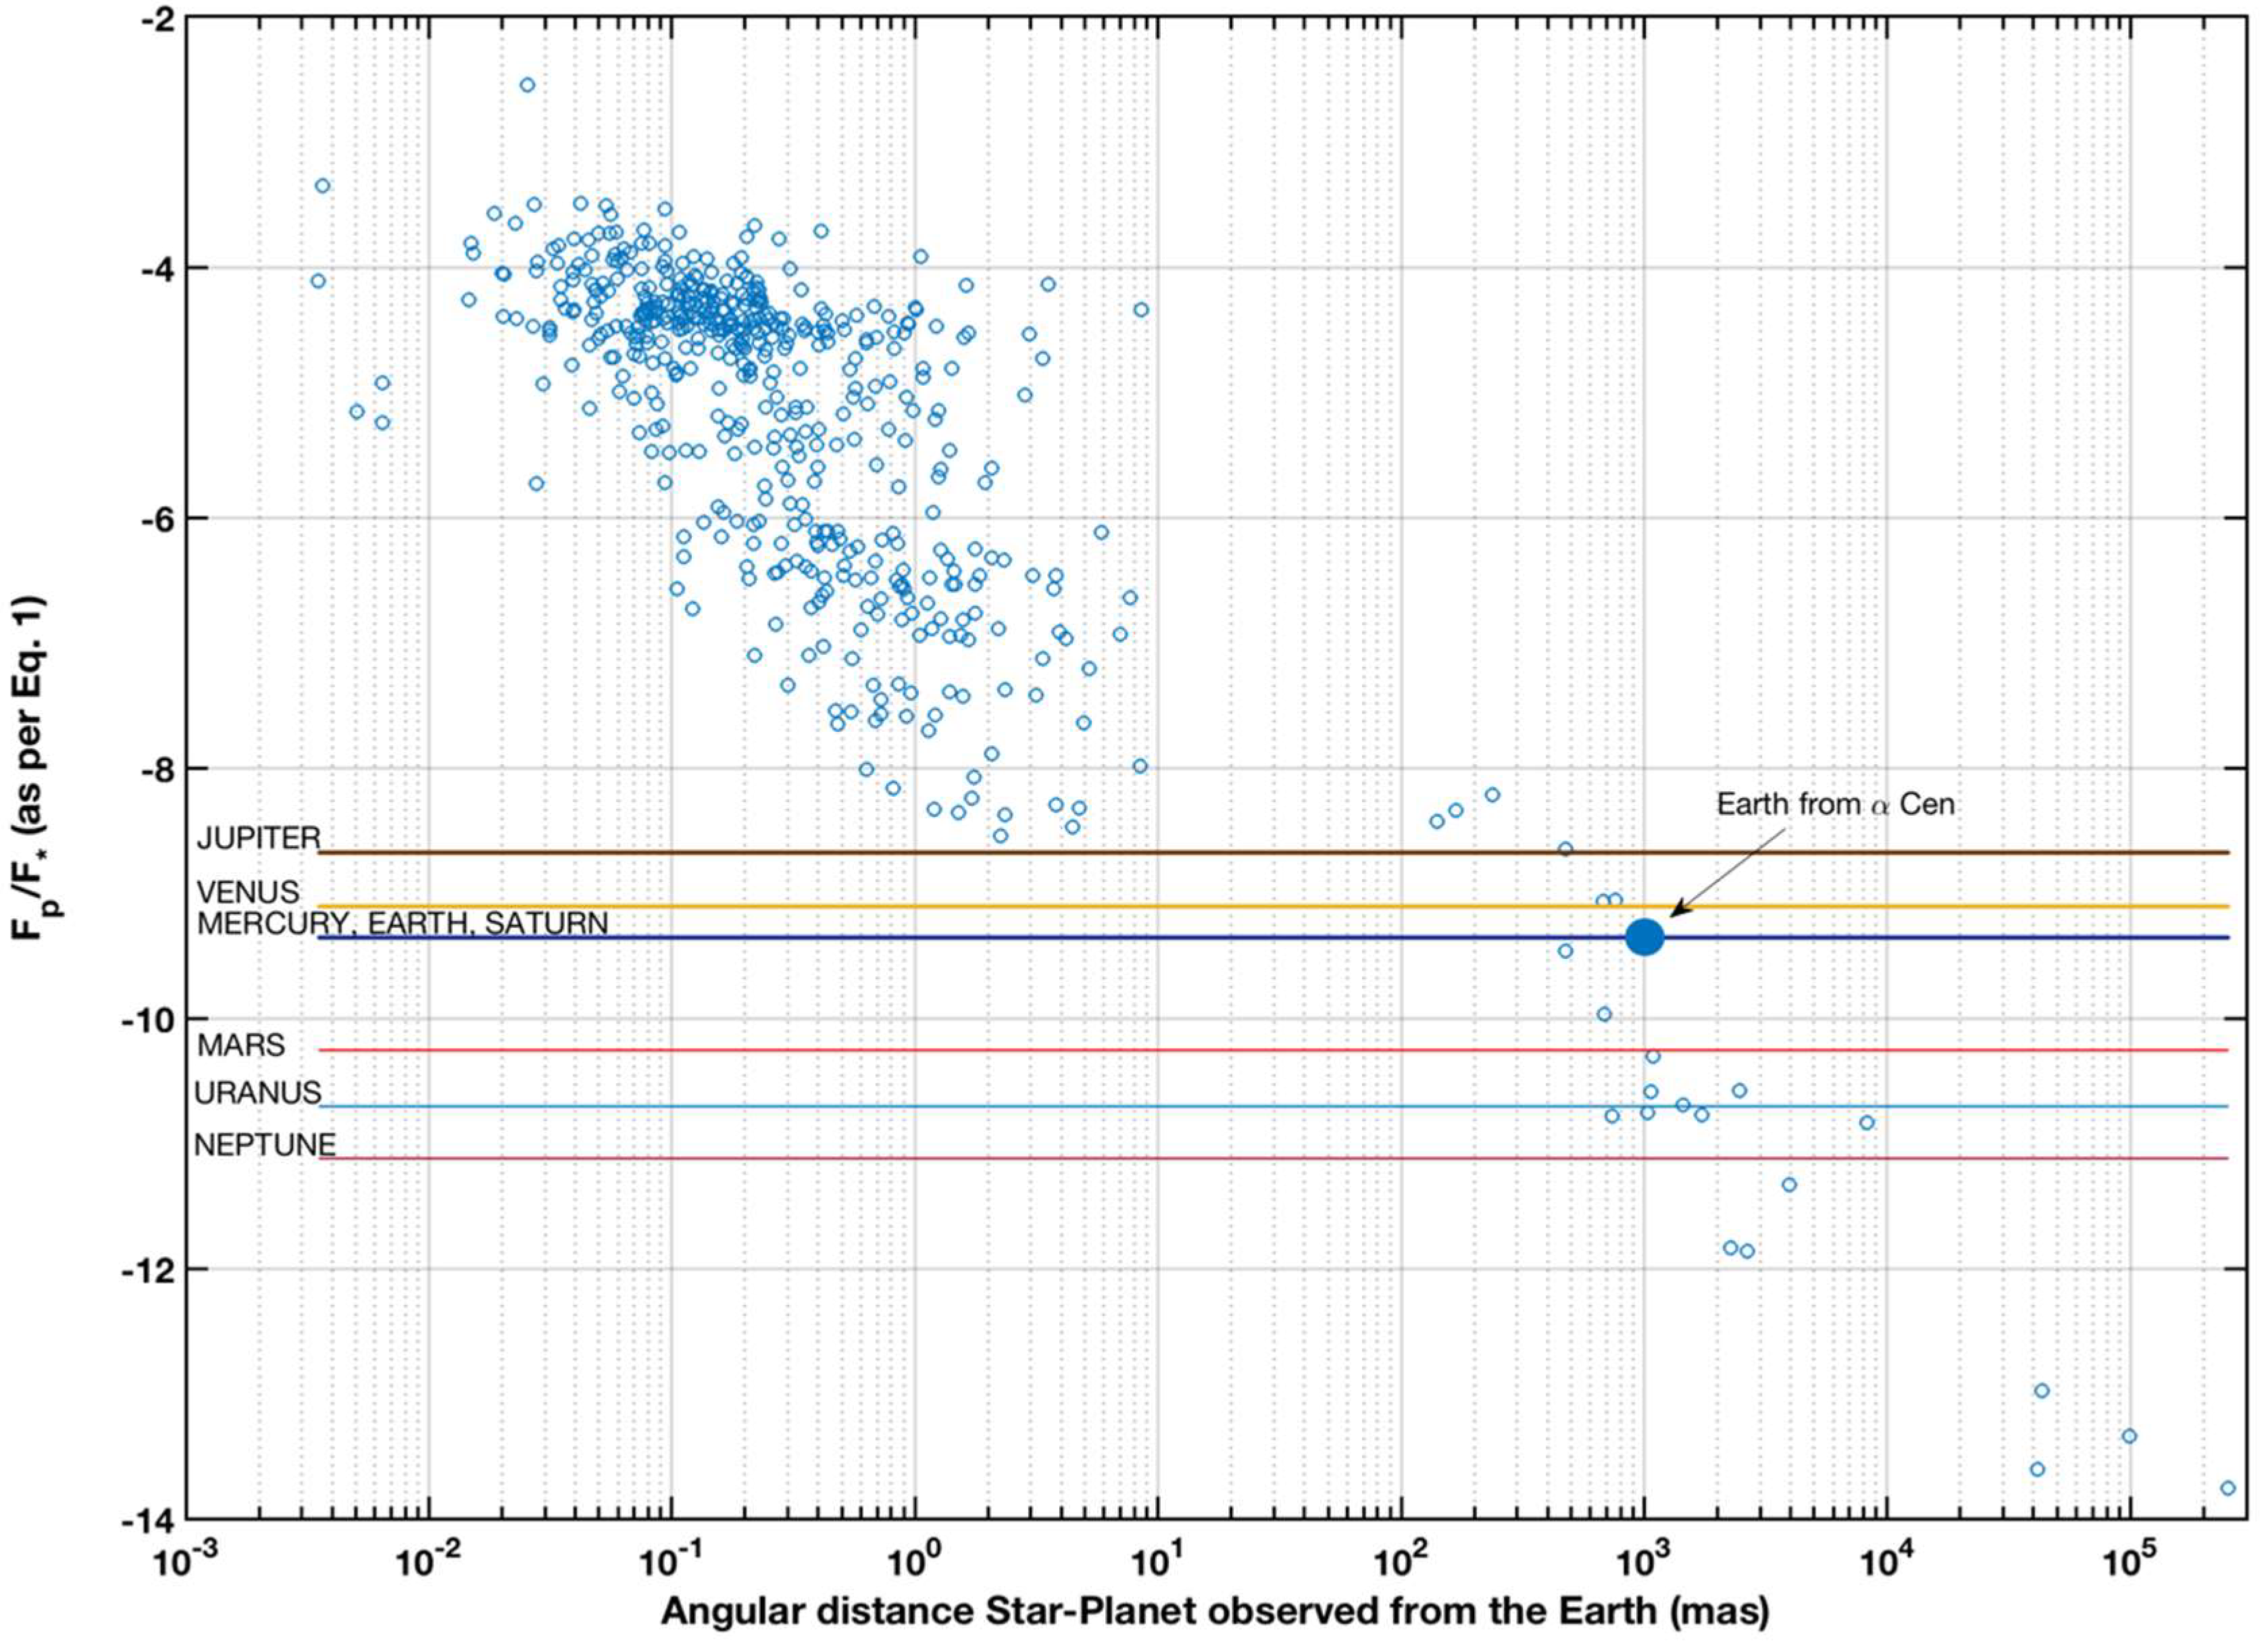
with Rp and ap, the planet radius and semi-major axis of its orbit, a(λ) the planet albedo and g(t, i) a geometric factor that takes into account the inclination of the system, the eccentricity of the orbit and the phase in the orbit. The planet albedo depends on the composition and atmospheric properties. The geometric factor depends on inclination and phase and ranges from 1 (the full illuminated hemisphere is seen) to 0 (during transit in the planet is observed in a system with inclination 90°). To illustrate the technical difficulties behind exoplanetary studies, Fp/F* is represented versus the angular distance for the known exoplanets (only exoplanets with known radii from the exoplanets.eu/catalog data base have been selected for the plot) in Figure 3. For the plot, it has been assumed that the planet albedo is 0.5 (the planet reflects half of the radiation received from the star) and that only half of the irradiated hemisphere is visible. With these provisions,
F p F 1 4 ( R p a p ) 2
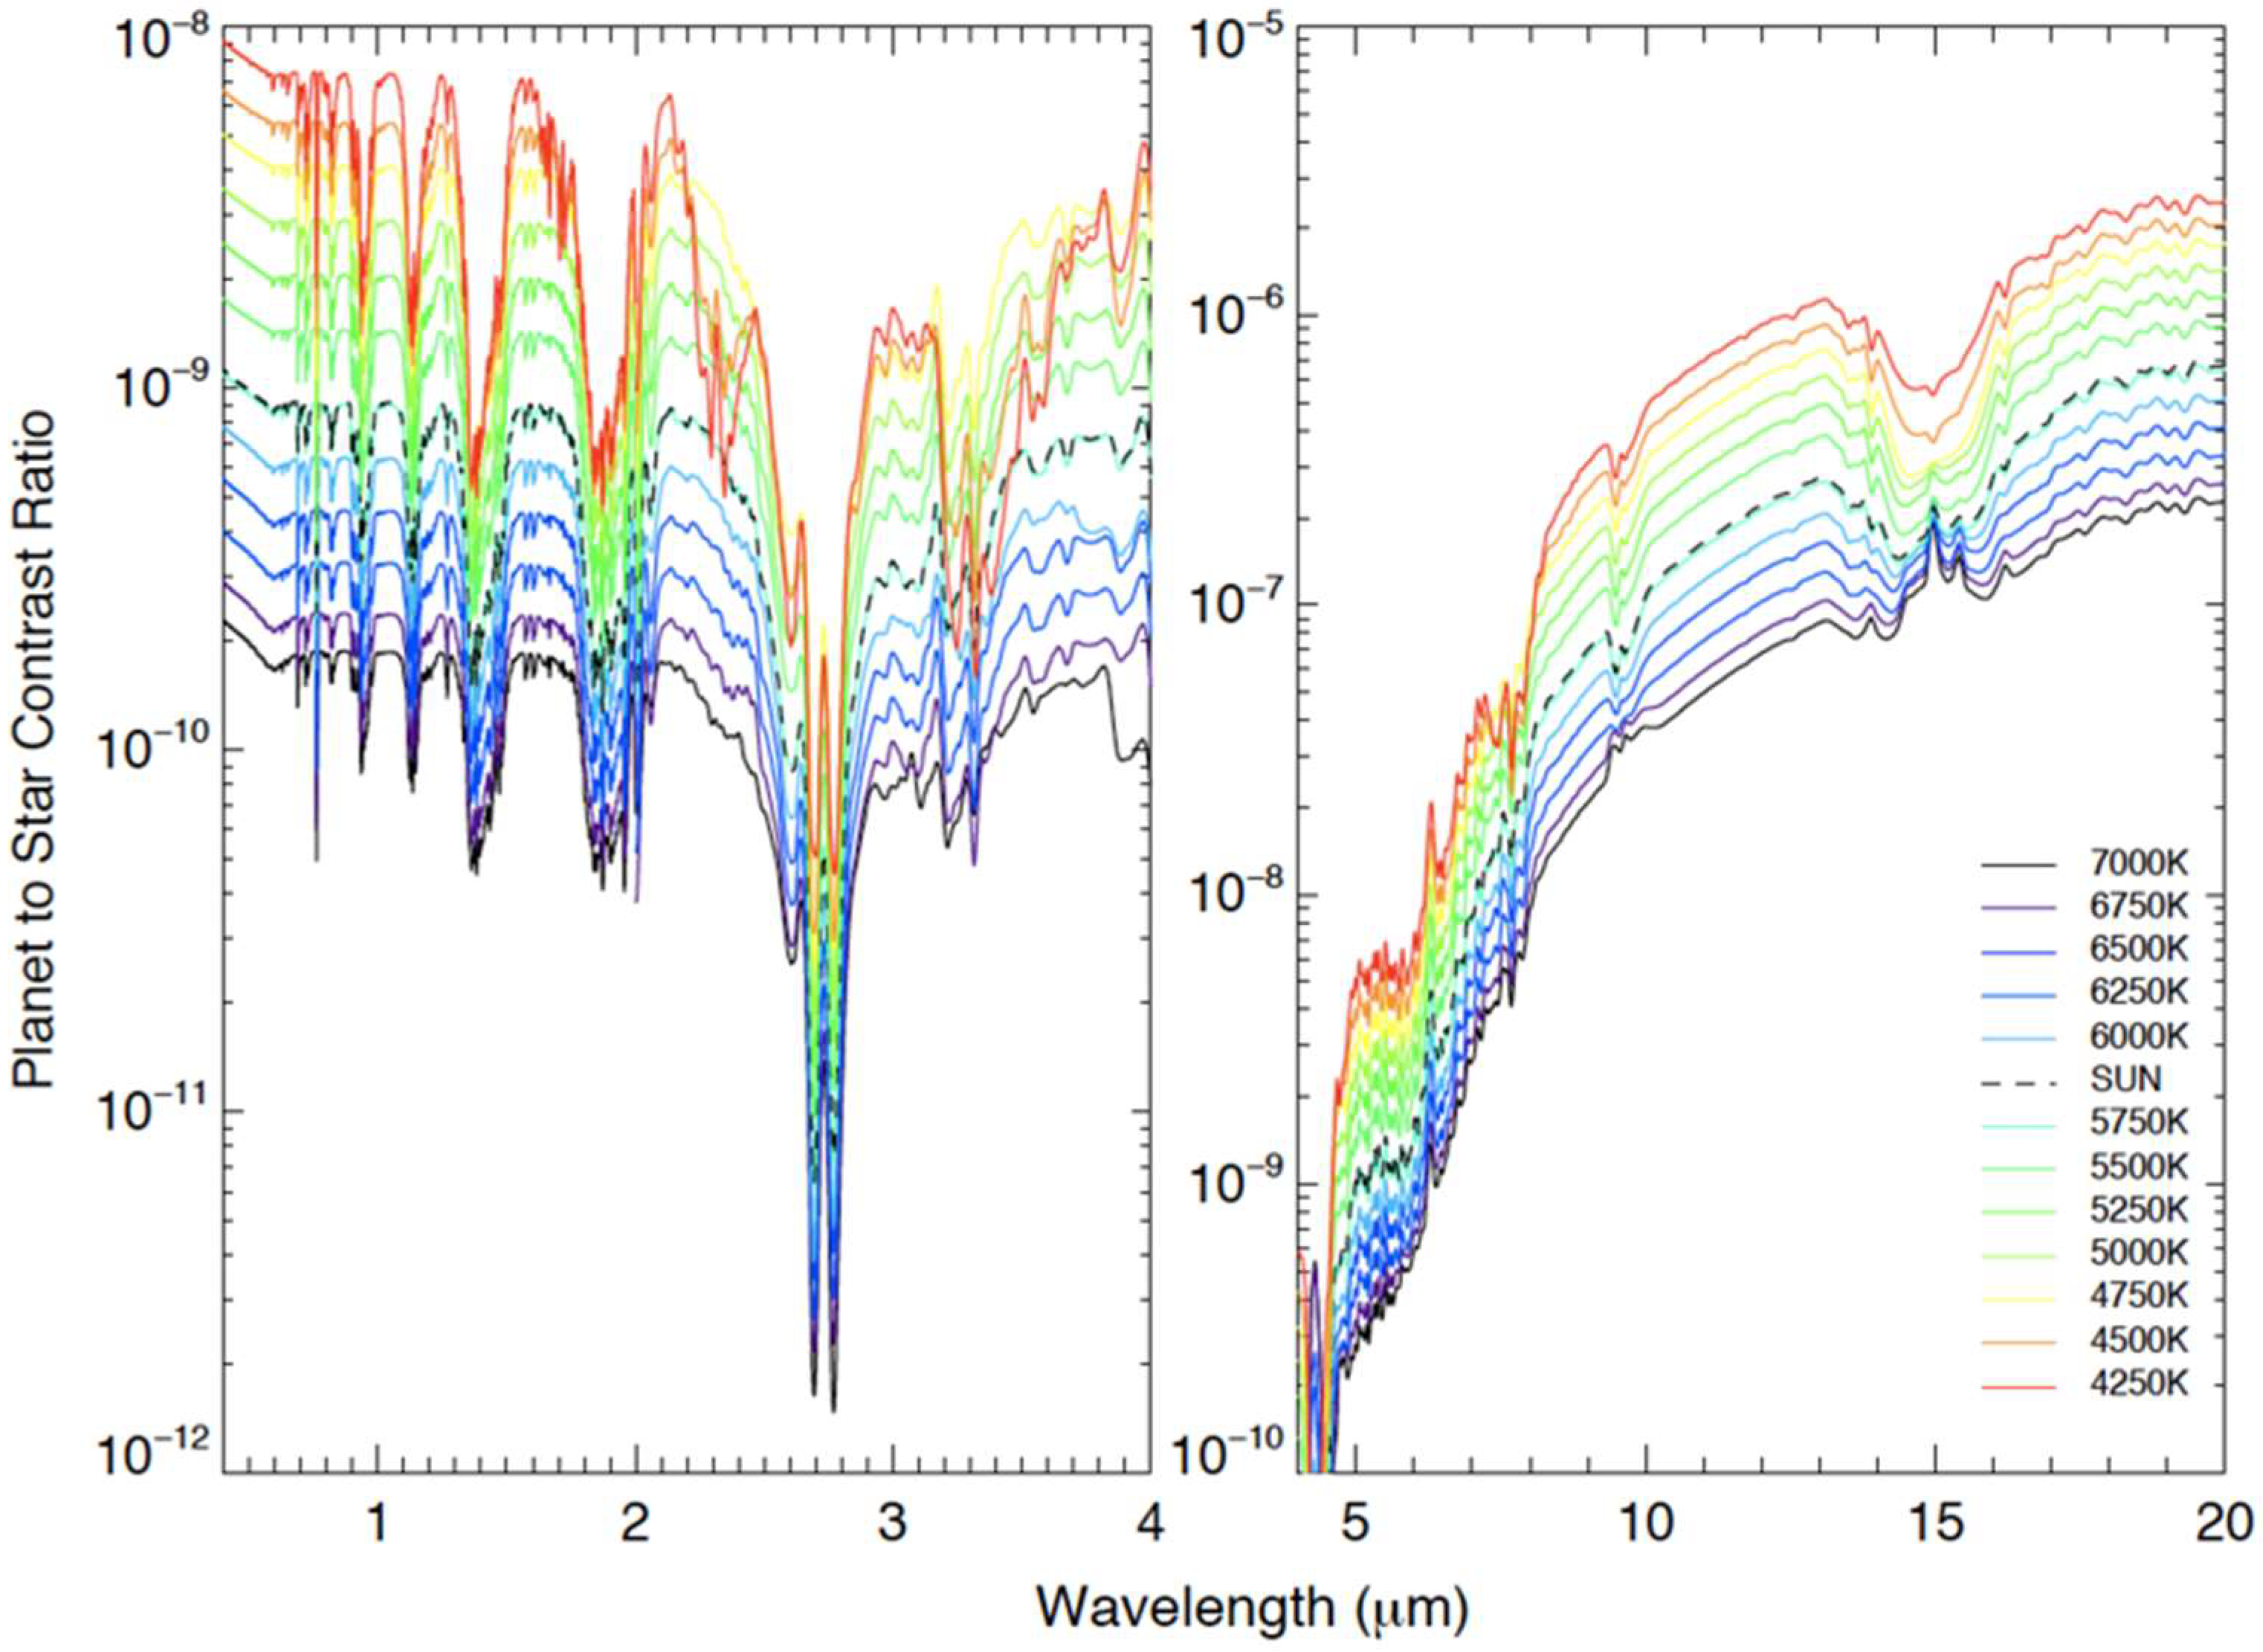
In Figure 3, the planet–star flux ratio in Equation (1) is represented versus the angular distance, as seen from Earth, for the planetary systems in the exoplanets data base (exoplanet.eu, contents by July 2018). Also, the parameters for the planets in the Solar System as seen by external observers are plotted. Moderate dynamical ranges (<106) are required to detect most of the exoplanets in the figure, provided high enough angular resolution is achieved. However, dynamical ranges larger than 109 are needed to resolve an Earth-like planet orbiting around a Solar-like star. This requirement depends on the wavelength and spectral type of the star. Planet to stars contrast ratio (Fp/F*) of Earth-like planets are shown in Figure 4 for an Earth-analogue cloud coverage (from [3]). From M-type to F-type stars, the requirement in terms of dynamical range varies by roughly two orders of magnitude.
Reaching high dynamical ranges represents a severe technological challenge; it requires suppressing the radiation from the star and cleaning the wakes of the diffraction pattern close to the location of the star in the image plane. Moreover, large collecting surfaces are needed. The 30-m generation of ground-based observatories is designed for this purpose. Space telescopes have several advantages over ground-based observatories since the signal received is clean and unaffected by the Earth’s atmosphere; in addition, wavelengths of interest, such as the ultraviolet can only be observed from space. However, it is significantly more difficult (and expensive) to set large optical collecting surfaces in space; as today, no 10-m size space telescope has ever flown.
As the contrast ratio is smaller and thus more favorable at infrared wavelengths, there are plenty of projects addressing this wavelength range, in particular the James Webb Space Telescope (JWST). After the ROSCOSMOS Radio Astron mission, JWST will be the space telescope with the largest collecting surface ever flown. JWST is equipped with instruments as NIRISS, MIRI, and NIRCam for transit spectroscopy of planets and coronagraphic imaging [4,5].
In the quest for the emergence of life, it seems that the presence of a photosynthetic biosphere is the least difficult to detect sign. In an Earth-like atmosphere, with composition N2, H2O, and CO2, the biosignature gases include O2, O3, CH4, C2H6, N2O, CH3Cl, CH3SH, (CH3)2S, and CH3SSCH3 however, any individual gas alone is likely insufficient for biosignature confirmation due to potential false positive scenarios [6]. JWST will work in the 0.6–30 microns range covering the main features, as shown in Figure 4, to study and possibly characterize exo-Earths via transit techniques. Unfortunately, JWST will not provide simultaneous observations of the ultraviolet (UV) stellar radiation field which is one of the main drivers of the planetary atmospheric chemistry. Also, the signal of the most sensitive tracer of O2, the Hartley–Huggins bands of ozone, is missed and together with it, information about the penetration depth of the stellar UV radiation into the atmosphere; the Hartley-Huggins bands are centered at 250 nm (0.25 microns) producing a broad and deep feature in the near UV (from 150 to 350 nm).
There are several smaller projects approved by the main agencies to detect and characterize exoplanets. The Transiting Exoplanet Survey Satellite (TESS) from NASA was launched in 2018 to run an all-sky survey for transiting planets around nearby stars [7]; the telescope design is based in four small cameras (1 cm diameter pupil, each) and works in the 0.6–1-micron range. The CHaracterising ExOPlanet Satellite (CHEOPS) from ESA will be launched in 2019 to search for exoplanetary transits by performing ultra-high precision photometry on bright stars already known to host planets; CHEOPS consists of a 30 cm diameter small telescope equipped with instrumentation for high precision photometry in the 0.6–1.1 microns spectral range [8]. The Planetary Transits and Oscillations of stars (PLATO) from ESA to be launched in 2026 to search for transiting exoplanets around stars ranging from M to G dwarfs [9]; the telescope design is based in 24 small cameras (12 cm diameter pupil, each) and will work in the optical range. The Atmospheric Remote-sensing Infrared Exoplanet Large-survey (ARIEL) has been selected as the fourth medium-class mission in ESA’s Cosmic Vision program to survey a sample of about 1000 extrasolar planets, simultaneously in visible and infrared wavelengths and measure their chemical composition [10].
None of these missions will be able to image an exoplanet. Three main technologies are currently under study for this purpose: Fresnel interferometers, telescopes equipped with formation flying star-shades and Coronagraphs, as instruments for large space telescopes. All of them are designed to provide access to the UV range where the resonance transitions of the most abundant atmospheric species and the electronic transitions of the most abundant molecules are observed. In the subsequent Section 2, Section 3 and Section 4, these three types of devices are described. In the Section 5, a short discussion on the pros and cons of direct versus transmission spectroscopy is included.

2. Fresnel Interferometers

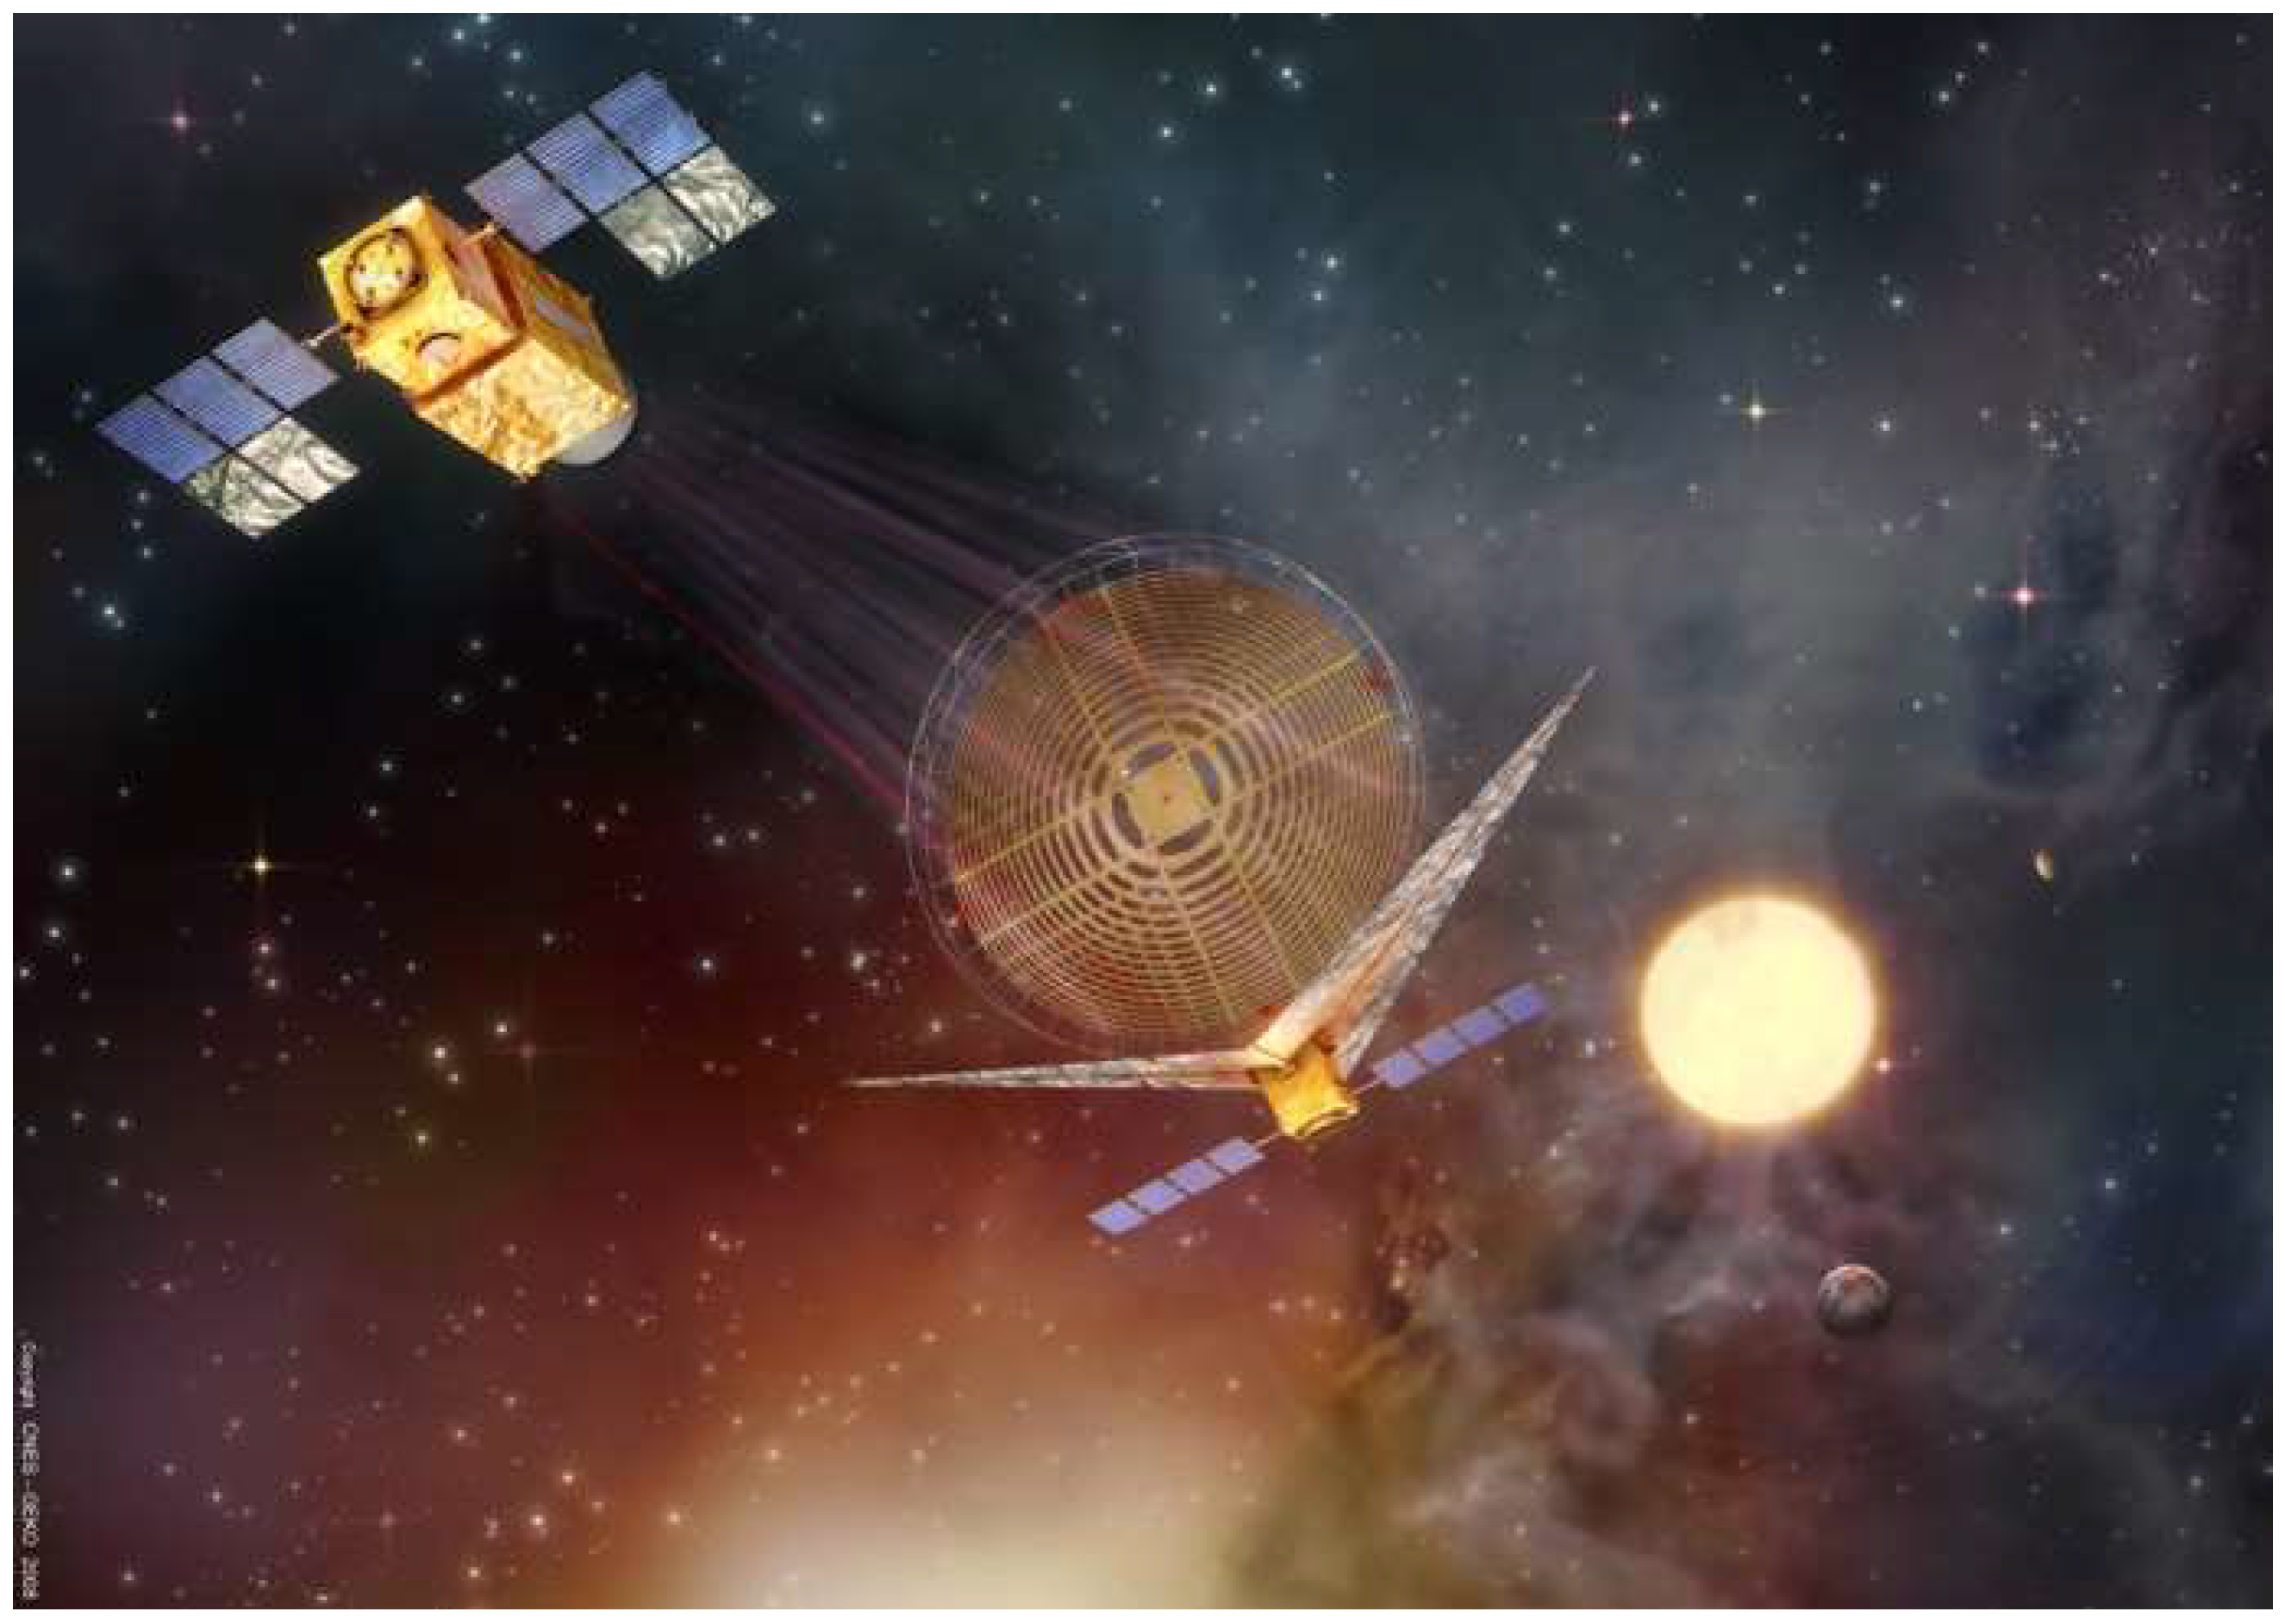
Fresnel interferometers (FIs) are based on the Fresnel zone plate concept [11,12,13,14]; images are formed by diffractive focusing. To operate in a broad wavelength bandpass, diffractive optics requires correcting optical defects in the conjugate plane [11,12]. In space, this implies formation flying: the Fresnel interferometric array (FIA) is in one spacecraft and the optics to correct chromatism (a Fresnel lens) and the instrumentation in another (see Figure 5).
The FIA is the main focusing element and plays a role equivalent to the primary mirror in an astronomical telescope. It consists of a deployable opaque foil punched following a pattern similar to an aperture synthesis array. The beams from the holes or subapertures are coherently combined into the focus without the need for any kind of optical element.
From the point of view of exoplanetary observations, the main characteristics of FIs are:
  • Diffraction limited angular resolution (diffraction limited angular resolution, θ, is θ = 1.22λ/D, with λ the wavelength at which the telescope operates and D the diameter of the primary collecting surface) with very large collecting surfaces. For a 30-m size deployable foil the resolution is 0.8 mas at Lyman-α.
  • The wavefront quality is controlled by the accuracy of the pattern. A 0.1 mm precision in the positioning of the subapertures in the foil provides the same image quality than a λ/100 mirror (2 nm precision at ultraviolet wavelengths). The positioning constraints in a FIA are not wavelength dependent.
  • The diffraction pattern can be designed to generate high dynamical range areas in the image. For instance, if the pattern is carved following orthogonal directions, the light at focus is concentrated into two thin orthogonal spikes instead of being spread in Airy diffraction rings as produced by a circular aperture (see Figure 6). Dynamic ranges as high 108 can be obtained.
  • Only 5% to 10% of the initial light is focused on the image plane. FI are radiometrically inefficient.
  • The spectral bandpass (∆λ) is limited for a given flight configuration to ∆λ/λ =1.41D/LFIA, with D the diameter of the field optics in the second spacecraft and LFIA the side of the square FIA. For the standard configuration in [14]: ∆λ/λ = 0.2.

Current Status of the Technology

The FI concept has been tested successfully at optical wavelengths on the ground. A 20 cm FIA and the secondary module were attached to each end of the 76 cm aperture refractor at the Observatoire de Nice. Dynamic ranges up to 4 × 10⁵ were obtained in images of Mars and its satellites, and Sirius A–B [15]. FI has been tested at ultraviolet wavelengths in the laboratory and a prototype has been designed to be tested at vacuum ultraviolet in space on board the international space station [16].

3. Starshades

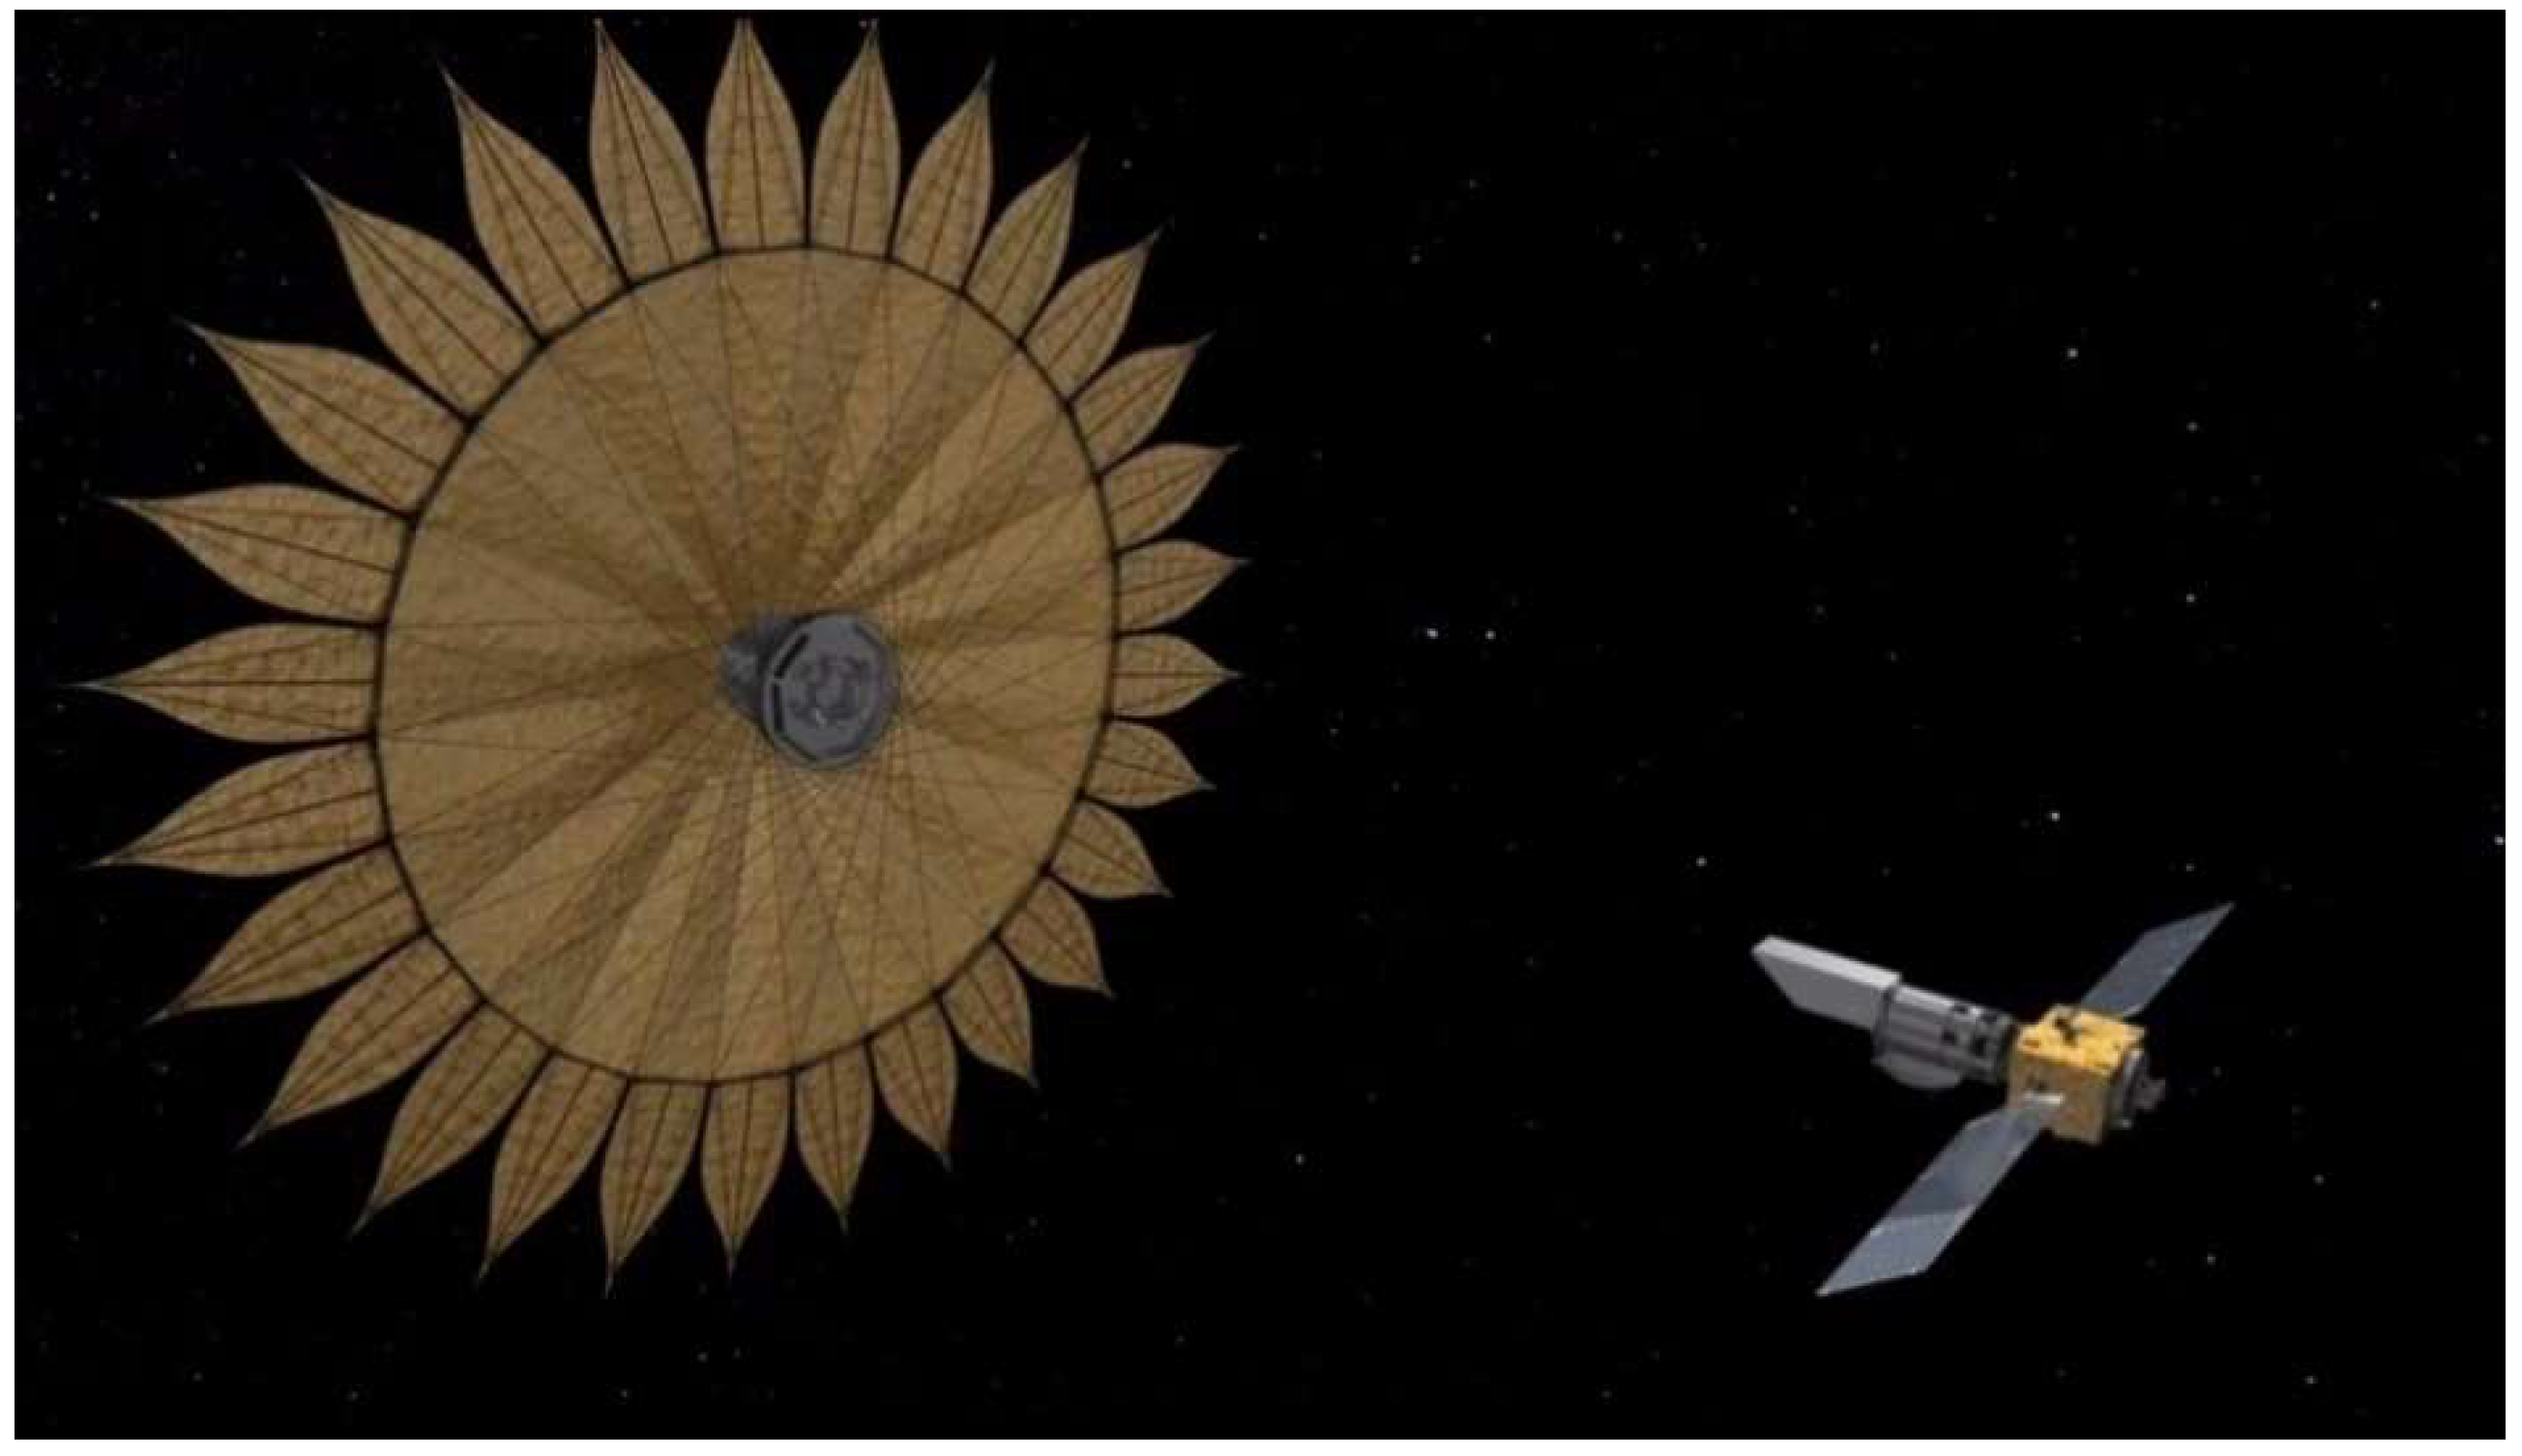
Starshades are external occulters that suppress the stellar radiation. They are flown in formation flying with a standard space telescope (see Figure 7) and, as the starlight is attenuated prior to diffraction by the primary mirror, they do not pose on the telescope optics as stringent requirements as coronagraphs [17,18,19]. Neither starshades require active wavefront control to the telescope in order to achieve high dynamic range images at an inner working angle (IWAs).
The precise shape of the starshades is defined by the optimal attenuation function to suppress the stellar radiation, unfortunately this is wavelength dependent [19,20] and it is not currently possible to build an apodized (apodization is an optical filtering technique to remove the Airy disks caused by diffraction around an intensity peak) occulter to the required precision. However, it is possible to build a binary occulter; a dark screen of a particular shape that provides good results.
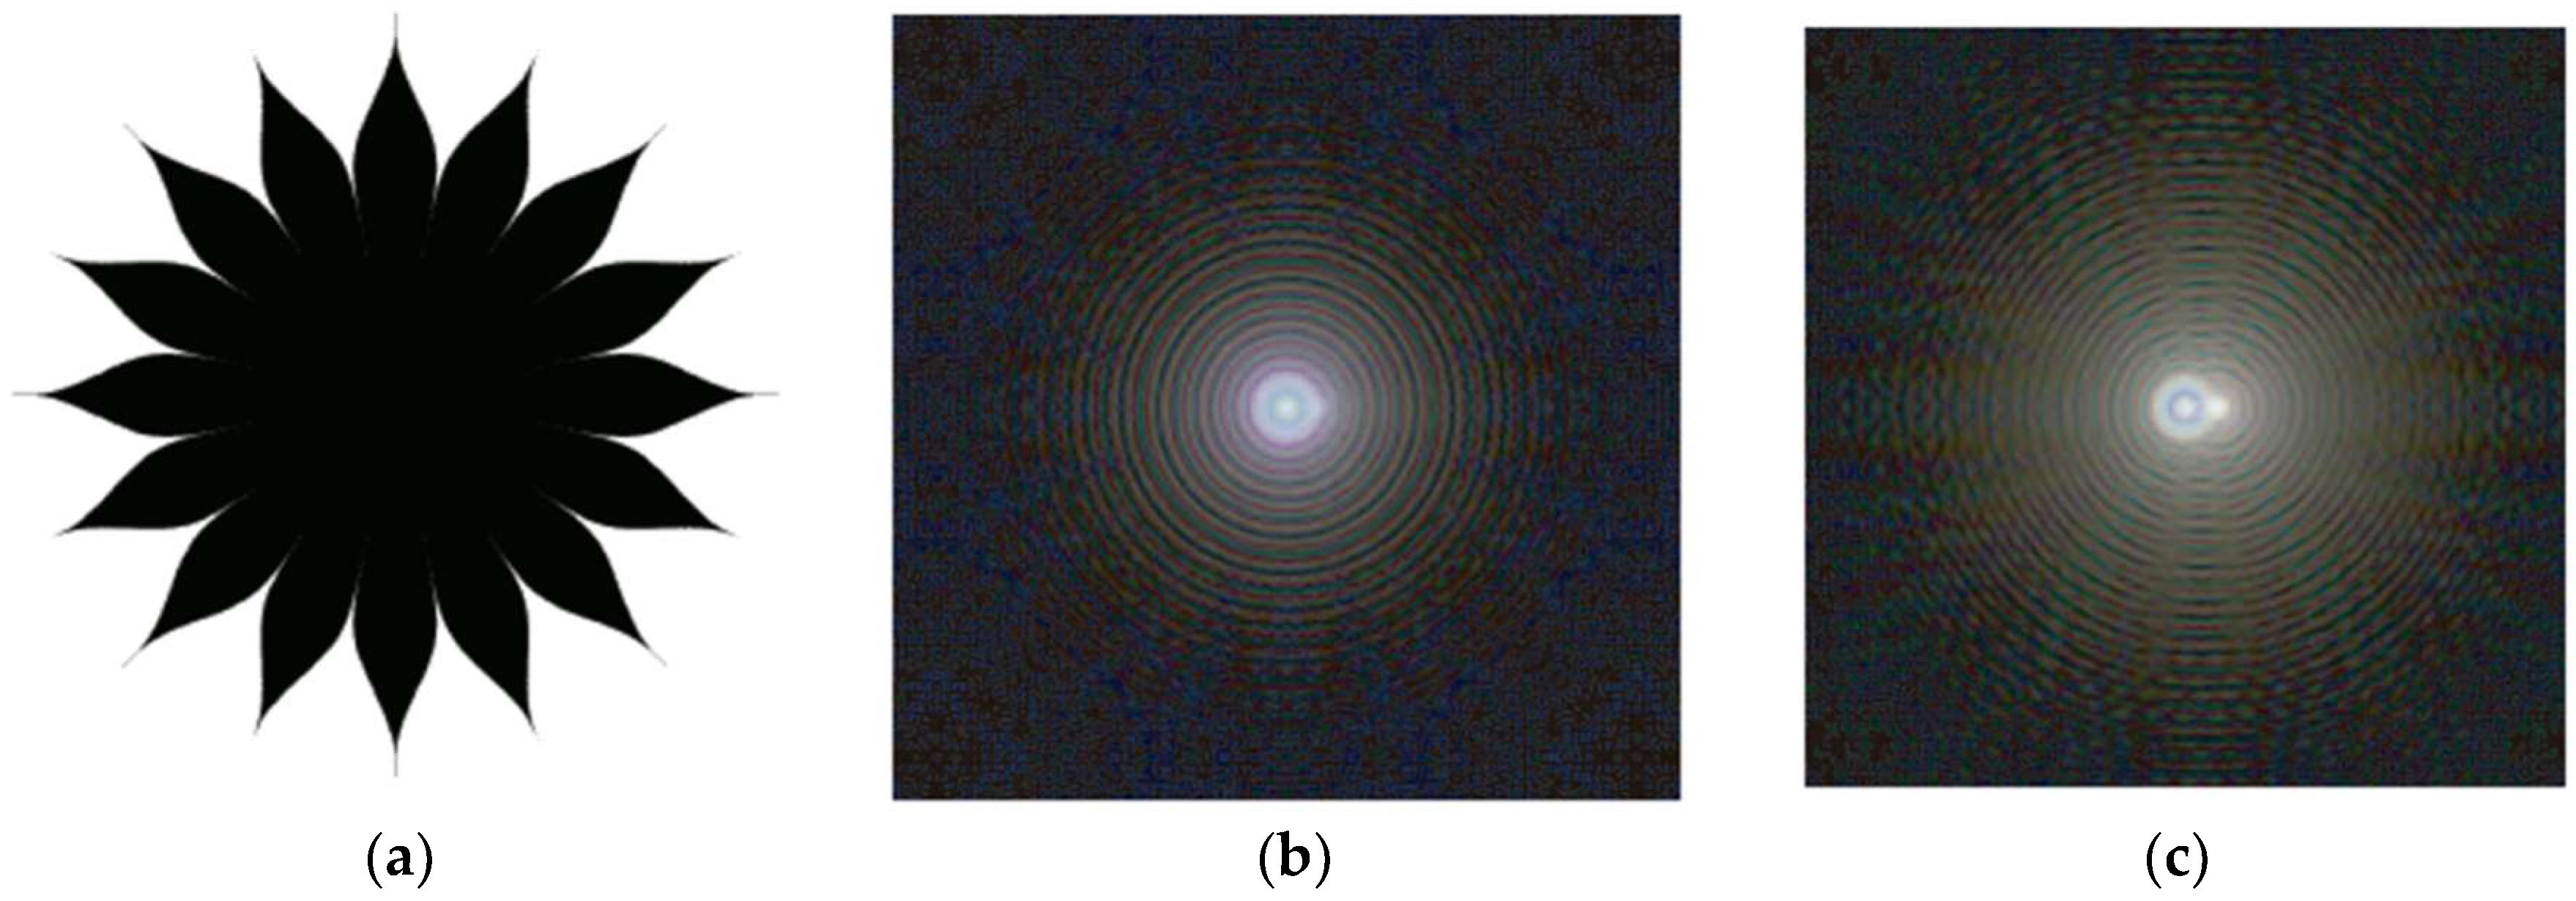
The most tested design consists of N identical evenly spaced ‘petals’ as shown in Figure 7 and Figure 8. These petals are wedges of the circle whose width varies with radius such that the fractional angular extent of the occulter at a given radius is the attenuation profile [18,20].
From the point of view of exoplanetary observations, the main characteristics of starshades are:
  • The angular size of the shade is the radius, R, divided by the distance to the spacecraft containing the space telescope, dS-T. Therefore, to resolve the Earth from 10 pc, a 25 m radius shade must be at dS-T ≥ 52,000 km.
  • Dynamic ranges as high as 1010 can be theoretically achieved at the pupil of the telescope (see Figure 8). Further contrast is added by the telescope itself.
  • The optimal attenuation profile depends on the wavelength of the radiation.

Current Status of the Technology

Testing of scale models in the laboratory have proven the robustness of the basic concept [21]. Optical tests in ground-based facilities have been run in the McMath-Pierce Solar Telescope [21,22]. A 24 cm diameter starshade was set at a distance of 2.4 km; a dynamic range of 2 × 10⁶ at 30 arcsec IWA on Vega was achieved [21]. The technology for starshade deployment, alignment, and operation in space is under development. Starshade prototypes are being constructed at the Jet Propulsion Laboratory [22] and proposed to be flown with the Habitable Exoplanets Observatory (Habex) [23].

4. Coronagraphs

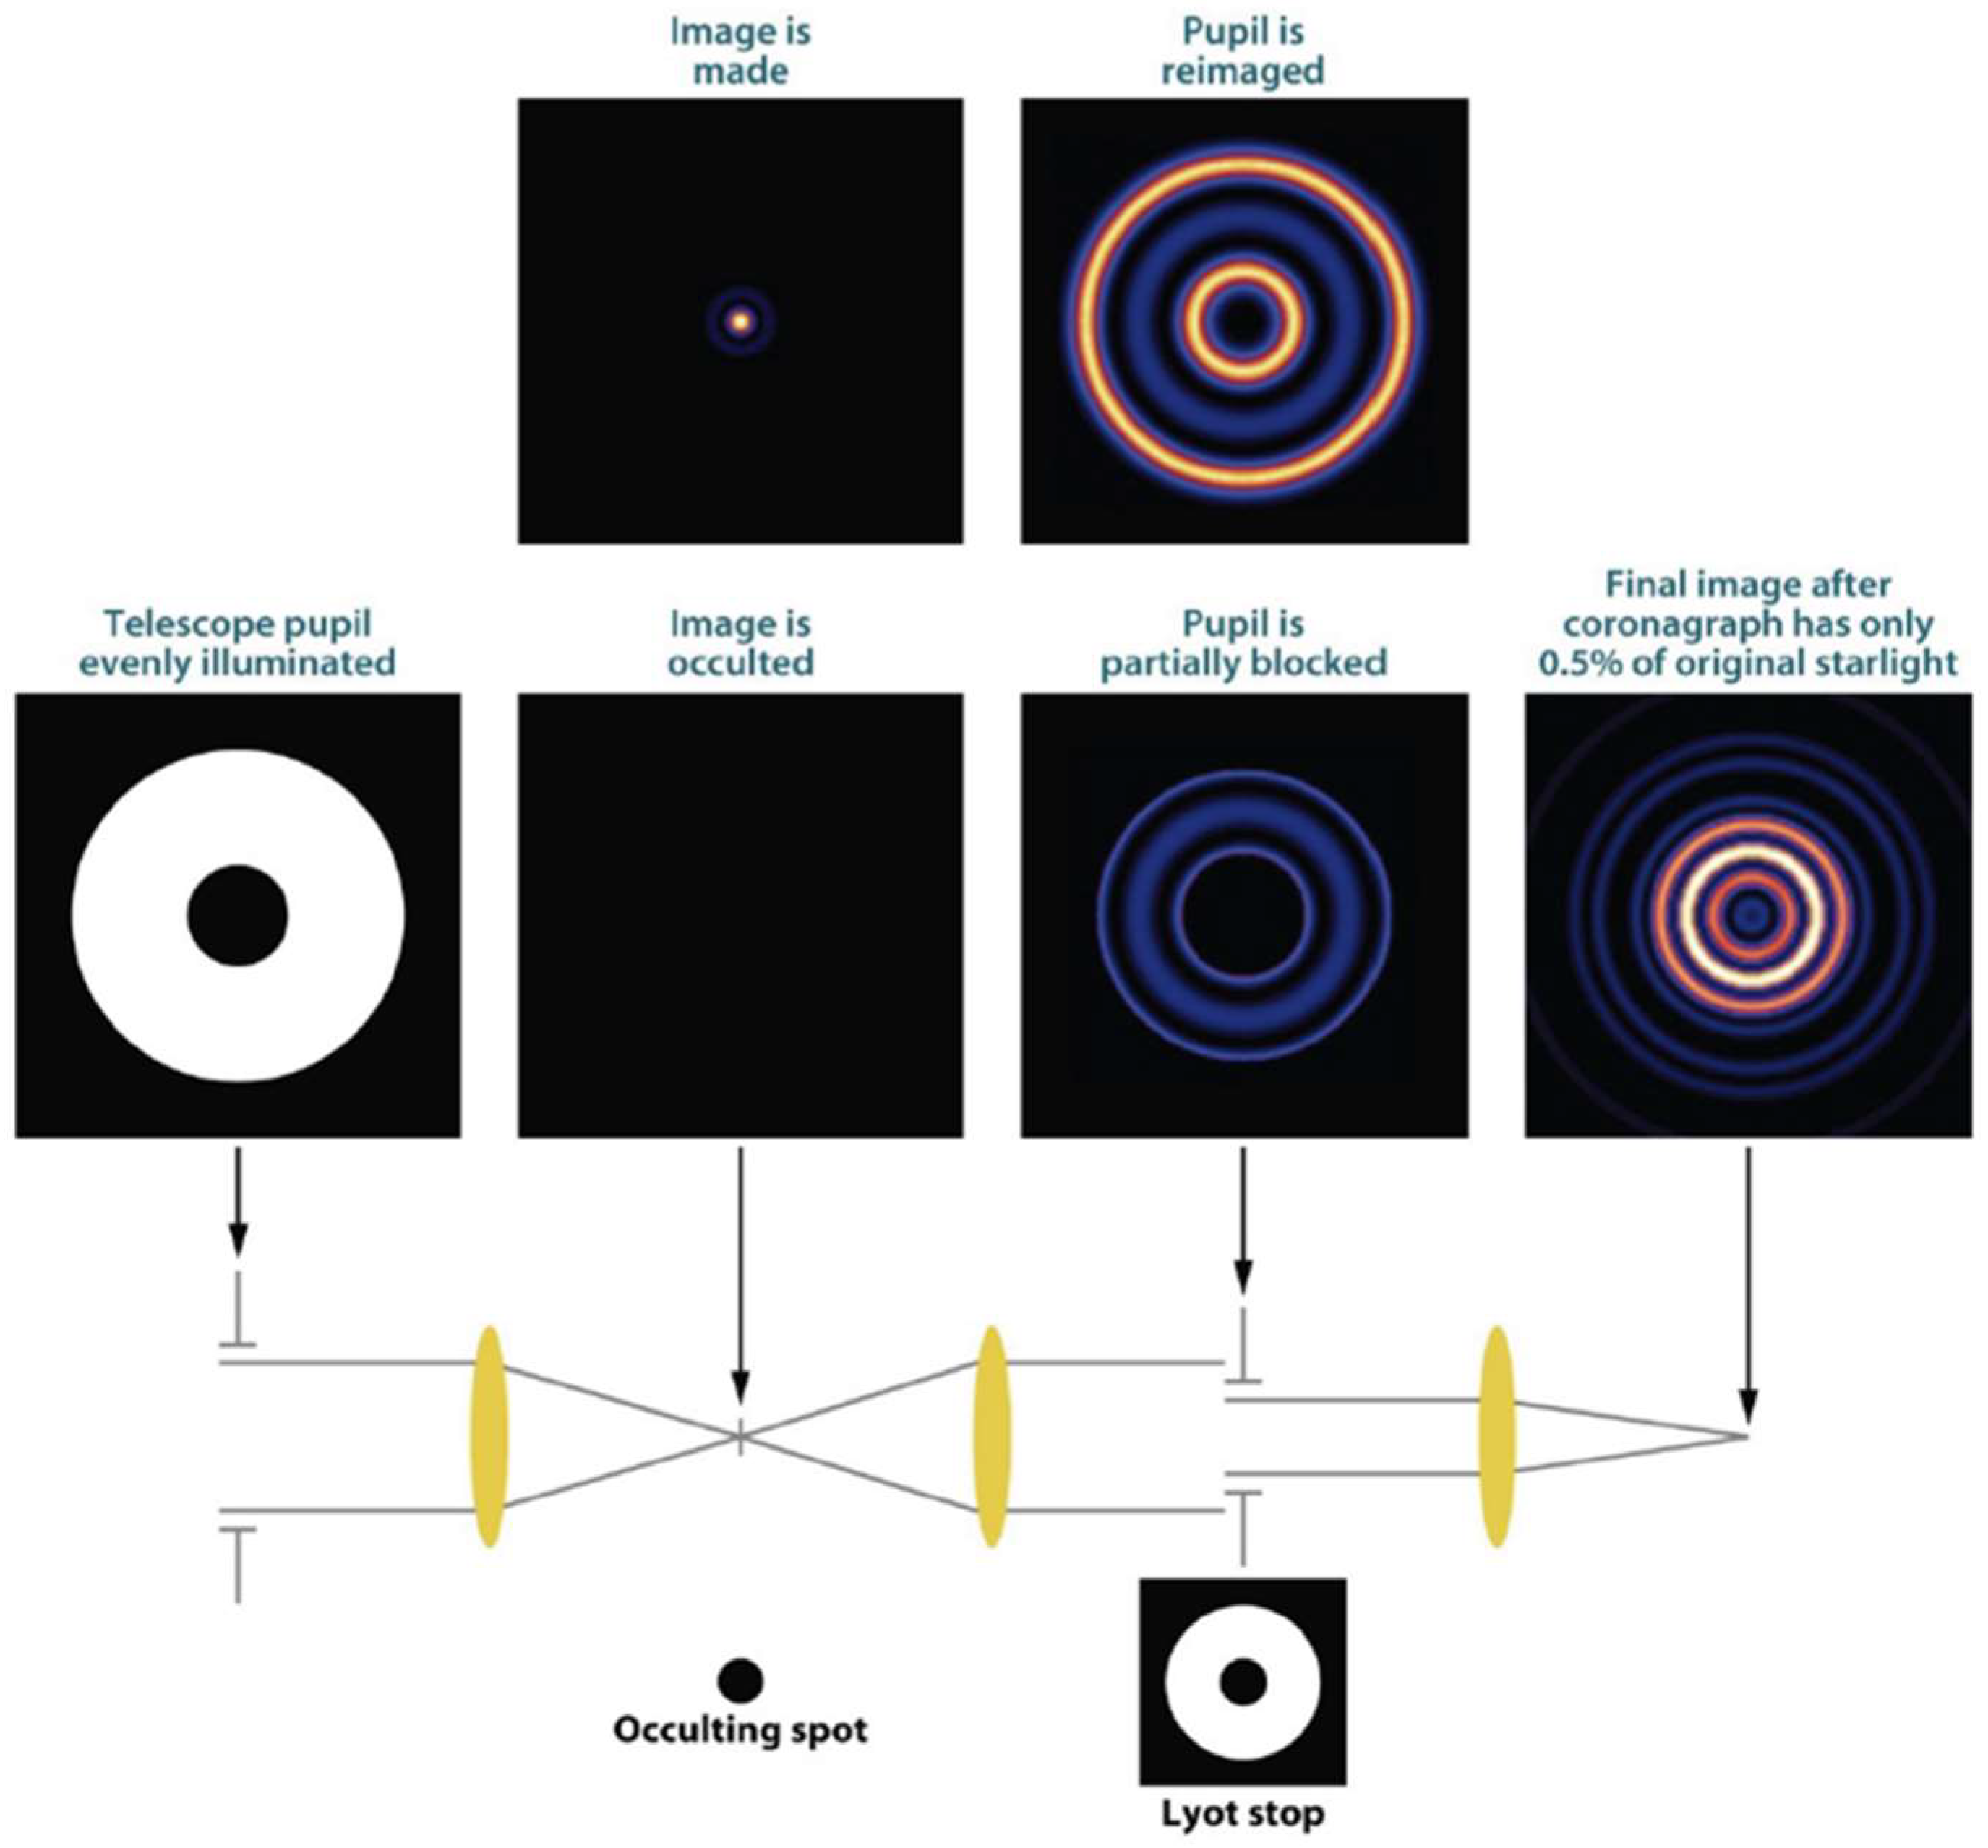
Coronagraphs are currently routinely implemented in imaging telescopes to block the input flux from bright sources and allow observing nearby faint objects. The larger the telescope, the more photons are collected from the planet, but also more challenging is the coronagraph design. There are several means to block the bright source radiation. In phase coronagraphs and vortex coronagraphs the blockage is produced by a mask that modifies the phase of the bright source, later to be eliminated by destructive interference. Band-limited coronagraphs are the preferred option for space telescopes and already implemented in the Hubble Space Telescope and in the JWST [4]. In these systems, the mask is designed to block radiation over a given wavelength range and manage the diffraction effects caused by mask using Lyot stop’s (see i.e., [24] for a mathematical description of these systems and [25], for a review). The basic optical layout and performance of these systems is shown in Figure 9.
A specific problem of coronagraphs in space telescopes is the jittering; fast and small oscillations in directing the telescope. These oscillations produce a variable error in the centering of the star on the optical axis (typically < 0.15 arcsec at 5σ, in medium to large space missions) and the subsequent off-axis star light leakage. Band-limited masks can be designed to cope with these effects but at the cost of decreased throughput.
Ultimately, the detectability of exoplanets depends on the contrast achieved on the region around the coronagraph axis and the off-axis throughput. The terms ‘inner working angle’ (IWA) and ‘outer working angle’ (OWA) are introduced to define the angular distances of the planets susceptible to be observed; IWA and OWA are the inner and outer edges of the high contrast, dark on-axis region where the signal of the planet can be detected [26]. IWA is typically only a few times larger than the theoretical diffraction limit of the telescope.
At the time of writing this article, the most ambitious project under study is the Large Ultraviolet-Optical-Infrared Surveyor (LUVOIR). The Extreme Coronagraph for Living Planetary Systems (ECLIPS) is the baseline instrument in the NASA-funded LUVOIR Design Study [27]. ECLIPS is designed for high dynamic range imaging (target dynamic range 1010) and slitless spectroscopy [28].
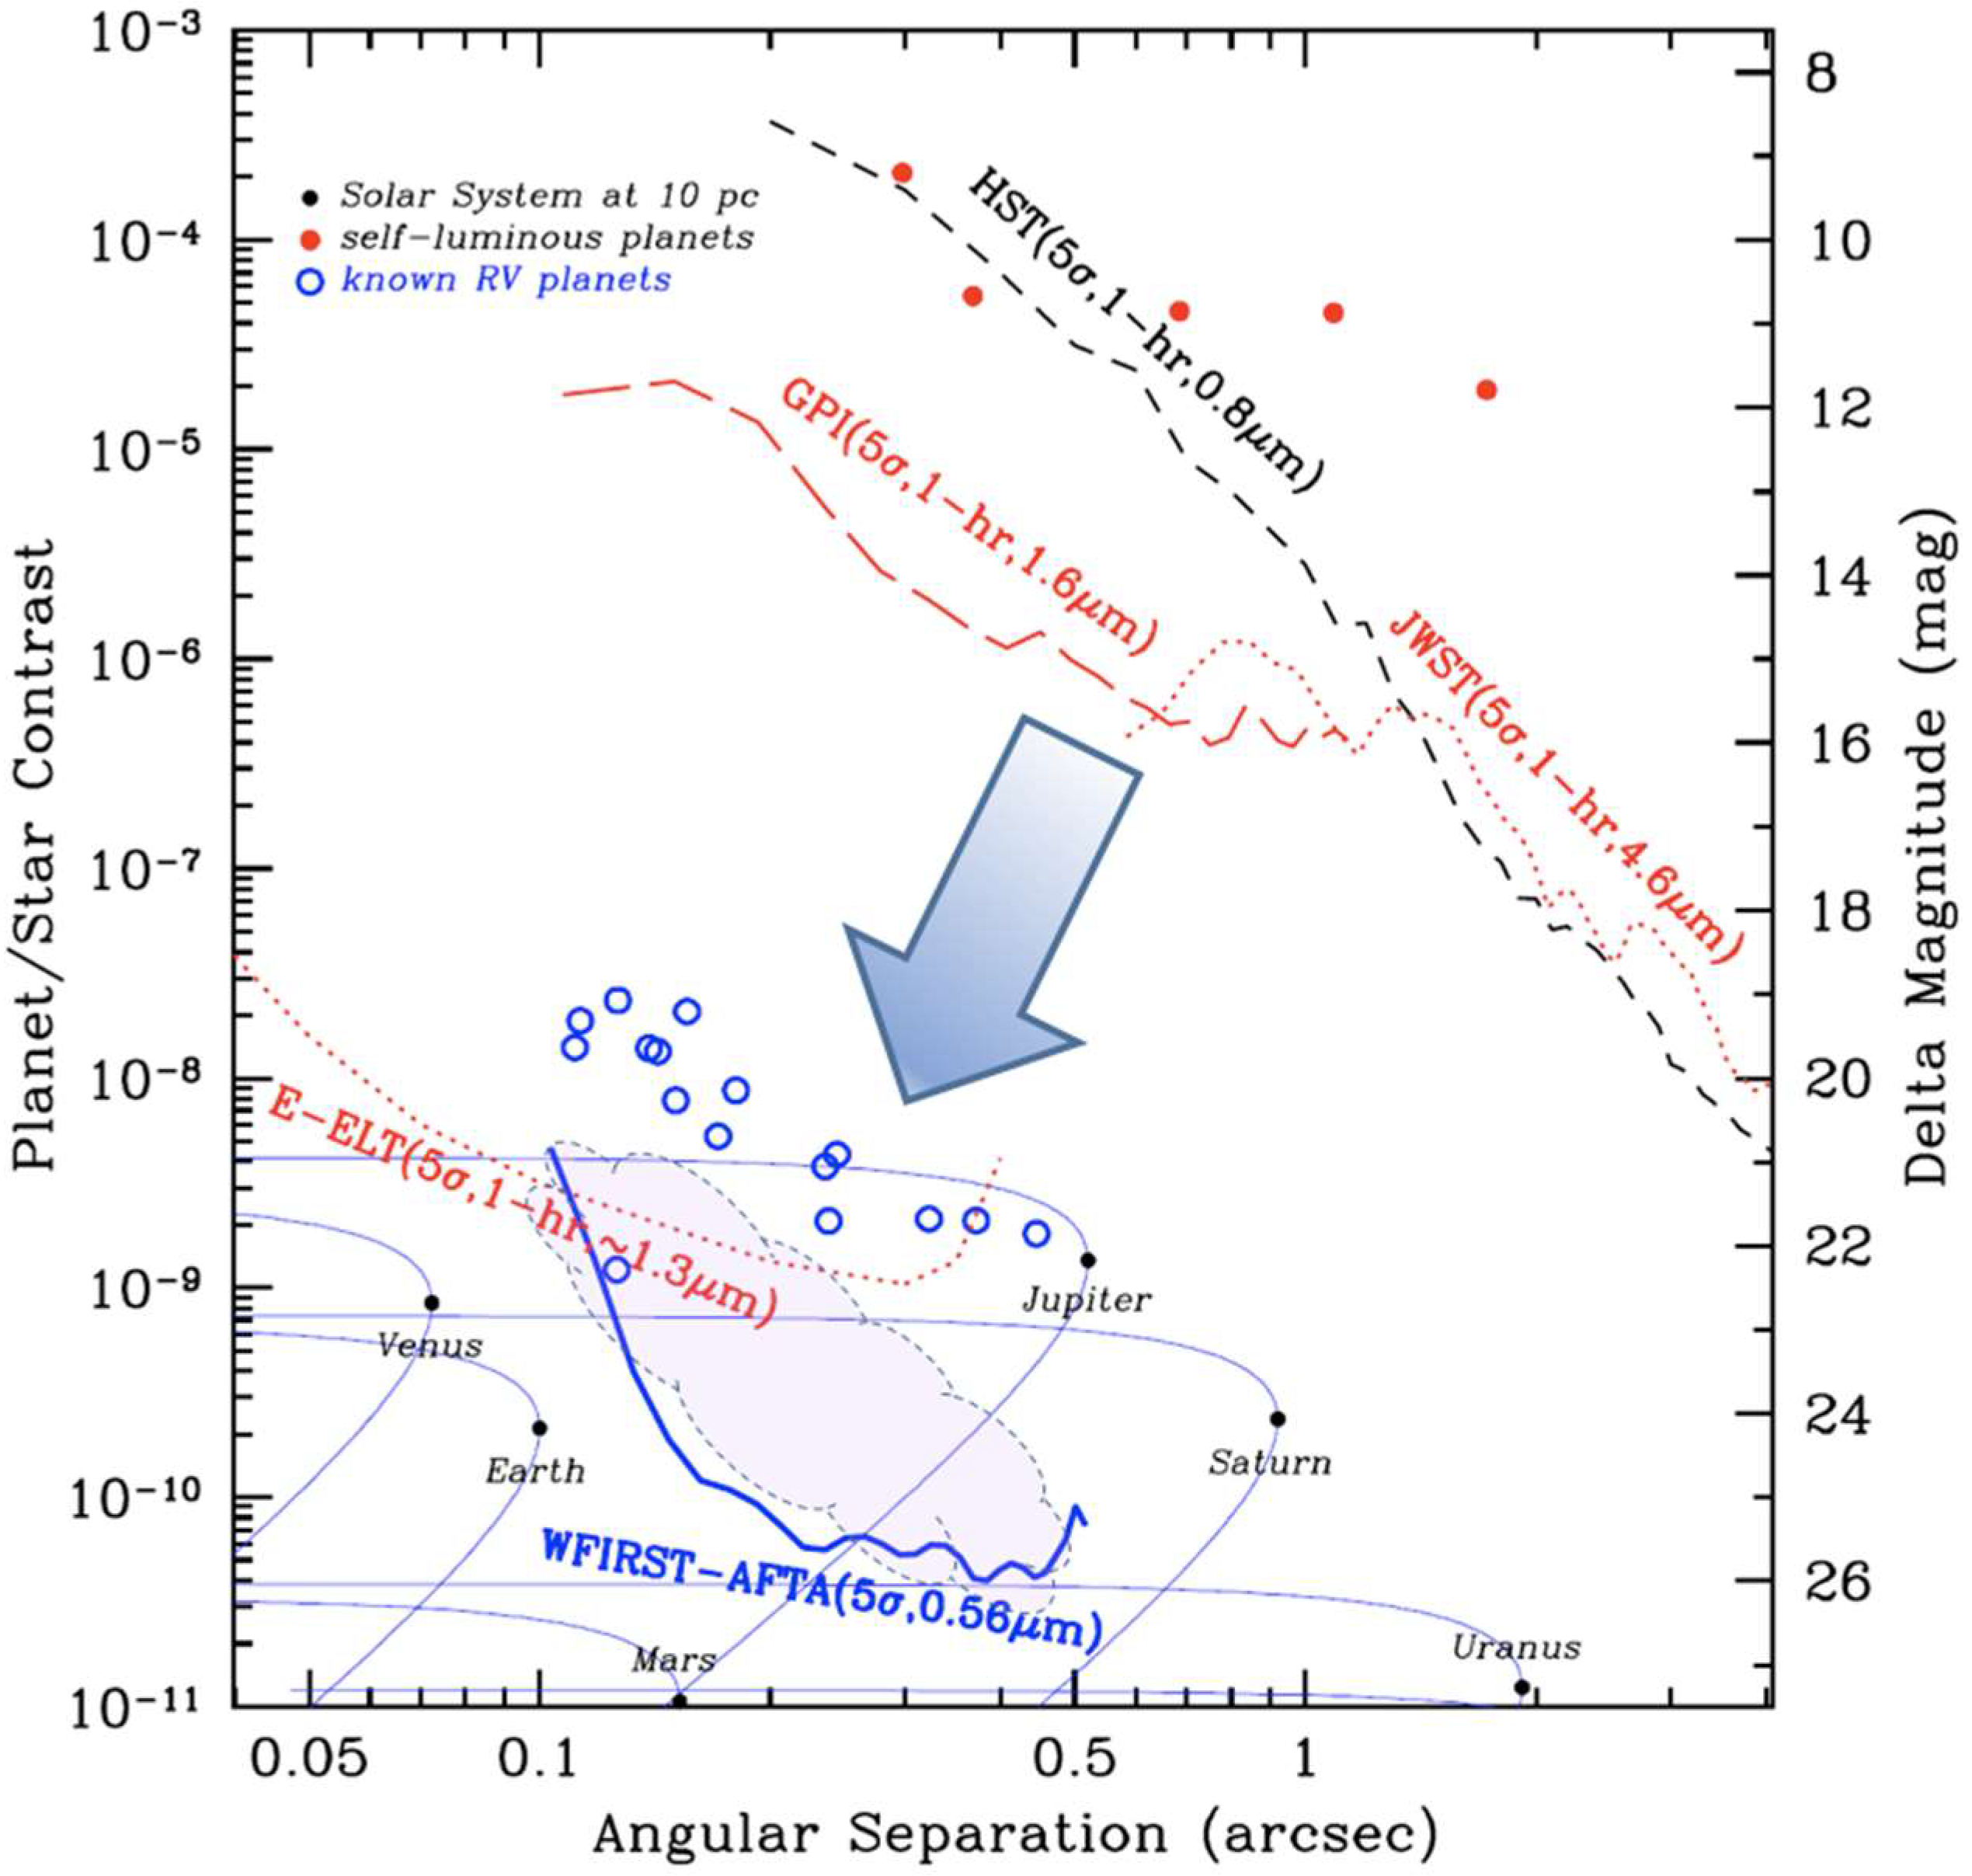
ECLIPS divides the telescope beam in three channels that correspond to the following bandpasses: UV (200 nm to 400 nm), optical (400 nm to 850 nm), and NIR (850 nm to 2.0 microns). Each channel is equipped with a set of coronagraph masks, a low-order/out-of-band wavefront sensor and, two deformable mirrors for wavefront control. ECLIPS design grows on the experience of Wide-Field InfraRed Survey Telescope (WFIRST) [28,29]. Key technologies such as autonomous ultra-precise wavefront sensing and control systems, small deformable mirrors to work under space conditions, high contrast coronagraph masks and very low noise photon counting detectors are being developed under the WFIRST project [29]. The current status of the technology is summarized in Figure 10 extracted from [29].

5. Discussion: High Resolution Imaging Versus Transmission Spectroscopy

Coronagraphs are widely used in astronomy and have proven to be a valuable tool to resolve faint structures around bright objects however, observing and characterizing exo-Earths is a significant challenge. In particular, no coronagraph has been ever developed to work at 200 nm wavelength. Formation flying technologies such as starshades and FIs have never been tested in space (though both have been successfully tested on the ground); they are inefficient from the operational point of view because of the large overheads associated with the realignment of the spacecrafts each new pointing. It is clear that though promising, technologies yet need to mature to reach the 1010 dynamic range required to image exo-Earths. In Table 1, the current status of development is summarized.
NASA funded studies are being run for starshades (WFIRST and HabEx) and Coronagraphs (WFIRST, LUVOIR). The evaluations made on exo-Earth candidate yield for the various technologies is more favorable to LUVOIR than to HabEx; the expected exoplanet yield is 51+75−33 for the 15-m primary LUVOIR version and 12 for HabEx [27].
By comparison, transmission spectroscopy during transit is a simple technology to implement to study exoplanets atmospheres. The coming space telescopes designed for exoplanet exploration: TESS (2018), CHEOPS (2019), JWST (2021), PLATO (2026), and ARIEL (2028) are designed for transmission spectroscopy and only JWST incorporates coronagraphs; it is far simpler to use the high photon flux from the stellar continuum to detect the absorption by spectral lines or molecular bands from the planet’s atmosphere than trying to cancel the strong stellar photon flux by a coronagraph or interferometer to search for the faint emission (thermal and scattered starlight) from the planet. In addition, the intrinsic faintness of the target sources enhances potential difficulties in planet imaging like confusion with exo-zodiacal light. Moreover, observations of the atmosphere of satellites of giant planets, suspected to be numerous, are not feasible in emission because of the ultrahigh spatial resolution requirements. For these reasons, the large missions under study such as LUVOIR, incorporate instrumentation for transit spectroscopy (such as LUMUS or POLLUX) [27].
Most of the known planetary systems have been detected by the transit method and the observation of UV and optical absorption during transit is a very powerful diagnostic technique [30,31]. Important bio-markers absorb efficiently the stellar radiation at ultraviolet-optical wavelengths. Ozone has the prominent Hartley bands at 200–300 nm. Oxygen (O2) has strong absorptions in the range 150–200 nm. CO has strong bands below 180 nm, and the weaker Cameron bands from 180 to 260 nm. The CO+ first negative bands are located within the 210 to 280 nm range. The presence of CO2 can be detected through the CO2+ Fox–Duffenback–Barker bands from 300 to 450 nm. Also, important tracers of atmospheric chemistry and escape are in the 100–600 nm range such as the resonance transitions of atomic hydrogen, oxygen, and carbon. Observation of these species in the high atmosphere can be easily done, demonstrating that these atoms and ions are present at very high altitude (several hundreds of kilometers) and providing large absorption depths.
Transmission spectroscopy is specially well suited to study atmospheric escape and the interaction between planetary atmospheres and stellar winds. Taking the Earth as reference, it is well known from NASA’s missions Magnetopause-to-Aurora Global Exploration (IMAGE) [32] and Two Wide-angle Imaging Neutral-atom Spectrometers (TWINS) [33] that Earth’s exosphere extends much further than 30R reaching a size comparable to the radius of a late M star (see Figure 11). As the exosphere’s main component is atomic hydrogen, planetary exospheres efficiently block the Lyα (121.6 nm) radiation from the star [34]. In fact, in spite of the heavy interstellar absorption at Lyα, the transit of HD209458b, the first transiting planet was detected in Lyα with HST [31].
Planetary exospheres trace the atmospheric escape and are very sensitive to the solar wind. Therefore, Lyα monitorings have an enormous potential to study atmospheric escape in young planetary systems and the robustness of planetary atmospheres against the stellar magnetic activity.
Observation of biomarkers in the Earth shows that these atoms and ions are present at very high altitude (even several hundreds of kilometers) causing large absorption depths. Electronic molecular transitions, pumped by UV photons, are several orders of magnitude stronger than the vibrational or rotational transitions observed in the infrared or radio range provided the stellar UV radiation field is strong enough. For a typical life-supporting terrestrial planet, the ozone layer is optically thick to grazing incident UV radiation to an altitude of about 60 km. With a telescope 50 times as sensitive as Hubble, ozone can be detected in Earth-like planets orbiting stars brighter than V~10; i.e., orbiting a K dwarf at a distance of about 50 pc, or orbiting a F dwarf at a distance of more than 500 pc [35].
However, an unbiased study of exoplanetary systems requires actually resolving the planet from the star, i.e., wide angular resolution imaging. Firstly, because most of the exoplanetary systems are not observed edge-on and even, for those observed edge-on, the chances of detecting exoplanets during the transit decrease with the orbital radius. Moreover, transmission spectroscopy is ideally suited to study planetary winds and exospheres (as shown, in Figure 11) but the absorption cross section of the atmosphere to the stellar radiation is reduced to the terminator, a ring significantly smaller than the planetary surface for the lowest (and densest) planetary layers; for instance, for Earth’s parameters, the ratio between the geometric cross section of the dense atmosphere (~100 km height) to absorption spectroscopy to the Earth’s geometric cross section to emission spectroscopy is 0.028.

6. Conclusions

Imaging Earth-like exoplanets is a challenging endeavor supported by promising technological developments. It will enable unbiased studies of the exoplanetary systems. The observation of UV and optical absorption produced by planet transits is a very powerful and robust diagnostic technique, with far less stringent optical requirements and not to be neglected.

Funding

This article has been partially funded by the Ministerio de Economia y Competitividad of Spain under grant, ESP2015-68908-R.

Acknowledgments

It is my pleasure to acknowledge Laurent Koechlin, Jean Pierre Rivet, and the LUVOIR team for interesting conversations on the technological challenges of exoplanet detection and characterization.

Conflicts of Interest

The author declares no conflict of interest.

References

  1. Fressin, F.; Torres, G.; Charbonneau, D.; Bryson, S.T.; Christiansen, J.; Dressing, C.D.; Jenkins, J.M.; Walkowicz, L.M.; Batalha, N.M. The False Positive Rate of Kepler and the Occurrence of Planets. Astrophys. J. 2013, 766, 81–101. [Google Scholar] [CrossRef]
  2. Luhman, K.L.; Morley, C.V.; Burgasser, A.J.; Esplin, T.L.; Bochanski, J.J. Near-infrared Detection of WD 0806-661 B with the Hubble Space Telescope. Astrophys. J. 2014, 794, 16. [Google Scholar] [CrossRef]
  3. Rugheimer, S.; Kaltenegger, L.; Zsom, A.; Segura, A.; Sasselov, D. Spectral Fingerprints of Earth-like Planets Around FGK Stars. Astrobiology 2013, 13, 251. [Google Scholar] [CrossRef] [PubMed]
  4. Beichman, C.A.; Krist, J.; Trauger, J.T.; Greene, T.; Oppenheimer, B.; Sivaramakrishnan, A.; Doyon, R.; Boccaletti, A.; Barman, T.S.; Rieke, M. Imaging Young Planets from Ground and Space. Publ. Astron. Soc. Pac. 2010, 122, 162. [Google Scholar] [CrossRef]
  5. Beichman, C.A.; Green, T.P. A White Paper Submitted to The National Academy of Science’s Committee on Exoplanet Science Strategy: Observing Exoplanets with the James Webb Space Telescope. arXiv, 2018; arXiv:1803.03730. [Google Scholar]
  6. Schwieterman, E.W.; Kiang, N.Y.; Parenteau, M.N.; Harman, C.E.; DasSarma, S.; Fisher, T.M.; Arney, G.N.; Hartnett, H.E.; Reinhard, C.T.; Olson, S.L.; et al. Exoplanet Biosignatures: A Review of Remotely Detectable Signs of Life. Astrobiology 2018, 18, 663. [Google Scholar] [CrossRef] [PubMed]
  7. Ricker, G.R.; Winn, J.N.; Vanderspek, R.; Latham, D.W.; Bakos, G.Á.; Bean, J.L.; Berta-Thompson, Z.K.; Brown, T.M.; Buchhave, L.; Butler, N.R.; et al. Transiting Exoplanet Survey Satellite (TESS). Proc. SPIE 2014, 9143, 914320. [Google Scholar] [Green Version]
  8. Broeg, C.; Fortier, A.; Ehrenreich, D.; Alibert, Y.; Baumjohann, W.; Benz, W.; Deleuil, M.; Gillon, M.; Ivanov, A.; Liseau, R.; et al. CHEOPS: A Transit Photometry Mission for ESA’s Small Mission Programme. Hot Planets and Cool Stars, Garching, Germany. EPJ Web Confer. 2013, 47, 03005. [Google Scholar] [CrossRef]
  9. Rauer, H.; Catala, C.; Aerts, C.; Appourchaux, T.; Benz, W.; Brandeker, A.; Christensen-Dalsgaard, J.; Deleuil, M.; Gizon, L.; Goupil, M.J.; et al. The PLATO 2.0 mission. Exp. Astron. 2014, 38, 249. [Google Scholar] [CrossRef] [Green Version]
  10. Pascale, E.; Bezawada, N.; Barstow, J.; Beaulieu, Je.; Bowles, N.; Foresto, V.C.d.; Coustenis, A.; Decin, L.; Drossart, P.; Eccleston, P.; et al. The ARIEL space mission. In Proceedings of the SPIE Astronomical Telescopes + Instrumentation, Austin, TX, USA, 10–15 June 2018. [Google Scholar]
  11. Chesnokov, Y.M. A space-based very-high resolution telescope. Russ. Space Bull. 1993, 1, 18–21. [Google Scholar]
  12. Hyde, R.A. Eyeglass: Very large aperture diffractive telescopes. Appl. Opt. 1999, 38, 4198–4212. [Google Scholar] [CrossRef] [PubMed]
  13. Early, J.T. Solar sail—Fresnel zone plate lens for a large aperture based telescope. AIAA 2002, 1705, 3773–3778. [Google Scholar]
  14. Koechlin, L.; Serre, D.; Deba, P.; Pelló, R.; Peillon, C.; Duchon, P.; de Castro, A.I.; Karovska, M.; Désert, J.M.; Ehrenreich, D.; Hebrard, G. The Fresnel interferometer imager. Exp. Astron. 2009, 23, 379–402. [Google Scholar] [CrossRef] [Green Version]
  15. Koechlin, L.; Rivet, J.P.; Deba, P.; Serre, D.; Raksasataya, T.; Gili, R.; David, J. First high dynamic range and high resolution images of the sky obtained with a diffractive Fresnel array telescope. Exp. Astron. 2012, 33, 129–140. [Google Scholar] [CrossRef]
  16. Roux, W.; Koechlin, L. Improvements on Fresnel arrays for high contrast imaging. Exp. Astron. 2018, 45, 21–40. [Google Scholar] [Green Version]
  17. Copy, C.J.; Starkman, G.D. The Big Occulting Steerable Satellite (BOSS). Astrophys. J. 2000, 532, 581–592. [Google Scholar] [CrossRef]
  18. Cash, W. Detection of Earth-like planets around nearby stars using a petal-shaped occulter. Nature 2006, 442, 51–53. [Google Scholar] [CrossRef] [PubMed]
  19. Vanderbei, R.J.; Cady, E.; Kasin, N.J. Optimal occulter design for finding extrasolar planets. Astrophys. J. 2007, 665, 794–798. [Google Scholar] [CrossRef]
  20. Vanderbei, R.J.; Spergel, D.N.; Kasdin, N.J. Circularly Symmetric Apodization via Star-shaped Masks. Astrophys. J. 2003, 599, 686–694. [Google Scholar] [CrossRef]
  21. Novicki, M.C.; Warwick, S.; Smith, D.K.; Richards, M.C.; Harness, A. Suppression of astronomical sources using the McMath-Pierce Solar Telescope and starshades with flight-like optics. In Space Telescopes and Instrumentation 2016: Optical, Infrared, and Millimeter Wave; 2016; SPIE (Society of Photo-Optical Instrumentation Engineers): Bellingham, WA, USA; Volume 9904, p. 26. [Google Scholar]
  22. Harness, A.; Cash, W.; Warwick, S. High contrast observations of bright stars with a starshade. Exp. Astron. 2017, 44, 209–237. [Google Scholar] [CrossRef] [Green Version]
  23. Gaudi, B.S.; Seager, S.; Mennesson, B.; Kiessling, A.; Warfield, K.; Kuan, G.; Cahoy, K.; Clarke, J.T.; Domagal-Goldman, S.; Feinberg, L.; et al. The Habitable Exoplanet Observatory (HabEx) Mission Concept Study Interim Report. arXiv, 2018; arXiv:1809.09674. [Google Scholar]
  24. Kuchner, M.J.; Traub, W.A. A Coronagraph with a Band-limited Mask for Finding Terrestrial Planets. Astrophys. J. 2002, 570, 900. [Google Scholar] [CrossRef]
  25. Oppenheimer, B.R.; Hinkley, S. High-Contrast Observations in Optical and Infrared Astronomy. Annu. Rev. Astron. Astrophys. 2009, 47, 253. [Google Scholar] [CrossRef]
  26. Ruane, G.; Jewell, J.; Mawet, D.; Pueyo, L.; Shaklan, S. Apodized vortex coronagraph designs for segmented aperture telescopes. Proc. SPIE 2016, 9912, 99122. [Google Scholar] [Green Version]
  27. The LUVOIR Team. The LUVOIR Mission Concept Study Interim Report. arXiv, 2018; arXiv:1809.09668. [Google Scholar]
  28. Pueyo, L.; Zimmerman, N.; Bolcar, M.; Groff, T.; Stark, C.; Ruane, G.; Jewell, J.; Soummer, R.; Laurent, K.S.; Wang, J.; et al. The LUVOIR architecture “A” coronagraph instrument. Proc. SPIE 2017, 10398, 20. [Google Scholar]
  29. Spergel, D.; Gehrels, N.; Baltay, C.; Bennett, D.; Breckinridge, J.; Donahue, M.; Dressler, A.; Gaudi, B.S.; Greene, T.; Guyon, O.; et al. Wide-Field InfrarRed Survey Telescope-Astrophysics Focused Telescope Assets WFIRST-AFTA 2015 Report. arXiv, 2015; arXiv:1503.03757. [Google Scholar]
  30. Gómez de Castro, A.I.; Lecavelier, A.; D’Avillez, M.; Linsky, J.L.; Cernicharo, J. UV Capabilities to Probe the Formation of Planetary Systems: From the ISM to Planets. In Fundamental Questions in Astrophysics: Guidelines for Future UV Observatories; Springer: Dordrecht, The Netherlands, 2006; pp. 33–52. [Google Scholar]
  31. Vidal-Madjar, A.; Des Etangs, A.L.; Désert, J.M.; Ballester, G.E.; Ferlet, R.; Hébrard, G.; Mayor, M. An extended upper atmosphere around the extrasolar planet HD209458b. Nature 2002, 422, 143–146. [Google Scholar] [CrossRef] [PubMed]
  32. Fuselier, S.A.; Burch, J.L.; Lewis, W.S.; Reiff, P.H. Overview of the image science objectives and mission phases. Space Sci. Rev. 2000, 91, 51–66. [Google Scholar] [CrossRef]
  33. McComas, D.J.; Allegrini, F.; Baldonado, J.; Blake, B.; Brandt, P.C.; Burch, J.; Clemmons, J.; Crain, W.; Delapp, D.; DeMajistre, R.; et al. The Two Wide-angle Imaging Neutral-atom Spectrometers (TWINS) NASA Mission-of-Opportunity. Space Sci. Rev. 2009, 142, 157–231. [Google Scholar] [CrossRef] [Green Version]
  34. Gómez de Castro, A.I.; Beitia-Antero, L.; Ustamujic, S. On the feasibility of studying the exospheres of Earth-like exoplanets by Lyman-α monitoring. Detectability constraints for nearby M stars. Exp. Astron. 2018, 45, 147–163. [Google Scholar] [CrossRef]
  35. Gómez de Castro, A.I.; Appourchaux, T.; Barstow, M.A.; Barthelemy, M.; Baudin, F.; Benetti, S.; Blay, P.; Brosch, N.; Bunce, E.; de Martino, D.; et al. Building galaxies, stars, planets and the ingredients for life between the stars. The science behind the European Ultraviolet-Visible Observatory. Astrophys. Space Sci. 2014, 354, 229–246. [Google Scholar] [CrossRef] [Green Version]
Figure 1. The location of Kepler planet candidates known by 7 August 2017 is shown for the wide field observed in the constellations of Cygnus and Lyra during the main nominal mission (about four years). Image credit: NASA/Wendy Stenzel.
Geosciences 08 00442 g001
Figure 2. Parameters of known exoplanetary systems: distance to the Sun versus angular distance between the planet and the parent star. Masses of planets are color coded: Mp ≤ 2ME (blue dots), 2ME < Mp < 10ME (red asterisks), Mp ≥ 10ME (green circles). Data from exoplanets.eu/catalog.
Geosciences 08 00442 g002
Figure 3. The Fp/F* ratios and angular distances of exoplanetary systems as per exoplanet.eu (in July 2018). The Fp/F* ratios are also plotted for Solar System planets. The bottom left source is WD 0806-661 b, one of the coldest known brown dwarfs (Teff = 300–345 K) [2], included in the data base. Fp/F* ratios are given in logarithmic scale.
Geosciences 08 00442 g003
Figure 4. The Fp/F* ratios for an Earth-analogue cloud coverage orbiting a cool star. The planet is assumed to receive the same energy per unit surface as the Earth receives from the Sun (the wavelength integrated stellar flux received on top of the planet’s atmosphere is 1370 Wm−2) (from [3]).
Geosciences 08 00442 g004
Figure 5. Artist concept of a FI. The two spacecrafts in a formation flying configuration are represented. The Fresnel Interferometer Array (FIA) depicted in the figure is circular but carved with an orthogonal pattern. The FIA focus the light in the second spacecraft, located at the end of the optical path (upper top corner in the image), that includes the optics to correct for chromatism, as well as the standard analysis optics and detection chain. Courtesy: Laurent Koechlin.
Geosciences 08 00442 g005
Figure 6. (a) Typical PSF at order 1 of a binary Fresnel zone plate for a square aperture; (b) Upper right quadrant of the PSFs of FIAs for various configurations (see [16] for details).
Geosciences 08 00442 g006
Figure 7. Artist concept of a starshade operating with a space telescope. The two spacecrafts are represented in a formation flying configuration. Credits: NASA/JPL-Caltech.
Geosciences 08 00442 g007
Figure 8. (a) The 16-petal starshade corresponding to the optimized solution in [18]; (b,c) Simulated images at the telescope’s image plane; RGB colors correspond to wavelengths 1 μm, 0.7 μm and 0.4 μm, respectively. (b): Planet at 60 mas. Parameters: R = 22 m, dS-T = 66,000 km; (c): Planet at 72 mas. Parameters: R = 25 m, dS-T = 72,000 km.
Geosciences 08 00442 g008
Figure 9. Optical design of a basic Lyot coronagraph for monochromatic radiation. The mask (or occulting spot) is located in the image plane and blocks the stellar radiation. After, the pupil is partially blocked to suppress the diffraction rings. After the coronagraph, the stellar image is a set of rings with a 0.5% of the original stellar flux (for this particular design from A. Sivaramakrishnan). The figure comes from [25].
Geosciences 08 00442 g009
Figure 10. Exoplanet detection limit of the hybrid-Lyot coronagraph on WFIRST-AFTA, compared to other high-contrast systems. GPI stands for the Gemini Planet Imager and ELT for the extremely large telescope. Both are ground-based observatories. The only space telescope flown with capabilities for coronagraphy is HST. The blue open dots are planets found by the detection of stellar radial velocity variations. For comparison, LUVOIR/ECLIPS expected IWA is 14.4 mas at 200 nm (UV) and 37 mas at 525 nm (optical range), (figure from [29]).
Geosciences 08 00442 g010
Figure 11. The Earth’s exosphere is a hydrogen envelope that extends further than 30 R. This envelope absorbs efficiently the stellar Lyα photons producing a measurable effect [34]. The transmittance of the Earth’s exosphere to Lyα photons is outlined in left panel (black corresponds to transmittance 0 and white to transmittance 1). On the left panel, several images of the Sun’s chromospheric emission have been scaled to the size of the Sun, AU Mic and Proxima Centauri and multiplied by this mask. The size of the Earth’s exosphere is comparable to the radius of an M5 V star (right panel), covers a large fraction of the disk of an M0 V star (central right panel), and is small compared with the Sun (central left panel). The squares in the color panels have a size of 30R × 30R.
Geosciences 08 00442 g011
Table 1. Summary of technologies.
TechnologyAngular Resolution@ LyαDynamic RangeDevelopment StateChallenges
Fresnel Imager (10 m)2.5 mas108 anisotropic (Figure 5)Tested on astronomical sources at ground-based facilities (optical range)Low radiometric efficiency. Dedicated mission.
Starshade (10 m)2.5 mas requires dST = 8200 km107 experiment@ optical rangeTested on astronomical sources at ground-based facilities (optical range)Low radiometric efficiency.
LUVOIR A/ECLIPS Coronagraph1.7 mas1010 (target)To be tested for large space telescopesConcept to be tested