Article

Dissociation and Self-Preservation of Gas Hydrates in Permafrost

1
Skolkovo Institute of Science and Technology (Skoltech), 3, Nobel st., Innovation Center Skolkovo, Moscow 121205, Russia
2
Lomonosov Moscow State University (MSU), GSP-1, Leninskie Gory, Moscow 119991, Russia
3
Scientific & Research Institute of Natural Gases and Gas Technologies (Gazprom VNIIGAZ), Building 1, Village Razvilka, Leninsky District, Moscow region 142717, Russia
*
Author to whom correspondence should be addressed.
Geosciences 2018, 8(12), 431; https://doi.org/10.3390/geosciences8120431
Submission received: 19 October 2018 / Revised: 15 November 2018 / Accepted: 20 November 2018 / Published: 23 November 2018
(This article belongs to the Special Issue Gas and Gas Hydrate in Permafrost)

Abstract

:
Gases releasing from shallow permafrost above 150 m may contain methane produced by the dissociation of pore metastable gas hydrates, which can exist in permafrost due to self-preservation. In this study, special experiments were conducted to study the self-preservation kinetics. For this, sandy samples from gas-bearing permafrost horizons in West Siberia were first saturated with methane hydrate and frozen and then exposed to gas pressure drop below the triple-phase equilibrium in the “gas–gas hydrate–ice” system. The experimental results showed that methane hydrate could survive for a long time in frozen soils at temperatures of −5 to −7 °C at below-equilibrium pressures, thus evidencing the self-preservation effect. The self-preservation of gas hydrates in permafrost depends on its temperature, salinity, ice content, and gas pressure. Prolonged preservation of metastable relict hydrates is possible in ice-rich sandy permafrost at −4 to −5 °C or colder, with a salinity of <0.1% at depths below 20–30 m.

1. Introduction

Permafrost occupies a large area in Eurasia and North America, where it reaches a thickness of 1 km [1,2]. Continuous permafrost, 200–300 m thick or more, also spreads over vast territories in the shelf of the shallow Arctic Sea at sea depths within a few tens of meters [3,4,5,6]. Permafrost stores large amounts of gas that may exist in the hydrate form, especially methane hydrate. The zone of gas hydrate stability in permafrost, where methane hydrates can form and exist for a long time, spans a depth interval between 200 and 250 m in permafrost and between 800 and 1500 meters below it [7]. Intrapermafrost and subpermafrost gas hydrates have been discovered in northern West Siberia, in Alaska and Canadian Arctic (onshore and offshore), and in the Tibet highlands [8,9,10,11,12,13,14,15]. Subpermafrost gas hydrate deposits existing at >0 °C are well known in the Mackenzie Delta, Canada (Mallik methane hydrate reservoir) [16], Alaska [17], and Tibet [18].
Exploration and development of the Arctic oil and gas fields for the past 40–50 years have revealed high gas contents in shallow permafrost within 100–150 m. Numerous gas shows (mostly from sandy horizons) have been observed during drilling of geotechnical, test, and exploratory wells in northern West Siberia (Figure 1). Gas is often released at daily flow rates of hundreds or even thousands of cubic meters and can hardly come from voids or pockets in permafrost where ice fills almost the entire pore space.
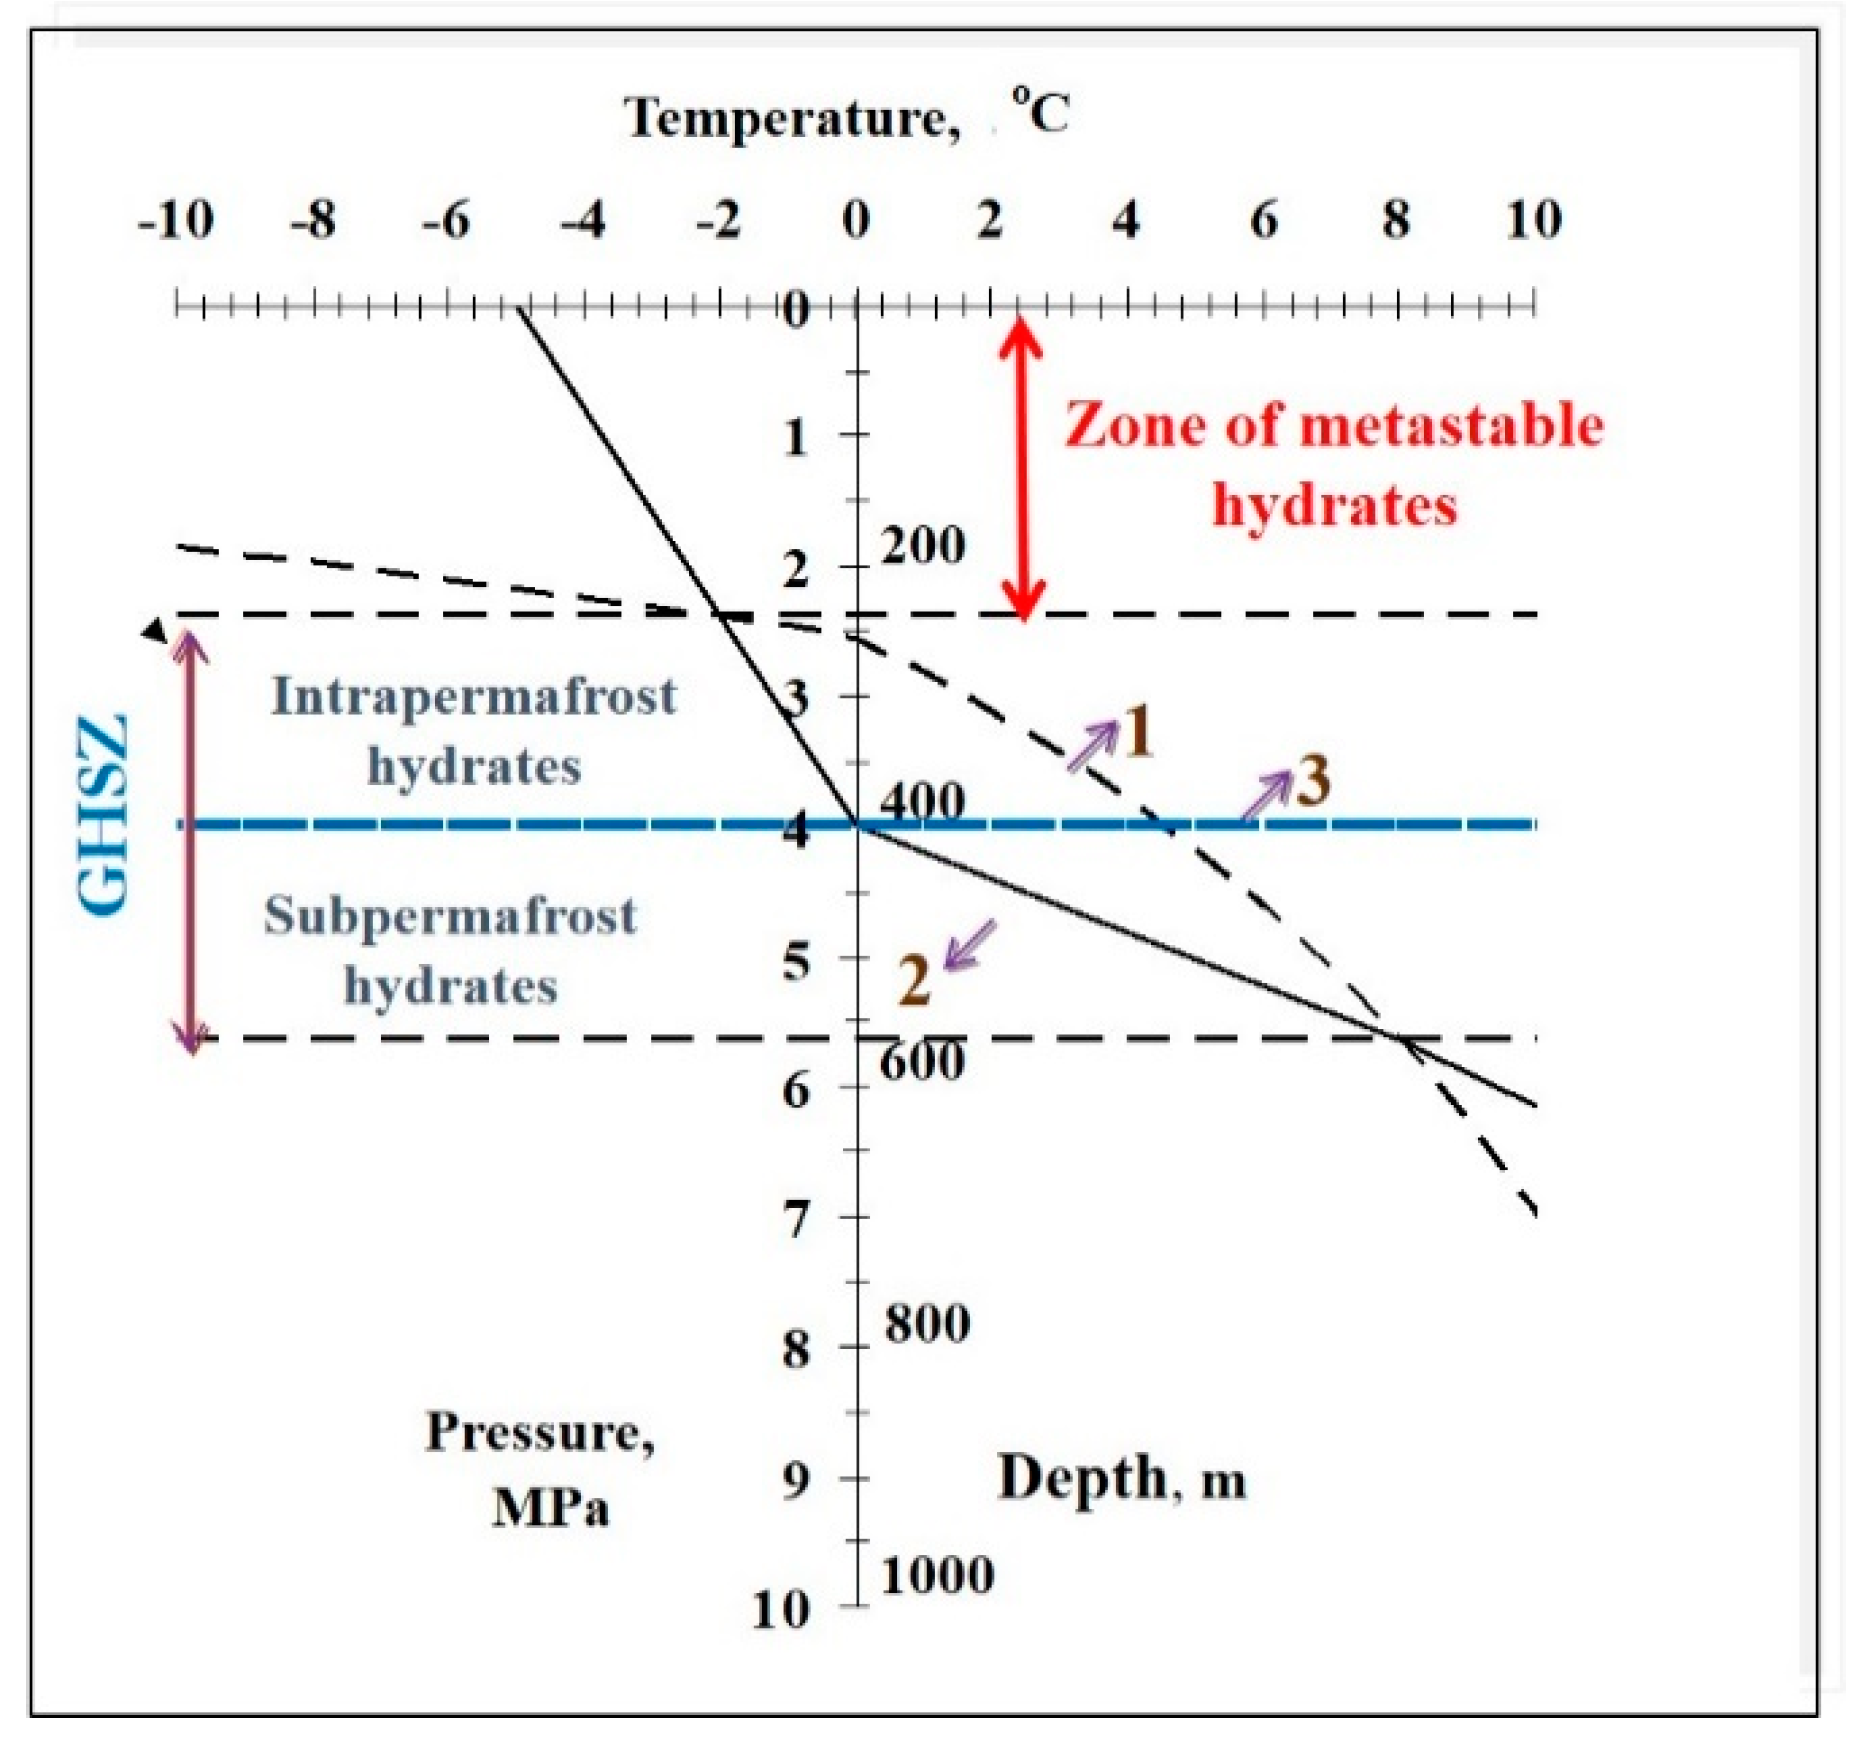
Active gas shows have been reported from 50–70 m depths in 92 GSC TAGLU Mallik 2L-38 Gas Hydrate Research Well, Mackenzie Delta, Northwest Territories, Canada [19]. Investigation of a sand core retrieved from 119 m above the zone of hydrate stability showed that pore hydrates could preserve for a long time at negative temperatures. Therefore, methane hydrates may survive in permafrost in the depth interval of 150–200 m above their thermodynamic stability, which is called a zone of metastable (or relict) hydrates (Figure 2).
Relict gas hydrates have formed under favorable conditions in the past and have survived till now due to the geological manifestation of self-preservation (anomalous preservation) at negative temperatures [19,20,21]. The self-preservation of gas hydrates means very slow dissociation at a decaying rate after the external pressure has dropped below phase equilibrium in the “gas–ice–hydrate” system at temperatures below −3 or −2 °C. As a result, the gas hydrate particles become covered with thin ice films, which prevent further hydrate dissociation [20,22,23,24].
This effect was discovered and studied from the late 1980s to early 1990s by scientists from Russia (Gazprom VNIIGAZ and Lomonosov Moscow State University), Canada (Ottawa National R&D Center), and the US (United States Geological Survey) [20,25,26,27,28,29,30,31]. The term “self-preservation” of gas hydrates was coined in Russia after researchers discovered that gas hydrate dissociation stopped soon after the onset of experiments when hydrate particles became coated with ice films. Later on, the results were corroborated and extended with data from more thorough experiments on structural changes in hydrates of methane and other gases capable of self-preservation [22,23,24,32,33,34,35,36,37,38,39,40,41,42]. The results were the basis for a unique technology of using hydrates as a gas storage and transportation media due to their very slow dissociation at <0 °C and 0.1 MPa [43,44,45,46].
Studies in the last two decades have focused on the dissociation and self-preservation kinetics of metastable gas hydrates in permafrost and porous materials at negative temperatures [47,48,49,50,51,52,53,54]. Self-preservation of pore hydrates depends on the properties of host sediments (particle sizes, mineralogy, salinity, pore moisture, pore hydrate structure, initial ice content, etc.) as well as on external pressure and temperature. The metastable gas hydrates lying above the present hydrate stability zone are extremely sensitive to the external effects of temperature, pressure, and sediment salinity, which create problems for the development of oil and gas fields as well as pose risks of gas explosions and other emergencies during drilling and operation of geotechnical and production wells. In this respect, experimental investigation into self-preservation of gas hydrates in frozen ground, as well as their physical properties, is of special importance.

2. Methods

Dissociation of pore gas hydrates upon pressure drop to below equilibrium was modeled in the laboratory using a specially designed system consisting of a pressure cell (420 cm3 working volume), a vessel for artificial saturation of samples with gas hydrates, a liquid cryostat for automatic temperature monitoring in the pressure cell, an analog-to-digital converter (for digitizing the electric signals from temperature and pressure sensors), and a workstation. The temperature and pressure readings were accurate to 0.05 °C and 0.005 MPa, respectively. The experiments were applied to samples of natural quartz sand (fine sand-1) and gas-bearing permafrost from northern West Siberia, i.e., fine sand-2 and fine sand-3 from the Yamburg and South Tambey gas fields, respectively (Table 1). The initial pore moisture content (Win, %), in a range of 10 to 20%, was assumed to be uniformly distributed over the samples.
The cylindrical samples, which were 10 cm high and 4.6 cm in diameter, were saturated with gaseous methane (gas pressure 6–8 MPa) in the sealed and vacuumed gas cell. Pure methane (99.98%) was used as hydrate-forming gases. As a rule, the samples were partly saturated to ensure a tight gas–water contact in the pore space.
The samples were prepared basically in two different ways:
(1) Cooling the pressure cell with samples from room temperature (20–25 °C) to low positive temperatures (1–3 °C), which led to the formation of pore gas hydrates. As hydrate formation decayed, the cell was frozen to freeze up the residual unfrozen pore water whereby additional hydrates were formed [55,56]. The samples were exposed to cyclic freezing and thawing in some runs in order to increase the hydrate saturation. This saturation procedure was applied mainly to samples with low initial pore moisture; it did not work in the case of high moisture, which became redistributed and produced hydrate caps on sample ends, thus impeding estimation of the saturation parameters.
(2) Gradually heating the system with hydrate-bearing samples frozen to −4 to −6 °C to low positive temperatures (1–3 °C). The ensuing ice melting of the pore accelerated pore hydrate formation due to additional gas–water contacts. The samples were frozen back (−6 to −8 °C) after the hydrate formation decayed. This approach suggested by Chuvilin et al. [52] allows hydrate saturation to ≥60%.
Thus, samples with ice- and hydrate-filled porosity were obtained in the pressure cell at a gas pressure above the equilibrium. Then, the gas pressure (at <0 °C) was reduced to below the equilibrium to obtain frozen sediments with metastable pore hydrates (Figure 3).
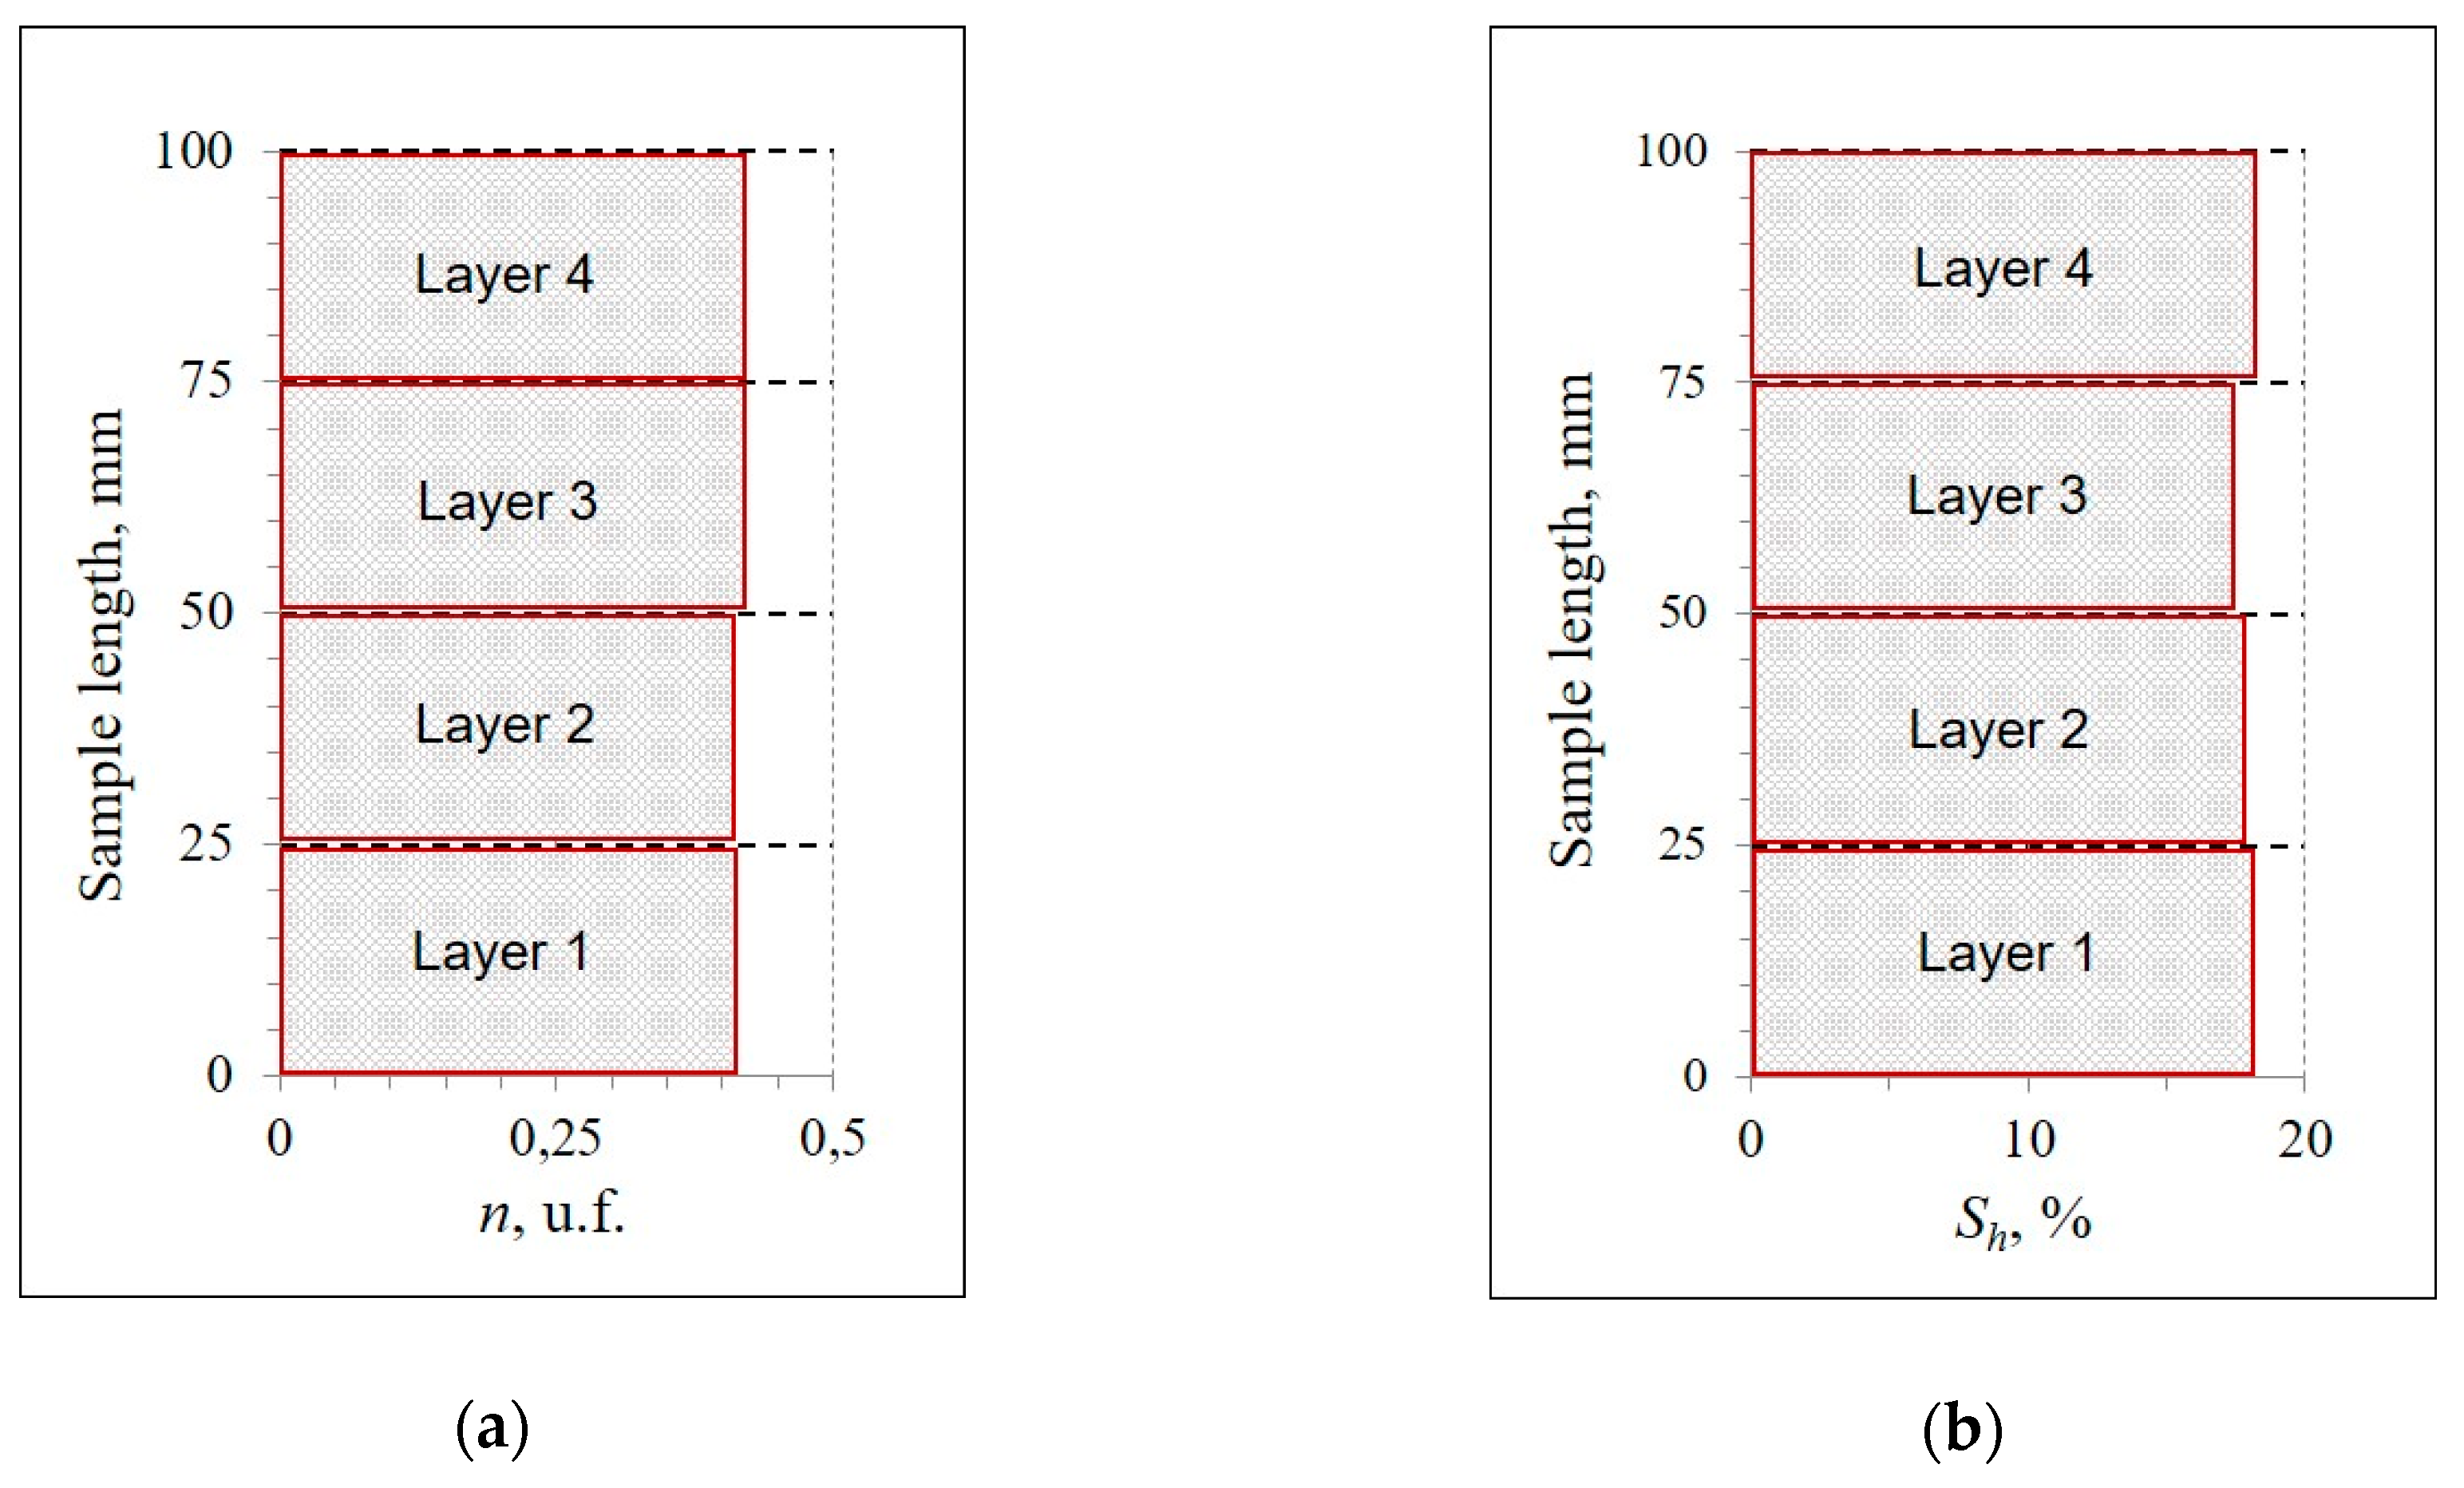
The samples had a massive ice–hydrate texture with pore hydrate contents uniformly distributed over the sample height [47]. Moisture contents (W, %), dry density (ρd, g/cm3), and hydrate saturation were estimated separately in four 20–25-mm-thick layers of the samples (Figure 4).
Porosity (n from 0.41 to 0.42) and hydrate saturation (Sh from 17 to 18%) varied only slightly over the height of the frozen samples (fine sand with 7% of montmorillonite clay particles) with the initial moisture Win = 10%, which were saturated with hydrate at temperatures slightly above 0 °C. Pore moisture (assumed to be uniform) did not redistribute significantly during hydrate formation in these conditions.
The kinetics of pore hydrate dissociation was studied experimentally using two original techniques:
(1) Pressure in the cell with frozen hydrate-bearing soil samples dropped to 0.1 MPa. Then, the cell was opened, and the samples were taken out, most often 30 min after the pressure drop. The samples were then analyzed in terms of their physical properties: structure and texture, moisture content (W, %), porosity (n, u.f.), dry density (ρd, g/cm3), gas and hydrate contents, percentage of pore moisture converted to hydrate as well as ice and hydrate saturation [48]. The moisture content W is the weight ratio of water in soil (Mw) to dry soil (Msk) in percentage (%):
W = M w M s k × 100 %  
Dry density ρd of soil samples was calculated as follows:
ρ d = ρ ( 1 + 0.01 × W )   where   ρ   ( g / cm 3 )   is   the   soil   density
Porosity n of the sediment was determinate as follows:
n = ρ s ρ d ρ s   where   ρ s ( g / cm 3 )   is   the   density   of   solid   particles
Additionally, thermal conductivity, mechanic strength, and gas permeability of the samples were measured in some runs at disequilibrium conditions [57,58,59,60,61].
Gas contents were estimated by measuring the volume of gas released (with 3–4 times repeatability) as the samples were thawing in a saturated NaCl solution. The estimates were used to calculate hydrate saturation assuming hydrate numbers of 5.9 for CH4 pore hydrates. Several (usually 3–4 pcs.) specimens were placed in special isothermal containers for prolonged storage at temperatures from −2 to −7 °C. The samples became coated with ice, which prevented them from sublimation. Time-dependent variations in gas and hydrate contents were determined in some of the samples selected at certain time intervals over periods from a few weeks to a few months.
(2) Pressure–volume–temperature (PVT) analysis was applied to estimate the rate of pore hydrate dissociation directly in the pressure cell at changing temperatures and at the pressure drop of below equilibrium. This approach allows study of the dissociation kinetics within large pressure and temperature ranges and places more rigorous constraints on dissociation rates right after the pressure drop.
The volume content of hydrate (Hv, %), hydrate saturation (Sh, %), and the fraction of water converted to hydration coefficient (Kh, u.f.) were calculated from the analysis of P–T changes in the test cell as follows:
H v = M h × ρ M s × ρ h × 100 %  
where Mh is the weight of pore gas hydrate (g); Ms is the weight of sample (g); ρ is the sample density (g/cm3); and ρh is the hydrate density. The crystallographic density ρh of empty square lattice (without gas molecules by analogy with the pure ice structure) was assumed to be 0.794 g/cm3 for CH4 hydrates based on empirical data by Takeya et al. [62].
S h = H v n
where n is the sample porosity.
K h = W h W
where Wh is the percentage of water converted to hydrate (% of dry sample weight); W is the total amount of moisture (initial water content in %).
The analyzed samples had a massive structure with uniformly distributed pore ice and gas hydrates according to the initial uniform distribution of moisture remaining immobile during pore hydrate accumulation. The porosity of the hydrate-bearing samples varied within 0.4–0.5. Hydrate saturation in the equilibrium conditions was 20–70%, and hydration coefficient reached 0.7–0.9. Accuracy of hydrate saturation (Sh, %) and volumetric gas hydrate content (Hv, %) was estimated to be about 0.5–1%.

3. Results

The experiments showed that the dissociation of pore hydrates in frozen samples slowed down and stopped after the pressure dropped below the equilibrium. The samples often retained some portion of hydrates that survived until the end of the experimental run, which is the evidence of the self-preservation effect. Self-preservation becomes possible as thin ice films coat the particles of dissociating gas hydrate at negative temperatures, and it ensures prolonged existence of metastable gas hydrates.
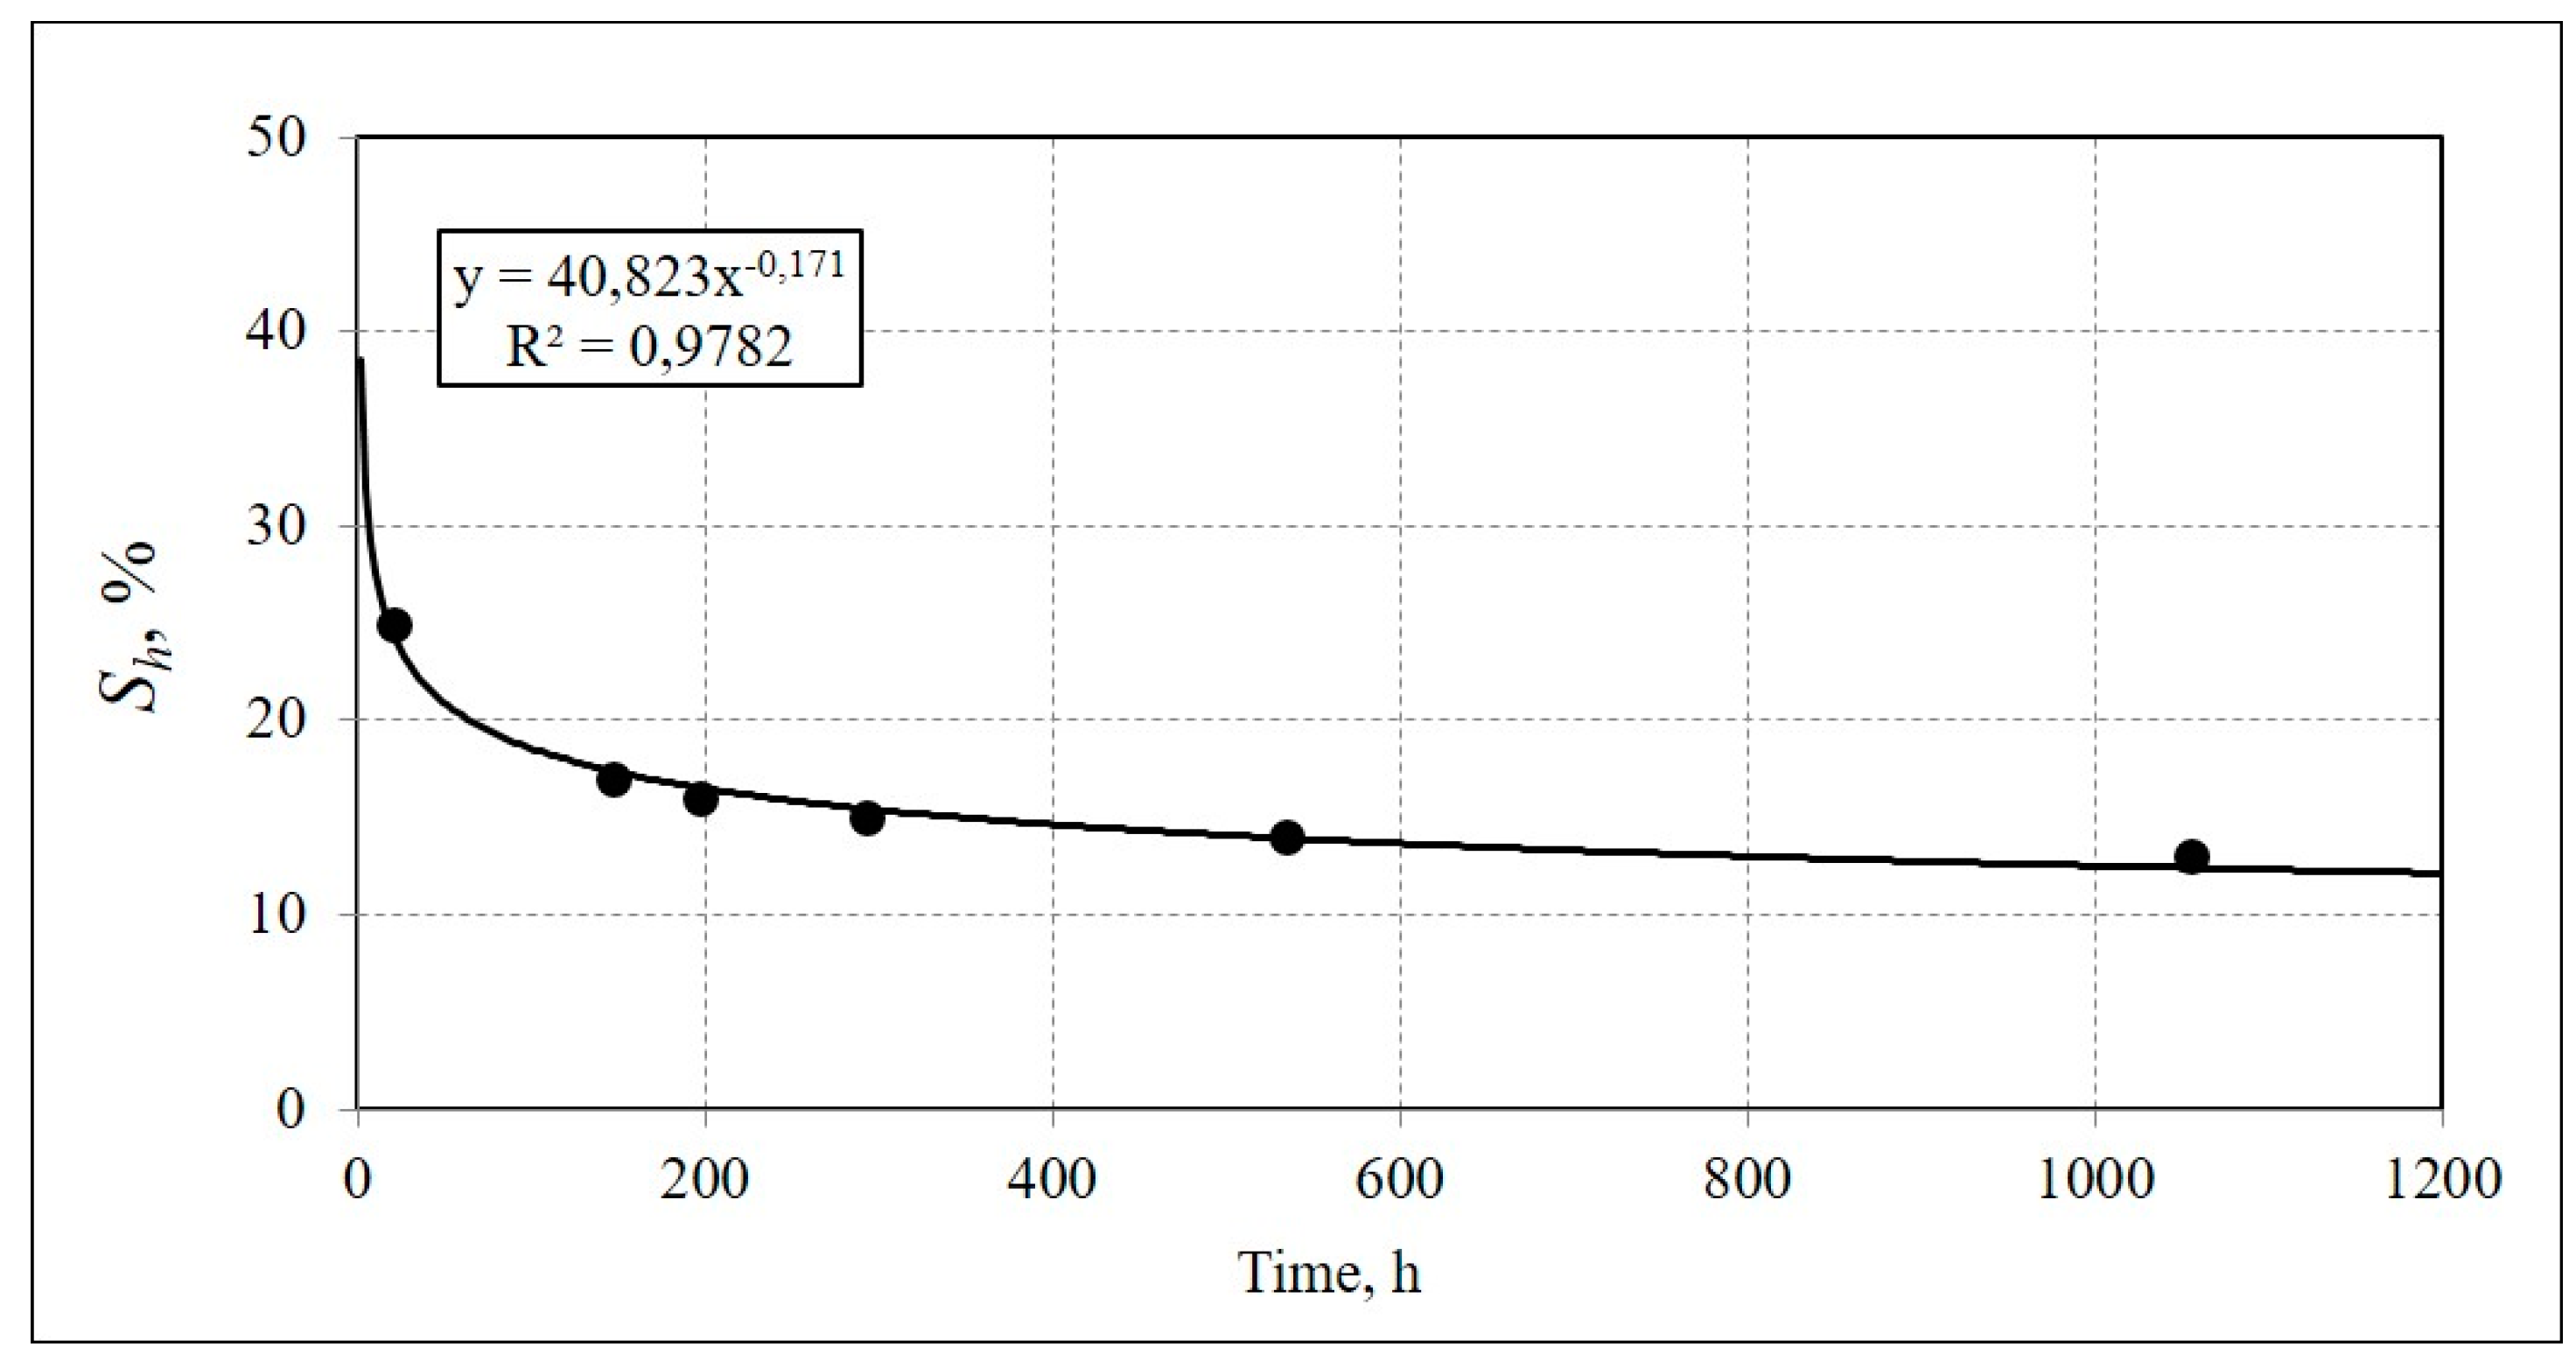
The preservation of pore hydrates was studied in frozen hydrate-bearing sand samples (W = 18%; n = 0.41). The samples were prepared in a special way. First, they were saturated with methane hydrate for about a year, which is comparable with accumulation of natural gas hydrates in permafrost. Then, they were exposed to repeated freezing–thawing cycles (hydrate formation began at subzero temperatures) to increase the hydrate density and saturation (to at least 50%). Pore methane hydrates in sand samples obtained in this way preserved for a long time at T = −6 °C and P = 0.1 MPa (Figure 5).
The samples still had quite high hydrate saturation up to Sh ≈ 13% 45 days after decompression to the atmospheric pressure. The experimentally observed kinetics of pore hydrate dissociation in frozen samples was the basis for the following analytical relationship:
S h = A × τ n  
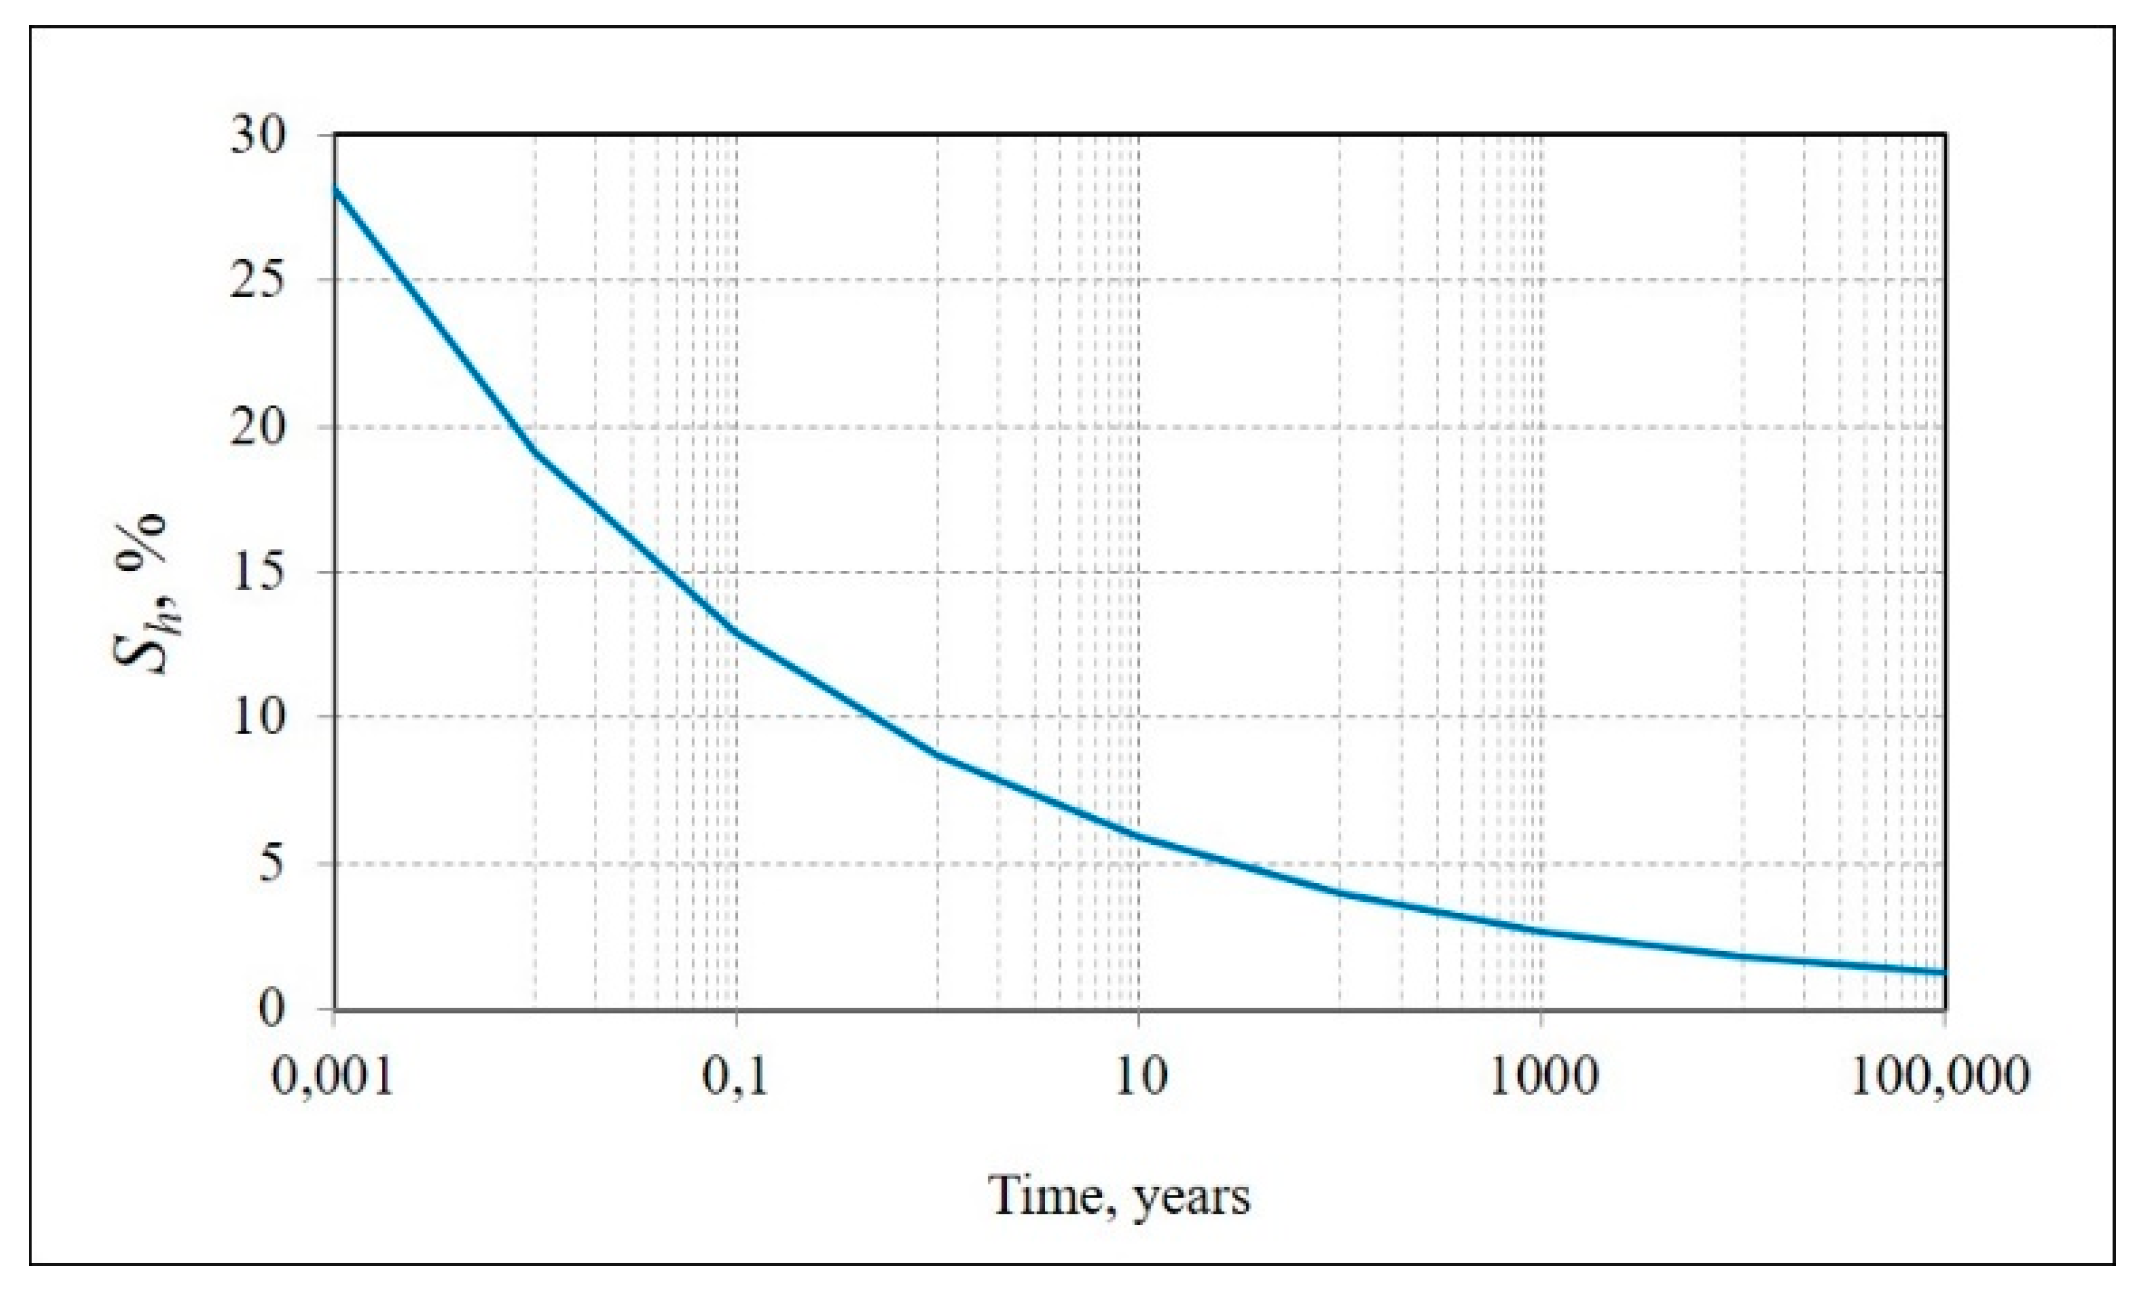
where τ is the lifetime of self-preserved pore gas hydrate; n is the constant within 0.15–0.17; and A refers to the initial content of pore hydrate. Equation (7) can be used to predict hydrate saturation changes in frozen soils in the case of self-preservation of pore hydrates. According to the prognostic curve, soils contain a few percentages of pore hydrates even after tens of thousands of years of dissociation (Figure 6), i.e., relict gas hydrates can exist in permafrost of northern West Siberia for at least a thousand years. The residual hydrate saturation may be still higher given the true lithostatic pressure and recrystallization in the pore space of hydrate-bearing permafrost.
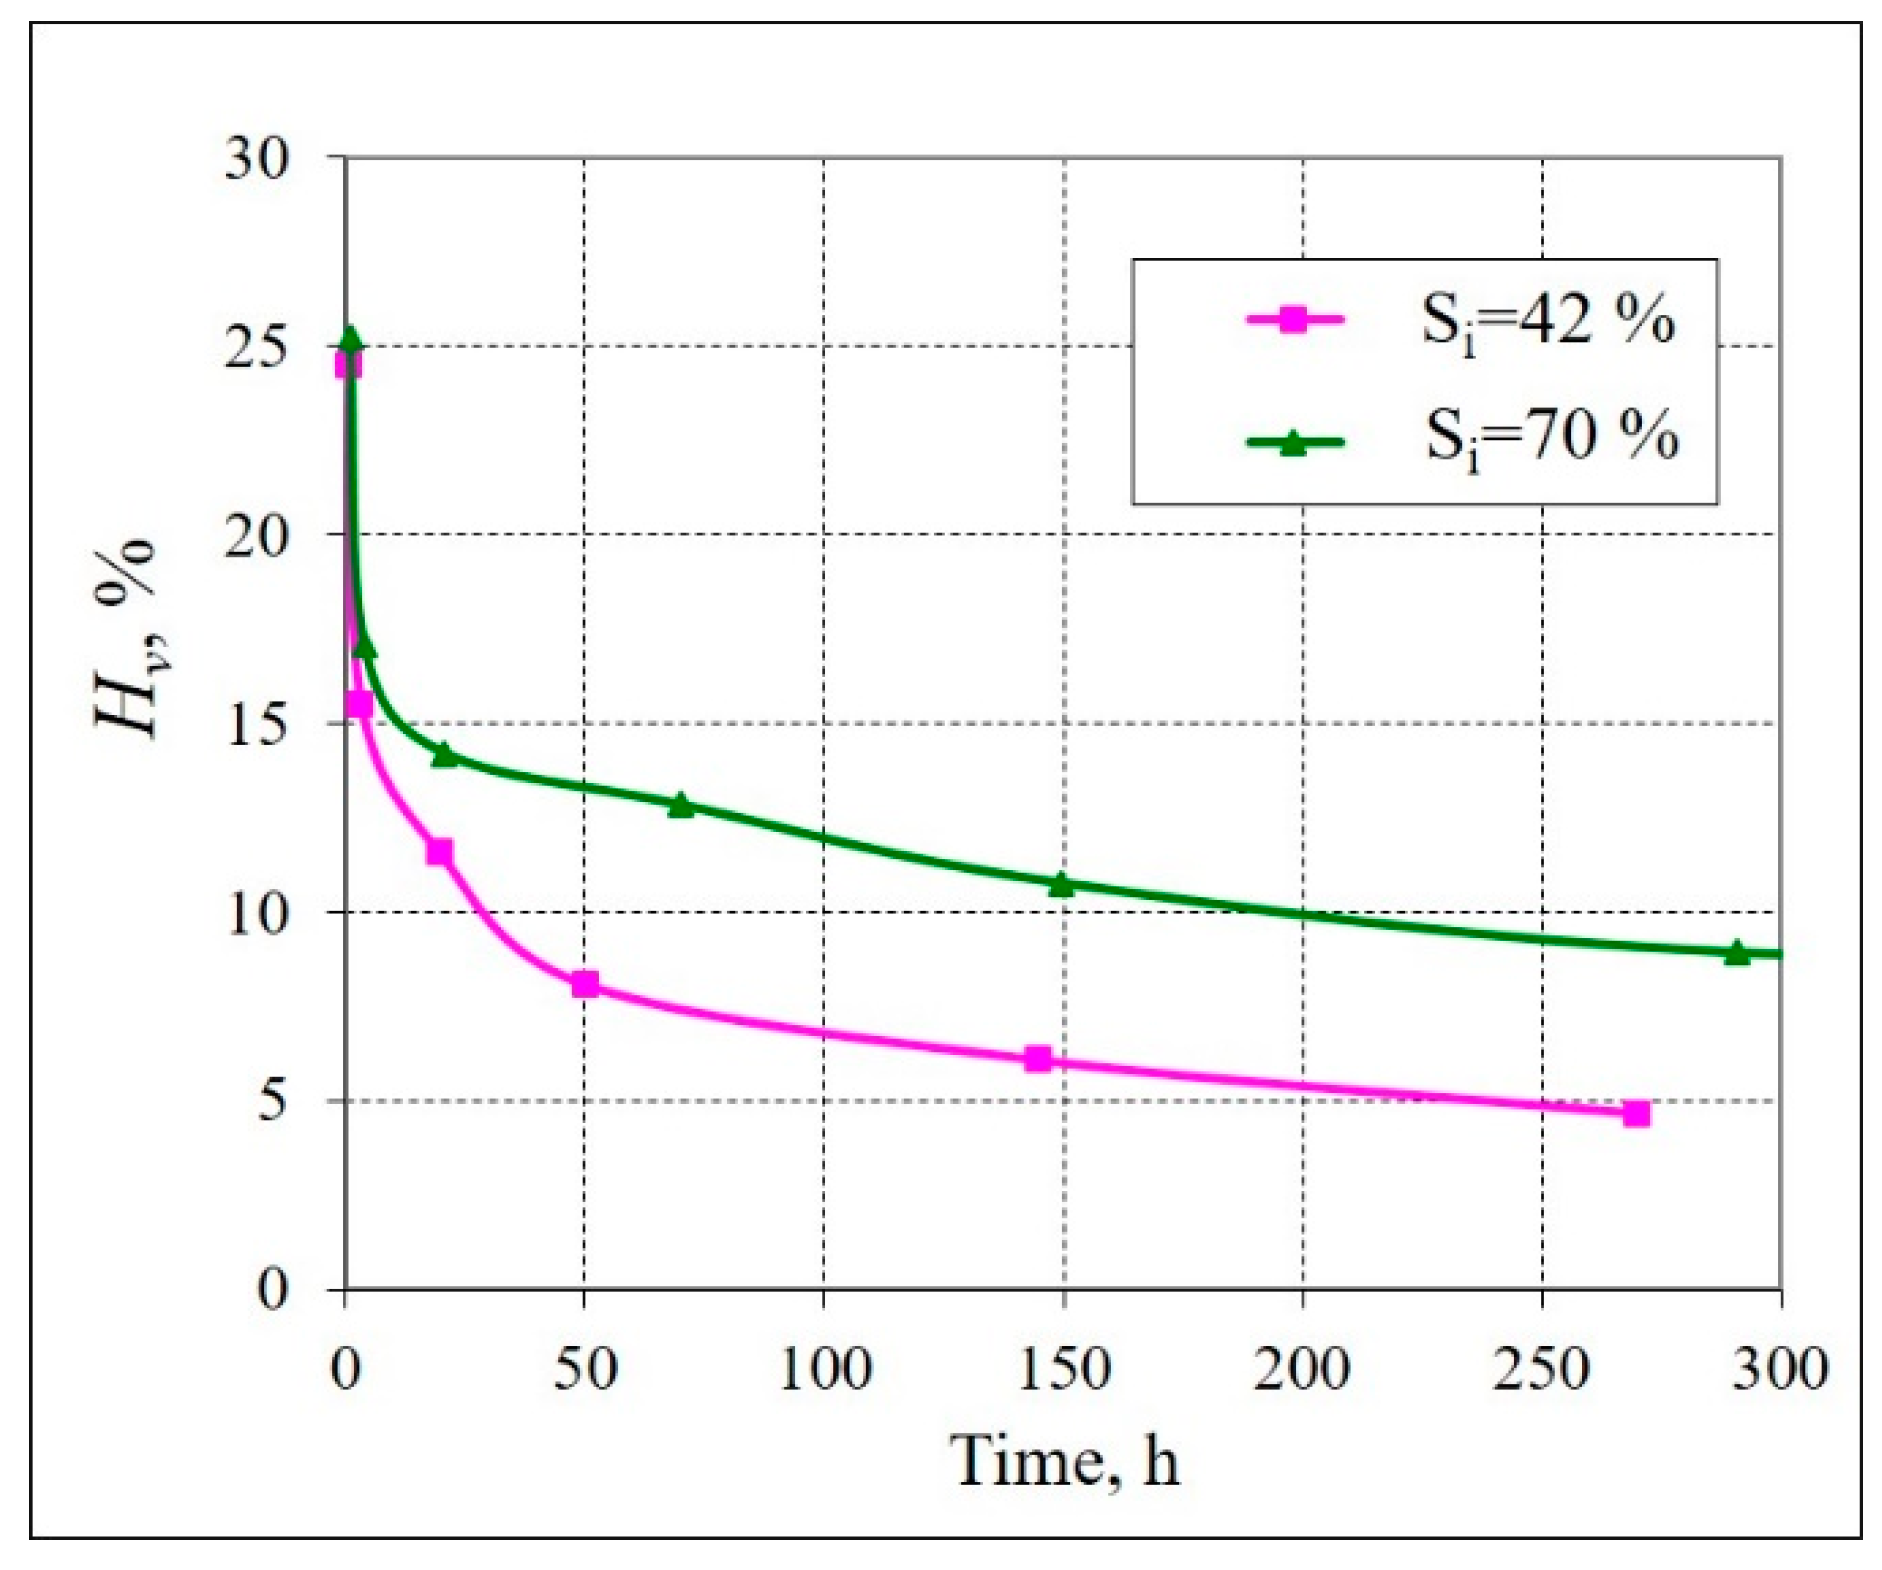
The self-preservation of pore hydrates in frozen rocks has multiple controls. This is primarily the initial content of pore moisture (water and ice) prior to pressure drop. The presence of pore ice originally decelerates the dissociation of pore hydrates and maintains their stability at below-equilibrium pressures. Frozen (−4 to −5 °C) hydrate-bearing samples with higher initial ice contents showed both faster decay of hydrate dissociation and higher residual hydrate saturation at the run end (Figure 7). Of the two methane hydrate samples with equal initial hydrate saturation of Sh ≈ 11%, the one with higher initial ice saturation (Si = 70% against Si = 42%) showed better preservation. Thus, ice-rich frozen rocks can be expected to store greater amounts of relict pore gas hydrates.
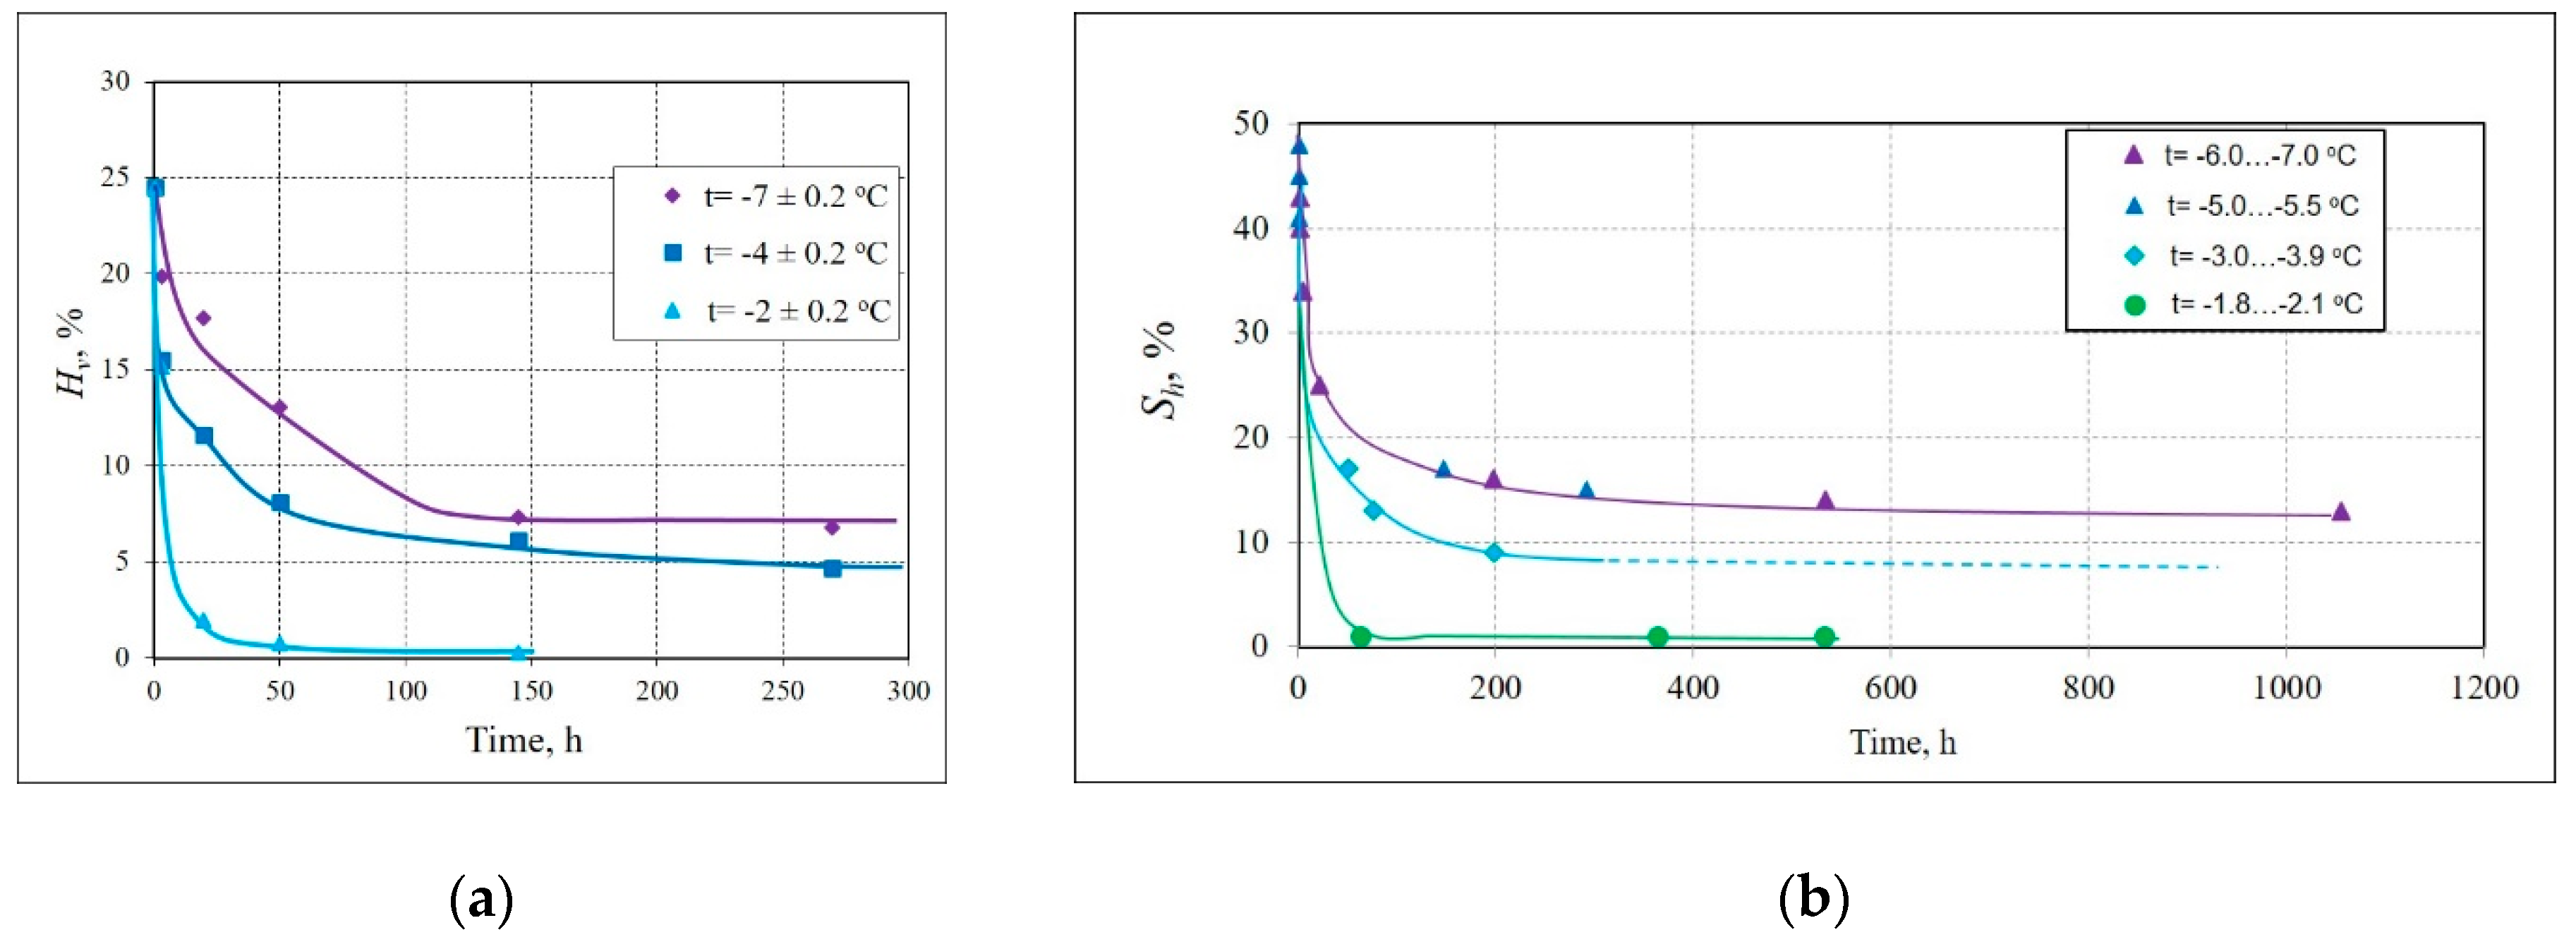
Temperature is the most important control of the self-preservation of metastable gas hydrates. Experiments with sand samples exposed to temperatures from −1.8 °C to −7 °C showed that pore hydrates dissociated much more slowly at lower temperatures (Figure 8), while the dissociation of pore hydrates in the frozen samples was incomplete at any temperature (about 1–2% of hydrates still survived at −2.0 °C).
The frozen fine sand samples stored for at least 300 h at a temperature below −5 °C and 0.1 MPa had a residual hydrate saturation of 7% and 11%, respectively. These results obtained for soil samples from gas-bearing permafrost in northern West Siberia confirm that the self-preservation effect can ensure prolonged survival of relict gas hydrates in frozen ground at −4 to −5 °C.
Self-preservation of pore gas hydrates also depends on salinity (Z, %) of the host frozen sediments, i.e., salt-to-dry sediment weight ratio. Salinity affects the preservation of hydrates as far as it controls phase change of pore moisture and amount of unfrozen water because the presence of liquid water slows down the formation of ice films over hydrate crystals and decreases their density. The contents of unfrozen water increase with salinity [60], which is unfavorable for the existence of pore hydrates, especially in the metastable state. As shown by our experiments, prolonged preservation of pore hydrates in frozen sand samples (fine sand 1 and fine sand 3) was possible at salinity within ~0.1%. Therefore, relict gas hydrates can be expected to exist in low-salinity permafrost (Z < 0.1%).
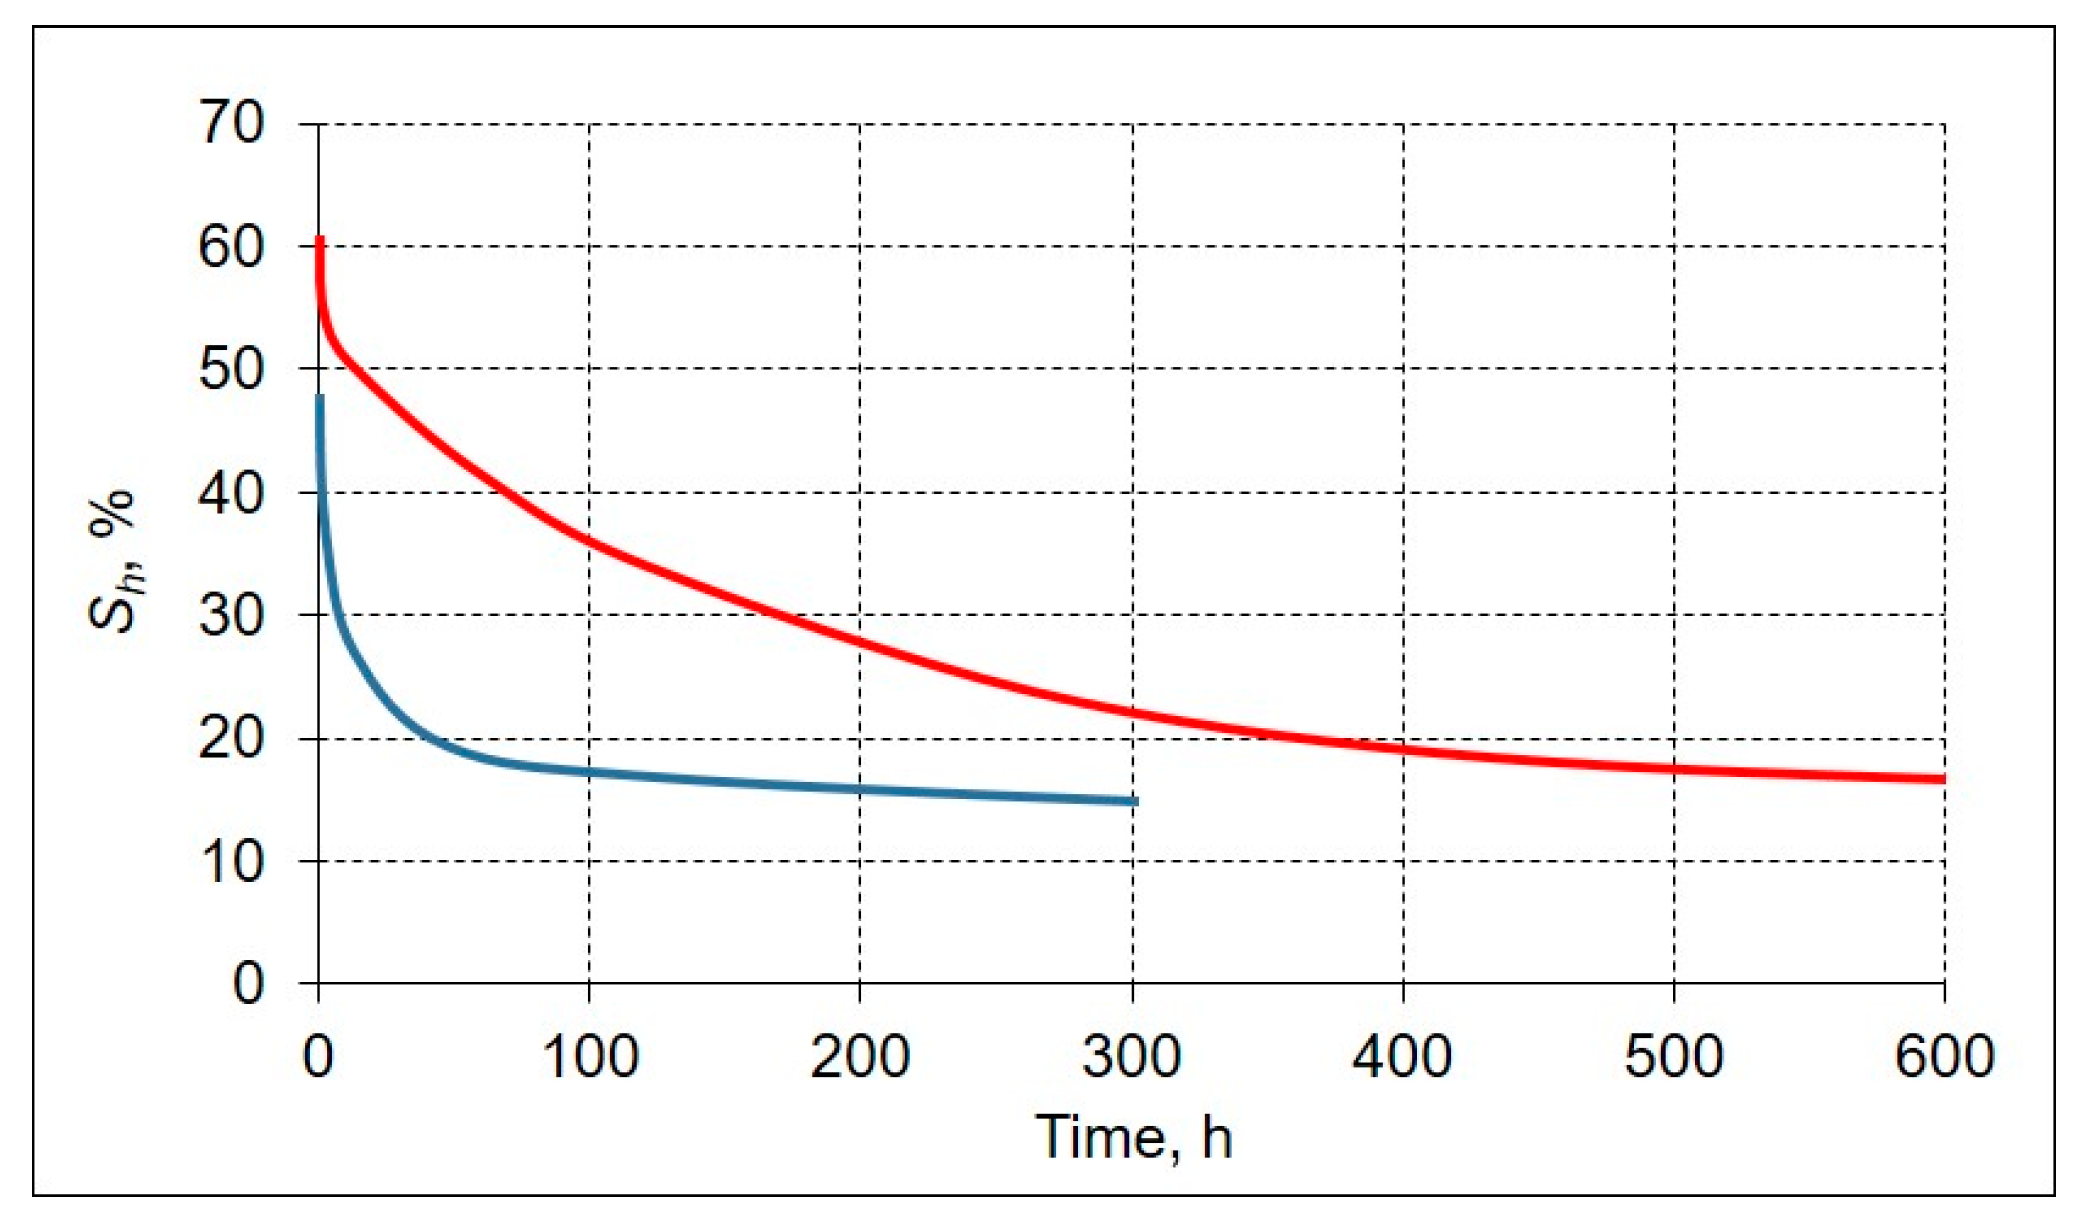
According to the PVT analysis, gas pressure also influenced the dissociation of gas hydrates (Figure 9). Pore methane hydrates in frozen sand dissociated faster at 0.1 MPa than at 1.2 MPa. During the run, the pore hydrate content was always higher in the sample exposed to 1.2 MPa than in that at 0.1 MPa, while the initial hydrate saturation of both samples at the equilibrium pressure was about 50%. Thus, relict hydrates will survive better in permafrost below 60 m than within the upper 10–20 m.

4. Conclusions

Much knowledge has been gained to date on the emission of gas (mainly methane) from exploratory and production wells in shallow permafrost (within ~150 m) in northern West Siberia. Gas flow rates can reach as high as >1000 m3/day, which can hardly be maintained by gas stored in voids and pockets. Therefore, the released gas most likely originates from relict gas hydrates that formed in favorable conditions in the past and have survived in shallow permafrost till present day due to the self-preservation effect.
In this work, the conditions for prolonged preservation of gas hydrates in permafrost at pressures below the equilibrium were studied in experiments that simulated dissociation and self-preservation of CH4 hydrates in sand samples from gas-bearing permafrost in northern West Siberia. The experiments have demonstrated that metastable pore methane hydrate can survive for thousands of years in frozen ground (−5 to −7 °C) and have thus corroborated the existence of the self-preservation effect. Self-preservation of pore gas hydrates in frozen sediments has multiple controls: temperature, salinity, initial moisture (ice) content, and gas pressure. Drawing from the experimental results, preservation of relict hydrates can be expected in low-saline (<0.1%), ice-rich sandy permafrost at −4 to −5 °C or colder at depths below 20–30 m.

Author Contributions

Conceptualization, E.C.; experimental methodology, E.C.; PVT calculation methodology, E.C. and V.I.; experiments, processing, and analysis, E.C., B.B., D.D., and S.G.; supervision, E.C.; writing manuscript and editing, E.C. and B.B.

Funding

This research was funded by the Russian Science Foundation, grant numbers 16-17-00051 and 18-77-10063, and the Russian Foundation of Basic Research, grant number 17-05-00995.

Conflicts of Interest

The authors declare no conflict of interest.

References

  1. Andersland, O.B.; Ladanyi, B. An Introduction to Frozen Ground Engineering; Springer Science & Business Media: Berlin, Germany, 1994. [Google Scholar]
  2. Yershov, E.D. General Geocryology; Cambridge University Press: Cambridge, UK, 1998; p. 580. [Google Scholar]
  3. Romanovskii, N.N.; Tumskoy, V.E. Retrospective approach to the estimation of the contemporary extension and structure of the shelf cryolithozone in East Arctic. J. Earth’s Cryosphere 2011, 15, 3–14. (in Russian). [Google Scholar]
  4. Badu, Y.B. The influence of gas bearing structures on the thickness of cryogenic strata of Jamal Peninsula. J. Earth’s Cryosphere 2014, 18, 11–22. (in Russian). [Google Scholar]
  5. Chuvilin, E.M.; Bukhanov, B.A.; Tumskoy, V.E.; Shakhova, N.E.; Dudarev, O.V.; Semiletov, I.P. Thermal conductivity of bottom sediments in the region of Buor-Khaya Bay (shelf of the Laptev Sea). J. Earth’s Cryosphere 2013, 17, 32–40. (in Russian). [Google Scholar]
  6. Shakhova, N.; Semiletov, I.; Gustafsson, O.; Sergienko, V.; Lobkovsky, L.; Dudarev, O.; Tumskoy, V.; Grigoriev, M.; Mazurov, A.K.; Salyuk, A.; et al. Current rates and mechanisms of subsea permafrost degradation in the East Siberian Arctic Shelf. Nat. Commun. 2017, 8, 15872. [Google Scholar] [CrossRef] [PubMed] [Green Version]
  7. Max, D.M.; Johnson, A.H.; Dillon, W.P. Natural Gas Hydrate—Arctic Ocean Deepwater Resource Potential; Springer: New York, NY, USA, 2013; p. 113. [Google Scholar]
  8. Cherskiy, N.V.; Tsarev, V.P.; Nikitin, S.P. Investigation and prediction of conditions of accumulation of gas resources in gas-hydrate pools. Pet. Geol. 1985, 21, 65–89. [Google Scholar]
  9. Bird, K.J.; Magoon, L.B. Petroleum Geology of the Northern Part of the Arctic National Wildlife Refuge, Northeastern Alaska; US Government Printing Office: Washington, DC, USA, 1987; p. 329.
  10. Judge, A.S.; Smith, S.L.; Majorowicz, J.A. The current distribution and thermal stability of gas hydrates in the Canadian Polar Region. In Proceedings of the Fourth Offshore and Polar Engineering Conference, Osaka, Japan, 10–15 April 1994; pp. 307–313. [Google Scholar]
  11. Judge, A.S.; Majorowicz, J.A. Geothermal conditions for gas hydrate stability in the Beaufort-Mackenzie area: The global change aspect. Glob. Planet. Chang. 1992, 98, 251–263. [Google Scholar] [CrossRef]
  12. Dallimore, S.R.; Uchida, T.; Collett, T.S. Scientific Results from JAPEX/ JNOC/GSC Mallik 2L-38 Gas Hydrate Research Well, Mackenzie Delta, Northwest Territories, Canada. Geological Survey of Canada, Bulletin 544; US Government Printing Office: Washington, DC, USA, 1999; p. 403.
  13. Yakushev, V.S.; Chuvilin, E.M. Natural gas and hydrate accumulation within permafrost in Russia. Cold Reg. Sci. Technol. 2000, 149, 46–50. [Google Scholar] [CrossRef]
  14. Liang, Y.P.; Li, X.S.; Li, B. Assessment of gas production potential from hydrate reservoir in Qilian mountain permafrost using five-spot horizontal well system. Energies 2015, 8, 10796–10817. [Google Scholar] [CrossRef]
  15. Ruppel, C. Permafrost-associated gas hydrate: Is it really approximately 1% of the global system? J. Chem. Eng. Data 2015, 60, 429–436. [Google Scholar] [CrossRef]
  16. Henninges, J.; Schrötter, J.; Erbas, K.; Huenges, E. Temperature field of the Mallik gas hydrate occurrence —Implications on phase changes and thermal properties. In Scientific Results from the Mallik 2002 Gas Hydrate Production Research WellProgram, Mackenzie Delta, Northwest Territories, Canada. Geological Survey of Canada, Bulletin 585; Dallimore, S.R., Collett, T.S., Eds.; US Government Printing Office: Washington, DC, USA, 2005. [Google Scholar]
  17. Collett, T.S.; Lee, M.W.; Agena, W.F.; Miller, J.J.; Lewis, K.A.; Zyrianova, M.V.; Boswell, R.; Inks, T.L. Permafrost associated natural gas hydrate occurrences on the Alaskan North Slope. Mar. Petr. Geol. 2011, 28, 279–294. [Google Scholar] [CrossRef]
  18. Fang, H.; Xu, M.; Lin, Z.; Zhong, Q.; Bai, D.; Liu, J.; Pei, F.; He, M. Geophysical characteristics of gas hydrate in the Muli area, Qinghai province. J. Nat. Gas Sci. Eng. 2017, 37, 539–550. [Google Scholar] [CrossRef]
  19. Dallimore, S.R.; Chuvilin, E.M.; Yakushev, V.S.; Grechischev, S.E.; Ponomarev, V.; Pavlov, A. Field and laboratory characterization of interpermafrost gas hydrates, Mackenzie Delta, N.W.T., Canada. In Proceedings of the 2nd International Conference on Natural Gas Hydrates, Toulouse, France, 2–6 June 1996; pp. 525–531. [Google Scholar]
  20. Yershov, E.D.; Lebedenko, Y.P.; Chuvilin, E.M.; Istomin, V.A.; Yakushev, V.S. Features of gas hydrate occurrence in permafrost. USSR Acad. Sci. 1991, 321, 788–791. (in Russian). [Google Scholar]
  21. Chuvilin, E.M.; Yakushev, V.S.; Perlova, E.V. Gas and gas hydrates in the permafrost of Bovanenkovo gas field, Yamal Peninsula, West Siberia. Polarforschung 2000, 68, 215–219. [Google Scholar]
  22. Kuhs, W.F.; Genov, G.; Staykova, D.K.; Hansen, T. Ice perfection and onset of anomalous preservation of gas hydrates. Phys. Chem. Chem. Phys. 2004, 6, 4917–4920. [Google Scholar] [CrossRef]
  23. Istomin, V.A.; Yakushev, V.S.; Mokhonina, N.A.; Kwon, V.G.; Chuvilin, E.M. Self-preservation phenomenon of gas hydrate. Gas Ind. Russ. 2006, 4, 16–27. (in Russian). [Google Scholar]
  24. Takeya, S.; Ripmeester, J.A. Anomalous Preservation of CH4 hydrate and its dependence on the morphology of hexagonal ice. Phys. Chem. Chem. Phys. 2010, 11, 70–73. [Google Scholar] [CrossRef] [PubMed]
  25. Davidson, D.W.; Garg, S.K.; Gough, S.R.; Handa, Y.P.; Ratcliffe, C.I.; Ripmeester, J.A.; Tse, J.S.; Lawson, W.F. Laboratory analysis of a naturally occurring gas hydrate from sediment of the Gulf of Mexico. Geochim. Cosmochim. Acta 1986, 50, 619–623. [Google Scholar] [CrossRef]
  26. Handa, Y.P. Calorimetric determinations of the composition, enthalpies of dissociation and heat capacities in the range 85 to 270 К for clathrate hydrates of xenon and krypton. J. Chem. Thermodyn. 1986, 18, 891–902. [Google Scholar] [CrossRef]
  27. Yershov, E.D.; Lebedenko, Y.P.; Chuvilin, E.M.; Yakushev, V.S. Microstructure of an ice—methane hydrate agglomerate: An experimental study. Eng. Geol. 1990, 3, 38–44. (in Russian). [Google Scholar]
  28. Ershov, E.D.; Yakushev, V.S. Experimental research on gas hydrate decomposition in frozen rocks. Cold Reg. Sci. Technol. 1992, 20, 147–156. [Google Scholar] [CrossRef]
  29. Yakushev, V.S.; Istomin, V.A. Gas-hydrates self-preservation effect. In Physics and Chemistry of Ice; Maeno, N., Hondoh, T., Eds.; Hokkaido University Press: Sapporo, Japan, 1992; pp. 136–139. [Google Scholar]
  30. Stern, L.; Circone, S.; Kirby, S.H.; Durham, W. Temperature, pressure, and compositional effects on anomalous or “self” preservation of gas hydrates. Can. J. Phys. 2003, 81, 271–283. [Google Scholar] [CrossRef]
  31. Stern, L.; Circone, S.; Kirby, S.H.; Durham, W. Anomalous preservation of pure methane hydrates at 1 atm. J. Phys. Chem. 2001, 105, 537–542. [Google Scholar] [CrossRef]
  32. Takeya, S.; Ebinuma, T.; Uchida, T.; Nagao, J.; Narita, H. Self-preservation effect and dissociation rates of CH4 hydrate. J. Cryst. Growth 2002, 237, 379–382. [Google Scholar] [CrossRef]
  33. Takeya, S.; Uchida, T.; Nagao, J.; Ohmura, R.; Shimada, W.; Kamata, Y.; Ebinuma, H.; Narita, H. Particle size effect of CH4 hydrate for self-preservation. Chem. Eng. Sci. 2005, 60, 1383–1387. [Google Scholar] [CrossRef]
  34. Takeya, S.; Muromachi, S.; Yamamoto, Y.; Umeda, H.; Matsuo, S. Preservation of CO2 hydrate under different atmospheric conditions. Fluid Phase Equilib. 2016, 413, 137–141. [Google Scholar] [CrossRef]
  35. Takeya, S.; Mimachi, H.; Murayama, T. Methane storage in water frameworks: Self-preservation of methane hydrate pellets formed from NaCl solutions. Appl. Energy 2018, 230, 86–93. [Google Scholar] [CrossRef]
  36. Shimada, W.; Takeya, S.; Kamata, Y.; Uchida, T.; Nagao, J.; Ebinuma, T.; Narita, H. Mechanism of self-preservation during dissociation of methane clathrate hydrate. In Proceedings of the 5th International Conference on Gas Hydrate, Trondheim, Norway, 13–16 June 2005; Volume 1, pp. 208–212. [Google Scholar]
  37. Falenty, A.; Kuhs, W.F. “Self-Preservation” of CO2 Gas HydratessSurface Microstructure and Ice Perfection. J. Phys. Chem. B 2009, 113, 15975–15988. [Google Scholar] [CrossRef] [PubMed]
  38. Melnikov, V.P.; Nesterov, A.N.; Reshetnikov, A.M.; Zavodovsky, A.G. Evidence of liquid water formation during methane hydrates dissociation below the ice point. Chem. Eng. Sci. 2009, 64, 1160–1166. [Google Scholar] [CrossRef]
  39. Melnikov, V.P.; Nesterov, A.N.; Reshetnikov, A.M.; Istomin, V.A. Metastable states during dissociation of carbon dioxide hydrates below 273 K. Chem. Eng. Sci. 2011, 66, 73–77. [Google Scholar] [CrossRef]
  40. Ohno, H.; Nishimura, O.; Suzuki, K.; Narita, H.; Nagao, J. Morphological and compositional characterization of self-preserved gas hydrates by low-vacuum scanning electron microscopy. ChemPhysChem 2011, 12, 1661–1665. [Google Scholar] [CrossRef] [PubMed]
  41. Uchida, T.; Kida, M.; Nagao, J. Dissociation termination of methane–ethane hydrates in temperature-ramping tests at atmospheric pressure below the melting point of ice. ChemPhysChem 2011, 12, 1652–1656. [Google Scholar] [CrossRef] [PubMed]
  42. Zhong, J.-R.; Zeng, X.-Y.; Zhou, F.-H.; Ran, Q.-D.; Sun, C.-Y.; Zhong, R.-Q.; Yang, L.-Y.; Chen, G.-J.; Koh, C.A. Self-preservation and structural transition of gas hydrates during dissociation below the ice point: An in situ study using Raman spectroscopy. Sci. Rep. 2016, 6, 38855. [Google Scholar] [CrossRef] [PubMed]
  43. Dou, B.; Jiang, G.; Wu, X.; Zhang, L.; Ning, F. Research methane hydrate meta-stable property for application to natural gas storage and transportation. In Proceedings of the Asia Pacific Oil and Gas Conference & Exhibition, Jakarta, Indonesia, 4–6 August 2009. [Google Scholar] [CrossRef]
  44. Takeya, S.; Yoneyama, A.; Ueda, K.; Mimachi, H.; Takahashi, M.; Sano, K.; Hyodo, K.; Takeda, T.; Gotoh, Y. Anomalously preserved clathrate hydrate of natural gas in pellet form at 253 K. J. Phys. Chem. C 2012, 116, 13842–13848. [Google Scholar] [CrossRef]
  45. Falenty, A.; Kuhs, W.F.; Glockzin, M.; Rehder, G. "Self-preservation" of CH4 hydrates for gas transport technology: Pressure-temperature dependence and ice microstructures. Energy Fuels 2014, 10, 6275–6283. [Google Scholar] [CrossRef]
  46. Mimachi, H.; Takeya, S.; Yoneyama, A.; Hyodo, K.; Takeda, T.; Gotoh, Y.; Murayama, T. Natural gas storage and transportation within gas hydrate of smaller particle: Size dependence of self-preservation phenomenon of natural gas hydrate. Chem. Eng. Sci. 2014, 118, 208–213. [Google Scholar] [CrossRef]
  47. Chuvilin, E.M.; Kozlova, E.V. Experimental estimation of hydrate-bearing sediments stability. In Proceedings of the 5th International Conference on Gas Hydrate, Trondheim, Norway, 13–16 June 2005; Volume 3, pp. 1506–1514. [Google Scholar]
  48. Chuvilin, E.M.; Guryeva, O.M. Experimental study of self-preservation effect of gas hydrates in frozen sediments. In Proceedings of the 9th International Conference on Permafrost, Fairbanks, Alaska, 23 June–3 July 2008; pp. 263–267. [Google Scholar]
  49. Kwon, T.-H.; Cho, G.-C.; Santamarina, J.C. Gas hydrate dissociation in sediments: Pressure-temperature evolution. Geochem. Geophys. Geosyst. 2008, 9, Q03019. [Google Scholar] [CrossRef]
  50. Hachikubo, A.; Takeya, S.; Chuvilin, E.; Istomin, V. Preservation phenomena of methane hydrate in pore spaces. Phys. Chem. Chem. Phys. 2011, 13, 17449–17452. [Google Scholar] [CrossRef] [PubMed]
  51. Takeya, S.; Fujihisa, H.; Gotoh, Y.; Istomin, V.; Chuvilin, E.; Sakagami, H.; Hachikubo, A. Methane clathrate hydrates formed within hydrophilic and hydrophobic porous media: kinetics of dissociation and distortion of host structure. J. Phys. Chem. C 2013, 117, 7081–7085. [Google Scholar] [CrossRef]
  52. Chuvilin, E.M.; Lupachik, M.V.; Guryeva, O.M. Kinetics research of ice transition into gas hydrate in porous media. In Physics and Chemistry of Ice; Furukawa, Y., Sazaki, G., Uchida, T., Watanabe, N., Eds.; Hokkaido University Press: Sapporo, Japan, 2011; pp. 127–132. [Google Scholar]
  53. Podenko, L.S.; Drachuk, A.O.; Molokitina, N.S.; Nesterov, A.N. Effect of silica nanoparticles on dry water gas hydrate formation and self-preservation efficiency. Russ. J. Phys. Chem. A 2018, 92, 255–261. [Google Scholar] [CrossRef]
  54. Yakushev, V.S.; Semenov, A.P.; Bogoyavlensky, V.I.; Medvedev, V.I.; Bogoyavlensky, I.V. Experimental modeling of methane release from intrapermafrost relic gas hydrates when sediment temperature change. Cold Reg. Sci. Technol. 2018, 31, 189–197. [Google Scholar] [CrossRef]
  55. Chuvilin, E.M.; Ebinuma, T.; Kamata, Y.; Uchida, T.; Takeya, S.; Nagao, J.; Narita, H. Effects of temperature cycling on the phase transition of water in gas-saturated sediments. Can. J. Phys. 2003, 81, 343–350. [Google Scholar] [CrossRef]
  56. Chuvilin, E.M.; Bukhanov, B.A. Effect of hydrate accumulation conditions on thermal conductivity of gas-saturated soils. Energy Fuels 2017, 31, 5246–5254. [Google Scholar] [CrossRef]
  57. Bukhanov, B.A.; Chuvilin, E.M.; Guryeva, O.M.; Kotov, P.I. Experimental study of the thermal conductivity of the frozen sediments containing gas hydrate. In Proceedings of the 9th International Conference on Permafrost, Fairbanks, Alaska, 23 June–3 July 2008; pp. 205–209. [Google Scholar]
  58. Chuvilin, E.M.; Bukhanov, B.A. Experimental study of the thermal conductivity of frozen hydrate-saturated sediments at atmospheric pressure. J. Earth’s Cryosphere 2013, 17, 69–79. (in Russian). [Google Scholar]
  59. Chuvilin, E.M.; Bukhanov, B.A.; Grebenkin, S.I.; Doroshin, V.V.; Iospa, A.V. Shear strength of frozen sand with dissociating pore methane hydrate: An experimental study. Cold Reg. Sci. Technol. 2018, 153, 101–105. [Google Scholar] [CrossRef]
  60. Chuvilin, E.; Bukhanov, B.; Cheverev, V.; Motenko, R.; Grechishcheva, E. Effect of ice and hydrate formation on thermal conductivity of sediments. In Impact of Thermal Conductivity on Energy Technologies; Shahzad, A., Ed.; IntechOpen: London, UK, 2018; pp. 115–132. [Google Scholar]
  61. Chuvilin, E.M.; Grebenkin, S.I. Dissociation of gas hydrates in frozen sands: effect on gas permeability. J. Earth’s Cryosphere 2018, 22, 41–45. (in Russian). [Google Scholar] [CrossRef]
  62. Takeya, S.; Uchida, T.; Kamata, Y.; Nagao, J.; Kida, M.; Minami, H.; Sakagami, H.; Hachikubo, A.; Takahashi, N.; Shoji, H.; et al. Lattice Expansion of Clathrate Hydrates of Methane Mixtures and Natural Gas. Angew. Chem. Int. Ed. 2005, 44, 6928–6931. [Google Scholar] [CrossRef] [PubMed]
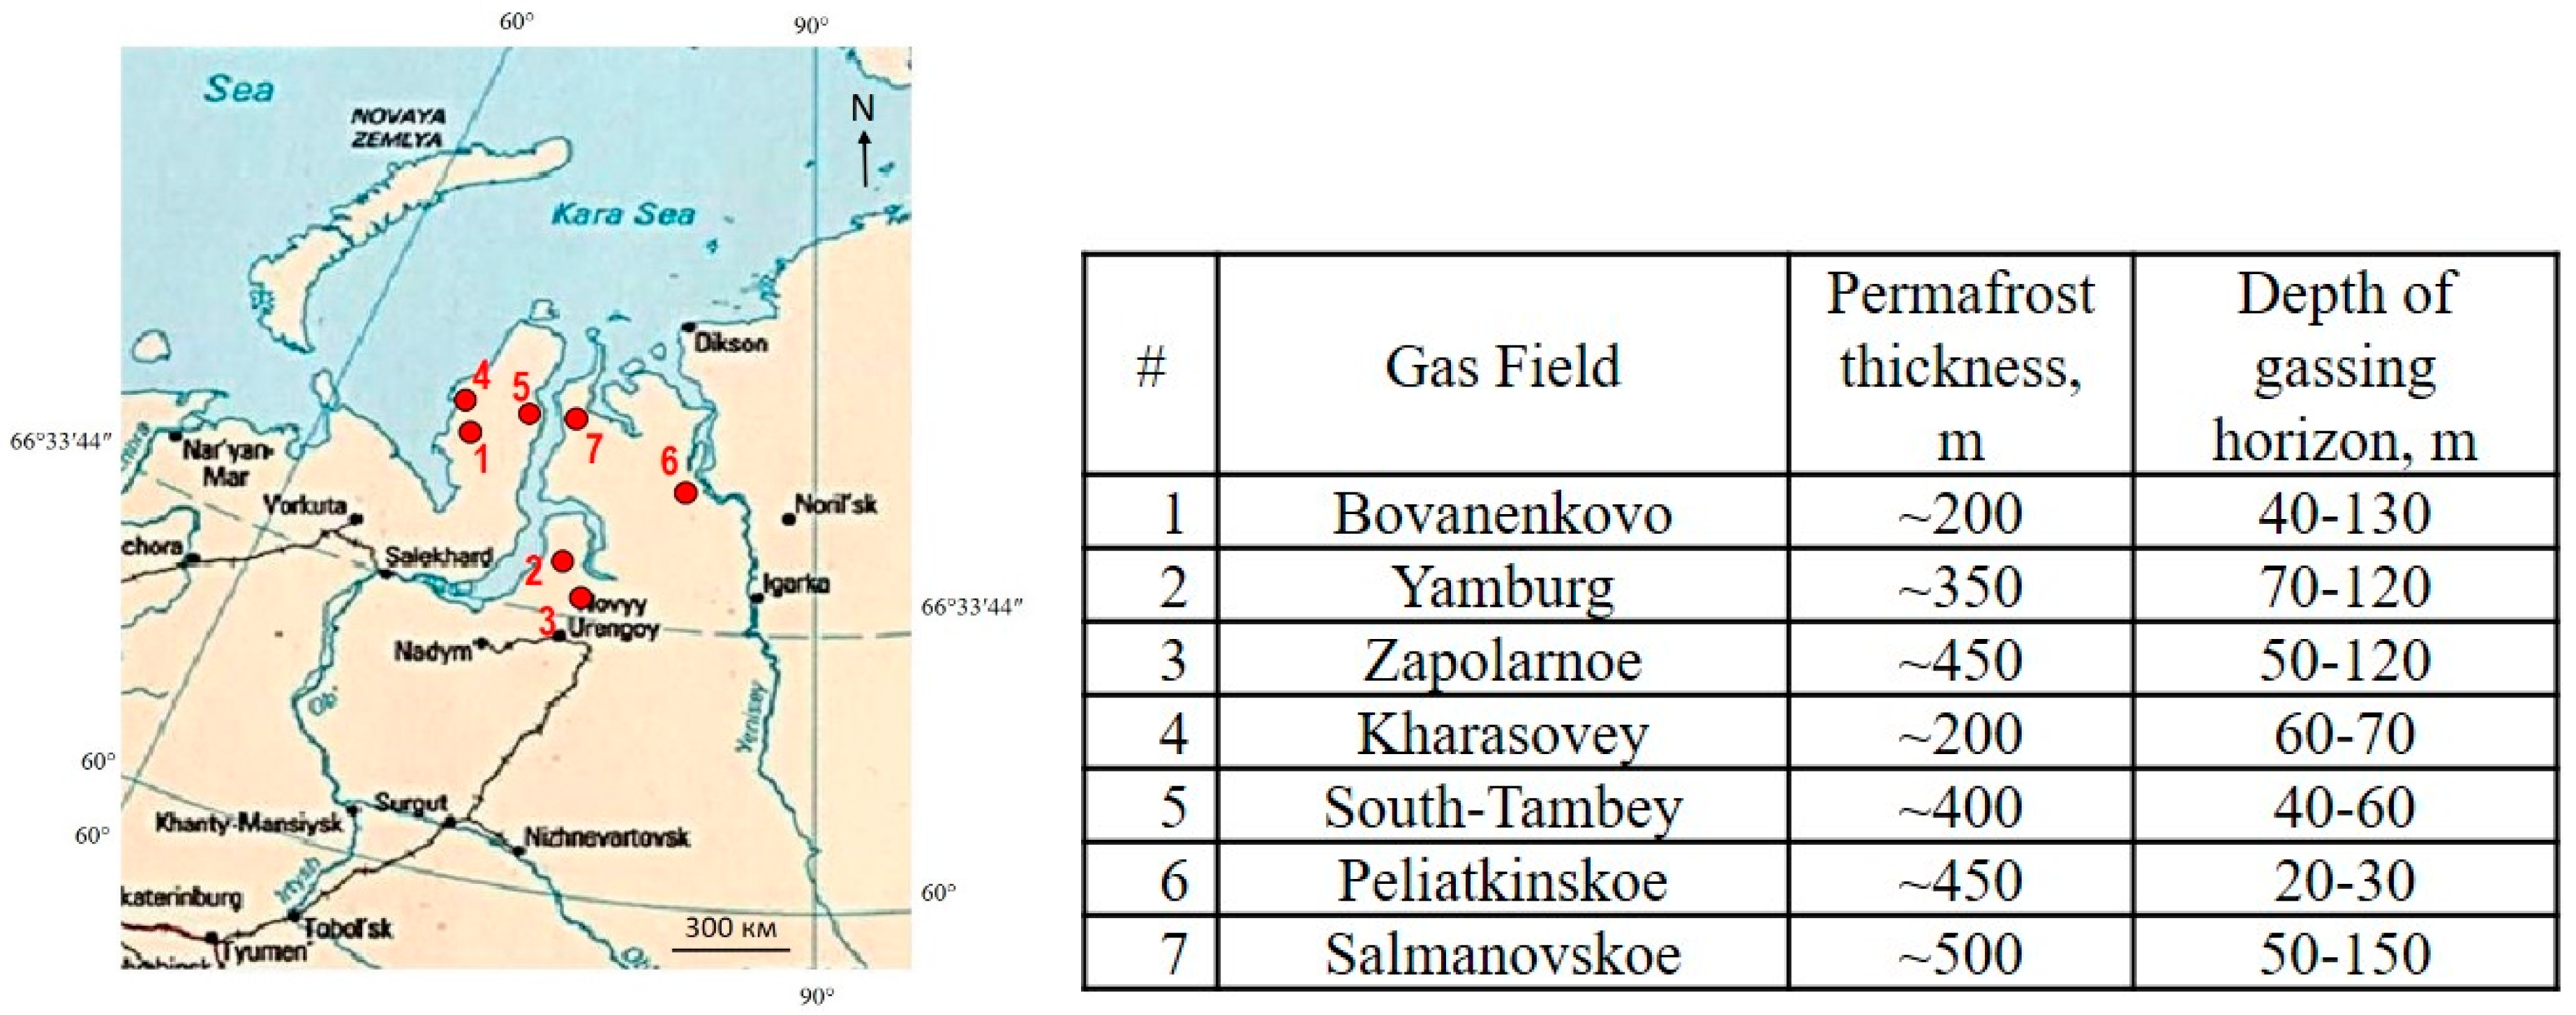
Figure 1. Gas release from shallow permafrost (within 150 m) in gas fields of northern West Siberia.
Geosciences 08 00431 g001
Figure 2. Conditions for gas hydrate existence in permafrost. 1 = equilibrium curve of gas hydrate stability; 2 = temperature distribution along the cross section; 3 = permafrost base. GHSZ: gas hydrate stability zone.
Geosciences 08 00431 g002
Figure 3. General view of frozen sand samples with pore hydrates and massive ice–hydrate texture (at −6 to −7 °C and 0.1 MPa).
Geosciences 08 00431 g003
Figure 4. Porosity (n, u.f.) and methane hydrate saturation (Sh, %) over sample height (fine sand with 7% of montmorillonite clay particles, Win = 10%). (a) Porosity distribution; (b) hydrate saturation distribution.
Geosciences 08 00431 g004
Figure 5. Time-dependent hydrate saturation (Sh) of frozen fine sand-1 at −6 °C and 0.1 MPa. Black dots are experimental data; solid line is a trend line of exponential approximation.
Geosciences 08 00431 g005
Figure 6. Predicted time-dependent decrease in hydrate saturation in frozen soil at T = −6 °C and P = 0.1 MPa.
Geosciences 08 00431 g006
Figure 7. Dissociation kinetics of pore methane hydrates in frozen fine sand-1 samples with different ice contents at −4 to −5 °C and 0.1 MPa.
Geosciences 08 00431 g007
Figure 8. Kinetics of gas hydrate dissociation in frozen sand sediments at negative temperatures and atmospheric pressure. Data points (circles, triangles, squares, and diamonds) are experimental measurements, lines are approximation trends, and dashed line is the expected trend. (a) Fine sand-2 (Win = 14%) [48]; (b) fine sand-1 (Win = 18%) [59].
Geosciences 08 00431 g008
Figure 9. Effect of gas pressure on kinetics of methane hydrate dissociation in frozen fine sand-1 (Win = 17%) at T = −5.0 to −5.5 °C. Red and blue lines correspond to pressures of 1.2 MPa and 0.1 MPa, respectively.
Geosciences 08 00431 g009
Table 1. Particle size distribution, mineralogy, and salinity of soils.
Type of SedimentLocation and Core DepthParticle Size Distribution, %MineralogySalinity, %
1–0.5 mm0.5–0.25 mm0.25–0.1 mm0.1–0.05 mm0.05–0.001 mm<0.001 mm
Fine sand-1-6.56.579.62.23.12.1>90% quartz0.01
Fine sand-2Yamburg gas field
(~64 m)
1.27.547.328.314.42.438% quartz
45% microcline + albite
9% illite
5% kaolinite + chlorite
0.09
Fine sand-3South Tambey gas field
(36–46 m)
0.112.562.921.91.61.0Quartz >90%0.11