Article

Geographies and Scientometrics of Research on Natural Hazards

The Czech Academy of Sciences, Global Change Research Institute, 603 00 Brno, Czech Republic
Geosciences 2018, 8(10), 382; https://doi.org/10.3390/geosciences8100382
Submission received: 14 September 2018 / Revised: 8 October 2018 / Accepted: 16 October 2018 / Published: 18 October 2018

Abstract

:
This contribution aims to reveal patterns of research on natural hazards worldwide, based on the analysis of the Clarivate Analytics Web of Science database. A set of 588,424 research items published between 1900 and 2017 is analyzed, covering different types of natural hazards. Two categories of natural hazards are distinguished in this study: (i) geological/geomorphic (earthquakes, slope movements, erosion, volcanic activity, and others); and (ii) climatic/hydro-meteorological (floods, storms, drought, hurricane, and others). General trends, the geographical focus, and the involvement and cooperation between individual countries are revealed, pointing out certain patterns (e.g., hotspots of research) and trends (e.g., changing publishing paradigm). Further, a global overview of research on natural hazards is confronted with disastrous events, fatalities, and losses of MunichRE and SwissRE global databases of natural disasters.

1. Introduction

Natural disasters claim lives and result in damages of billions of USD yearly [1,2]. Research on various types of natural hazards is thus well-justified, especially in the context of changing conditions (e.g., climatological [3]) and increasing population pressure and vulnerability globally (e.g., [4]). Furthermore, the number of events and extent of damage caused by natural disasters are reported to have gradually increased in the past decades [5]. While a worldwide overview of the occurrence of different types of natural hazards and disasters is covered by numerous global [1,5], as well as regional [6], databases, and some types of natural hazards have been the subject of previous scientometrics studies (e.g., tsunamis [7,8], earthquakes [9,10], landslides [11,12], or lake outburst floods [13]), the research on natural hazards and their geographies has not yet been mapped from the global perspective.
Hence, the main objective of this work is to provide detailed insights into the research on different types of natural hazards worldwide, specifically focusing on analyzing spatiotemporal patterns (geographies) of research and selected scientometrical characteristics. The results of this study should provide a comprehensive overview, focusing on both the scientific community and the practitioners. Observed trends and patterns of research on natural hazards are put into the context of the number of events and fatalities, as well as the extent of damage, caused by natural disasters worldwide.

2. Data and Methods

2.1. Web of Science Database, Classification of Natural Hazards, and Dataset Building

The Clarivate Analytics Web of Science (WOS) Core Collection database (www.webofknowledge.com) covers more than 13,000 highly credible journals and numerous books, and includes over 100 mil. research items (articles, reviews, book chapters, etc.) for the period 1900–present [14]. The dataset analyzed in this study was built in June 2018, using the classification scheme of natural hazards and carefully designed search chains (see Table 1). The number of research items in the WOS database is gradually increasing over time; however, since the analyzed period is 1900–2017, it is assumed that the majority of journals and publishers have already released their 2017 and older publications to the WOS.
Many classification schemes of natural hazards and disasters exist, reflecting different needs and purposes. In line with the classification scheme of natural hazards presented by [15,16], the term ’natural hazard’ in this study covers various types of events of two general categories: (i) climatic/hydro-meteorological natural hazards; and (ii) geological/geomorphic natural hazards. Biological hazards such as fungal, bacterial, and viral diseases and infestations or astronomical (extraterrestrial) hazards are not the subject of this study.
Various types of natural hazards are firstly classified according to the categories (see Table 1) and secondly according to the number of research items found:
  • Major types of natural hazards (over 40,000 research items found; four major types of natural hazards for each of category–climatic/hydro-meteorological (FL, ST, DR, HU) and geological/geomorphic (EQ, SM, ER, VO)).
  • Other types of natural hazards (between 4000 and 40,000 research items found; two other types of geological and geomorphic natural hazards (SU, TS), six other types of climatic hydro-meteorological hazards (SR, WF, DE, HW, TO, DS)). Other types of natural hazards are grouped into one category for some of the analysis (CO, GO; see Section 2.2).
  • Not considered types of natural hazards (natural hazards not reaching the threshold of 4000 research items at WOS (1900–2017) are not considered in this study). These are, for example: shifting sand (TS = (shift * AND sand); 3127 research items), blizzard and snowstorms (TS = (blizzard * OR snowstorm * OR (snow storm *)); 2704 research items), hailstorms (TS = (hailstorm * OR (hail AND storm *)); 1289 research items), lahars (921 research items),…).
It is obvious that the classification of some specific types of natural hazards (e.g., slope movements covering many different types of processes) may be ambiguous, especially when considering links and interactions (hazard chains) between individual types of natural hazards [17]. For example, debris flows or avalanches might be classified both as geological/geomorphic hazards and hydrological hazards, depending on the classification scheme used. Since it is not possible to further distinguish these in detail, considering the scope and extent of this study, all diverse types of slope movements are classified as geological/geomorphic hazards, referring to the traditional way of assigning all gravitational processes into this category [15].
The final classification scheme of natural hazards used in this study is presented in Table 1. While the WOS search query chains are easy to define for some types of natural hazards (e.g., subsidence), others are more complicated, especially considering terminological richness (e.g., different types of slope movements). Clearly, different search chains could lead to different results. To avoid (minimize) potential distortion of obtained results, each of the search query chains was carefully designed to cover a given type of natural hazard and checked with the most frequently represented WOS categories for the fit with expected ones, such as geoscience multidisciplinary, water resources, meteorology atmospheric sciences, geochemistry geophysics, geology, engineering geological, etc. The search query chains were defined after several iterations in more complicated cases (e.g., volcanic activity).

2.2. Dataset Analysis

Using pre-defined search chains (see Section 2.1), a dataset consisting of 588,424 research items is built and analyzed from various perspectives. Firstly, research on different types of natural hazards in time is analyzed, focusing on the share of individual types of natural hazards and the comparison between two categories—climatic/hydro-meteorological natural hazards and geological/geomorphic natural hazards (see Section 3.1.1). Special attention is paid to the multi-hazard research items focusing on more than one type of natural hazard. The overall share and the number of multi-hazard studies between each of the two individual types of natural hazards are analyzed using the WOS Advanced Search tool, based on a combined search among two sub-datasets (two types of natural hazards), focusing on links between them and within/between general categories of natural hazards (see Section 3.1.2).
Secondly, the geographical focus of research (defined by the name of the states and countries in some specific cases such as United Kingdom) is analyzed using content analysis [18] of titles and abstracts (see Section 3.2), revealing geographical hotspots of research on natural hazards. The numbers of research items geographically focusing on individual countries are assigned manually, using the WOS Advanced Search tool (see also [13]). Thirdly, the dataset is analyzed from the perspective of the country of researchers—affiliations (see Section 3.3), again using the WOS Results Analysis tool (Countries/Regions bookmark). This tool is also used to analyze research on individual types of natural hazards in the top 10 research countries, and to analyze the top 10 research countries for individual types of natural hazards (see Section 3.3.1). Bilateral cooperation between the top 25 research countries is analyzed in Section 3.3.2. The numbers of joint research items between two individual countries (cooperation matrix) are assigned manually, using the WOS Advanced Search tool. The results are visualized using the Network Visualization Tool of VOSviewer software version 1.6.9. [19] with the following parameters: Scale 2.0 (weighted by total link strength), Label size variation 1.0, Line size variation 0.7. Fourthly, the citations (see Section 3.4) are analyzed using the WOS Citation Report tool. Since only up to 10,000 research items can be analyzed using this tool, natural hazard types with more than 10,000 research items (see Table 1) had to be analyzed manually by parts. Selected impact indicators [20] such as the H index [21] and i100 index (number of research items within the dataset with 100 or more citations) are obtained from the citation analysis.

2.3. Databases of Disasters

Two freely available global databases of natural disasters are used to compare the focus of natural hazard studies with recorded events (see Section 4.1)/fatalities (see Section 4.2)/damages (see Section 4.3). These are MunichRE NatCatSERVICE [1] and SwissRE Sigma Explorer [5]. Both of these databases include information about damages and fatalities caused by individual types of natural hazards. The NatCatSERVICE analyses tool is comprised of 935 catastrophic events and 17,320 relevant events (935 catastrophic events) for the period 1980–2017, while Sigma Explorer is comprised of 5505 events for the period 1970–2018 (see Table 2). It is important to note that these databases consist of only a specific subset of real events and geographical coverage, event-specific coverage may differ in time, and total numbers of fatalities and damages caused are likely underestimated. It is thus necessary to carefully interpret observed trends [22,23].

3. Results

3.1. Research on Different Types of Natural Hazards

3.1.1. General Trends

The overall number of research items has been increasing dramatically over time (see Figure 1), reaching a total of 588,424 research items published (until 2017), of which floods, earthquakes, storms, and droughts are the most frequently researched natural hazard types. While a total of 2307 research items was published between 1900 and 1949 (0.4% of all), 30,720 research items (5.2% of all) were published between 1950 and 1989, and 94,068 between 1990 and 1999 (16.3% of all). Over half of all research items have been published since 2010 (2010–2017). A comparable trend is observed in the WOS category Physical Geography (half of all research items in this category published since 2009), a not so strong increase is observed in WOS categories Environmental Sciences, Water Resources, Multidisciplinary Geosciences, Meteorology & Atmospheric Sciences, and Geology (half of all research items published since 2007, 2006, 2004, 2003, and 2001, respectively), and an even less strong increase in the category Multidisciplinary Sciences (half of all research items published since 1994). These figures indicate the prominent role and increasing interest of scientists in researching natural hazards in recent years.
While the overall number of research items published has increased rapidly in past decades, the ratio between research items focusing on the geological/geomorphic natural hazards and research items focusing on the climatic/hydro-meteorological natural hazards has remained relatively stable over time (see Figure 1). The research items focusing on climatic/hydro-meteorological natural hazards dominated in all studied periods, with 51.4% in 1900–1949 to 57.9% in 2010–2017. Significant differences, however, exist between individual countries (see Section 3.2).
The share of research items focusing on individual types of natural hazards is also relatively stable, with marginal changes being detected since the 1990s (see also Figure 1). The most significant changes in the whole studied period 1900–2017 are the decreasing share of research on earthquakes (from 30.4% in 1900–1949 to 15.7% in 2010–2017) and of research on storms (from 23.1% in 1950–1969 to 12.5% in 2010–2017). The most significant increasing share is observed for droughts (from 6.7% in 1900–1949 to 14.1% in 2010–2017), slope movements (from 2.9% in 1900–1949 to 7.9% in 2010–2017), and other climatic/hydro-meteorological natural hazards (from 3.7% in 1900–1949 to 7.2% in 2010–2017). A very stable share is observed for floods (minimum 17.3% in 1900–1949, maximum 18.3% in 2000–2009).

3.1.2. Multi-Hazard Research Items and Links Between Types of Natural Hazards

Obvious disproportion is observed between the sum of research items found for individual types of natural hazards (n = 682,923) and the overall number of research items found in the WOS database when using all individual search chains (see Table 1) simultaneously (n = 588,424), meaning that 94,499 research items found (16.1% of all) deal with two or more types of natural hazards (so called multi-hazard research items). The share of multi-hazard research items on the number of research items found for individual types of natural hazards varies from 14.5% (droughts), 17.0% (volcanic activity), and 17.4% (earthquakes) to 37.5% (other climatic/hydro-meteorological hazards), 38.1% (erosion), and 42.5% (other geological/geomorphic hazards). Both climatic/hydro-meteorological natural hazards and geological/geomorphic natural hazards are addressed in 26,013 research items (i.e., 27.5% of all multi-hazard items).
It is further shown that the most significant links (>5% share of multi-hazard items on the total of research items for the two given types of natural hazards) exist between storms and hurricanes (research items, 7.9%), storms and other climatic/hydro-meteorological hazards (6.1%), earthquakes and other geological/geomorphic hazards (5.8%), and storms and floods (5.2%; see Table 3). Table 3 also reveals stronger links between natural hazards of one category—climatic/hydro-meteorological or geological/geomorphic (darker colors in the upper left and the lower right sector of the table).

3.2. Geographical Focus of Research on Natural Hazards

Based on the search in abstracts and titles, geographical focus (defined by the name of the country) can be assigned to 378,851 research items (64.4% of all). The research on natural hazards has been performed in all 195 countries of the world, ranging from 82,525 research items focusing on the USA to three research items focusing on Sao Tome and Principe, and Antigua and Barbuda (see Figure 2). The USA are followed by China (31,403 research items), Japan (18,006 research items), Australia (17,193 research items), and Canada (14,423 research items). In Europe, 11,980 research items are focusing on Italy (6th worldwide), 9646 on the U.K. (8th worldwide), and 9329 on Spain (10th worldwide). In Asia, China and Japan are followed by India (11,856 research items, 7th worldwide), and in Latin America, Mexico (9331 research items, 9th worldwide) is followed by Brazil (7101 research items, 12th worldwide). South Africa, with 3802 research items, is the most researched African state (19th worldwide).
The apparent hotspot where only a limited amount of research on natural hazards is performed is identified in Africa—a total of 24,800 research items (6.5% of all with assigned geographical focus) are geographically focusing on Africa. Considering the number of inhabitants of individual countries [24] with more than 1000 research items, the highest share of research items per 1000 inhabitants is observed in Iceland (8.3 research items per 1000 inhabitants), New Zealand (1.8 research items per 1000 inhabitants), Mongolia and Australia (both 0.7 research items per 1000 inhabitants), and Norway (0.5 research items per 1000 inhabitants), while 0.005 research items per 1000 inhabitants is observed in Nigeria; 0.006 research items per 1000 inhabitants is observed in Nigeria; 0.009 research items per 1000 inhabitants is observed in India; and 0.01 research items per 1000 inhabitants is observed in Pakistan, Sudan, Bangladesh, Iraq, Indonesia, and Viet Nam.
Considering the area of individual countries [25] with more than 1000 research items, it is observed that the highest number of research items per km2 is reached in Taiwan (0.180 research items/km2), followed by Israel (0.066 research items/km2), The Netherlands (0.063 research items/km2), and Switzerland (0.057 research items/km2). Naturally, the lowest number is observed in large countries such as Russia (0.00018 research items/km2), Brazil (0.00083 research items/km2), and Colombia (0.00087 research items/km2).

3.3. Research by the Countries of the Authors (Affiliations)

3.3.1. General Overview and Research in Top 10 Research Countries

The research on natural hazards is dominated by authors affiliated with institutions located in the USA (177,671 research items (co-)authored, i.e., 30.2%), followed by authors affiliated with institutions located in China (67,350 research items (co-)authored, i.e., 11.4%). Authors located in five other countries (co-)authored over 30,000 research items for each country (England, Japan, Germany, Italy, and France) and authors from three other countries (co-)authored over 20,000 research items (Australia, Canada, and India). Altogether, the authors affiliated with the institutions located in these top 10 natural hazard research countries (co-)authored 71.3% of all research items in the analyzed dataset. Researchers from the top 25 research countries (12 from Europe, 7 from Asia, 4 from Americas, and 2 from Australia) altogether (co-)authored 85.8% of all research items.
Significant differences exist between research on different types of natural hazards in the top 10 research countries. Figure 3 shows that research on climatic/hydro-meteorological natural hazards dominates in the majority of countries (up to 69.2% share in case of Australia), while research on geological/geomorphic natural hazards dominates in Italy (65.2%), Japan (65.1%), and France (51.8%). The explanation for these differences might be related to the natural hazards affecting individual countries, e.g., increased share of research on earthquakes in Japan (40.7% compared to world’s average 18.5%) or increased share of research on slope movements in Italy (18.2% compared to world’s average 9.8%; see also Section 4.1). An increased share of research on droughts is observed in India and Australia (21.6% and 20.5%, respectively, compared to world’s average of 14.1%).
Considering the GDP of the top 10 research countries [26], it is observed that nine of them are at the same time ranked among the countries with the highest GDP (the only exception is Australia, which is ranked 13th, while Brazil is ranked 8th). The ratio between the number of inhabitants [24] of individual countries with reference to the world’s population and the share of research items (co-)authored shows that researchers from the USA (co-)authored 30.2% of research items while the population of the country is only 4.3% of the world’s population. An even more extreme ratio is observed in Australia with 4.7% research items (co-)authored and 0.3% of population, England (6.5% of research items (co-)authored and 0.7% of population), and Canada (4.7%; 0.5%). On the other hand, researchers from China (co-)authored 11.4% of research items while the population of the country is 18.1% of world’s population. Researchers from India (co)-authored 3.5% of research items while the population of the country is 17.3% of the world’s population. The research performance of individual countries is thus highly unbalanced.
From the global perspective, the research on individual types of natural hazards is in all cases dominated by researchers from the USA, followed by researchers from China, with the exception of research on volcanic activity, where Italy is ranked second (see Table 4). Spain is ranked 5th for research on droughts, 7th for research on other climatic/hydro-meteorological hazards, 8th for erosion, and 10th for research on slope movements; Taiwan is ranked as 6th for research on hurricanes; Russia is ranked 9th for research on volcanic activity and 10th for research on earthquakes; Switzerland is ranked 9th for research on slope movements; and The Netherlands is ranked 10th for research on erosion, as well as climatic/hydro-meteorological hazards.

3.3.2. Cooperation between Countries

The majority of research items are written by the author(s) from one country and only slightly above one fourth of all research items (27.3%) are characterized as international research items. Significant differences, however, exist between individual countries. Among the top 25 research countries, the higher share of international research items is observed in Scandinavian countries (Sweden, Norway), Switzerland, Scotland, and The Netherlands, while the lower share is observed in India, China, the USA, Iran, and Japan.
Two clusters of bi-lateral cooperation are identified (see Figure 4)—European (leading countries England, Germany, France, Italy) and circum-Pacific (leading countries USA, China, Canada, Australia, Japan). Considering the amount of joint research items between two countries, the most intense scientific cooperation exists between the USA and China (8642 joint research items), the USA and England (6343 joint research items), and the USA and Canada (5750 joint research items). Additionally, 3000+ joint research items exist between the USA and Germany, the USA and France, the USA and Australia, the USA and Japan, and the USA and Italy.
Considering the share of joint research items between two countries on the total number of research items of these two countries, the highest share of joint research items exists between Switzerland and Germany (4.5%; 2010 joint research items), England and Scotland (4.5%; 1999 joint research items), and England and Germany (3.9%; 2760 joint research items). More than 3.0% of joint research items further exist between several often neighboring countries, such as Germany and France, Italy and France, England and France, Switzerland and France, the USA and China, Germany and The Netherlands, Spain and Italy, Norway and Sweden, and Spain and France (see Figure 4).

3.4. Citations

A total of 588,424 research items analyzed have obtained 9996,579 citations (1900–2017), resulting in an average of 17.0 citations per item (in 8/2018). The H index of the whole dataset is 561 and the i100 index is 17,414 (see Table 5). A clear relationship exists between the number of research items and citations obtained:
Ct = 15.6 ∙ It + 59,147 (R2 = 0.95)
where Ct is the total of citations obtained by an individual type of natural hazard and It is the total number of research items for a given natural hazard. A comparison of average citations per item between climatic/hydro-meteorological natural hazards and geological/geomorphic natural hazards shows a slightly higher average of climatic/hydro-meteorological natural hazards (17.2 vs. 16.7 citations per item). Average citations per item, however, significantly vary among individual types of natural hazards from 9.9 citations per item (tornado) and 11.6 citations per item (tsunami) to 23.9 citations per item (volcanic activity) and 24.8 citations per item (heat wave).
The highest H index (354) is observed for drought, which is ranked 4th in terms of the total number of research items, but 2nd in the total number of citations obtained (see Table 5). A logarithmic relationship is observed between H indexes and the total number of research items of a given type of natural hazard (It), and total number of citations obtained (Ct):
Hindex = 61.9 ∙ lnIt–412.6 (R2 = 0.89)
Hindex = 64.4 ∙ lnCt–621.9 (R2 = 0.95)
where Ct is the total number of citations obtained by an individual type of natural hazard and It is the total number of research items of a given natural hazard. The i100 indexes are proportionally related (linear relationship) to the amount of research items focusing on individual types of natural hazards (Pearson coefficient 0.996) and to the total of citations obtained by them (Pearson coefficient 0.999). The relationships between the number of items published and citations obtained (H indexes; Equations (1)–(3)) are in line with [27] and recent observations of [28].

4. Discussion: Research on Natural Hazards and Reported Disasters—Global Overview

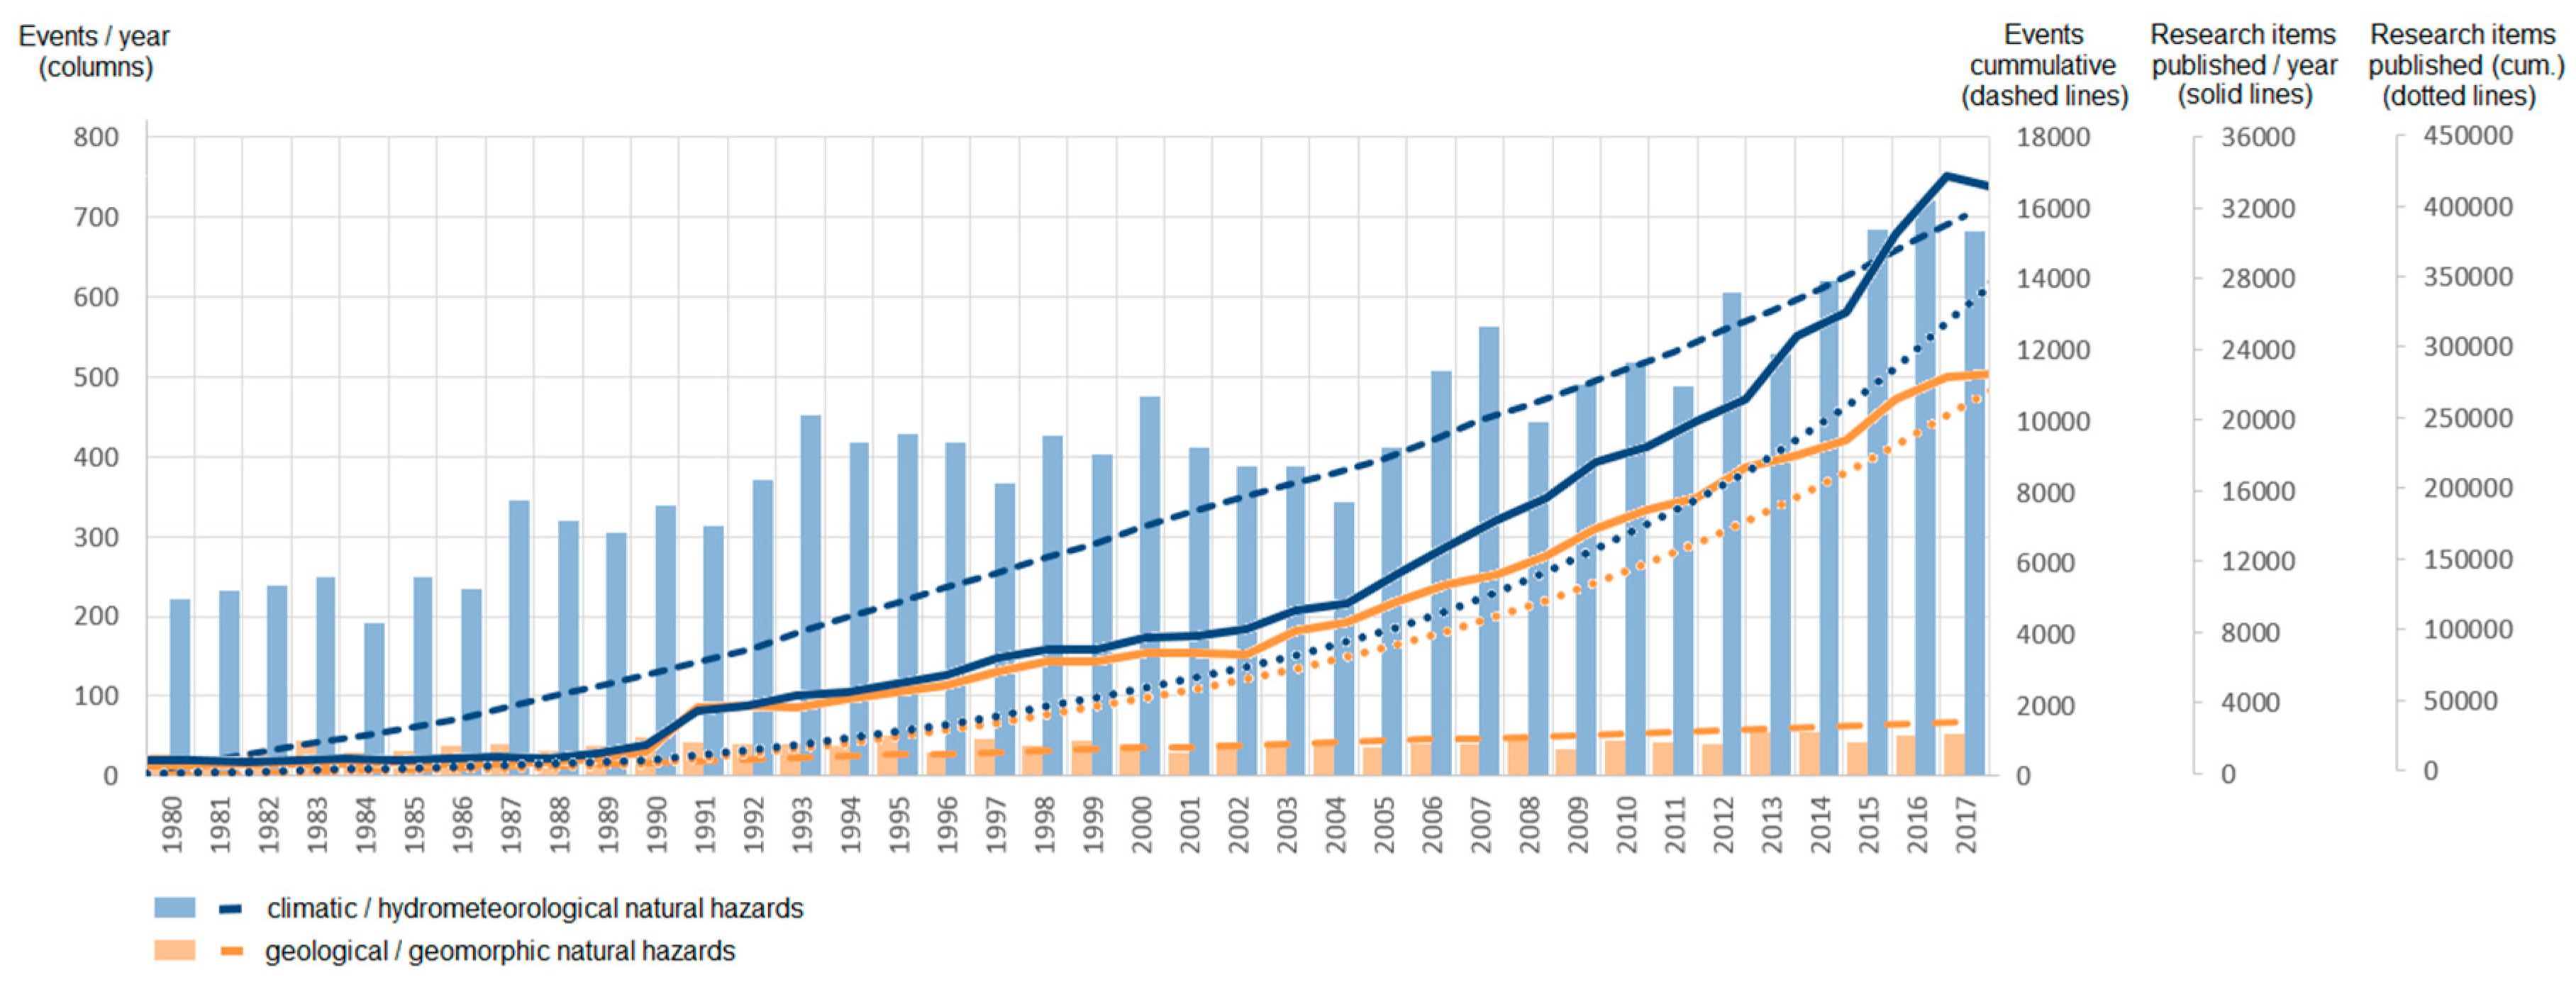
4.1. Research on Natural Hazards and Their Occurrence in Time

The occurrence of natural hazards based on MunichRE NatCatSERVICE data [1] in the period 1980–2017 indicates an increasing number of reported events (a total of 17,320 events, of which 1532 (8.8%) are classified as geological/geomorphic natural hazards). These figures provide an average of 194 research items published in the WOS database per one geological/geomorphic event in the NatCatSERVICE database and an average of 24 research items published in the WOS database per one climatic/hydro-meteorological event in the NatCatSERVICE database. Specifics of the database building (especially classification scheme and the definition of disasters; see also Section 2.3), however, need to be considered carefully when interpreting these observations (see [22,23]). While the cumulative number of reported events exhibits an increasing linear trend for both climatic/hydro-meteorological and geological/geomorphic natural hazards, a rather exponential trend is observed for the increasing number of research items published (see Figure 5). This exponential trend could be explained as a result of the increasing interest of the research community in natural hazard science (see also the comparison in Section 3.1.1) or as a result of a generally changing publishing paradigm (see also [13]), as well as possible other motivation for research on natural hazards, such as changing strategic natural hazards-/disasters-related policies [29,30] and/or research funding priorities [31,32].

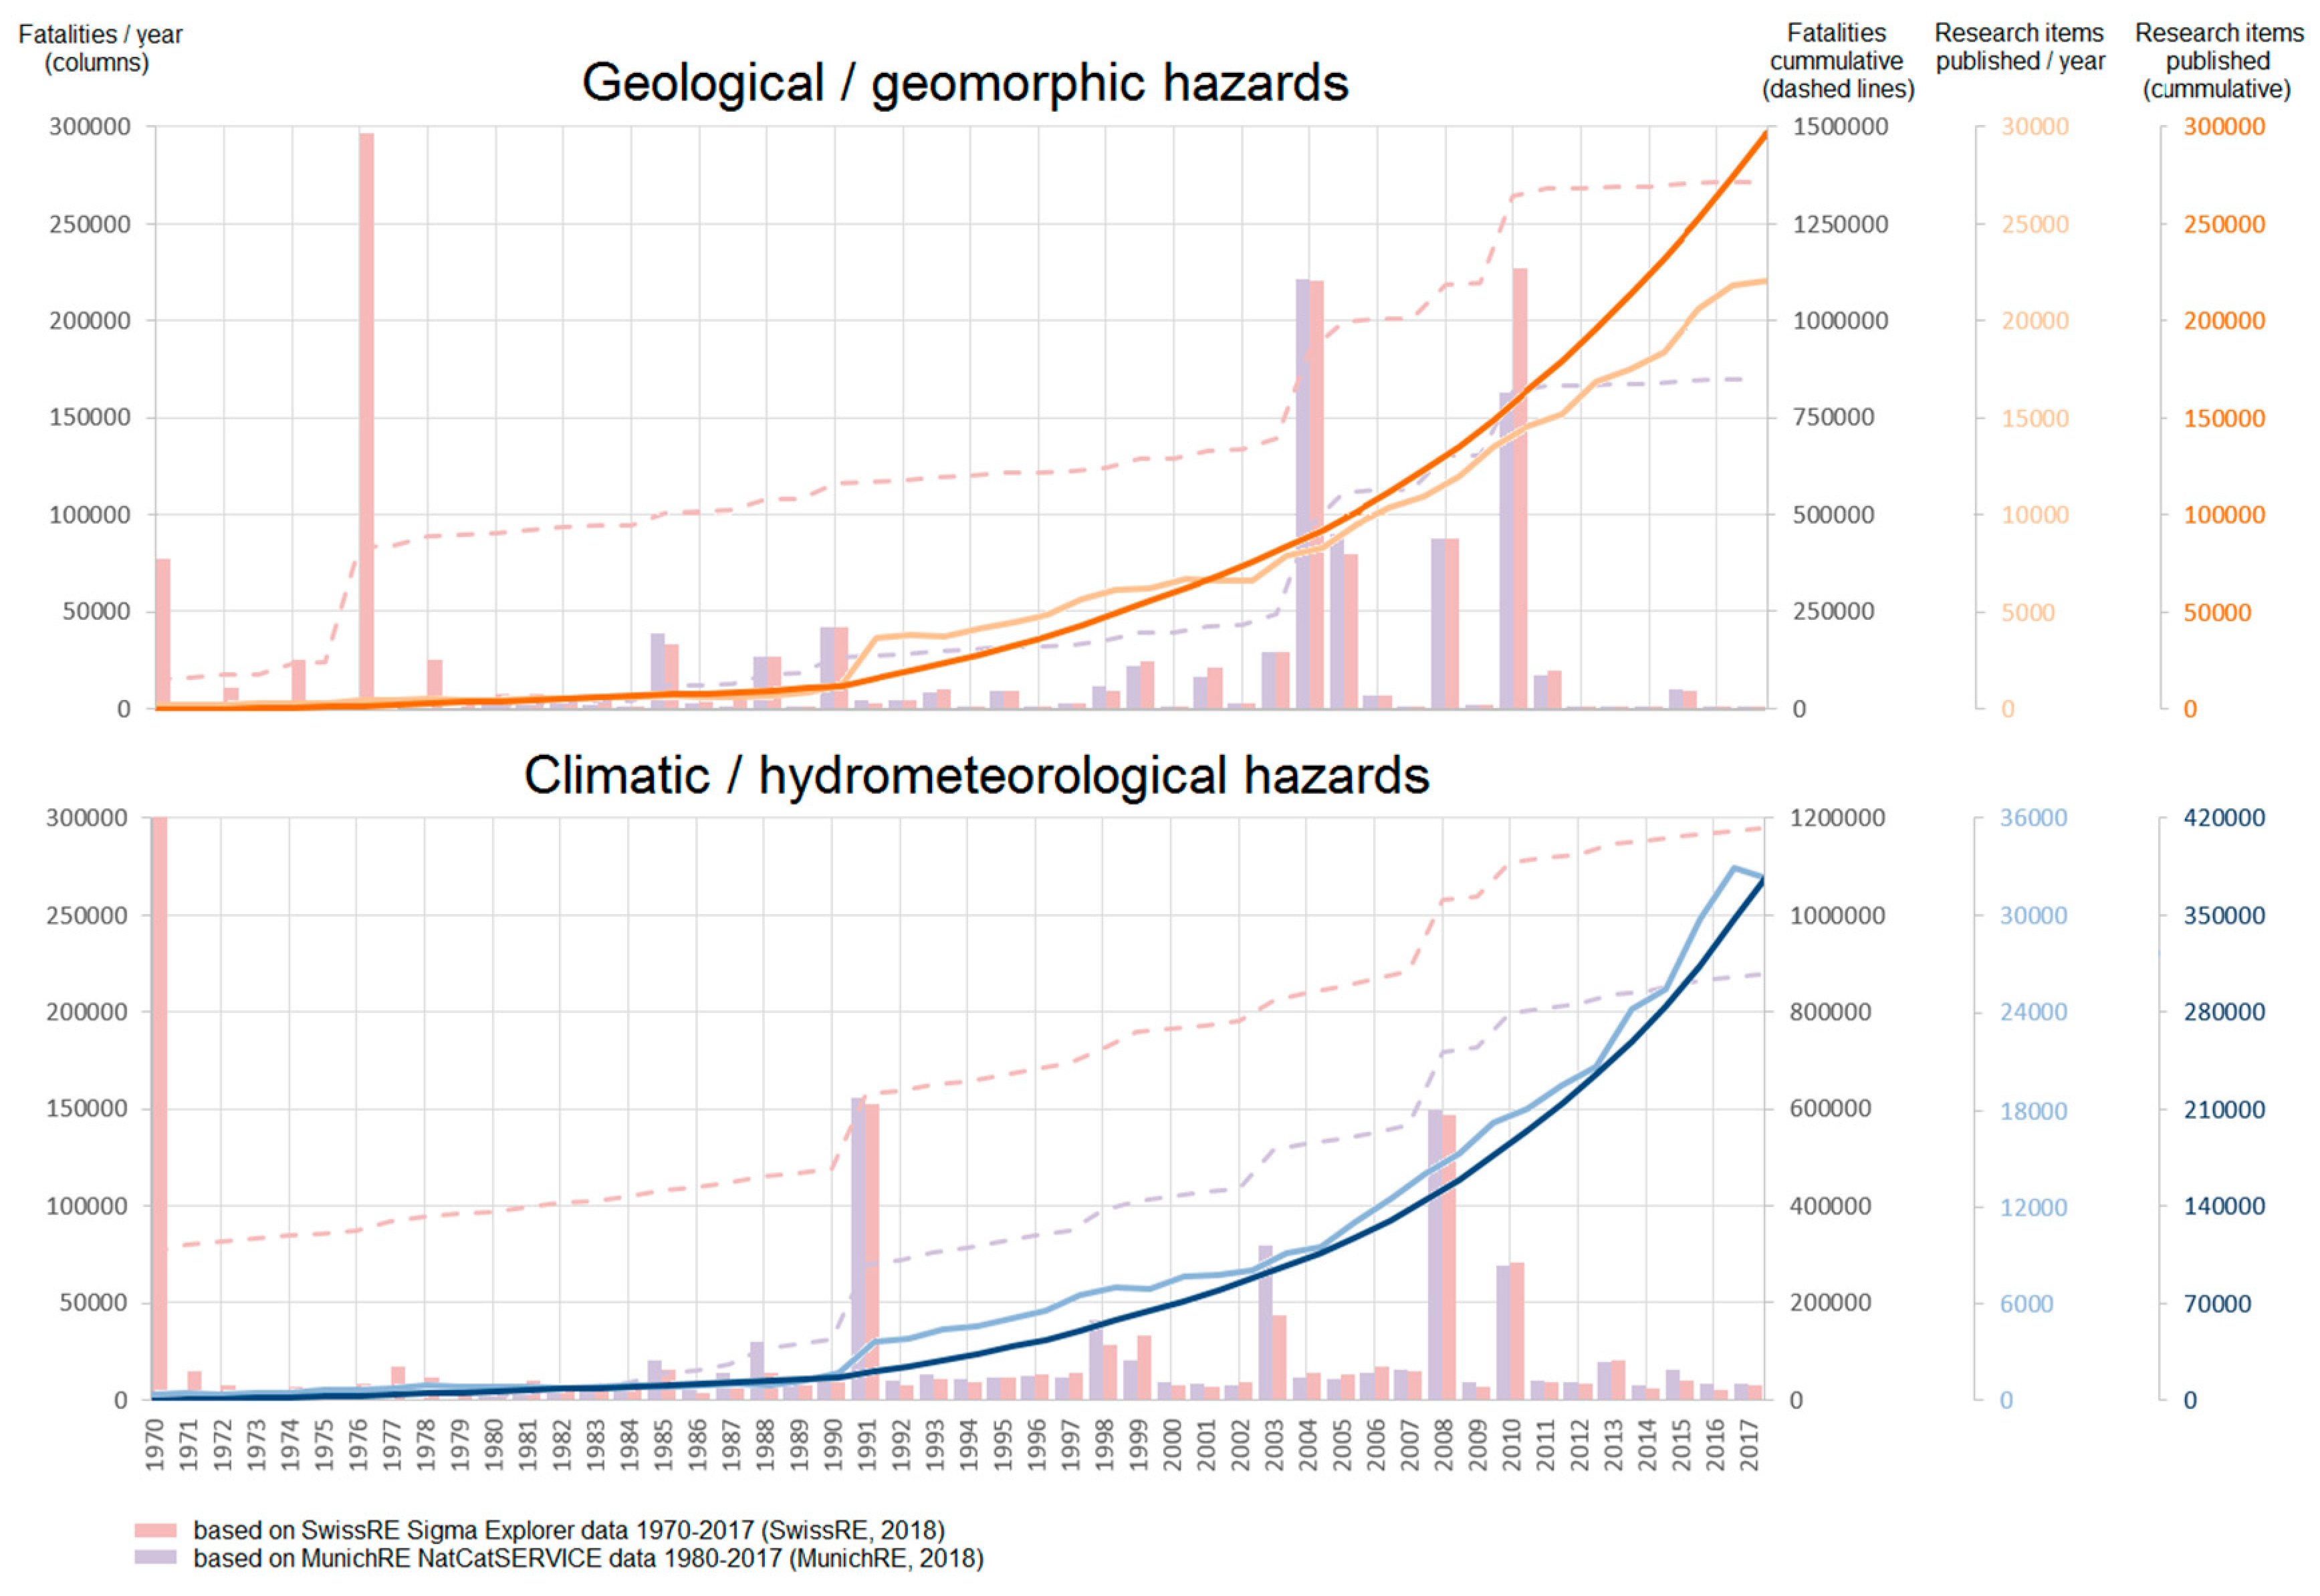
4.2. Research on Natural Hazards and Fatalities Caused

Fatalities caused by natural hazards in both global databases [1,5] significantly vary yearly, reflecting the occurrence of major disasters (e.g., major earthquakes, tsunamis, and floods; see Figure 6). Furthermore, the cumulative number of fatalities caused by natural hazards is increasing with a rather linear trend interrupted by episodic imprints of major disasters, such as the 2004 Indian Ocean earthquake and tsunami, or the 2010 Haiti earthquake. A total of 1,723,648 fatalities are attributed to disasters in the period 1980–2017 (of which 848,437, i.e., 49.2% to geological/geomorphic ones [1]). A total of 2,530,566 fatalities are observed for the period 1970–2017 (of which 1,356,146; i.e., 53.6% are attributed to geological/geomorphic hazards [5]). Some of the major disasters are also recognizable in research on natural hazards, clearly not only motivated by the number of fatalities caused. An example is again the 2004 disaster, which led to the increase of research items on tsunamis, from 154 research items published in 2004 to 624 research items published in 2005 (+305%).

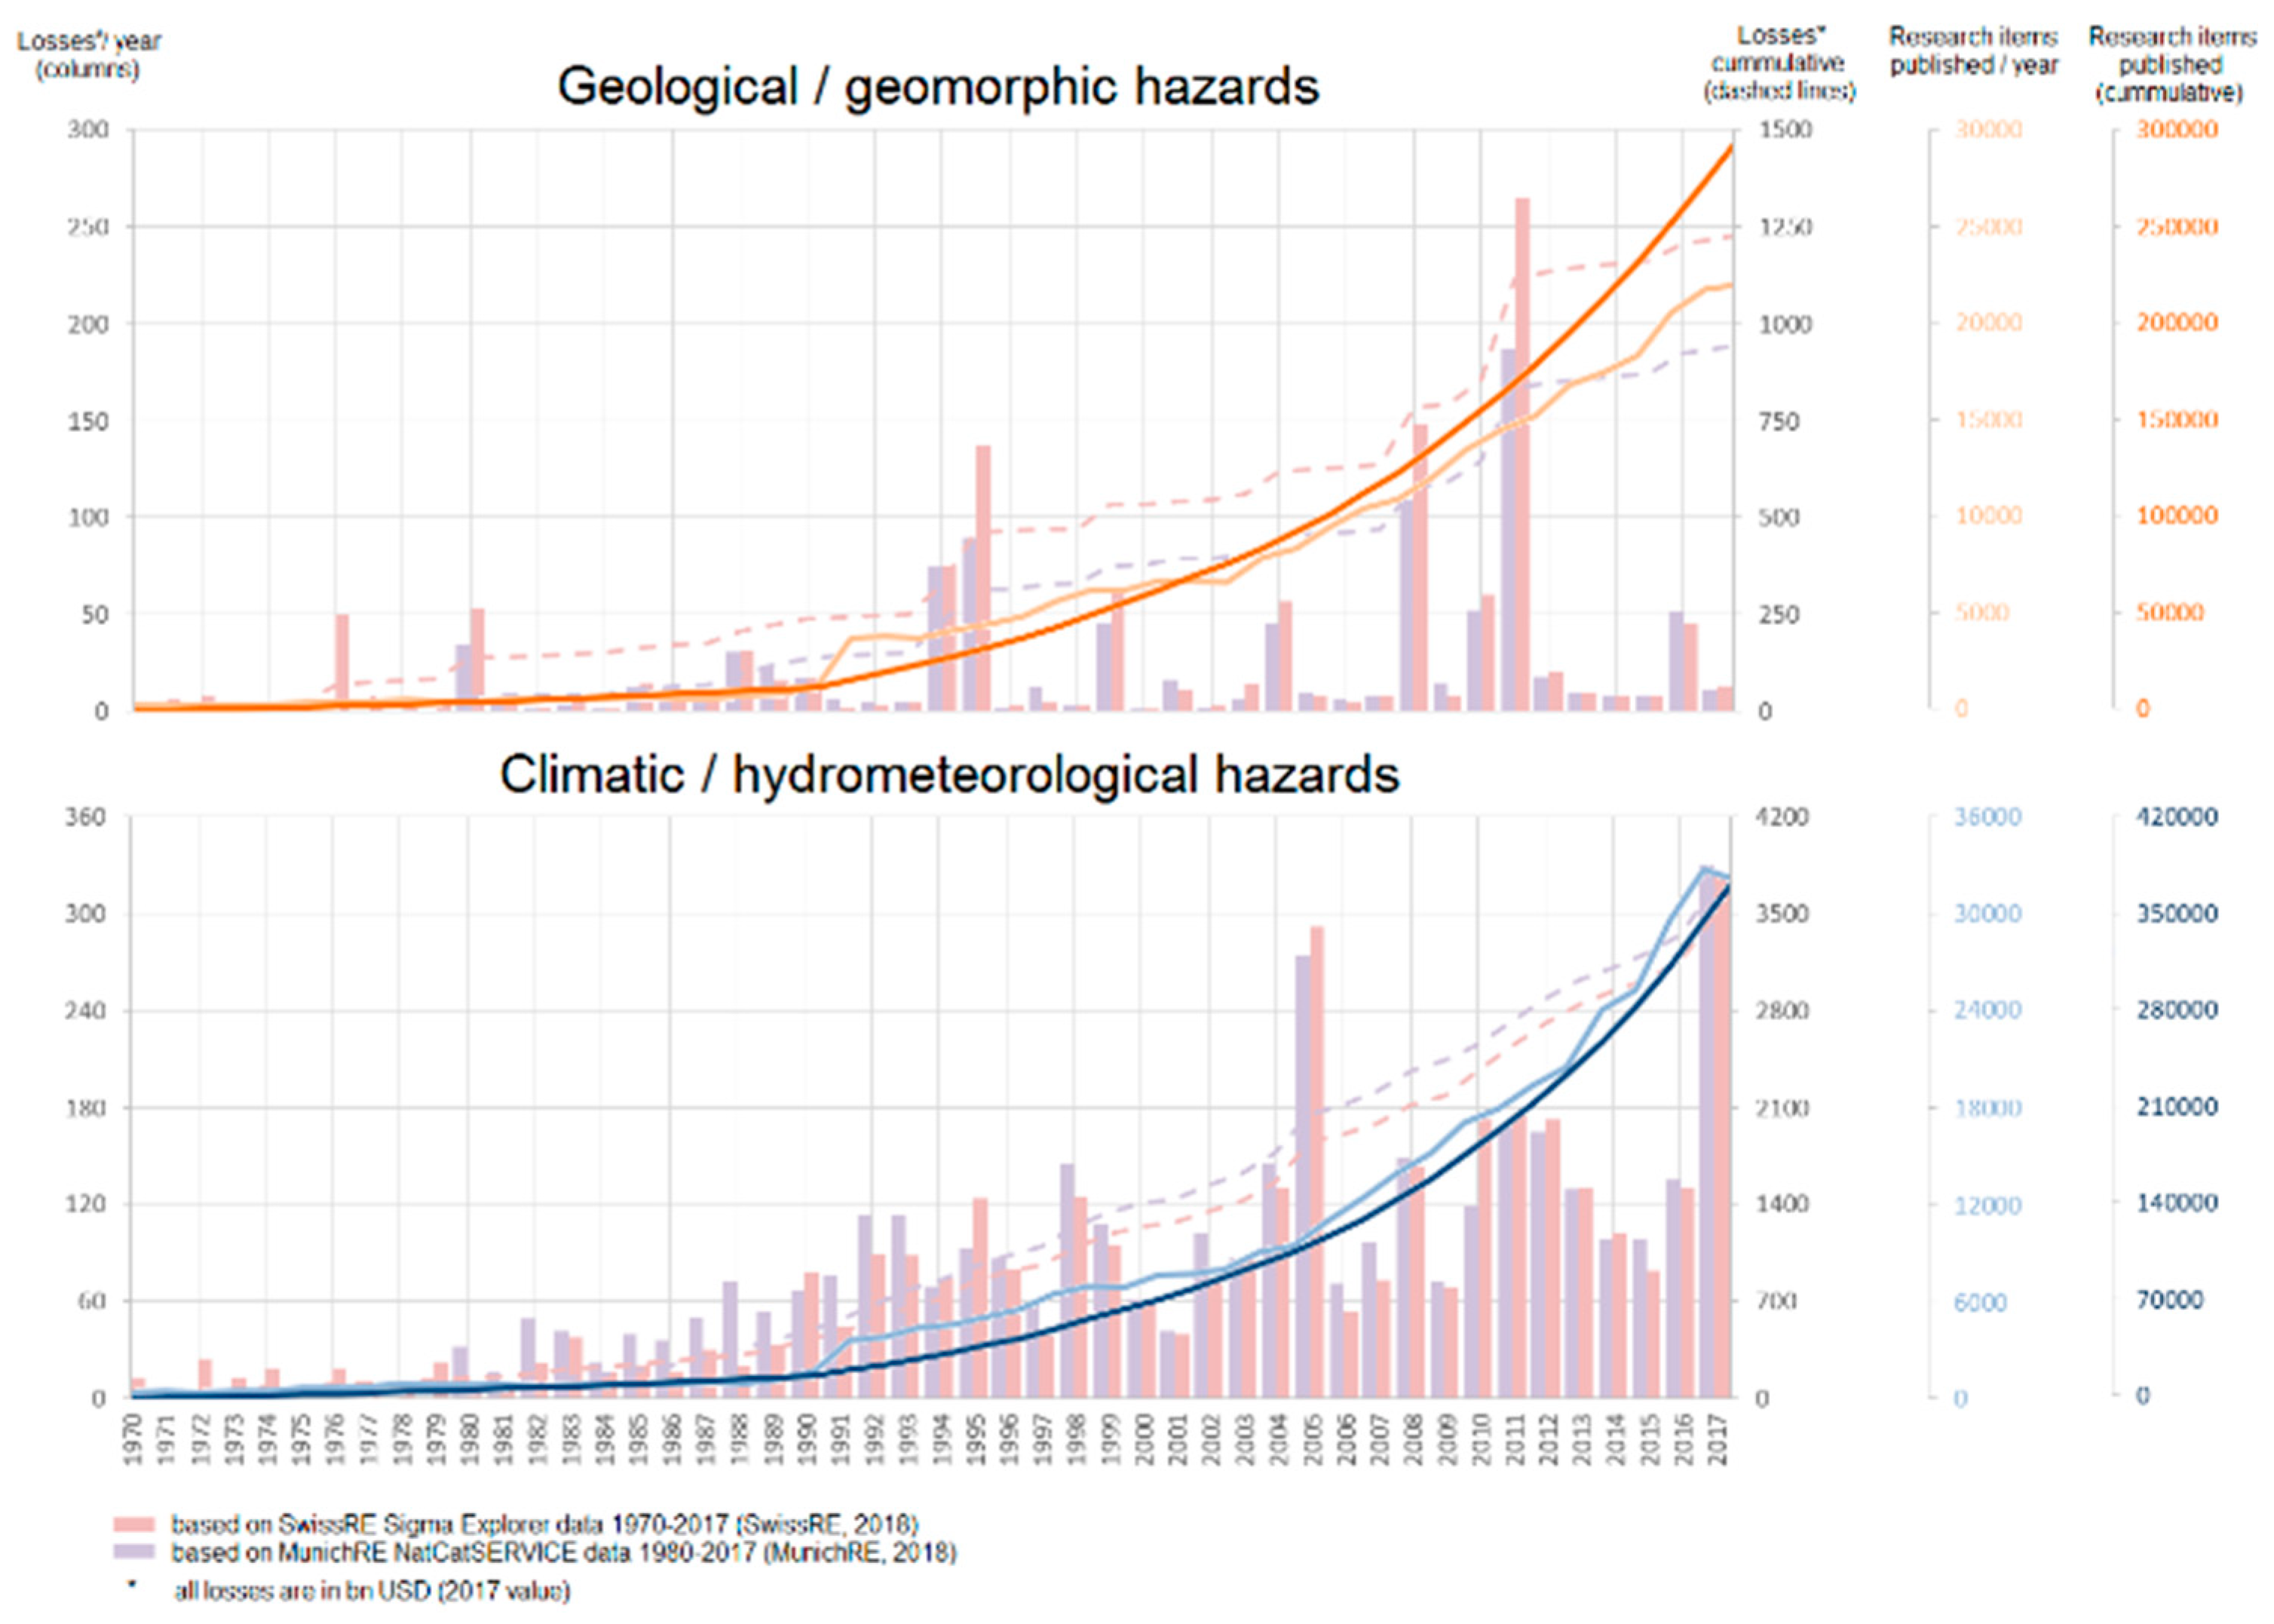
4.3. Research on Natural Hazards and Losses Caused by Natural Hazards

Both NatCatSERVICE [1] and Sigma Explorer [5] report increasing extents of damage caused by natural disasters yearly, apparently reflecting changing conditions (e.g., [3]), increasing population pressure and vulnerability globally [4], as well as possible inconsistencies in disaster databases on a global level [22,23] (see also Section 2.3). Overall losses caused by natural disasters were estimated to be 4614 billion USD in the period 1980–2017 [1] and 4697 billion USD in the period 1970–2017 [5]. The share of geological/geomorphic disasters varies from 20.3% to 25.9% among the two different databases used. While major disasters are capable of significantly influencing the overall statistics of losses (especially in case of geological/geomorphic disasters), the amount of research items published does not clearly reflect them on a scale of natural hazard categories (see Figure 7). Imprints of large disasters are, however, recognizable on a scale of individual types of natural hazards (see [10]). The 2008 Wenchuan earthquake (the second costliest geological/geomorphic disaster in the database) caused an increase in research on earthquakes (from 3952 research items published in 2008 to 4743 research items published in 2009), as well as slope movements (from 2470 research items published in 2008 to 2868 research items published in 2009).

5. Conclusions

This study provides insight into the global characteristics of research on natural hazards from the perspective of scientometry and the view of geography. Key findings of this study can be summarized as follows:
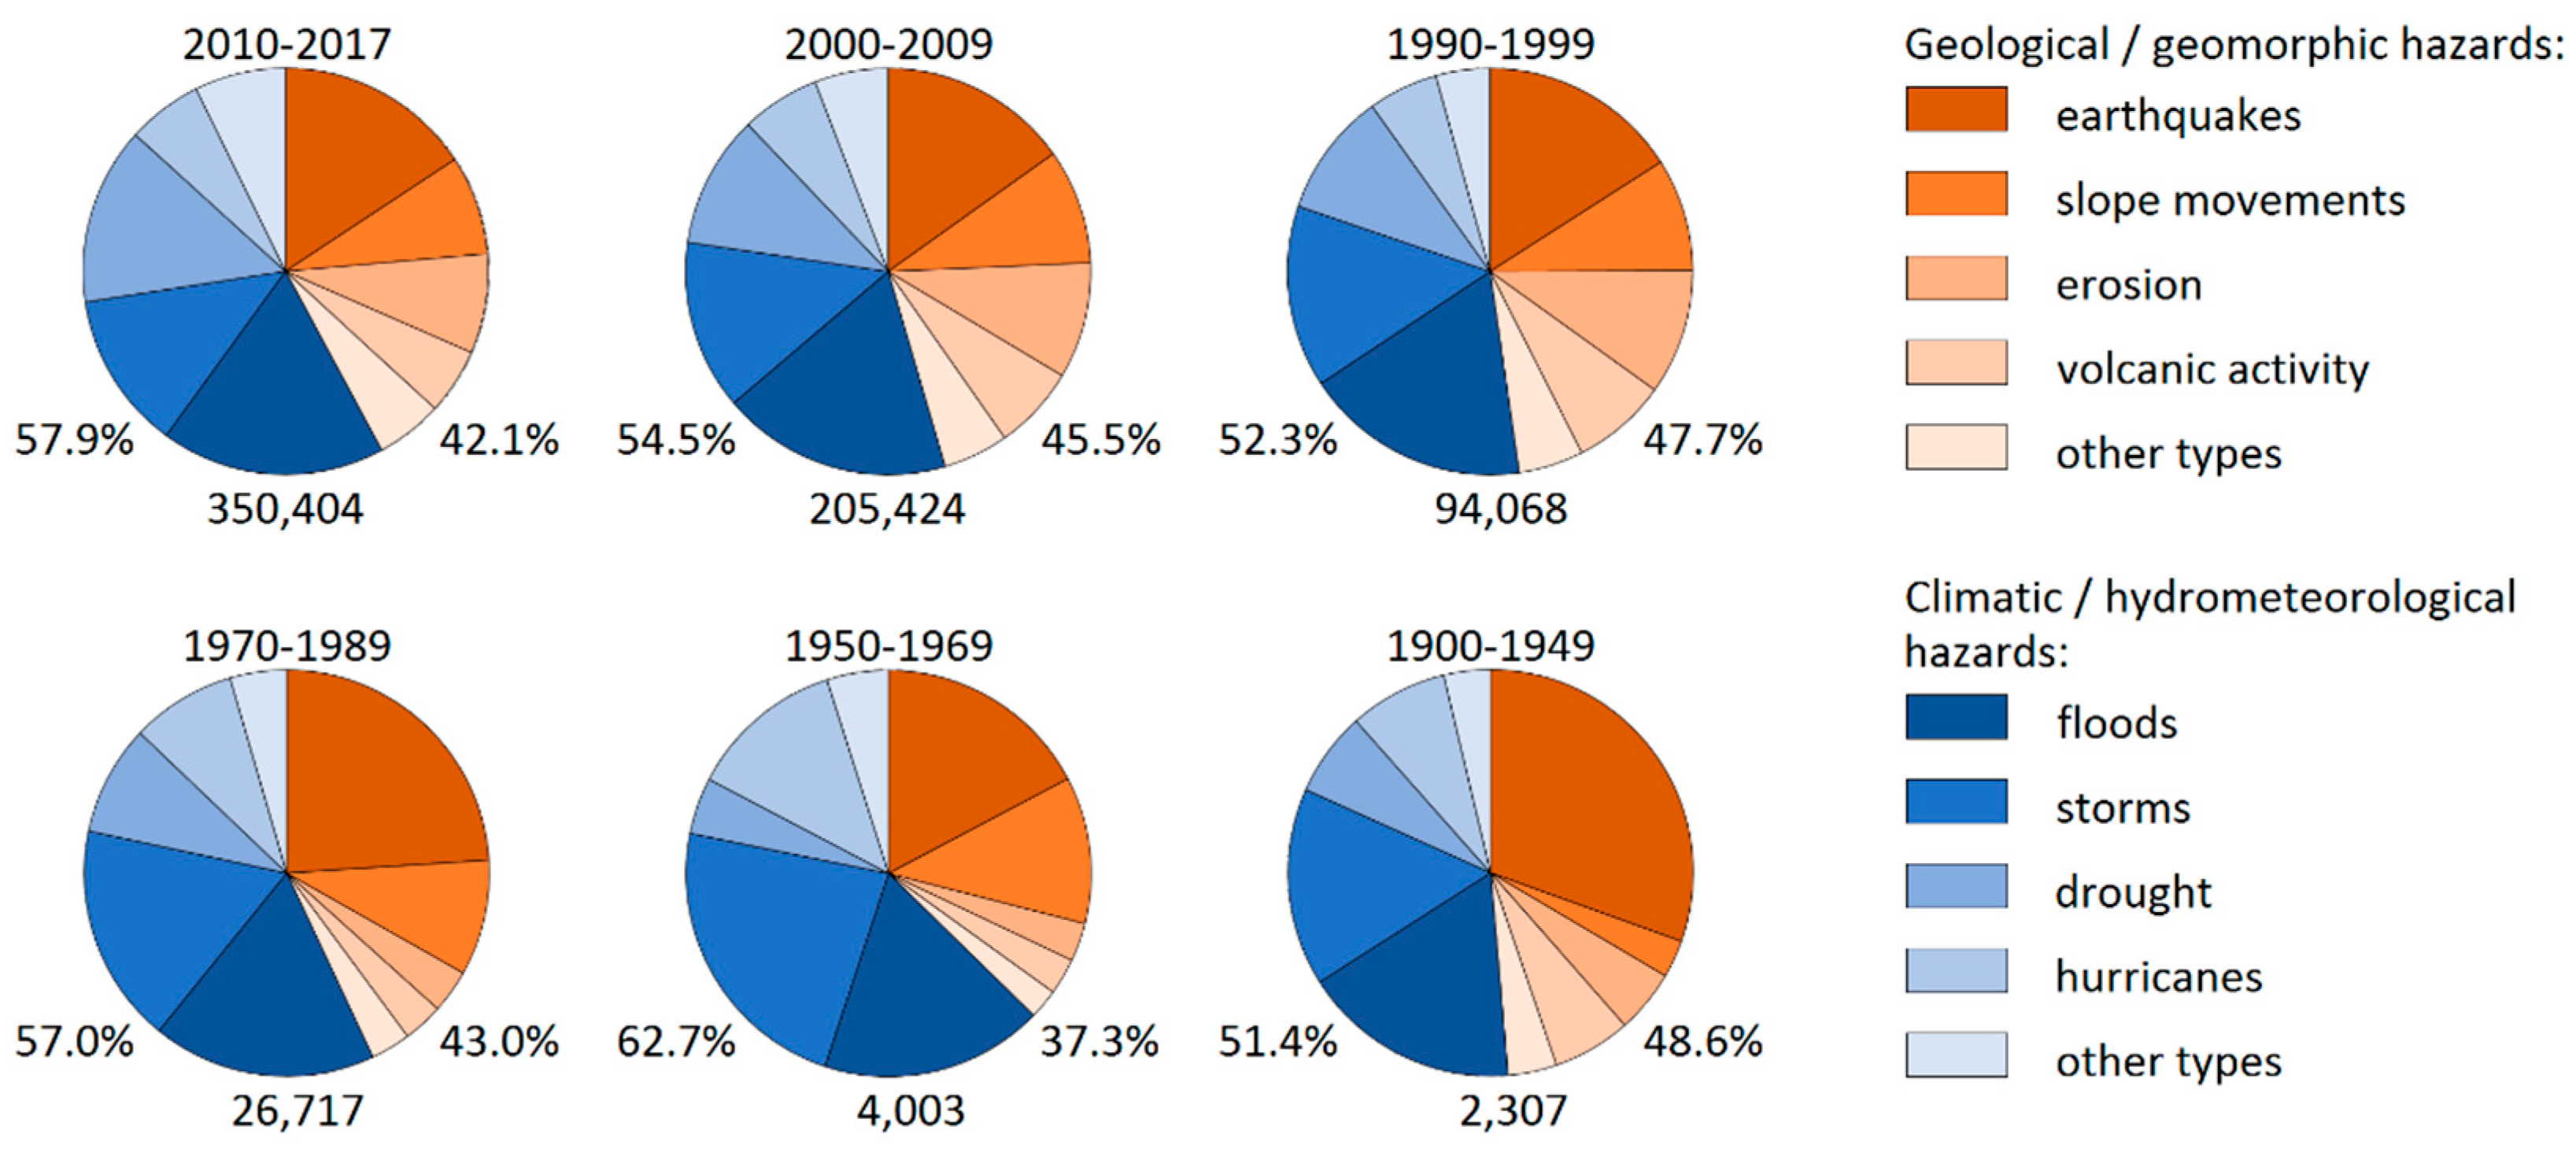
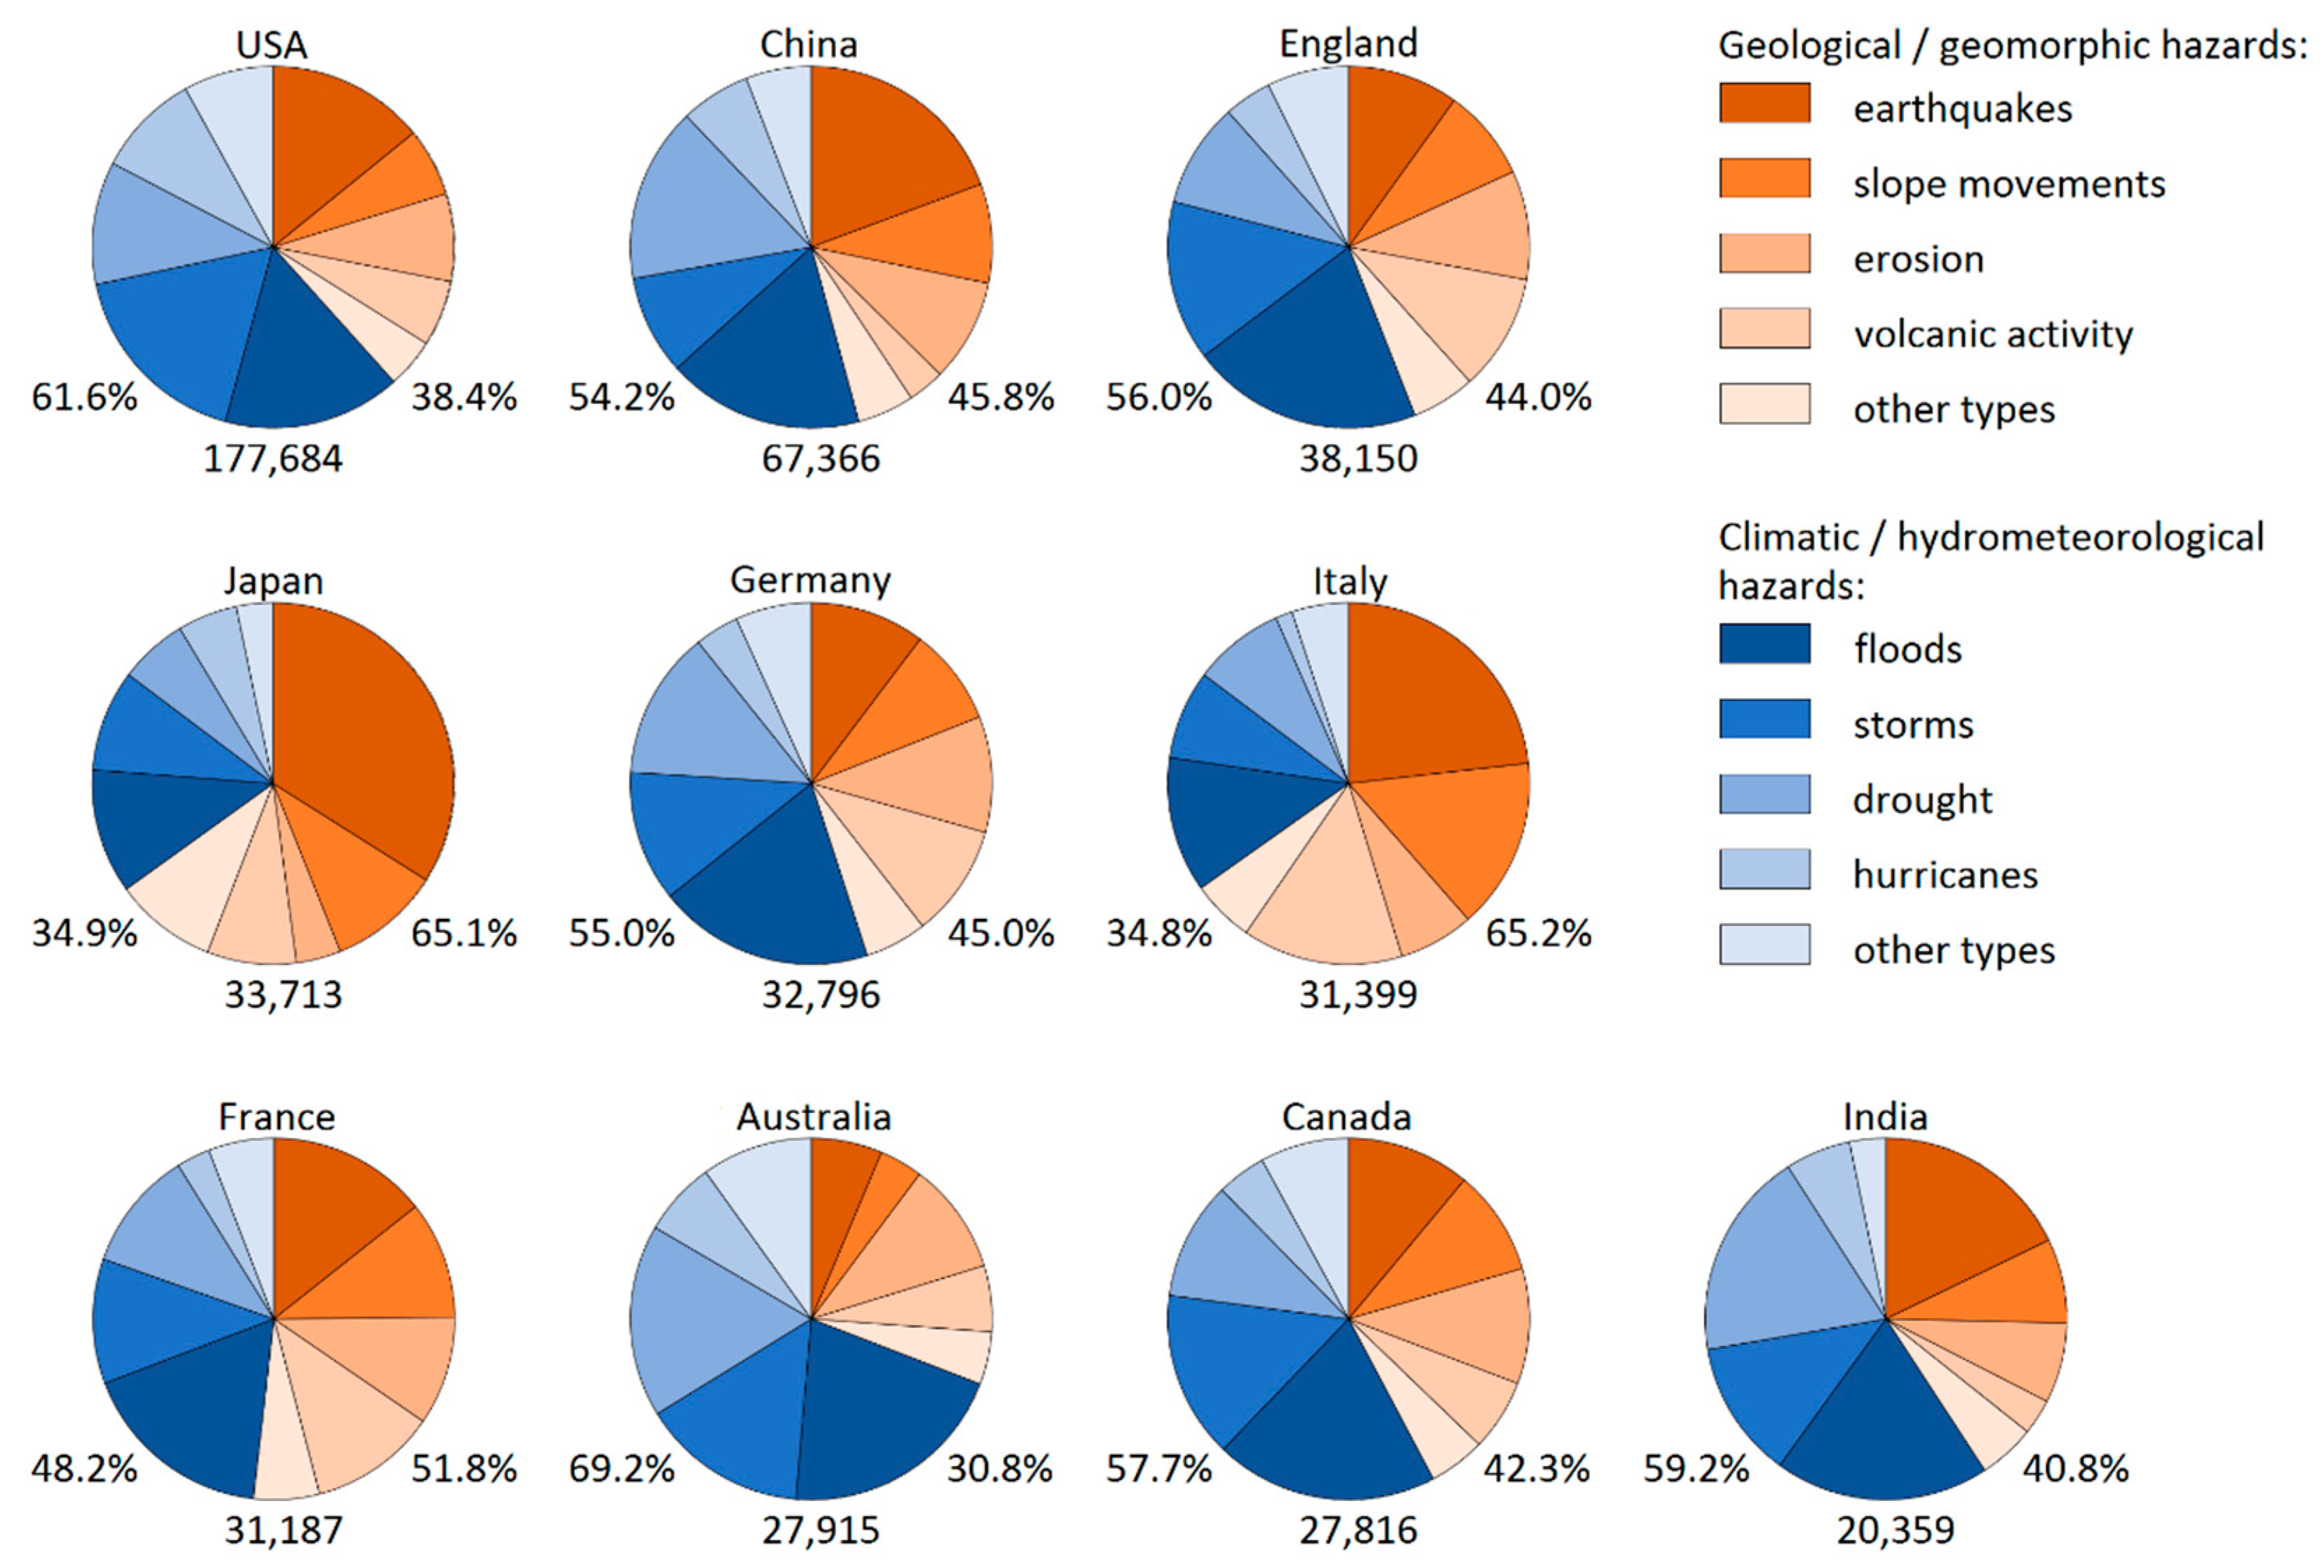
  • Research on climatic/hydro-meteorological hazards is prevailing over the research on geological/geomorphic hazards globally (55.8%/44.2%), while significant differences exist between individual countries, reflecting the main types of natural hazards affecting these countries.
  • The total amount of research items published is increasing exponentially for all types of natural hazards, with over the half of all research items published in 2010–2017 (analyzed period 1900–2017).
  • In terms of the total number of research items published, leading hazards are floods, earthquakes, storms, and droughts; the share of individual types of natural hazards in research on natural hazards is rather stable over time.
  • Research on all types of natural hazards is dominated by researchers from the USA, followed by researchers from China; the list of top 10 research countries for individual types of natural hazards further includes England, Japan, Germany, Italy, France, Australia, Canada, India, Spain, Taiwan, Russia, Switzerland, and The Netherlands.
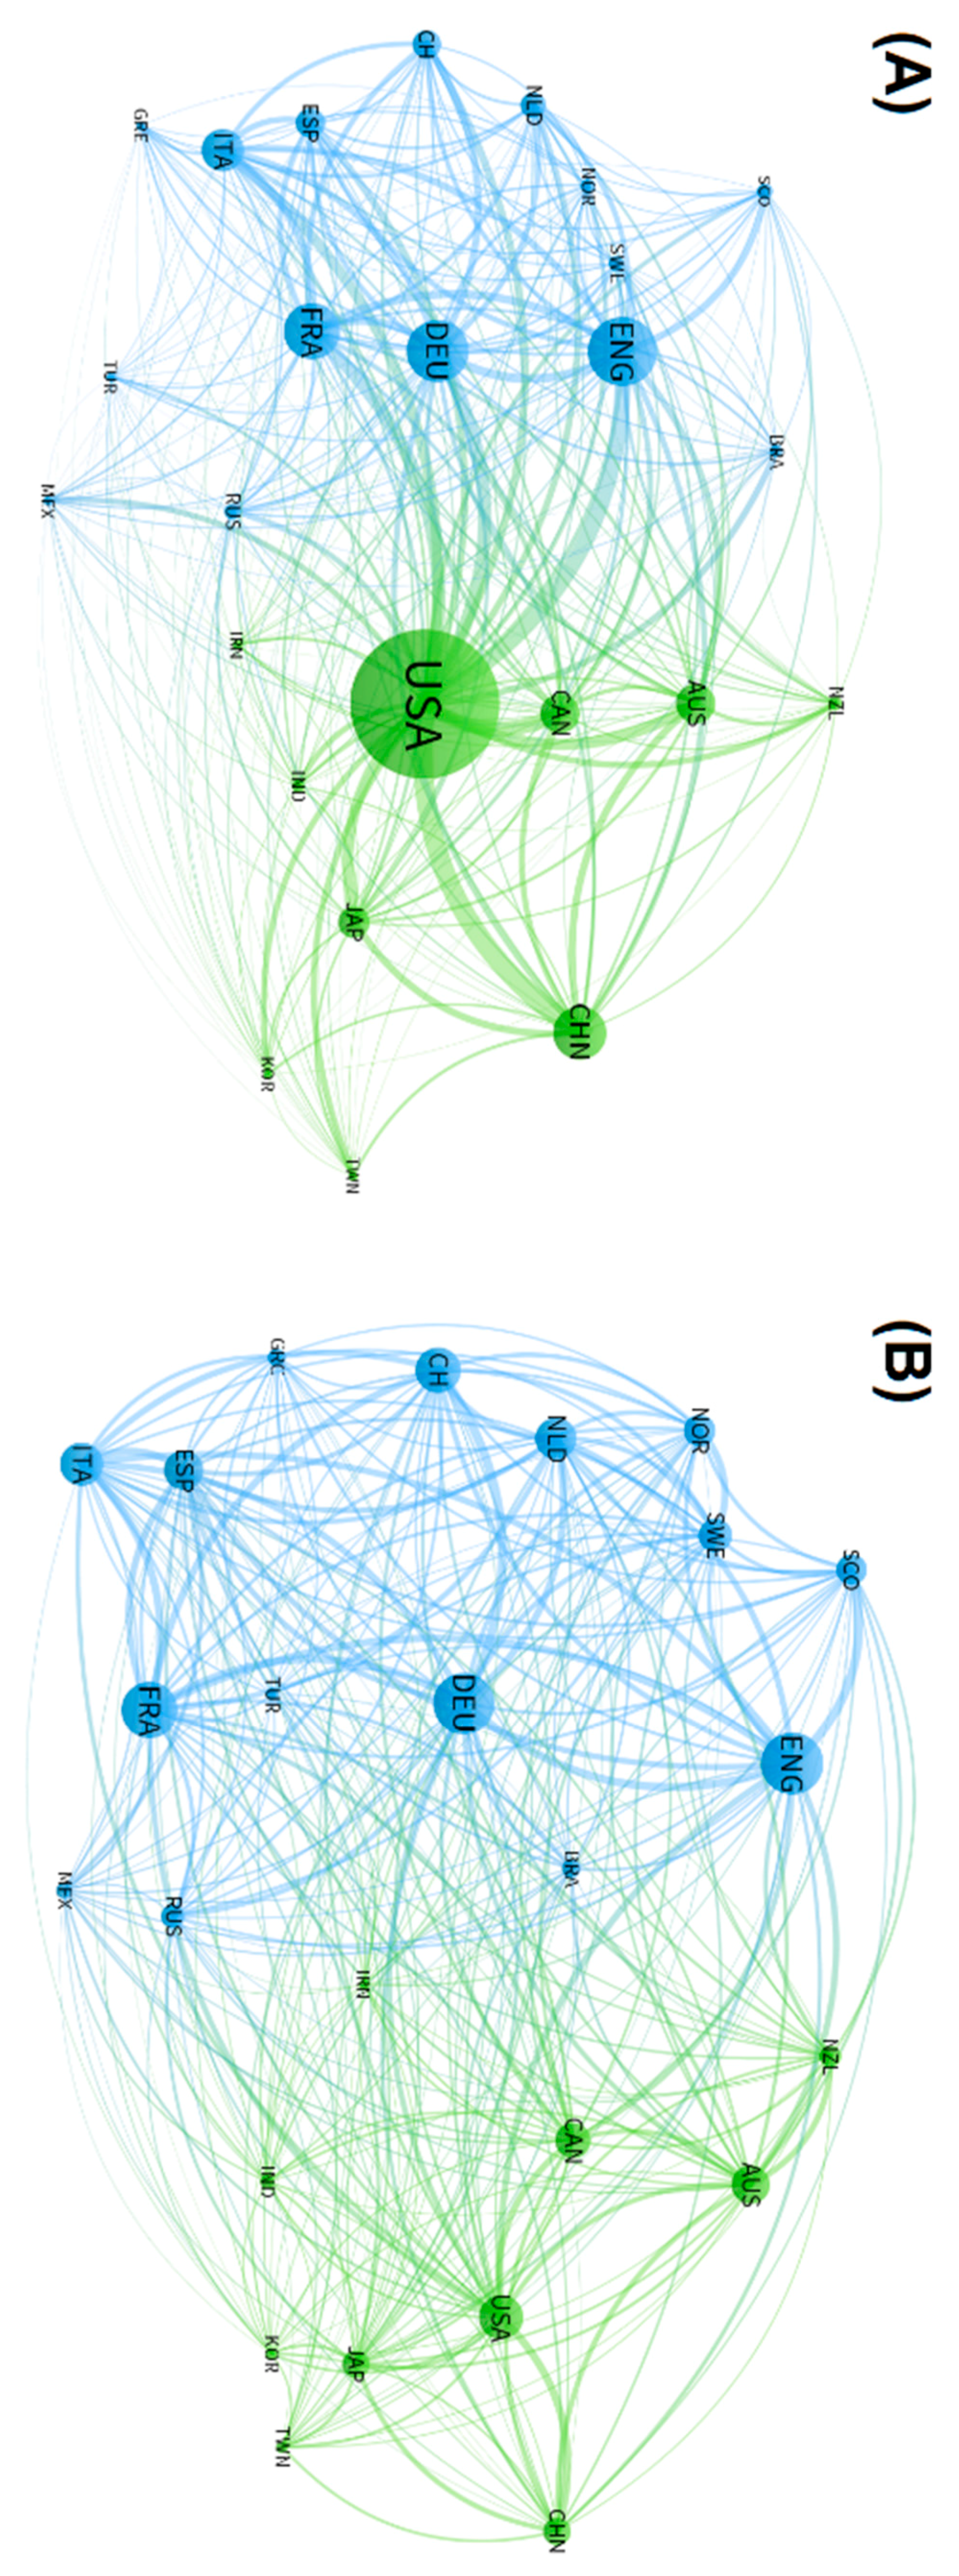
  • The majority of research items are written by the author(s) from one country; strong cooperation in natural hazard research exists between the top 10 research countries and geographically neighboring countries; two clusters of cooperation in natural hazard research are revealed—European and circum-Pacific.
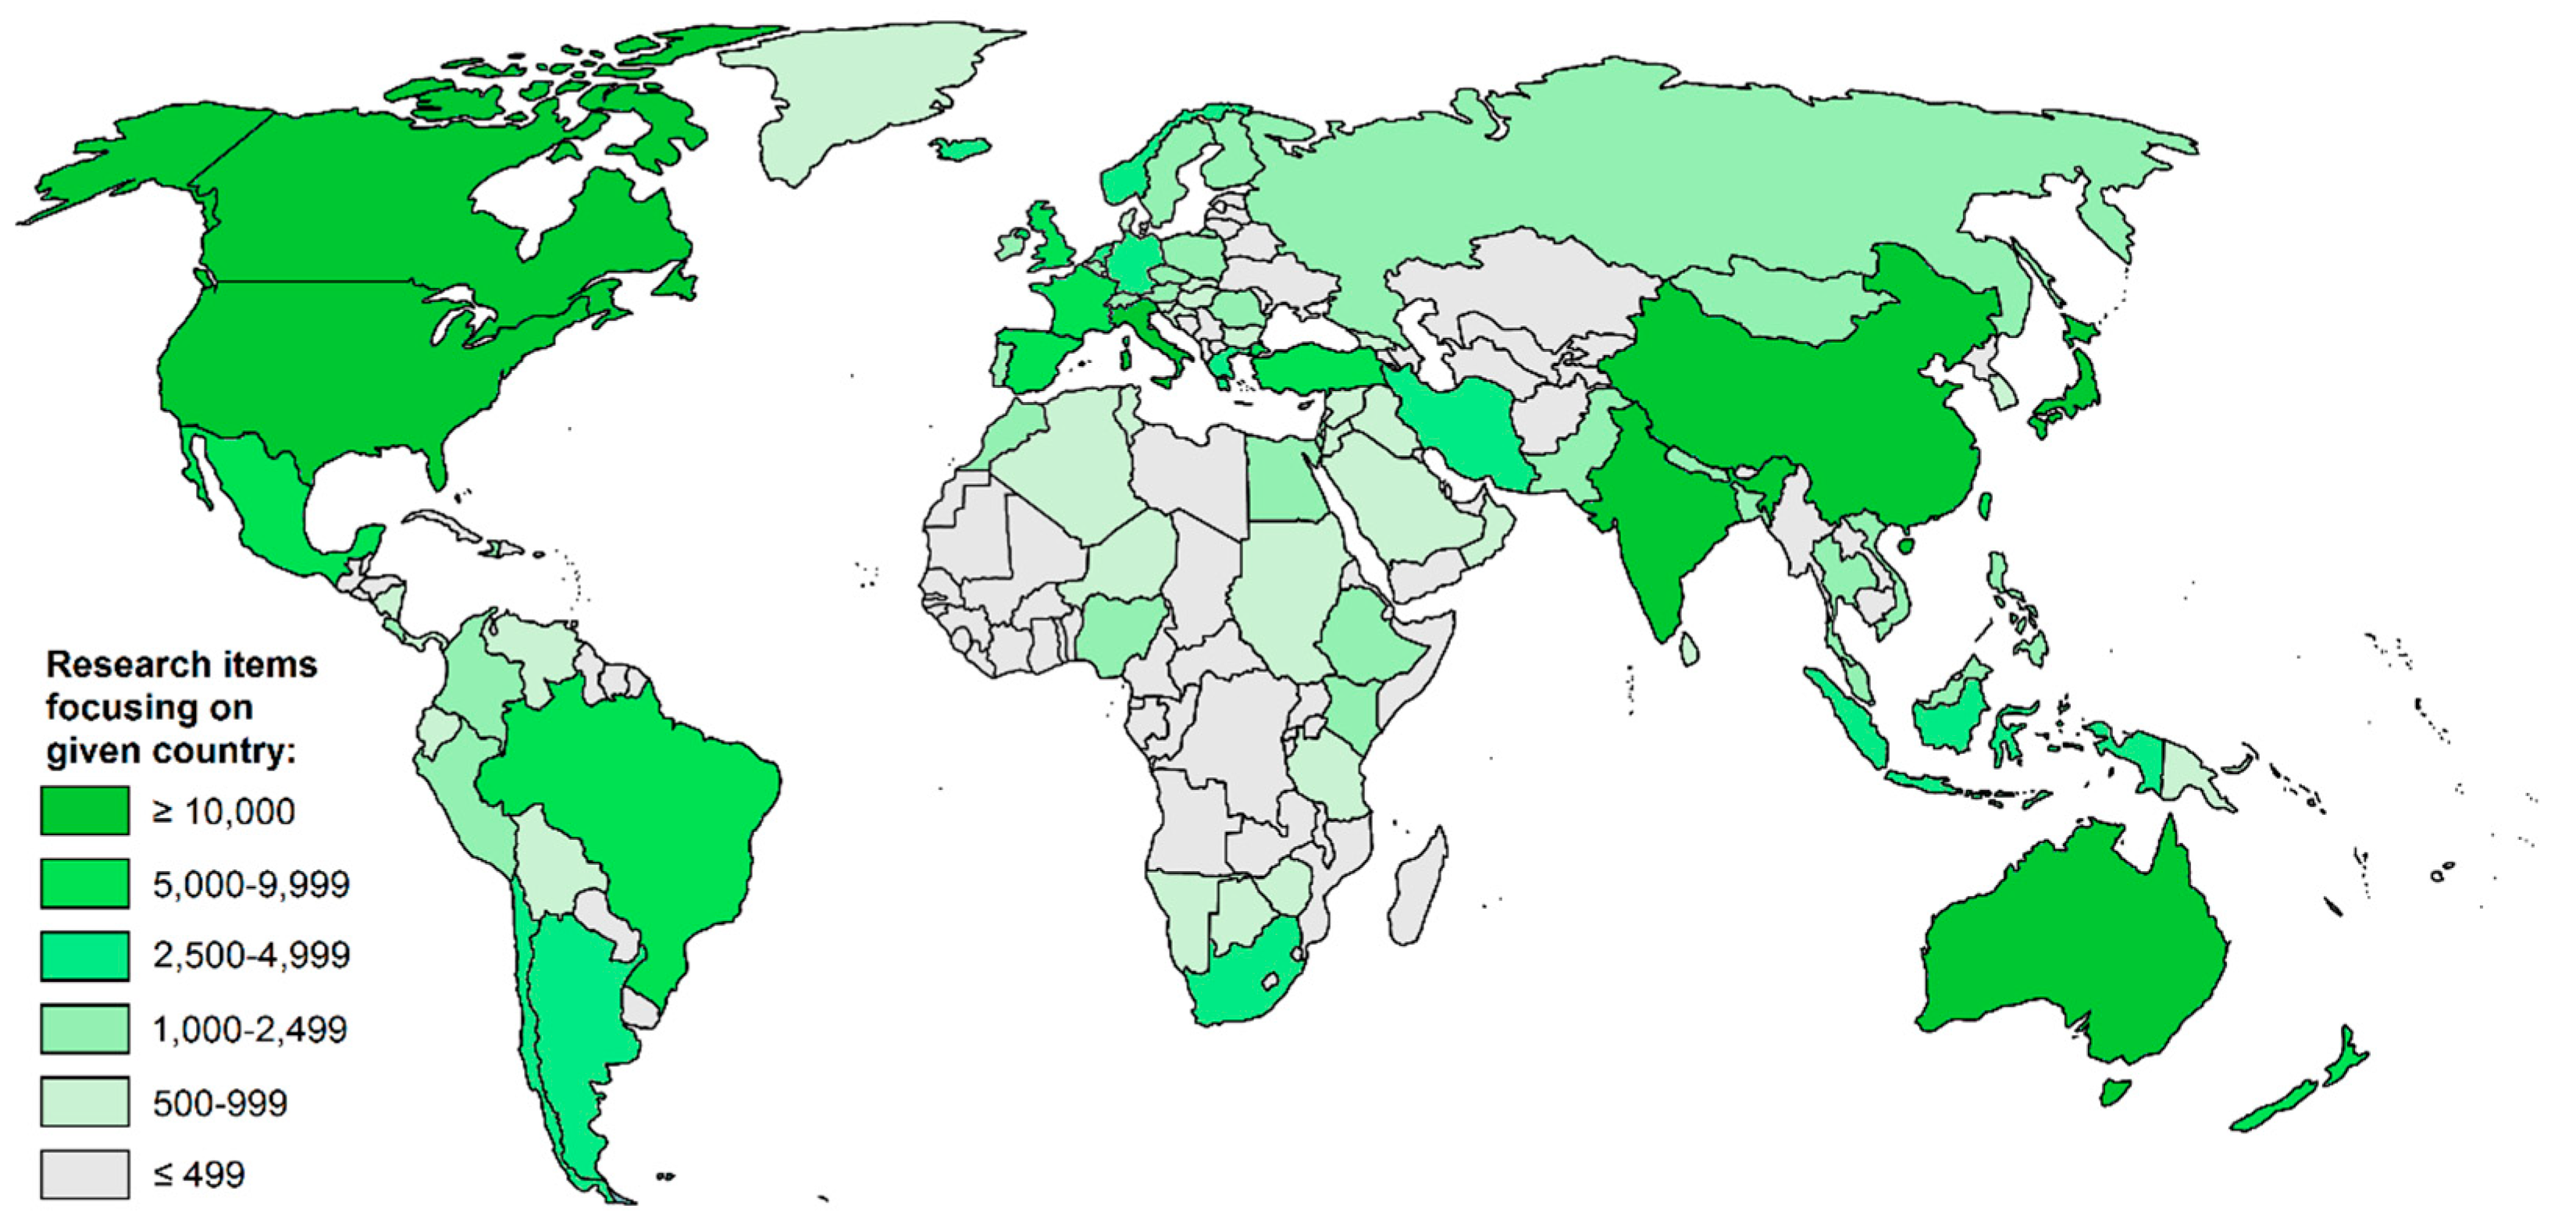
  • The analysis of geographical focus reveals hotspots of natural hazards research (USA, China, Japan, Australia, Canada, Italy, India; > 10,000 research items focusing on each country), as well as hotspots of a limited amount of research on natural hazards in Africa and Central Asia.
  • Research on heat waves and volcanic activity obtained the highest average number of citations per research item (24.8 and 23.9 citations/item), while research on tornadoes and tsunamis yielded the lowest (9.9 and 11.6 citations/item).
  • The exponentially increasing amount of published research items does not correspond with the number of events reported, or fatalities or losses claimed (linear increasing trend; based on two global databases of natural disasters), rather indicating a changing paradigm in publishing in natural hazard science and/or possible other motivation for research on natural hazards (changing policies, funding priorities).
  • The share of research on climatic/hydro-meteorological hazards and geological/geomorphic hazards roughly corresponds to the share on the total number of fatalities claimed, but not damages caused globally (dominance of climatic/hydro-meteorological disasters).
  • Major disasters such as the 2004 Indian Ocean tsunami or 2008 Wenchuan earthquake are capable of imprinting into the global statistics of research on individual types of natural hazards.

Author Contributions

This study was designed and executed by Adam Emmer.

Funding

This work was supported by the Ministry of Education, Youth and Sports of the Czech Republic within the National Sustainability Programme I (NPU I), grant number LO1415.

Acknowledgments

The author thanks two anonymous reviewers for their constructive comments and valuable suggestions which helped to improve this work.

Conflicts of Interest

The author declares no conflict of interest.

References

  1. MunichRE NatCatSERVICE. Available online: https://natcatservice.munichre.com/ (accessed on 18 October 2018).
  2. Hewitt, K. Environmental disasters in social context: Toward a preventive and precautionary approach. Nat. Hazards 2013, 66, 3–14. [Google Scholar] [CrossRef]
  3. Intergovernmental Panel on Climate Change (IPCC). Contribution of Working Group I to the Fifth Assessment Report of the Intergovernmental Panel on Climate Change; Cambridge University Press: Cambridge, UK; New York, NY, USA, 2013; 1522p. [Google Scholar]
  4. Birkmann, J. Measuring Vulnerability to Natural Hazards; United Nations University Press: New Delhi, India, 2006; 524p. [Google Scholar]
  5. SwissRE Sigma Explorer. Available online: http://www.sigma-explorer.com/ (accessed on 18 October 2018).
  6. DesInventar—Inventory System of the Effects of Disasters. Available online: https://www.desinventar.org/ (accessed on 18 October 2018).
  7. Chiu, W.T.; Ho, Y.S. Bibliometric analysis of tsunami research. Scientometrics 2007, 73, 3–17. [Google Scholar] [CrossRef]
  8. Sagar, A.; Kademani, B.S.; Garg, R.G.; Kumar, V. Scientometric mapping of Tsunami publications: A citation based study. Malays. J. Libr. Inf. Sci. 2010, 15, 23–40. [Google Scholar]
  9. Liu, X.J.; Zhan, F.B.; Hong, S.; Niu, B.B.; Liu, Y.L. A bibliometric study of earthquake research: 1900–2010. Scientometrics 2012, 92, 747–765. [Google Scholar] [CrossRef]
  10. Qian, G. Scientometrics Analysis on the Research Field of Wenchuan Earthquake. Disaster Adv. 2012, 5, 704–707. [Google Scholar]
  11. Wu, X.L.; Chen, X.Y.; Zhan, F.B.; Hong, S. Global research trends in landslides during 1991–2014: A bibliometric analysis. Landslides 2014, 12, 1215–1226. [Google Scholar] [CrossRef]
  12. Mikoš, M. The bibliometric impact of books published by the International Consortium on Landslides. Landslides 2018, 15, 1459–1482. [Google Scholar] [CrossRef]
  13. Emmer, A. GLOFs in the WOS: Bibliometrics, geographies and global trends of research on glacial lake outburst floods (Web of Science, 1979–2016). Nat. Hazards Earth Syst. Sci. 2018, 18, 813–827. [Google Scholar] [CrossRef]
  14. Clarivate Analytics Web of Science. Available online: www.webofknowledge.com (accessed on 18 October 2018).
  15. Burton, I.; Kates, W.R. The Perception of Natural Hazards in Resource Management. Nat. Resour. J. 1964, 3, 412–441. [Google Scholar]
  16. Wisner, B.; Gaillard, J.C.; Kelman, I. The Routledge Handbook of Hazards and Disaster Risk Reduction; Routledge, Taylor and Francis Group: London, UK; New York, NY, USA, 2012; 875p. [Google Scholar]
  17. Gill, J.C.; Malamud, B.D. Reviewing and visualizing the interactions of natural hazards. Rev. Geophys. 2014, 5, 680–722. [Google Scholar] [CrossRef]
  18. Hsieh, H.F.; Shannon, S.E. Three Approaches to Qualitative Content Analysis. Qual. Health Res. 2005, 15, 1277–1288. [Google Scholar] [CrossRef] [PubMed]
  19. Van Eck, N.J.; Waltman, J. Software survey: VOSviewer, a computer program for bibliometric mapping. Scientometrics 2010, 84, 523–538. [Google Scholar] [CrossRef] [PubMed]
  20. Waltman, L. A review of the literature on citation impact indicators. J. Infometrics 2016, 10, 365–391. [Google Scholar] [CrossRef] [Green Version]
  21. Hirsch, J.E. An index to quantify an individual’s scientific research output. Proc. Natl. Acad. Sci. USA 2005, 102, 16569–16572. [Google Scholar] [CrossRef] [PubMed] [Green Version]
  22. Kron, W.; Steuer, M.; Low, P.; Wirtz, A. How to deal properly with a natural catastrophe database—Analysis of flood losses. Nat. Hazards Earth Syst. Sci. 2012, 12, 535–550. [Google Scholar] [CrossRef]
  23. Wirtz, A.; Kron, W.; Low, P.; Steuer, M. The need for data: Natural disasters and the challenges of database management. Nat. Hazards 2014, 70, 135–157. [Google Scholar] [CrossRef]
  24. World Population Review. Available online: http://worldpopulationreview.com/countries/ (accessed on 18 October 2018).
  25. United Nations Statistics Division, Environmental Indicators—Total Area. Available online: https://unstats.un.org/unsd/environment/totalarea.htm (accessed on 18 October 2018).
  26. The World Bank Data—GDP Stats. Available online: https://data.worldbank.org/indicator/NY.GDP.MKTP.CD?year_high_desc=true (accessed on 18 October 2018).
  27. Wuchty, S.; Jones, B.F.; Uzzi, B. The increasing dominance of teams in production of knowledge. Science 2007, 316, 1036–1039. [Google Scholar] [CrossRef] [PubMed]
  28. Sandstrom, U.; Van den Besselaar, P. Quantity and/or Quality? The Importance of Publishing Many Papers. PLoS ONE 2016, 11, e0166149. [Google Scholar] [CrossRef] [PubMed]
  29. Birkmann, J.; Buckle, P.; Jaeger, J.; Pelling, M.; Setiadi, N.; Garschagen, M.; Fernando, N.; Kropp, J. Extreme events and disasters: A window of opportunity for change? Analysis of organizational, institutional and political changes, formal and informal responses after mega-disasters. Nat. Hazards 2010, 55, 637–655. [Google Scholar] [CrossRef]
  30. Gall, M.; Nguyen, K.H.; Cutter, S.L. Integrated research on disaster risk: Is it really integrated? Int. J. Disaster Risk Reduct. 2015, 12, 255–267. [Google Scholar] [CrossRef] [Green Version]
  31. Roy, N.; Thakkar, P.; Shah, H. Developing-World Disaster Research: Present Evidence and Future Priorities. Disaster Med. Public Health Prep. 2011, 5, 112–116. [Google Scholar] [CrossRef] [PubMed]
  32. Ebi, K.L.; Semenza, J.C.; Rocklov, J. Current medical research funding and frameworks are insufficient to address the health risks of global environmental change. Environ. Health 2016, 15, 108. [Google Scholar] [CrossRef] [PubMed]
Figure 1. The share of major types of natural hazards in different time periods. The numbers show the total number of research items and the percentages show the share between research items dealing with the geological/geomorphic natural hazards and research items dealing with the climatic/hydro-meteorological natural hazards.
Geosciences 08 00382 g001
Figure 2. Geographical focus of research on natural hazards.
Geosciences 08 00382 g002
Figure 3. The share of major types of natural hazards among the top 10 research countries. The numbers show the total number of research items and the percentages show the share between research items dealing with the geological/geomorphic natural hazards and research items dealing with the climatic/hydro-meteorological natural hazards.
Geosciences 08 00382 g003
Figure 4. Cooperation between top 25 research countries. Part (A) shows absolute number of joint research items between two countries (varying from 9 to 8642); part (B) shows relative share of joint research items between two countries on the total number of research items of these two countries (varying from 0.06% to 4.5%). Two apparent clusters are distinguished (see the text).
Geosciences 08 00382 g004
Figure 5. Research on natural hazards and the occurrence of natural hazards in 1980–2017 (number of events based on [1]).
Geosciences 08 00382 g005
Figure 6. Research on geological/geomorphic and climatic/hydro-meteorological natural hazards and fatalities caused (fatalities estimations based on [1,5]).
Geosciences 08 00382 g006
Figure 7. Research on geological/geomorphic and climatic/hydro-meteorological natural hazards and losses caused (losses estimations based on [1,5]).
Geosciences 08 00382 g007
Table 1. Classification of natural hazards used in this study (adapted from [15,16]), WOS search query chains, and the number of research items found (June 2018). Note that numbers of research items found for individual categories (climatic/hydro-meteorological; geological/geomorphic), as well as for the total, do not correspond with the sum of research items found for individual types of natural hazards, because some items are focusing on two or more types of natural hazards simultaneously (multi-hazard items, see Section 3.1.2).
Categories (Bold) and Types of Natural HazardsWOS Advanced Search Query Chain #Research Items Found (1900–2017)
Climatic/hydro-meteorologicalTS = ((flood *) OR (drought * OR (water scarcity)) OR (hurricane * OR typhoon * OR cyclone *) OR (“sea level rise” OR “rising sea level”) OR (wildfire *) OR (desertification) OR (tornado *) OR (“heat wave *” OR heatwave *) OR (dust AND storm *) OR (TS = ((storm * OR (rainfall AND (extreme OR heavy)))) NOT TS = dust)342,250
- Flood (FL)TS = (flood *)123,227
- Storm (ST)TS = (storm * OR (rainfall AND (extreme OR heavy))) NOT TS = (dust)91,298
- Drought (DR)TS = (drought * OR (water scarcity))83,214
- Hurricane (HU)TS = (hurricane * OR typhoon * OR cyclone *)42,097
- Sea level rise (SR)TS = (“sea level rise” OR “rising sea level”)12,725
- Wildfire (WF)TS = (wildfire *)11,086
- Desertification (DE)TS = (desertification)5763
- Heat wave (HW)TS = (“heat wave *” OR heatwave *)4903
- Tornado (TO)TS = (tornado *)4384
- Dust storm (DS)TS = (dust AND storm *)4264
Geological/geomorphicTS = ((earthquake *) OR ((slope AND movement *) OR landslide * OR avalanche * OR rockfall * OR rockslide * OR “debris flow *”) OR (erosion * AND (soil * OR rock * OR water OR wind)) OR (volcan * AND (activ * OR eruption * OR explos *)) OR (subsidence *) OR (tsunami *))273,459
- Earthquakes (EQ)TS = (earthquake *)109,123
- Slope movements (SM)TS = ((slope AND movement *) OR landslide * OR avalanche * OR rockfall * OR rockslide * OR “debris flow *”)57,846
- Erosion (ER)TS = (erosion * AND (soil * OR rock * OR water OR wind))57,269
- Volcanic activity (VO)TS = (volcan * AND (activ * OR eruption * OR explos *))40,469
- Subsidence (SU)TS = (subsidence *)21,777
- Tsunami (TS)TS = (tsunami *)13,478
TOTALTS = ((earthquake *) OR ((slope AND movement *) OR landslide * OR avalanche * OR rockfall * OR rockslide * OR “debris flow *”) OR (erosion * AND (soil * OR rock * OR water OR wind)) OR (volcan * AND (activ * OR eruption * OR explos *)) OR (subsidence *) OR (tsunami *) OR (flood *) OR (drought * OR (water scarcity)) OR (hurricane * OR typhoon * OR cyclone *) OR (“sea level rise” OR “rising sea level”) OR (wildfire *) OR (desertification) OR (tornado *) OR (“heat wave *” OR heatwave *) OR (dust AND storm *)) OR (TS = ((storm * OR (rainfall AND (extreme OR heavy)))) NOT TS = dust)588,424
# TS = Topic; OR, AND, NOT are Boolean operators; * covers all words with given root (e.g., “flood*” covers “flood”, “floods”, “flooding”, “flooded”, …).
Table 2. Basic characteristics of two databases of natural disasters used in this study.
Database of Catastrophes
MunichRE NatCatSERVICESwissRE Sigma Explorer
Geographical coverageglobalglobal
Time span1980–20171970–2018
No. of events17,320 relevant
(935 catastrophes)
5505
(5421 for period 1970–2017)
Data usedNumber of events, losses and fatalities by natural hazard types and by yearsNumber of events (cumulative), losses and fatalities by natural hazard types and by years
Linkhttps://natcatservice.munichre.com/http://www.sigma-explorer.com/
Reference[1][5]
Table 3. Number of multi-hazard research items (see the text for explanation) between individual types of natural hazards (classes: ≤ 999; 1000–2499; 2500–4999; ≥ 5000) and the share of multi-hazard research items on the total number of research items found for the two types of natural hazards involved (classes: ≤ 0.9%; 1.0–2.4%; 2.5–4.9%; ≥ 5.0%). Increased number (share) of research items between two types of natural hazards is indicated by a darker color. The last row shows the share of multi-hazard research items within individual types of natural hazard. See Table 1 for the explanation of abbreviations of natural hazard types.
Number of Multi-Hazard Research Items between Two Types of Natural Hazards
XEQSMERVOGOFLSTDRHUCO
Share of multi-hazard research items between two types of natural hazards [%]EQX529972441897935265714032311742581
SM3.3X3035195918981982410170220329
ER0.42.7X1307227634512501302873549
VO2.92.01.4X13144829433712455763104
GO5.82.51.42.6X2631159330111221490
FL1.21.92.71.21.7X10,827649238653725
ST0.71.62.90.31.25.2X330710,1048023
DR0.10.20.90.10.33.21.9X7922675
HU1.20.90.60.31.52.47.90.6X1736
CO0.40.53.20.42.02.36.12.22.1X
Share of multi-hazard research items [%]17.417.025.238.142.524.335.614.535.437.5
Table 4. Top 10 research countries for individual types of natural hazard (see Table 1 for abbreviations).
EQSMERVOGOFLSTDRHUCOTOTAL
1. Geosciences 08 00382 i001 Geosciences 08 00382 i001 Geosciences 08 00382 i001 Geosciences 08 00382 i001 Geosciences 08 00382 i001 Geosciences 08 00382 i001 Geosciences 08 00382 i001 Geosciences 08 00382 i001 Geosciences 08 00382 i001 Geosciences 08 00382 i001 Geosciences 08 00382 i001
2. Geosciences 08 00382 i002 Geosciences 08 00382 i002 Geosciences 08 00382 i002 Geosciences 08 00382 i004 Geosciences 08 00382 i002 Geosciences 08 00382 i002 Geosciences 08 00382 i002 Geosciences 08 00382 i002 Geosciences 08 00382 i002 Geosciences 08 00382 i002 Geosciences 08 00382 i002
3. Geosciences 08 00382 i003 Geosciences 08 00382 i004 Geosciences 08 00382 i006 Geosciences 08 00382 i006 Geosciences 08 00382 i003 Geosciences 08 00382 i006 Geosciences 08 00382 i006 Geosciences 08 00382 i011 Geosciences 08 00382 i011 Geosciences 08 00382 i006 Geosciences 08 00382 i006
4. Geosciences 08 00382 i004 Geosciences 08 00382 i003 Geosciences 08 00382 i008 Geosciences 08 00382 i005 Geosciences 08 00382 i006 Geosciences 08 00382 i008 Geosciences 08 00382 i011 Geosciences 08 00382 i008 Geosciences 08 00382 i003 Geosciences 08 00382 i011 Geosciences 08 00382 i003
5. Geosciences 08 00382 i005 Geosciences 08 00382 i005 Geosciences 08 00382 i005 Geosciences 08 00382 i008 Geosciences 08 00382 i005 Geosciences 08 00382 i011 Geosciences 08 00382 i009 Geosciences 08 00382 i012 Geosciences 08 00382 i006 Geosciences 08 00382 i008 Geosciences 08 00382 i008
6. Geosciences 08 00382 i006 Geosciences 08 00382 i006 Geosciences 08 00382 i011 Geosciences 08 00382 i003 Geosciences 08 00382 i008 Geosciences 08 00382 i009 Geosciences 08 00382 i008 Geosciences 08 00382 i007 Geosciences 08 00382 i013 Geosciences 08 00382 i009 Geosciences 08 00382 i004
7. Geosciences 08 00382 i007 Geosciences 08 00382 i008 Geosciences 08 00382 i009 Geosciences 08 00382 i002 Geosciences 08 00382 i004 Geosciences 08 00382 i005 Geosciences 08 00382 i005 Geosciences 08 00382 i006 Geosciences 08 00382 i008 Geosciences 08 00382 i012 Geosciences 08 00382 i005
8. Geosciences 08 00382 i008 Geosciences 08 00382 i009 Geosciences 08 00382 i012 Geosciences 08 00382 i009 Geosciences 08 00382 i009 Geosciences 08 00382 i007 Geosciences 08 00382 i003 Geosciences 08 00382 i005 Geosciences 08 00382 i009 Geosciences 08 00382 i005 Geosciences 08 00382 i011
9. Geosciences 08 00382 i009 Geosciences 08 00382 i014 Geosciences 08 00382 i004 Geosciences 08 00382 i010 Geosciences 08 00382 i011 Geosciences 08 00382 i004 Geosciences 08 00382 i004 Geosciences 08 00382 i009 Geosciences 08 00382 i007 Geosciences 08 00382 i004 Geosciences 08 00382 i009
10. Geosciences 08 00382 i010 Geosciences 08 00382 i012 Geosciences 08 00382 i015 Geosciences 08 00382 i011 Geosciences 08 00382 i007 Geosciences 08 00382 i003 Geosciences 08 00382 i007 Geosciences 08 00382 i004 Geosciences 08 00382 i005 Geosciences 08 00382 i015 Geosciences 08 00382 i007
Table 5. Total number of citations obtained by research items of individual types of natural hazards, average citations per item, H index, and i100 index (in August 2018).
Categories and Types of Natural HazardsResearch Items Found (1900–2017)Citations (Total)
(1900–2017)
Citations/ItemH Index
(8/2018)
i100 Index
(8/2018)
Climatic/hydro-meteorological342,2505,884,96717.249410,603
- Flood (FL)123,2271,868,55115.13133161
- Storm (ST)91,2981,501,88016.53012658
- Drought (DR)83,2141,719,38520.73543478
- Hurricane (HU)42,097621,61114.82241058
- Sea level rise (SR)12,725290,77122.9194595
- Wildfire (WF)11,086222,71720.1160417
- Desertification (DE)5763102,17717.7131209
- Heatwave (HW)4903108,65424.8141247
- Tornado (TO)438448,6239.98767
- Dust storm (DS)4264100,62123.6128194
Geological/geomorphic273,4594,573,73216.74147684
- Earthquakes (EQ)109,1231,530,71814.02942587
- Slope movements (SM)57,846866,88815.02431420
- Erosion (ER)57,2691,081,60818.92641824
- Volcanic activity (VO)40,469968,05423.92551794
- Subsidence (SU)21,777413,47118.9184659
- Tsunami (TS)13,478156,26811.6128228
TOTAL588,4249,996,57917.056117,414

