Ground-Based Measurements of the 2014–2015 Holuhraun Volcanic Cloud (Iceland)

 , ,
, ,  ,
, 
 and
and
Abstract
1. Introduction
2. Materials and Methods
2.1. DOAS
2.1.1. ScanDOAS
2.1.2. Down-Wind MobileDOAS and In Situ SO2 Traverses
2.2. Icelandic Environmental Agency Network
2.3. Open-Path Fourier Transform IR
2.4. MultiGAS
2.5. Filter Pack
2.6. OPC
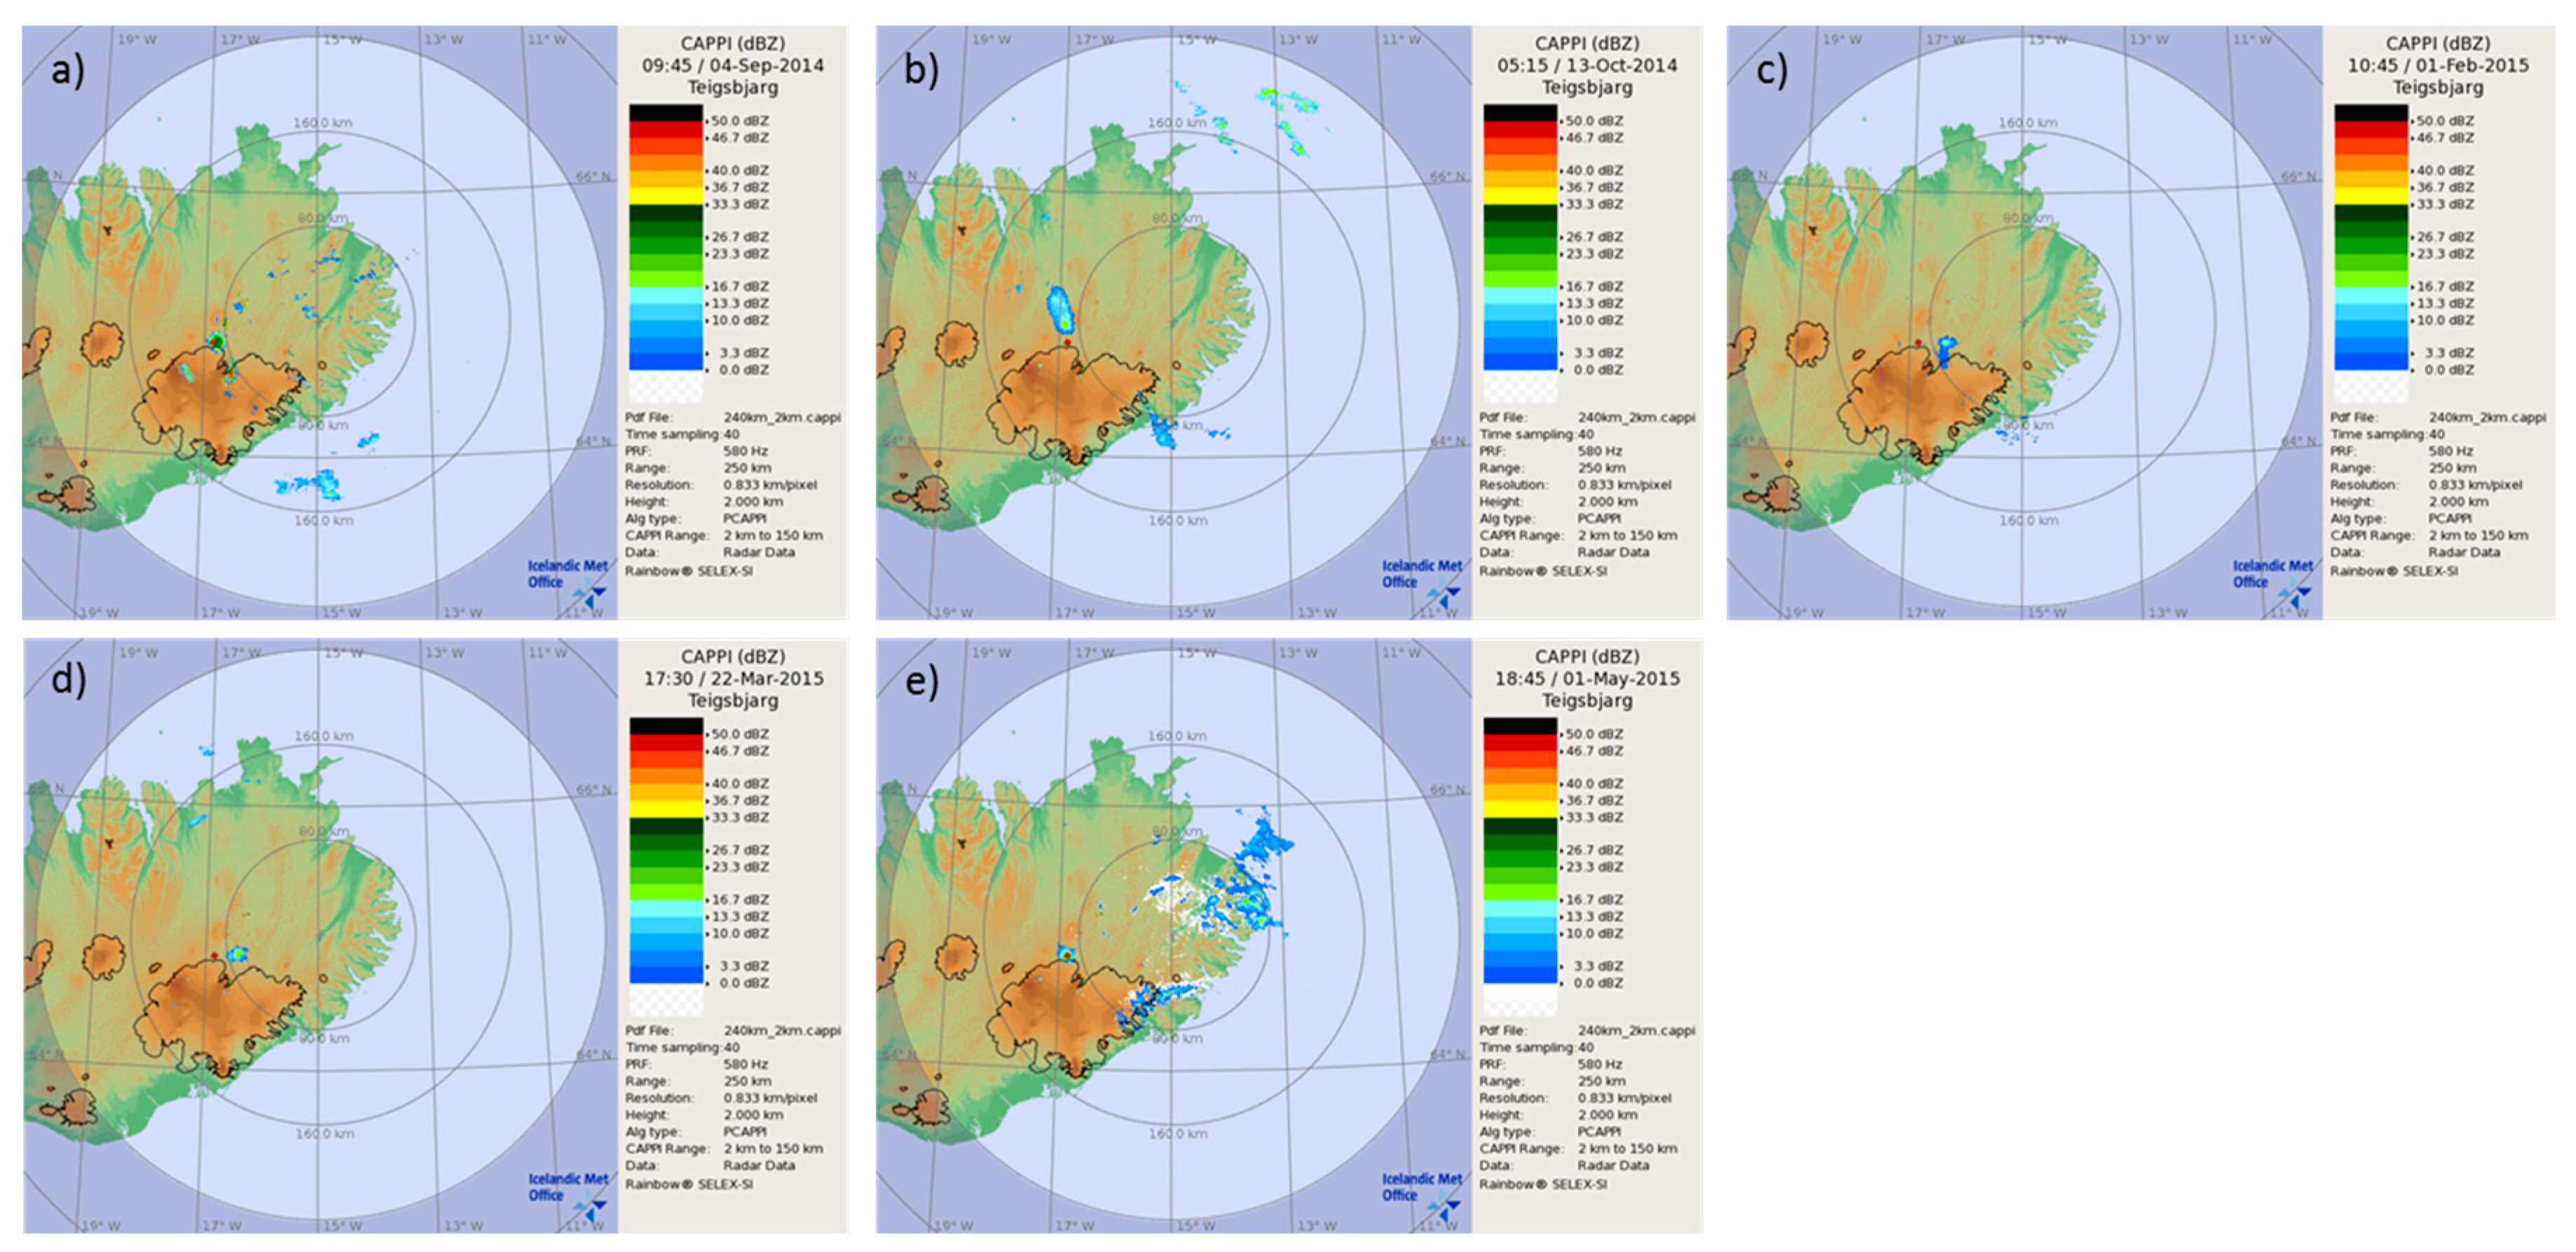
2.7. Weather Radar
2.8. Web Cam
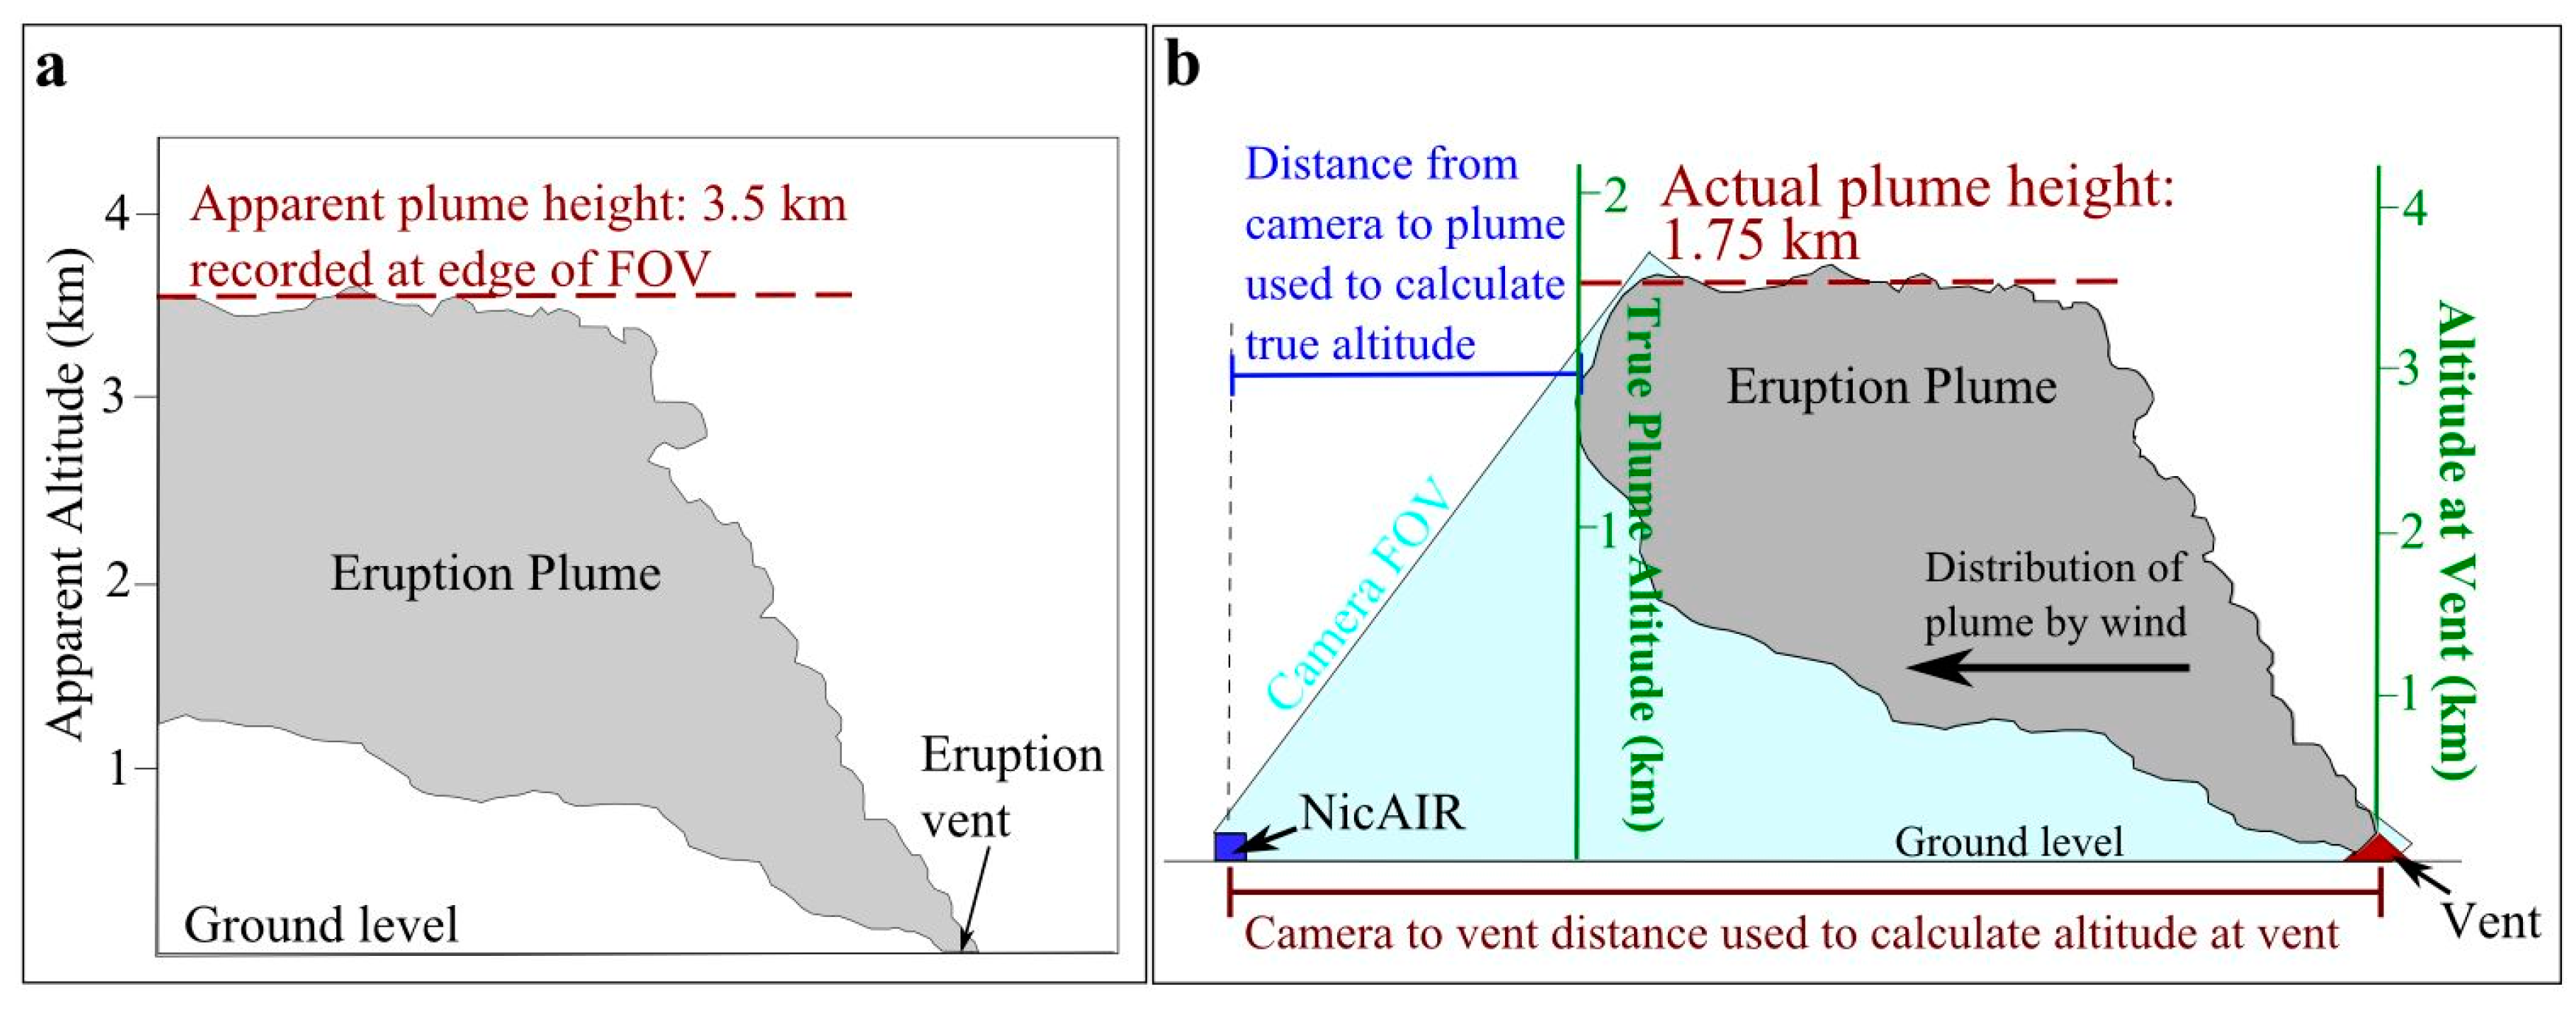
2.9. NicAIR II
2.10. Observations from Ground and Aircraft
3. Results
3.1. Eruption Cloud Composition
3.1.1. Gases
3.1.2. Particles
3.2. Cloud Height
4. Discussion
Acknowledgments
Author Contributions
Conflicts of Interest
References
- Gíslason, S.R.; Stefánsdóttir, G.; Pfeffer, M.A.; Barsotti, S.; Jóhannsson, Þ.; Galeczka, I.; Bali, E.; Sigmarsson, O.; Stefánsson, A.; Keller, N.S.; et al. Environmental pressure from the 2014–15 eruption of Bárðarbunga volcano, Iceland. Geochem. Perspect. Lett. 2015, 84–93. [Google Scholar] [CrossRef]
- Bárðarbunga. Alternative Name: Veiðivötn. Available online: http://www.icelandicvolcanoes.is/?volcano=BAR (accessed on 18 January 2018).
- Sigmundsson, F.; Hooper, A.; Hreinsdóttir, S.; Vogfjörd, K.S.; Ófeigsson, B.G.; Heimisson, E.R.; Dumont, S.; Parks, M.; Spaans, K.; Gudmundsson, G.B.; et al. Segmented lateral dyke growth in a rifting event at Bárðarbunga volcanic system, Iceland. Nature 2014, 517, 191–195. [Google Scholar] [CrossRef] [PubMed]
- Hartley, M.E.; Thordarson, T. The 1874–1876 volcano-tectonic episode at Askja, North Iceland: Lateral flow revisited: Askja 1874–1876 Volcano-Tectonic Episode. Geochem. Geophys. Geosyst. 2013, 14, 2286–2309. [Google Scholar] [CrossRef]
- Ilyinskaya, E.; Schmidt, A.; Mather, T.A.; Pope, F.D.; Witham, C.; Baxter, P.; Jóhannsson, T.; Pfeffer, M.A.; Barsotti, S.; Singh, A.; et al. Understanding the environmental impacts of large fissure eruptions: Aerosol and gas emissions from the 2014–2015 Holuhraun eruption (Iceland). Earth Planet. Sci. Lett. 2017, 472, 309–322. [Google Scholar] [CrossRef]
- The Scientific Advisory Board of the Icelandic Civil Protection. Volcanic Activity in the Bárðarbunga system. Available online: http://en.vedur.is/media/jar/Factsheet_Bardarbunga_20150127.pdf (accessed on 10 January 2018).
- Arnalds, O.; Dagsson-Waldhauserova, P.; Olafsson, H. The Icelandic volcanic aeolian environment: Processes and impacts—A review. Aeolian Res. 2016, 20, 176–195. [Google Scholar] [CrossRef]
- Platt, U.; Stutz, J. Differential Optical Absorption Spectroscopy: Principles and Applications, 1st ed.; Springer: Berlin, Germany, 2008; ISBN 978-3-540-21193-8. [Google Scholar]
- Galle, B.; Pfeffer, M.A.; Arellano, S.; Bergsson, B.; Conde, V.; Barsotti, S.; Stefánsdóttir, G.; Ingvarsson, Þ.; Bergsson, B.; Weber, K. Measurements of the gas emission from Holuhraun volcanic fissure eruption on Iceland, using Scanning DOAS instruments 2016. In Proceedings of the European Geosciences Union General Assembly 2016, Vienna, Austria, 17–22 April 2016; p. 13892. [Google Scholar]
- Galle, B.; Johansson, M.; Rivera, C.; Zhang, Y.; Kihlman, M.; Kern, C.; Lehmann, T.; Platt, U.; Arellano, S.; Hidalgo, S. Network for Observation of Volcanic and Atmospheric Change (NOVAC)—A global network for volcanic gas monitoring: Network layout and instrument description. J. Geophys. Res. 2010, 115. [Google Scholar] [CrossRef]
- HARMONIE—Numerical Weather Prediction Model. Available online: http://en.vedur.is/weather/articles/nr/3232 (accessed on 10 January 2018).
- Mori, T.; Mori, T.; Kazahaya, K.; Ohwada, M.; Hirabayashi, J.; Yoshikawa, S. Effect of UV scattering on SO2 emission rate measurements. Geophys. Res. Lett. 2006, 33. [Google Scholar] [CrossRef]
- Johansson, M. Application of Passive DOAS for Studies of Megacity Air Pollution and Volcanic Gas Emissions. Ph.D. Thesis, Chalmers University of Technology, Gothenburg, Sweden, 2009. [Google Scholar]
- Simmons, I.C.; Pfeffer, M.A.; Calder, E.S.; Galle, B.; Arellano, S.; Coppola, D.; Barsotti, S. Extended SO2 outgassing from the 2014–2015 Holuhraun lava flow field, Iceland. Bull. Volcanol. 2017, 79. [Google Scholar] [CrossRef]
- Galle, B.; Oppenheimer, C.; Geyer, A.; McGonigle, A.J.S.; Edmonds, M.; Horrocks, L. A miniaturised ultraviolet spectrometer for remote sensing of SO2 fluxes: A new tool for volcano surveillance. J. Volcanol. Geotherm. Res. 2003, 119, 241–254. [Google Scholar] [CrossRef]
- Johansson, M.; Galle, B.; Zhang, Y.; Rivera, C.; Chen, D.; Wyser, K. The dual-beam mini-DOAS technique—Measurements of volcanic gas emission, plume height and plume speed with a single instrument. Bull. Volcanol. 2009, 71, 747–751. [Google Scholar] [CrossRef]
- Tsanev, V.I. A Collection of JScripts for Retrieval of Gas Column Amounts Using DOAS Methodology. Available online: https://www.geog.cam.ac.uk/research/projects/doasretrieval/ (accessed on 10 January 2018).
- Avoscan. Available online: https://code.google.com/archive/p/avoscan/ (accessed on 18 January 2018).
- Kern, C.; Deutschmann, T.; Vogel, L.; Wöhrbach, M.; Wagner, T.; Platt, U. Radiative transfer corrections for accurate spectroscopic measurements of volcanic gas emissions. Bull. Volcanol. 2010, 72, 233–247. [Google Scholar] [CrossRef]
- La Spina, A.; Burton, M.; Harig, R.; Mure, F.; Rusch, P.; Jordan, M.; Caltabiano, T. New insights into volcanic processes at Stromboli from Cerberus, a remote-controlled open-path FTIR scanner system. J. Volcanol. Geotherm. Res. 2013, 249, 66–76. [Google Scholar] [CrossRef]
- Burton, M.; Allard, P.; Mure, F.; La Spina, A. Magmatic gas composition reveals the source depth of slug-driven strombolian explosive activity. Science 2007, 317, 227–230. [Google Scholar] [CrossRef] [PubMed]
- La Spina, A.; Burton, M.; Salerno, G.G. Unravelling the processes controlling gas emissions from the central and northeast craters of Mt. Etna. J. Volcanol. Geotherm. Res. 2010, 198, 368–376. [Google Scholar] [CrossRef]
- Burton, M.; Ilyinskaya, E.; Hartley, M.; La Spina, A.; Salerno, G.G.; Bali, E.; Barsotti, S.; Bergsson, B.; Pfeffer, M.A.; Kaasalainen, H.; et al. Mantle source controls gas emissions and impact of Icelandic basaltic eruptions. Nat. Commun. 2017. submitted for publication. [Google Scholar]
- Allard, P.; Burton, M.; Oskarsson, N.; Michel, A.; Polacci, M. Magmatic gas composition and fluxes during the 2010 Eyjafjallajökull explosive eruption: implications for degassing magma volumes and volatile sources 2011. In Proceedings of the European Geosciences Union General Assembly 2011, Vienna, Austria, 3–8 April 2011. [Google Scholar]
- Gudmundsson, M.T.; Jónsdóttir, K.; Hooper, A.; Holohan, E.P.; Halldórsson, S.A.; Ófeigsson, B.G.; Cesca, S.; Vogfjörd, K.S.; Sigmundsson, F.; Högnadóttir, T.; et al. Gradual caldera collapse at Bárdarbunga volcano, Iceland, regulated by lateral magma outflow. Science 2016, 353, aaf8988. [Google Scholar] [CrossRef] [PubMed]
- Aiuppa, A.; Bertagnini, A.; Métrich, N.; Moretti, R.; Di Muro, A.; Liuzzo, M.; Tamburello, G. A model of degassing for Stromboli volcano. Earth Planet. Sci. Lett. 2010, 295, 195–204. [Google Scholar] [CrossRef]
- Aiuppa, A.; Federico, C.; Giudice, G.; Giuffrida, G.; Guida, R.; Gurrieri, S.; Liuzzo, M.; Moretti, R.; Papale, P. The 2007 eruption of Stromboli volcano: Insights from real-time measurement of the volcanic gas plume CO2/SO2 ratio. J. Volcanol. Geotherm. Res. 2009, 182, 221–230. [Google Scholar] [CrossRef]
- Ilyinskaya, E.; Aiuppa, A.; Bergsson, B.; Di Napoli, R.; Fridriksson, T.; Óladóttir, A.A.; Óskarsson, F.; Grassa, F.; Pfeffer, M.; Lechner, K.; et al. Degassing regime of Hekla volcano 2012–2013. Geochim. Cosmochim. Acta 2015, 159, 80–99. [Google Scholar] [CrossRef]
- Tamburello, G. Ratiocalc: Software for processing data from multicomponent volcanic gas analyzers. Comput. Geosci. 2015, 82, 63–67. [Google Scholar] [CrossRef]
- Stefánsson, A.; Stefánsdóttir, G.; Keller, N.S.; Barsotti, S.; Sigurdsson, Á.; Thorláksdóttir, S.B.; Pfeffer, M.A.; Eiríksdóttir, E.S.; Jónasdóttir, E.B.; von Löwis, S.; et al. Major impact of volcanic gases on the chemical composition of precipitation in Iceland during the 2014–2015 Holuhraun eruption: impact of volcanic gas on precipitation. J. Geophys. Res. Atmos. 2017, 122, 1971–1982. [Google Scholar] [CrossRef]
- Gauthier, P.-J.; Sigmarsson, O.; Gouhier, M.; Haddadi, B.; Moune, S. Elevated gas flux and trace metal degassing from the 2014-2015 fissure eruption at the Bárðarbunga volcanic system, Iceland: Degassing at Holuhraun. J. Geophys. Res. Solid Earth 2016, 121, 1610–1630. [Google Scholar] [CrossRef]
- Vignelles, D.; Roberts, T.J.; Carboni, E.; Ilyinskaya, E.; Pfeffer, M.A.; Dagsson Waldhauserova, P.; Schmidt, A.; Berthet, G.; Jegou, F.; Renard, J.-B.; et al. Balloon-borne measurement of the aerosol size distribution from an Icelandic flood basalt eruption. Earth Planet. Sci. Lett. 2016, 453, 252–259. [Google Scholar] [CrossRef]
- De Michele, M.; Raucoules, D.; Arason, Þ. Volcanic Plume Elevation Model and its velocity derived from Landsat 8. Remote Sens. Environ. 2016, 176, 219–224. [Google Scholar] [CrossRef]
- Prata, A.J.; Bernardo, C. Retrieval of volcanic ash particle size, mass and optical depth from a ground-based thermal infrared camera. J. Volcanol. Geotherm. Res. 2009, 186, 91–107. [Google Scholar] [CrossRef]
- Prata, A.J.; Bernardo, C. Retrieval of sulfur dioxide from a ground-based thermal infrared imaging camera. Atmos. Meas. Tech. 2014, 7, 2807–2828. [Google Scholar] [CrossRef]
- Lopez, T.; Thomas, H.E.; Prata, A.J.; Amigo, A.; Fee, D.; Moriano, D. Volcanic plume characteristics determined using an infrared imaging camera. J. Volcanol. Geotherm. Res. 2015, 300, 148–166. [Google Scholar] [CrossRef]
- Lopez, T.; Fee, D.; Prata, F.; Dehn, J. Characterization and interpretation of volcanic activity at Karymsky Volcano, Kamchatka, Russia, using observations of infrasound, volcanic emissions, and thermal imagery: Characterization of volcanic activity. Geochem. Geophys. Geosyst. 2013, 14, 5106–5127. [Google Scholar] [CrossRef]
- Whitty, R.C.W. The Use of an Infrared Camera to Analyse a Volcanic Eruption Extraordinarily Rich in SO2 and H2O. Master’s Thesis, The University of Edinburgh, Edinburgh, 2016. [Google Scholar]
- Scollo, S.; Prestifilippo, M.; Pecora, E.; Corradini, S.; Merucci, L.; Spata, G.; Coltelli, M. Eruption column height estimation of the 2011–2013 Etna lava fountains. Ann. Geophys. 2014. [Google Scholar] [CrossRef]
- Arason, Þ.; Petersen, G.N.; Bjornsson, H. Observations of the altitude of the volcanic plume during the eruption of Eyjafjallajökull, April–May 2010. Earth Syst. Sci. Data 2011, 3, 9–17. [Google Scholar] [CrossRef]
- Björnsson, H.; Petersen, G.N.; Arason, Þ.; Jónasdóttir, E.B.; Ólafsson, H.; Pfeffer, M.A.; Barsotti, S.; Palmason, B.; von Löwis, S.; Dürig, T. Interaction Between the Eruption at Holuhraun and the Ambient Atmosphere 2015. In Proceedings of the European Geosciences Union General Assembly 2015, Vienna, Austria, 12–17 April 2015. [Google Scholar]
- Marzano, F.S.; Lamantea, M.; Montopoli, M.; Di Fabio, S.; Picciotti, E. The Eyjafjöll explosive volcanic eruption from a microwave weather radar perspective. Atmos. Chem. Phys. 2011, 11, 9503–9518. [Google Scholar] [CrossRef]
- Marzano, F.S.; Barbieri, S.; Vulpiani, G.; Rose, W.I. Volcanic ash cloud retrieval by ground-based microwave weather radar. IEEE Trans. Geosci. Remote Sens. 2006, 44, 3235–3246. [Google Scholar] [CrossRef]
- Mereu, L.; Marzano, F.S.; Barsotti, S.; Montopoli, M.; Yeo, R.; Arngrimsson, H.; Björnsson, H.; Bonadonna, C. Ground-based microwave weather radar observations and retrievals during the 2014 Holuhraun eruption (Bárðarbunga, Iceland). In Proceedings of the European Geosciences Union General Assembly 2015, Vienna, Austria, 12–17 April 2015. [Google Scholar]
- Arason, Þ.; Björnsson, H.; Petersen, G.N.; Jónasdóttir, E.B.; Oddsson, B. Plume height during the 2014–2015 Holuhraun volcanic eruption. In Proceedings of the European Geosciences Union General Assembly 2015, Vienna, Austria, 12–17 April 2015. [Google Scholar]
- Coppola, D.; Ripepe, M.; Laiolo, M.; Cigolini, C. Modelling satellite-derived magma discharge to explain caldera collapse. Geology 2017, 45, 523–526. [Google Scholar] [CrossRef]
- Bali, E.; Hartley, M.; Halldórsson, S.A.; Gudfinnsson, G.H.; Jakobsson, S. Melt inclusion constraints on volatile systematics and degassing history of the 2014–2015 Holuhraun eruption, Iceland. Contrib. Mineral. Petrol. 2017. submitted for publication. [Google Scholar] [CrossRef]
- Pedersen, G.B.M.; Höskuldsson, Á.; Dürig, T.; Thordarson, T.; Jónsdóttir, I.; Riishuus, M.S.; Óskarsson, B.V.; Dumont, S.; Magnusson, E.; Gudmundsson, M.T.; et al. Lava field evolution and emplacement dynamics of the 2014–2015 basaltic fissure eruption at Holuhraun, Iceland. J. Volcanol. Geotherm. Res. 2017, 340, 155–169. [Google Scholar] [CrossRef]
- Schmidt, A.; Leadbetter, S.; Theys, N.; Carboni, E.; Witham, C.S.; Stevenson, J.A.; Birch, C.E.; Thordarson, T.; Turnock, S.; Barsotti, S.; et al. Satellite detection, long-range transport, and air quality impacts of volcanic sulfur dioxide from the 2014–2015 flood lava eruption at Bárðarbunga (Iceland): SO2 from 2014 to 2015 eruption at Bárðarbunga. J. Geophys. Res. Atmos. 2015, 120, 9739–9757. [Google Scholar] [CrossRef]
- Carn, S.A. Global Sulfur Dioxide Monitoring Home Page. Available online: https://so2.gsfc.nasa.gov/ (accessed on 14 September 2017).
- Sutton, A.J.; Elias, T.; Gerlach, T.M.; Stokes, J.B. Implications for eruptive processes as indicated by sulfur dioxide emissions from Kilauea Volcano, Hawai’i, 1979–1997. J. Volcanol. Geotherm. Res. 2001, 108, 283–302. [Google Scholar] [CrossRef]
- Hellsing, V.Ú.L.; Ragnarsdóttir, A.S.; Jónsson, K.; Keller, N.S.; Jóhannsson, Þ.; Guðmundsson, J.; Snorrason, A.; Þórsson, J. National Inventory Report: Emissions of Greenhouse Gases in Iceland from 1990 to 2015; The Environment Agency of Iceland: Reykjavík, Iceland, 2017. [Google Scholar]
- Aiuppa, A.; Baker, D.R.; Webster, J.D. Halogens in volcanic systems. Chem. Geol. 2009, 263, 1–18. [Google Scholar] [CrossRef]
- Aiuppa, A.; Bellomo, S.; D’Alessandro, W.; Federico, C.; Ferm, M.; Valenza, M. Volcanic plume monitoring at Mount Etna by diffusive (passive) sampling. J. Geophys. Res. Atmos. 2004, 109. [Google Scholar] [CrossRef]
- Butz, A.; Dinger, A.S.; Bobrowski, N.; Kostinek, J.; Fieber, L.; Fischerkeller, C.; Giuffrida, G.B.; Hase, F.; Klappenbach, F.; Kuhn, J.; et al. Remote sensing of volcanic CO2, HF, HCl, SO2, and BrO in the downwind plume of Mt. Etna. Atmos. Meas. Tech. 2017, 10, 1–14. [Google Scholar] [CrossRef]
- Granieri, D.; Salerno, G.; Liuzzo, M.; La Spina, A.; Giuffrida, G.; Caltabiano, T.; Giudice, G.; Gutierrez, E.; Montalvo, F.; Burton, M.R.; et al. Emission of gas and atmospheric dispersion of SO2 during the December 2013 eruption at San Miguel volcano (El Salvador, Central America): SO2 emission at San Miguel volcano. Geophys. Res. Lett. 2015, 42, 5847–5854. [Google Scholar] [CrossRef]
- Martin, R.S.; Sawyer, G.M.; Spampinato, L.; Salerno, G.G.; Ramirez, C.; Ilyinskaya, E.; Witt, M.L.I.; Mather, T.A.; Watson, I.M.; Phillips, J.C.; et al. A total volatile inventory for Masaya Volcano, Nicaragua. J. Geophys. Res. 2010, 115. [Google Scholar] [CrossRef]
- Oppenheimer, C.; Scaillet, B.; Martin, R.S. Sulfur degassing from volcanoes: Source conditions, surveillance, plume chemistry and earth system impacts. Rev. Mineral. Geochem. 2011, 73, 363–421. [Google Scholar] [CrossRef]
- Pennisi, M.; Le Cloarec, M.-F. Variations of Cl, F, and S in Mount Etna’s plume, Italy, between 1992 and 1995. J. Geophys. Res. Solid Earth 1998, 103, 5061–5066. [Google Scholar] [CrossRef]
- Sawyer, G.M.; Carn, S.A.; Tsanev, V.I.; Oppenheimer, C.; Burton, M. Investigation into magma degassing at Nyiragongo volcano, Democratic Republic of the Congo: Magma degassing at Nyiragongo volcano. Geochem. Geophys. Geosystems 2008, 9. [Google Scholar] [CrossRef]
- Spampinato, L.; Salerno, G.G.; Martin, R.S.; Sawyer, G.M.; Oppenheimer, C.; Ilyinskaya, E.; Ramirez, C. Thermal and geochemical signature of Poas volcano, Costa Rica. Rev. Geol. Am. Cent. 2010, 43, 171–189. [Google Scholar]
- Symonds, R.B.; Rose, W.I.; Bluth, G.J.S.; Gerlach, T.M. Volcanic gas studies: Methods, results and applications. Rev. Mineral. Geochem. 1994, 30, 1–66. [Google Scholar]


| Date (DDMMYY) | SO2 Flux (kg/s) | Technique | Syn- or Post-Eruption |
|---|---|---|---|
| 02/09/2014 | 520 ± 100 | Scan | Syn |
| 08/09/2014 | 1330 ± 440 | Scan | Syn |
| 10/09/2014 | 1050 ± 370 | Scan | Syn |
| 11/09/2014 | 1140 ± 230 | Scan | Syn |
| 12/09/2014 | 1290 ± 290 | Scan | Syn |
| 13/09/2014 | 1120 ± 220 | Scan | Syn |
| 14/09/2014 | 610 ± 180 | Scan | Syn |
| 18/09/2014 | 820 ± 310 | Near | Syn |
| 19/09/2014 | 250 ± 100 | Near | Syn |
| 20/09/2014 | 680 ± 260 | Near | Syn |
| 21/09/2014 | 2170 ± 1720 | Near; Ring | Syn |
| 22/09/2014 | 1130 ± 490 | Scan | Syn |
| 24/09/2014 | 710 ± 210 | Scan | Syn |
| 25/09/2014 | 960 ± 320 | Scan | Syn |
| 30/09/2014 | 1200 ± 230 | Scan | Syn |
| 01/10/2014 | 1180 ± 240 | Scan | Syn |
| 02/10/2014 | 840 ± 460 | Scan | Syn |
| 06/10/2014 | 890 ± 340 | Ring | Syn |
| 05/11/2014 | 1450 ± 550 | Ring | Syn |
| 18/11/2014 | 220 ± 30 | Scan | Syn |
| 21/11/2014 | 1070 ± 410 | Ring | Syn |
| 25/11/2014 | 250 ± 50 | Scan | Syn |
| 26/11/2014 | 990 ± 1810 | Scan | Syn |
| 02/12/2014 | 300 ± 110 | Scan | Syn |
| 21/01/2015 | 250 ± 50 | Scan; Near | Syn |
| 22/01/2015 | 410 ± 70 | Scan | Syn |
| 25/01/2015 | 520 ± 120 | Scan | Syn |
| 27/01/2015 | 320 ± 100 | Scan | Syn |
| 30/01/2015 | 40 ± 20 | Ring | Syn |
| 31/01/2015 | 410 ± 160 | Ring | Syn |
| 04/02/2015 | 240 ± 90 | Ring | Syn |
| 06/02/2015 | 220 ± 30 | Scan | Syn |
| 16/02/2015 | 90 ± 30 | Scan | Syn |
| 07/03/2015 | 2 ± 0.5 | Scan | Post |
| 13/03/2015 | 1 ± 0.2 | Scan | Post |
| 21/03/2015 | 2 ± 0.5 | Scan | Post |
| 22/03/2015 | 2 ± 0.5 | Scan | Post |
| 26/03/2015 | 2 ± 0.5 | Scan | Post |
| 27/03/2015 | 2 ± 0.5 | Scan | Post |
| 28/03/2015 | 3 ± 0.7 | Scan | Post |
| 15/04/2015 | 4 ± 1 | Scan | Post |
| 22/05/2015 | 4 ± 1 | Scan | Post |
| 23/05/2015 | 4 ± 1 | Scan | Post |
| 24/05/2015 | 5 ± 1 | Scan | Post |
| Gas Ratios (Mol/Mol) | 25%–75% Percentiles | Emissions (Mt) |
|---|---|---|
| H2O/CO2 | 5–16 | |
| H2O/SO2 | 18–98 | H2O: 49–263 (34–394) |
| CO2/SO2 | 0.3–2 | CO2: 5.1 (3.6–7.6) |
| SO2/H2S | 9–13 | H2S: 0.4–0.6 (0.3–0.9) |
| SO2/HCl | 46–79 | HCl: 0.07–0.1 (0.05–0.2) |
| SO2/HF | 34–122 | HF: 0.02–0.09 (0.02–0.1) |
| Date (DDYYMM) | Daily Average Top of Cloud Height (km·AGL) | Daily Min Top of Cloud Height (km·AGL) | Daily Max Top of Cloud Height (km·AGL) | Technique |
|---|---|---|---|---|
| 29/08/2014 | 1.0 | Cam | ||
| 01/09/2014 | 4.5 | Flight | ||
| 03/09/2014 | 5.3 | 4.5 | 6.0 | Flight |
| 04/09/2014 | 4.1 | 1.7 | 5.5 | Field; DOAS |
| 05/09/2014 | 3.8 | Field | ||
| 06/09/2014 | 3.1 | Field | ||
| 07/09/2014 | 3.5 | Field | ||
| 08/09/2014 | 3.0 | 1.9 | 4.3 | DOAS |
| 09/09/2014 | 2.1 | 1.3 | 3.7 | DOAS |
| 10/09/2014 | 1.6 | 1.2 | 2.5 | DOAS |
| 11/09/2014 | 2.0 | 1.1 | 3.1 | Cam; DOAS |
| 12/09/2014 | 1.8 | 1.3 | 2.7 | Cam; DOAS |
| 13/09/2014 | 2.6 | 1.6 | 3.5 | Cam; Flight; Field; DOAS |
| 14/09/2014 | 2.3 | 2.0 | 2.5 | Cam; Field; DOAS |
| 15/09/2014 | 1.6 | Cam | ||
| 16/09/2014 | 2.3 | Cam | ||
| 17/09/2014 | 2.0 | Cam | ||
| 19/09/2014 | 3.0 | Field | ||
| 20/09/2014 | 2.3 | Cam; Field | ||
| 21/09/2014 | 1.6 | 1.0 | 2.0 | Cam; Field; Mobile |
| 22/09/2014 | 2.5 | 2.1 | 3.0 | Cam; Flight; Field |
| 23/09/2014 | 3.9 | 3.5 | 4.2 | Field |
| 24/09/2014 | 2.1 | 1.9 | 2.8 | Field; DOAS |
| 26/09/2014 | 2.0 | Field | ||
| 27/09/2014 | 2.5 | Field | ||
| 28/09/2014 | 3.0 | Field | ||
| 02/10/2014 | 1.7 | Field | ||
| 06/10/2014 | 1.2 | Mobile | ||
| 08/10/2014 | 1.0 | Field | ||
| 17/10/2014 | 2.6 | 2.4 | 3.0 | Flight; Field |
| 21/10/2014 | 1.3 | Field | ||
| 22/10/2014 | 1.2 | Field | ||
| 23/10/2014 | 1.2 | Field | ||
| 28/10/2014 | 2.0 | Field | ||
| 29/10/2014 | 2.6 | 1.8 | 3.5 | Field |
| 30/10/2014 | 2.7 | 2.3 | 2.9 | Field |
| 04/11/2014 | 2.9 | 2.8 | 3.0 | Flight |
| 05/11/2014 | 1.4 | 1.0 | 1.5 | Field; Mobile |
| 11/11/2014 | 2.2 | 1.3 | 3.0 | Field |
| 13/11/2014 | 3.5 | Field | ||
| 14/11/2014 | 2.8 | 2.5 | 3.0 | Flight |
| 18/11/2014 | 1.7 | 0.4 | 2.3 | Flight; Field |
| 19/11/2014 | 1.3 | 1.1 | 1.5 | Field |
| 20/11/2014 | 1.0 | 0.5 | 1.4 | Field |
| 21/11/2014 | 0.8 | 0.5 | 1.5 | Field; Mobile |
| 23/11/2014 | 2.1 | 1.9 | 2.2 | NICAIRII |
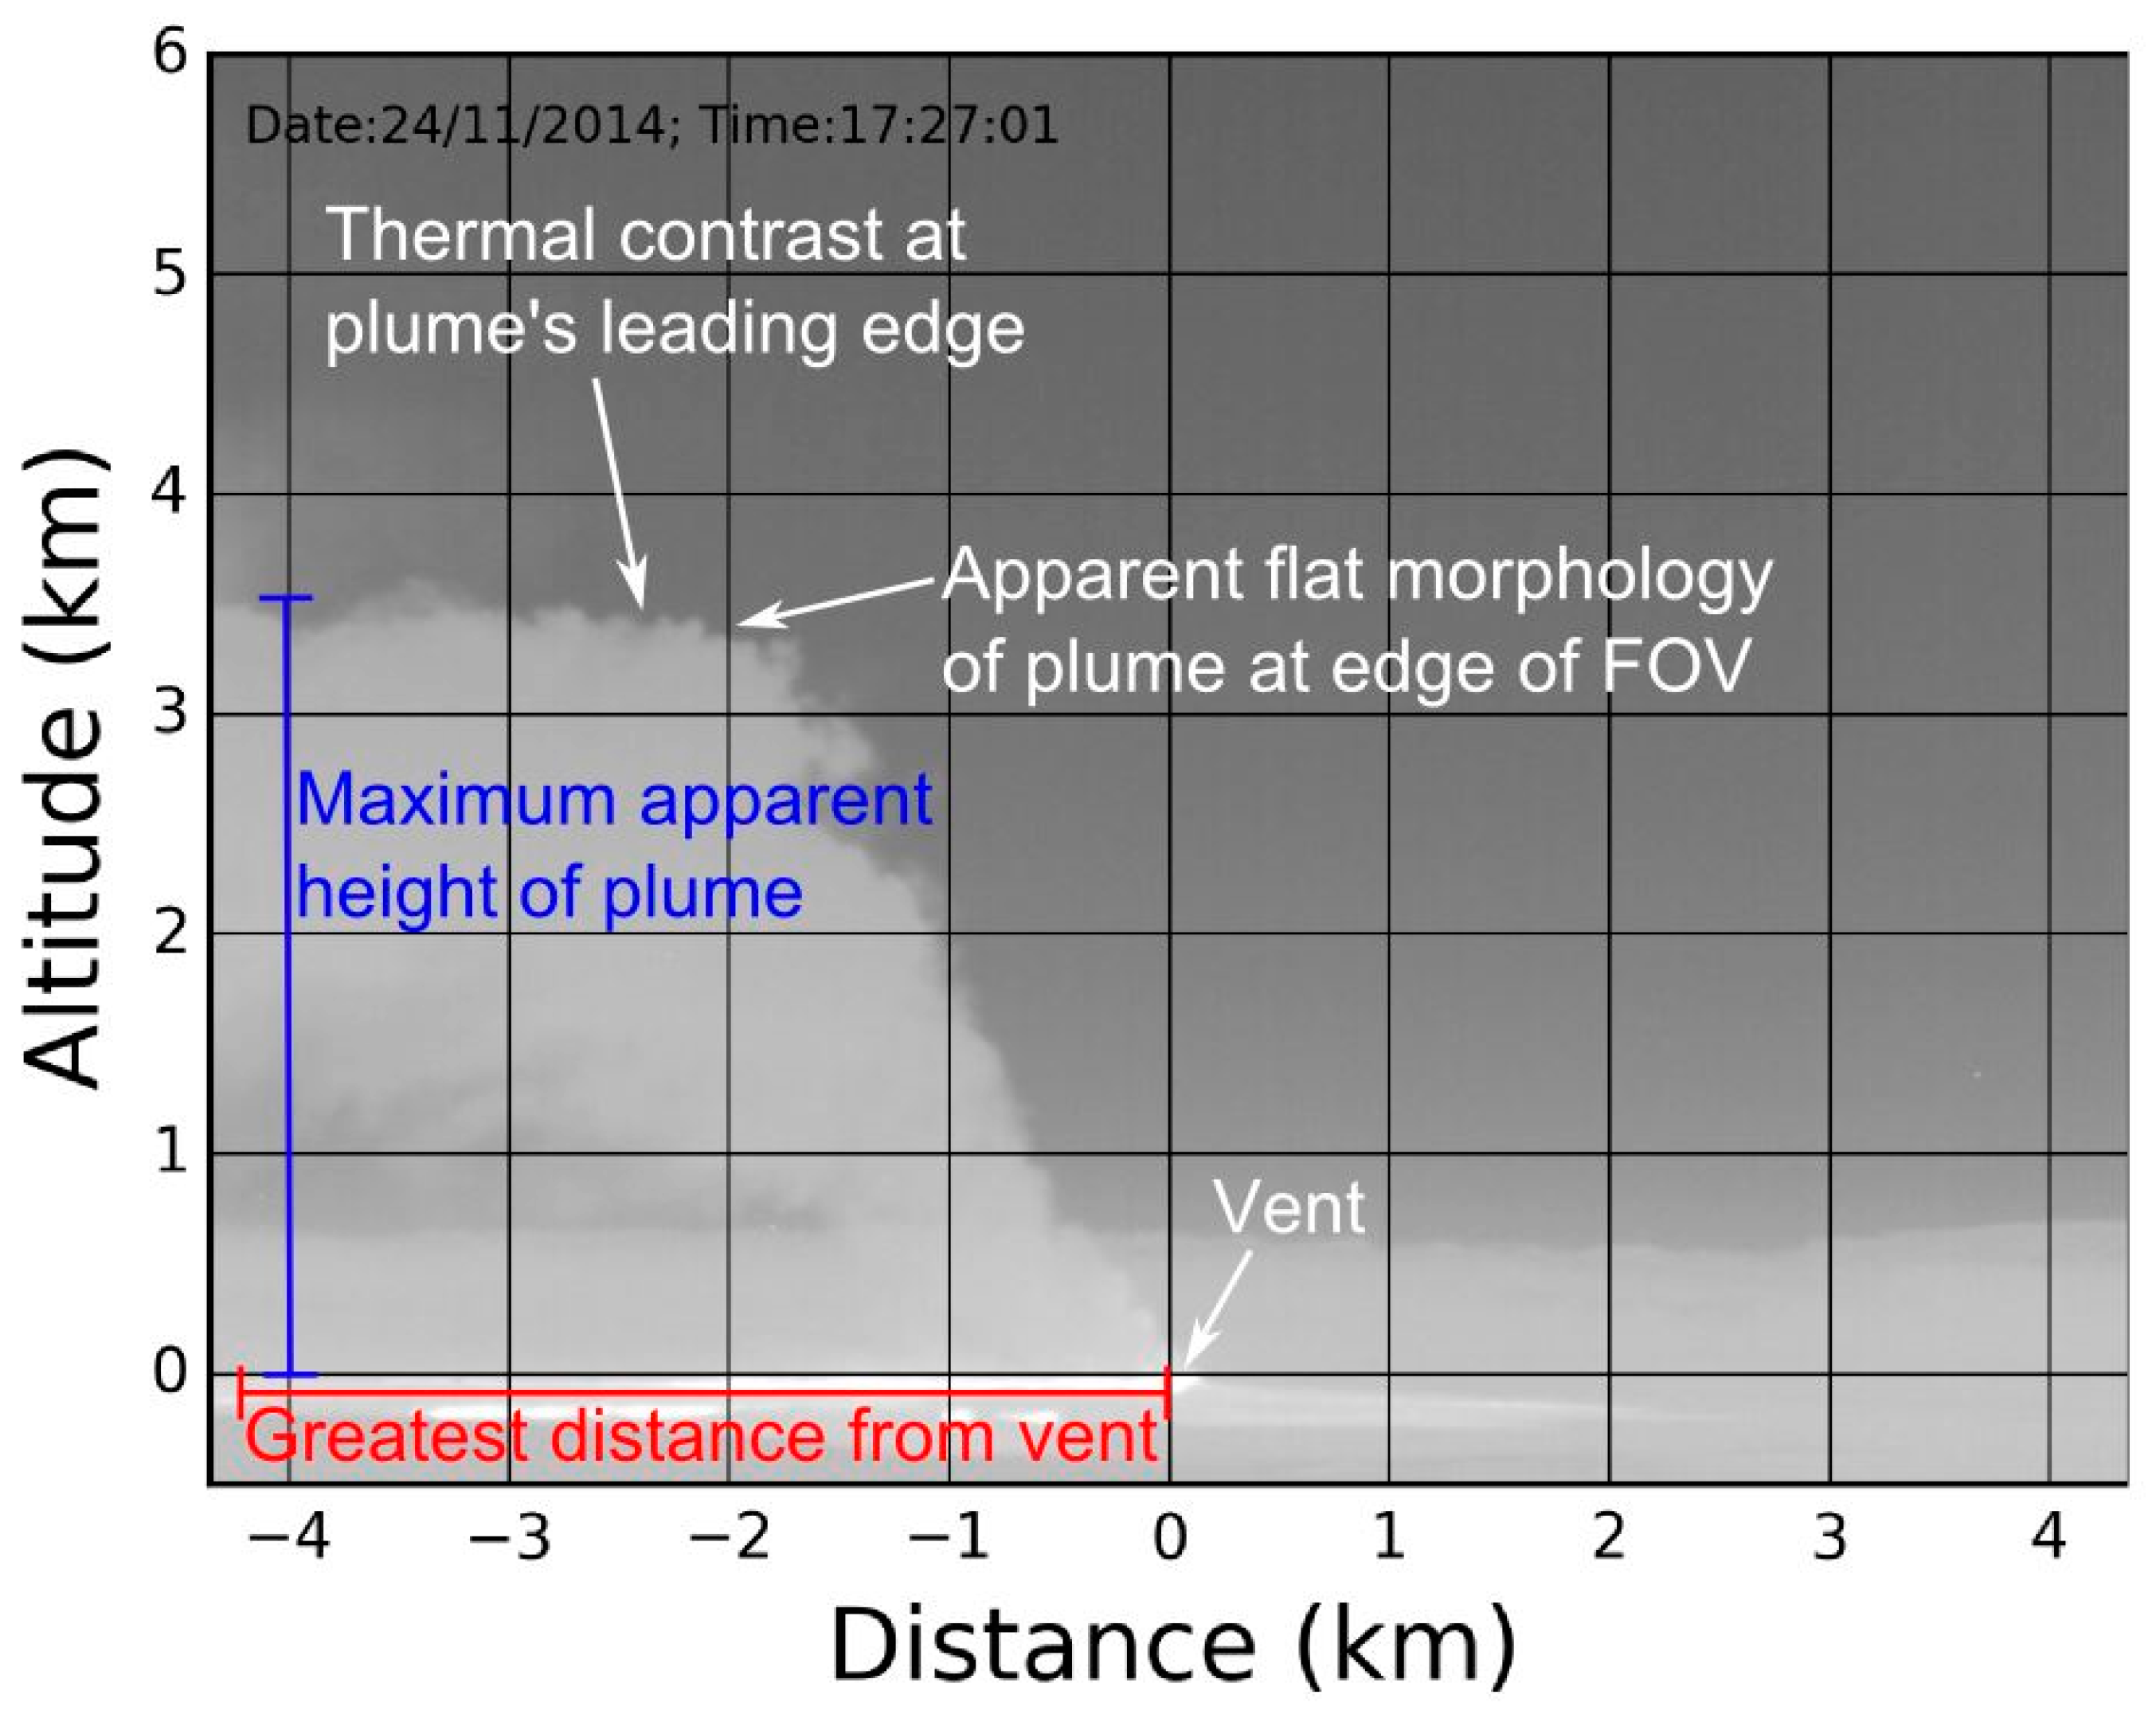
| 24/11/2014 | 0.5 | NICAIRII | ||
| 25/11/2014 | 2.6 | 0.8 | 4.0 | Field; NICAIRII |
| 26/11/2014 | 1.8 | 0.4 | 3.1 | Field; NICAIRII |
| 27/11/2014 | 1.9 | 0.9 | 3.1 | Field |
| 30/11/2014 | 2.5 | 2.4 | 2.6 | NICAIRII |
| 01/12/2014 | 1.0 | NICAIRII | ||
| 02/12/2014 | 2.5 | Field | ||
| 03/12/2014 | 1.3 | Field | ||
| 04/12/2014 | 2.1 | 1.5 | 2.7 | Flight; Field |
| 05/12/2014 | 2.0 | 1.6 | 2.3 | Field |
| 09/12/2014 | 0.5 | NICAIRII | ||
| 30/12/2014 | 2.6 | 2.5 | 2.7 | Flight |
| 10/01/2015 | 2.5 | Flight | ||
| 21/01/2015 | 3.5 | 3.0 | 4.2 | Mobile |
| 22/01/2015 | 2.8 | 2.8 | 2.8 | Field |
| 27/01/2015 | 1.3 | Field | ||
| 28/01/2015 | 1.4 | 1.3 | 1.5 | Field |
| 29/01/2015 | 2.8 | 2.3 | 3.2 | Field |
| 30/01/2015 | 0.7 | 0.5 | 1.0 | Mobile |
| 31/01/2015 | 1.7 | 1.5 | 2.0 | Mobile |
| 03/02/2015 | 1.5 | Flight | ||
| 04/02/2015 | 0.9 | 0.7 | 1.0 | Mobile |
| 19/02/2015 | 0.9 | 0.7 | 1.0 | Field |
© 2018 by the authors. Licensee MDPI, Basel, Switzerland. This article is an open access article distributed under the terms and conditions of the Creative Commons Attribution (CC BY) license (http://creativecommons.org/licenses/by/4.0/).
Share and Cite
Pfeffer, M.A.; Bergsson, B.; Barsotti, S.; Stefánsdóttir, G.; Galle, B.; Arellano, S.; Conde, V.; Donovan, A.; Ilyinskaya, E.; Burton, M.; et al. Ground-Based Measurements of the 2014–2015 Holuhraun Volcanic Cloud (Iceland). Geosciences 2018, 8, 29. https://doi.org/10.3390/geosciences8010029
Pfeffer MA, Bergsson B, Barsotti S, Stefánsdóttir G, Galle B, Arellano S, Conde V, Donovan A, Ilyinskaya E, Burton M, et al. Ground-Based Measurements of the 2014–2015 Holuhraun Volcanic Cloud (Iceland). Geosciences. 2018; 8(1):29. https://doi.org/10.3390/geosciences8010029
Chicago/Turabian StylePfeffer, Melissa A., Baldur Bergsson, Sara Barsotti, Gerður Stefánsdóttir, Bo Galle, Santiago Arellano, Vladimir Conde, Amy Donovan, Evgenia Ilyinskaya, Mike Burton, and et al. 2018. "Ground-Based Measurements of the 2014–2015 Holuhraun Volcanic Cloud (Iceland)" Geosciences 8, no. 1: 29. https://doi.org/10.3390/geosciences8010029
APA StylePfeffer, M. A., Bergsson, B., Barsotti, S., Stefánsdóttir, G., Galle, B., Arellano, S., Conde, V., Donovan, A., Ilyinskaya, E., Burton, M., Aiuppa, A., Whitty, R. C. W., Simmons, I. C., Arason, Þ., Jónasdóttir, E. B., Keller, N. S., Yeo, R. F., Arngrímsson, H., Jóhannsson, Þ., ... Mereu, L. (2018). Ground-Based Measurements of the 2014–2015 Holuhraun Volcanic Cloud (Iceland). Geosciences, 8(1), 29. https://doi.org/10.3390/geosciences8010029