Abstract
Monitoring gaseous and particulate volcanic emissions with remote observations is of particular importance for climate studies, air quality and natural risk assessment. The concurrent impact of the simultaneous presence of sulphur dioxide (SO2) emissions and the subsequently formed secondary sulphate aerosols (SSA) on the thermal infraRed (TIR) satellite observations is not yet well quantified. In this paper, we present the first assessment of the combined sensitivity of pseudo-observations from three TIR satellite instruments (the Infrared Atmospheric Sounding Interferometer (IASI), the MODerate resolution Imaging Spectro radiometer (MODIS) and the Spinning Enhanced Visible and InfraRed Imager (SEVIRI)) to these two volcanic effluents, following an idealized moderate stratospheric eruption. Direct radiative transfer calculations have been performed using the 4A (Automatized Atmospheric Absorption Atlas) radiative transfer model during short-term atmospheric sulphur cycle evolution. The results show that the mutual effect of the volcanic SO2 and SSA on the TIR outgoing radiation is obvious after three to five days from the eruption. Therefore, retrieval efforts of SO2 concentration should consider the progressively formed SSA and vice-versa. This result is also confirmed by estimating the information content of the TIR pseudo-observations to the bi-dimensional retrieved vector formed by the total masses of sulphur dioxide and sulphate aerosols. We find that it is important to be careful when attempting to quantify SO2 burdens in aged volcanic plumes using broad-band instruments like SEVIRI and MODIS as these retrievals present high uncertainties. For IASI, the total errors are smaller and the two parameters can be retrieved as independent quantities.
1. Introduction
Volcanic eruptions are a major natural source of various trace gases and aerosols types that can perturb the atmospheric composition (e.g., [1,2]) and the Earth’s radiative budget (e.g., [3]). These effluents, injected into the stratosphere, can produce atmospheric impacts on a relatively long time-scale [4]. About 7.5–10.0 Tg·S·year −1 of sulphur dioxide (SO2) of volcanic origin are globally released to the atmosphere [5]. This contributes the third most abundant gas releases from volcanic activity, after water vapour and carbon dioxide. Sulphur dioxide is a precursor of secondary sulphate aerosol (SSA). These particles are efficient scatterers for short wave (solar) radiation, which can result in a global cooling of the climate system following massive [3] to moderate stratospheric eruptions [6]. In addition, SSA can absorb long wave radiation, which can result in a local warming [7]. Secondary sulphate aerosols can also promote the destruction of the stratospheric ozone by heterogeneous chemistry [8] and modify the occurrence and optical properties of clouds systems [9].
Once SO2 is released to the atmosphere, its evolution to form aerosols particles follows two mechanisms [10]. The first mechanism represents the aqueous oxidation of SO2 to sulphuric acid H2SO4(aq) in a dilute water droplet, according to the following series of equations:
SO2 + H2O ⇌ H+ + SO2OH−,
SO2OH− + H2O2 ⇌ SO2OOH−1 + H2O,
SO2OOH−1 + H+(HA) → H2SO4 + A−1.
A is the equilibrium of SO2 between the gas and aqueous phase. The aqueous phase oxidation occurs mostly in the troposphere where 60% to 80% of the tropospheric SO2 are removed by this process [11]. The second mechanism is the gas phase oxidation taking place in both the troposphere and the stratosphere and involves three steps: SO2 reacts rapidly with OH to form HSO3, which reacts with O2 to form SO3. The latter reacts with H2O to form sulfuric acid H2SO4 with bimolecular rate constant of cm3·molecules−1· s−1 [12] represented by the third equation in the following series:
SO2 + OH + M → HSO3 + M,
HSO3 + O2 → SO3 + HO2,
SO3 + H2O + M → H2SO4 + M.
M represents an inert species N2 or O2 necessary for the energetic of the reaction. The lifetime of SO2 depends on the plume altitude. It is longer in the stratosphere where the concentration of hydroxyl is relatively small [13]. It also depends on different physical processes, like the dry deposition, and the scavenging by cloud or rainwater droplets [14]. Starting from the gaseous H2SO4 formed with this mechanism, SSA are formed by homogeneous nucleation [15]. In the stratosphere, they are generally formed of about 75% H2SO4 and 25% H2O [4] and have small deposition rates ensuring long lifetimes (of the order of months to years [16]). Sulphate aerosols formed in the troposphere are depleted by precipitation and have, therefore, shorter life times, varying from days to weeks [17]. Sulphate aerosols can also be directly emitted from the volcanic vents [18], in which case they are called primary sulphate aerosols. The average conversion rate of SO2 to stratospheric aerosols represents an e-folding time of 30 to 40 days [16,19]. It is generally assumed that all the SO2 emissions are converted to SSA and other sink processes are negligible.
Satellite measurements are well established tools to detect volcanic eruption and characterize the emissions, specifically for volcanoes that are not monitored by ground measurements. Their contribution is crucial, e.g., for aviation hazard mitigation. Both InfraRed (IR) and UltraViolet (UV) sensors provide near-real time measurements of SO2 (see a review of the capabilities of the satellite instruments available at present in [20]). Aerosol remote sensing in the IR channels has received more and more attention in recent years. The imaginary part of the refractive indices of many aerosols compositions has a strong spectral variability in this domain, thus giving access to specific information on both their distribution and their composition [21,22]. Sulphur dioxide and SSA have spectral signatures in the same infrared window between 700 and 1400 cm−1. This region includes two absorption bands of SO2 centered at about 1150 and 1370 cm−1 [23] and also two distinctive SSA absorption features localized at 905 and 1170 [24].
Monitoring the aforementioned atmospheric sulphur cycles using remote sensing is essential in order to better understand the inherent processes, and to estimate the SSA impact on the radiative transfer. In addition, usual methods to derive information on volcanic SO2 emissions neglect the impact of subsequently formed SSA on SO2 retrievals. This is particularly critical when using satellite data in the infrared spectral region, as both SO2 and SSA have spectral signatures in the same band, namely between 700 and 1400 cm−1 [22,25,26]. In this paper, we present the first sensitivity analysis of the SO2 and SSA mutual interference on pseudo-observations of three Thermal InfraRed (TIR) satellites instruments, the Infrared Atmospheric Sounding Interferometer (IASI), the MODerate resolution Imaging Spectro radiometer (MODIS) and the Spinning Enhanced Visible and InfraRed Imager (SEVIRI) , after an idealized moderate stratospheric volcanic eruption. We also assess the information content of these pseudo-observations to SO2 and SSA total masses.
2. Data and Methods
2.1. Satellite Data
In the present study, we consider three prototypical TIR nadir satellite instruments: IASI, MODIS and SEVIRI. These three instruments present different technical characteristics and advantages to observe SO2 and SSA. SEVIRI has a high temporal resolution. MODIS has a high spatial resolution. Both instruments have a limited spectral resolution. On the contrary, IASI is characterized by a high spectral resolution. The MODIS and SEVIRI infrared channels, in the spectral range 700–1400 (sensitive region to SO2 and SSA absorption bands, as mentioned in Section 1), used in this work, are detailed in Table 1.

Table 1.
MODIS and SEVIRI TIR bands in the spectral range 700–1400 cm−1 and their spectral characteristics. (* = not used in this work because of the interaction with the strong ozone absorption band at 9.7 μm (e.g., [26])).
2.1.1. IASI
The Infrared Atmospheric Sounding Interferometer (IASI) is on-board MetOp-A and MetOp-B, polar orbiting meteorological satellites launched by EUMETSAT (European Organisation for the Exploitation of Meteorological Satellites) in October 2006 and September 2012, respectively. These sun-synchronous satellites perform measurements at an altitude of around 817 km and crosses the equator twice daily at 9:30 a.m. and at 9:30 p.m. local time in a descending and an ascending node, respectively. The characteristics of the IASI instrument are detailed by Clerbaux et al. [27]. The IASI instrument is a Fourier Transform Spectrometer that measures the infrared radiation emitted from the Earth in the range of 3.4–15.5 μm corresponding to 645–2760 cm−1. This important spectral coverage allows the retrieval of temperature and water vapour profiles, and contains absorption bands of many atmospheric gases, like carbon dioxide, ozone, methane and others. The spectral resolution, in our spectral region of interest, is 0.5 cm−1, after apodisation. IASI observations have been extensively used to monitor volcanic SO2 amounts (e.g., [23,28]). Volcanic SSA have been also recently studied (e.g., [22,25]).
2.1.2. MODIS
The MODerate resolution Imaging Spectroradiometer (MODIS) is part of the National Aeronautics and Space Administration (NASA) Earth Observing System (EOS). It provides long-term global observation of the Earth’s land, ocean and atmospheric properties. The MODIS instrument is designed to achieve a trade-off of relatively high spectral, spatial and temporal resolution, with a priority on spatial resolution and imaging capabilities. MODIS observes the Earth with a 2330 km swath, from a polar orbit approximately 700 km above the surface and ±55° views scan. MODIS is flying on two NASA satellites, Terra and Aqua, which are polar-orbiting sun-synchronous platforms. Terra and Aqua were launched on 18 December 1999 and 4 May 2002, respectively. The Terra orbit passes from North to South and crosses the equator at about 10:30 a.m., while Aqua has an ascending orbit and crosses the equator at about 1:30 p.m. This instrument acquires data at 36 spectral bands (0.4–14.4 μm), with 29 spectral bands (bands 8–36) are located in the middle and long wave TIR spectral regions. In these bands, the spatial resolution is 1 km. MODIS observations have been extensively used to monitor volcanic SO2 and ash amounts (e.g., [24,29,30]), but no SSA inversion algorithm is available at present, to our knowledge.
2.1.3. SEVIRI
The Spinning Enhanced Visible and Infrared Imager (SEVIRI), the main sensor of the Meteosat Second Generation (MSG) geostationary satellite, orbits the Earth at an approximate altitude of 36,000 km with a period of 24 h and a nadir point of approximately 3° W, over the equator. The instrument is a line-by-line scanning radiometer, which provides image data in four Visible and Near-InfraRed (VNIR) channels and eight IR channels. The spatial resolution of IR channels is 3 km. The key feature of this imaging instrument is the repeat cycle of 15 min. Despite their limited spectral resolution, SEVIRI measurements have been used to quantifying volcanic SO2 [31] and detecting subsequent SSA formation [26].
2.2. Stratospheric Volcanic Sulphur Cycle
To quantitatively study the concurrent impact of volcanic SO2 emission and subsequently formed SSA, we introduce, in this section, a chemical/micro-physical simplified model of SO2 to SSA formation. In this work, we focus on stratospheric eruptions. The model developed here is based on the model introduced by Miles et al. [32].
We assume that all the consumed SO2 gaseous emissions oxidise to form sulphuric acid, and that this chemical process is the sole sink for these emissions. The oxidation phase, and then the time evolution of volcanic SO2 burdens, is controlled by Equation (1) (e.g., [13,33]), where is the SO2 mass at a time t, is the total SO2 mass loading injected by the volcano (the day of eruption, t = 0) and a is the e-folding time for this process. In our study, we fix SO2 e-folding time to 3.10−7 s−1 (about 38 days lifetime), as observed by Oppenheime et al. (e.g., [13]), and suggested as a typical value for stratospheric sulphur cycles:
The oxidised SO2 forms gaseous sulphuric acid (H2SO4). Starting from the amount of gaseous H2SO4 at time t obtained with Equation (1), the micro-physical processes leading to the formation of SSA are represented with Equation (2). In this equation, is the time-resolved SSA effective mass volume concentration and b is the e-folding time of gaseous to particulate H2SO4 conversion (the other quantities have been introduced before). The factor b describes different processes going from nucleation, condensation to coagulation and is assumed here as relative to a lifetime of approximately three months, which is typical of stratospheric volcanic sulphur cycle [32]. In the present study, the loss rate of SSA (different physical processes, like gravitational settling, evaporation and wet removal) are not taken into account, having an e-folding time of the order of one year in the stratosphere (e.g., [32,34]). Our study is targeted on a short-term evolution (the first few days after the eruptive event). We suppose the formed SSA particles as binary solution systems formed of 75% H2SO4 and 25% H2O. The increase in mass for this binary-solution transformation (oxidation and then nucleation/hydration) is 2.04 [32]. Thus, the initial mass of SO2 is approximately doubled upon the aerosol formation:
From the SSA mass calculated with Equation (2), we derive the number concentration of sulphate aerosols using a logarithmic size distribution. We fix a mean radius of 0.2 , a standard deviation of 1.86 and a sulphuric acid mixing ratio of 75% H2SO4 and 25% H2O. These are representative values of SSA distributions in the upper troposphere lower stratosphere (UTLS) [35] and have been previously used by Sellitto et al. (e.g., [24]). The number concentration of aerosol distributions are calculated using Equation (3). The three parameters (, and sulfuric acid mixing ratio) of the aerosol size distribution are used as inputs to calculate the optical properties of aerosols (extinction, absorption and scattering coefficients and phase function) using a Mie code. These radiative calculations are described in Section 2.3:
In our subsequent radiative simulations, we considered an initial mass volume concentration of SO2 injected in the stratosphere at three different plume altitudes: 18.5, 20.0 and 21.3 km. We sample four different time intervals during evolution since the eruption: 1, 3, 5 and 10 days. The evolution over time of SO2 and SSA masses, as well as of SSA number concentration, as a function of the injection height, are summarized in Table 2.

Table 2.
SO2 mass concentration, secondary sulphate aerosols (SSA) mass concentration and particle distribution properties for the investigated time intervals and injection altitudes.
2.3. Radiative Transfer Simulations
The IASI, MODIS and SEVIRI pseudo-observations are obtained using the radiative transfer model 4A (Automatized Atmospheric Absorption Atlas OPerational) [36]. This model is a line-by-line radiative transfer model, developed by the Laboratoire de Météorologie Dynamique and the NOVELTIS company [37] with the support of CNES (Centre National d’Études Spatiales), to allow fast forward radiative transfer calculations in the IR spectral region, using optical thickness databases, called Atlases. Spectra are computed at high resolution and can be convolved with various types of instrument Relative Spectral Response (RSR) functions. We simulate radiances in the range of 700–1400 cm−1, with zero viewing zenith angle and with spectral resolution of 0.50 cm−1, in order to fit IASI high-spectral resolution observations. The TIR calculations are subsequently convolved with MODIS and SEVIRI RSRs, to produce corresponding pseudo-observations. We consider as input for the radiative transfer calculation a typical tropical atmosphere in terms of temperature, pressure and trace gases profiles. Following the considerations of Section 2.2, a fixed SO2 amount of 10 Dobson Units (DU) is injected at different altitudes (18.5, 20.0 and 21.3 km) to test the impact of volcanic effluents injections at different lower-stratospheric altitudes. The amount of 10 DU has been selected to simulate a moderate stratospheric eruption, like the recent Nabro, Sarichev or Kasatochi eruptions (see, e.g., [6]). The SO2 mass concentration has been re-calculated for each injection altitude, due to the slightly different layer thicknesses in 4A (ranging between 1.3 and 1.5 km, in this altitude range). No vertical diffusion or vertical plume structure has been simulated and the SO2 perturbation has been produced at one single layer each time. During the first day of the volcanic eruption (t = 0), only SO2 perturbations are present. Subsequent SSA formation (and SO2 loss) were considered at t = 1, t = 3, t = 5 and t = 10. The aerosol optical parameters (extinction coefficient, single scattering albedo and asymmetry parameters) described above for each layer are required as inputs, when aerosols are considered. These parameters are calculated using a Mie code, using the time- and altitude-dependent particle size distribution introduced in Section 2.2 and the H2SO4 mixing ratio-dependent refractive index of Bierman et al. [38], taken from the GEISA (Gestion et Etude des Information Spectroscopiques) spectroscopic database. The real and imaginary part of the refractive indices have been taken for a reference temperature of 215 K and for H2SO4 mixing ratio of 75%. The Mie scattering routines are obtained from the Earth Observation Data Group of the Department of Physics of Oxford University and they are run in IDL (Interactive Data Language). In order to solve the Radiative Transfer Equation (RTE) for the scattering aerosol contribution, we use the DIScrete ORdinaTe (DISORT) algorithm [39]. A baseline run is performed for a clear atmosphere (in the absence of both volcanic SO2 and SSA), to compare with the time-dependent volcanically-perturbed simulations.
3. Results and Discussion
3.1. The SSA Spectral Extinction Coefficient Variability during Short-Term Plume Evolution
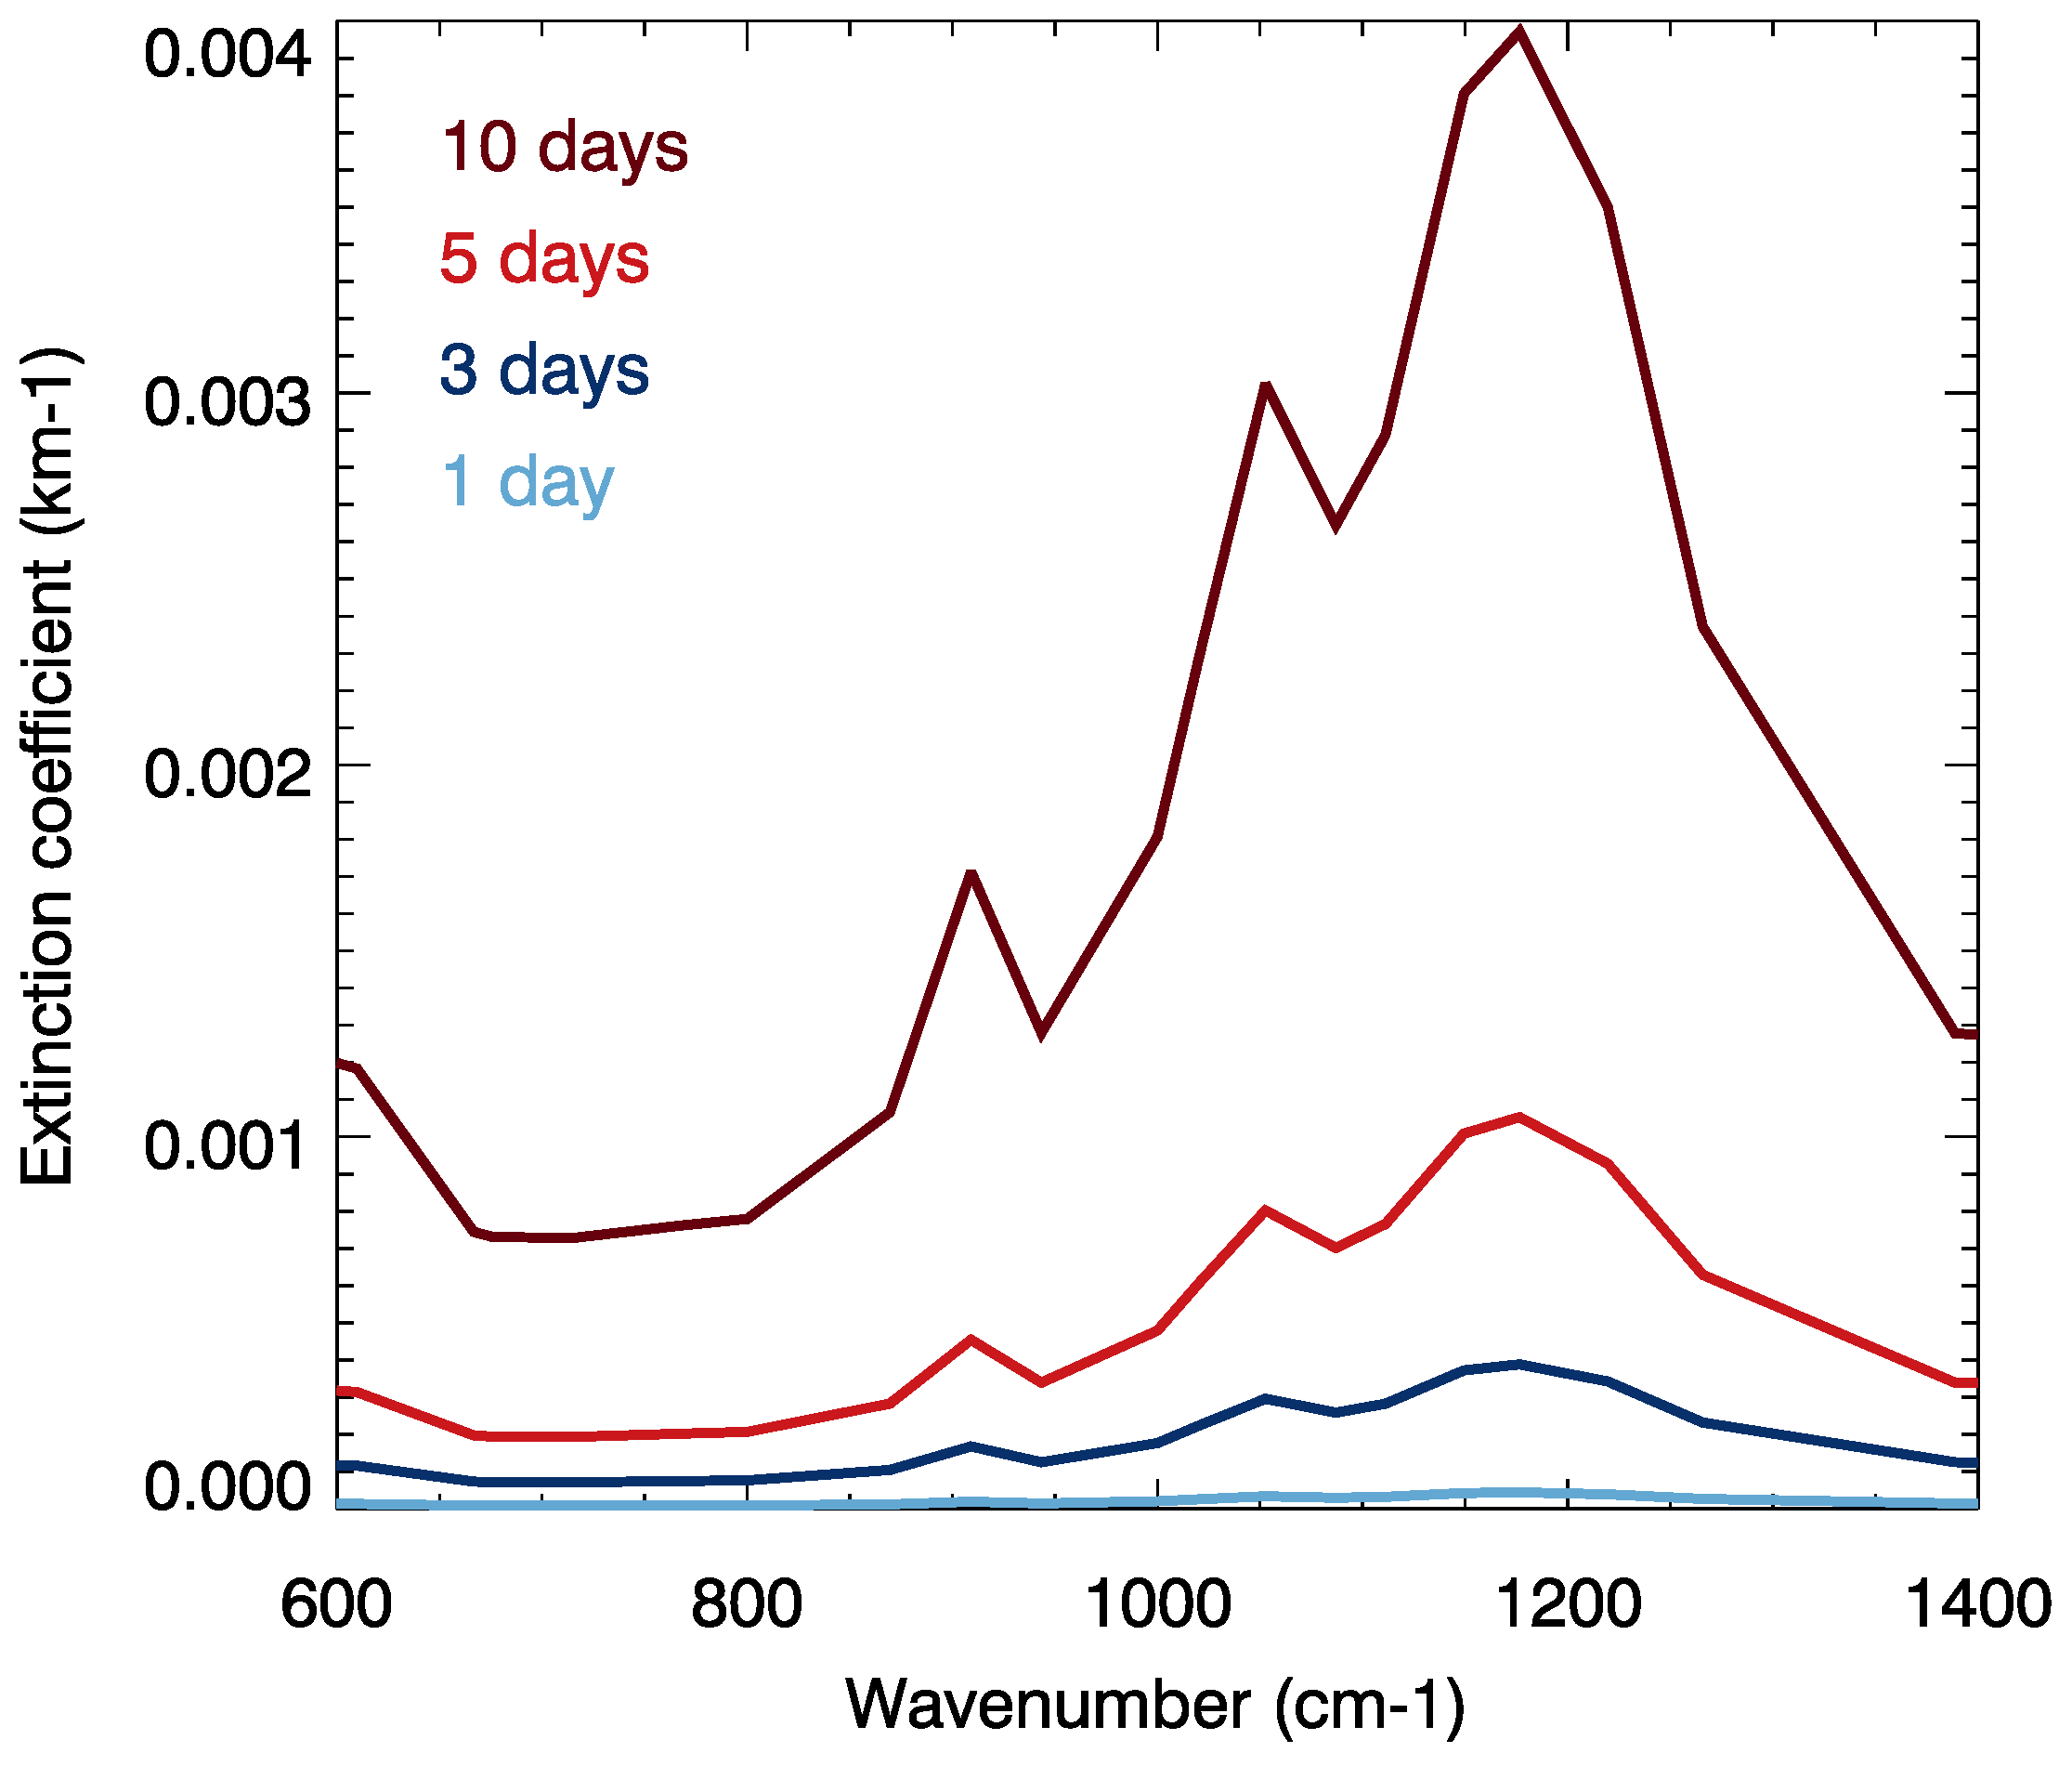
We first analyse the variability of the spectral extinction coefficient of SSA layers during the plume evolution, following the chemical/micro-physical model of Section 2.2. The evolution of the spectral extinction coefficient is illustrated in Figure 1, between 600 and 1400 , for an initial volcanic injection at 20.0 km. For each time interval, the aerosol extinction generally increases with the wavenumber, as discussed by Sellitto and Legras [22]. A minimum extinction between 650 and 800 and a maximum extinction at about 1170 are found. A secondary maximum is also found around 905 . This behaviour is principally attributed to the absorption features of the undissociated H2SO4 in the aerosol droplets ([22] and references therein). The extinction of the SSA layer starts to be particularly important (higher than 0.001 at 1170 cm−1) after about five days. The extinction at 10 days is about 40 times larger than at one day after the eruption, due to the steep increase of particles number concentration from volcanic SO2 conversion. According to Table 2, our chemical/micro-physical model generates SSA number concentrations of 0.2 and 22.2 particles , at 1 and 10 days, respectively.
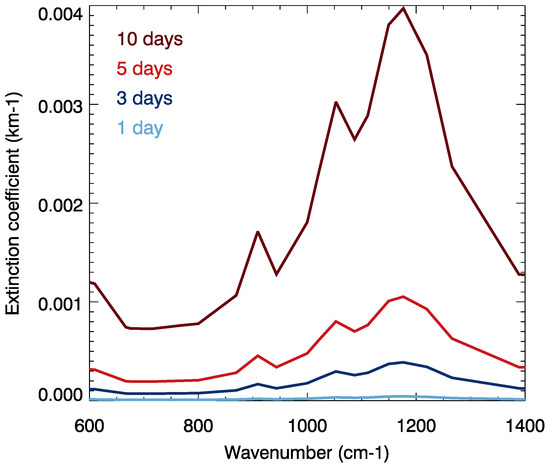
Figure 1.
SSA spectral extinction coefficients variability for the investigated time intervals since eruption (one day: sky blue; three days: dark blue; five days: light red; ten days: dark red). The considered SO2 injection altitude is 20.0 km.
3.2. Brightness Temperature Pseudo-Observations Variability
In this section, we discuss the concurrent impact on the outgoing IR radiation of volcanic SO2 and the subsequently formed SSA. In order to quantify these impacts, we use the SO2 varying concentrations and the aerosol extinction coefficients as inputs for the forward modeling with 4A. These volcanic effluents are modelled as a single layer and introduced in a typical tropical atmosphere. The mutual SSA and SO2 interference is studied using three prototype instrumental models, to produce SEVIRI, MODIS and IASI pseudo-observations. To get insights into the altitude dependent concurrent radiative impacts, three injection altitudes have been tested, 18.5, 20.0 and 21.3 km (near and above the tropical tropopause; the levels are fixed in the 4A Radiative Transfer Model (RTM)). The modelled plume is then extending vertically over a thickness of about 1.5 km.
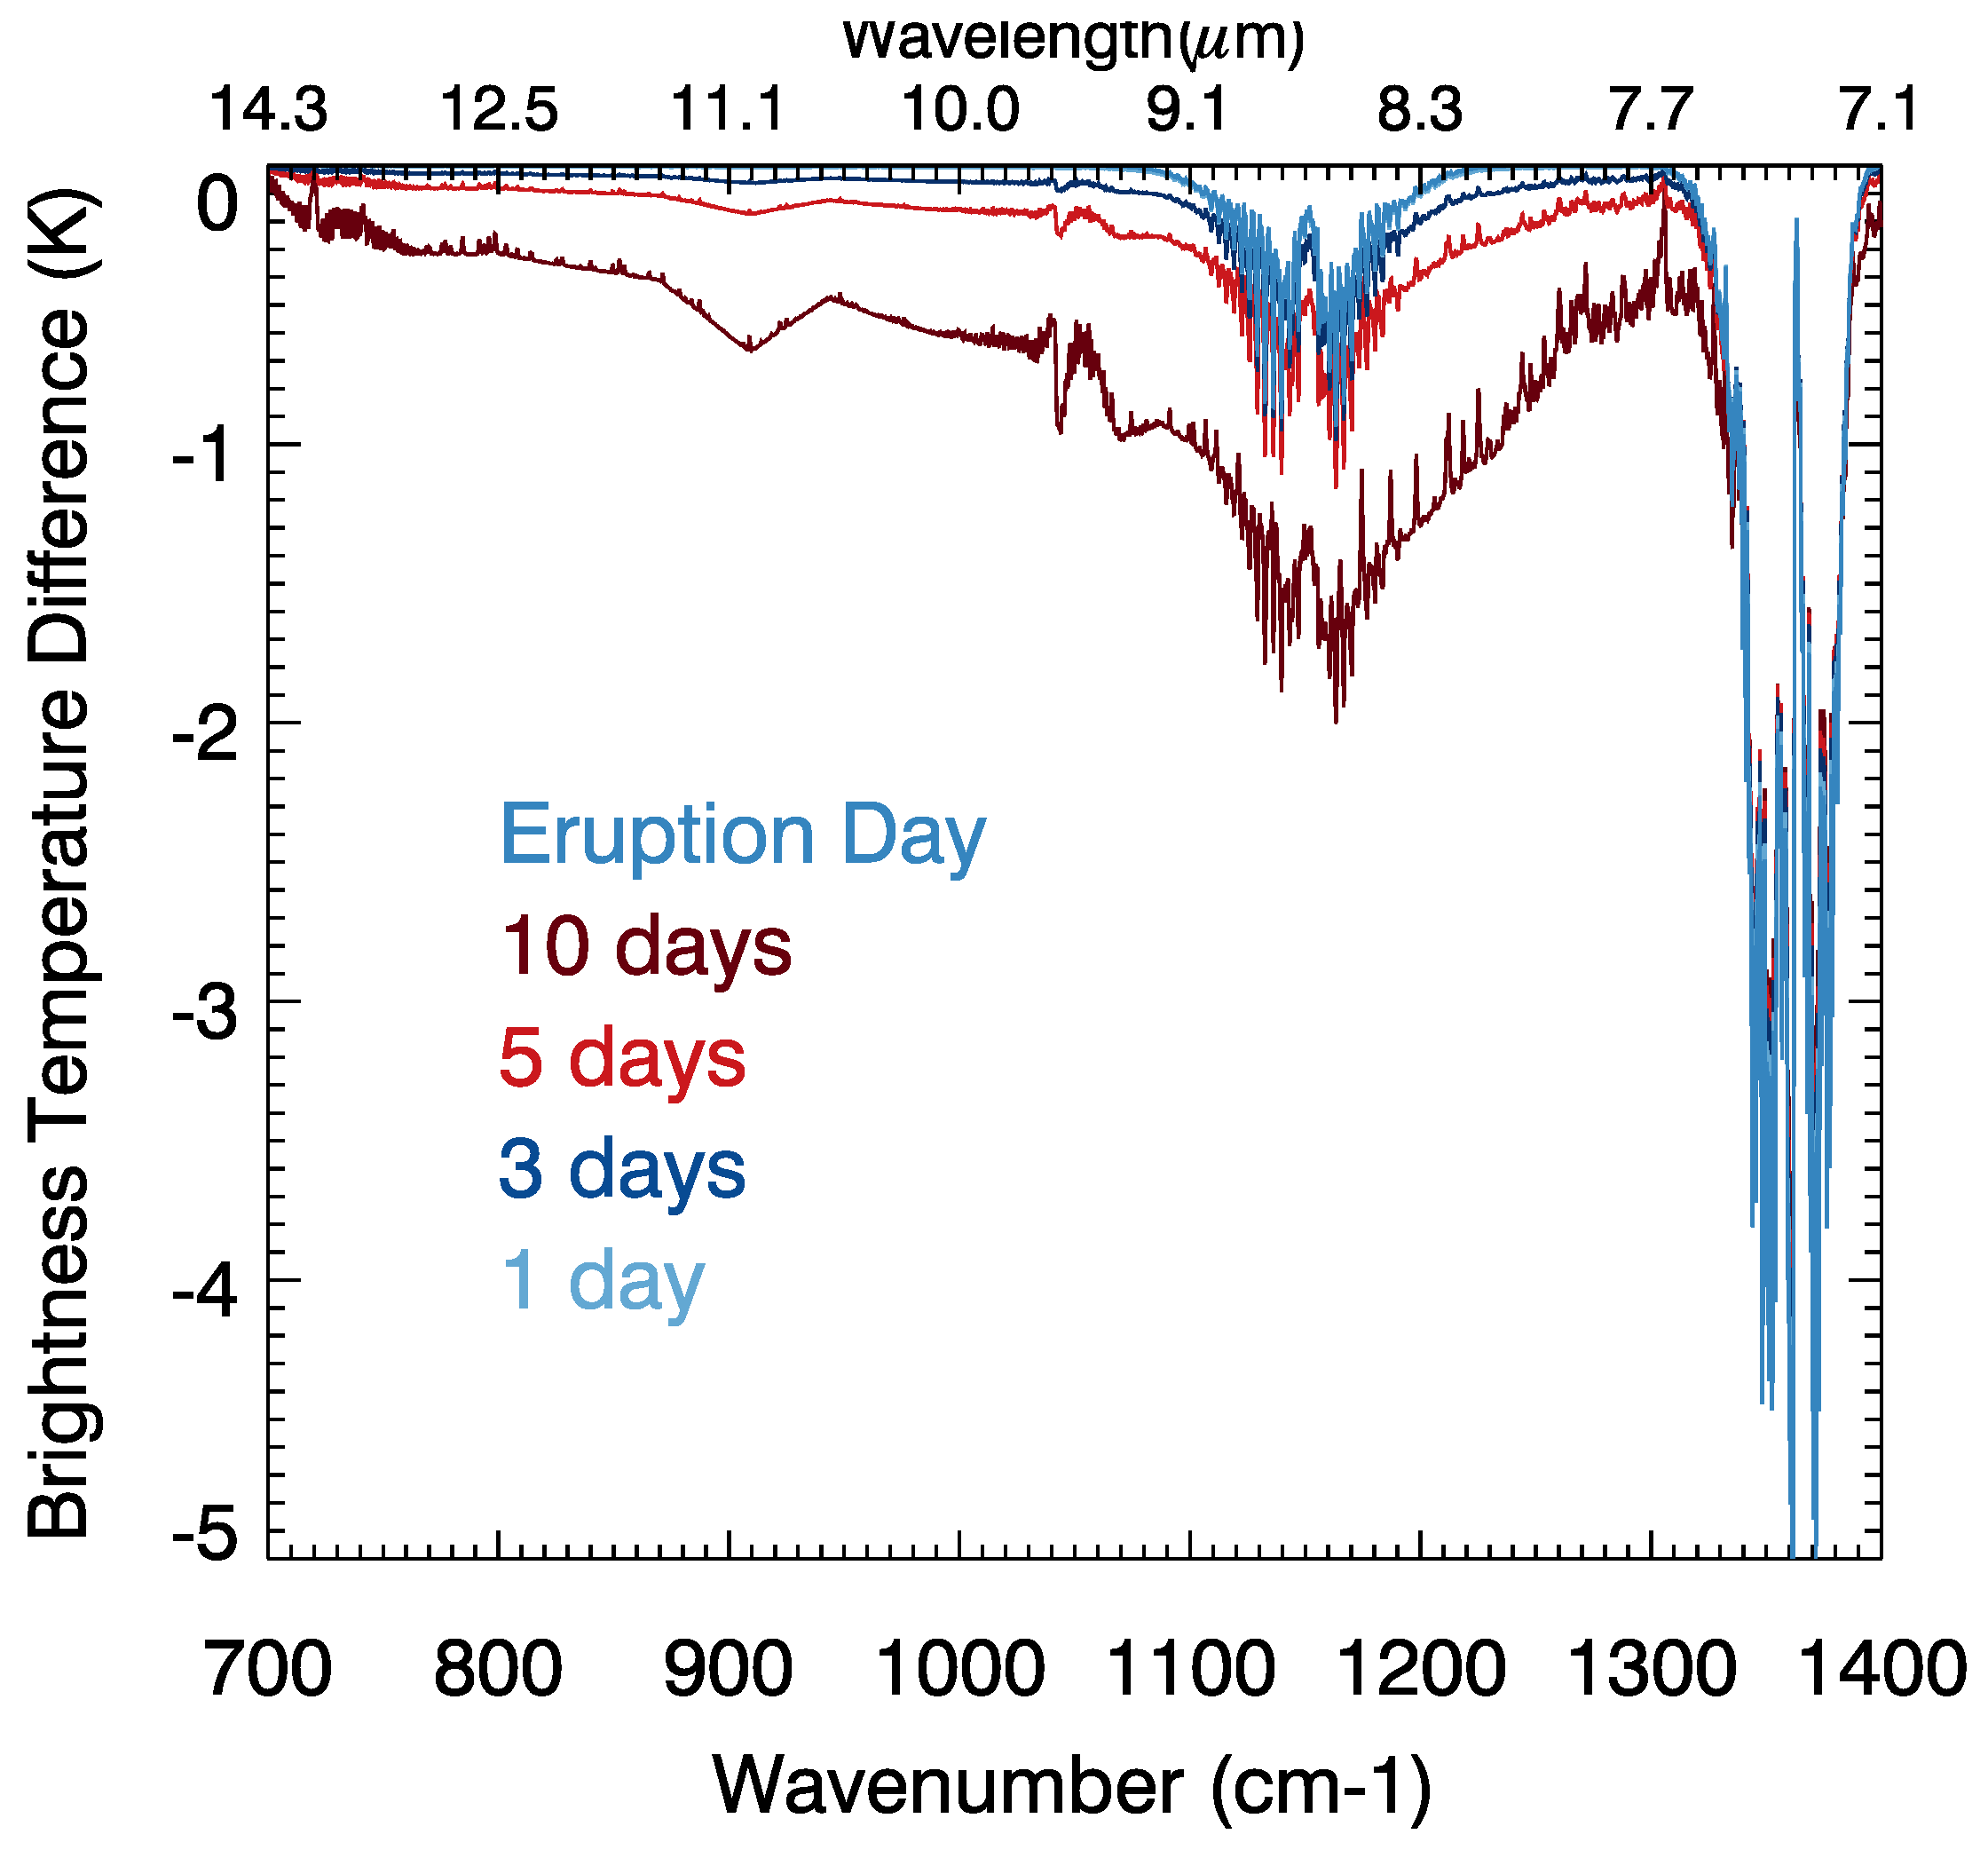
Figure 2 shows the synthetic spectra for IASI BT (Brightness Temperature) plume signatures (BT pseudo-observations with SO2 mixing ratio and SSA layer extinction, as simulated at each time interval, minus the pseudo-observation for the reference clear atmosphere), considering a plume injection altitude of 20.0 km. At the time of eruption, the residual spectrum is characterised by the SO2-only spectral absorption in the range 1100–1200 cm−1, with the largest absorption at 1150 and 1160 (e.g., [23]). A second, stronger absorption feature is visible in the range 1300–1400 cm−1. This absorption band presents competitive interference with water vapour [31] and is discarded from our subsequent analyses. Therefore, we consider only the spectral range between 700 and 1300 cm−1. Throughout the whole evolution, spectral signatures are also influenced by the presence of other interfering species, like the ozone (strong absorption band at about 1030 cm−1). For this reason, the instrumental channels affected by the strong ozone absorption are also discarded from our subsequent analyses (Channels IR8.7 for SEVIRI and 29 for MODIS). Then, for time intervals of one day, three days and five days after the eruption, the residual spectral is still markedly characterized by the SO2 absorption, but the whole-band signature of SSA gradually appears, including the maximum extinction at about 905 and 1150 cm−1. Starting from day 5, the spectral signature of the combined SSA and SO2 is particularly apparent. The plume residual signature at about 1150–1200 cm−1 for day 10 is approximately two times greater than for day 5 (about −1.0 K), reaching a value of about −2.0 K. This evolution is consistent with the SO2 depletion and SSA formation over time. These analyses confirm that the residual signature of SSA in IASI-like instruments becomes more and more important as SO2 converts to SSAs, and the effect of SO2 is overestimated due to the formation of these particles. As a matter of fact, starting from day 5, the SSA extinction is dominant with respect to SO2 absorption.
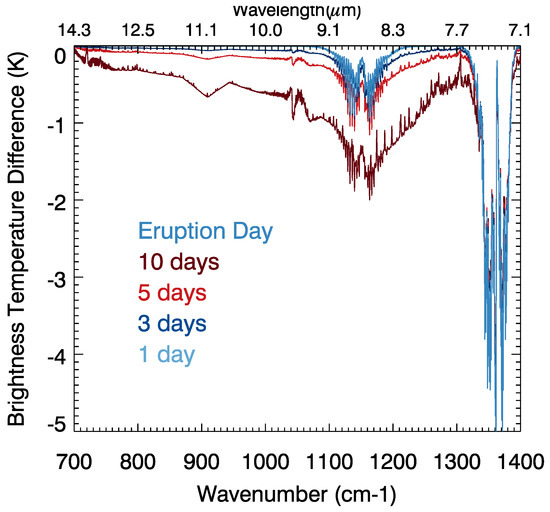
Figure 2.
Plume residual IASI pseudo-observations at four different time intervals (one day: sky blue; three days: dark blue; five days: light red; ten days: dark red) since eruption (reference pseudo-observation at the eruption in light blue). An injection altitude of 20.0 km is considered here.
3.3. The Impact of the Plume Altitude
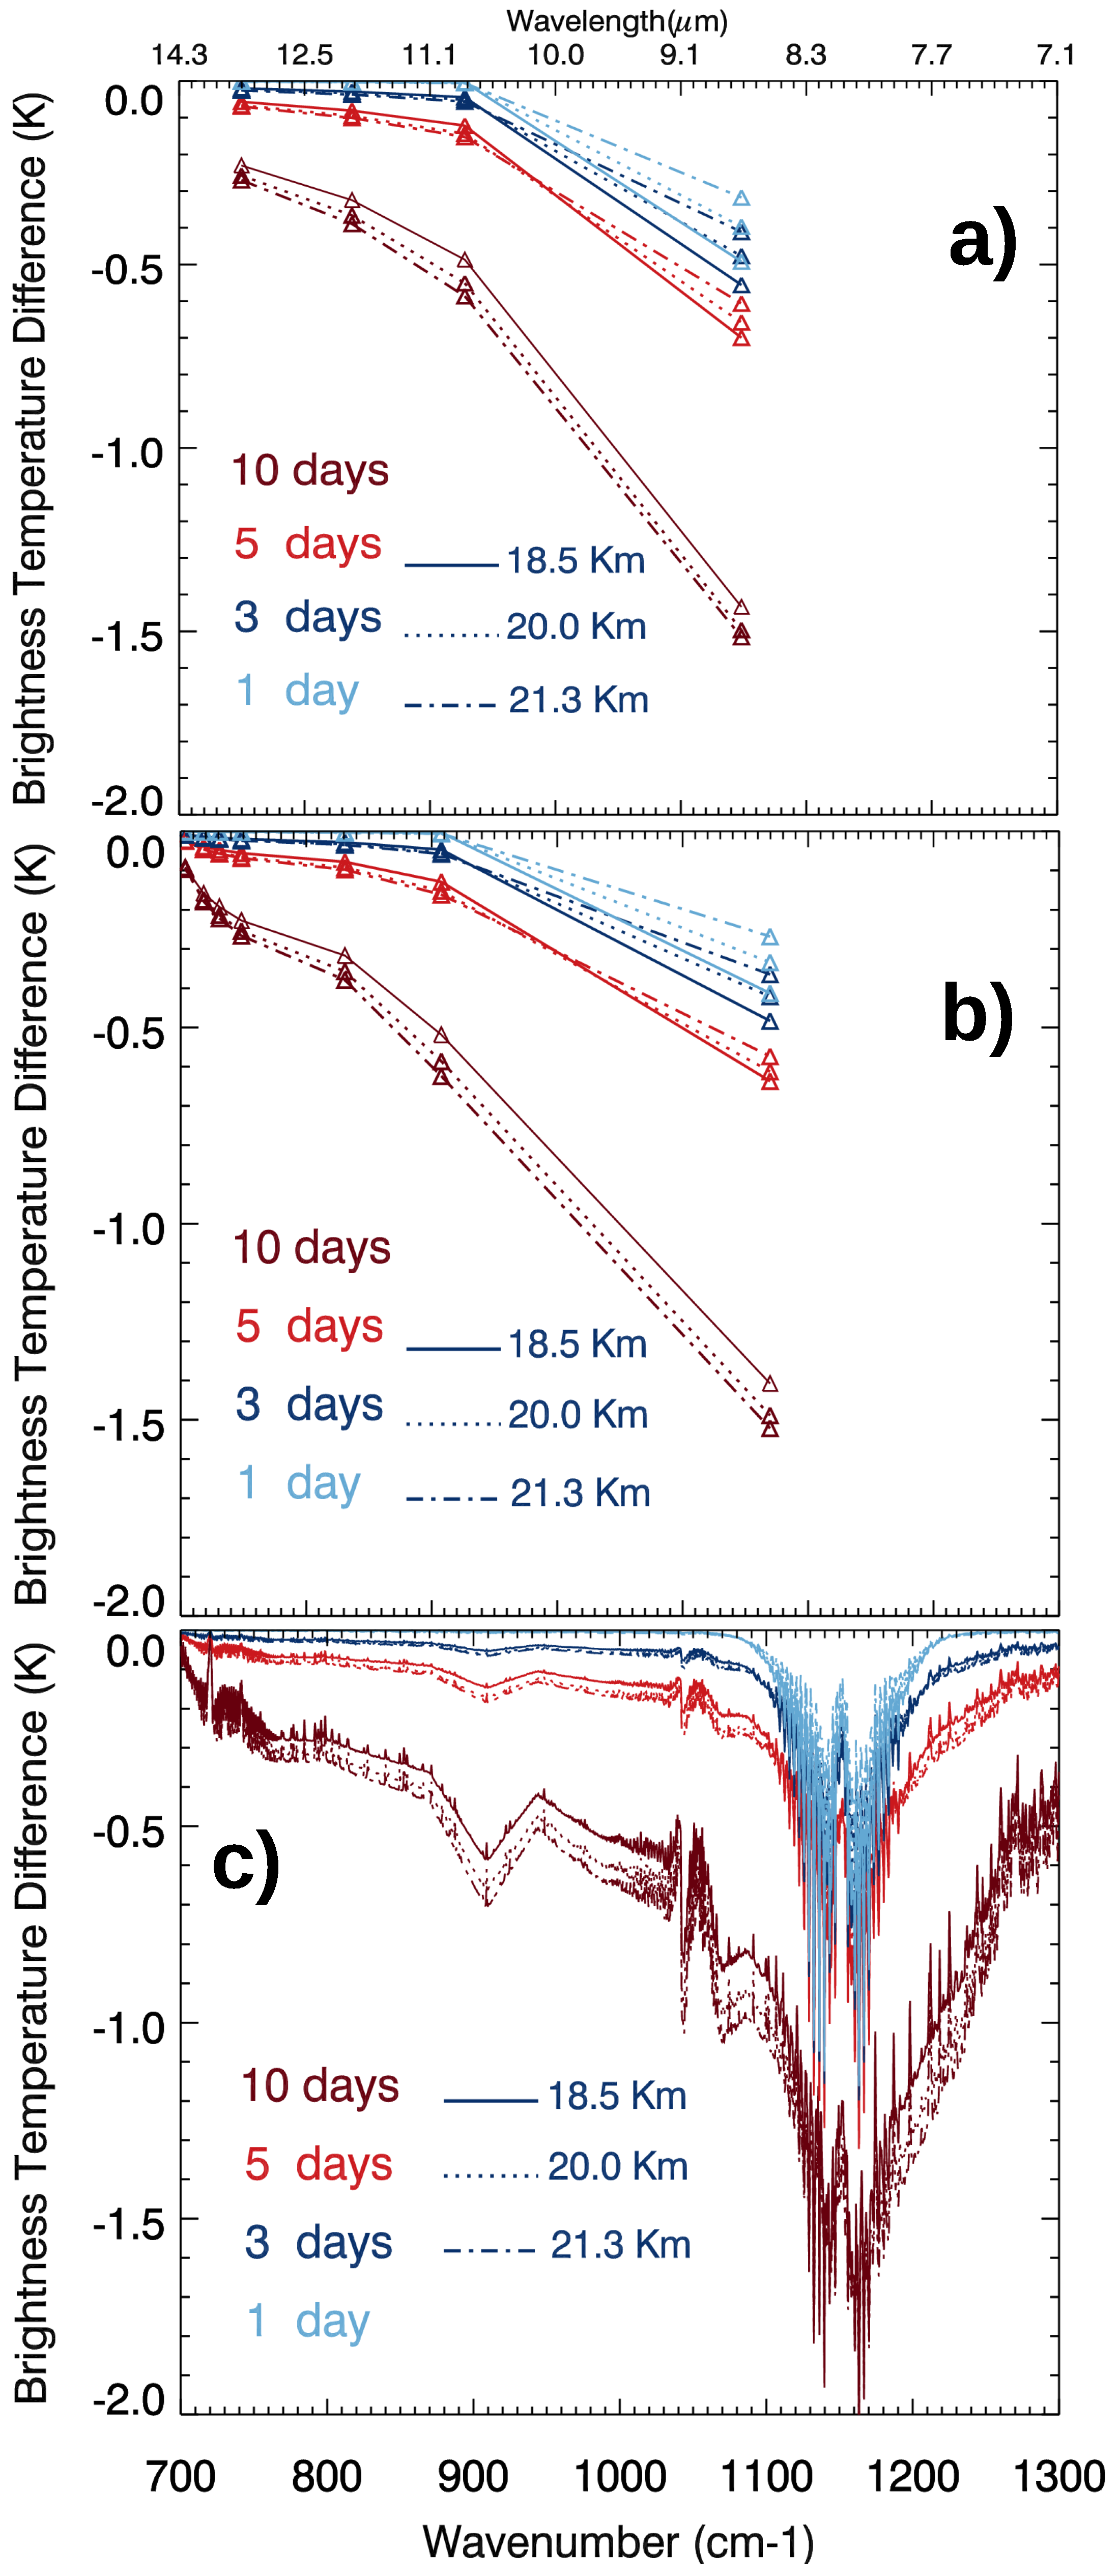
In order to investigate the influence of the initial volcanic SO2 injection altitude on the synthetic TIR observations, in Figure 3, we show the SEVIRI (Figure 3a), MODIS (Figure 3b) and IASI (Figure 3c) pseudo-observations for plumes at three different altitudes levels: 18.5, 20.0, and 21.3 km. The BT residual for the three instruments have similar spectral behaviour, though with lower spectral resolution for SEVIRI and MODIS with respect to IASI. The maximum signature of IASI pseudo-observations at 1100–1200 cm−1 is translated with a maximum signature at band 29 for MODIS and at band IR8.7 for SEVIRI. At this region, the signatures of SEVIRI and MODIS are less strong than the one of IASI. This is due to the internal convolution, during 4A RTM post-processing, with SEVIRI and MODIS RSR. Accurate information on one specific chemical species can get lost due to this band averaging. The main difference of MODIS with respect to SEVIRI is the larger number of exploitable bands (eight versus five), which, in turn, provides a better information content (as discussed later). Comparing the different curves, we notice very small differences, in general smaller than about 0.1 K, as a function of the altitude. Stronger signatures are associated with higher altitudes. This difference is more and more pronounced as the conversion to SSA progresses, and is stronger after 10 days from the eruption. Thus, the higher the plume layer, the greater its impact on the BT signature. This is a reasonable result because, when the aerosol layer is more distant from the satellite platform, the absorption of radiation by overlying gases (H2O and O3) partially hides the signature and reaches the satellite with more attenuation. However, it must be stressed that a BT difference of 0.1 K is generally under the radiometric noise of the three satellite instruments explored in this work and then the altitude information is hardly inferable from these differences.
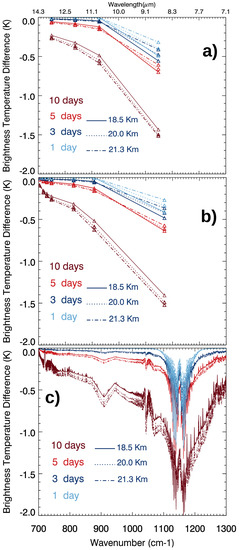
Figure 3.
(a) SEVIRI; (b) MODIS and (c) IASI BT residual pseudo-observations at four different time intervals (one day: sky blue; three days: dark blue; five days: light red; ten days: dark red) and for three plume altitudes (18.5 km: solid lines; 20.0 km: dotted lines; 21.3 km: dot-dashed lines).
For the analysed case, the atmospheric sulphur cycle evolution has an important and complex impact on the TIR pseudo-observation. The effect induced by SO2 is enhanced by the presence of sulphate aerosols. Retrieval efforts of SO2 concentrations should consider the interference with surely coexisting SSAs and vice-versa.
3.4. Information Content of SEVIRI, MODIS and IASI Pseudo-Observations
To more accurately quantify the sensitivity of TIR pseudo-observations to SO2 and SSA and their mutual interference shown in the previous section, here we aim to estimate the information content of these pseudo-observations on the retrieved parameters (SO2 and SSA masses). In particular, we evaluate this information content using Rodgers theory [40]. We set-up our ideal retrieval, defining a time-dependent parameter vector .
We first calculate the Jacobian matrix, representing the sensitivity of the spectral pseudo-observations to parameter vectors elements (in our case the two masses, and ). The Jacobian matrix elements, whose analytic expression is in Equation (4), are the partial derivatives of the BT measurement, at each wavenumber (index i), with respect to the retrieved parameters of the state vector (index j). From a numerical calculation perspective, for each investigated time interval t, we took a mean value of SO2 and SSA masses (). The IASI, MODIS and SEVIRI spectra were then simulated with the same atmospheric and instrumental set-up described in the Section 2.3, considering small positive and negative variation of, alternatively, and :
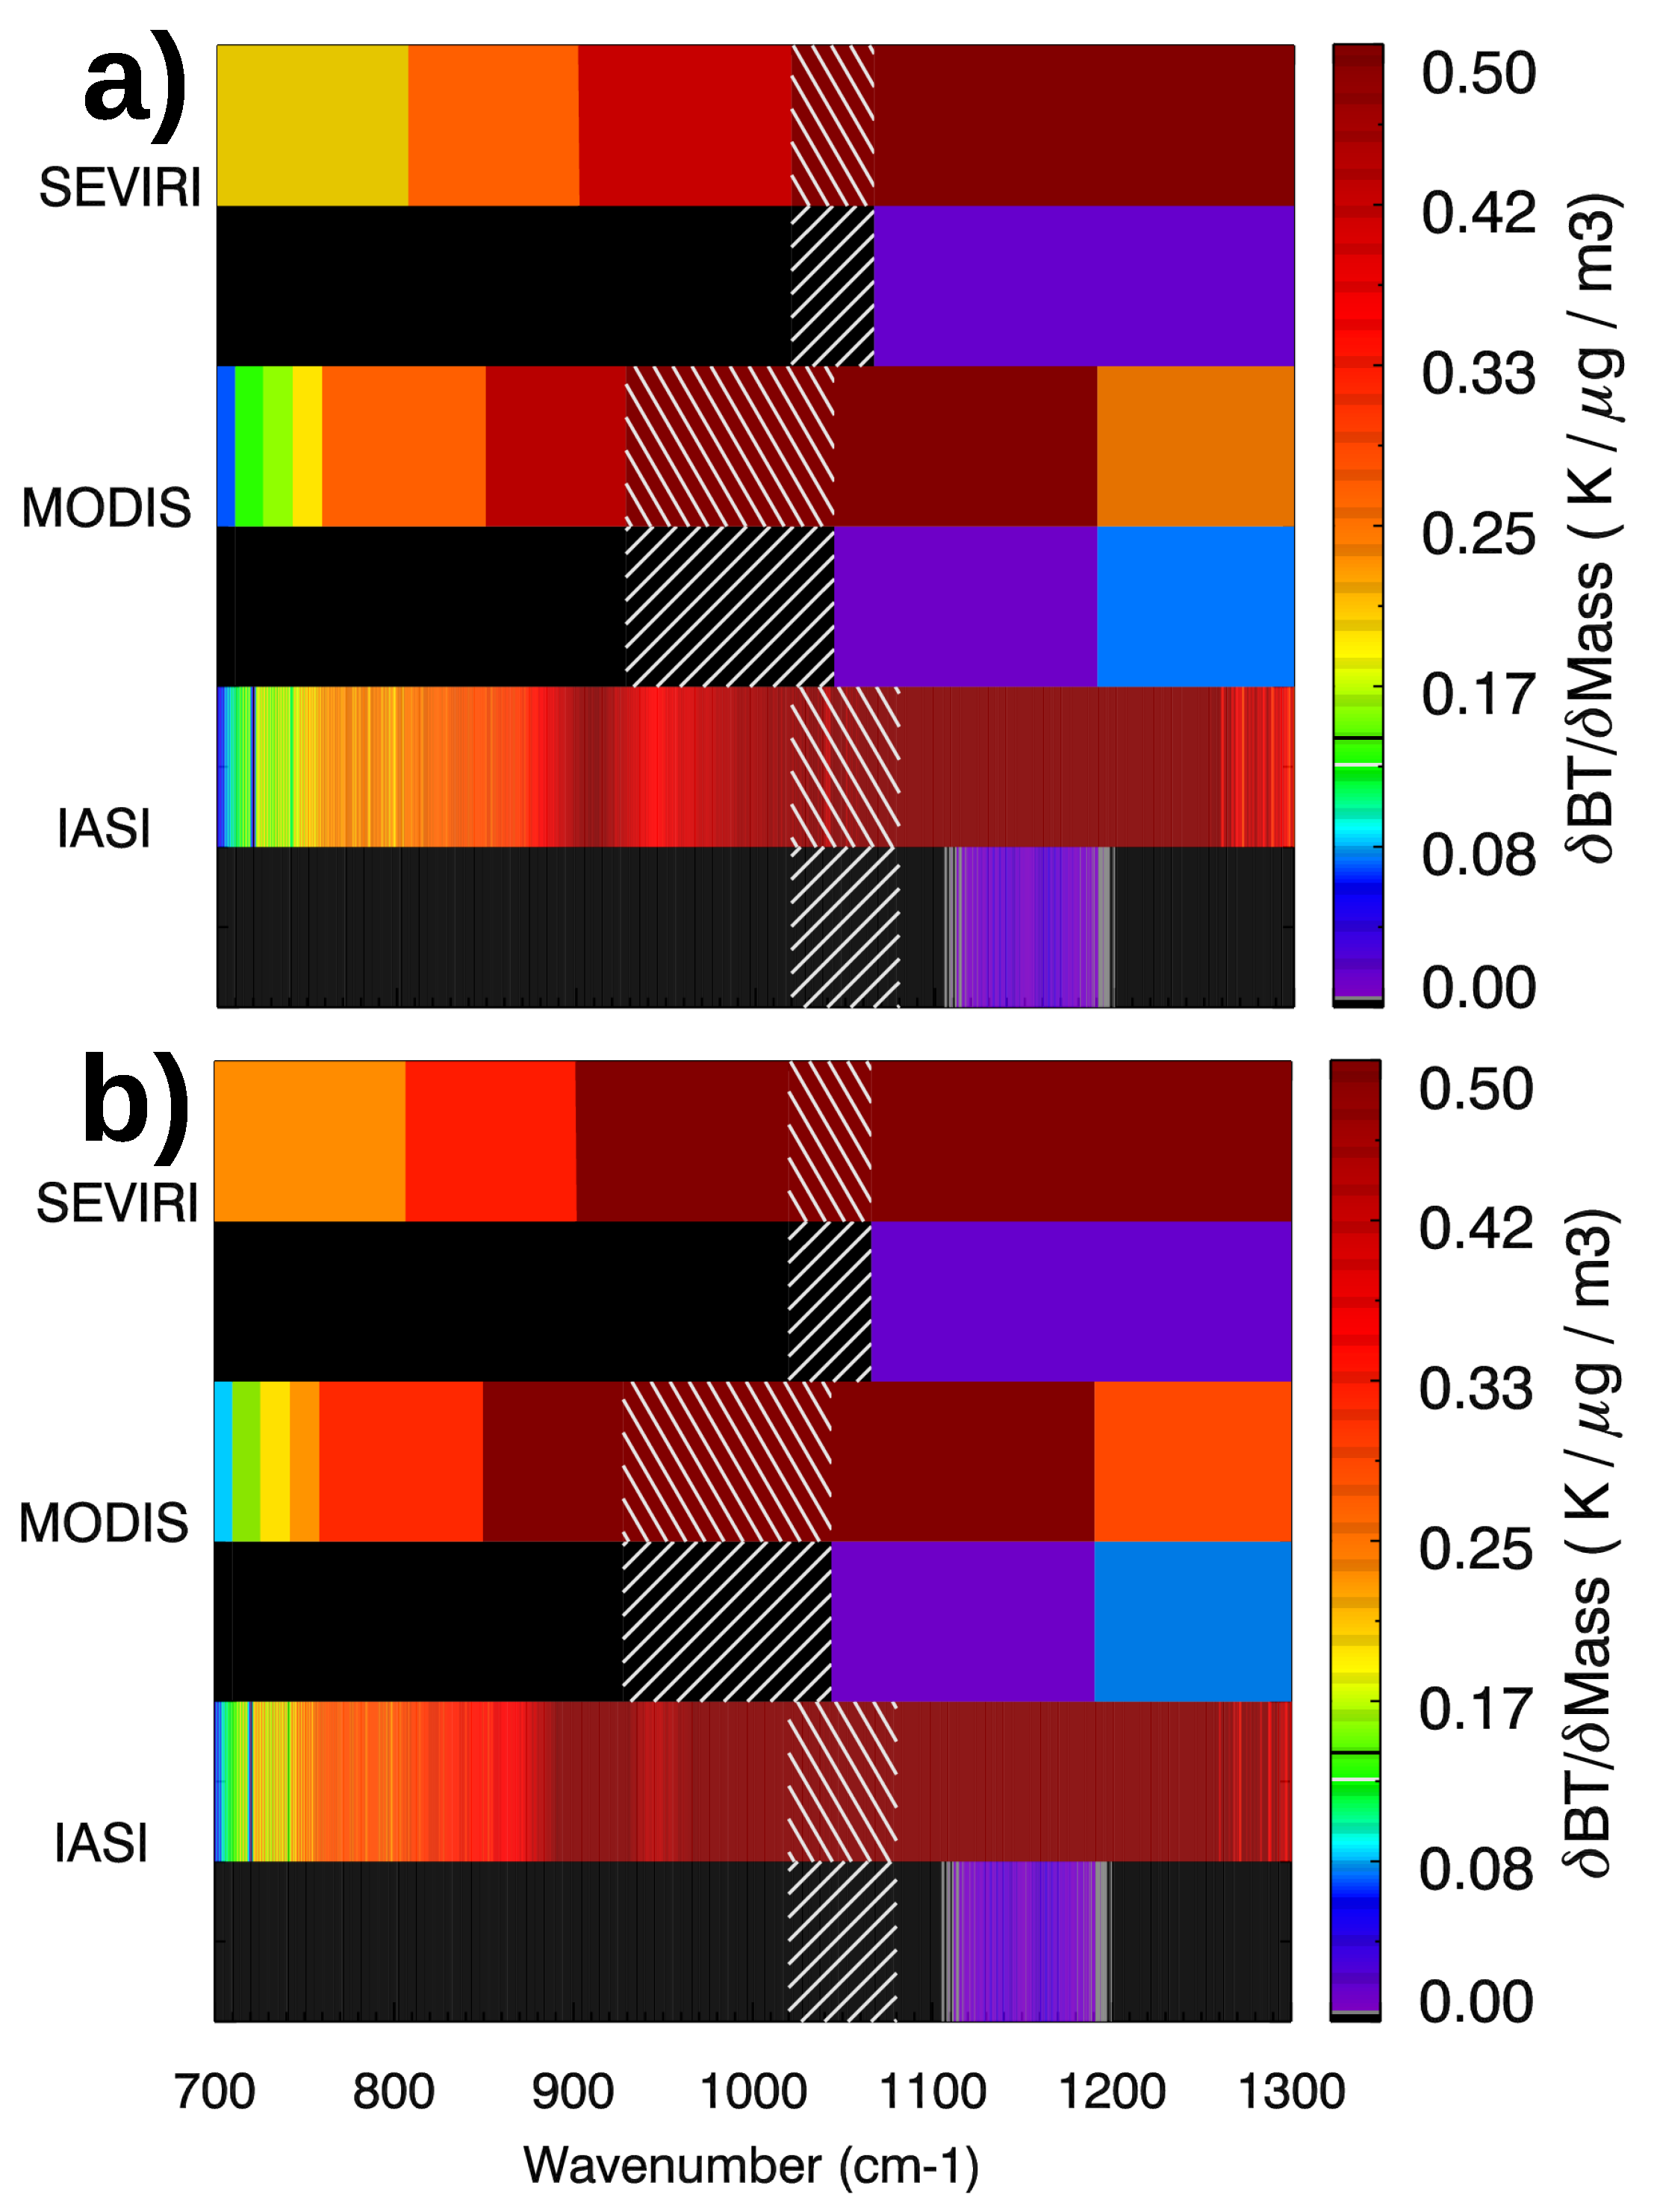
contains two lines that represent the weighting functions with respect to the two parameters and . The weighting functions of IASI, MODIS and SEVIRI pseudo-observations, as well as their temporal variability, are shown in Figure 4. Only time intervals t = 1 day and t = 10 days are shown, for a plume altitude of 20.0 km. The two time intervals represent the two extremes and so intermediate time intervals have, correspondingly, an intermediate behaviour between these two extremes. The sensitivity of TIR pseudo-observations to SSA, in terms of the weighting function, is about one order of magnitude higher that the sensitivity to SO2. Values as high as 0.50 K·· are found for SSA in the range of maximum sensitivity (1100–1200 cm−1) for the three instruments. Approximately in the same spectral region, the weighting function values for SO2 are about ten times smaller (about 0.05 K··). This is a strong indication that the SSA layer, even after a few days from the eruption, when the conversion of SO2 has generated only a small amount of SSA in terms of its mass, is significantly more active from a radiative point of view than SO2. From another perspective, the sensitivity of TIR observations to SO2 can be dramatically hampered by SSA formation, even after a few days from the eruption event. Another spectral region with strong sensitivity to SSA is found around 900 cm−1 (IASI) and band 31 (MODIS), due to the secondary absorption feature of undissociated H2SO4 in SSA droplets. The MODIS band 31 is very well adapted to catch this feature, being nicely centred around the peak at 905 cm−1 (please refer to Figure 1 to identify this peak). On the contrary, no similar band is available for SEVIRI, which hampers the exploitation of this information. As discussed before, we avoid in the following the region with ozone absorption interference, identified in Figure 4 by white crosshatches.
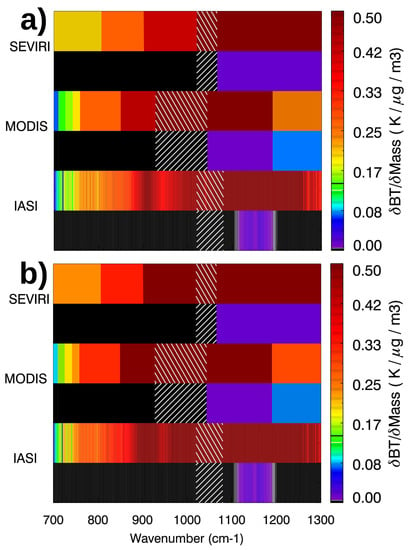
Figure 4.
Jacobian matrices for SEVIRI, MODIS and IASI pseudo-observations, at time intervals (a) t = 1 day and (b) t = 10 days. In the figure, the two line Jacobian matrix lines (the weighting functions), for each instrument and time interval, are ordered as follows: line 1 is the weighting function with respect to and line 2 is the weighting function with respect to . The ozone absorption region is identified by white crosshatches and excluded.
We further characterize the information content of the synthetic observations, with the averaging kernel matrix (Equation (5)), which represents the sensitivity of the retrieved state to the true state. In Equation (5), and represent, respectively, the measurement error covariance matrix and the a priori covariance matrix. The measurement error covariance matrix , representing the radiometric noise, is assumed diagonal with each diagonal element representing the Noise Equivalent Brightness Temperature (NEBT) in each spectral band, for each instrument. For IASI, the NEBT is taken as equal to 0.2 K for all wavenumbers. For MODIS, the NEBT is taken equal to 0.05 K for channels 29, 31, 32, to 0.25 K for channels 33, 34 and 35 and to 0.35 K for channel 36 [41]. For SEVIRI, NEBT values of 0.80, 0.94, 0.93 and 0.74 K are taken for channels IR8.7, IR10.8, IR12.0 and IR13.4 [42]. For our case study, we consider an a priori covariance matrix with two diagonal elements equal to 50% of the modelled SO2 mass and 100% of the modelled SSA mass, at each time interval t. This reflects the fact that a priori SSA information is hardly available, from both satellite and ground-based observations, and atmospheric chemical/micro-physical modelling. On the contrary, constraints on SO2 mixing ratios, e.g., at the time of eruption, can be derived from satellite (e.g., [23,29]) or, in the case of well instrumented volcanoes, from ground-based observations (e.g., [43]). We also added an additional water vapour uncertainty , due to the known interference with spectrally-ubiquitous water vapour absorption lines. These uncertainties are smaller than 0.2 K in our spectral region of interest [22,44]. Consequently, this value has been chosen as a conservation water vapour-related error in the subsequent calculations.
Starting from the averaging kernel matrix, two important diagnostics of the sensitivity of the retrieval can be derived: the number of degrees of freedom (DOF) and total error. The DOF is the trace of and quantifies the number of independent parameters that can be retrieved from the measurements. In Table 3, the DOFs for our simulated retrieval, for all the investigated time intervals and the three instrument configurations, are summarized. In our case, 2 being the dimensionality of the retrieved state vector ([, ]), the DOFs can take values between 0.0 (no retrievable independent parameters) and 2.0 (two perfectly independent retrievable parameters). The DOF for IASI pseudo-observations is about 2.0, which points at the fact that the two parameters can be retrieved independently. For MODIS and SEVIRI, the DOF values are around 1.0 (between 0.99 and 1.09 for MODIS and between 0.88 and 0.92 for SEVIRI). This confirms that SO2 and SSA are strongly inter-dependent and to discriminate the individual radiative contributions of the two effluents is virtually impossible without high-spectral resolution observations.

Table 3.
DOFs of SEVIRI, MODIS and IASI pseudo-observations to the retrieval of the state vector [, ], at different time intervals since the eruption event.
The theoretical estimation of the total uncertainties, using the Rodgers theory, is also very important to assess the expected quality of the retrievals. The total error covariance matrix (see Equation (6)) is generally expressed in terms of the smoothing error and the radiometric noise Sm [40]. As mentioned before, we consider an additional error component that takes into account the interference of water vapour absorption:
The total error estimations for the two retrieved quantities (the diagonal elements of ) are summarized in Table 4. For MODIS and SEVIRI, SO2 retrieval uncertainties are found around 50%. On the contrary, SO2 retrieval uncertainties with IASI observations are smaller than 7.0%. As for the SSA, uncertainties of SEVIRI observations reach values as high as about 25% to 35%. MODIS shows lower uncertainties, smaller than 10%. This is mostly due to the smaller radiometric noise and the contribution of band 31, centred around the distinct and peculiar absorption peak of SSAs around 900 cm−1. Theoretical uncertainties are definitely smaller for IASI observations, smaller than 1%. To summarize, broad-band instruments like SEVIRI and MODIS cannot gain quantitative observations of both SO2 and SSA mass burden as independent informations. After just one day from the eruption event, the SO2 can only be observed with significant (around 50%) uncertainties, while the radiatively predominant SSAs, even if in small amounts, can be quantified in terms of their mass, with reasonable uncertainties. These results thus suggest that care must be taken when attempting to quantitatively observe SO2 burdens from volcanic eruptions with broad-band instruments. These observations are accurate only under a few hours from the eruptive event and aged plumes, containing a mixture of SO2 and SSAs (and possibly other gaseous and particulate volcanic effluents) are difficult to characterize in terms of SO2-only information. This is mainly due to the concurrent spectral features of these two effluents, basically in the same band, centred around 1200 cm−1. As for IASI-like high-spectral-resolution sounders, the two effluents are in principle independently retrievable with limited uncertainties on both.

Table 4.
Total error (%) of SEVIRI, MODIS and IASI pseudo-observations to the retrieval of the state vector [, ], at different time intervals since the eruption event.
4. Conclusions
The present study gives a detailed analysis of IASI, MODIS and SEVIRI TIR pseudo-observations and their information content on SO2 and SSA, at different time intervals and altitudes following an ideal moderate stratospheric eruption (injection of 10 DU of SO2 around 20 km of altitude, in a tropical atmosphere). The mutual interference of SSA and SO2 on the outgoing TIR radiation and then on the observed BT signal observed by satellite instruments has never been studied in these terms, to our knowledge. Our analyses demonstrate that, despite the relatively small amount of SSA formed (in terms of their total mass), the combined effect of the volcanic SO2 and SSA on the TIR pseudo-observations is apparent after 3 to 5 days from the eruption and is very important after 10 days. In effect, the maximum spectral signature of the two volcanic effluents locate approximately in the same region (about 1100–1200 cm−1, linked to a vibrational mode of both SO2 and the undissociated H2SO4 present in SSA droplets). These results are quantitatively confirmed by assessing the information content of the TIR pseudo-observations to a test bi-dimensional state vector of retrieved parameters, constituted by the SO2 and SSA masses. The sensitivity of TIR pseudo-observations to SSA, in terms of the Jacobian matrix, is about one order magnitude bigger than the sensitivity to SO2 (0.50 versus 0.05 K·· in the range of maximum sensitivity around 1100–1200 cm−1, for the three instruments). For the broad-band instruments like MODIS or SEVIRI, the information content of TIR pseudo-observations to SO2 and SSA mass burdens are strongly inter-dependent (DOF around 1.0) and to discriminate the individual radiative contributions of the two effluents is virtually impossible without the high spectral resolution of IASI-like instruments (DOF of about 2.0). The theoretical uncertainties for MODIS and SEVIRI are about 50% for the SO2, 10% (SEVIRI) and 25% to 35% (MODIS) for the SSA. IASI- related uncertainties are, on the contrary, smaller than 7.0%, for the SO2, and lower than 1%, for the SSA. This demonstrates that the high-spectral-resolution observations of IASI-like instruments allows, in principle, to quantitatively observe these two volcanic effluents as independent, and low-uncertainties parameters are found, through the analysed 10-days short-term evolution. On the contrary, broad-band instruments like SEVIRI and MODIS cannot gain quantitative observations of both SO2 and SSA mass burden as independent pieces of information.
Further analyses using new generation TIR instruments such as Himawari, Visible Infrared Imaging Radiometer Suite (VIIRS) and IASI-NG (New Generation) are needed to characterize future possibilities in complex volcanic plume combined monitoring. In addition, studies regarding the case of tropospheric eruptions, where atmospheric processes are potentially more complex, are still ongoing.
Acknowledgments
We would like to acknowledge NOVELTIS (L’innovation au service de la Protection du Vivant) and Alain Chédin for supporting us with the radiative transfer model 4A. The optical parameters of sulphate aerosol layers used in this work are obtained with the Interactive Data Language (IDL) Mie scattering routines developed by the Earth Observation Data Group of the Department of Physics of Oxford University, and available via the following website: http://eodg.atm.ox.ac.uk/MIE/. This project has been partially supported by the EU 7th Framework Program under Grant No. 603557 (StratoClim). The two anonymous reviewers are gratefully acknowledged.
Author Contributions
Henda Guermazi and Pasquale Sellitto conceived this study and wrote the paper. Henda Guermazi performed the simulation. Pasquale Sellitto supervised all activities. All authors revised and approved the manuscript.
Conflicts of Interest
The authors declare no conflict of interest.
Abbreviations
The following abbreviations are used in this manuscript:
| BT | Brightness Temperature |
| CNES | Centre National D’études Spatiales |
| DISORT | DIScrete ORdinaTe algorithm |
| DOF | Degrees of Freedom |
| DU | Dobson Unit |
| EOS | Earth Observing System |
| EUMETSAT | EUropean organisation for the exploitation of METeorological SATellite |
| H2SO4 | Sulphuric acid |
| IASI | Infrared Atmospheric Sounding Interferometer |
| IR | InfraRed |
| IDL | Interactive Data Language |
| GEISA | GEstion des Informations Spectroscopiques Atmosphériques |
| MetOP | METeorological OPerational |
| MODIS | MODerate resolution Imaging Spectroradiometer |
| MSG | Meteosat Second Generation |
| NASA | National Aeronautics and Space Administration |
| NEBT | Noise Equivalent Brightness Temperature |
| OH | Hydroxyl |
| O2 | Oxygen |
| RSR | Relative Spectral Response |
| RTM | Radiative Transfer Model |
| SEVIRI | Spinning Enhanced Visible and Infrared Imager |
| SO2 | Sulphur Dioxide |
| SSA | Secondary Sulphate Aerosol |
| TIR | Thermal InfraRed |
| UTLS | Upper Troposphere Lower Stratosphere |
| UV | UltraViolet |
| VIIRS | visible Infrared Imager Radiometer Suite |
| VNIR | Visible Near InfraRed |
| 4A | Automatized Atmospheric Absorption Atlas |
References
- Graf, H.F.; Langmann, B.; Feichter, J. The contribution of Earth degassing to the atmospheric sulfur budget. Chem. Geol. 1998, 147, 131–145. [Google Scholar] [CrossRef]
- Sellitto, P.; Zanetel, C.; di Sarra, A.; Salerno, G.; Tapparo, A.; Meloni, D.; Pace, G.; Caltabiano, T.; Briole, P.; Legras, B. The impact of Mount Etna sulfur emissions on the atmospheric composition and aerosol properties in the central Mediterranean: A statistical analysis over the period 2000–2013 based on observations and Lagrangian modelling. Atmos. Environ. 2017, 148, 77–88. [Google Scholar] [CrossRef]
- Robock, A. Volcanic eruptions and climate. Rev. Geophys. 2000, 38, 191–219. [Google Scholar] [CrossRef]
- Grainger, D.G.; Highwood, E.J. Changes in stratospheric composition, chemistry, radiation and climate caused by volcanic eruptions. Geol. Soc. 2013, 213, 329–347. [Google Scholar] [CrossRef]
- Halmer, M.; Schmincke, H.U.; Graf, H.F. The annual volcanic gas input into the atmosphere, in particular into the stratosphere: A global data set for the past 100 years. J. Volcanol. Geotherm. Res. 2002, 115, 511–528. [Google Scholar] [CrossRef]
- Ridley, D.A.; Solomon, S.; Barnes, J.E.; Burlakov, V.D.; Deshler, T.; Dolgii, S.I.; Herber, A.B.; Nagai, T.; Neely, R.R.; Nevzorov, A.V.; et al. Total volcanic stratospheric aerosol optical depths and implications for global climate change. Geophys. Res. Lett. 2014, 41, 7763–7769. [Google Scholar] [CrossRef]
- Stenchikov, G.L.; Kirchner, I.; Robock, A.; Graf, H.F.; Antuña, J.C.; Grainger, R.G.; Lambert, A.; Thomason, L. Radiative forcing from the 1991 Mount Pinatubo volcanic eruption. J. Geophys. Res. Atmos. 1998, 103, 13837–13857. [Google Scholar] [CrossRef]
- Solomon, S.; Portmann, R.W.; Garcia, R.R.; Thomason, L.W.; Poole, L.R.; McCormick, M.P. The role of aerosol variations in anthropogenic ozone depletion at northern midlatitudes. J. Geophys. Res. Atmos. 1996, 101, 6713–6727. [Google Scholar] [CrossRef]
- Malavelle, F.F.; Haywood, J.M.; Jones, A.; Gettelman, A.; Clarisse, L.; Bauduin, S.; Allan, R.P.; Karset, I.H.H.; Kristjánsson, J.E.; Oreopoulos, L.; et al. Strong constraints on aerosol-cloud interactions from volcanic eruptions. Nature 2017, 546, 485–491. [Google Scholar] [CrossRef] [PubMed]
- Seinfeld, J.; Pandis, S. Atmospheric Chemistry and Physics: From Air Pollution to Climate Change; John Wiley: New York, NY, USA, 2012. [Google Scholar]
- Doeringer, D.; Eldering, A.; Boone, C.D.; González Abad, G.; Bernath, P.F. Observation of sulfate aerosols and SO2 from the Sarychev volcanic eruption using data from the Atmospheric Chemistry Experiment (ACE). J. Geophys. Res. Atmos. 2012, 117, D03203. [Google Scholar] [CrossRef]
- Castleman, A.W., Jr.; Davis, R.D.; Tang, I.N.; Ball, J.A. Heterogeneous processes and the chemistry of aerosol formation in the upper atmosphere. In Proceedings of the Fourth Conference on the Climatic Assessment Program DOT-TSC-OST-75-38, Department of Transportation, Cambridge, MD, USA, 4–7 February 1975. [Google Scholar]
- Oppenheimer, C.; Francis, P.; Stix, J. Depletion rates of sulfur dioxide in tropospheric volcanic plumes. Geophys. Res. Lett. 1998, 25, 2671–2674. [Google Scholar] [CrossRef]
- Pruppacher, J.; Klett, J. Microphyscics of Clouds and Precipitation, Atmospheric and Oceanic Sciences Library, 2nd ed.; Kluwer Academic Publishers: Norwell, MA, USA, 2004; p. 954. [Google Scholar]
- Steel, H.; Hamill, P. Effects of temperature and humidity on the grouwth and optical properties of sulfuric acid water droplets in the stratosphere. J. Aerosol Sci. 1981, 12, 517–528. [Google Scholar] [CrossRef]
- Bluth, G.J.S.; William, I.; Rose, I.E.S.; Krueger, A.J. Stratospheric Loading of Sulfur from Explosive Volcanic Eruptions. J. Geol. 1997, 1105, 671–683. [Google Scholar] [CrossRef]
- Stevenson, D.S.; Johnson, C.E.; Highwood, E.J.; Gauci, V.; Collins, W.J.; Derwent, R.G. Atmospheric impact of the 1783–1784 Laki eruption: Part I Chemistry modelling. Atmos. Chem. Phys. 2003, 3, 487–507. [Google Scholar] [CrossRef]
- Allen, A.G.; Oppenheimer, C.; Ferm, M.; Baxter, P.J.; Horrocks, L.A.; Galle, B.; McGonigle, A.J.S.; Duffell, H.J. Primary sulfate aerosol and associated emissions from Masaya Volcano, Nicaragua. J. Geophys. Res. Atmosp. 2002, 107, ACH 5-1–ACH 5-8. [Google Scholar] [CrossRef]
- Coffey, M.T. Observations of the impact of volcanic activity on stratospheric chemistry. J. Geophys. Res. Atmos. 1996, 101, 6767–6780. [Google Scholar] [CrossRef]
- Carn, S.; Clarisse, L.; Prata, A. Multi-decadal satellite measurements of global volcanic degassing. J. Volcanol. Geotherm. Res. 2016, 311, 99–134. [Google Scholar] [CrossRef]
- Clarisse, L.; Coheur, P.F.; Prata, F.; Hadji-Lazaro, J.; Hurtmans, D.; Clerbaux, C. A unified approach to infrared aerosol remote sensing and type specification. Atmos. Chem. Phys. 2013, 13, 2195–2221. [Google Scholar] [CrossRef]
- Sellitto, P.; Legras, B. Sensitivity of thermal infrared nadir instruments to the chemical and microphysical properties of UTLS secondary sulfate aerosols. Atmos. Meas. Tech. 2016, 9, 115–132. [Google Scholar] [CrossRef]
- Carboni, E.; Grainger, R.; Walker, J.; Dudhia, A.; Siddans, R. A new scheme for sulphur dioxide retrieval from IASI measurements: Application to the Eyjafjallajokull eruption of April and May 2010. Atmos. Chem. Phys. 2012, 12, 11417–11434. [Google Scholar] [CrossRef]
- Sellitto, P.; di Sarra, A.; Corradini, S.; Boichu, M.; Herbin, H.; Dubuisson, P.; Sèze, G.; Meloni, D.; Monteleone, F.; Merucci, L.; et al. Synergistic use of Lagrangian dispersion and radiative transfer modelling with satellite and surface remote sensing measurements for the investigation of volcanic plumes: The Mount Etna eruption of 25–27 October 2013. Atmos. Chem. Phys. 2016, 16, 6841–6861. [Google Scholar] [CrossRef]
- Karagulian, F.; Clarisse, L.; Clerbaux, C.; Prata, A.J.; Hurtmans, D.; Coheur, P.F. Detection of volcanic SO2, ash, and H2SO4 using the Infrared Atmospheric Sounding Interferometer (IASI). J. Geophys. Res. Atmos. 2010, 115, D00L02. [Google Scholar] [CrossRef]
- Sellitto, P.; Sèze, G.; Legras, B. Secondary sulphate aerosols and cirrus clouds detection with SEVIRI during Nabro volcano eruption. Int. J. Remote Sens. 2017, 38, 5657–5672. [Google Scholar]
- Clerbaux, C.; Coheur, P.F.; Clarisse, L.; Hadji-Lazaro, J.; Hurtmans, D.; Turquety, S.; Bowman, K.; Worden, H.; Carn, S.A. Measurements of SO2 profiles in volcanic plumes from the NASA Tropospheric Emission Spectrometer (TES). Geophys. Res. Lett. 2008, 35, L22807. [Google Scholar] [CrossRef]
- Carboni, E.; Grainger, R.G.; Mather, T.A.; Pyle, D.M.; Thomas, G.E.; Siddans, R.; Smith, A.J.A.; Dudhia, A.; Koukouli, M.E.; Balis, D. The vertical distribution of volcanic SO2 plumes measured by IASI. Atmos. Chem. Phys. 2016, 16, 4343–4367. [Google Scholar] [CrossRef]
- Corradini, S.; Merucci, L.; Prata, A.J. Retrieval of SO2 from thermal infrared satellite measurements: Correction procedures for the effects of volcanic ash. Atmos. Meas. Tech. 2009, 2, 177–191. [Google Scholar] [CrossRef]
- Dubuisson, P.; Herbin, H.; Minvielle, F.; Compiègne, M.; Thieuleux, F.; Parol, F.; Pelon, J. Remote sensing of volcanic ash plumes from thermal infrared: A case study analysis from SEVIRI, MODIS and IASI instruments. Atmos. Meas. Tech. 2014, 7, 359–371. [Google Scholar] [CrossRef]
- Prata, A.J.; Kerkmann, J. Simultaneous retrieval of volcanic ash and SO2 using MSG-SEVIRI measurements. Geophys. Res. Lett. 2007, 34, L05813. [Google Scholar] [CrossRef]
- Miles, G.M.; Grainger, R.G.; Highwood, E.J. The significance of volcanic eruption strength and frequency for climate. Q. J. R. Meteorol. Soc. 2004, 130, 2361–2376. [Google Scholar] [CrossRef]
- McCormick, B.T.; Herzog, M.; Yang, J.; Edmonds, M.; Mather, T.A.; Carn, S.A.; Hidalgo, S.; Langmann, B. A comparison of satellite- and ground-based measurements of SO2 emissions from Tungurahua volcano, Ecuador. J. Geophys. Res. Atmos. 2014, 119, 4264–4285. [Google Scholar] [CrossRef]
- Lambert, A.; Grainger, R.G.; Rodgers, C.D.; Taylor, F.W.; Mergenthaler, J.L.; Kumer, J.B.; Massie, S.T. Global evolution of the Mt. Pinatubo volcanic aerosols observed by the infrared limb-sounding instruments CLAES and ISAMS on the Upper Atmosphere Research Satellite. J. Geophys. Res. Atmos. 1997, 102, 1495–1512. [Google Scholar] [CrossRef]
- SPARC. SPARC Assessment of Stratospheric Aerosol Properties (ASAP); Technical Report No. 4, WCRP-124, WMO/TD-No. 1295; SPARC offices: Paris, French; Toronto, ON, Canada, 2006. [Google Scholar]
- Scott, N.; Chedin, A. A fast line-by-line method for atmospheric absorption computations: The Automatized Atmospheric Absorption Atlas. J. Appl. Meteorol. 1981, 20, 802–812. [Google Scholar] [CrossRef]
- Noveltis. L’innovation au Service de la Protection du Vivant. Available online: http://www.noveltis.com/ (accessed on 13 September 2017). (In French).
- Biermann, U.M.; Luo, B.P.; Peter, T. Absorption Spectra and Optical Constants of Binary and Ternary Solutions of H2SO4, HNO3, and H2O in the Mid Infrared at Atmospheric Temperatures. J. Phys. Chem. A 2000, 104, 783–793. [Google Scholar] [CrossRef]
- Stamnes, K.; Tsay, S.C.; Wiscombe, W.; Jayaweera, K. Numerically stable algorithm for discrete-ordinate- method radiative transfer in multiple scattering and emitting layered media. Appl. Opt. 1988, 27, 2502–2509. [Google Scholar] [CrossRef] [PubMed]
- Rodgers, C.D. Inverse Methods for Atmospheric Sounding: Theory and Practice; Series on Atmospheric Oceanic and Planetary Physics; World Scientific: London, UK, 2000; Volume 2, pp. 43–64. [Google Scholar]
- Wan, Z. Estimate of noise and systematic error in early thermal infrared data of the Moderate Resolution Imaging Spectroradiometer (MODIS). Remote Sens. Environ. 2002, 80, 47–54. [Google Scholar] [CrossRef]
- EUMETSAT. Typical Radiometric Accuracy and Noise for MSG-1/2. Available online: http://www.eumetsat.int/website/wcm/idc/idcplg?IdcService=GET_FILE&dDocName=PDF_TYP_307RADIOMET_ACC_MSG-1-2&RevisionSelectionMethod=LatestReleased&Rendition=Web (accessed on 26 February 2007).
- Salerno, G.; Burton, M.; Oppenheimer, C.; Caltabiano, T.; Randazzo, D.; Bruno, N.; Longo, V. Three-years of SO2 flux measurements of Mt. Etna using an automated UV scanner array: Comparison with conventional traverses and uncertainties in flux retrieval. J. Volcanol. Geotherm. Res. 2009, 183, 76–83. [Google Scholar] [CrossRef]
- Pougatchev, N.; August, T.; Calbet, X.; Hultberg, T.; Oduleye, O.; Schlüssel, P.; Stiller, B.; Germain, K.S.; Bingham, G. IASI temperature and water vapor retrievals—Error assessment and validation. Atmos. Chem. Phys. 2009, 9, 6453–6458. [Google Scholar] [CrossRef]
© 2017 by the authors. Licensee MDPI, Basel, Switzerland. This article is an open access article distributed under the terms and conditions of the Creative Commons Attribution (CC BY) license (http://creativecommons.org/licenses/by/4.0/).

