Article

Variations in the Concentration of Magnetic Minerals and Heavy Metals in Suspended Sediments from Citarum River and Its Tributaries, West Java, Indonesia

Faculty of Mining and Petroleum Engineering, Institut Teknologi Bandung, Jalan Ganesha 10, Bandung 40132, Indonesia
*
Author to whom correspondence should be addressed.
Geosciences 2017, 7(3), 66; https://doi.org/10.3390/geosciences7030066
Submission received: 13 June 2017 / Revised: 27 July 2017 / Accepted: 31 July 2017 / Published: 3 August 2017

Abstract

:
The Citarum River has a volcanic catchment area in West Java Province, and is one of the nationally strategic rivers in tropical Indonesia due to its roles in water supply and in power generation. The river is economically important, but it is also polluted by industrial, agricultural, and residential wastes. Suspended sediment samples were collected along a certain section of the Citarum River, starting in Balekambang through the area of Bandung Regency to the downstream village of Nanjung, where the river is dammed. Similar samples were also collected from seven tributaries of the Citarum River. Magnetic and heavy metal analyses show that unlike river sediments from a non-volcanic catchment area in temperate climates, magnetic susceptibility values tend to decrease downstream, showing that the magnetic minerals in the upstream area are mostly lithogenic in origin, containing more Fe-bearing minerals compared to those in tributary samples which are anthropogenic in origin. Anthropogenic pollution is also represented by the increase of Zn content along the river. The results suggest that applying magnetic methods for monitoring river pollution in the tropics or in the volcanic areas should be carefully analyzed and interpreted.

1. Introduction

Magnetic methods have been widely used to monitor anthropogenic pollution, including heavy metals (especially heavy metals in soil and sediments), as these methods are considered simple, fast, and non-destructive [1,2,3,4,5,6,7,8,9,10,11]. Several studies [12,13] observed significant increases in the quantity of magnetic minerals in the surface of soils and sediments caused by industrial activities that released heavy metals. Increases in both heavy metals and magnetic minerals have also been found in agricultural soil irrigated by river water that runs through a steel factory [14]. Other studies [15,16] looked at sedimentary cores from Minjiang River in Southeast China and showed that during the growth of modern industry in the area from 1950 to 2010, the increases in the concentration of Cu and Pb were accompanied by the increase in magnetic mineral concentration. Most of the aforementioned studies were carried out in temperate climate and in non-volcanic catchment areas. At least one of these studies [11] dealt with changes in magnetic concentration in the main river and the influence of the tributaries.
Figure 1a shows that the Citarum River in West Java has a volcanic catchment area. In tropical Indonesia, such an area would have intense bedrock weathering that produces highly magnetic particulates. Therefore, in such an area, anthropogenic pollution will not necessarily increase the magnetic minerals and heavy metal contents in the river sediment. Depending on the nature of the anthropogenic pollutants, mixing of relatively less-magnetic pollutants (e.g., Zn bearing phases) with lithogenic ferromagnetic minerals originating from the river sediments might dilute the susceptibility signal of sediments as the river passes through industrial and residential areas.
In this study, magnetic minerals and heavy metal contents in suspended sediment from the Citarum River and its tributaries in West Java, Indonesia, were measured to identify how they vary from the relatively pristine area upstream to the heavily polluted area downstream. This information is especially important in determining the feasibility of using magnetic methods for monitoring pollution. The Citarum River is classified as an Indonesian National Strategic River due to its roles in providing water supply for residential and industrial areas, for agricultural irrigation, and for power generation through three dams (Saguling, Cirata, and Jatiluhur) supporting about 25 million people [17].

2. Materials and Methods

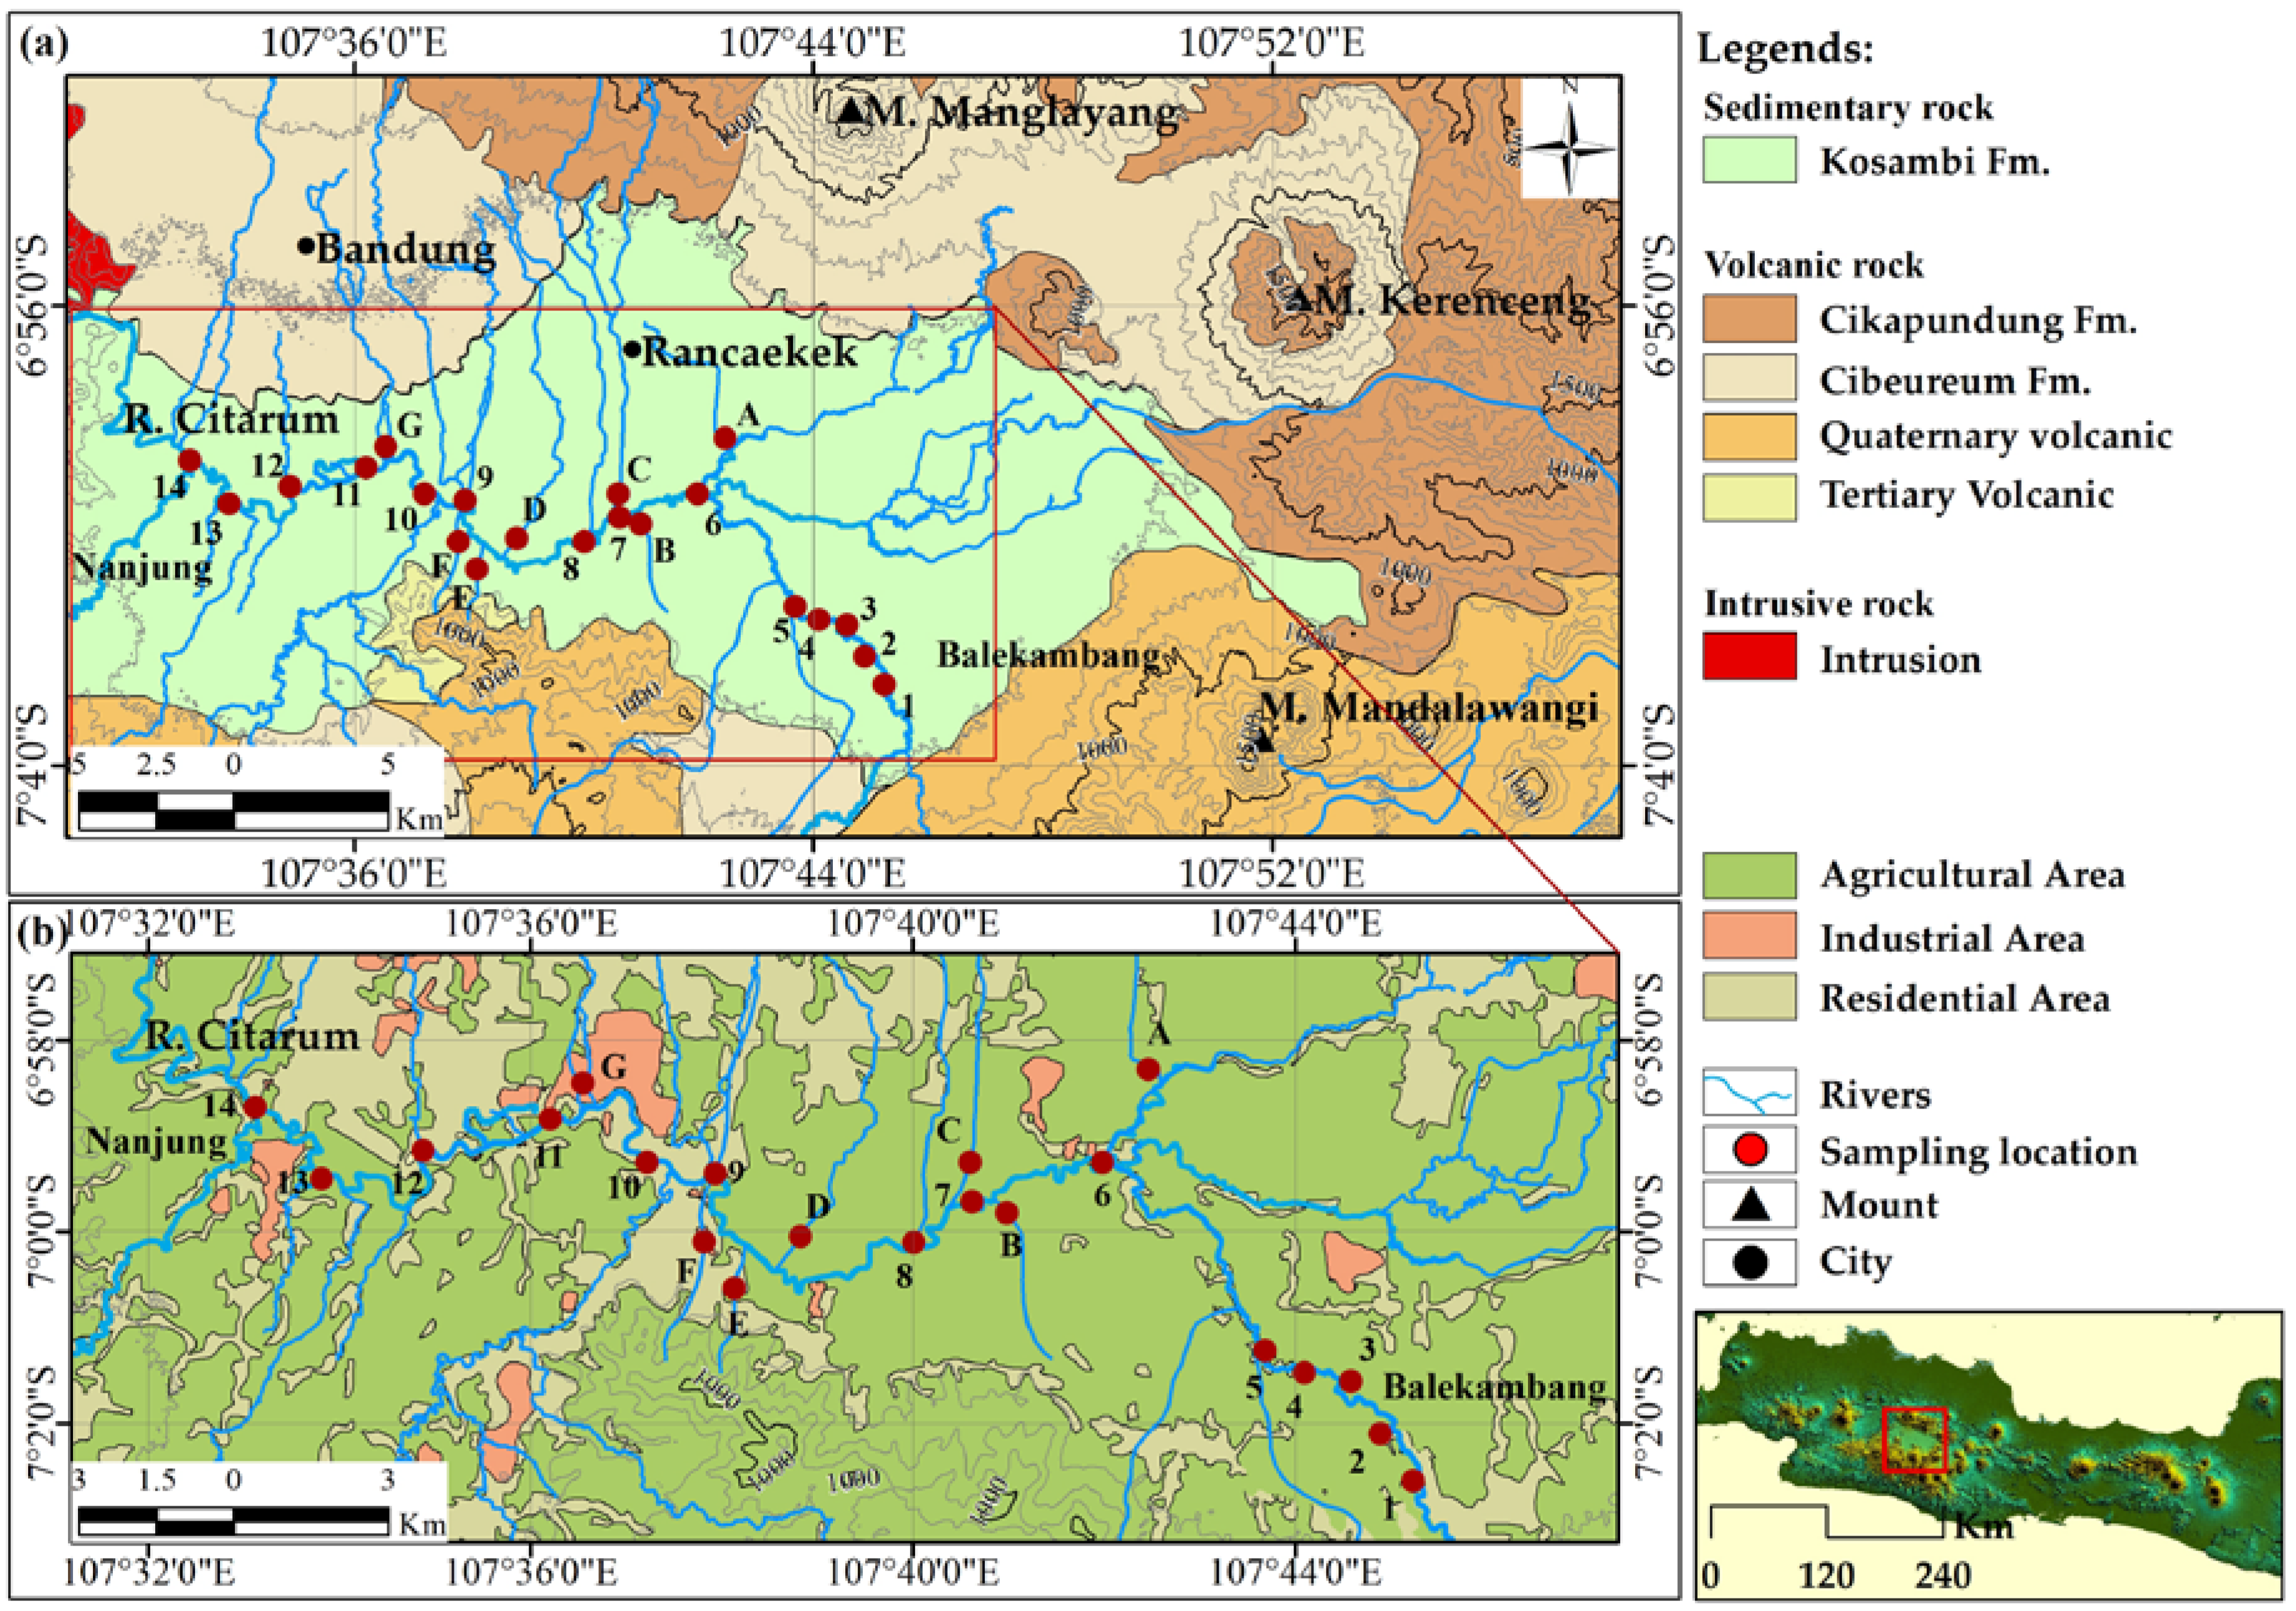
2.1. Description of the Research Area

The 269-km-long Citarum River is the longest river in West Java Province. The Citarum River has been experiencing serious pollution problems originating from agricultural, residential, and industrial wastes [18]. In this study, we concentrate our attention on the river segment between the relatively pristine areas of Balekambang to Nanjung, where the river is dammed at the Saguling Dam (Figure 1a). Between these two points, the Citarum River passes through the southern part of the city of Bandung—the third largest city of Indonesia, which is heavily populated and industrialized (see Figure 1b for land use around the study site). There are also several tributaries at this segment. The sampling sites (shown as red dots in Figure 1a) are located in the Kosambi Formation interpreted as lake deposits, with a composition of volcanic clays, siltstones, and sandstones. The age is around the Upper Pleistocene up to the Holocene [19]. The area is surrounded by Quaternary volcanic sediments and the Cikapundung and Cibeureum Formations. The Cikapundung Formation consists of layers of volcanic breccia that are of Pleistocene up to Middle Pliocene in age, while the Cibeureum Formation consists of layers of volcanic breccia which are Late Pleistocene–Holocene in age [19]. The area to the North of the Citarum River has predominantly industrial and residential use, whereas the area to the south of the Citarum River is predominantly used for agriculture (Figure 1b). The predominant soil type in the study areas is Inceptisol [17].
The Citarum River region is in a tropical climate with high rainfall and humidity throughout the year. For Bandung, the average annual temperature is 26.8 °C, while the average annual rainfall is 2120 mm [20]. In the higher elevations in the southern part of Bandung, however, the average annual rainfall could be as high as 4000 mm [17]. Volumetric flow rates recorded in the inlet of Saguling Dam vary greatly from 578 m3/s in the peak of rainy season to only 2.7 m3/s in dry season [21].

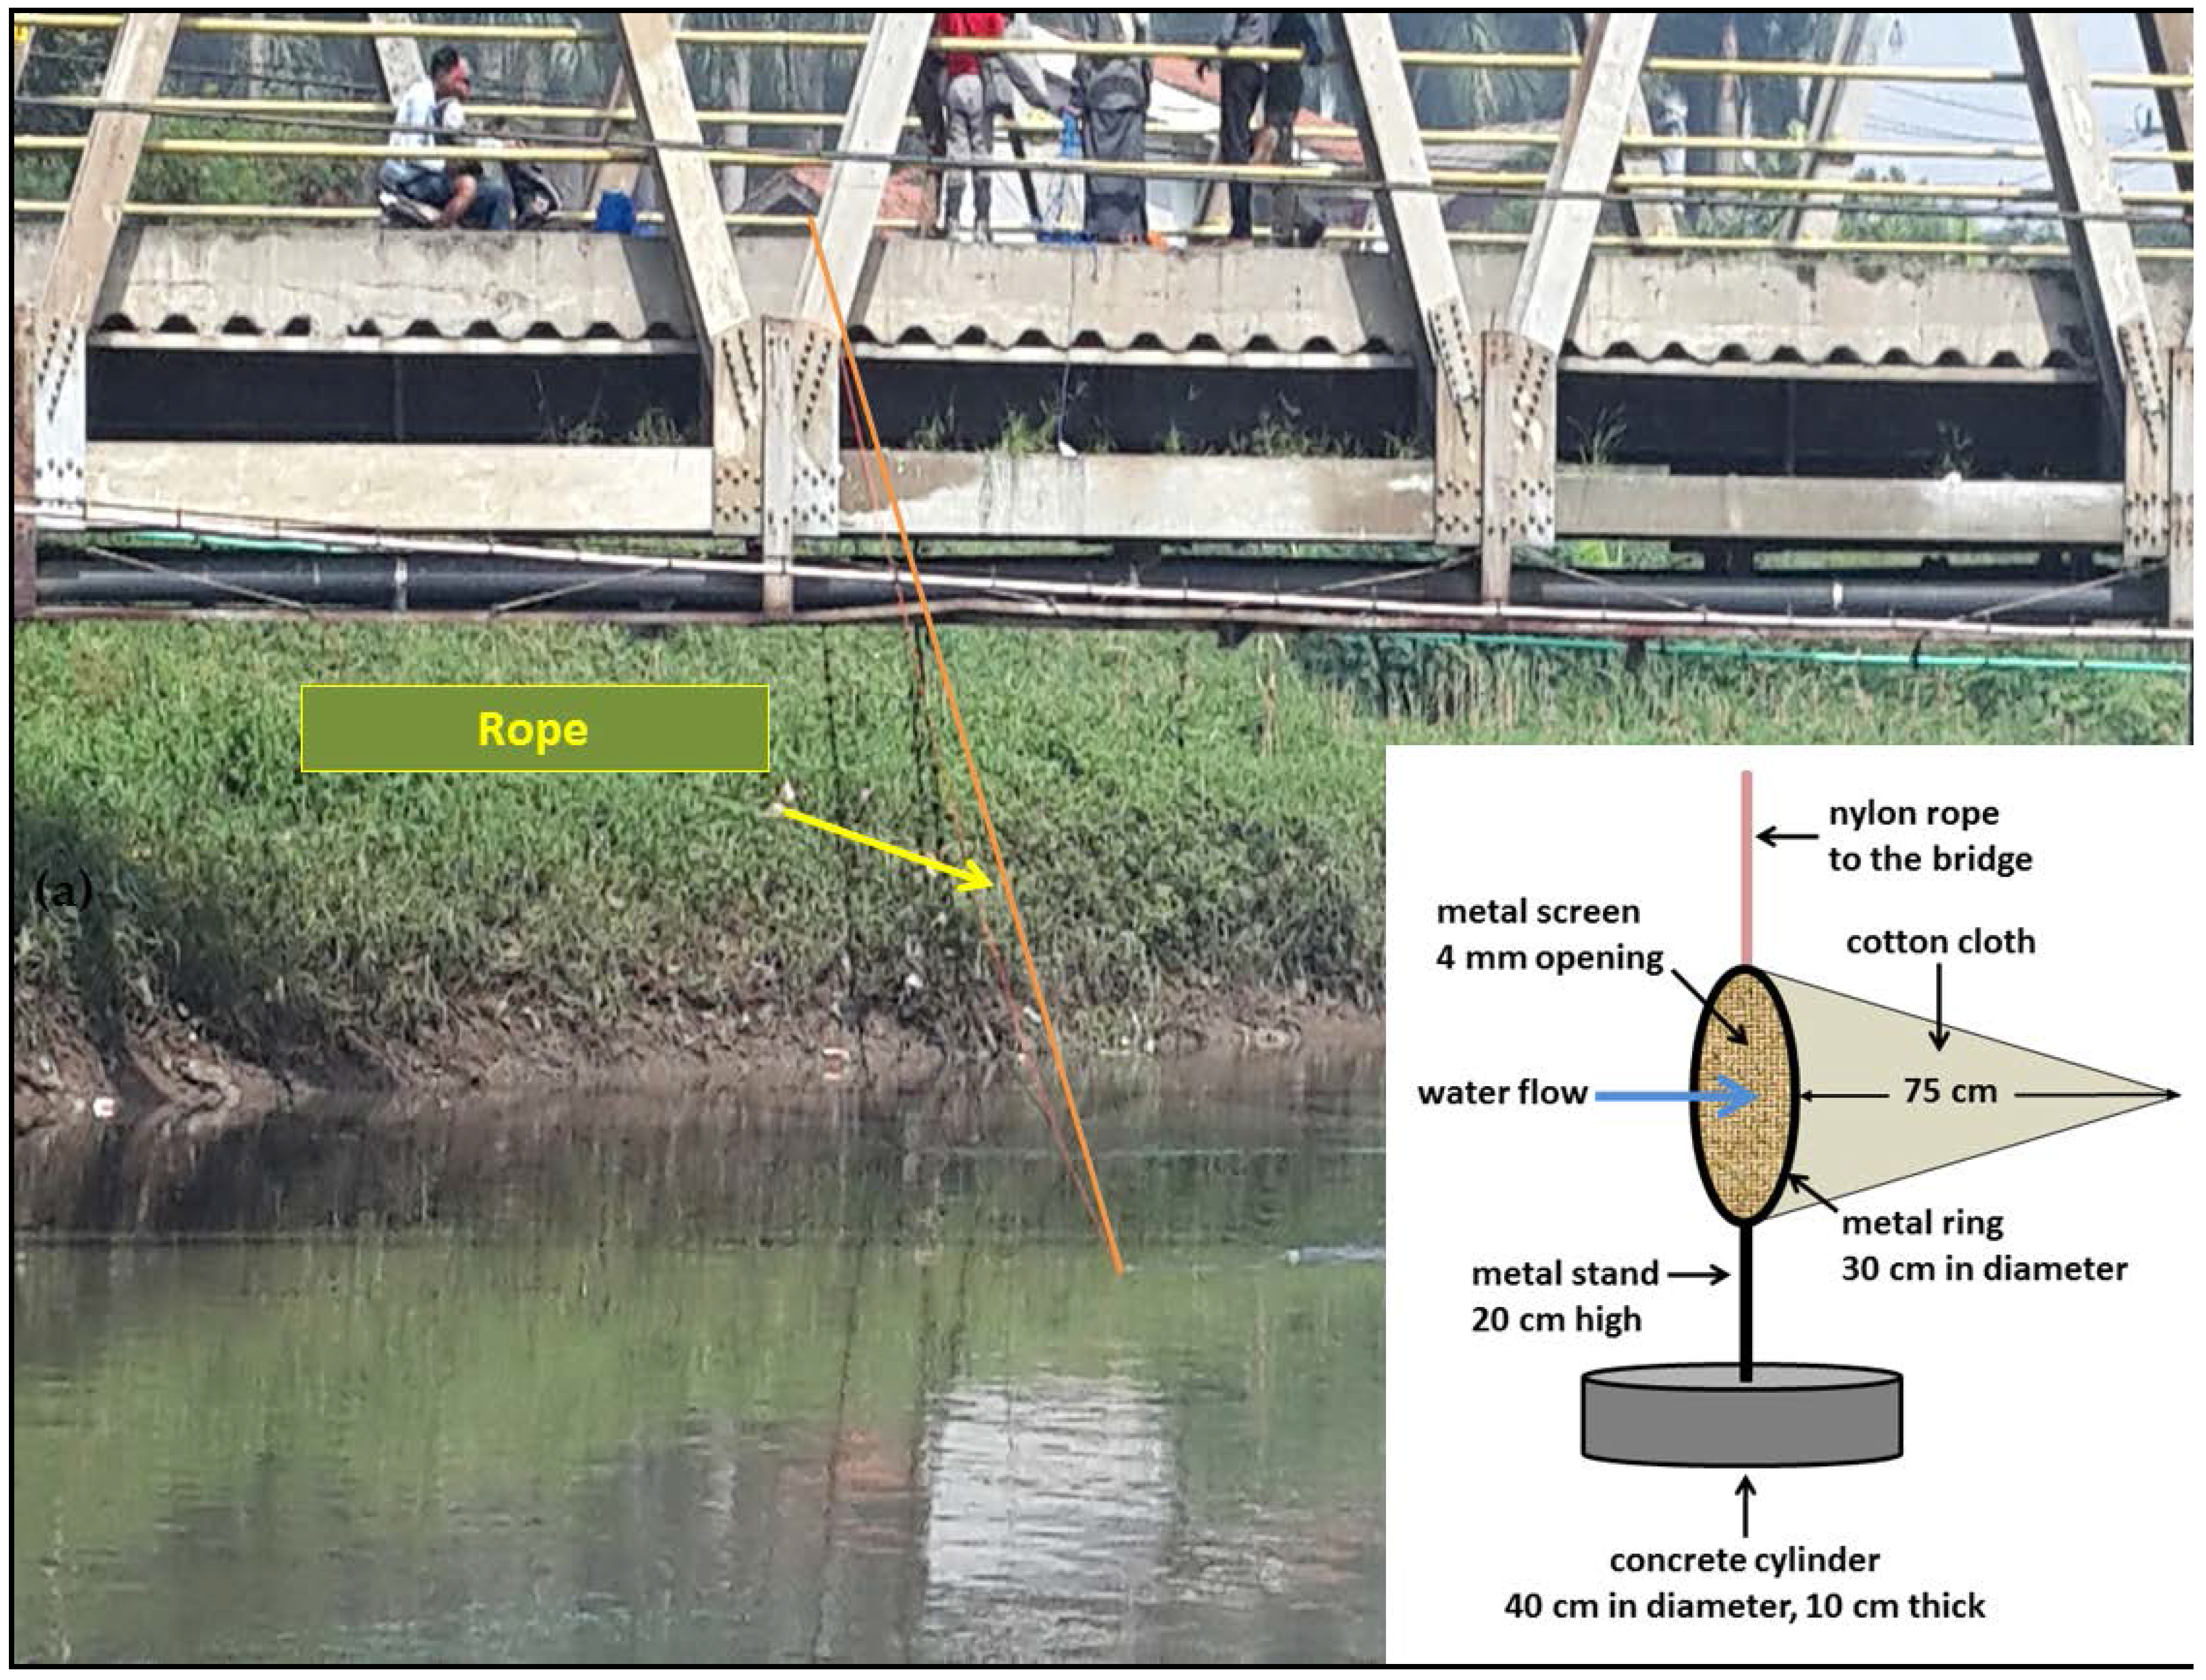
2.2. Collection and Analysis of Samples

There are fourteen sampling sites (numbered 1–14) along the Citarum River and seven samples from the tributaries (marked A–G). A refers to the Cikapundung River, B to the Ciodeng River, C to the Citepus River, D to the Cimariuk River, E to the Cicukang River, F to the Cikambuy River, and G to the Cikasungka River. Suspended sediment samples were collected during the rainy season of 2016 using specially-designed sediment traps placed underneath bridges for 3 weeks. The traps were located 30 cm from the river bed (Figure 2). Each trap was made of a metal ring and metal stand casted in a concrete cylinder (see Figure 2 for the schematic of the trap). The ring was covered by a metal screen with opening diameter of 4 mm and was placed perpendicular to water flow. The suspended sediment was collected in a cotton cloth bag tied to the metal ring.
Once collected, samples of suspended sediment (about 2 L in volume) from each site were brought to the laboratory for sieving using a 325 mesh-size sieve (44 µm in diameter). For each site, a small portion of sample was then subjected to magnetic extraction using a magnetic stirrer following a technique described elsewhere [22]. The remaining part would be referred to as bulk samples. The extracted magnetic grains from selected samples (sample 1 and sample 14) were later used for thermomagnetic measurements using a magnetic balance instruments (NMB-89 by Natsuhara Giken, Osaka, Japan) at Kochi University, Japan, which is equipped with a special power supply and furnace. Magnetization of the sample was measured during heating in vacuum air from 50 to 700 °C in steps of 1 °C and then subsequently during cooling back to room temperature. Later, extracted magnetic grains from three selected samples representing the upstream position (sample 1), middle position (sample 7), and downstream position (sample 14), were subjected to XRD (X-ray diffraction) analyses using X-ray diffractograms (SmartLab X-ray Diffractometer by Rigaku corporation, Tokyo, Japan). This instrument is equipped with a Cu tube, using Rigaku PDXL software (Version 2.0, Rigaku Corporation, Tokyo, Japan) to identify crystal structures, lattice parameters, and to perform mineral quantification.
A small amount of the bulk samples of each site was then inserted into standard cylindrical plastic sample holders (25.4 mm in diameter, 22 mm in height, and 10 cm3 in volume) and weighed using an analytical Ohaus balance. Later, these samples in plastic holders were subjected to various magnetic measurements. First, the samples were measured for mass-normalized magnetic susceptibility (χ) using dual frequencies with a magnetic susceptibility meter (MS2 susceptibility meter by Bartington Instrument Ltd., Witney, UK) producing low-frequency mass-specific magnetic susceptibility (χLF) and high-frequency mass-specific magnetic susceptibility (χHF). From the values of χLF and χHF, a new parameter termed χFD (%) defined as χFD (%) = 100% × (χLF − χHF)/χLF [23] could be derived. χFD (%) indicates the presence of superparamagnetic (SP) grains [24]. Later, all of the samples were subjected to IRM (acquisition of isothermal remanent magnetization) analyses. IRM was imparted by placing the samples in increasing magnetic fields generated by an electromagnet at room temperature. After each magnetizing step, the IRM intensity was measured using a spinner magnetometer (Minispin magnetometer by Molspin Ltd., Newcastle Upon Tyne, UK). The intensity of remanence during the induced field is 1 T, which is termed as SIRM (saturated isothermal remanent magnetization).
A small quantity of bulk sample was then used for the analyses of magnetic hysteresis with the following hysteresis parameters: Bc (coercive force), Bcr (coercivity of remanent), Ms (saturation magnetization), and Mrs (magnetic saturation remanence), determined using a vibrating sample magnetometer (VSM 1.2 H/CT/HT by Oxford Instrument, Oxfordshire, UK, performed at the laboratory of the Indonesian National Nuclear Energy Agency) at maximum applied fields of 1 T. For each sample, the magnetization versus the applied field was recorded at room temperature. The ratios of Mrs/Ms versus Bcr/Bc infer the predominant magnetic domain state of the sample. Other bulk samples were also subjected to XRF (X-ray fluorescence) analyses using a handheld XRF S1 Titan by Bruker (Berlin, Germany). This instrument uses up to 10 g of dry powder (maximum 74 µm in diameter) and identifies major, minor, and trace elements contained in the sample. The results could be presented as either oxides or elements. In this study, only the following elements were presented: Fe, Ti, Zn, Cu, and V.

3. Results and Discussion
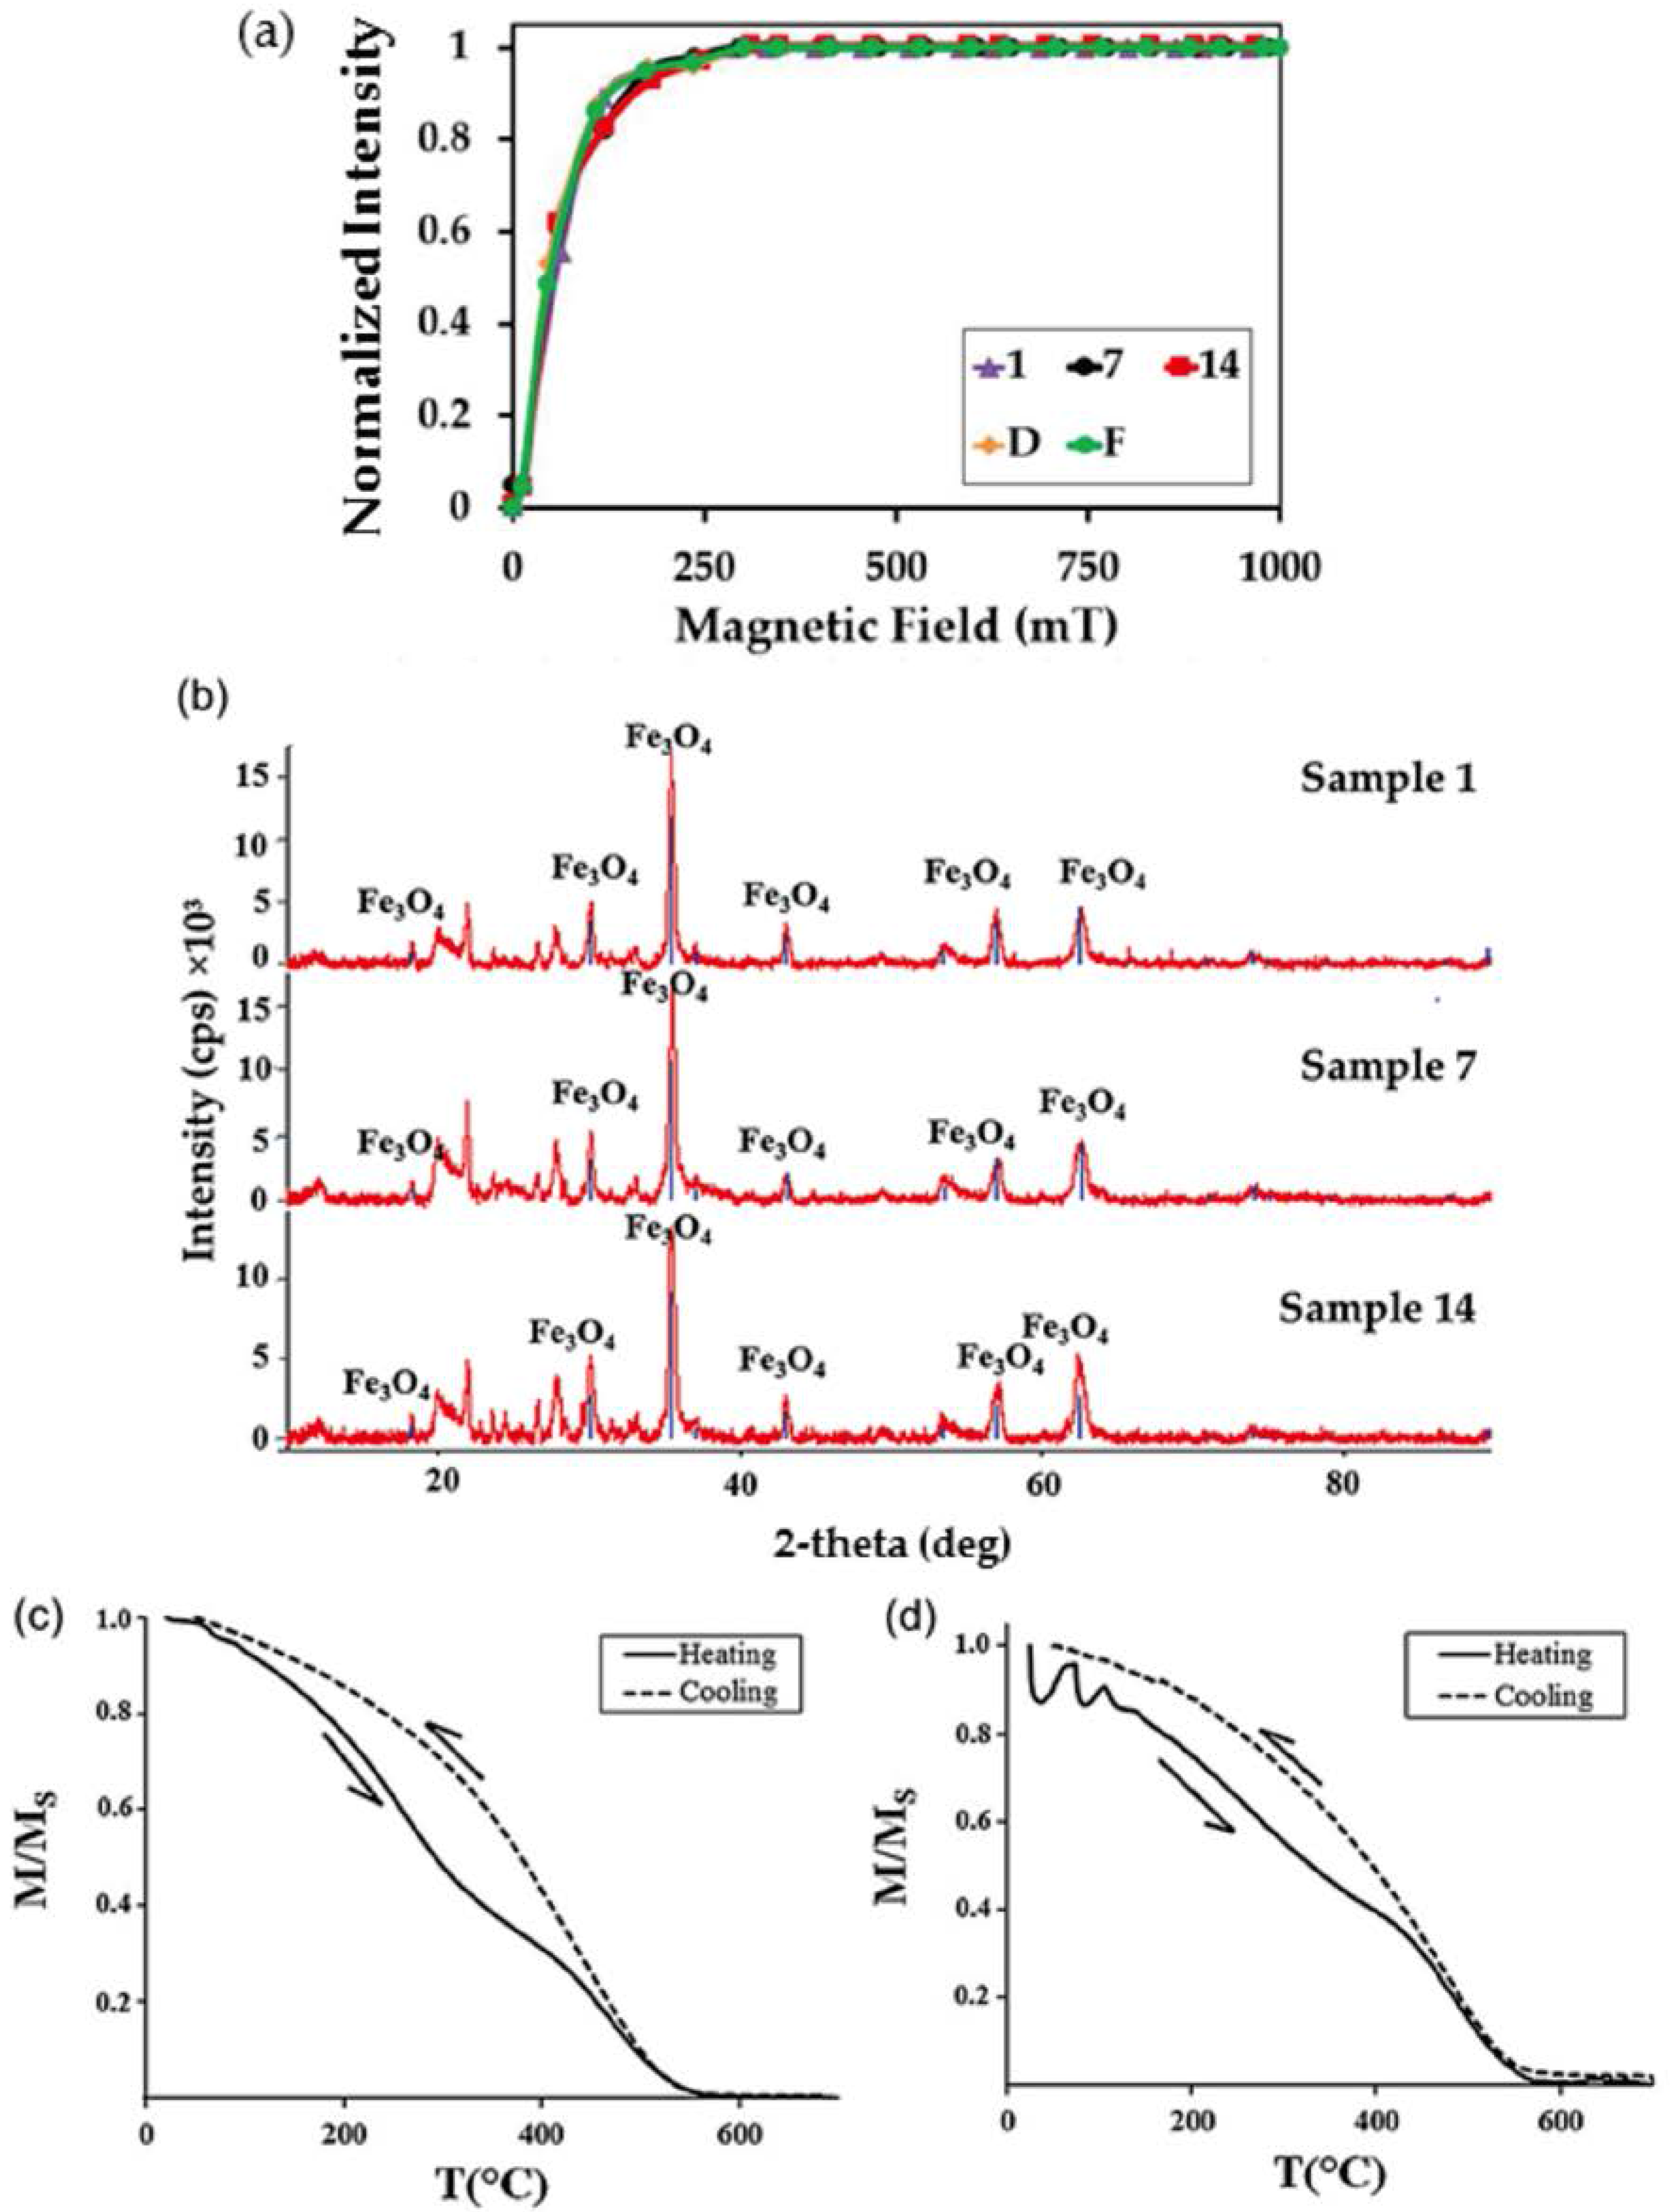
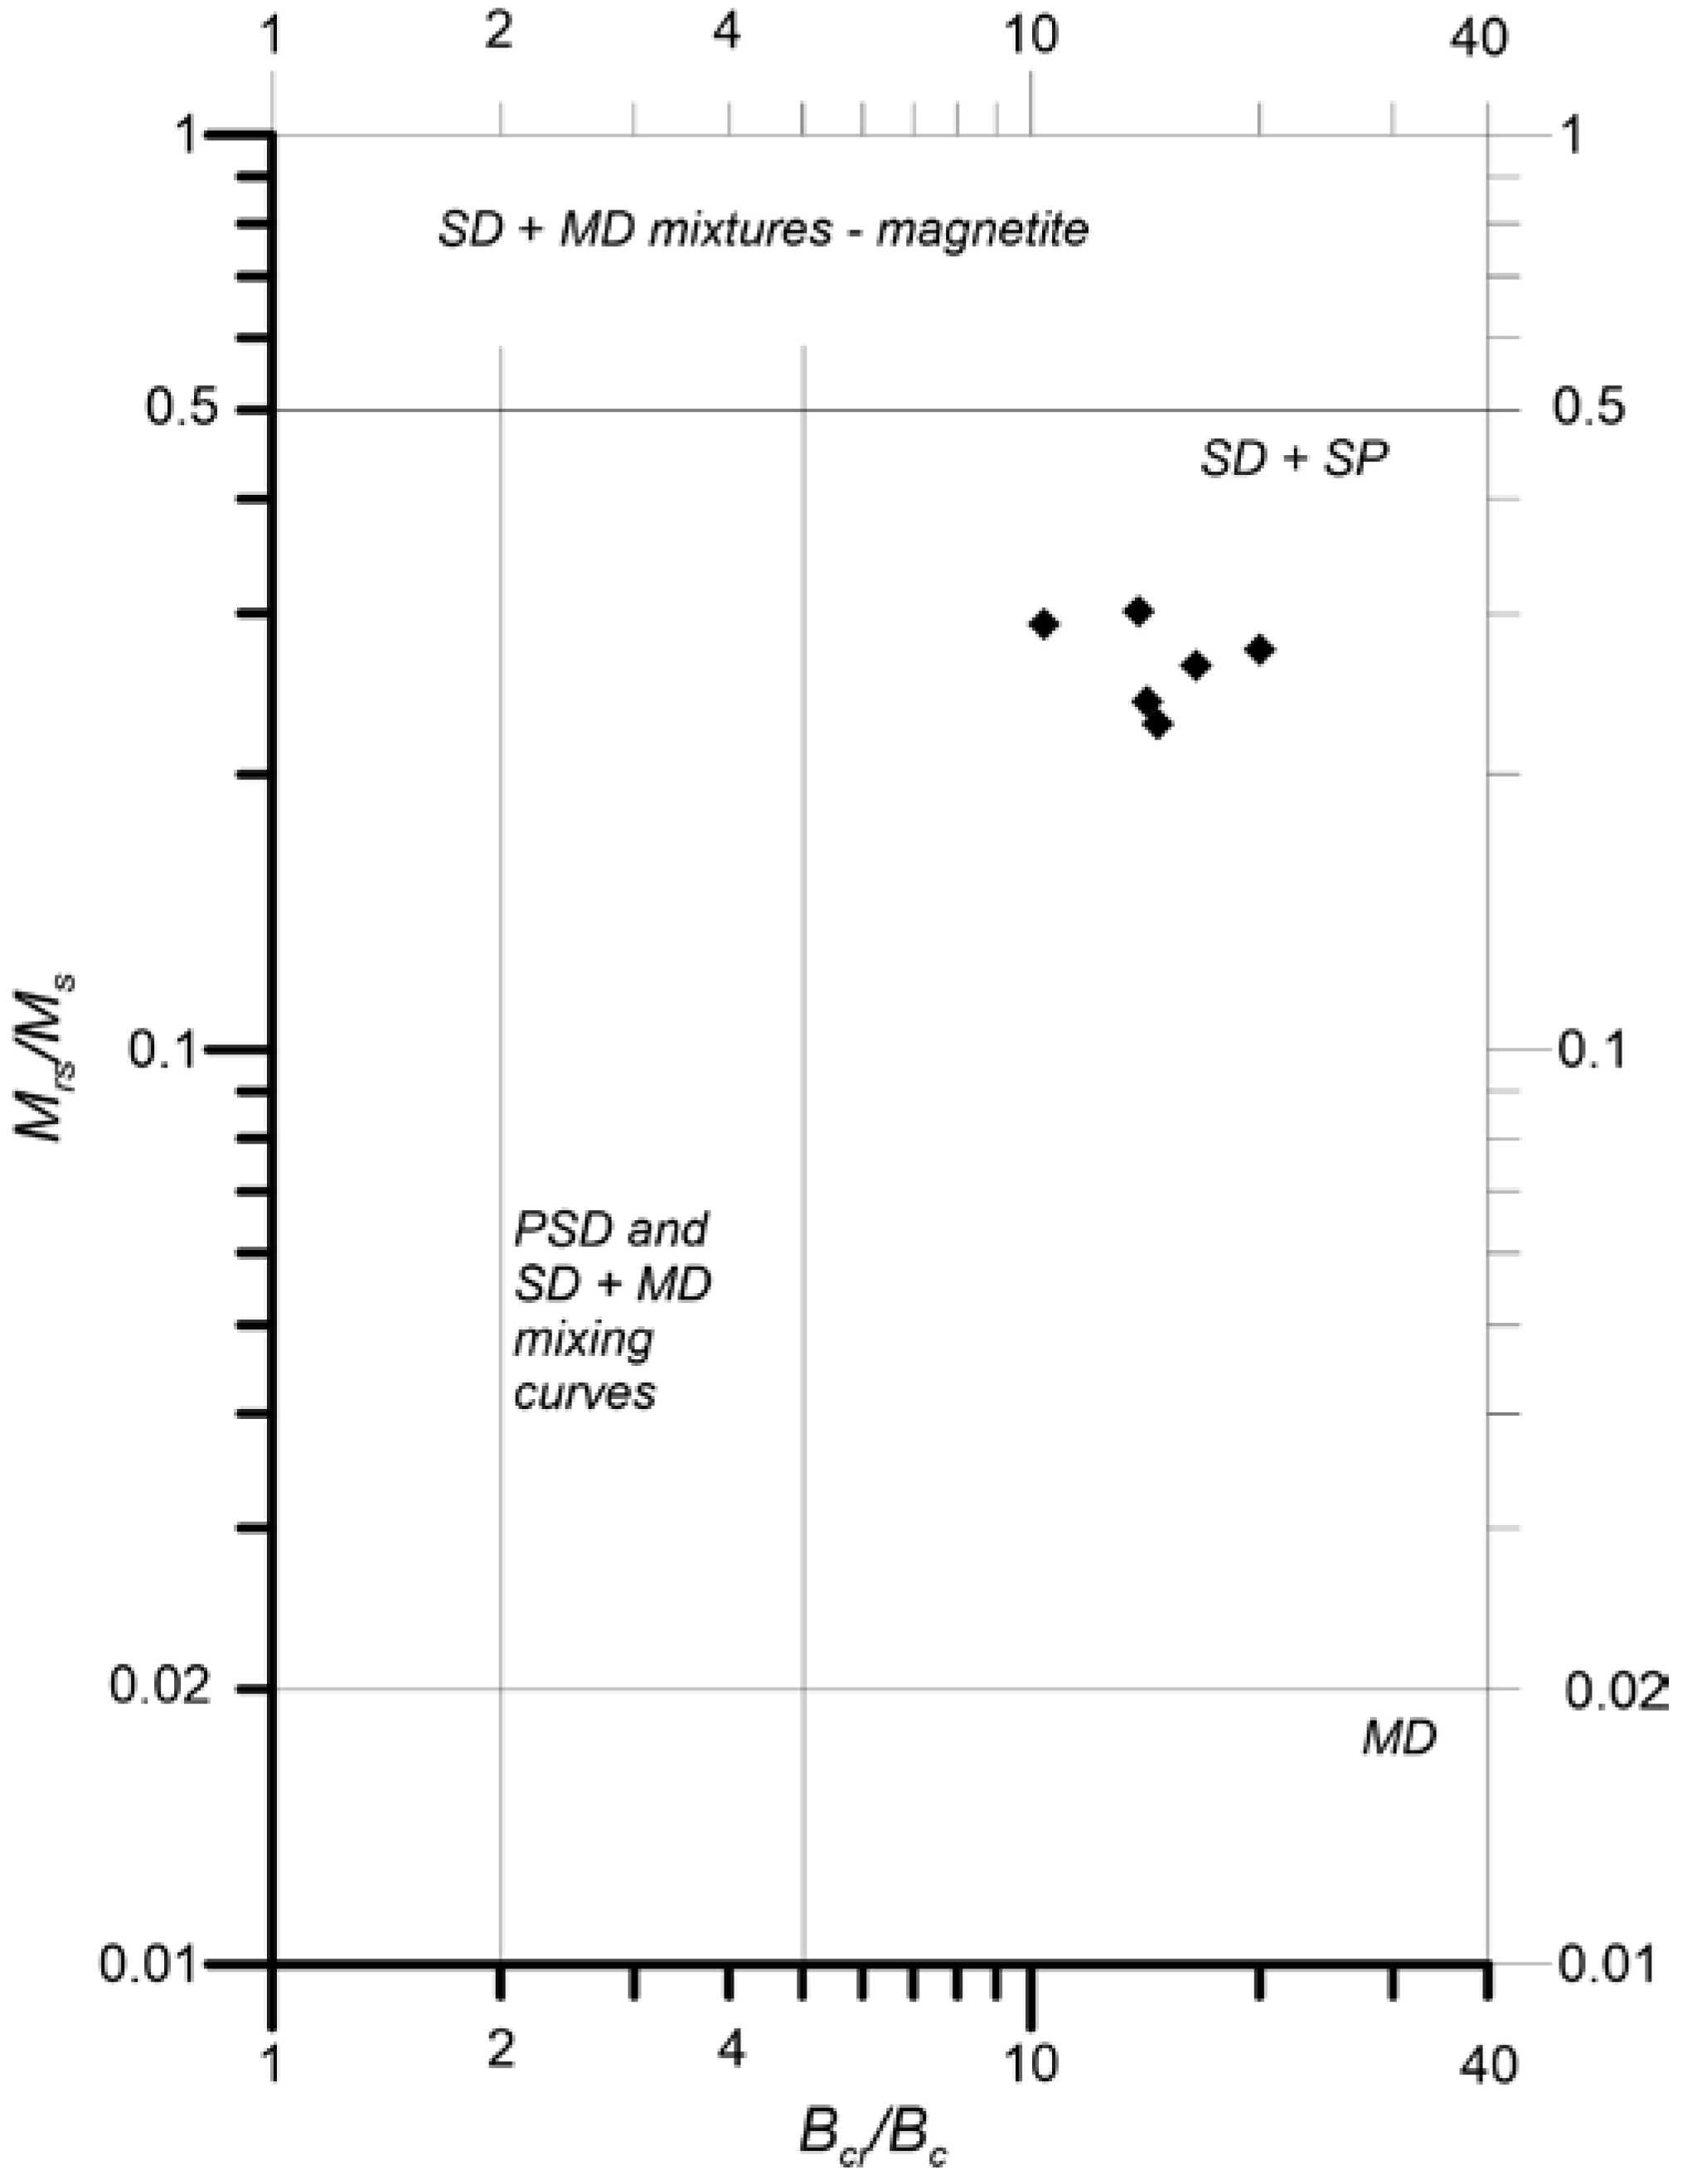
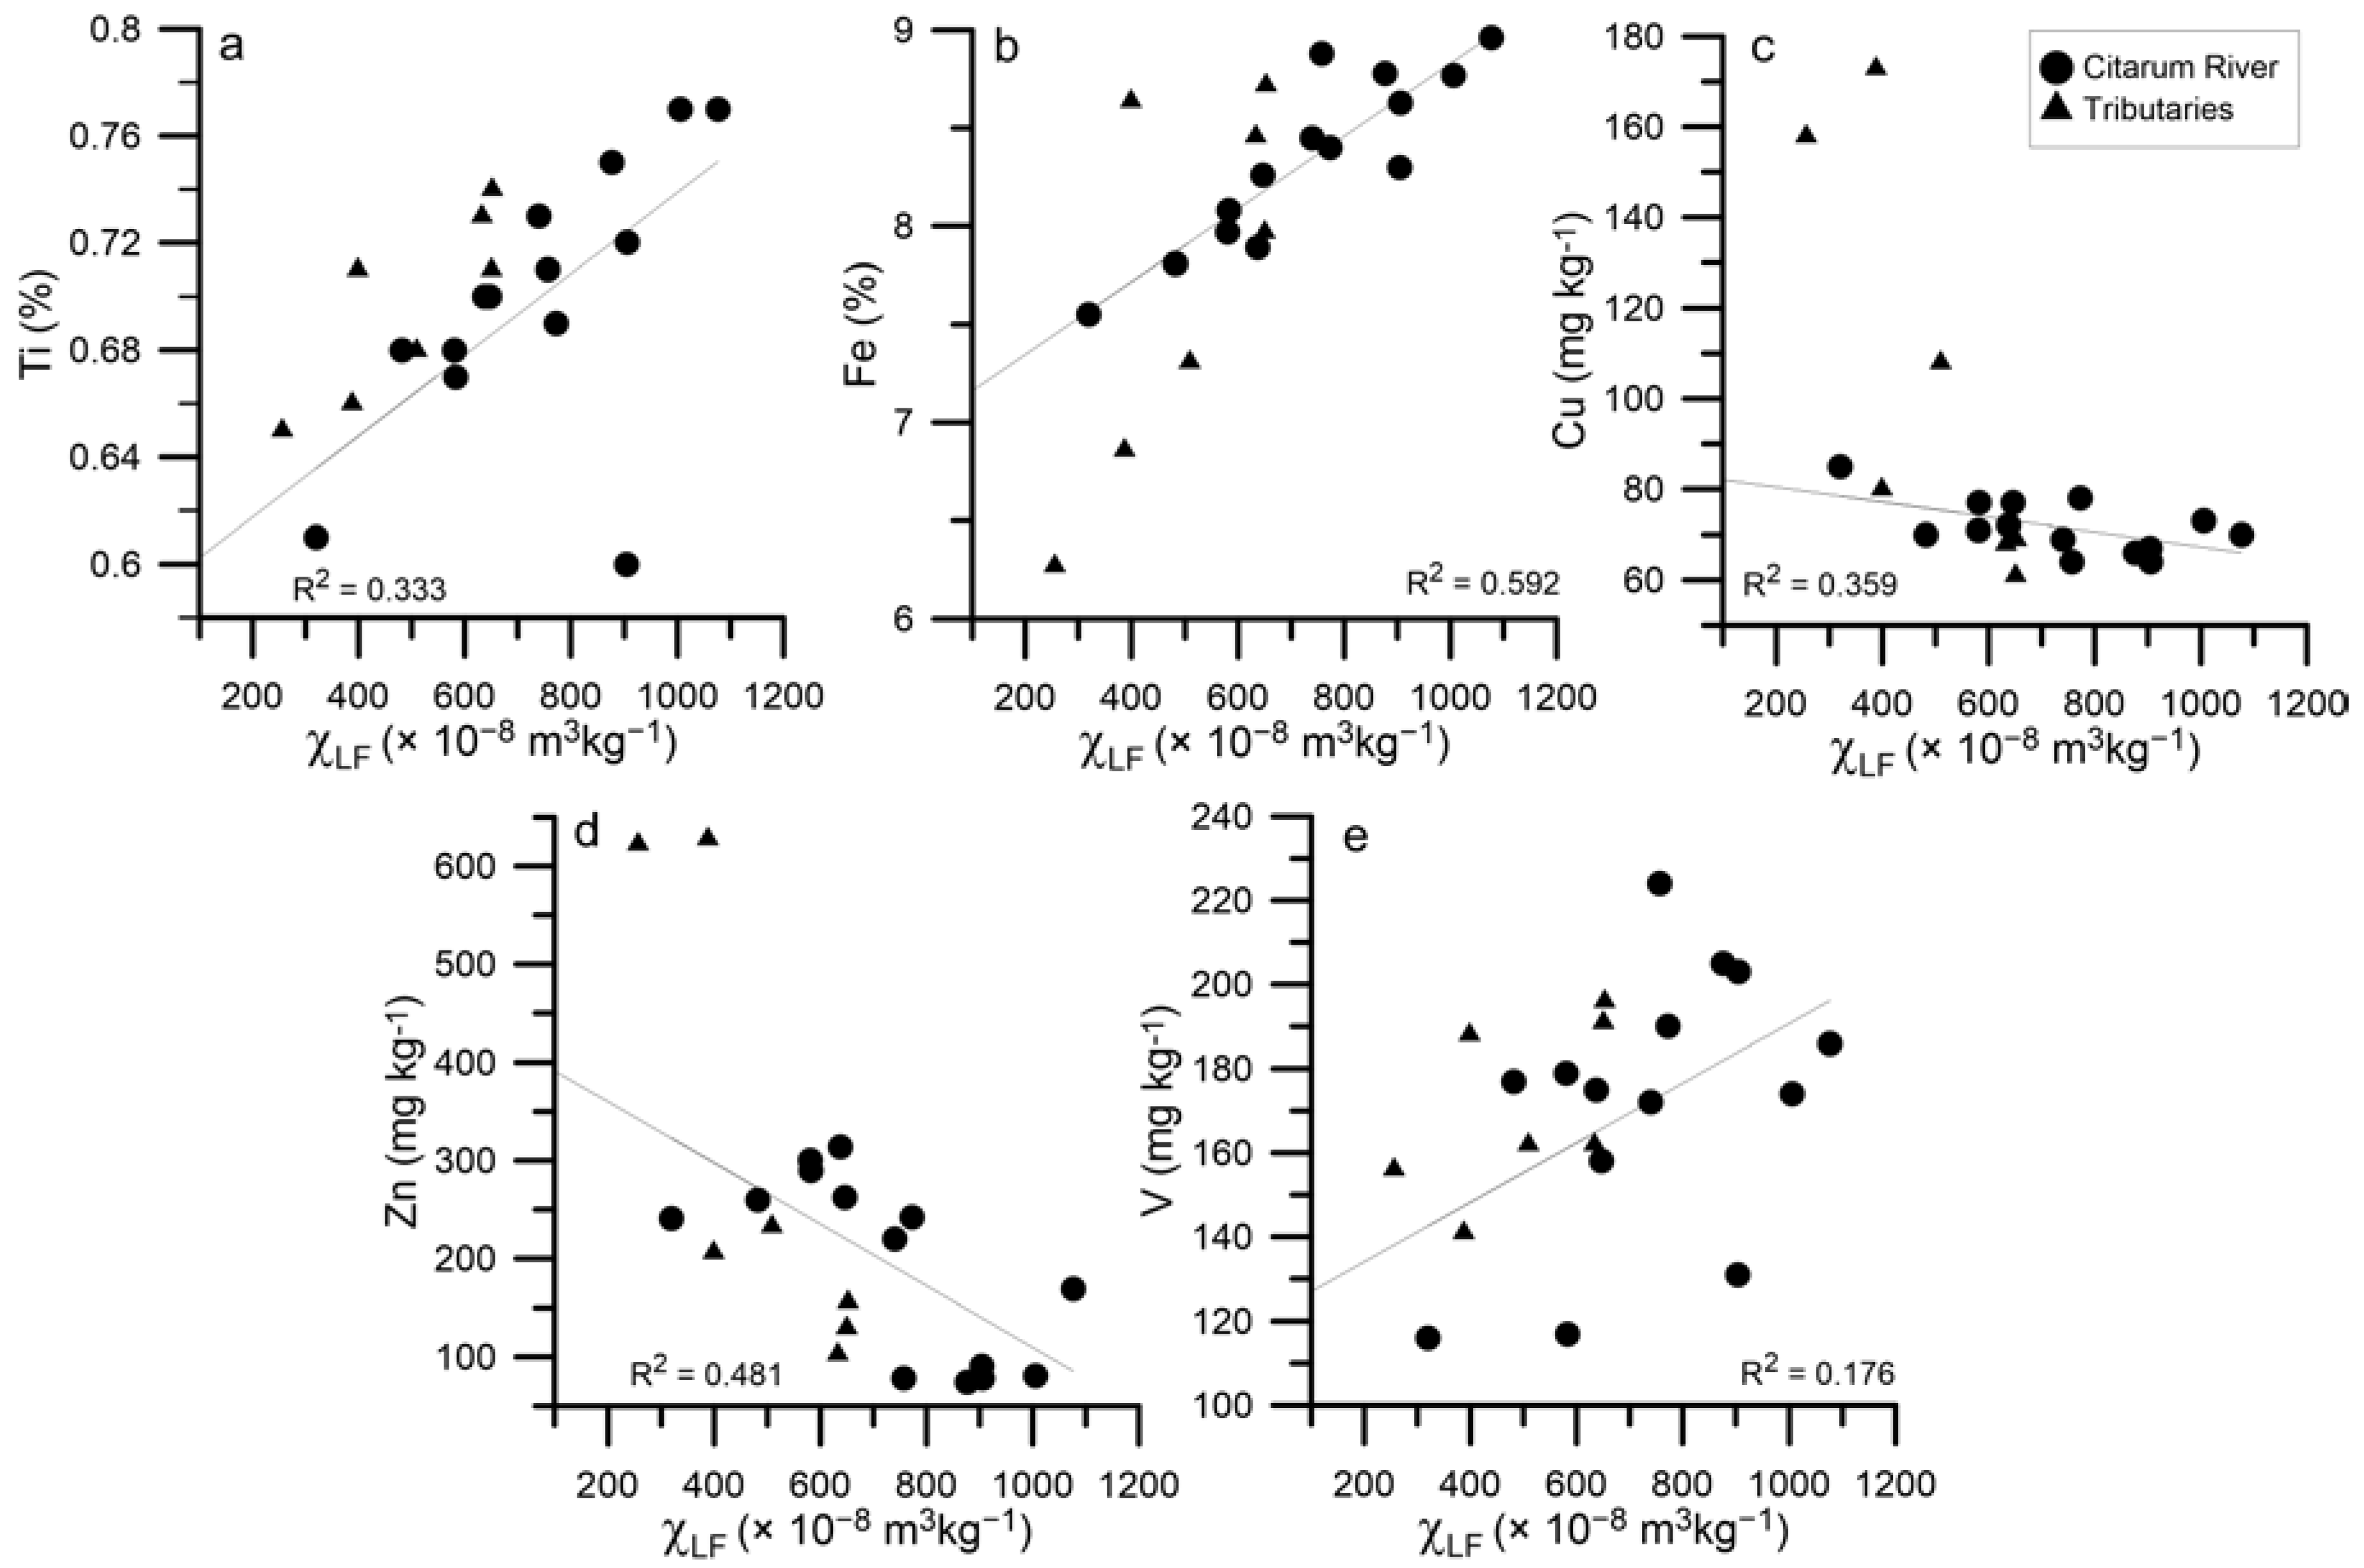
3.1. Results

Figure 3a shows the results of IRM analyses. The IRM acquisition curves for representative samples (1, 7, 14, D, and F) show that the IRMs saturated below 300 mT, inferring that the predominant magnetic mineral in the samples is a low coercivity magnetic mineral such as magnetite (Fe3O4). The presence of magnetite was also confirmed by the results of XRD analyses for extracted samples in the representative samples (1, 7, and 14) (see Figure 3b). Results from thermomagnetic analyses for extracted samples (1 and 14) also confirmed the predominance of magnetite, as shown by the Curie temperature around 580 °C (Figure 3c).
Since magnetite was the predominant magnetic mineral in the samples, the abundance of magnetite in the samples can be estimated from %magnetite, which is SIRM divided by JSmagnetite, where JSmagnetite is the saturation magnetization for magnetite (9.2 Am2·kg−1) [25]. Table 1 shows the magnetite contents in the samples estimated from SIRM/JSmagnetite that varied for the Citarum River from 0.81‰ (sample 9) to 4.16‰ (sample 11), while the tributaries samples varied from 1.8‰ (sample C) to 7.89‰ (sample G).
Table 1 summarizes the results of magnetic and geochemical analyses for all samples (1–14, and A–G). The values of χLF for Citarum River samples (1–14) varied from 319.6 × 10⁻⁸ m3·kg−1 (sample 14) to 1076.6 × 10−8 m3·kg−1 (sample 7), while the tributary samples (A–G) varied from 256.0 × 10⁻⁸ m3·kg−1 (sample D) to 652.4 × 10⁻⁸ m3·kg−1 (sample F).
Table 1 also shows the variation of χFD (%) values for Citarum River samples that vary from 3.1% (samples 7 and 8) to 6.1% (sample 14), while the tributary samples vary from 2.1% (sample D) to 4.3% (sample C). These results show that all samples contain SP grains [26]. The presence of SP grains is also confirmed by the plots of magnetic hysteresis parameters (Figure 4) showing that all representative samples (2, 6, 9, 10, 13, and 14) in the area are of SP and SD (single-domain) mixture. The value of χFD (%) did not change much, except in samples 4 and 14. The values of χFD (%) for the Citarum River suspended sediments indicate the presence of SP.
Table 1 also shows the results of XRF analyses for selected compounds and metals (Ti, Fe, Cu, Zn, and V), where Fe and Ti contents are important for understanding the magnetic properties of the sediment samples. The other three elements (Cu, Zn, and V) were listed, as they vary greatly from one site to the others. Other heavy metals were not listed because they were undetected, or their values showed relatively little variation.
The content of Fe for the Citarum River samples varied from 7.55 ± 0.07 (%) (Sample 14) to 8.96 ± 0.07 (%) (Sample 7), while the tributary samples varied from 6.27 ± 0.07 (%) (Sample D) to 8.72 ± 0.06 (%) (Sample F). The content of Ti for the Citarum River samples varied from 0.60 ± 0.02 (%) (Sample 5) to 0.77 ± 0.02 (%) (Sample 7), while the tributary samples varied from 0.65 ± 0.02 (%) (Sample D) to 0.74 ± 0.02 (%) (Sample F).
The content of Cu for the Citarum River samples (1–14) varied from 64 ± 15 (mg·kg−1) (sample 3) to 85 ± 16 (mg·kg−1) (sample 14), while the tributary samples (A–G) varied from 61 ± 15 (mg·kg−1) (sample G) to 173 ± 20 (mg·kg−1) (sample C). The content of Zn for the Citarum River samples varied from 74 ± 14 (mg·kg−1) (sample 2) to 314 ± 23 (mg·kg−1) (sample 14), while the tributary samples varied from 103 ± 15 (mg·kg−1) (sample B) to 628 ± 31 (mg·kg−1) (sample C). The content of V for the Citarum River samples varied from 116 ± 61 (mg·kg−1) (sample 14) to 224 ± 69 (mg·kg−1) (sample 4), while the tributary samples varied from 141 ± 66 (mg·kg−1) (sample C) to 196 ± 66 (mg·kg−1) (sample F).

3.2. Discussion

Comparing the river sediment to that from elsewhere [5,8,9,27,28,29], the values of χLF in the Citarum River were relatively high. This is to be expected, as the samples used in the other studies were taken from a non-volcanic catchment area. The χLF values do not directly correlate with the estimated magnetite content, as other magnetic minerals might contribute to the overall magnetic susceptibility. Therefore, there is a possibility that other magnetic minerals might be present in the samples. Both thermo-magnetic curves (Figure 3c,d) show inflection at ~400 °C, which reflects a relatively high Ti/Fe ratio in the composition of the titanomagnetites. For sample 14, the wiggly curve at low temperature (<100 °C) might indicate various phases of Ti-rich titanomagnetite that repeatedly change their compositions [30].
The ratio of SIRM/χLF shows a large contrast between the Citarum River samples and the tributary samples. The tributary samples (except from sample C) had significantly higher SIRM/χLF values compared to the Citarum River samples. Nevertheless, the range of SIRM/χLF values for all samples fell within the range of (titano) magnetite [31].
In general, these Fe and Ti contents were relatively higher than those of the report in the literature for other rivers (Fe in [8,9,28,29,32,33,34], and Ti in [32,33]). Moreover, the Fe contents in the suspended sediment samples exceeded the environmental safety threshold, which is 20 mg/kg according to [35].
In general, these Cu, Zn, and V contents were relatively higher than those of the reports in the literature for other rivers (Cu and Zn [8,9,28,29,32,34] and V [8,34]). The values of Cu content were generally lower than the environmental contamination threshold, which is 110 mg/kg according to [36], except for samples C and D, which represent densely-populated tributaries in the southern part of Bandung. The values of Zn content were generally higher than the environmental safety threshold, which is 124 mg/kg according to [37], except for samples 1−5 and B taken from agricultural areas which are not as densely populated. Meanwhile, the values of V content were all below the environmental safety threshold, which is 330 mg/kg according to [38]. Figure 5 shows the coefficient of determination of χLF and the contents of Fe, Ti, Zn, Cu, and V. It shows that the values for R2 vary between R2 = 0.176 (for V) and R2 = 0.592 (for Fe). Such a good positive correlation between χLF and Fe is to be expected, as χLF approximates the total concentration of Fe-bearing minerals in the sample [23]. Titanium also has a relatively good visual correlation with χLF values, except for point 5, where the Ti content is rather low. Point 5 is located in the area where river sand is collected for building materials.
Figure 6 shows the values of χLF and SIRM/χLF as well as Zn content along the Citarum River and its tributaries. The values of χLF tended to decrease downstream, as the χLF values of the tributaries samples were lower than those of the river samples upstream, even as the tributaries pass by industrial and residential areas. The χLF values of the tributaries samples (A–G) were comparable to those of the sediment from polluted rivers in the literature [8,27,28,33,34]. This situation differs significantly with the reported values in the rivers from a temperate climate and non-volcanic areas [28,29,33]. Therefore, the use of magnetic methods for monitoring river pollution in the tropics or in the volcanic areas should be carefully analyzed and interpreted. Sample 7 has the highest value of χLF. Apart from its location near the junction where the tributaries of Ciodeng (B) and Citepus (C) meet the Citarum River, this particular segment of the river had been normalized with the embankment in its north and south sides so that the river is narrow and its water flow is relatively faster than any other parts. This might influence the accumulation/dissolution/re-suspension of particles in that location. Faster water flow might also influence the proportion of fine particles in the sediment, leading to higher magnetic susceptibility.
Figure 6 also shows that Zn content tends to increase downstream. Zn inputs from the northern tributaries (except for G) that flow through major industrial and residential areas of the city of Bandung tended to be higher than those from the southern tributaries (B, E, and F) that flow through mainly agricultural areas. The first five upstream samples (1–5) also had relatively low Zn content compared to the samples after the Citarum River meets its major tributaries (samples 5, 6, 7, etc.). This shows that Zn content in the suspended sediment is mainly anthropogenic rather than lithogenic, in origin. Earlier studies show that Zn inputs through the rivers are mainly due to not only industrial and household wastes, but also traffic waste [8,40,41].
As shown in Figure 7, the SIRM/χLF values from the tributaries samples (except for C) were generally higher than that of Citarum River samples. An earlier study used the SIRM/χLF ratio merely to infer the type of magnetic minerals in the river sediment [33]. However, there is a possibility that in our study this ratio might also differentiate samples that are predominantly lithogenic in origin (relatively low SIRM/χLF ratio) from those that are predominantly anthropogenic in origin (high SIRM/χLF ratio). We propose that future studies might consider using the ratio of SIRM/χLF to distinguish the anthropogenic origin in river sediments.

4. Conclusions

As shown by samples taken from the Citarum River and its tributaries, the variation of χLF in suspended sediment from volcanic areas in the tropics differed significantly from the sediment from non-volcanic areas in temperate climate areas. Although the predominant magnetic minerals remain the same (i.e., (titano) magnetite), the χLF values in the upstream areas were higher than the samples in the downstream areas, suggesting that the lithogenic components in the suspended sediment in the upstream is more magnetic than the anthropogenic components in the suspended sediment from the tributaries that flow through industrial and residential areas. Thus, the use of magnetic methods for monitoring river pollution in the tropics or in the volcanic areas should be carefully analyzed and interpreted. We propose the use of SIRM/χLF as an indicator to test the importance of lithogenic or anthropogenic contributions in magnetic minerals in the sediment. The higher the value of SIRM/χLF, the greater the contribution of anthropogenic components.

Acknowledgments

This research was financially supported by a research grant to S. Bijaksana from the Ministry of Research, Technology, and Higher Education of the Republic of Indonesia. The Ministry also provided a doctoral scholarship and research fellowship to Sudarningsih. The sediment samples were collected by permission from the Regency of Bandung. Kartika Hajar Kirana, Abd Mujahid Hamdan, Arif Wijaya, Mimin Iryanti, and Dimas Maulana Wibowo are thanked for their assistance in the field and laboratory works. Two anonymous reviewers are thanked for their constructive comments.

Author Contributions

Sudarningsih Sudarningsih, Satria Bijaksana, Widodo Widodo, Irwan Iskandar, and Darharta Dahrin conceived the idea for this study. Sudarningsih Sudarningsih, Satria Bijaksana, Aditya Pratama, Silvia Jannatul Fajar, Rizky Ramdani, and Nono Agus Santoso collected and measured the samples. Sudarningsih Sudarningsih, Satria Bijaksana, Abd Hafidz and Nono Agus Santoso prepared the manuscript.

Conflicts of Interest

The authors declare no conflict of interest.

References

  1. Kapička, A.; Petrovský, E.; Ustjakb, S.; Machackova, K. Proxy mapping of fly-ash pollution of soils around a coal-burning power plant: A case study in the Czech Republic. J. Geochem. Explor. 1999, 66, 291–297. [Google Scholar] [CrossRef]
  2. Hoffmann, V.; Knab, M.; Appel, E. Magnetic susceptibility mapping of roadside pollution. J. Geochem. Explor. 1999, 66, 313–326. [Google Scholar] [CrossRef]
  3. Petrovský, E.; Kapička, A.; Jordanova, N.; Knab, M.; Hoffmann, V. Low-field magnetic susceptibility: A proxy method of estimating increased pollution of different environmental systems. Environ. Geol. 2000, 39, 312–318. [Google Scholar]
  4. Gautam, P.; Blaha, U.; Appel, E.; Neupane, G. Environmental magnetic approach towards the quantification of pollution in Kathmandu urban area, Nepal. Phys. Chem. Earth 2004, 29, 973–984. [Google Scholar] [CrossRef]
  5. Desenfant, F.; Petrovský, E.; Rochette, P. Magnetic signature of industrial pollution of stream sediments and correlation with heavy metals: Case study from South France. Water Air Soil Poll. 2004, 152, 297–312. [Google Scholar] [CrossRef]
  6. Blaha, U.; Appel, E.; Stanjek, H. Determination of anthropogenic boundary depth in industrially polluted soil and semi-quantification of heavy metal loads a using magnetic susceptibility. Environ. Pollut. 2008, 156, 278–289. [Google Scholar] [CrossRef] [PubMed]
  7. Zhang, C.X.; Huang, B.C.; Piper, J.D.A.; Luo, R.S. Biomonitoring of atmospheric particulate matter using magnetic properties of Salix matsudana tree ring cores. Sci. Total Environ. 2008, 393, 177–190. [Google Scholar] [CrossRef] [PubMed]
  8. Zhang, C.; Qiao, Q.; Piper, J.D.A.; Huang, B. Assessment of heavy metal pollution from a Fe-smelting plant in urban river sediments using environmental magnetic and geochemical methods. Environ. Pollut. 2011, 159, 3057–3070. [Google Scholar] [CrossRef] [PubMed]
  9. Bilinski, F.S.; Bilinski, H.; Tibljas, D.; Scholger, R. Magnetic, geochemical and mineralogical properties of sediments from karstic and flysch rivers of Croatia and Slovenia. Environm. Earth Sci. 2014, 72, 3939–3953. [Google Scholar] [CrossRef]
  10. Jordanova, D.; Veneva, L.; Hoffmann, V. Magnetic susceptibility screening of of anthropogenic impact on the Danube river sediment in northwestern Bulgaria—Preliminary results. Stud. Geophys. Geod. 2003, 47, 403–418. [Google Scholar] [CrossRef]
  11. Franke, C.; Kissel, C.; Robin, E.; Bontè, P.; Lagroix, F. Magnetic particle characterization in the Seine river system: Implications for the determination of natural versus anthropogenic input. Geochem. Geophy. Geosy. 2009, 10, Q08Z05. [Google Scholar] [CrossRef]
  12. Schmidt, A.; Yarnold, R.; Hill, M.; Ashmore, M. Magnetic Susceptibility as proxy for heavy metal pollution: A site study. J. Geochem. Explor. 2005, 85, 109–117. [Google Scholar] [CrossRef]
  13. Lu, S.G.; Bai, S.Q. Study on the correlation of magnetic properties and heavy metals content in urban soils of Hangzhou City, China. J. Appl. Geophys. 2006, 60, 1–12. [Google Scholar] [CrossRef]
  14. Zhang, C.; Appel, E.; Qiao, Q. Heavy metal pollution in farmland irrigated with river water near a steel plant—Magnetic and geochemical signature. Geophys. J. Int. 2013, 192, 963–974. [Google Scholar] [CrossRef]
  15. Dlouha, S.; Petrovský, E.; Kapička, A.; Boruvka, L.; Ash, C.; Drabek, O. Investigation of Polluted Alluvial Soils by Magnetic Susceptibility Methods: A Case Study of the Litavka River. Soil Water Res. 2013, 4, 151–157. [Google Scholar]
  16. Xu, Y.; Sun, Q.; Yi, L.; Yin, X.; Wang, A.; Li, Y.; Chen, J. The source of natural and anthropogenic heavy metals in the sediments of the Minjiang River Estuary (SE China): Implications for historical pollution. Sci. Total Environ. 2014, 493, 729–736. [Google Scholar] [CrossRef] [PubMed]
  17. BAPPENAS. Atlas Citarum 2011. In Integrated Citarum Water Resources Management Investment Program (ICWRMIP); National Development Planning Agency (BAPPENAS): Jakarta, Indonesia, 2011; p. 1. [Google Scholar]
  18. Chanpiwat, P.; Sthiannopkao, S. Status of metal levels and their potential sources of contamination in Southeast Asian rivers. Environ. Sci. Pollut. Res. 2014, 21, 220–233. [Google Scholar] [CrossRef] [PubMed]
  19. Hutasoit, L. Groundwater Surface Conditions with and without Permeation Artificial in Bandung: Numerical Simulation Results. J. Geol. Indonesia 2009, 4, 177–188. [Google Scholar]
  20. Climate-Data.Org. Available online: https://en.climate-data.org/location/607890/ (accessed on 14 July 2017).
  21. Hidayat, Y.; Murtilaksono, K.; Wahjunie, E.D.; Panuju, D.R. The characteristics of river discharge of Citarum Hulu. J. Ilmu Pertanian Indonesia 2013, 18, 109–114. [Google Scholar]
  22. Lu, S.; Yu, X.; Chen, Y. Magnetic properties, microstructure and mineralogical phase of technogenic magnetic particles (TMPs) in urban soils: Their sourceidentification and environmental implications. Sci. Total Environ. 2016, 543, 239–247. [Google Scholar] [CrossRef] [PubMed]
  23. Bijaksana, S.; Huliselan, E.K. Magnetic properties and heavy metal content of sanitary leachate sludge in two landfill sites near Bandung, Indonesia. Environ. Earth Sci. 2010, 60, 409–419. [Google Scholar] [CrossRef]
  24. Thompson, R.; Oldfield, F. Environmental Magnetism; Allen and Unwin Publishers Ltd.: London, UK, 1986; p. 227. [Google Scholar]
  25. Evans, M.E.; Heller, F. Environmental Magnetism Principles and Applications of Enviromagnetics; Academic Press: Cambridge, MA, USA, 2003; p. 147. [Google Scholar]
  26. Dearing, J.A. Environmental Magnetic Susceptibility: Using the Bartington MS2 System; Chi Publishing: Kenilworth, UK, 1994; p. 54. [Google Scholar]
  27. Knab, M.; Hoffmann, V.; Petrovský, E.; Kapička, A.; Jordanova, N.; Appel, E. Surveying the anthropogenic impact of the Moldau river sediments and nearby soils using magnetic susceptibility. Environ. Geol. 2006, 49, 527–535. [Google Scholar] [CrossRef]
  28. Chaparro, M.A.E.; Suresh, G.; Chaparro, M.A.E.; Sinito, A.M.; Ramasamy, V. Magnetic studies and elemental analysis of river sediments: A case study from the Ponnaiyar River (Southeastern India). Environ. Earth Sci. 2013, 70, 201–213. [Google Scholar] [CrossRef]
  29. Chaparro, M.A.E.; Sinito, A.M.; Ramasamy, V.; Marinelli, C.; Chaparro, M.A.E.; Mullainathan, S.; Murugesan, S. Magnetic measurements and pollutants of sediments from Cauvery and Palaru River, India. Environ. Geol. 2008, 56, 425–437. [Google Scholar] [CrossRef]
  30. Ubangoh, R.U.; Pacca, I.G.; Nyobe, J.B.; Hell, J.; Ateba, B. Petromagnetic characteristics of Cameroon Line volcanic rocks. J. Volcanol. Geoth. Res. 2005, 142, 225–241. [Google Scholar] [CrossRef]
  31. Peters, C.; Dekkers, M.J. Selected room temperature magnetic parameters as a function of mineralogy, concentration and grain size. Phys. Chem. Earth 2003, 28, 659–667. [Google Scholar] [CrossRef]
  32. Chaparro, M.A.E.; Krishnamoorthy, N.; Chaparro, M.A.E.; Lecomte, K.L.; Mullainathan, S.; Mehra, R.; Sinito, A.M. Magnetic, chemical and radionuclide studies of river sediments and their variation with different physiographic regions of Bharathapuzha River, southwestern India. Stud. Geophys. Geod. 2015, 59, 438–460. [Google Scholar] [CrossRef]
  33. Jordanova, D.; Hoffmann, V.; Fehr, K.T. Mineral magnetic characterization of anthropogenic magnetic phases in the Danube river sediments (Bulgarian part). Earth Planet Sci. Lett. 2004, 221, 71–89. [Google Scholar] [CrossRef]
  34. Chaparro, M.A.E.; Rajkumar, P.; Chaparro, M.A.E.; Ramasamy, V.; Sinito, A.M. Magnetic parameters, trace elements, and multivariate statistical studies of river sediments from southeastern India: A case study from the Vellar River. Environ. Earth Sci. 2011, 63, 297–310. [Google Scholar] [CrossRef]
  35. Consensus-Based Sediment Quality Guidelines Recommendations. Available online: http://dnr.wi.gov/topic/brownfields/documents/cbsqg_interim_final.pdf (accessed on 19 April 2017).
  36. Persaud, D.; Jaagumagi, R.; Hayton, A. Guideline for the Protection and Management of Aquatic Sediment Quality in Ontario; Ministry of Environment and Energy: Toronto, ON, Canada, 1993; p. 3.
  37. Canadian Sediment Quality Guidelines for the Protection of Aquatic Life. Available online: https://www.pla.co.uk/Environment/Canadian-Sediment-Quality-Guidelines-for-the-Protection-of-Aquatic-Life (accessed on 19 April 2017).
  38. Sediment Protective Concentration Levels (PCLs). 2006. Available online: http://www.tceq.texas.gov/assets/public/remediation/trrp/sedpcls_2006.pdf (accessed on 19 May 2017).
  39. Dunlop, D.J. Theory and application of the Day plot (Mrs/Ms versus Hcr/Hc): Application to data for rocks, sediments and soils. J. Geophys. Res. 2002, 107, 1–15. [Google Scholar]
  40. Bibi, M.H.; Ahmed, F.; Ishiga, H. Assessment of metal concentrations in lake sediments of southwest Japan based on sediment quality guidelines. Environ. Geol. 2007, 52, 625–639. [Google Scholar] [CrossRef]
  41. Paramasivam, K.; Ramasamy, V.; Suresh, G. Impact of sediment characteristics on the heavy metal concentration and their ecological risk level of surface sediments of Vaigai river, Tamilnadu, India. Spectrochim. Acta Part A 2015, 137, 397–407. [Google Scholar] [CrossRef] [PubMed]
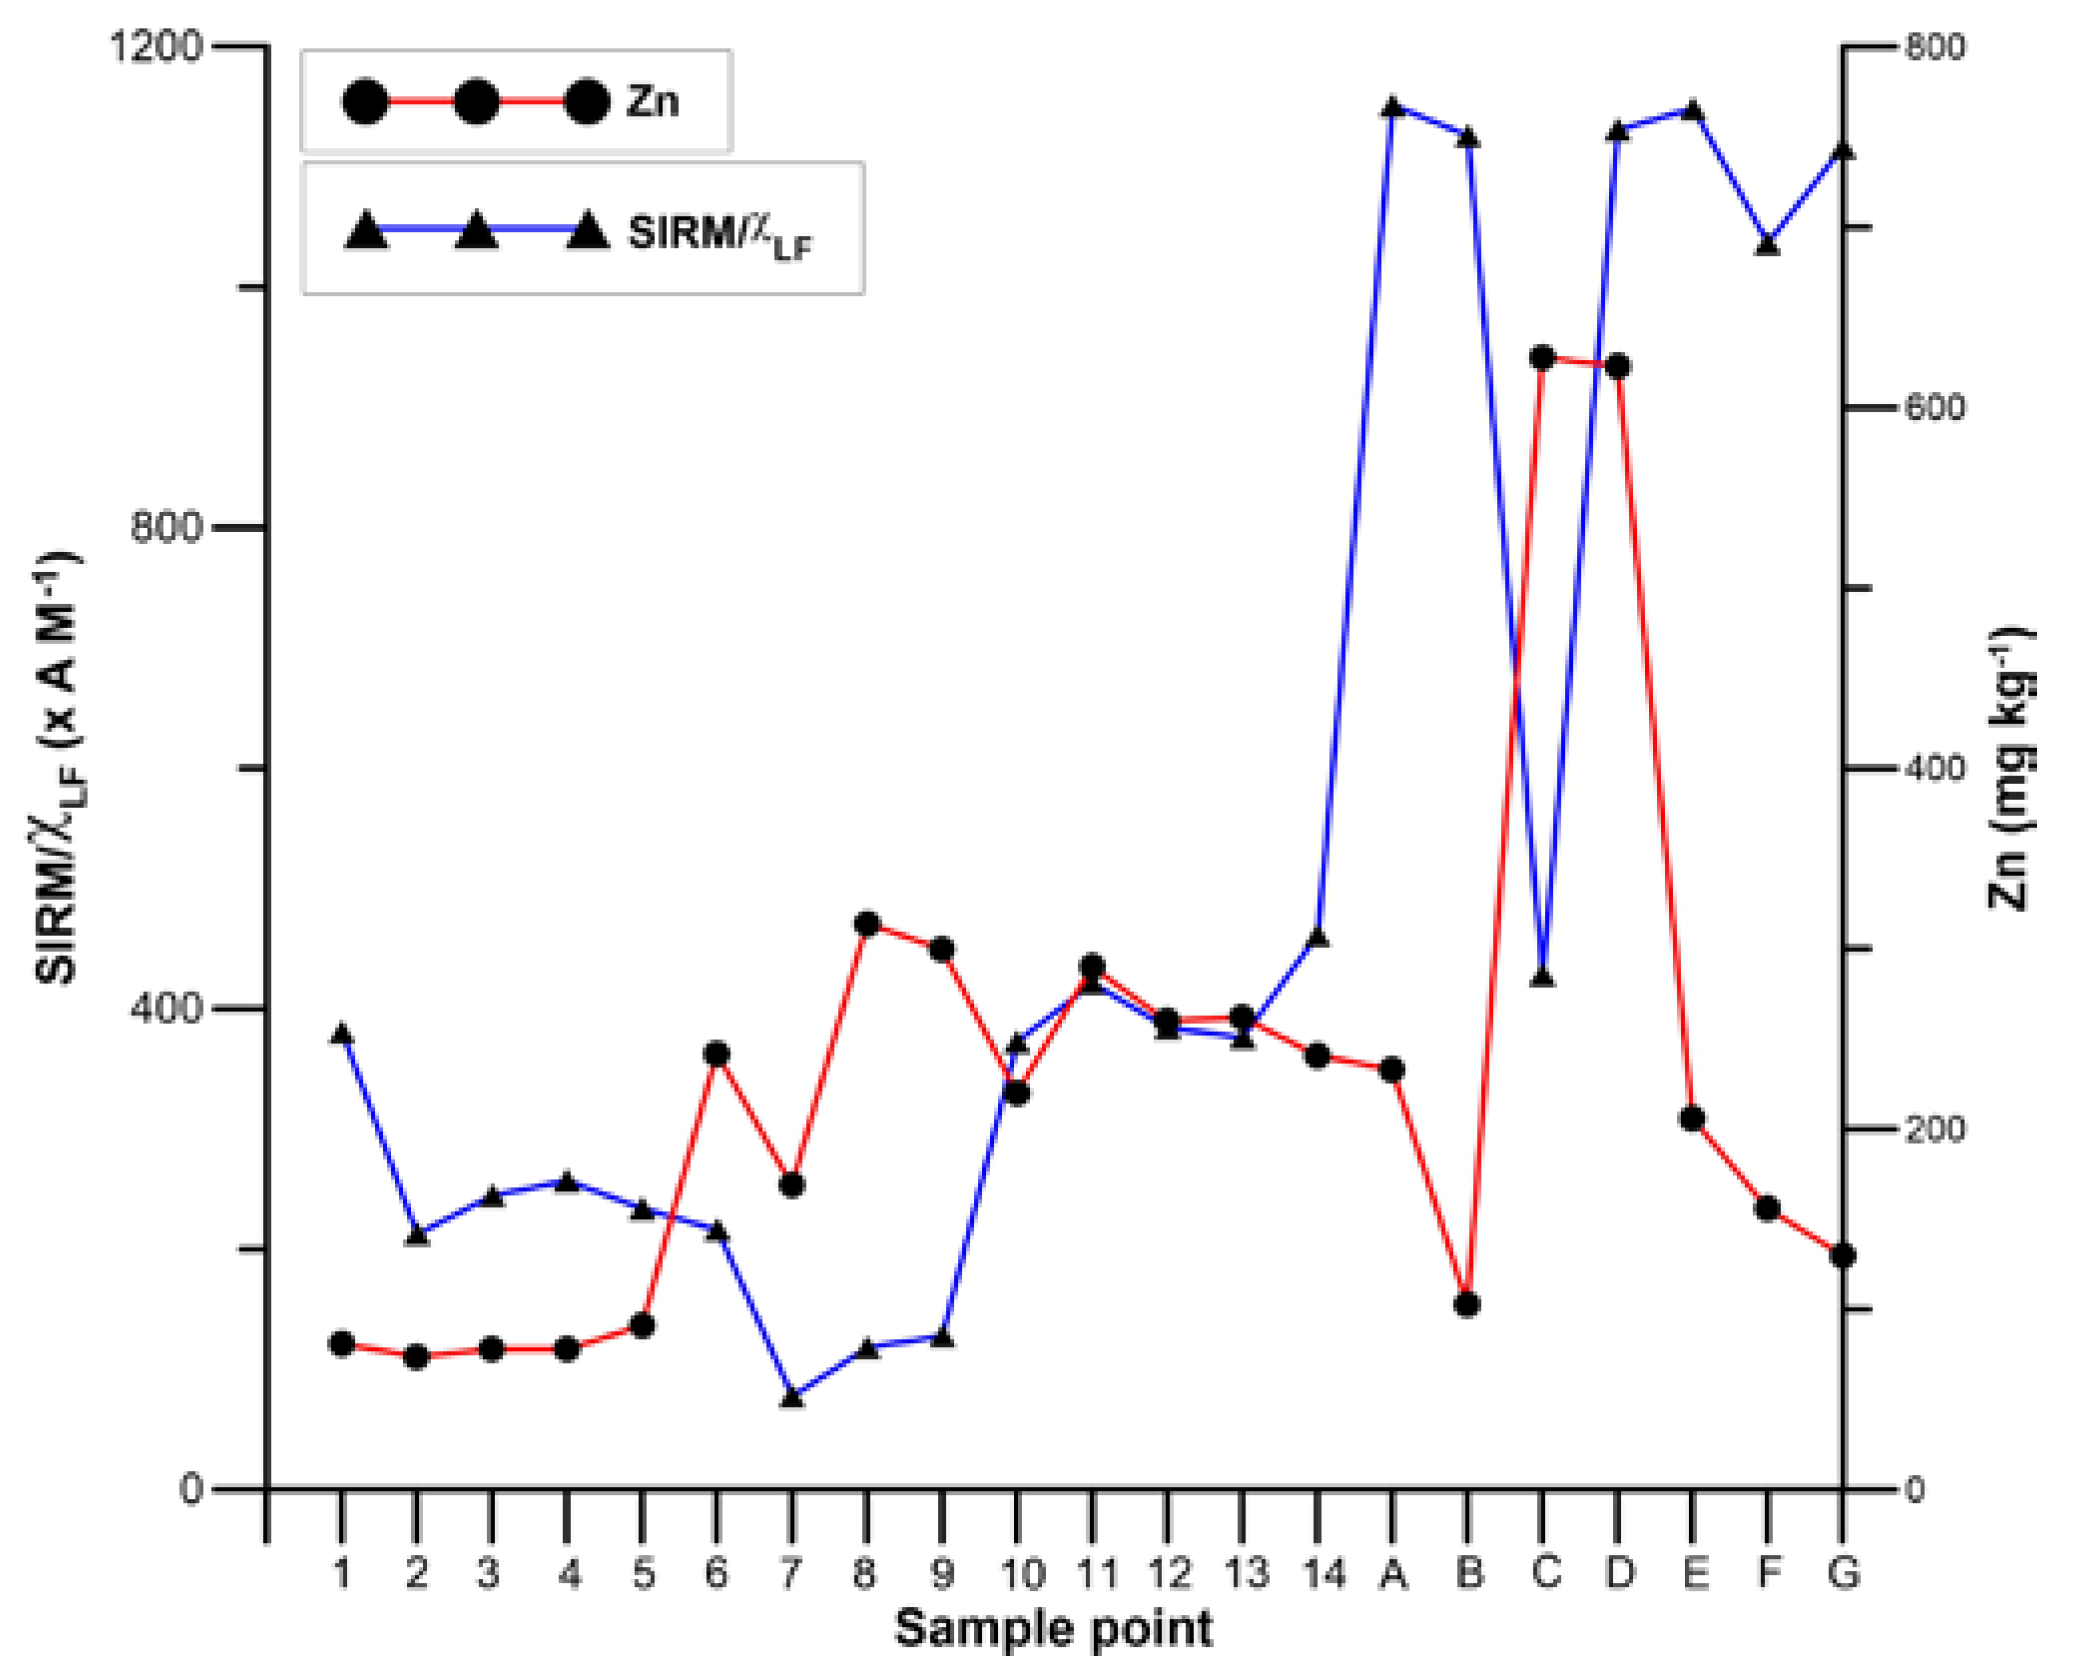
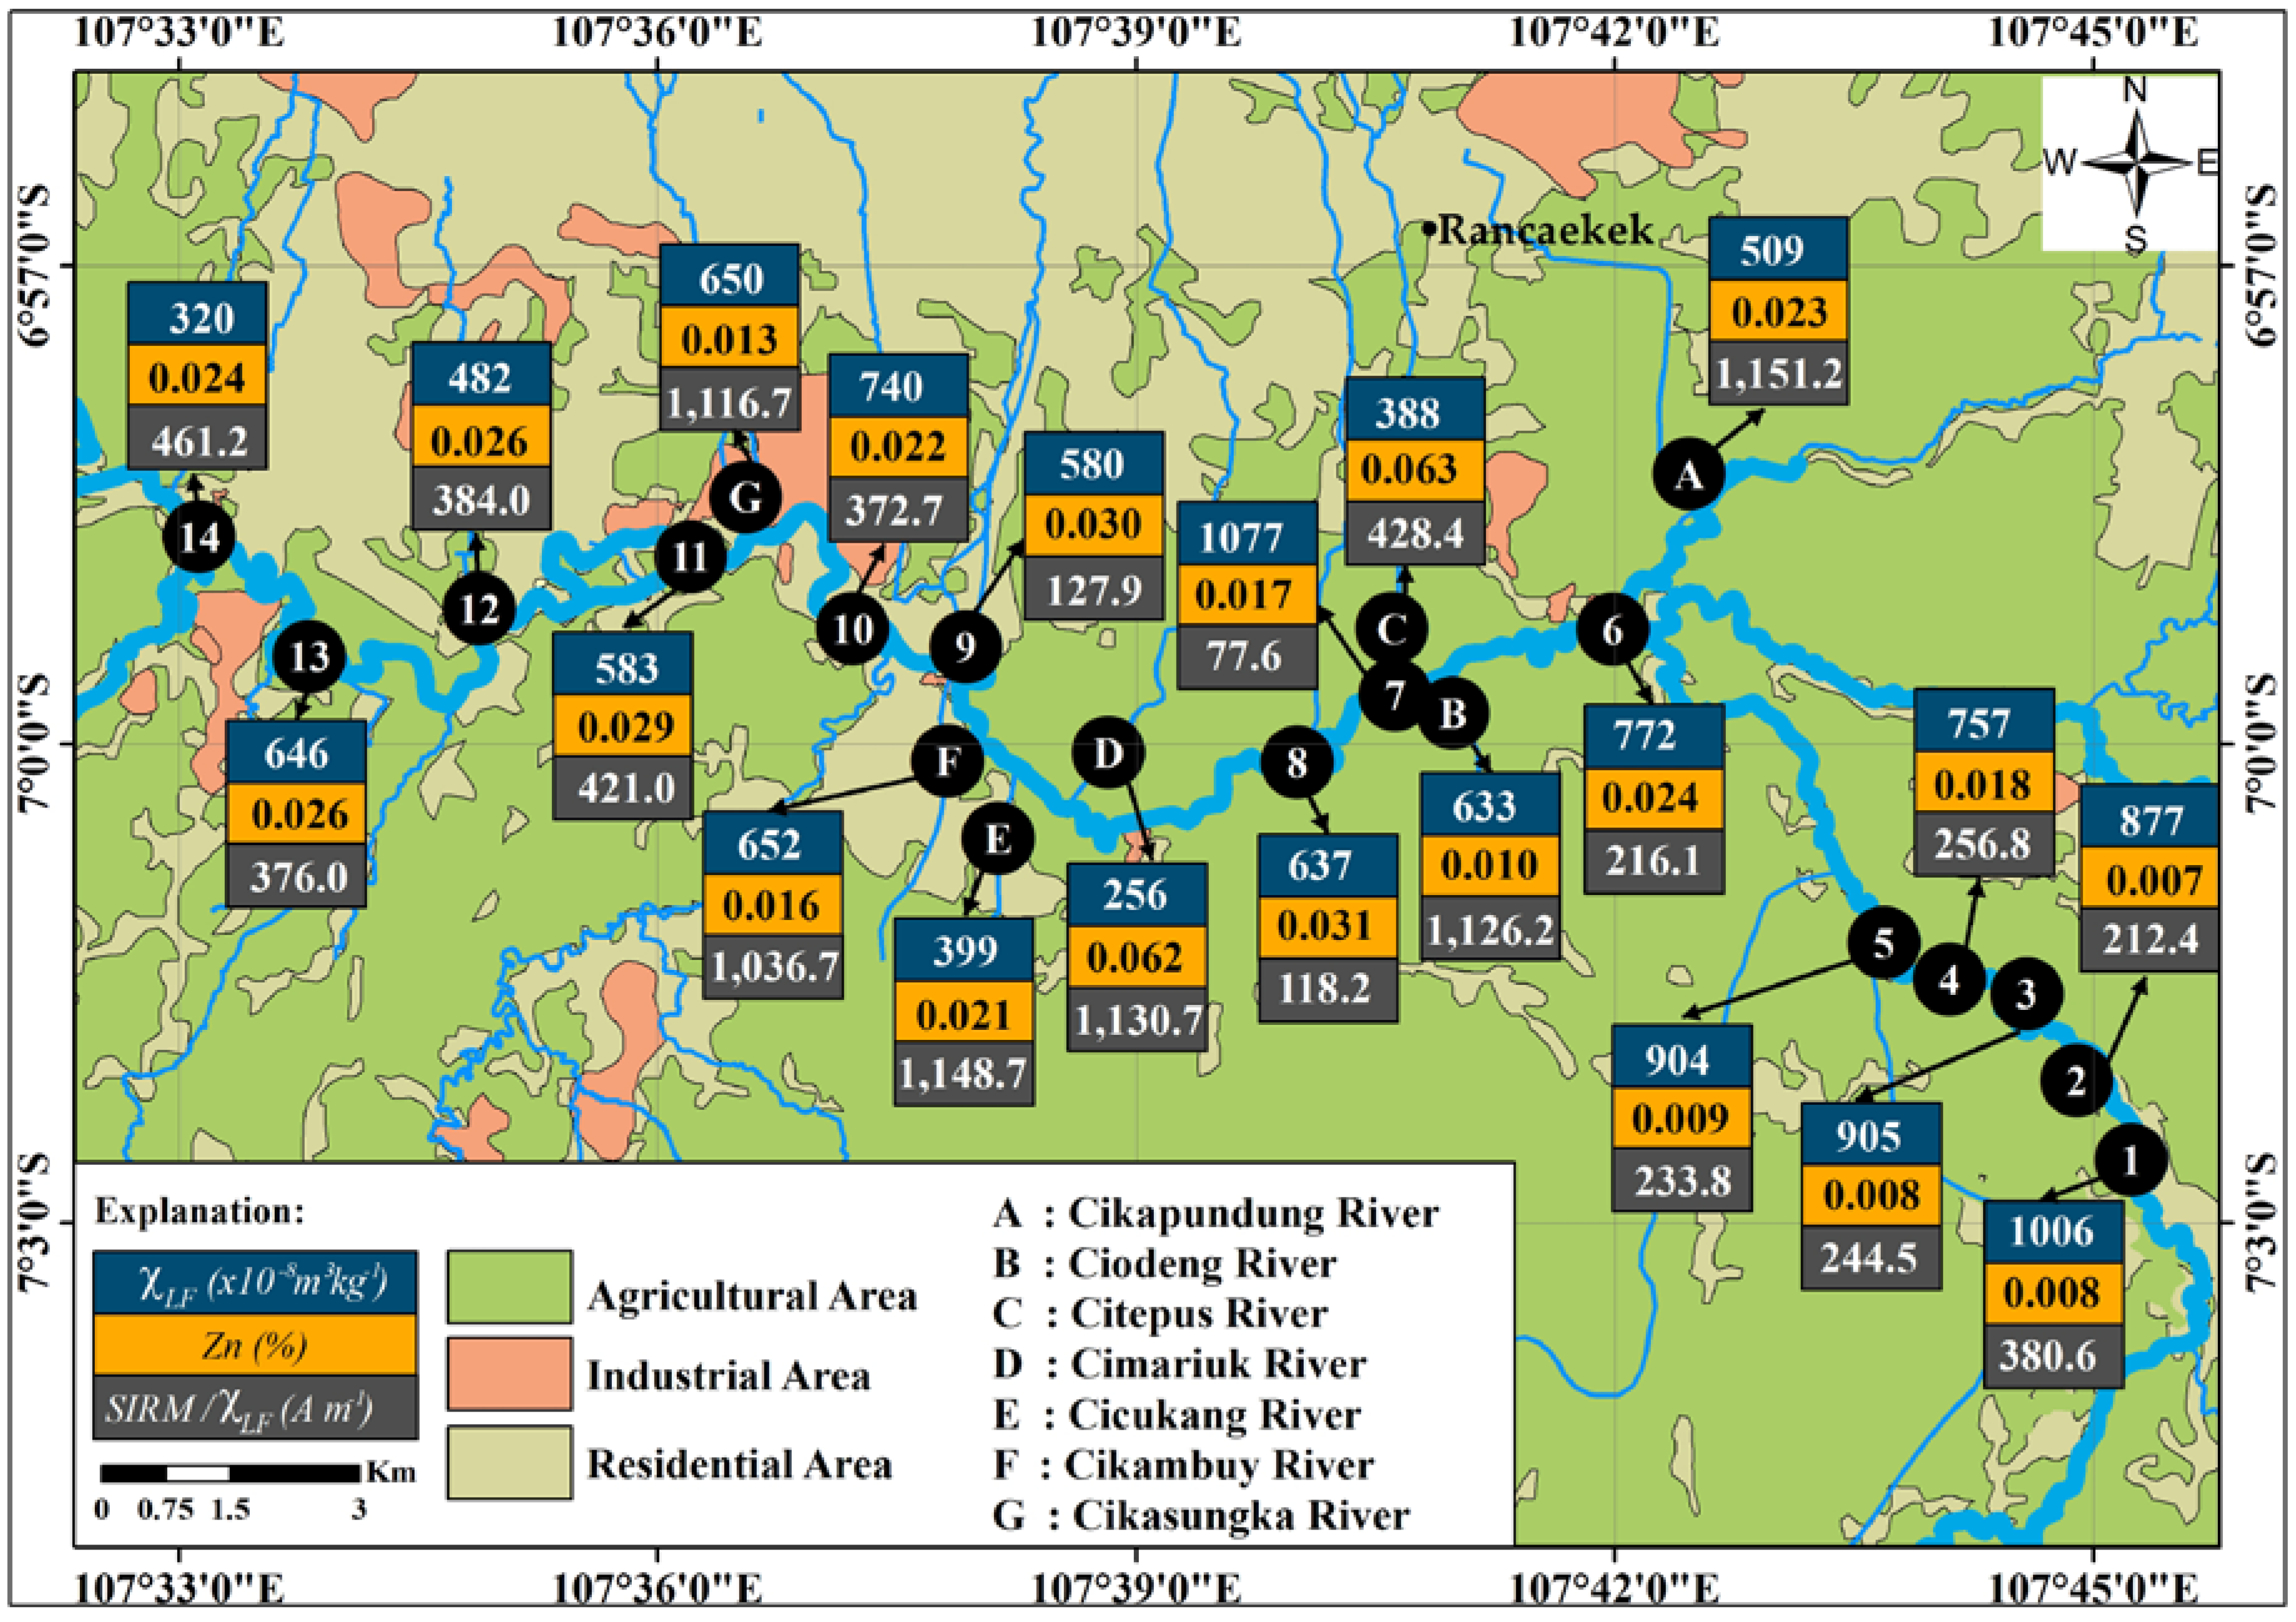
Figure 1. (a) Geological map of the studied area shows the sampling sites along the Citarum River from Balekambang (1) to Nanjung (14), as well as the tributaries (A to G) and (b) a map of the land use (modified from [19]). See text for further information.
Geosciences 07 00066 g001
Figure 2. Sample trap and its positioning on the site. Inset is the schematic of the sample trap.
Geosciences 07 00066 g002
Figure 3. (a) Isothermal remanent magnetization (IRM) acquisition curves for typical selected sediment samples from the Citarum River (1, 7, and 14) and its tributaries (D and F); (b) Diffractograms of magnetic separate of the suspended sediment samples shows the peaks of magnetite (Fe3O4); and Behaviors of the magnetization versus temperature of magnetic separate for typical selected samples of Citarum River: (c) sample 1, (d) sample 14.
Geosciences 07 00066 g003
Figure 4. Hysteresis properties of selected samples from the Citarum River (modified from [39]). SP: superparamagnetic; SD: single domain; PSD:pseudo-single domain; MD: multi domain.
Geosciences 07 00066 g004
Figure 5. Relationship among χLF and (a) Ti, (b) Fe, (c) Cu, (d) Zn, and (e) V for all samples in the Citarum River and its tributaries.
Geosciences 07 00066 g005
Figure 6. Sketch of the change in values of χLF, Zn, and SIRM/χLF along the Citarum River and its tributaries (modified from [19]).
Geosciences 07 00066 g006
Figure 7. Plot SIRM/Xlf and Zn of suspended sediment from the Citarum River and its tributaries.
Geosciences 07 00066 g007
Table 1. Summary of magnetic parameters and X-ray fluorescence (XRF) analyses of suspended sediment samples of the Citarum River and its tributaries. SIRM: saturated isothermal remanent magnetization.
Sample Magnetic ParametersComponent
χLF (× 10−8 m3·kg−1)χFD (%)SIRM (× 10−6Am2·kg−1)%magnetite (‰)SIRM/χLF (Am−1)Ti (%)Fe (%)Cu (mg·kg−1)Zn (mg·kg−1)V (mg·kg−1)
Citarum River
1 1005.83.33828.34.16380.60.77 ± 0.028.77 ± 0.0773 ± 1681 ± 14174 ± 74
2 876.53.51861.62.02212.40.75 ± 0.028.78 ± 0.0766 ± 1674 ± 14205 ± 69
3 905.34.52213.02.41244.50.72 ± 0.028.63 ± 0.0764 ± 1578 ± 13203 ± 7
4 757.05.21943.82.11256.80.71 ± 0.028.88 ± 0.0764 ± 1678 ± 19224 ± 69
5 904.14.12113.42.30233.80.60 ± 0.028.30 ± 0.0767± 1591 ± 1.4131 ± 65
6 772.33.61668.81.81216.10.69 ± 0.028.40 ± 0.0778 ± 16242 ± 2.1190 ± 64
7 1076.63.1835.70.9177.60.77 ± 0.028.96 ± 0.0770 ± 17169 ± 19186 ± 68
8 637.13.1753.40.82118.20.70 ± 0.027.89 ± 0.0772 ± 15314 ± 23175 ± 66
9 580.44.6742.40.81127.90.68 ± 0.027.97 ± 0.0771 ± 16300 ± 24179 ± 63
10 739.63.72756.43.00372.70.73 ± 0.028.45 ± 0.0769 ± 16220 ± 21172 ± 65
11 582.54.22452.52.67421.00.67 ± 0.028.08 ± 0.0777 ± 16290 ± 23117 ± 64
12 482.24.51856.02.02384.00.68 ± 0.027.81 ± 0.0770 ± 15260 ± 22177 ± 65
13 646.43.42430.42.64376.00.70 ± 0.028.26 ± 0.0777 ± 16262 ± 22158 ± 63
14 319.66.11477.11.61461.20.61 ± 0.027.55 ± 0.0785 ± 16241 ± 21116 ± 61
Tributaries
A 509.23.35861.76.371151.20.68 ± 0.027.31 ± 0.07108 ± 17233 ± 21162 ± 66
B 632.94.27127.97.751126.20.73 ± 0.028.46 ± 0.0768 ± 15103 ± 15162 ± 66
C 387.54.31659.91.80428.40.66 ± 0.026.86 ± 0.07173 ± 20628 ± 31141 ± 66
D 256.02.12894.63.151130.70.65 ± 0.026.27 ± 0.07158 ± 23623 ± 36156 ± 66
E 398.93.44582.34.981148.70.71 ± 0.028.64 ± 0.0780 ± 17206 ± 20188 ± 65
F 652.43.56762.97.351036.70.74 ± 0.028.72 ± 0.0669 ± 16156 ± 18196 ± 66
G 650.23.47260.67.891116.70.71 ± 0.027.97 ± 0.0761 ± 15130 ± 16191 ± 62

