
Climate Change and Watershed Hydrology—Heavier Precipitation Influence on Stormwater Runoff

Abstract
:
1. Introduction
2. Methods
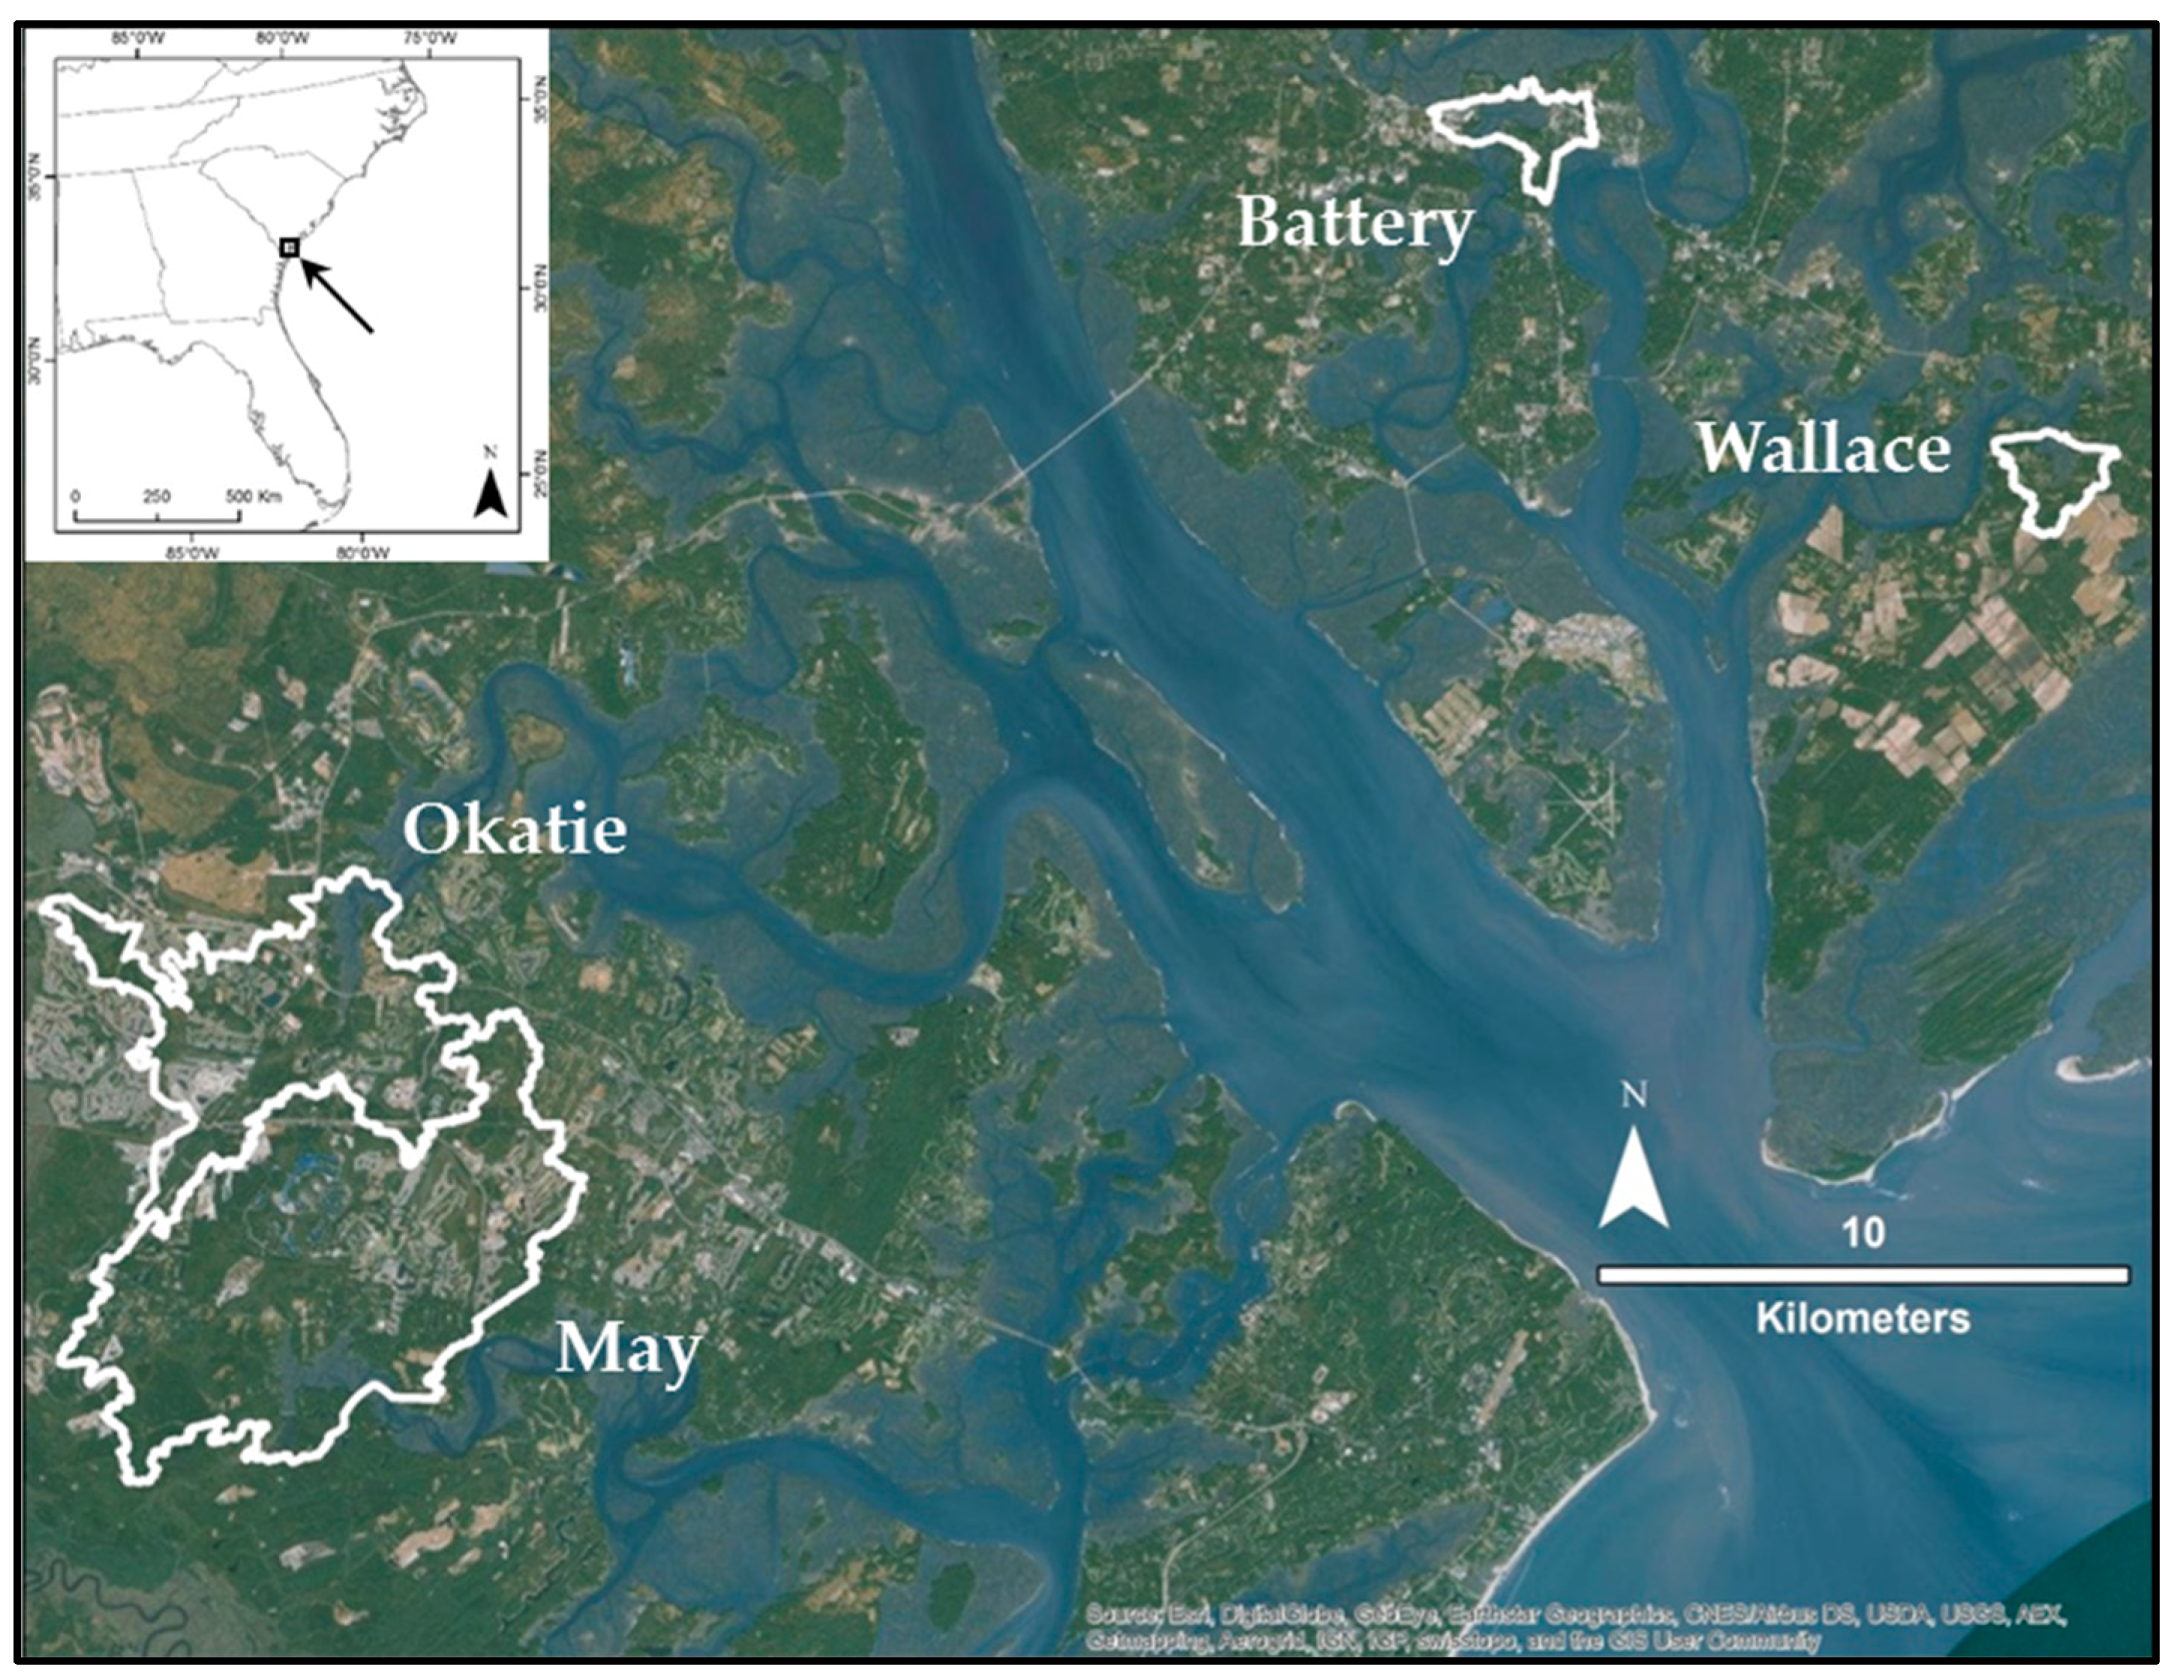
2.1. Study Sites
2.2. Stormwater Runoff Modeling
2.3. Development Levels
2.4. Climate Scenarios
3. Results
3.1. Watershed Characteristics
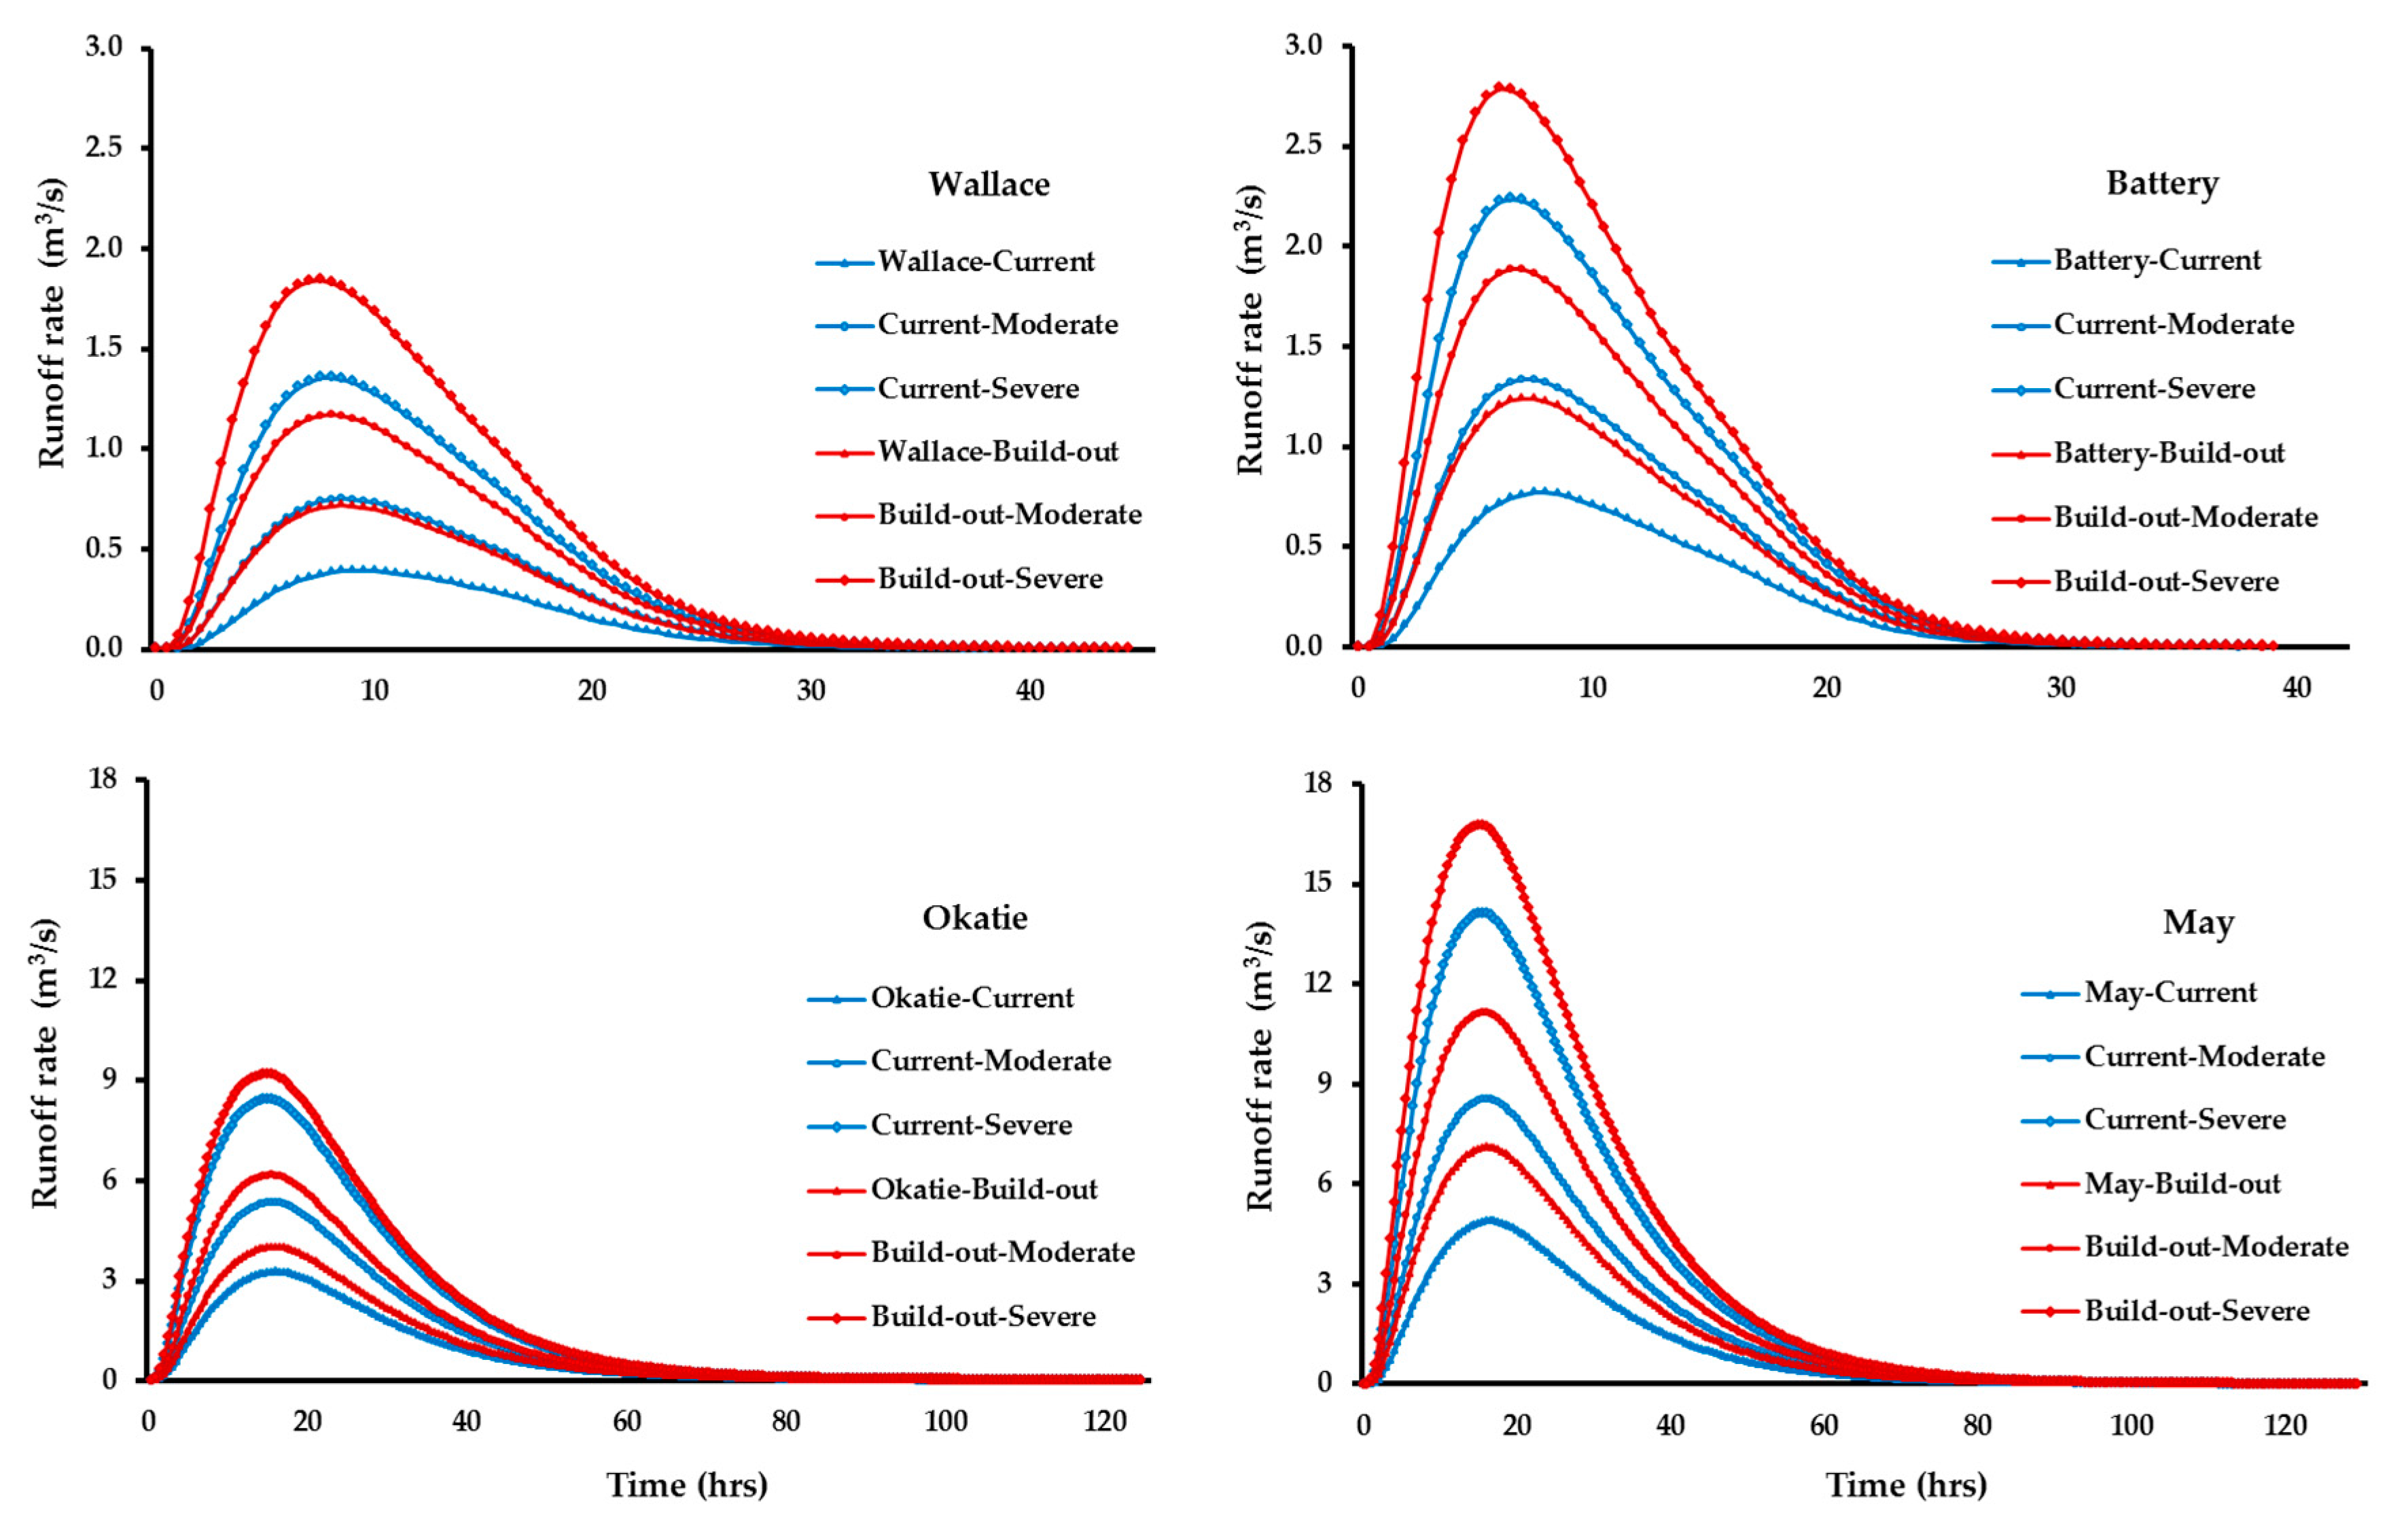
3.2. Modeled Runoff Measurements
3.3. Development Influence on Runoff
3.3.1. Development Effect at Current
3.3.2. Development Effect at Build-out
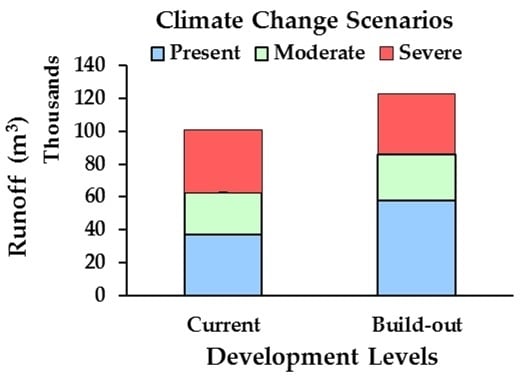
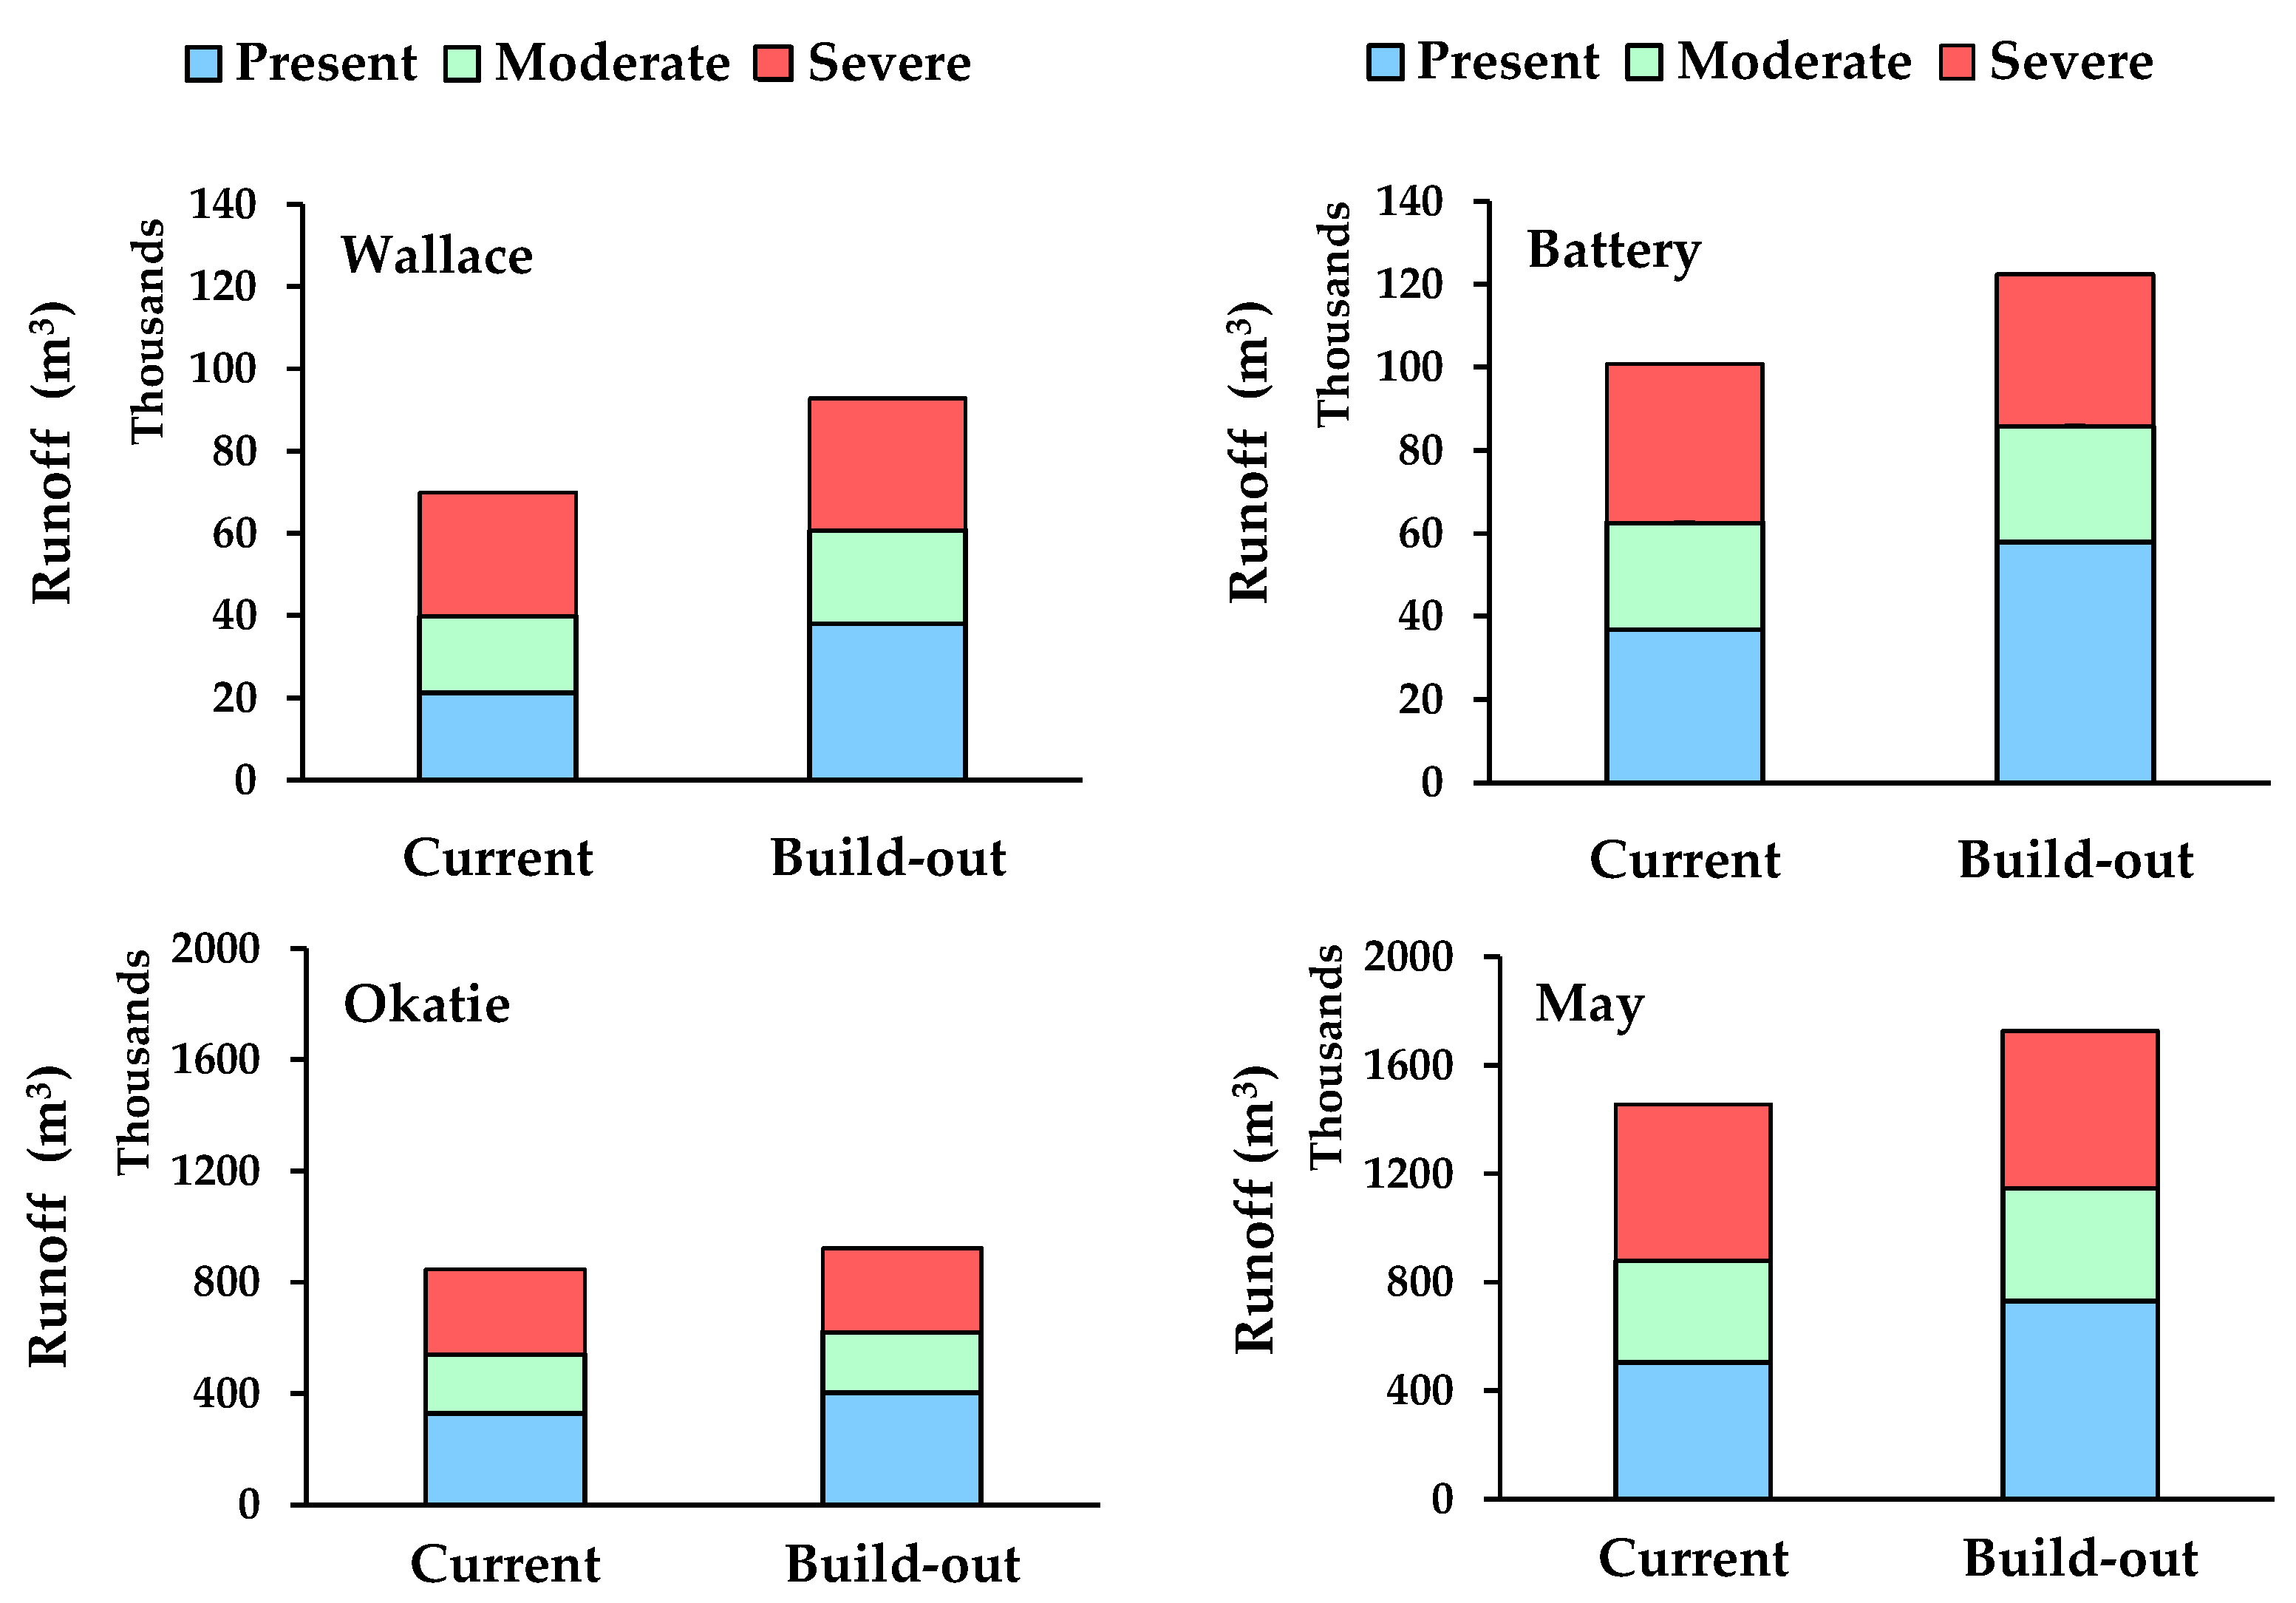
3.4. Climate Change Influence on Runoff
3.4.1. Climate Change Effect at Current Development
3.4.2. Climate Change Effect at Build-out Development
4. Discussion
Acknowledgments
Author Contributions
Disclaimer
Abbreviations
| ARC | Antecedent Runoff Conditions |
| h | Hour |
| ha | Hectare |
| HSG | Hydrologic Soil Group |
| Ia | Initial abstraction |
| IC | Impervious Cover |
| m3 | cubic meter |
| mm | Millimeter |
| NRCS | Natural Resources Conservation Service |
| s | Second |
| SC | South Carolina |
| SWARM | Stormwater Runoff Modeling System |
| U.S. | United States |
| USA | United States of America |
| USDA | United States Department of Agriculture |
| USGS | United States Geological Survey |
References
- Cohen, J.E. Human Population: The Next Half Century. Science 2003, 302, 1172–1175. [Google Scholar] [CrossRef] [PubMed]
- Bates, B.C.; Kundzewicz, Z.W.; Wu, S.; Palutikof, J.P. Climate Change and Water; Technical Paper; Intergovernmental Panel on Climate Change: Geneva, Switzerland, 2008; p. 210. [Google Scholar]
- Pryor, S.C.; Scavia, D.; Downer, C.; Gaden, M.; Iverson, L.; Nordstrom, R.; Patz, J.; Robertson, G.P. Chapter 18 Mid-west. In Climate Change Impacts in the United States: The Third National Climate Assessment; Melillo, J.M., Richmond, T.C., Yohe, G.W., Eds.; U.S. Global Change Research Program: Washington, DC, USA, 2014; pp. 418–440. [Google Scholar] [CrossRef]
- Walsh, J.; Wuebbles, D.; Hayhoe, K.; Kossin, J.; Kunkel, K.; Stephens, G.; Thorne, P.; Vose, R.; Wehner, M.; Willis, J.; et al. Chapter 2 Our Changing Climate. In Climate Change Impacts in the United States: The Third National Climate Assessment; Melillo, J.M., Richmond, T.C., Yohe, G.W., Eds.; U.S. Global Change Research Program: Washington, DC, USA, 2014; pp. 19–67. [Google Scholar] [CrossRef]
- U.S. Environmental Protection Agency. National Water Quality Inventory. 2000 Report; EPA-841-R-02-001; U.S. Environmental Protection Agency: Washington, DC, USA, 2002; p. 460.
- Schueler, T. The importance of imperviousness. Watershed Prot. Tech. 1994, 1, 100–111. [Google Scholar]
- Mallin, M.A.; Williams, K.E.; Esham, E.C.; Lowe, R.P. Effect of human development on bacteriological water quality in coastal watersheds. Ecol. Appl. 2000, 10, 1047–1056. [Google Scholar]
- Holland, A.F.; Sanger, D.M.; Gawle, C.P.; Lerberg, S.B.; Santiago, M.S.; Riekerk, G.H.M.; Zimmerman, L.E.; Scott, G.I. Linkages between tidal creek ecosystems and the landscape and demographic attributes of their watersheds. J. Exp. Mar. Biol. Ecol. 2004, 298, 151–178. [Google Scholar] [CrossRef]
- Bricker, S.; Longstaff, B.; Dennison, W.; Jones, A.; Boicourt, K.; Wicks, C.; Woerner, J. Effects of nutrient enrichment in the nation’s estuaries: A decade of change. Harmful Algae 2008, 8, 21–32. [Google Scholar] [CrossRef]
- Di Donato, G.T.; Stewart, J.R.; Sanger, D.M.; Robinson, B.J.; Thompson, B.C.; Holland, A.F.; Van Dolah, R.F. Effects of changing land use on the microbial water quality of tidal creeks. Mar. Pollut. Bull. 2009, 58, 97–106. [Google Scholar] [CrossRef] [PubMed]
- Blair, A.; Lovelace, S.; Sanger, D.; Holland, A.F.; Vandiver, L.; White, S. Exploring Impacts of Development and Climate Change on Stormwater Runoff. Hydrol. Process. 2014, 28, 559–569. [Google Scholar] [CrossRef]
- Sanger, D.; Blair, A.; DiDonato, G.; Washburn, T.; Jones, S.; Riekerk, G.; Wirth, E.; Stewart, J.; White, D.; Vandiver, L.; et al. Impacts of Coastal Development on the Ecology of Tidal Creek Ecosystems of the US Southeast Including Consequences to Humans. Estuar. Coast. 2015, 38, 49–66. [Google Scholar] [CrossRef]
- Semadeni-Davies, A.; Hernebring, C.; Svensson, G.; Gustafsson, L. The impacts of climate change and urbanisation on drainage in Helsingborg, Sweden: Combined sewer system. J. Hydrol. 2008, 350, 100–113. [Google Scholar] [CrossRef]
- Georgakakos, A.; Fleming, P.; Dettinger, M.; Peters-Lidard, C.; Richmond, T.C.; Reckhow, K.; White, K.; Yates, D. Chapter 3 Water Resources. In Climate Change Impacts in the United States: The Third National Climate Assessment; Melillo, J.M., Richmond, T.C., Yohe, G.W., Eds.; U.S. Global Change Research Program: Washington, DC, USA, 2014; pp. 69–112. [Google Scholar] [CrossRef]
- Crossett, K.M.; Culliton, T.J.; Wiley, P.C.; Goodspeed, T.R. Population trends along the coastal United States: 1980–2008. In Coastal Trends Report Series; National Oceanic and Atmospheric Administration, National Ocean Service: Washington, DC, USA, 2004; p. 47. [Google Scholar]
- Allen, J.; Lu, K. Modeling and prediction of future urban growth in the Charleston region of South Carolina: A GIS based integrated approach. Conserv. Ecol. 2003, 8, 2. [Google Scholar]
- Corbett, C.W.; Wahl, M.; Porter, D.E.; Edwards, D.; Moise, C. Nonpoint source runoff modeling a comparison of a forested watershed and an urban watershed on the South Carolina coast. J. Exp. Mar. Biol. Ecol. 1997, 213, 133–149. [Google Scholar] [CrossRef]
- Brown, D.G.; Polsky, C.; Bolstad, P.; Brody, S.D.; Hulse, D.; Kroh, R.; Loveland, T.R.; Thomson, A. chapter 13 Land Use and Land Cover Change. In Climate Change Impacts in the United States: The Third National Climate Assessment; Melillo, J.M., Richmond, T.C., Yohe, G.W., Eds.; U.S. Global Change Research Program: Washington, DC, USA, 2014; pp. 318–332. [Google Scholar] [CrossRef]
- Tweel, A.; Sanger, D.; Blair, A.; Montie, E.; Turner, A.; Leffler, J. Collaborative Research to Prioritize and Model the Runoff Volume Sensitivities of Tidal Headwaters; NOAA Grant Number NA09NOS4190153; NOAA: Washington, DC, USA, 2015; p. 63.
- Coastal Change Analysis Program. Available online: https://coast.noaa.gov/dataregistry/search/collection/info/ccapregional (accessed on 20 January 2016).
- Web Soil Survey. Available online: http://websoilsurvey.nrcs.usda.gov/app/ (accessed on 20 January 2016).
- U.S. Department of Agriculture; Natural Resources Conservation Service. National Engineering Handbook, Part 630 Hydrology, Chapters 7 (2009), 9 (2004), 10 (2004), 15 (2010), 16 (2007). Available online: http://www.nrcs.usda.gov/wps/portal/nrcs/detailfull/national/water/?cid=stelprdb1043063 (accessed on 20 January 2016).
- Blair, A.; Sanger, D.; White, D.; Holland, A.F.; Vandiver, L.; Bowker, C.; White, S. Quantifying and Simulating Stormwater Runoff in Watersheds. Hydrol. Process. 2014, 28, 2844–2854. [Google Scholar] [CrossRef]
- Beaufort County Manual for Stormwater Best Management and Design Practices (BMP). 2012. Available online: http://bcgov.net/departments/Engineering-and-Infrastructure/stormwater-management/documents/beaufort_manual_mar2012.pdf (accessed on 20 January 2016).
- National Oceanographic and Atmospheric Administration. Temporal distributions of heavy precipitation. In NOAA Atlas 14; NOAA: Washington, DC, USA, 2004; Volume 2. [Google Scholar]
- U.S. Department of Agriculture; Natural Resources Conservation Service. Chapter 10 Estimation of Direct Runoff from Storm Rainfall. In National Engineering Handbook Hydrology Chapters; USDA: Washington, DC, USA, 2004; p. 22. [Google Scholar]
- Gao, P.; Carbone, G.J.; Guo, D. Assessment of NARCCAP model in simulating rainfall extremes using a spatially constrained regionalization method. Int. J. Climatol. 2016, 36, 2368–2378. [Google Scholar] [CrossRef]
- Arnold, C.L., Jr.; Gibbons, C. Impervious surface coverage: The emergence of a key environmental indicator. J. Am. Plan. Assoc. 1996, 62, 243–258. [Google Scholar] [CrossRef]
- U.S. Department of Agriculture; Soil Conservation Service; Conservation Engineering Division. Urban Hydrology for Small Watersheds, 2nd ed.Technical Release 55; USDA: Washington, DC, USA, 1986; p. 12.
- Mallin, M.A.; Johnson, V.L.; Ensign, S.H. Comparative impacts of stormwater runoff on water quality of an urban, a suburban, and a rural stream. Environ. Model. Assess. 2009, 159, 475–491. [Google Scholar] [CrossRef] [PubMed]
- Ellis, K.; Berg, C.; Caraco, D.; Drescher, S.; Hoffmann, G.; Keppler, B.; LaRocco, M.; Turner, A. Low Impact Development in Coastal South Carolina: A Planning and Design Guide; ACE Basin and North Inlet-Winyah Bay National Estuarine Research Reserves: Georgetown, SC, USA, 2014; p. 462.
- Guan, M.; Sillanpaa, N.; Koivusalo, H. Storm runoff response to rainfall pattern, magnitude and urbanization in a developing urban catchment. Hydrol. Process. 2016, 30, 543–557. [Google Scholar] [CrossRef]


| Category | Description | Current Land Use | Build-out Land Use | ||||||
|---|---|---|---|---|---|---|---|---|---|
| Wallace | Battery | Okatie | May | Wallace | Battery | Okatie | May | ||
| Area | Hectares | 241 | 288 | 2296 | 4378 | 241 | 288 | 2296 | 4378 |
| Land Use | Developed-High | 0.000 | 0.068 | 0.006 | 0.001 | 0.000 | 0.089 | 0.009 | 0.004 |
| Developed-Medium | 0.000 | 0.100 | 0.071 | 0.026 | 0.000 | 0.132 | 0.110 | 0.066 | |
| Developed-Low | 0.005 | 0.174 | 0.166 | 0.098 | 0.367 | 0.229 | 0.258 | 0.251 | |
| Developed-Open | 0.003 | 0.224 | 0.160 | 0.112 | 0.180 | 0.294 | 0.248 | 0.286 | |
| Cultivated | 0.039 | 0.000 | 0.011 | 0.016 | 0 | 0 | 0 | 0 | |
| Forested | 0.297 | 0.151 | 0.125 | 0.228 | 0 | 0 | 0 | 0 | |
| Pasture/Grass | 0.062 | 0.003 | 0.032 | 0.049 | 0 | 0 | 0 | 0 | |
| Brush | 0.142 | 0.023 | 0.055 | 0.077 | 0 | 0 | 0 | 0 | |
| Wetland | 0.448 | 0.198 | 0.344 | 0.369 | 0.448 | 0.198 | 0.344 | 0.369 | |
| Water | 0.004 | 0.059 | 0.030 | 0.025 | 0.004 | 0.059 | 0.030 | 0.025 | |
| Hydrologic Soil Group | A | 0.093 | 0.583 | 0.033 | 0.041 | 0.093 | 0.583 | 0.033 | 0.041 |
| B | 0.206 | 0.151 | 0.054 | 0.221 | 0.206 | 0.151 | 0.054 | 0.221 | |
| C | 0.192 | 0.060 | 0.469 | 0.277 | 0.192 | 0.060 | 0.469 | 0.277 | |
| D | 0.509 | 0.207 | 0.444 | 0.462 | 0.509 | 0.207 | 0.444 | 0.462 | |
| Watershed | Area (ha) | IC (%) | Developed | Undeveloped | Wetland | Water | HSG (C+D) |
|---|---|---|---|---|---|---|---|
| Wallace | 241 | 1 | 1% | 54% | 45% | 0% | 70% |
| Battery | 288 | 30 | 57% | 17% | 20% | 6% | 27% |
| Okatie | 2296 | 23 | 40% | 22% | 35% | 3% | 91% |
| May | 4378 | 13 | 24% | 37% | 37% | 2% | 74% |
| Watershed | IC (%) | Category | Ia (mm) | Stormwater Runoff | ||
|---|---|---|---|---|---|---|
| Volume (m3) | Ratio | Peak rate (m3/s) | ||||
| Wallace | 1 | Current Development | 7.8 | 21,142 | 0.18 | 0.40 |
| Moderate Climate Change | 5.0 | 39,775 | 0.30 | 0.76 | ||
| Severe Climate Change | 2.7 | 69,839 | 0.49 | 1.37 | ||
| 35 | Build-out Development | 4.3 | 37,909 | 0.32 | 0.72 | |
| Moderate Climate Change | 2.7 | 60,646 | 0.46 | 1.18 | ||
| Severe Climate Change | 1.5 | 92,693 | 0.65 | 1.86 | ||
| Battery | 30 | Current Development | 5.4 | 36,853 | 0.26 | 0.78 |
| Moderate Climate Change | 3.5 | 62,551 | 0.40 | 1.35 | ||
| Severe Climate Change | 1.9 | 100,858 | 0.59 | 2.26 | ||
| 40 | Build-out Development | 3.1 | 57,857 | 0.41 | 1.25 | |
| Moderate Climate Change | 2.0 | 85,909 | 0.55 | 1.90 | ||
| Severe Climate Change | 1.1 | 122,453 | 0.72 | 2.80 | ||
| Okatie | 23 | Current Development | 4.8 | 328,255 | 0.29 | 3.27 |
| Moderate Climate Change | 3.1 | 539,843 | 0.43 | 5.40 | ||
| Severe Climate Change | 1.6 | 846,241 | 0.62 | 8.45 | ||
| 36 | Build-out Development | 3.7 | 400,719 | 0.35 | 4.02 | |
| Moderate Climate Change | 2.4 | 621,445 | 0.50 | 6.21 | ||
| Severe Climate Change | 1.3 | 922,765 | 0.68 | 9.22 | ||
| May | 13 | Current Development | 6.1 | 502,875 | 0.23 | 4.95 |
| Moderate Climate Change | 3.9 | 879,314 | 0.37 | 8.62 | ||
| Severe Climate Change | 2.1 | 1,454,969 | 0.56 | 14.24 | ||
| 33 | Build-out Development | 4.0 | 729,857 | 0.34 | 7.16 | |
| Moderate Climate Change | 2.5 | 1,147,637 | 0.48 | 11.24 | ||
| Severe Climate Change | 1.4 | 1,726,224 | 0.66 | 16.88 | ||
© 2016 by the authors; licensee MDPI, Basel, Switzerland. This article is an open access article distributed under the terms and conditions of the Creative Commons Attribution (CC-BY) license (http://creativecommons.org/licenses/by/4.0/).
Share and Cite
Blair, A.; Sanger, D. Climate Change and Watershed Hydrology—Heavier Precipitation Influence on Stormwater Runoff. Geosciences 2016, 6, 34. https://doi.org/10.3390/geosciences6030034
Blair A, Sanger D. Climate Change and Watershed Hydrology—Heavier Precipitation Influence on Stormwater Runoff. Geosciences. 2016; 6(3):34. https://doi.org/10.3390/geosciences6030034
Chicago/Turabian StyleBlair, Anne, and Denise Sanger. 2016. "Climate Change and Watershed Hydrology—Heavier Precipitation Influence on Stormwater Runoff" Geosciences 6, no. 3: 34. https://doi.org/10.3390/geosciences6030034
APA StyleBlair, A., & Sanger, D. (2016). Climate Change and Watershed Hydrology—Heavier Precipitation Influence on Stormwater Runoff. Geosciences, 6(3), 34. https://doi.org/10.3390/geosciences6030034