1. Introduction
Karst as a type of landscape found on carbonate rocks (limestone, dolomite, marble) or evaporites (gypsum, anhydrite, rock salt) is characterized by a suite of landforms comprising springs, dolines, caves, collapsed sinkholes and carbonate depositional landforms [
1,
2,
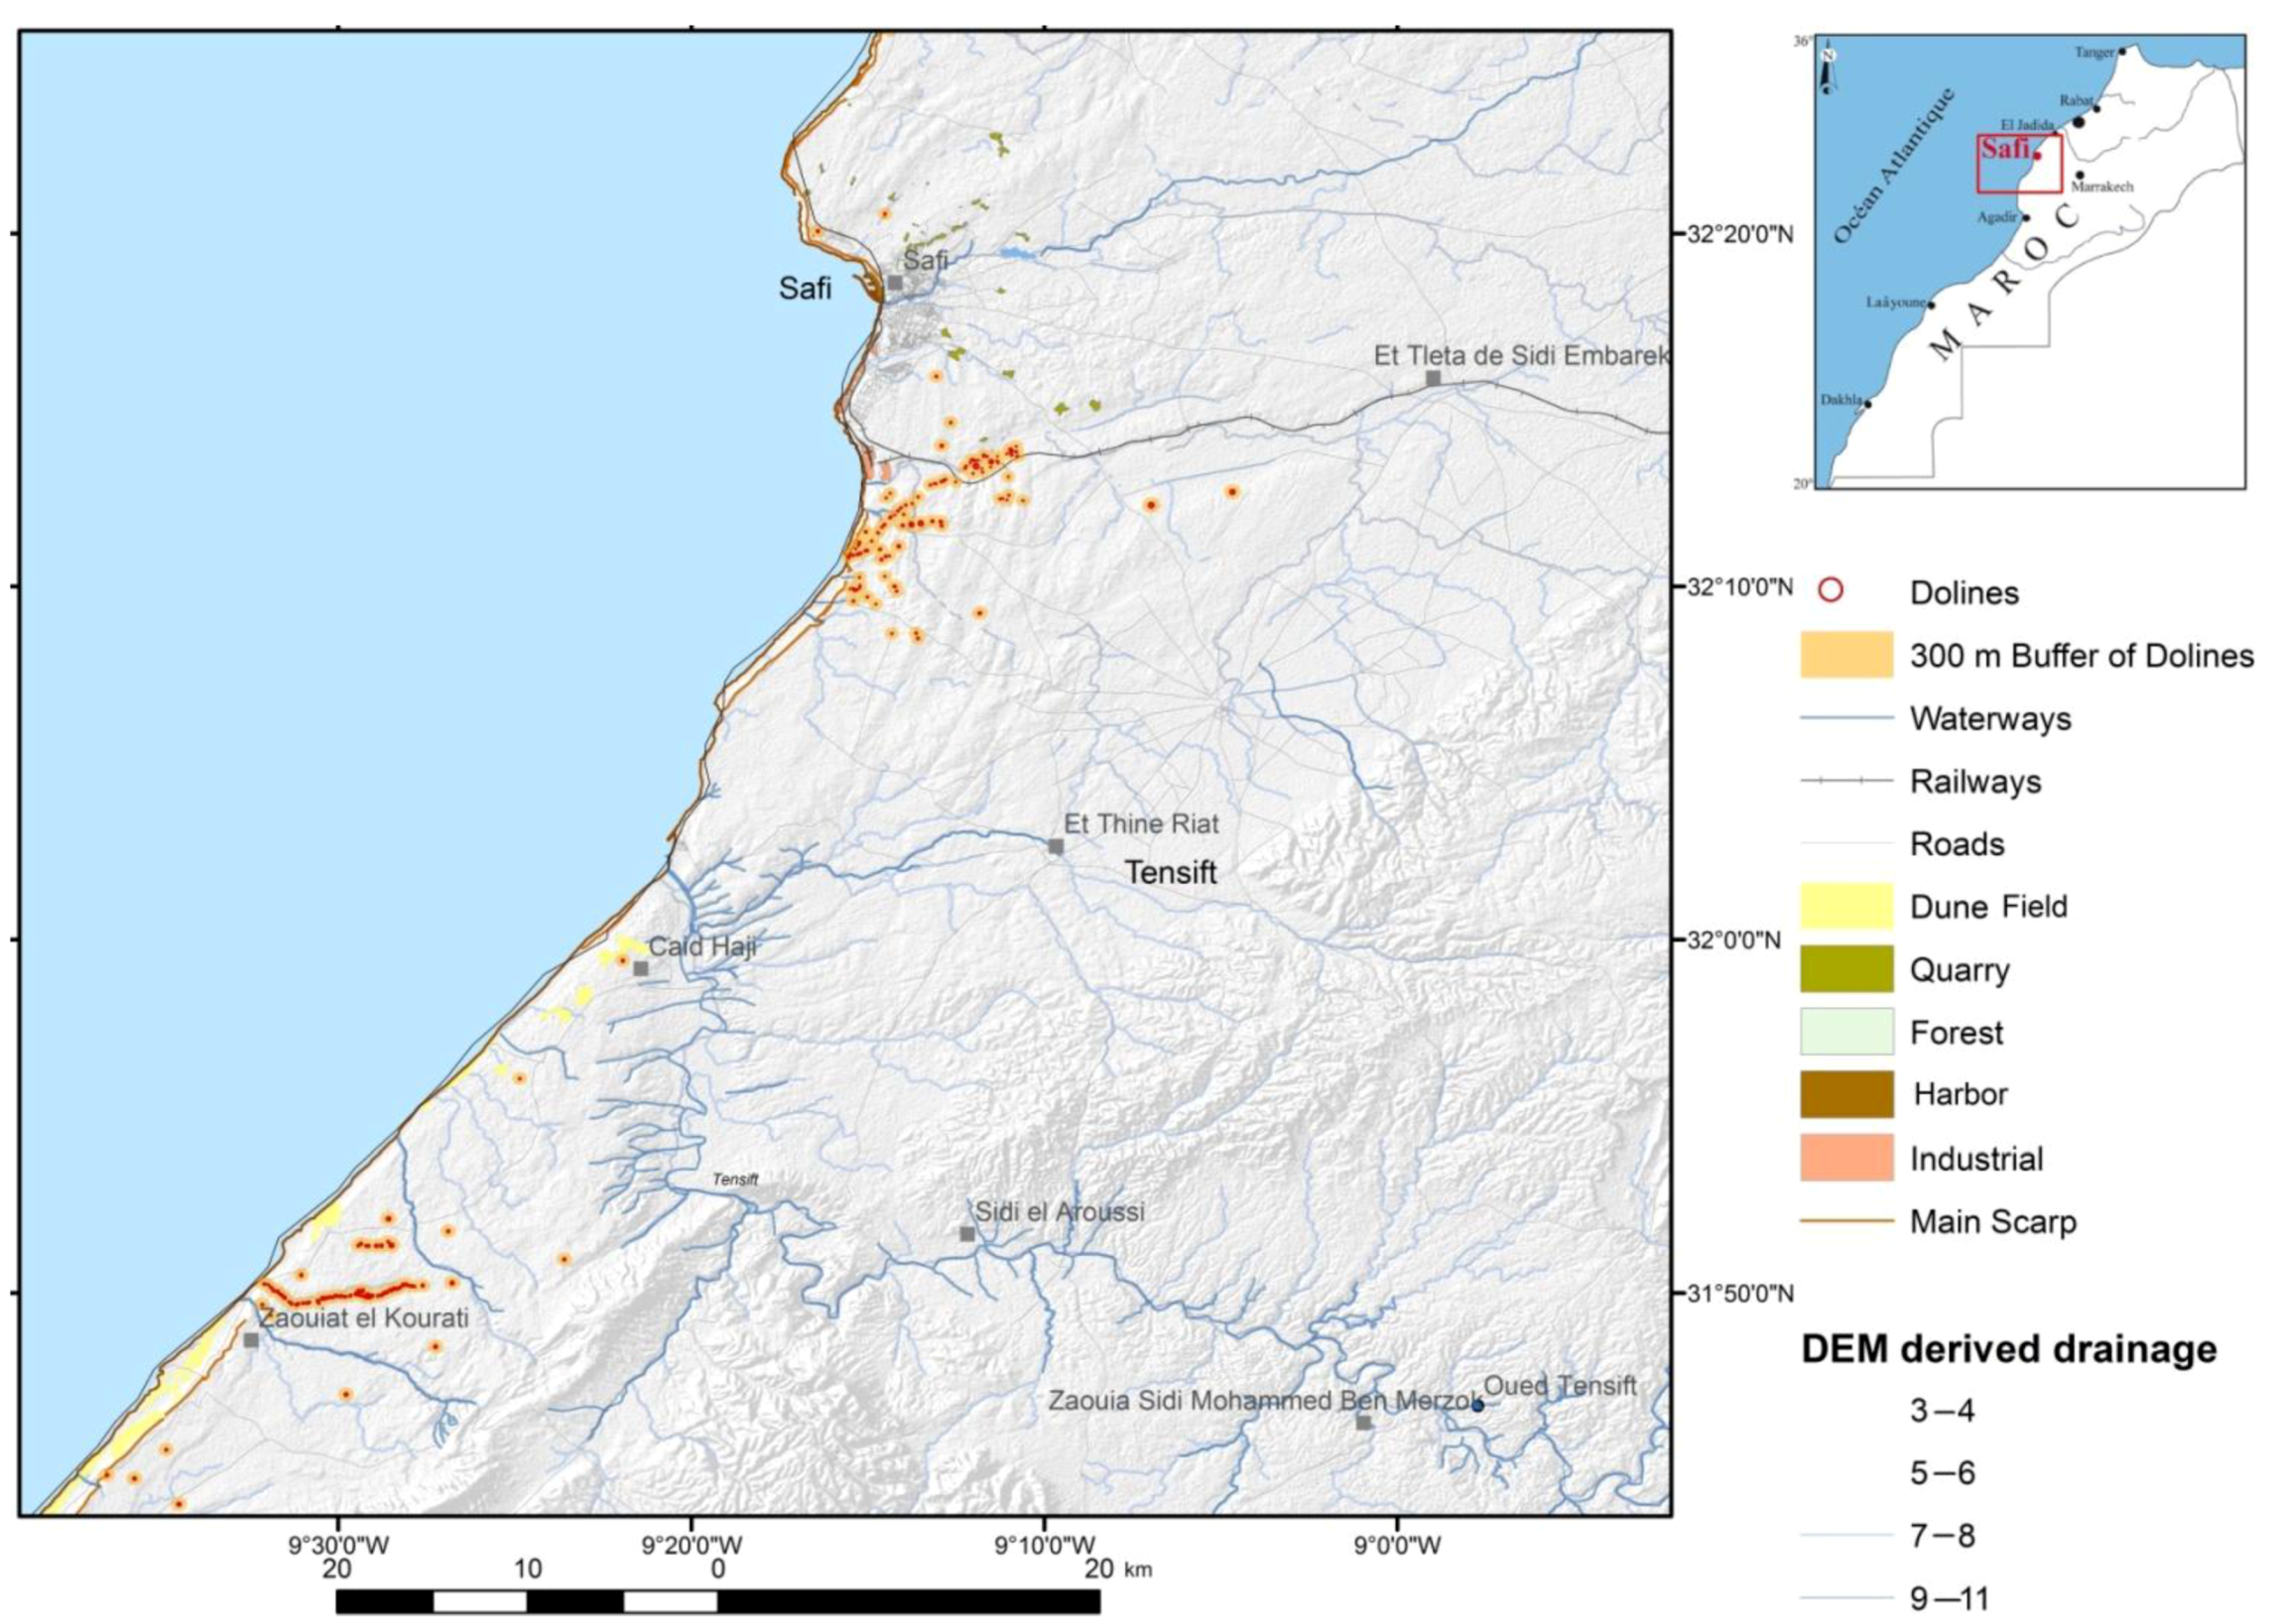
3]. This karst landscape type is well developed in the coastal area near the city of Safi in West Morocco (
Figure 1). Karst topography, limestone pavements, caves, dolines and uvalas are represented. Karstification processes have led to the formation of cavities and an underground drainage system.
Figure 1.
The position of the study area in Northwest Morocco.
Figure 1.
The position of the study area in Northwest Morocco.
However, little research has been carried out so far related to this karst environment, although numerous dolines, rounded depressions, caves and karst aquifers are documented [
4,
5].
The occurrence of karst phenomena and their continual evolution can pose serious problems related to subsurface stability and may require caution in the maintenance and planning of infrastructure, especially in urban areas, such as Safi. Therefore, caution in land use planning is required in urban areas, due to damage to buildings, roads, water supply systems, and in rural areas, through the loss of arable land. Thus, when dealing with the construction and maintenance of infrastructure (pipelines, sewage), areas of high intensity karst development should be carefully monitored. The effects of long-term destabilization processes on subsurface stability, by dissolution processes in limestones and sinkhole formation along pre-existing fracture and fault zones, in combination with hydrologic (high precipitation) and tectonic triggering factors (neotectonic and halotectonic movements), as well as earthquakes, pose important research issues in this area. As a prerequisite for an adapted land use, planning a detailed inventory of karst phenomena is necessary. Another issue is karst rock desertification, a special kind of land degradation process by soil erosion and, thus, bedrock exposition, providing a landscape view of karst land degradation. Karst desertification is one of the ecological and environmental problems. The karst regions around Safi are vulnerable to groundwater pollution, as well, due to the ease of water flow. Therefore, karst is a sensitive environment, which imposes specific management constraints on environmental domains, such as water protection, problems of pollution or site conservation.
The use of modern technologies has allowed new methodological approaches for karst studies. This especially applies to computer-aided investigations, such as remote sensing and geographic information systems (GIS), which improve the generation of geomorphic maps and help monitor and mitigate karst geohazards [
6,
7]. With regard to karst morphological studies, landform mapping based on the merging of different datasets with different resolutions in a GIS environment have proven to provide better results [
8].
3. Geographic and Geologic Overview
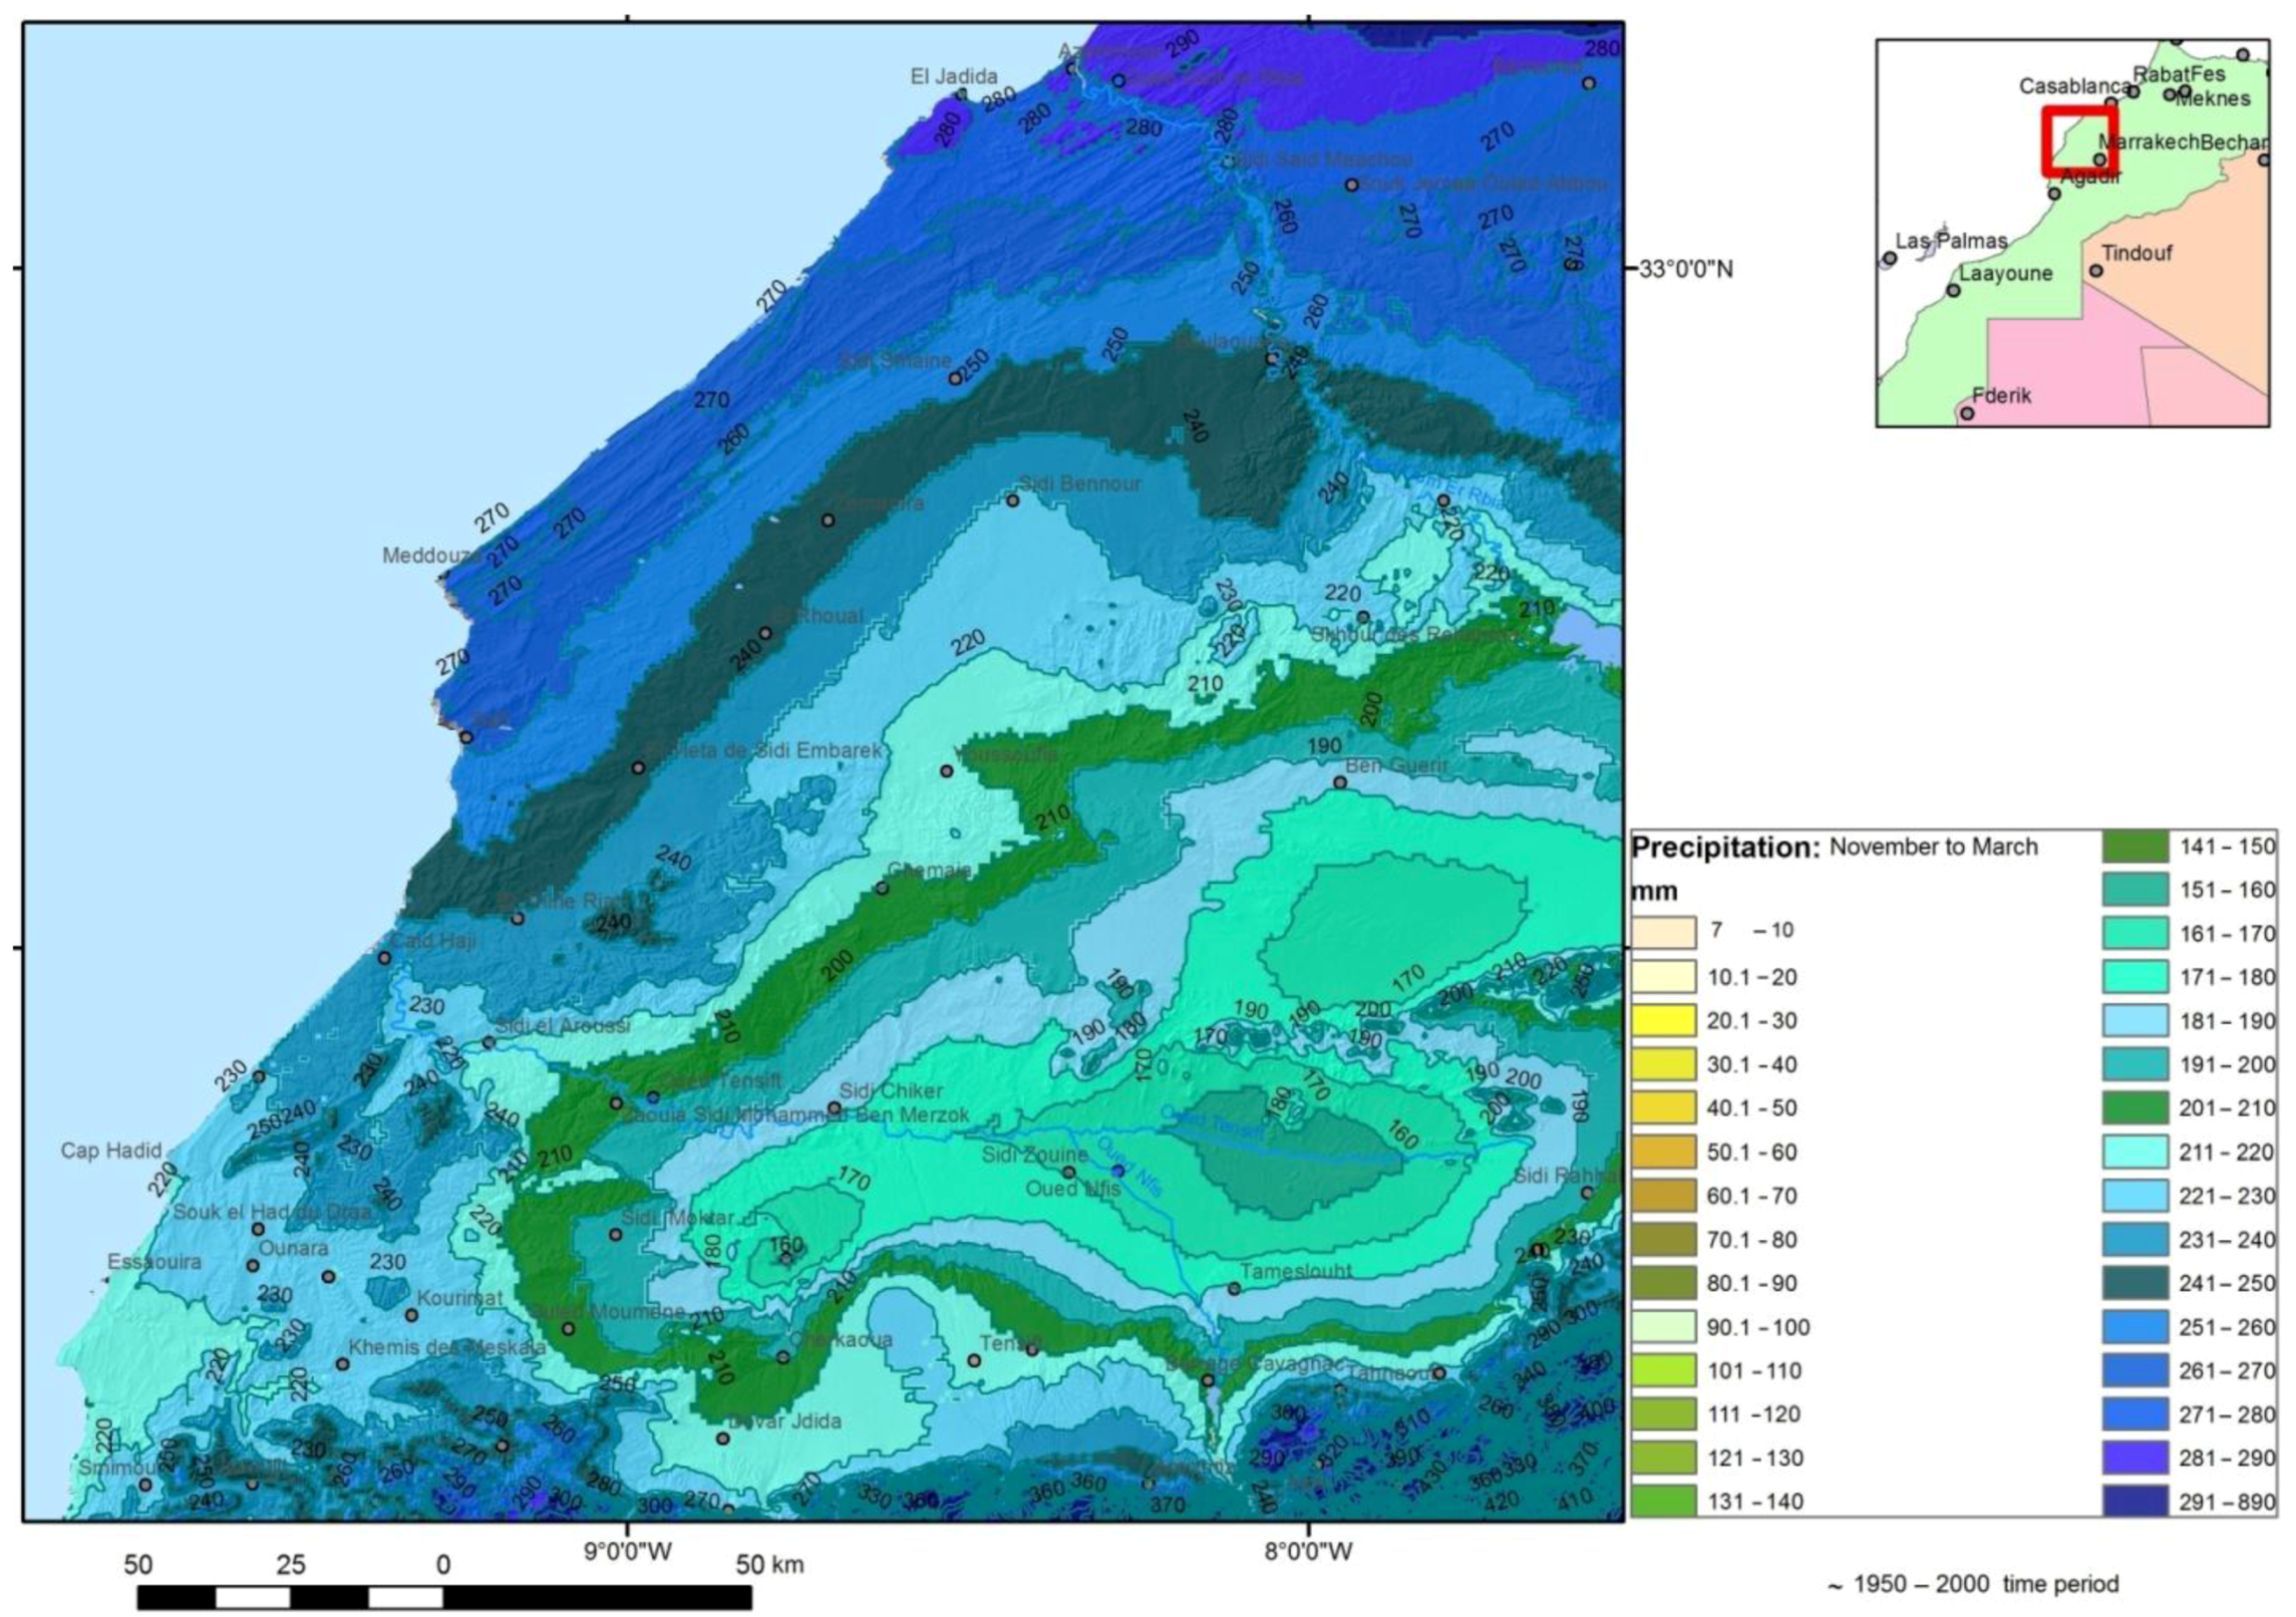
The investigation area is characterized by an arid to semi-arid climate with rainfall concentrated in autumn and winter [
7] (average annual rainfall of about 350 mm [
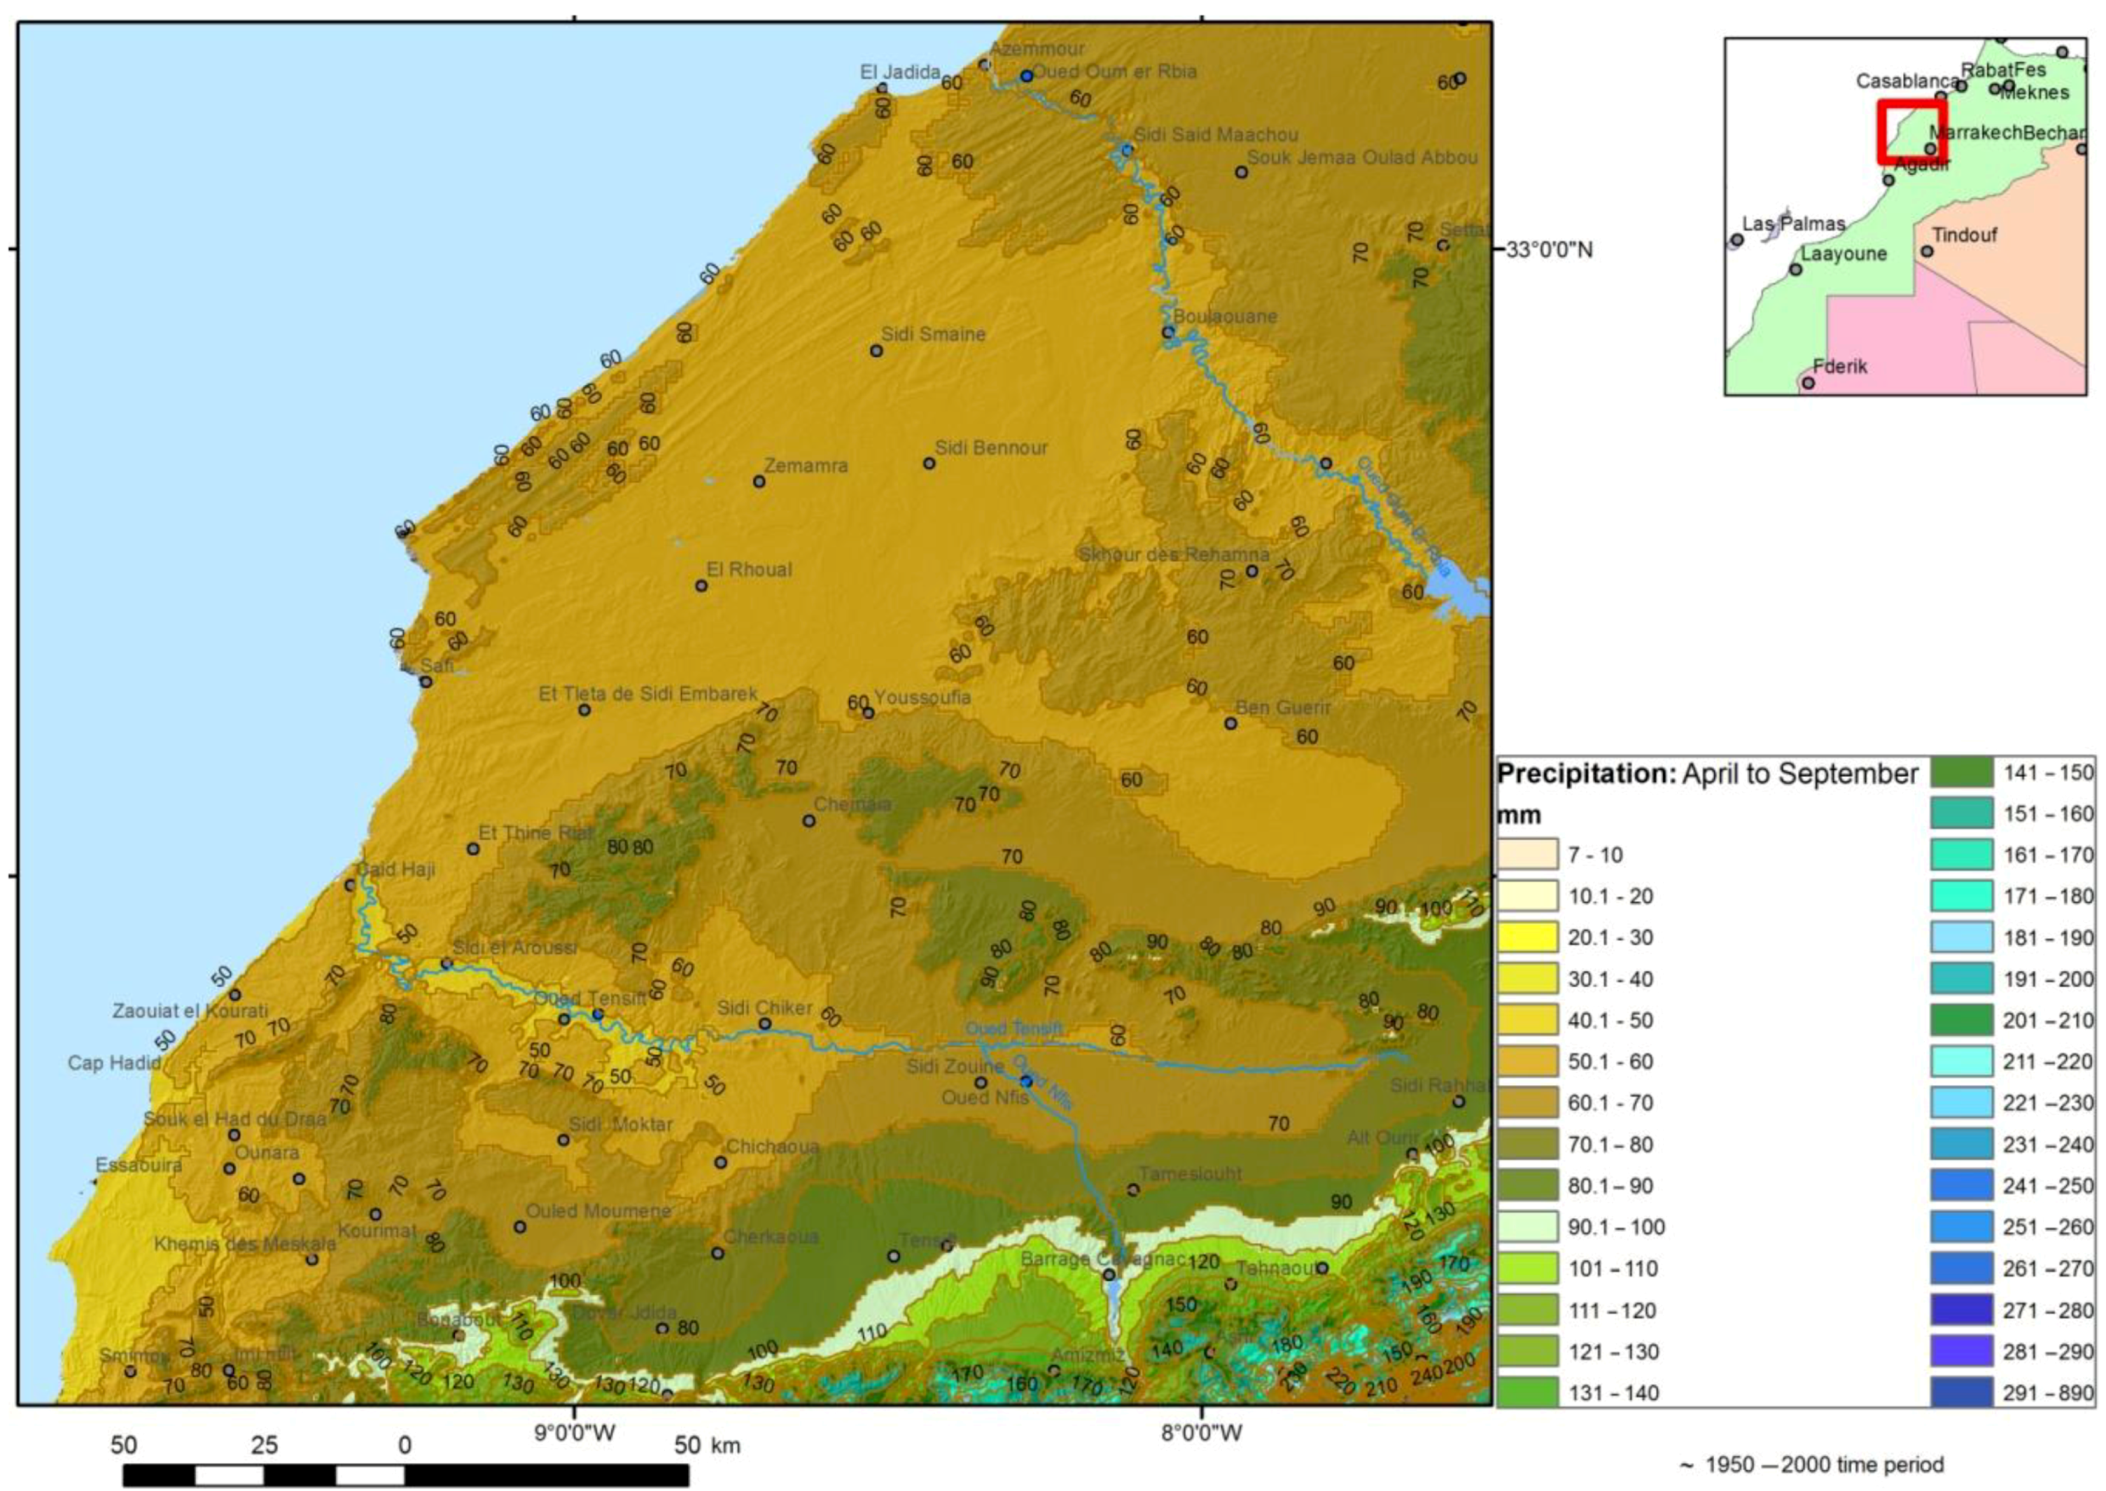
9]). The distribution of rainfall in the year shows two seasons: dry from April to September and more humid from November to March (
Figure 2 and
Figure 3). The mean temperatures during this wetter period according to the WorldClim data (the time period from about 1950–2000) are moderate in coastal areas, ranging from 15 to 18 °C [
8]. The influence of the Atlantic Ocean leads to a “softening” of the temperatures and a relatively higher humidity in coastal areas. The karst drainage pattern in the Safi area is often inactive during summer as a dry-valley network and active during high flow events in the winter season. Only the Tensift wadi discharges permanently into the Atlantic Ocean at Souira Qdima. Surface flow occurs only in the form of winter floods. Oscillating water tables between wet and dry seasons and temporary backing up of water in conduits due to flash floods produce rapid changes in the karstification processes. After extreme precipitation events in this area, groundwater levels in parts of the karst aquifer often rise within hours, and this can lead to rapid groundwater breakthrough, often under pressure, in unexpected locations. Streams run over the surface of karst when and where water flow exceeds that which can infiltrate into the channel bed or into sink points.
The process of dissolution during more humid climate conditions has promoted the formation of small-scaled depressions and hills, resulting in a rugged karst relief, as in the east of Safi [
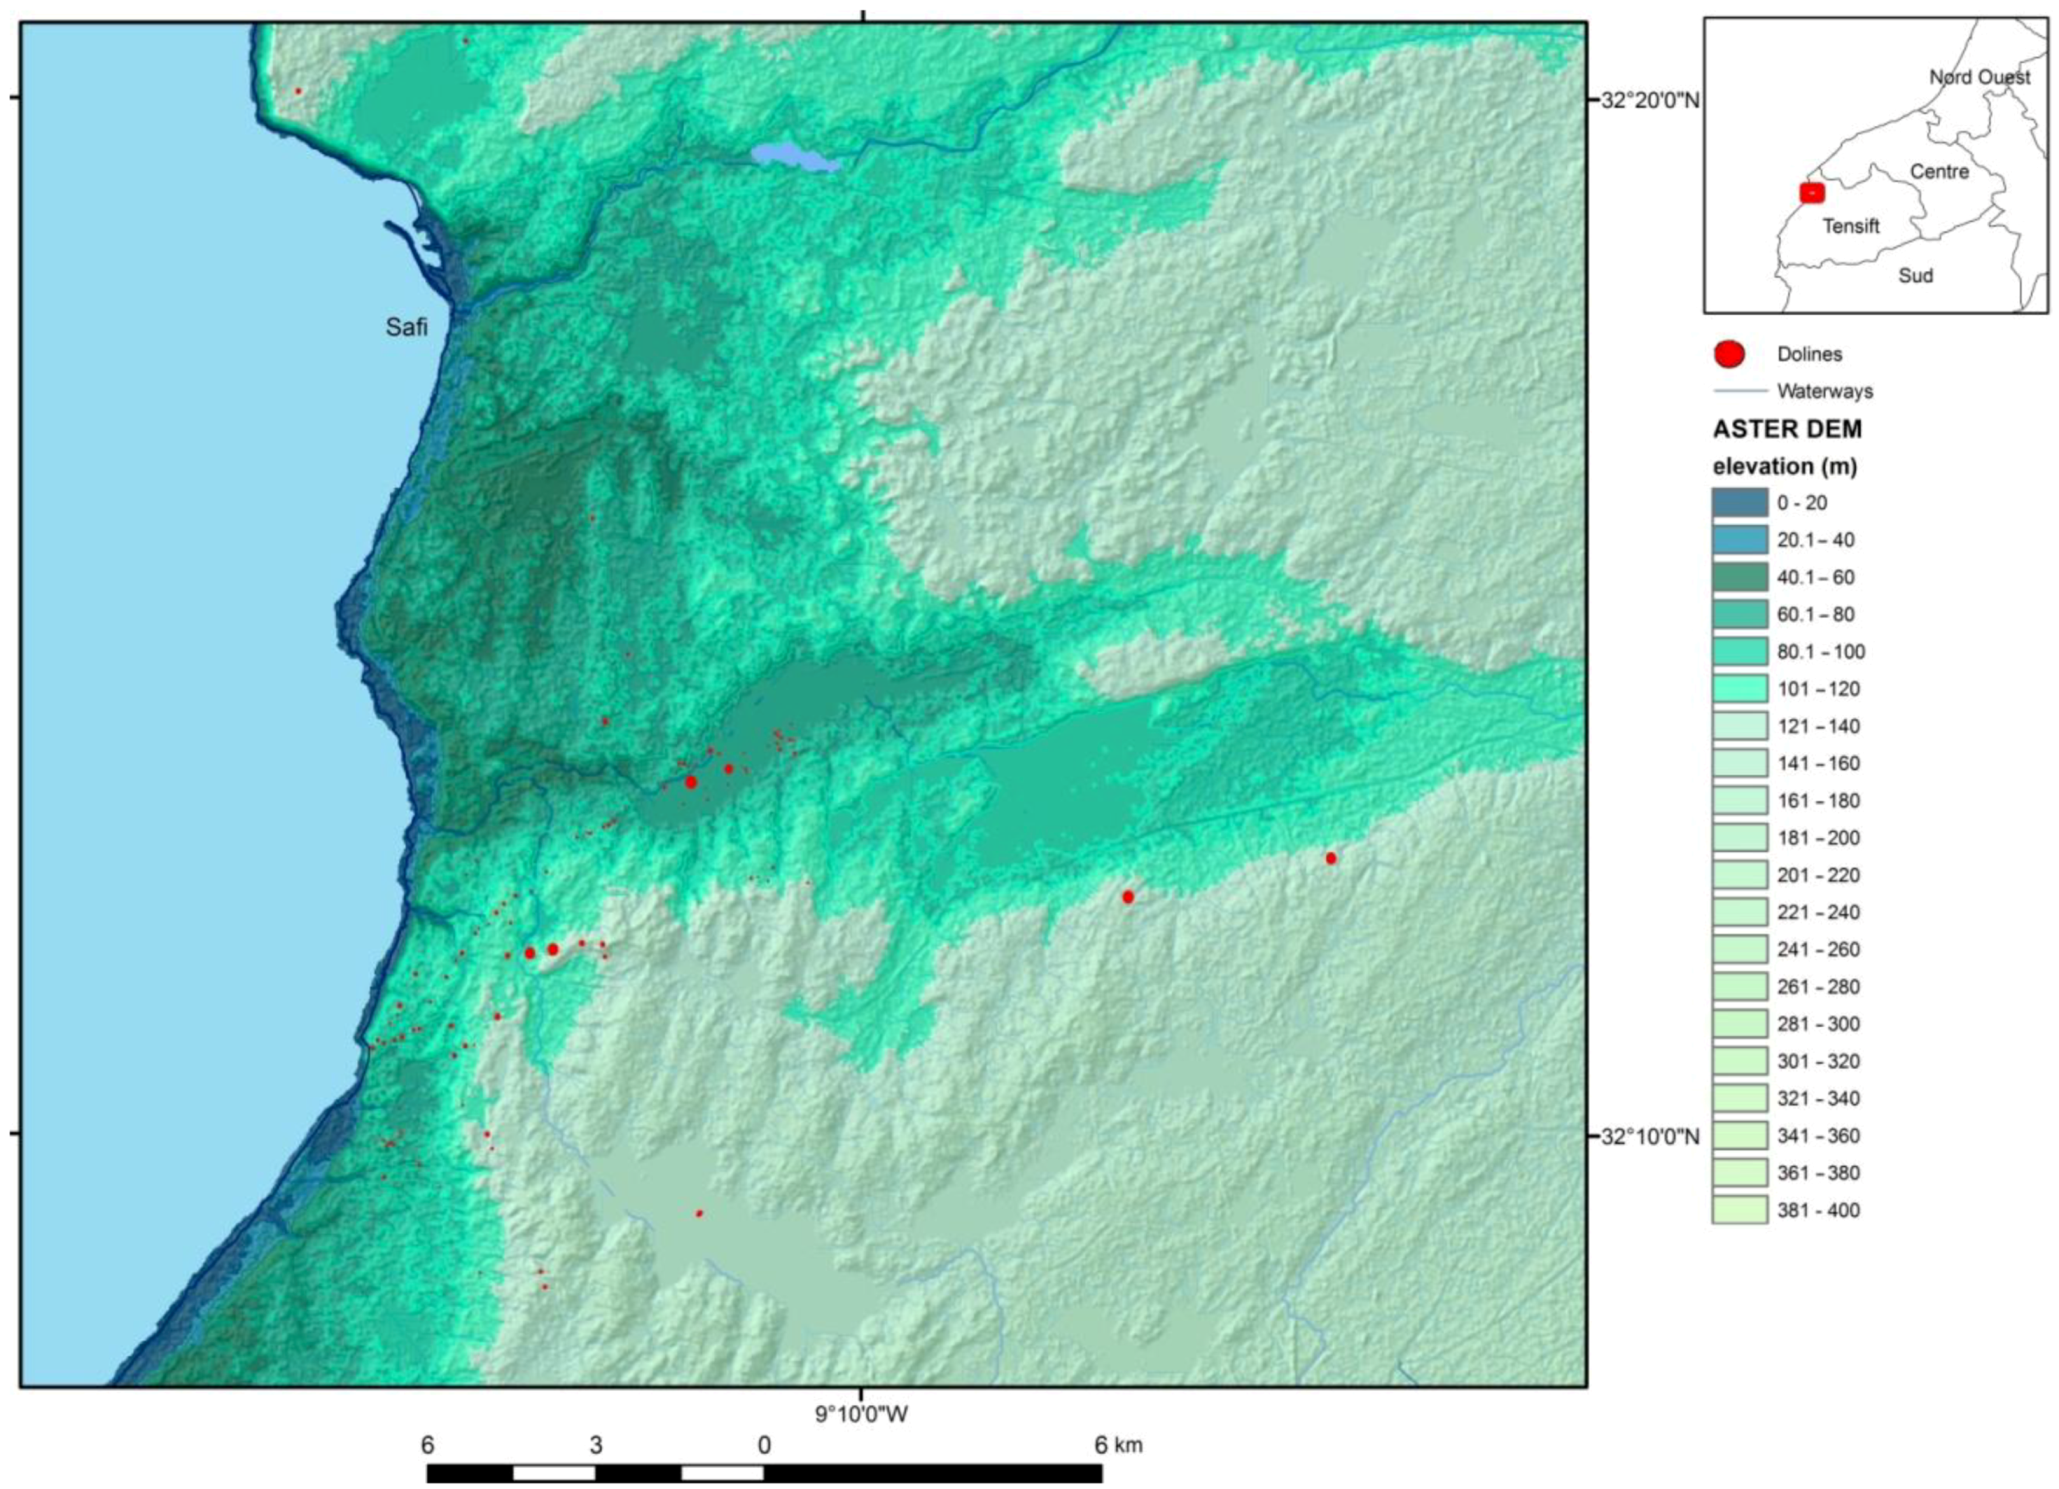
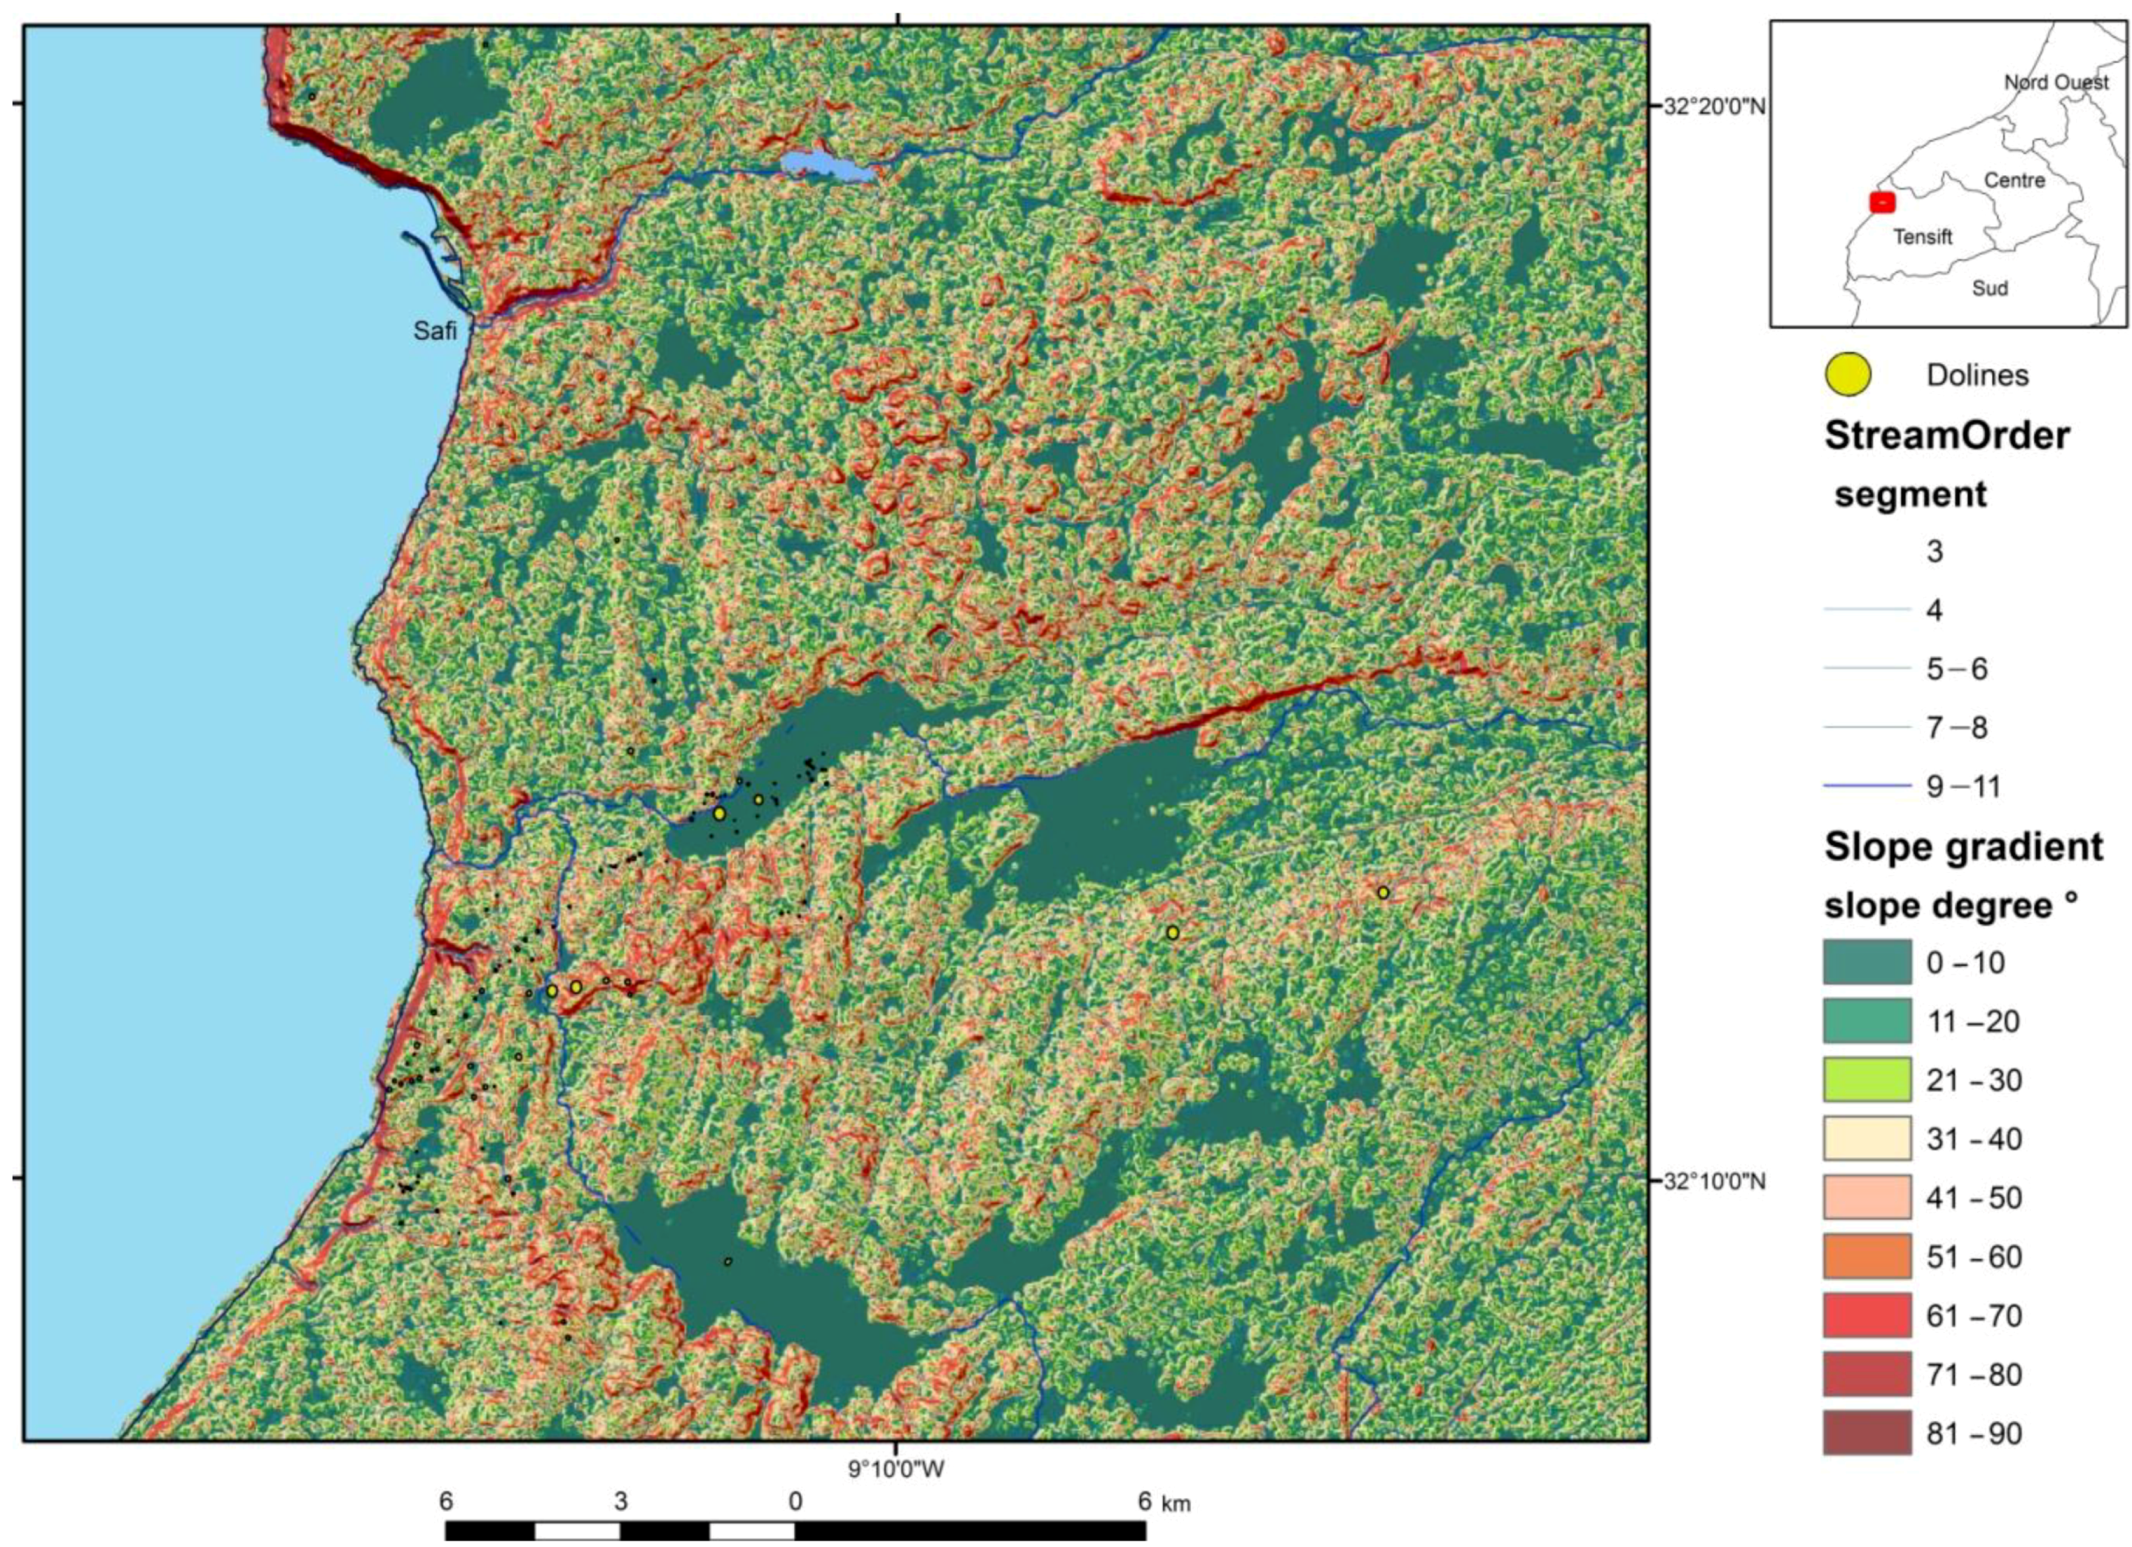
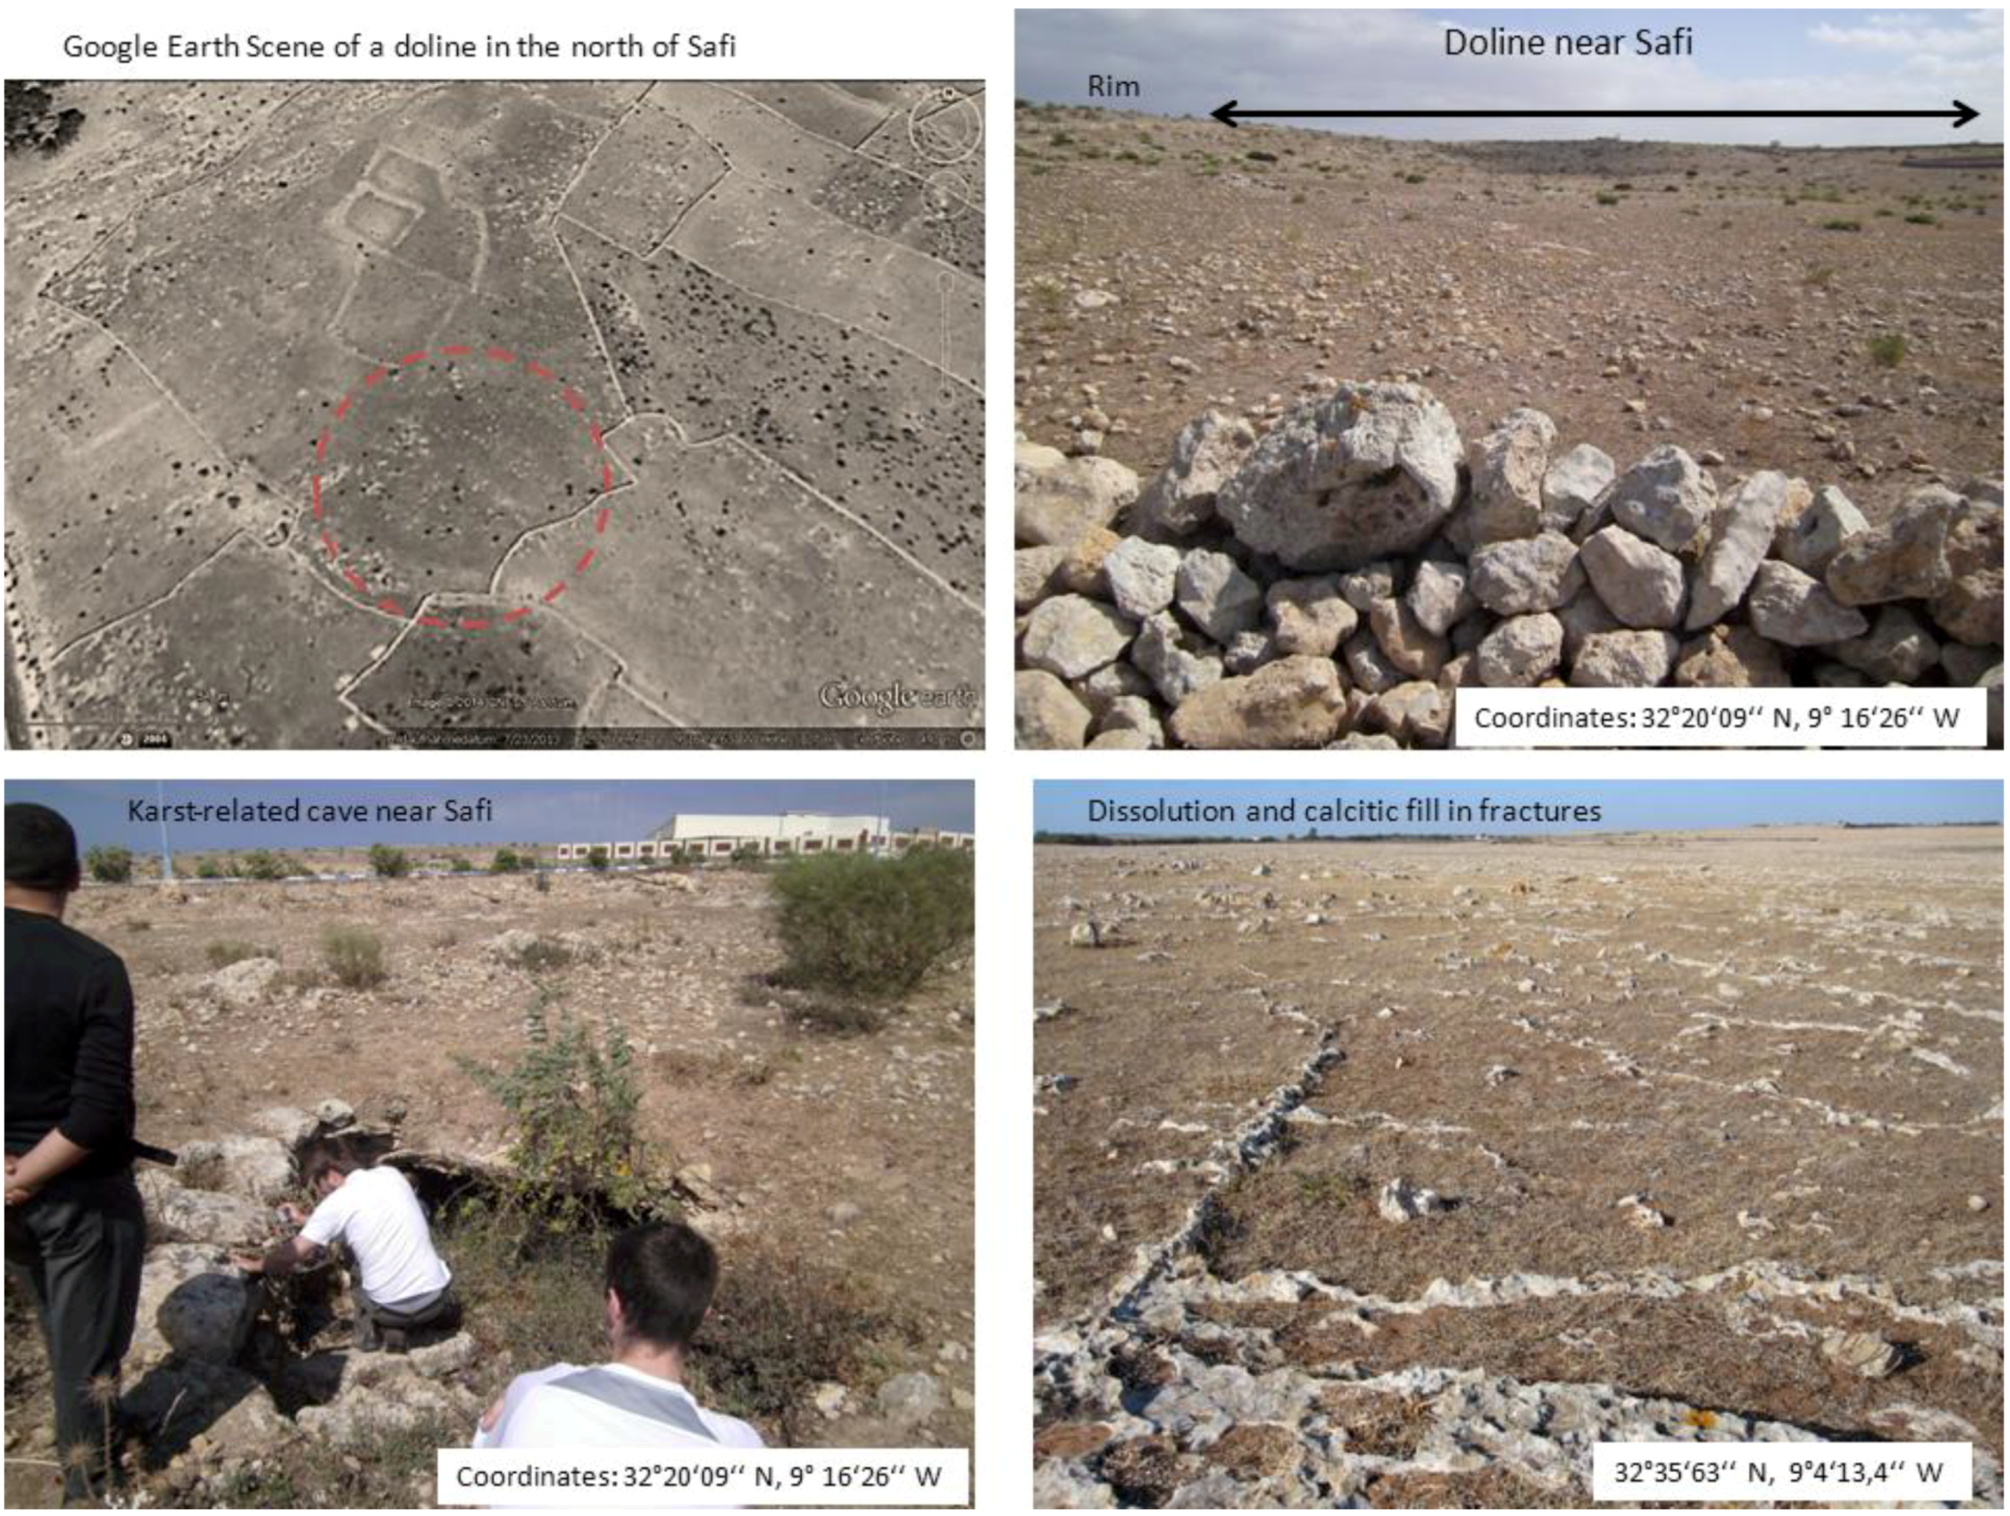
4]. In the south of Safi, karst plains prevail. Almost flat-floored solution sinkholes occur mainly at height levels from 30 up to 130 m and in flat areas with slope degrees <10°; see
Figure 4 and
Figure 5. Their rim sides range from gently sloping to vertical, and their overall form can range from bowl-shaped to sometimes conical or even cylindrical. Their lowest point is often near their center, but can be close to their rim, as well. From the lowest point on their rim, their depths are typically in the range of a few meters to tens of meters (
Figure 6 and
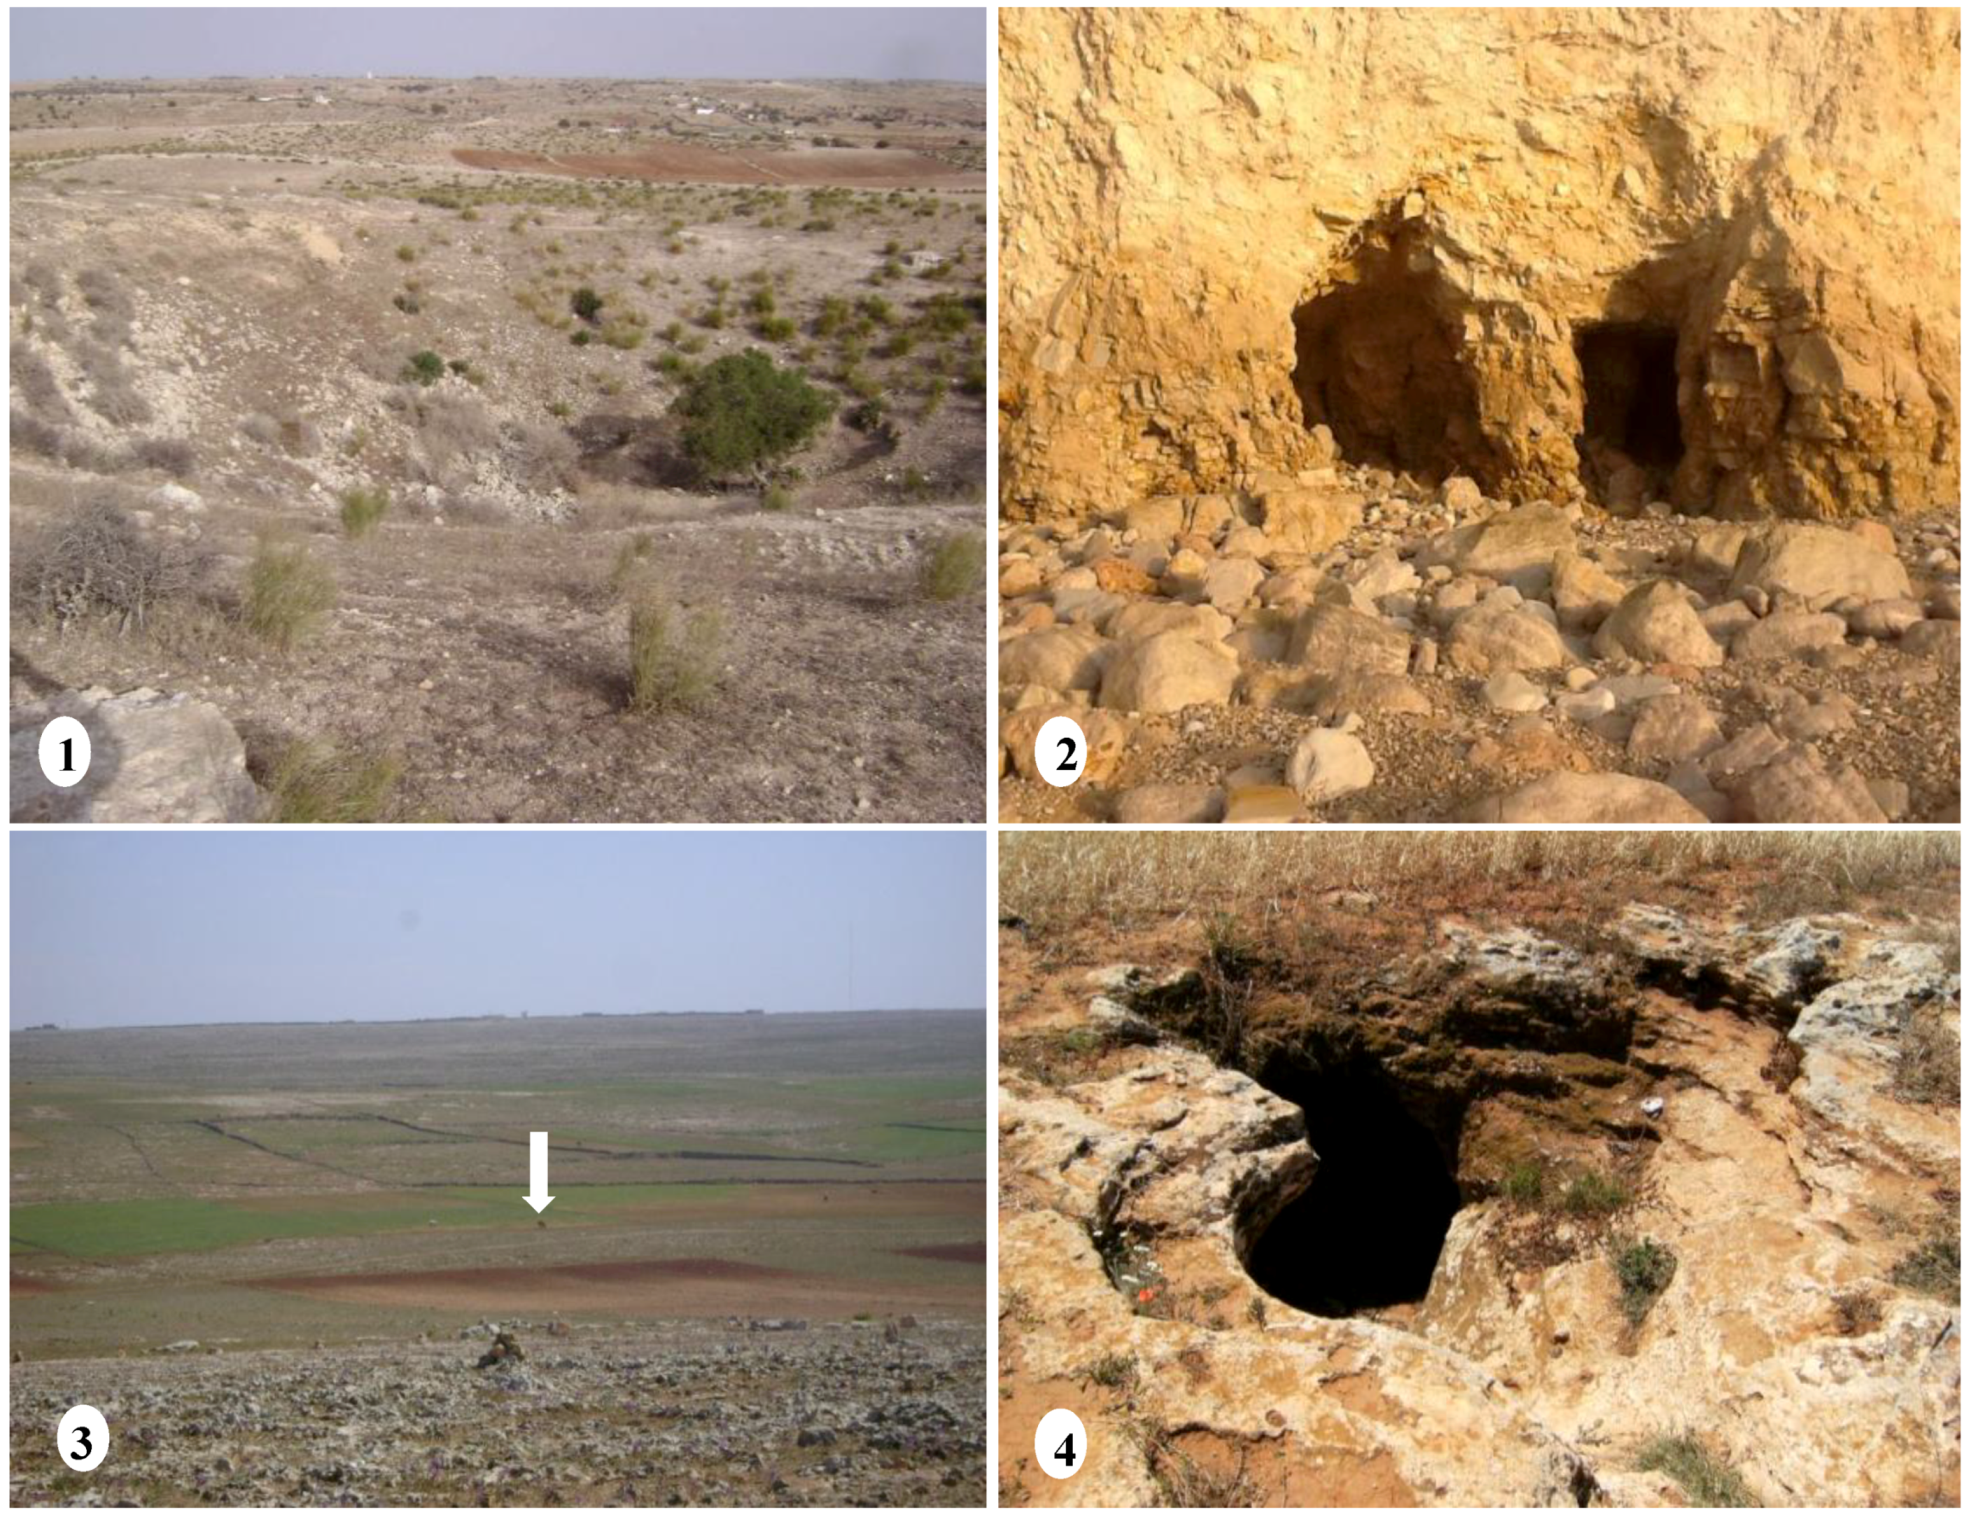
Figure 7). The sinkholes can be almost considered as solution dolines and buried dolines, which often serve as sediment traps for colluvial sediments and aeolian deposits. The majority of the accessible caves are rather small, as shown in
Figure 6 and
Figure 7. During the wet season, some of the sinkholes form circular ponds, whenever high-intensity precipitation events overload the karst system and produce surface flooding.
Since the Mesozoic, Morocco has been located in a triple junction between a continent (Africa), an ocean (the Atlantic) and an active plate collision (the Alpine belt system). Geodetic and seismological data suggest that the strain induced by the Africa-Eurasia oblique convergence concentrates at the northern edge of Africa [
10]. The present-day stresses are characterized by a NW-SE maximum compression.
Figure 2.
Mean precipitation (mm) during the time period from November to March (data: [
11]).
Figure 2.
Mean precipitation (mm) during the time period from November to March (data: [
11]).
Figure 3.
Mean precipitation (mm) during April–September.
Figure 3.
Mean precipitation (mm) during April–September.
Figure 4.
Height level map (elevation above sea level) of the investigation area (dolines: red circles).
Figure 4.
Height level map (elevation above sea level) of the investigation area (dolines: red circles).
Figure 5.
Slope map of the investigation area.
Figure 5.
Slope map of the investigation area.
Figure 6.
A doline of about 50 m in diameter in the north of Safi.
Figure 6.
A doline of about 50 m in diameter in the north of Safi.
Figure 7.
Karst-related caves near Safi (images: Ait Malek, Charif, El Bchari). Karst features in the study area: 1, dolines; 2, a cave in the south of Safi; 3, localization of the cave of Gouraani; 4, a cave of Gouraani north of Safi.
Figure 7.
Karst-related caves near Safi (images: Ait Malek, Charif, El Bchari). Karst features in the study area: 1, dolines; 2, a cave in the south of Safi; 3, localization of the cave of Gouraani; 4, a cave of Gouraani north of Safi.
The almost NW-SE compression can be connected to the compressive deformations, related to Eurasian and African plate convergence. The region of Safi shows anticlinal and synclinal structures oriented mainly in the NE-SW direction. Dolines, uvalas and poljes are found aligned along fault zones with predominantly SW-NE orientations, according to [
4,
5,
12].
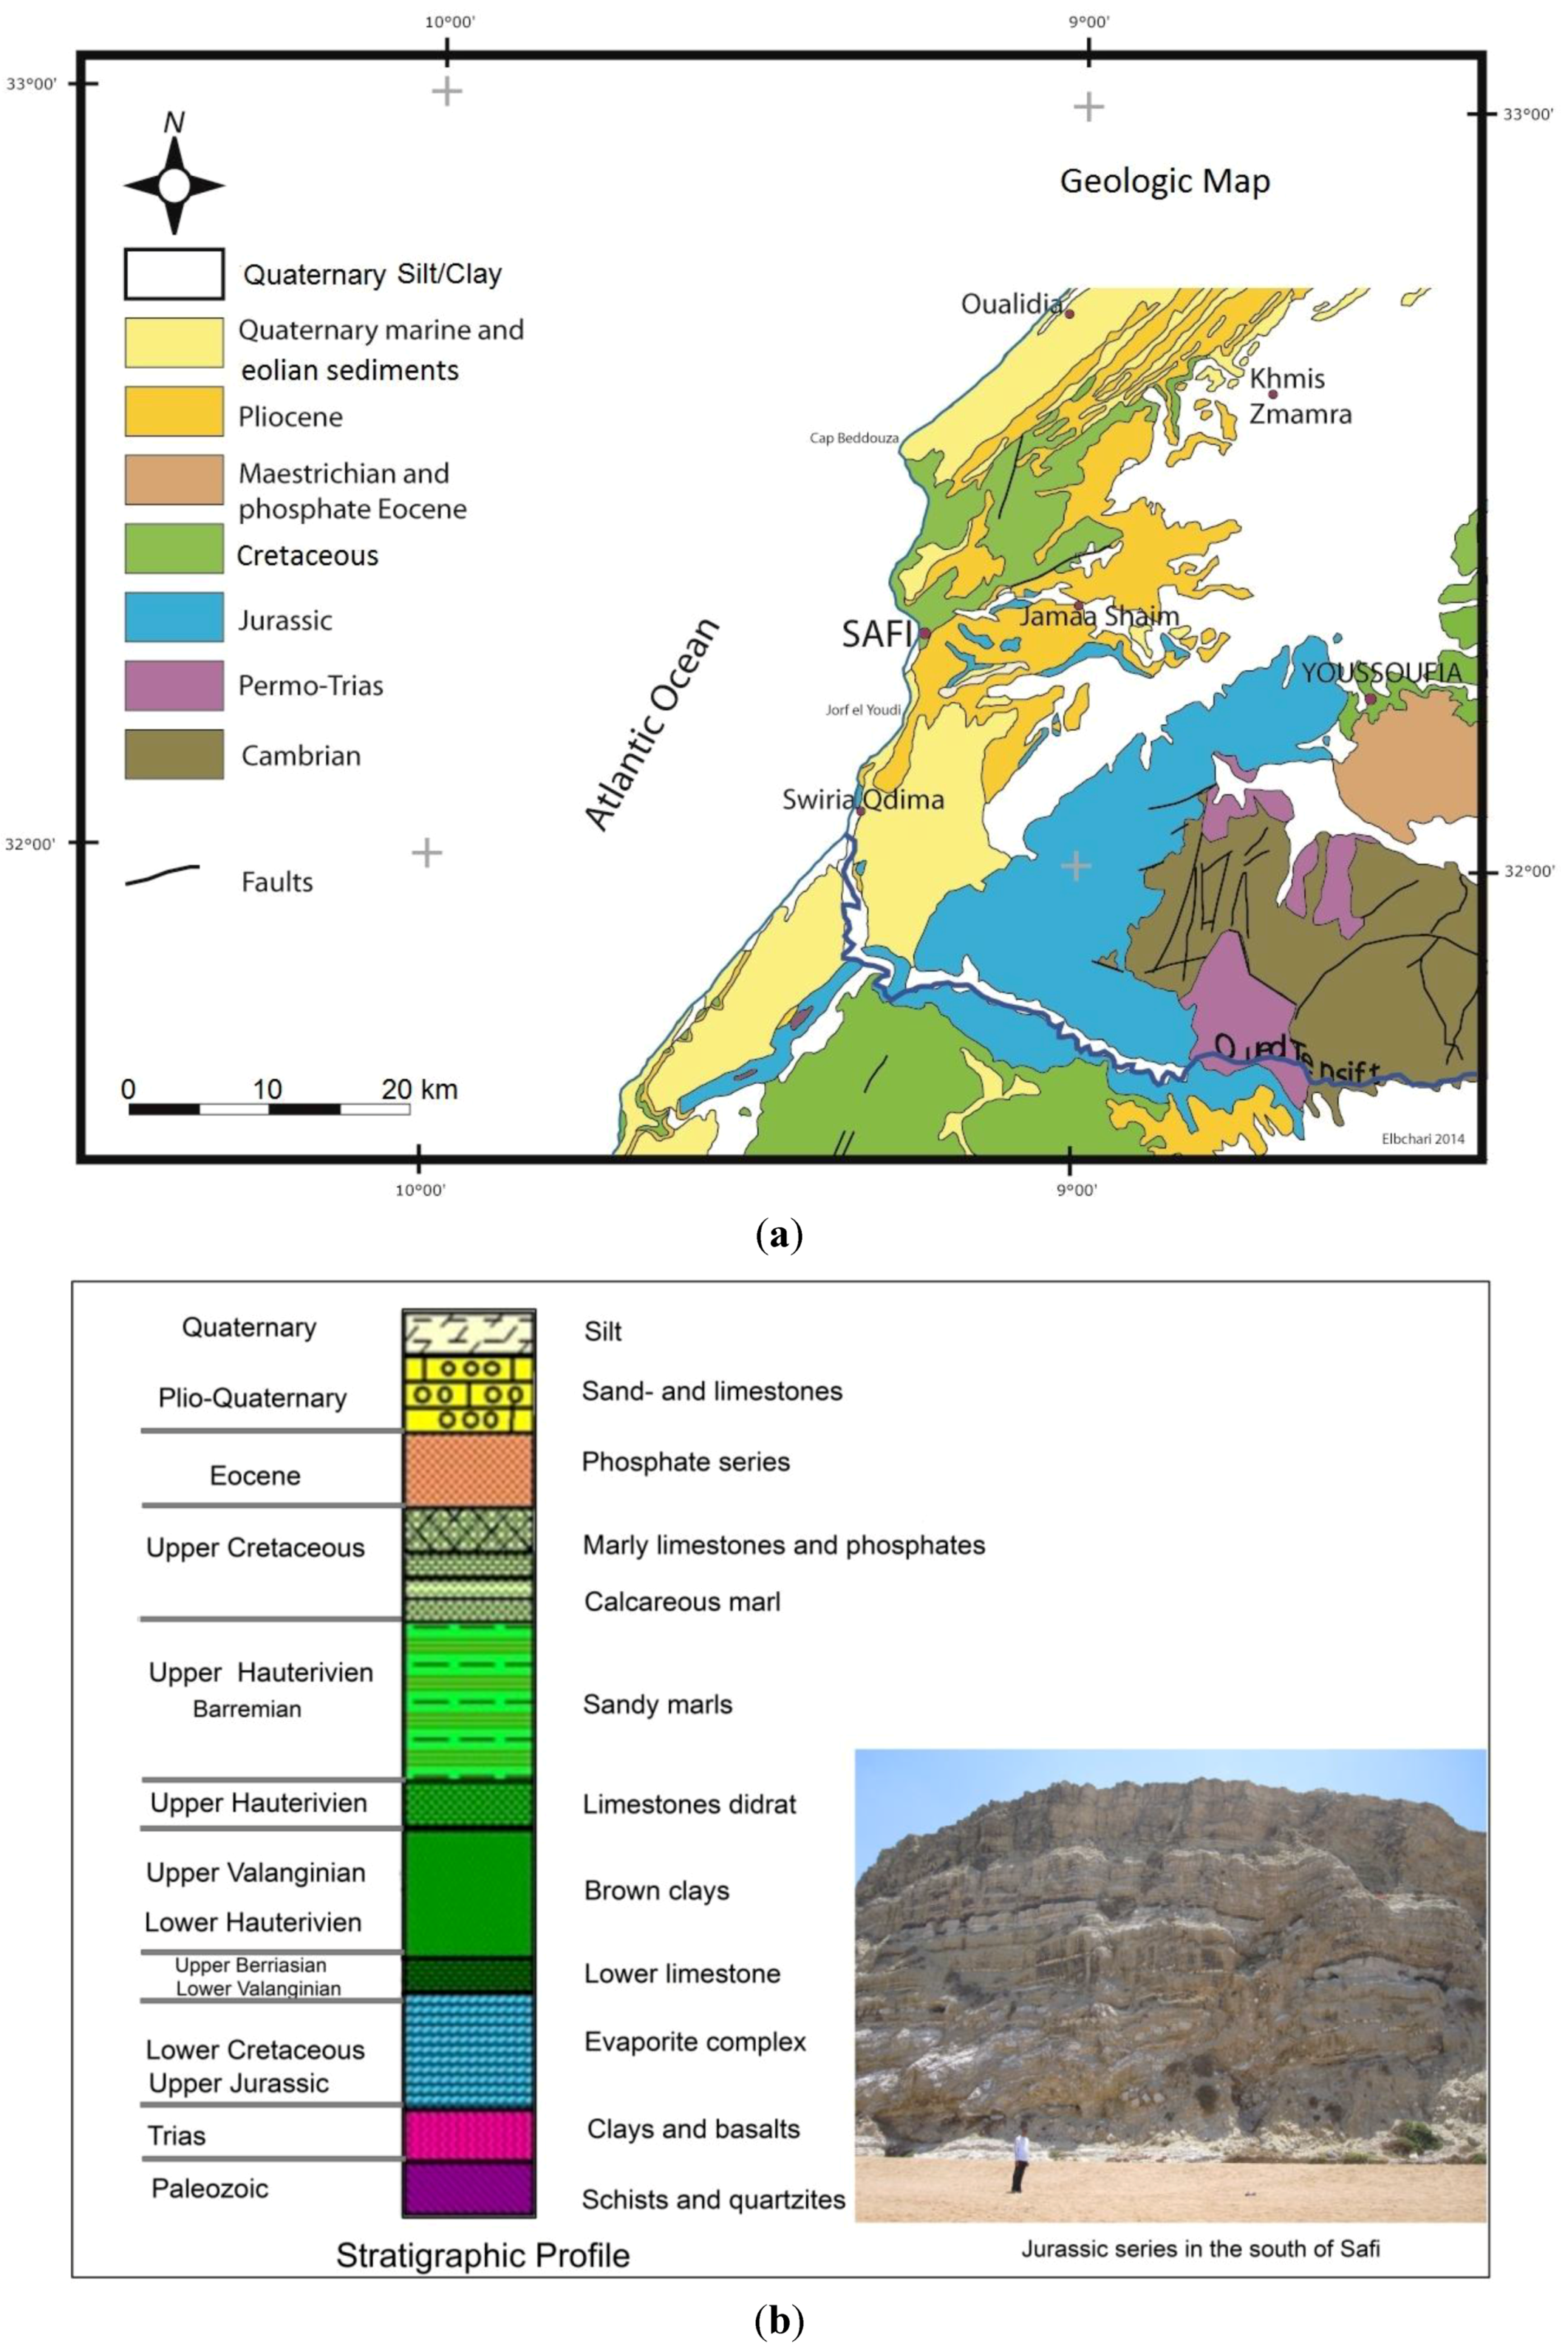
The region is characterized by a wide variety of sedimentary rocks that range in age from Paleozoic to Plio-Quaternary (
Figure 8a,b). The series comprise the outcrops of the following units [
13,
14,
15,
16,
17,
18]:
- (1)
-
A basal unit of white-colored gypsiferous evaporites, overlain by alternating dolomite, marl and gypsum layers, showing a variety of sedimentary features (laminations, tepee structure, breccia and bioturbation). These rocks are overlain by massive and azoic dolomites. The basal unit was deposited during the Late Jurassic in a confined, hot, arid environment.
- (2)
-
The Late Berriasian–Early Valanginian lower limestone formation mainly composed of limestones preserving a rich marine fauna (ammonites).
- (3)
-
The early Late Valanginian brown clay-stone formation, with a few intercalated limestone layers.
- (4)
-
The Late Hauterivian Dridrat limestone formation, rich in marine fossils, showing many features of karstification. The thickness of this layer ranges from 100 to 200 m [
13,
14,
15].
- (5)
-
The yellow sandy clay formation of the Late Hauterivian outcropping in the northern part of the study area.
- (6)
-
The Plio-Quaternary units consisting of calcareous sandstones and biodetritic shelly limestones.
Figure 8.
(a) Geologic overview of the study area and (b) stratigraphic sequence of geological formations in the Safi area.
Figure 8.
(a) Geologic overview of the study area and (b) stratigraphic sequence of geological formations in the Safi area.
Cavities and other karst phenomena occur especially in the Jurassic-Cretaceous series and the Plio-Quaternary biodetritic limestones, resulting from the effects of water on carbonate rocks and, in particular, from the circulation of groundwater. The karst in the Safi area is almost related to bioclastic calcarenites of the Plio-Quaternary age upon Mesozoic limestones, marls and gypsum [
4]. The karst genesis can be subdivided: (1) post-Pliocene karstic landforms and paleokarst in limestones and gypsum; and (2) the recent karstic developments occurring during the periods wetter than nowadays.
4. Methods
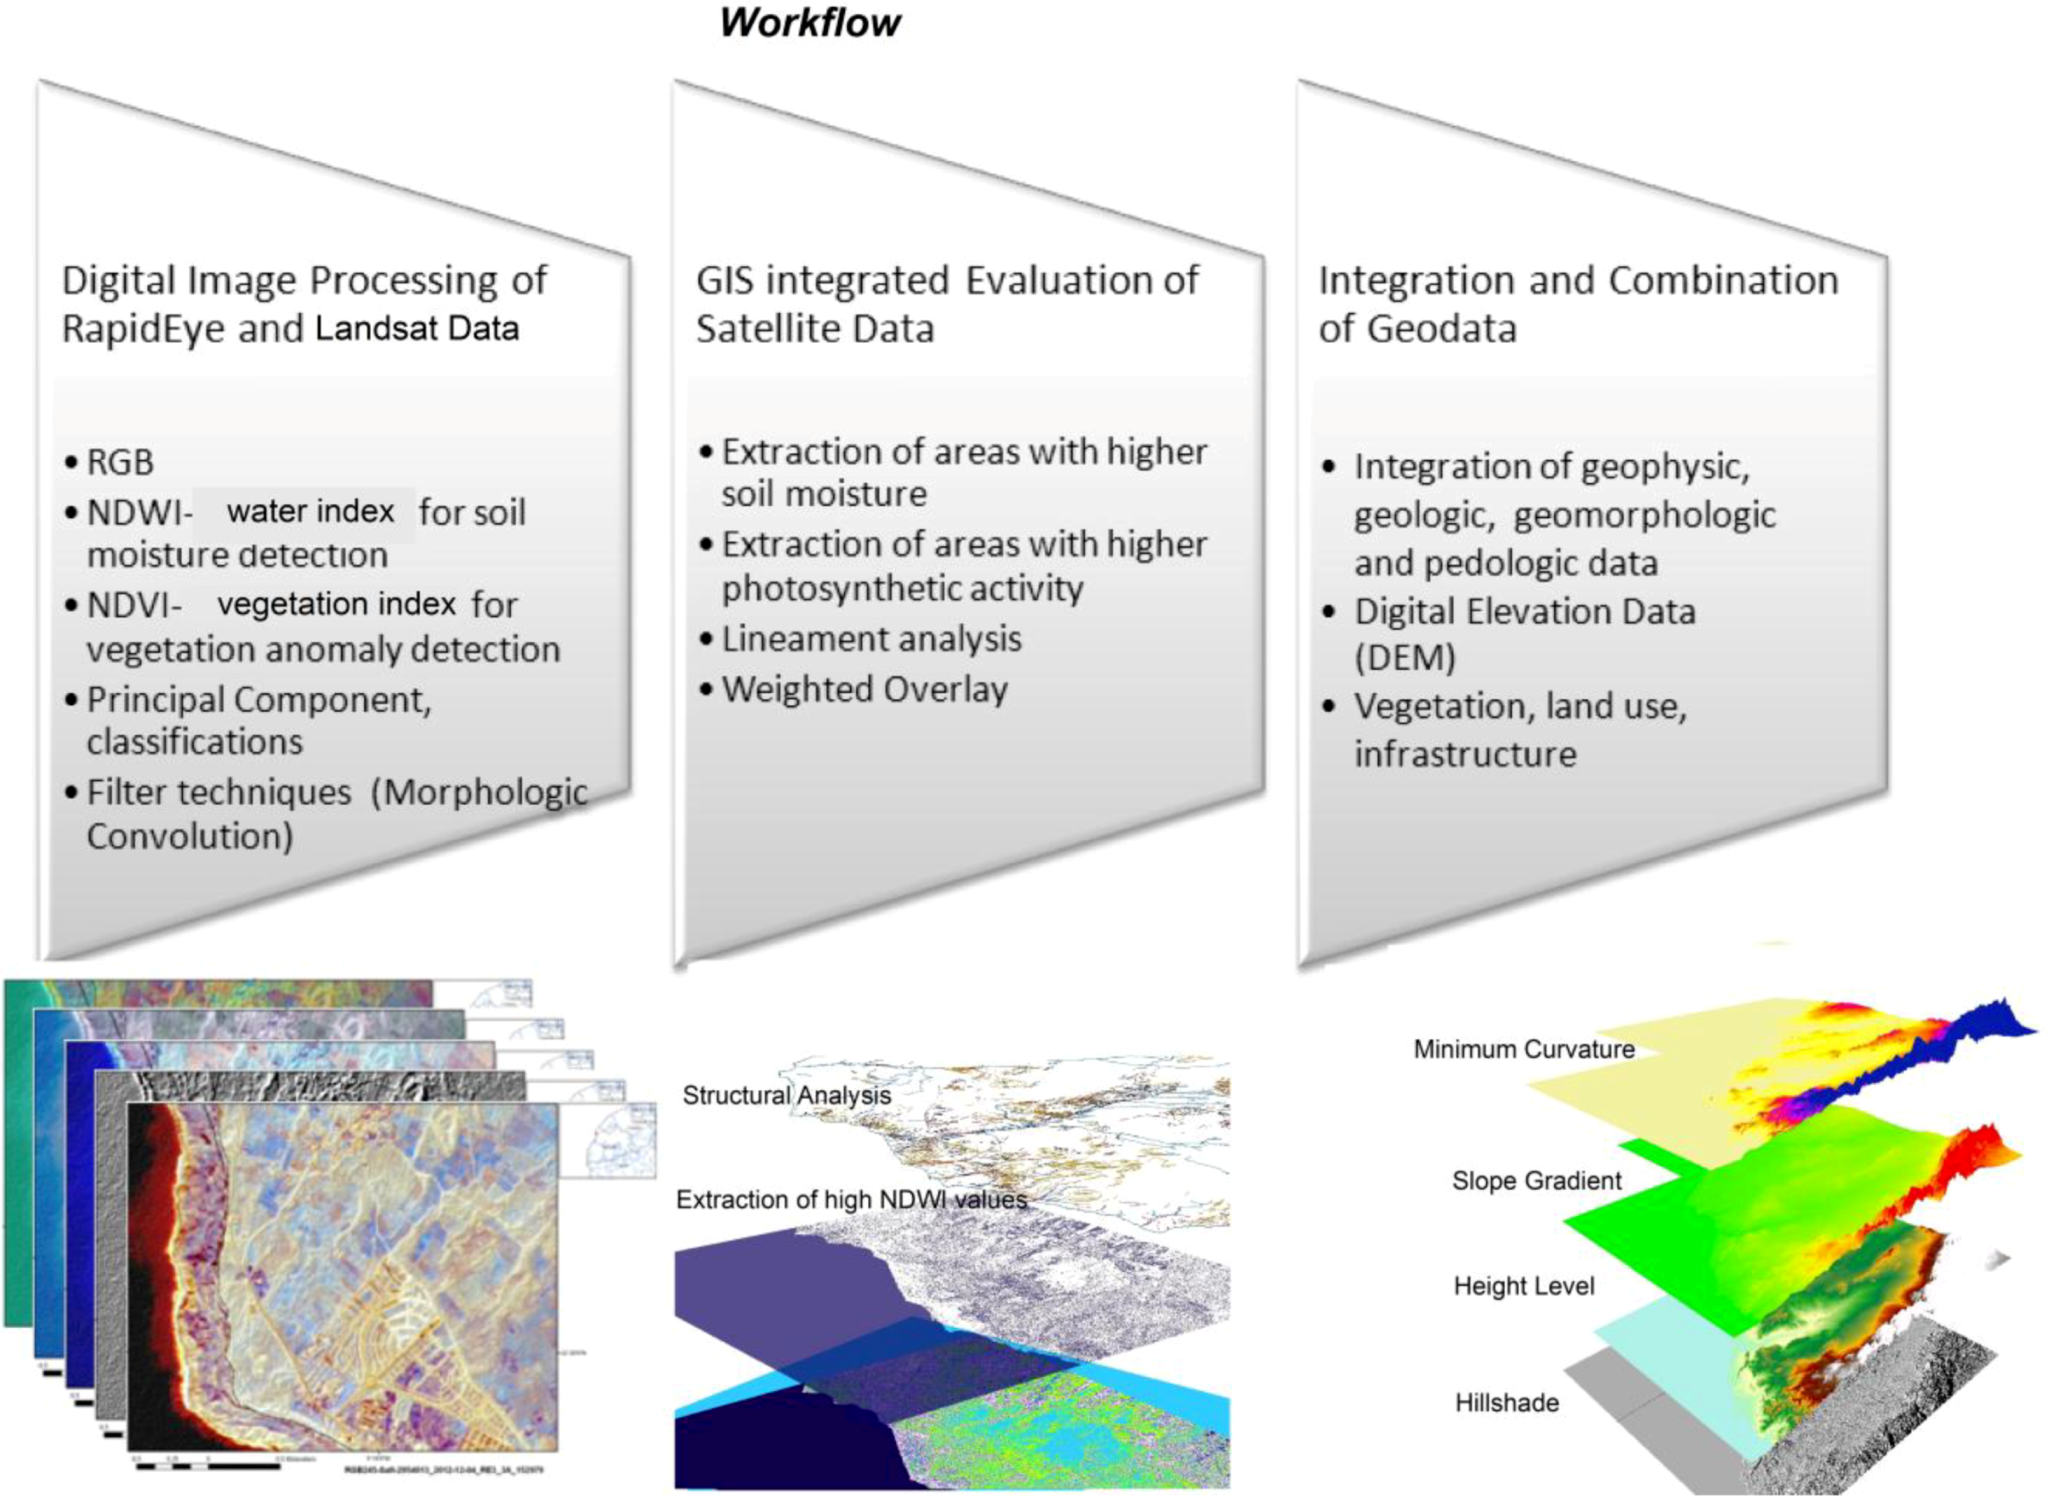
The multi-level approach focuses on the pre-processing and exploration of individual datasets, followed by data integration and investigations in a GIS environment, combining DEMs, satellite imagery and ground-truth. Satellite imagery and DEM data were used for generating an image-based GIS and combined with different geodata and other thematic maps, such as geologic and tectonic maps, and precipitation data (
Figure 9). The approach consists of the following steps:
- (a)
-
Morphometric analysis of the investigation area based on SRTM- and ASTER-DEM data;
- (b)
-
Inventory and mapping of dolines by visual interpretation of aerial photographs and high resolution satellite imagery and mapping of karst features from digitally-processed satellite images;
- (c)
-
Detection of areas with relatively higher surface water input based on the weighted overlay of causal factors influencing the susceptibility to higher surface water input;
- (d)
-
Detection of linear features with possible relation to subsurface structures, such as fault and fracture zones or fold structures.
Figure 9.
Geographic information system (GIS) integrated evaluation of different geodata.
Figure 9.
Geographic information system (GIS) integrated evaluation of different geodata.
4.1. Evaluations of Digital Elevation Model Data (DEM)
As the morphometric analysis of digital elevation data helped to visualize the small-scaled variations at the surface, characterized by subtle changes of depressions and elevations, from SRTM and the ASTER digital elevation model (DEM), data-derived morphometric maps (slope gradient maps, height level, drainage, etc.) were integrated into a GIS database. Based on the available DEMs, the theoretical drainage network was calculated (stream order calculation in ArcGIS). The majority of the dolines are less than 100 m in size. They are smaller than the 90-m spatial resolution of SRTM DEM data and, therefore, not visible on SRTM-derived morphometric maps. This was the reason to use ASTER DEM data for this study.
The development of karst phenomena depends on the ability of water to sink into and flow through karst rocks. The amount of limestone affected by dissolution during the karstification processes mainly depends on the amount and the concentration of the solute [
1,
2,
3]. As rainwater infiltrates, the water absorbs carbon dioxide and becomes increasingly acidic. Whenever the acidic water percolates through the fractures and fissures, these openings become enlarged through dissolution, and water transport increases. Thus, it can be assumed that in the areas with higher surface water input, surface run-off and infiltration, the karstification processes are more intense. Therefore, the investigations are focused on the detection of areas with higher surface water input after precipitation.
When searching for areas relatively more susceptible to karst processes, due to higher surface water input, so-called causal or preparatory factors might have an influence have to be taken into account. The causal factors determine the initial favorable conditions, while the triggering factors, such as high precipitation rates, determine the timing. Causal factors are the slope gradient, curvature, lithology or the groundwater table level [
4]. Some of the morphometric, causal factors influencing the susceptibility to higher surface water input can be determined systematically (
Figure 10):
- -
-
From height level maps are extracted the local lowest areas;
- -
-
From slope gradient maps are requested those areas with the lowest slope degrees (<10°); and
- -
-
From curvature maps, the flat areas with curvature values = 0 (calculated in ArcMap, Spatial Analyst), as these are more susceptible to higher surface water input;
- -
-
From the drop raster are extracted the relatively lower values < 100,000. (The drop raster is calculated as the difference in the
z-value divided by the path length between the cell centers, expressed as a percentage. For adjacent cells, this is analogous to the percent slope between cells. Across a flat area, the distance becomes the distance to the nearest cell of lower elevation. The result is a map of percent rise in the path of steepest descent from each cell [
19]).
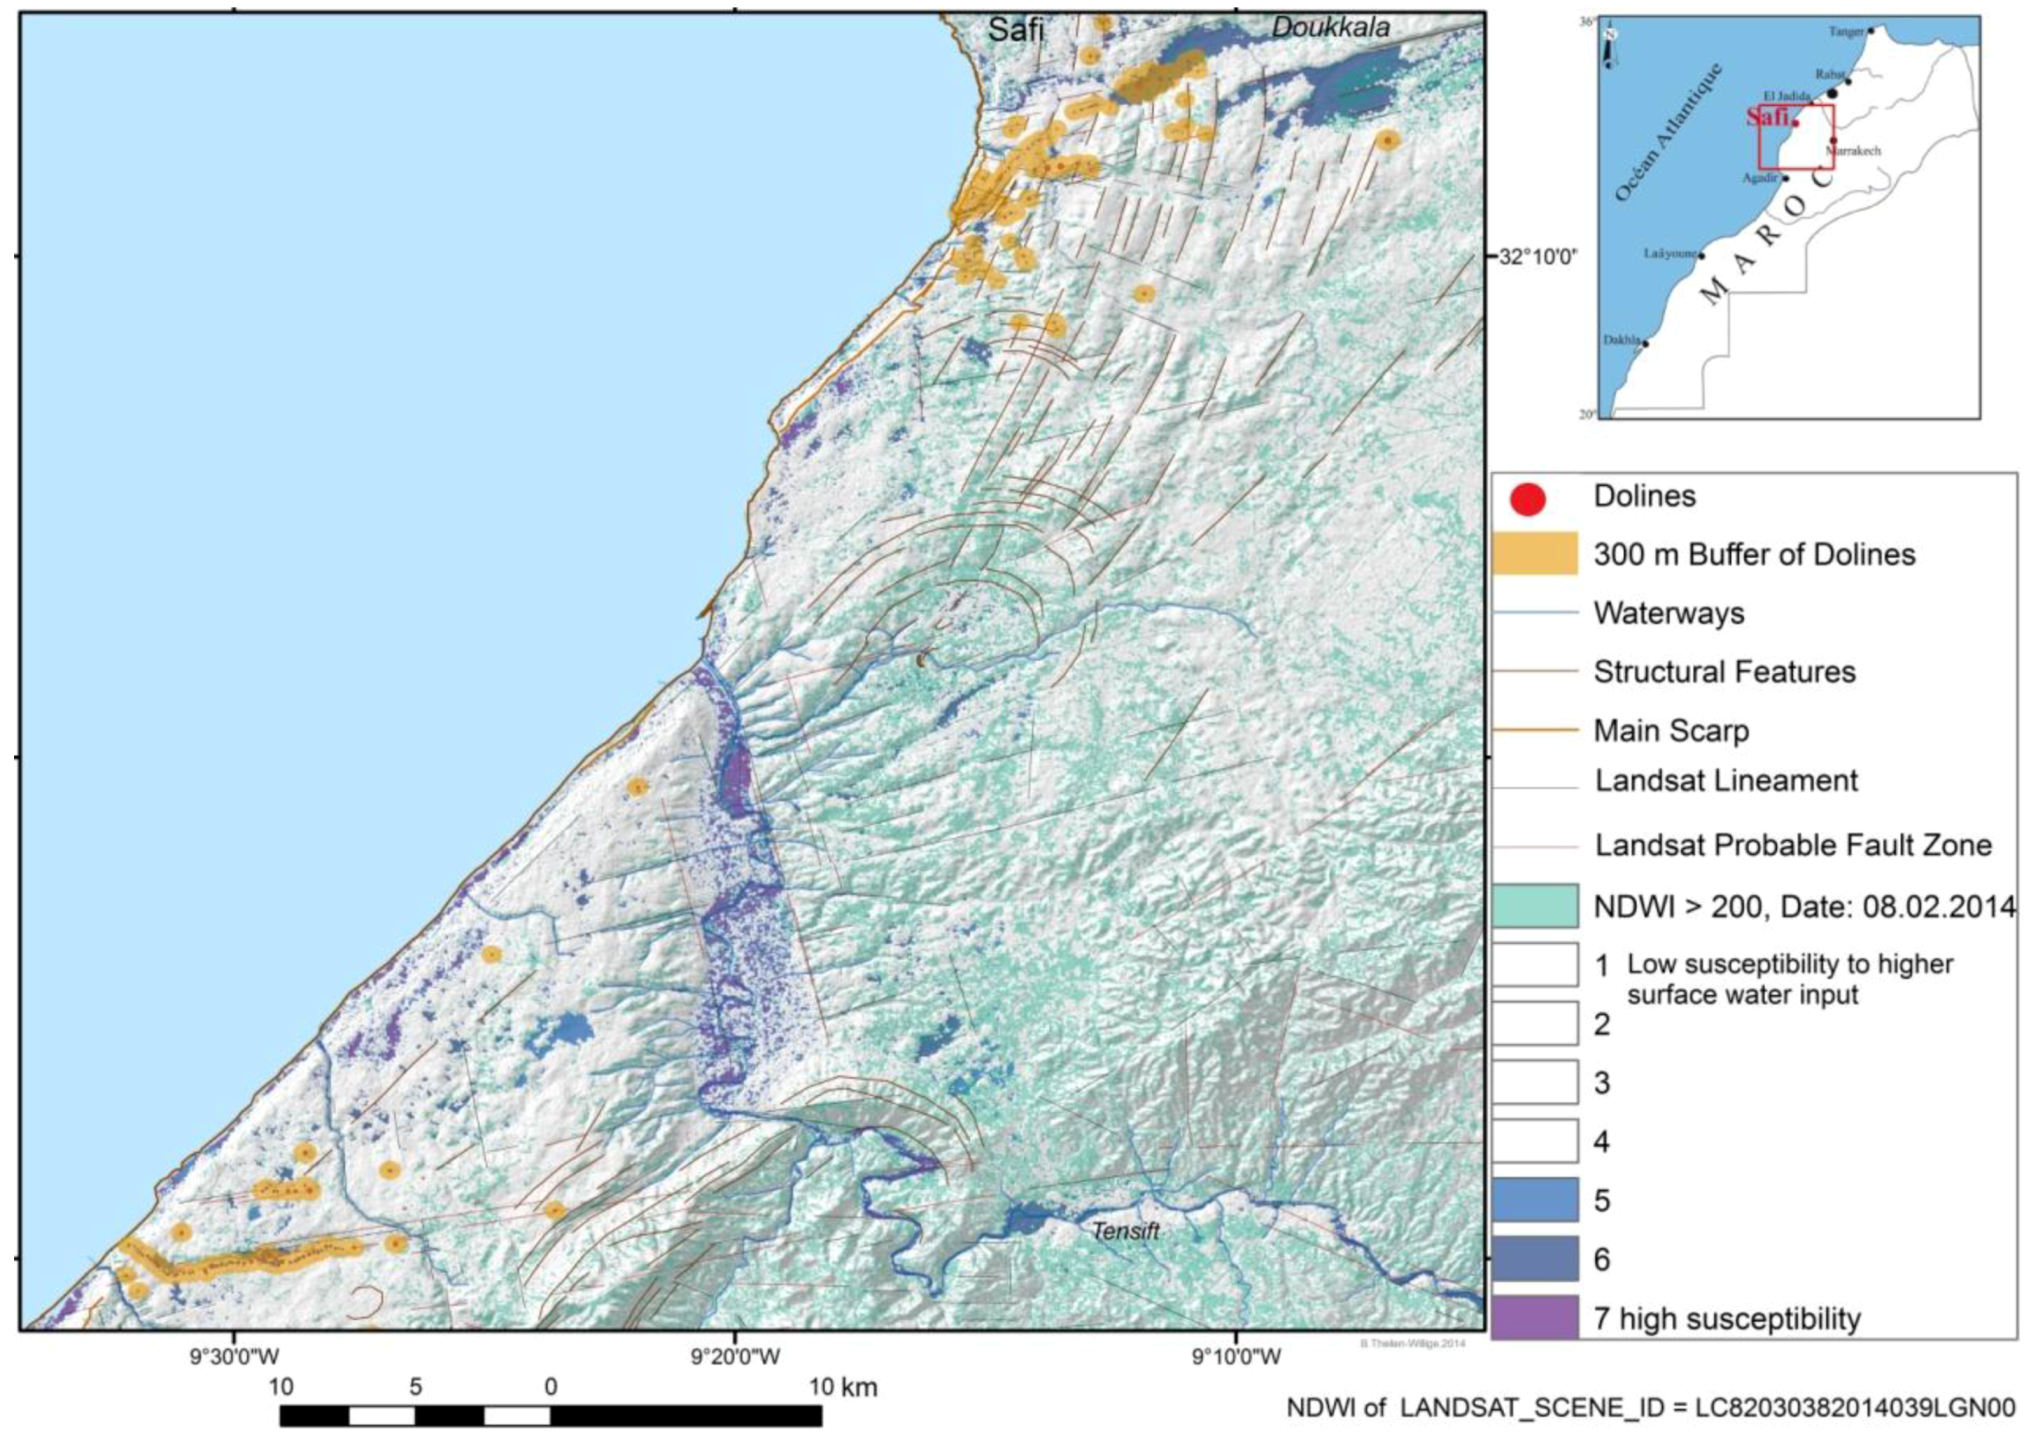
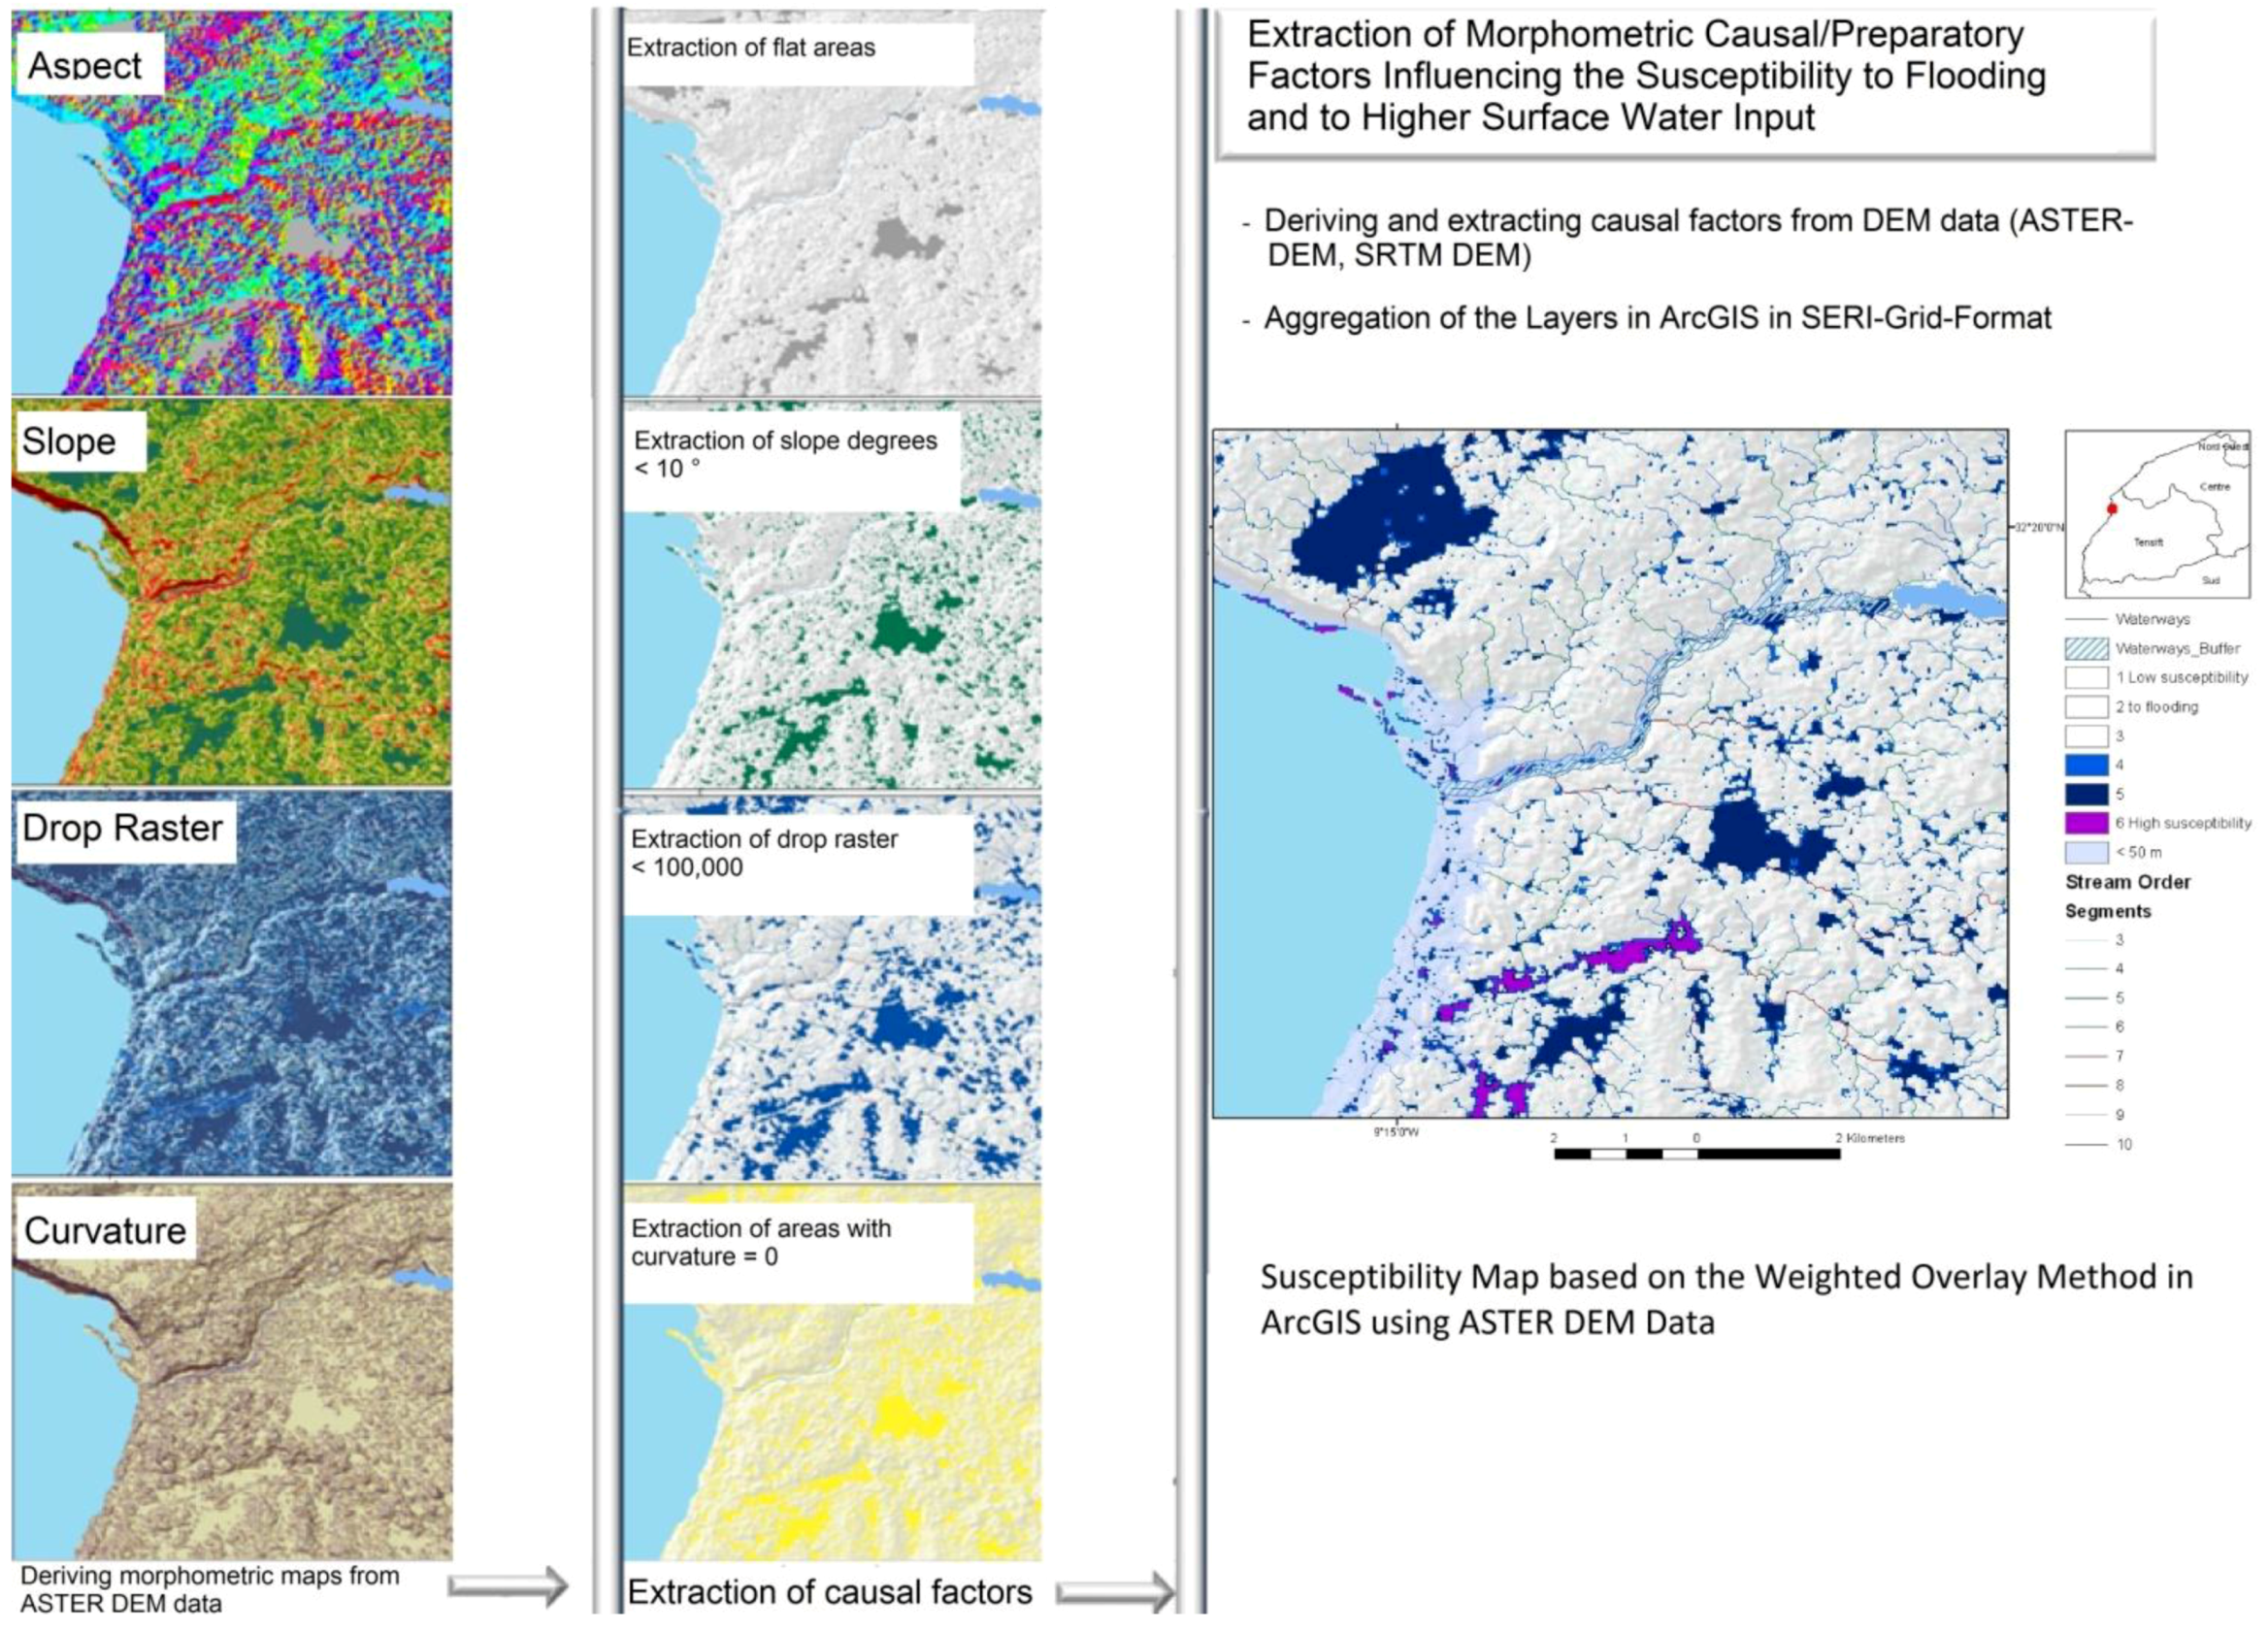
For visualizing those areas, the weighted overlay approach integrated in ArcGIS was used then for the detection and identification of endangered lowland areas susceptible to increased surface water input and even to flooding due to their morphometric disposition by aggregating the causal factors. The susceptibility is calculated by adding every layer with a weighted influence (such as, for example: slope degree <10°: 30%; lowest local height level: 30%; drop raster: 30%; curvature = 0: 10%), together and summing all layers. The sum of causal factors/layers, which can be included into GIS, provides some information on the susceptibility to surface water input and, thus, as a consequence, on areas prone to relatively more intense karstification processes, where the amount of surface water infiltration is higher. The resulting maps are divided into susceptibility classes. The susceptibility is classified by values from 0 to 6, wherein the value 6 stands for the strongest, assumed susceptibility to surface water input, due to the aggregation and summation of causal, morphometric factors in this area. Whenever the above-mentioned causal factors occur aggregated in the investigation area, the susceptibility to flooding events, such as flash floods, rises, as the local lowest and flattest areas are prone more to flash floods, which might lead, in these cases, to an overload of affected karst aquifers.
Figure 10.
A weighted overlay of causal/preparatory morphometric factors [
5]. The resulting maps are divided into susceptibility classes. The susceptibility to higher surface water input and to flooding is classified by values from 0 to 6, whereby the value 6 represents the highest assumed susceptibility due to the aggregation of the morphometric, causal/preparatory factors.
4.2. Digital Image Processing of Landsat, RapidEye and IKONOS Satellite Data and Aerial Photographs
Different satellite data and image processing tools were tested in order to find out whether and to what extent satellite data can contribute to the detection of karst features (dolines, depressions) and of the causal factors influencing karst processes. Landsat data provided by the Global Land Cover Facility (GLCF), University of Maryland, USA, and the U.S. Geological Survey (USGS), EarthExplorer, were used for evaluations. The freely available, cloud-free Landsat Multispectral Scanner (MSS), Landsat Thematic Mapper (TM), Landsat Enhanced Thematic Mapper (ETM) and Landsat 8 data from 1972 to 2014 were digitally processed and evaluated for landscape change detection. RapidEye satellite images were provided by the German Aerospace Center (DLR/Neustrelitz) in the scope of the “Announcement of Opportunity”, based on the project proposal, RapidEye Science Archive (RESA), No. 621 [
4]. High resolution IKONOS satellite imagery (up to 80 cm) were delivered by the GeoEye Foundation (USA) for this research. These data were mainly used for the detection of karst features, the actualization of infrastructural data and for lineament analysis.
Available aerial (black-white) photographs were scanned and digitally enhanced. Based on IKONOS and Google Earth data and on the World_Imagery.lyr provided by ESRI, as well as on existing data from OpenStreetMap, infrastructural data (buildings, functions, etc.) were digitized. This inventory is a prerequisite for land use planning and hazard preparedness in the cases of natural or technologic hazards.
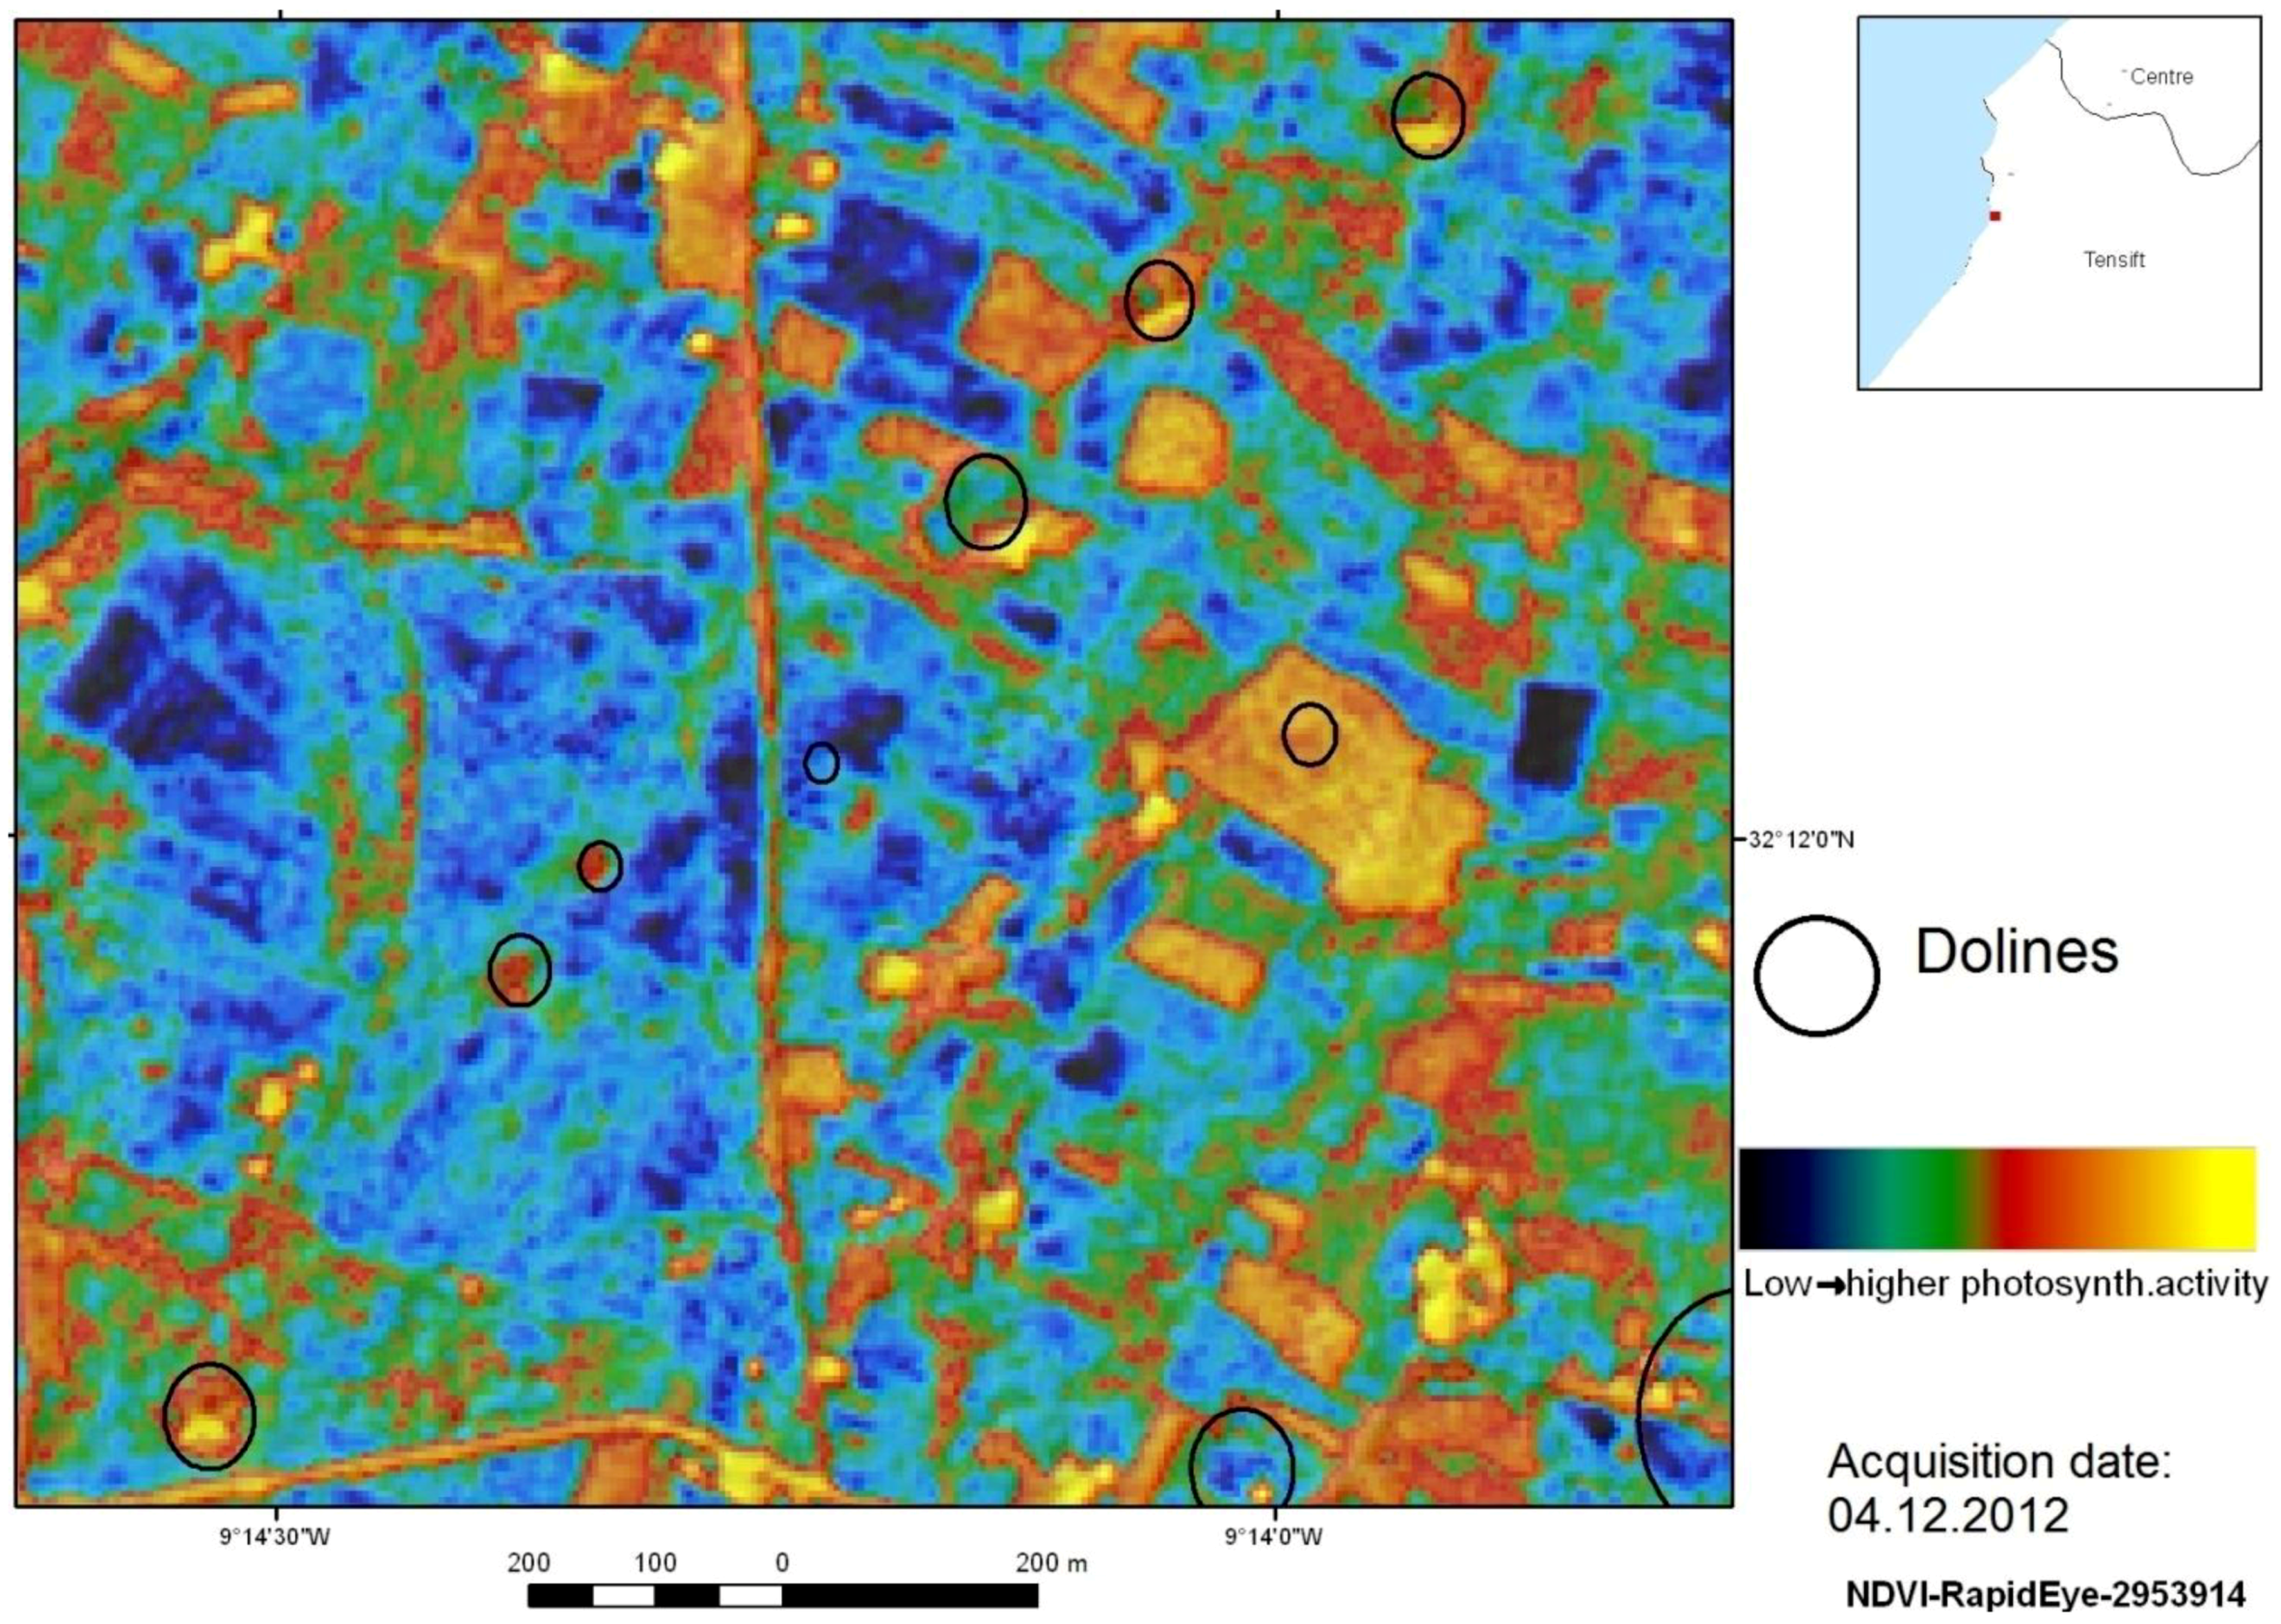
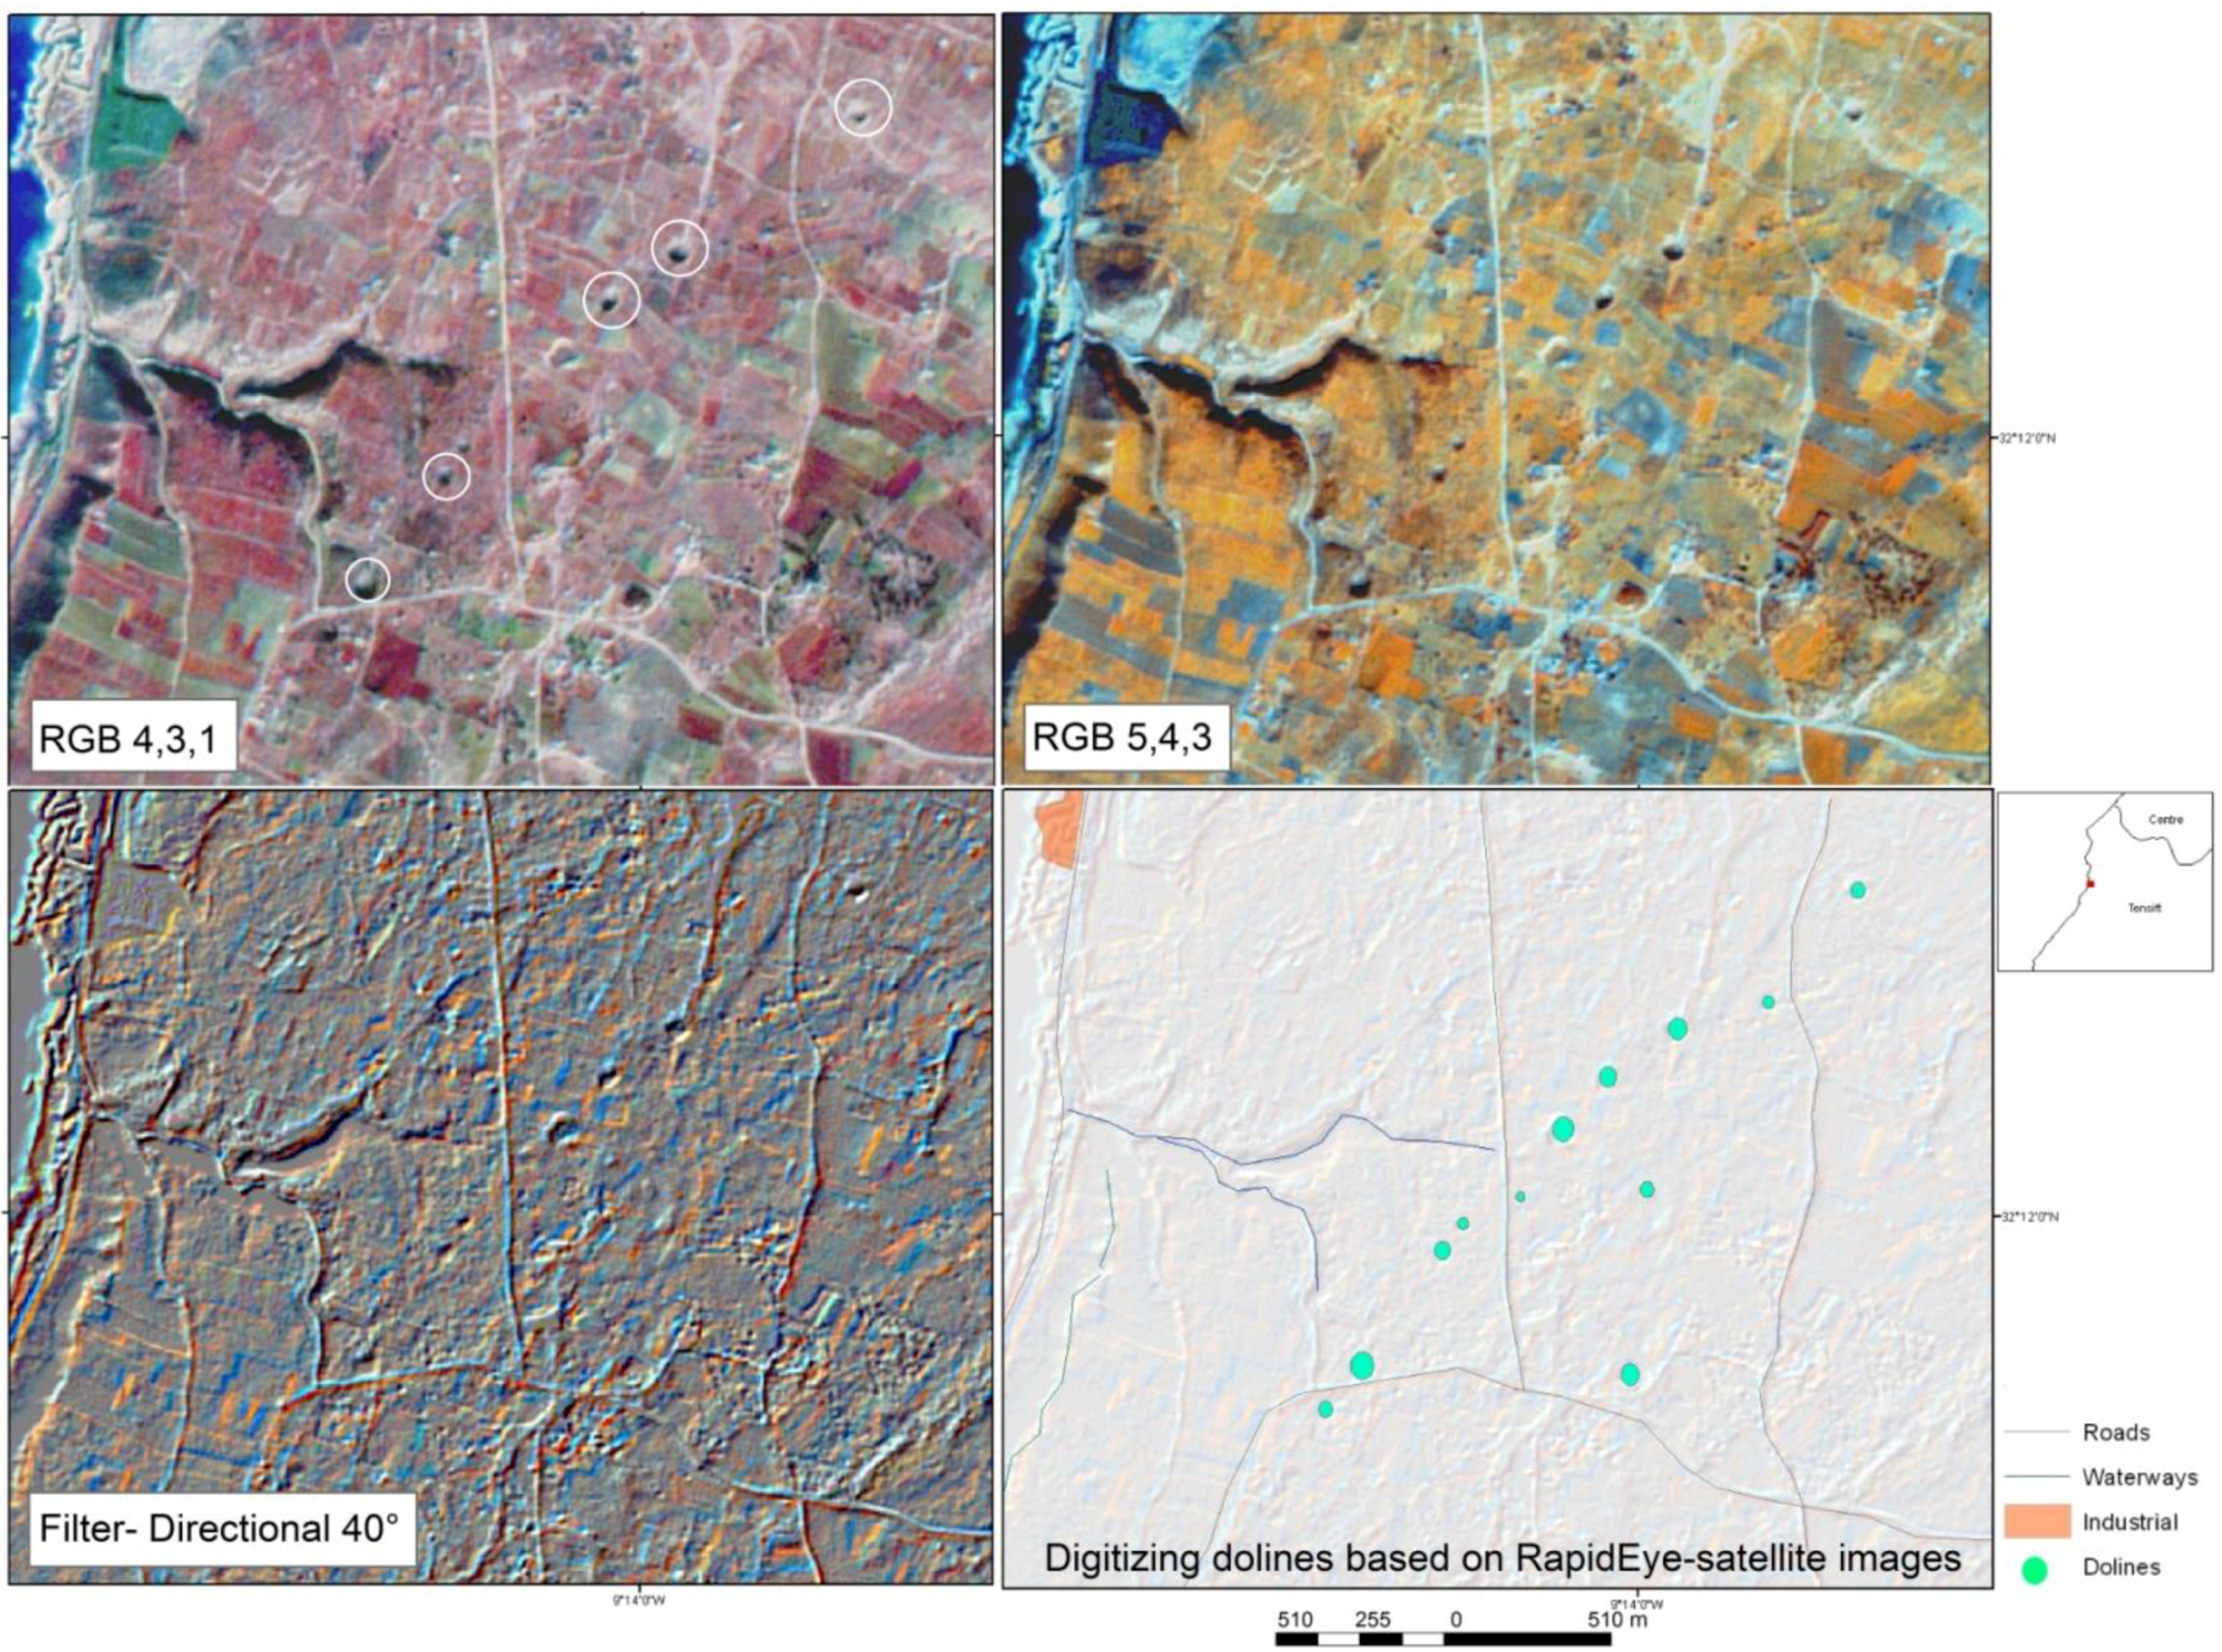
RGB combinations of the different satellite bands were tested. Low-pass and high-pass filters and directional variations were used for the detection of subtle surface structures, such as traces of sinkholes. Merging the “morphologic” image products derived from “Morphologic Convolution” image processing in ENVI software (edge enhancement filter selectively enhancing image features with specific direction components, ENVI help) with RGB imagery, the evaluation feasibilities related to the detection of dolines were improved. The vegetation index, NDVI (Normalized Difference Vegetation Index), was determined by using bands 3 (red) and 4 (NIR) of Landsat data. This vegetation index was used also to calculate NDVI imagery based on RapidEye data in the ENVI software. Calculating the vegetation index NDVI allows an overview of the vegetation photosynthetic activity at the acquisition time of the data. The vegetation index (NDVI) images were used to detect dolines, as in sinkhole areas the vegetation activity might be in a better state due to the higher soil moisture content, therefore showing higher photosynthetic activity.
Figure 11 presents a RapidEye NDVI image indicating dolines in yellow-orange colors related to relatively higher photosynthetic values in sinkholes.
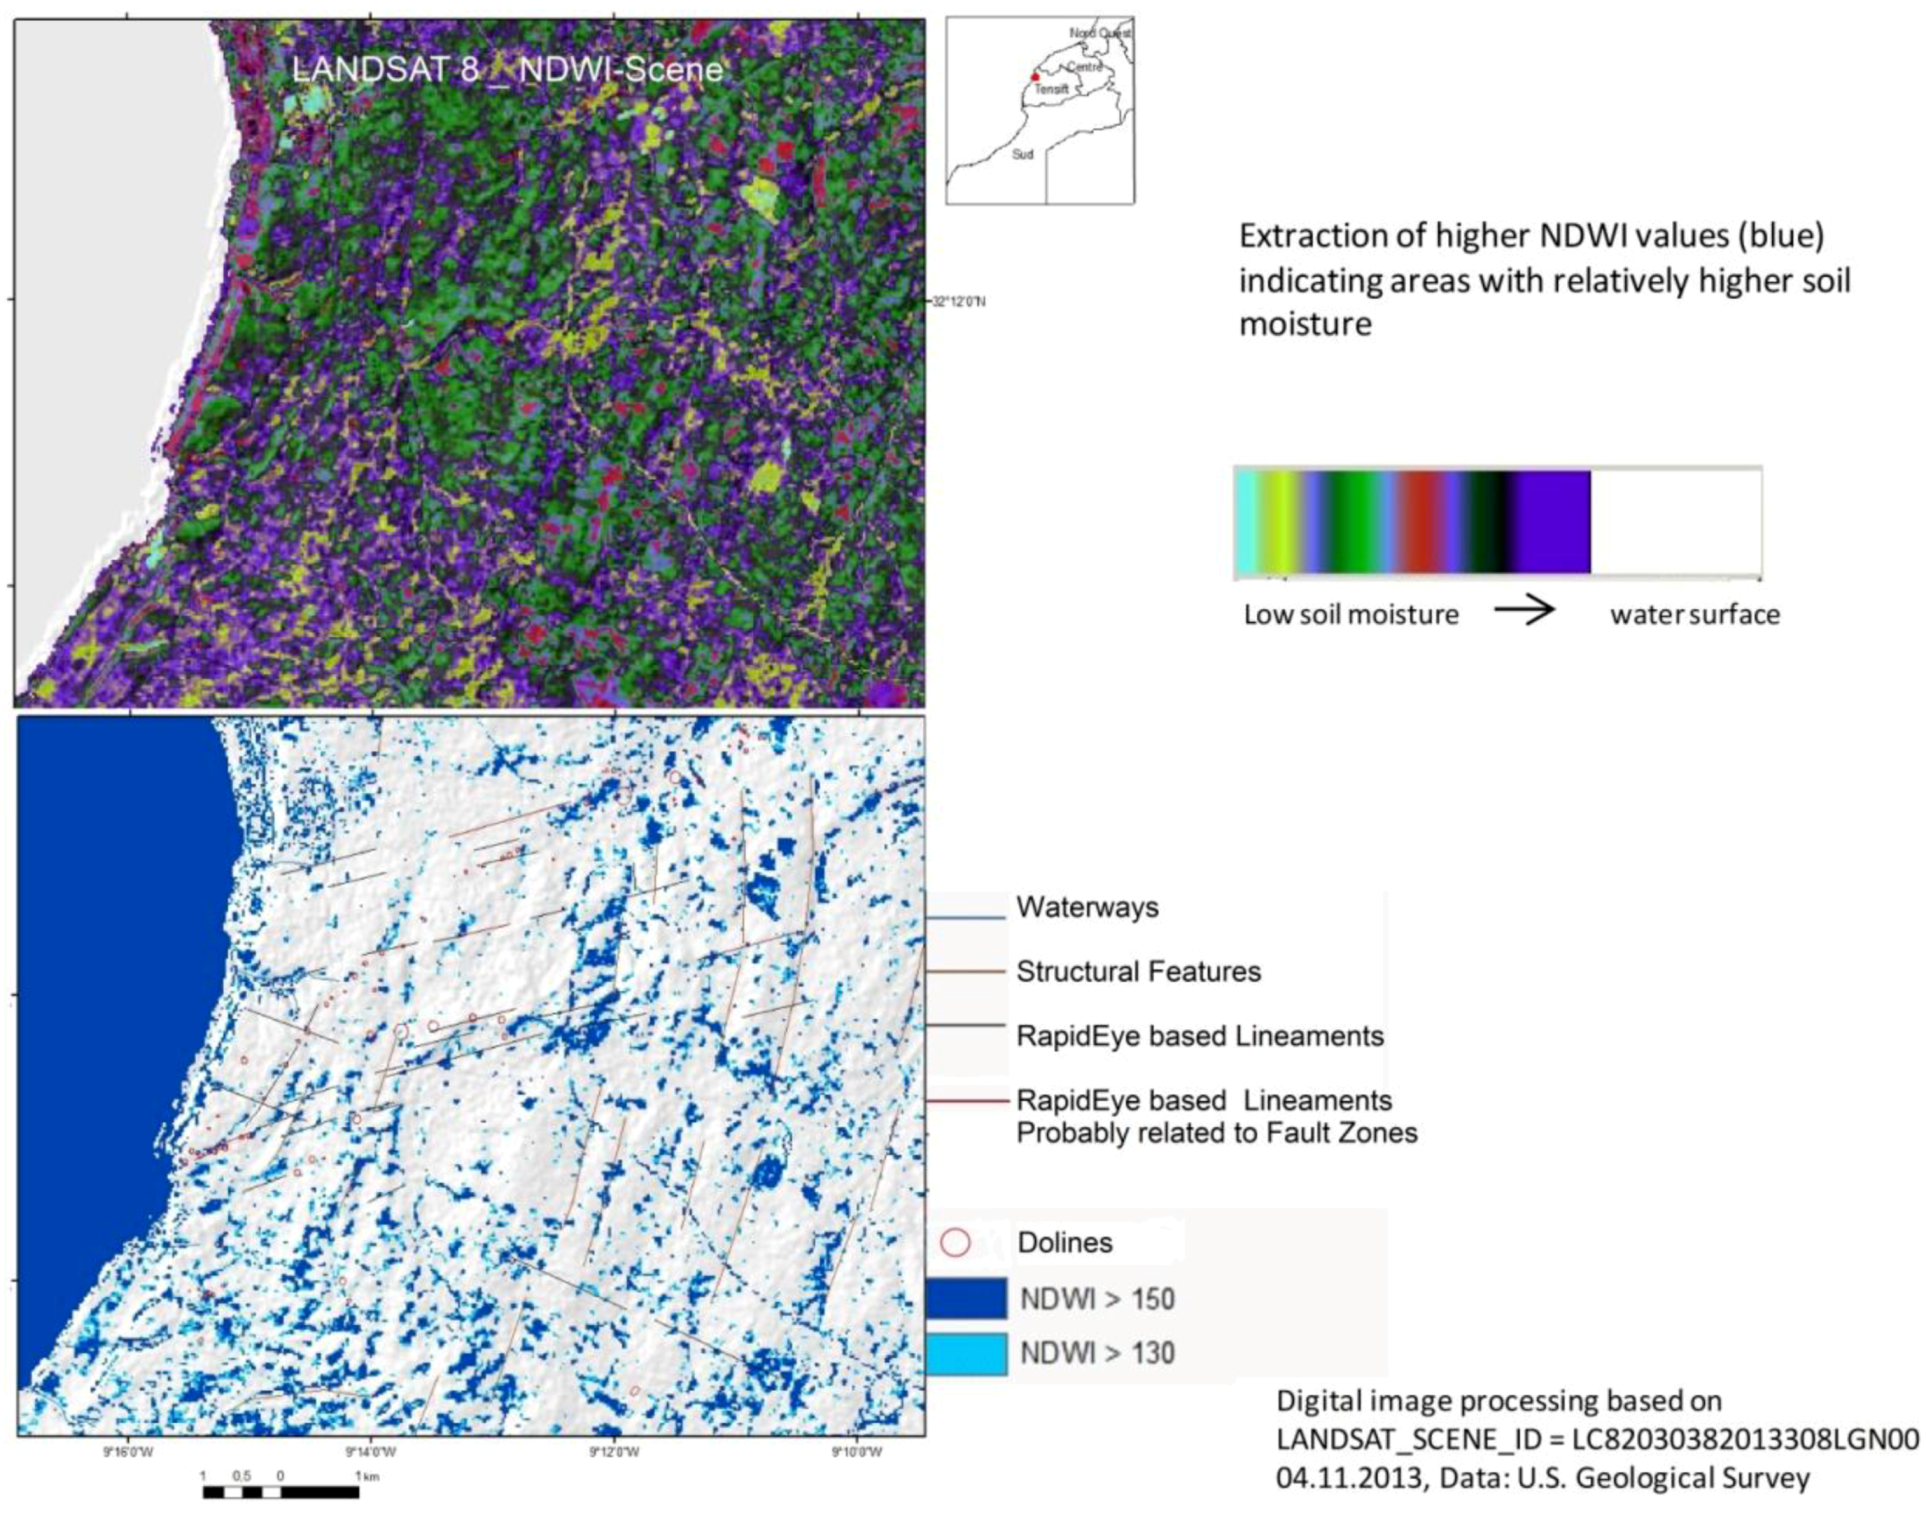
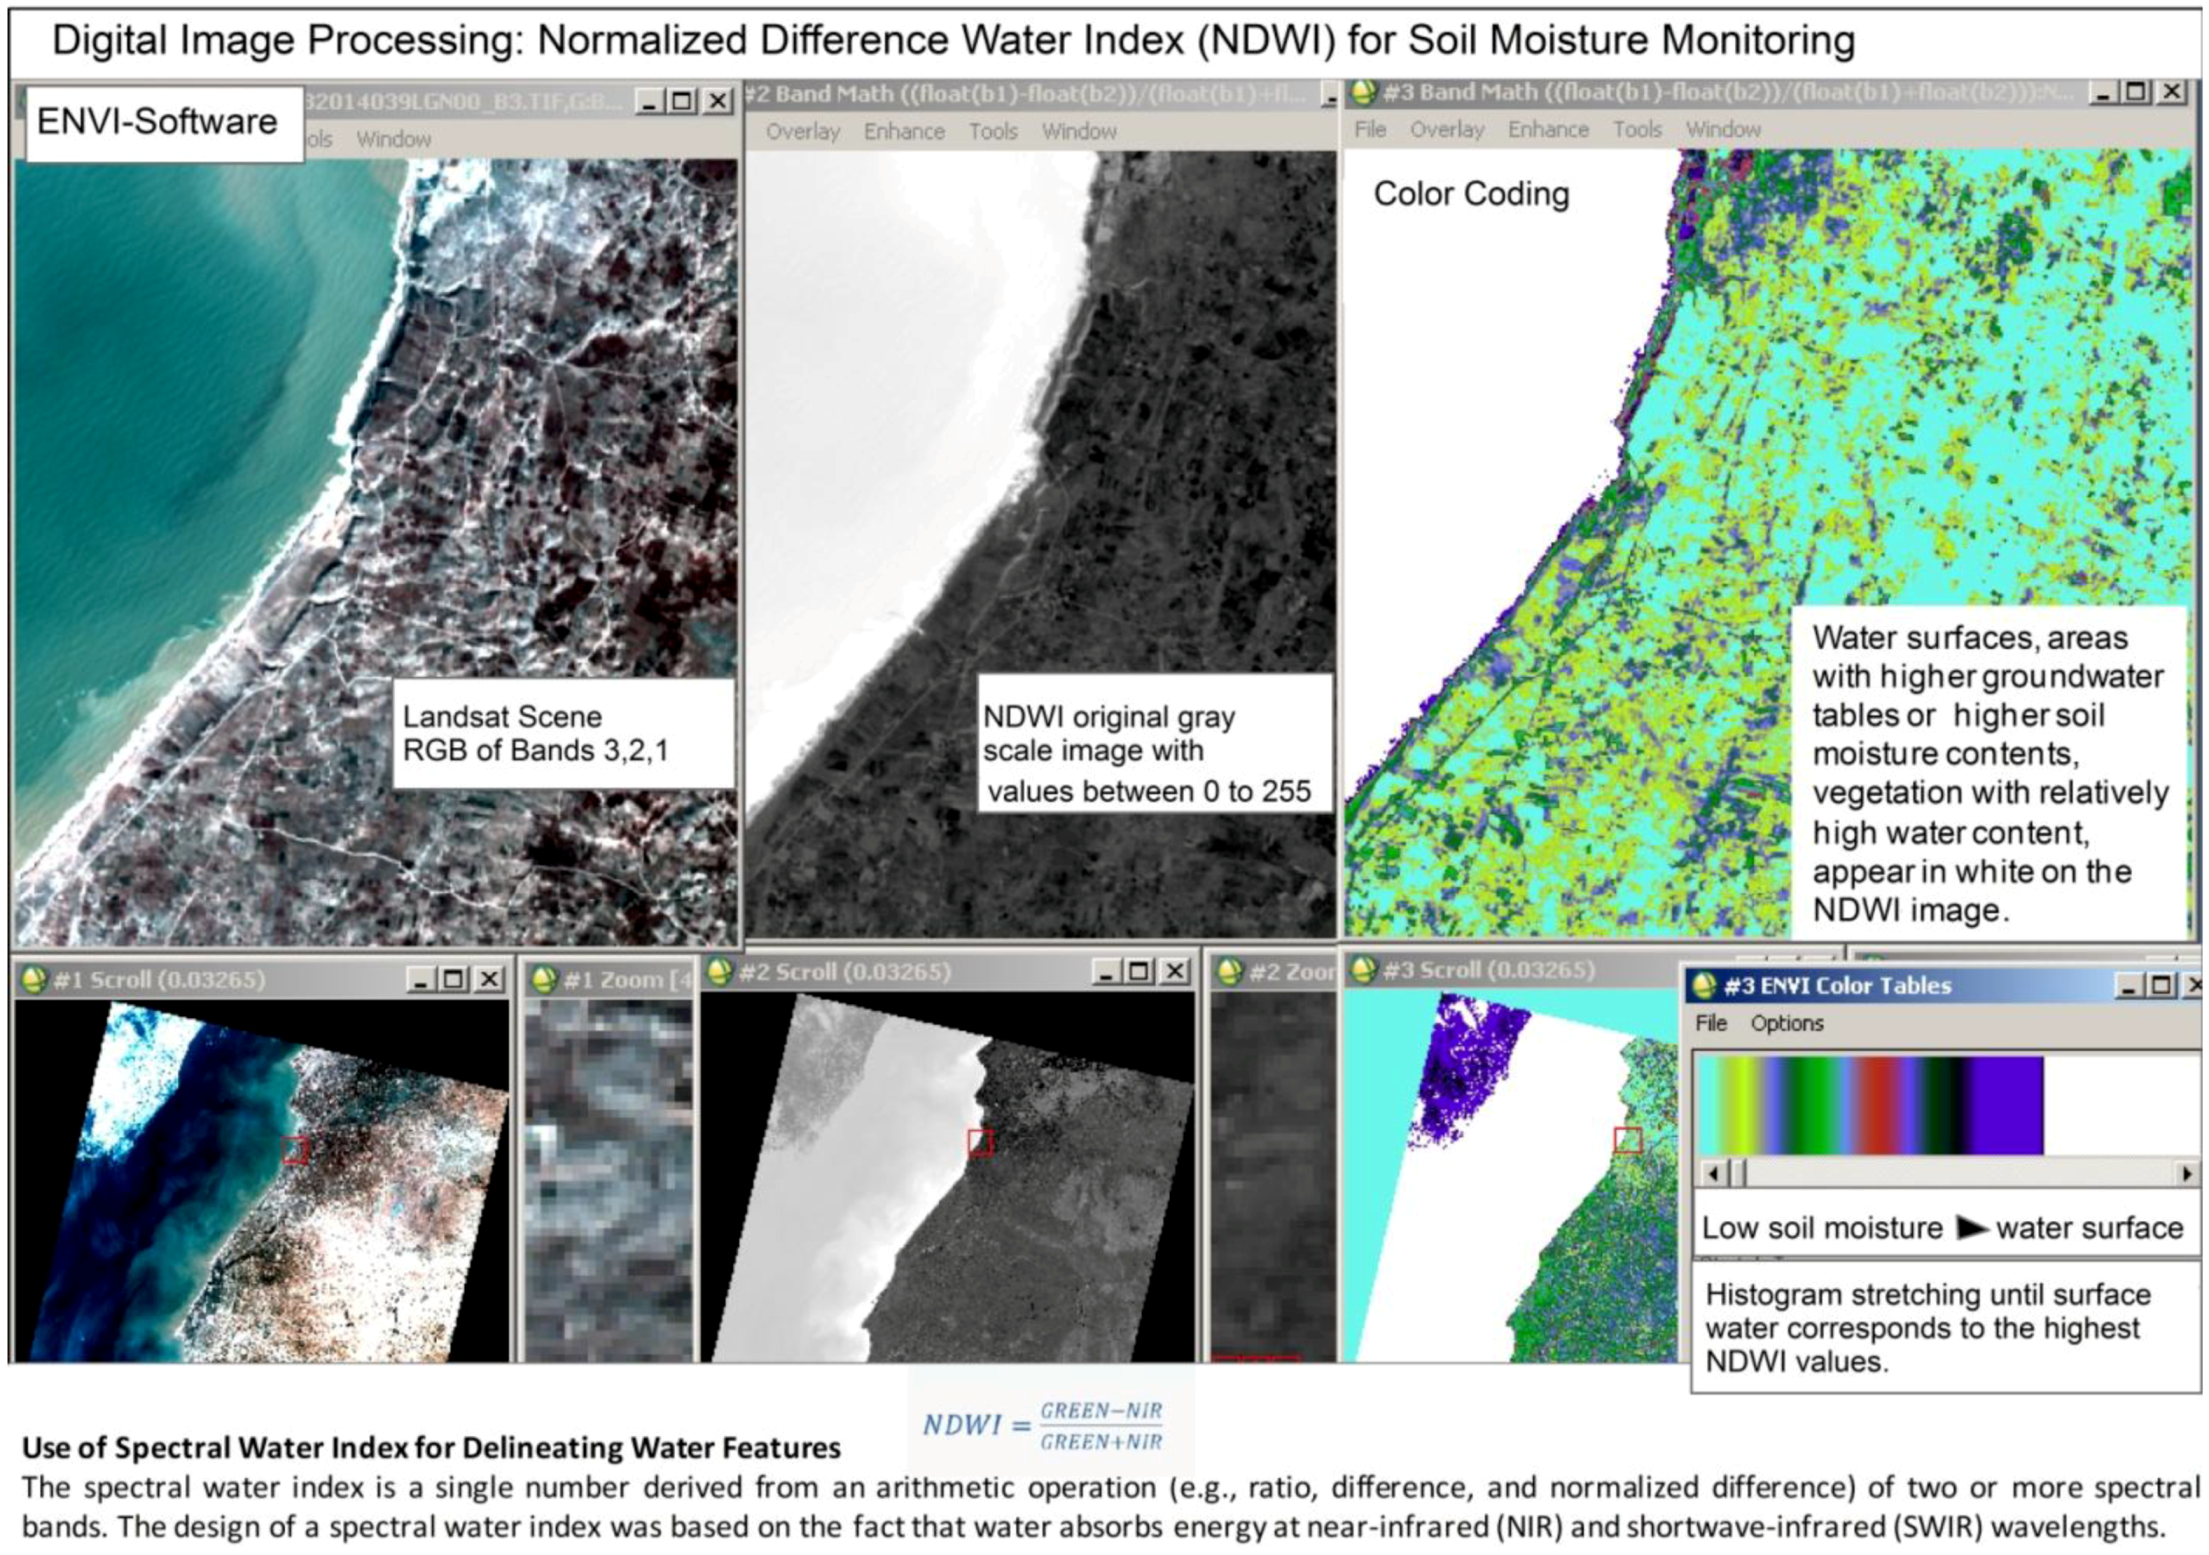
The Normalized Difference Water Index (NDWI) was used, a calculated index from the near-infrared (NIR) and shortwave infrared (SWIR) channels of the satellite data as an indicator of vegetation and soil moisture detection [
20]. The design of a spectral water index was based on the fact that water absorbs energy at near-infrared (NIR) and shortwave infrared (SWIR) wavelengths. In the scope of this study, the Normalized Difference Water Index (NDWI) was derived from high-resolution data, such as IKONOS and RapidEye data and medium resolution Landsat 7 ETM and Landsat 8 imagery, collected with acquisition dates over several years. For NDWI calculation based on IKONOS data, bands 2 and 4 were tested, and for that based on RapidEye imagery, bands 2 and 5 were used.
After calculating the NDWI in ENVI image processing software, an image product with greyscale values between 0 and 255 was created. The NDWI values ranged from 0 to 255 by assigning the least NDWI value in each image cube a value of zero and the maximum NDWI a value of 255. The image products were color-coded, and the values of 0–255 histogram-stretched until the result showed water surfaces corresponding exactly to the highest values of the NDWI calculation (>250), which could be correlated with the visible surface water on the RGB imagery (
Figure 12 and
Figure 13). Thus, a relative scale of soil water conditions at the acquisition time of the satellite image was achieved, as higher values of the NDWI calculation can be correlated with relatively higher soil moisture and surface water. The NDWI image was integrated in ArcGIS and converted into ESRI-Grid. Thus, it was possible to classify the data in ArcMap. A request was started then in the next step, selecting all values of the NDWI gray scale image (values: 0–255) above 150. The results were combined with the weighted overlay results aggregating morphometric, causal factors. By merging these results (higher NDWI values with the highest susceptibility-to-flooding values), some of the factors with a potential influence on karst processes could be visualized. Furthermore, the results of the NDWI extractions were combined with the lineament analysis. In addition to the satellite images, geomorphological interpretations of aerial photos from 1983 with a scale of 1:17,500 and images at a scale of 1:40,000 from 1966 were carried out in order to contribute to the identification of karst depressions. The black and white photographs were scanned, geo-referenced and enhanced by digital image processing tools.
The image products gained by digital image processing were used as a base for structural analysis, especially for the detection of linear features (lineaments), which might be related to near-surface faults and fracture zones. The mapped lineaments were included into the GIS. Structural features related to subsurface structures, such as folds and dome structures, were added to the maps.
Figure 11.
Vegetation index image based on RapidEye data (4 December 2012). Blue color: lower photosynthetic activity; orange to yellow colors: higher photosynthetic activity.
Figure 11.
Vegetation index image based on RapidEye data (4 December 2012). Blue color: lower photosynthetic activity; orange to yellow colors: higher photosynthetic activity.
Figure 12.
Extraction of higher Normalized Difference Water Index (NDWI) values.
Figure 12.
Extraction of higher Normalized Difference Water Index (NDWI) values.
Figure 13.
Water index NDWI derived from Landsat data.
Figure 13.
Water index NDWI derived from Landsat data.
5. Evaluation Results
The karst-typical landforms, like the dolines, named here “Daia”, partly occurring as uvalas, were identified on satellite imagery and aerial photographs due to their characteristic morphologic properties and circular outline. More than 200 circular features were digitized based on RapidEye and on IKONOS satellite imagery (
Figure 14 and
Figure 15a,b), aerial photographs and Google Earth data and integrated then into the GIS database. Numerous dolines and smaller depressions were found, some of which were not yet known, although errors in the scope of the remote sensing evaluation process cannot be excluded. The mapped dolines could be verified partly by field research (
Figure 6 and
Figure 7). The visibility of dolines on satellite images depends on seasonal influences, which makes the standardized approaches of digital image processing difficult. Smaller depressions are often only visible in the satellite imagery and aerial photographs, due to subtle, tonal differences, expressed as darker, almost circular features. During wet seasons, sinkholes are expressed more in the images, due to the higher photosynthetic activity and soil moisture or water fill (
Figure 16).
The pattern and surface alignments of karst features in the study area are structurally controlled and associated with subsurface structures, such as joint patterns, faults and folding. This relationship can be visualized by the structural evaluation of remote sensing data.
Figure 14.
Dolines visible on RapidEye scenes (acquisition date: 4 December 2012), south of Safi.
Figure 14.
Dolines visible on RapidEye scenes (acquisition date: 4 December 2012), south of Safi.
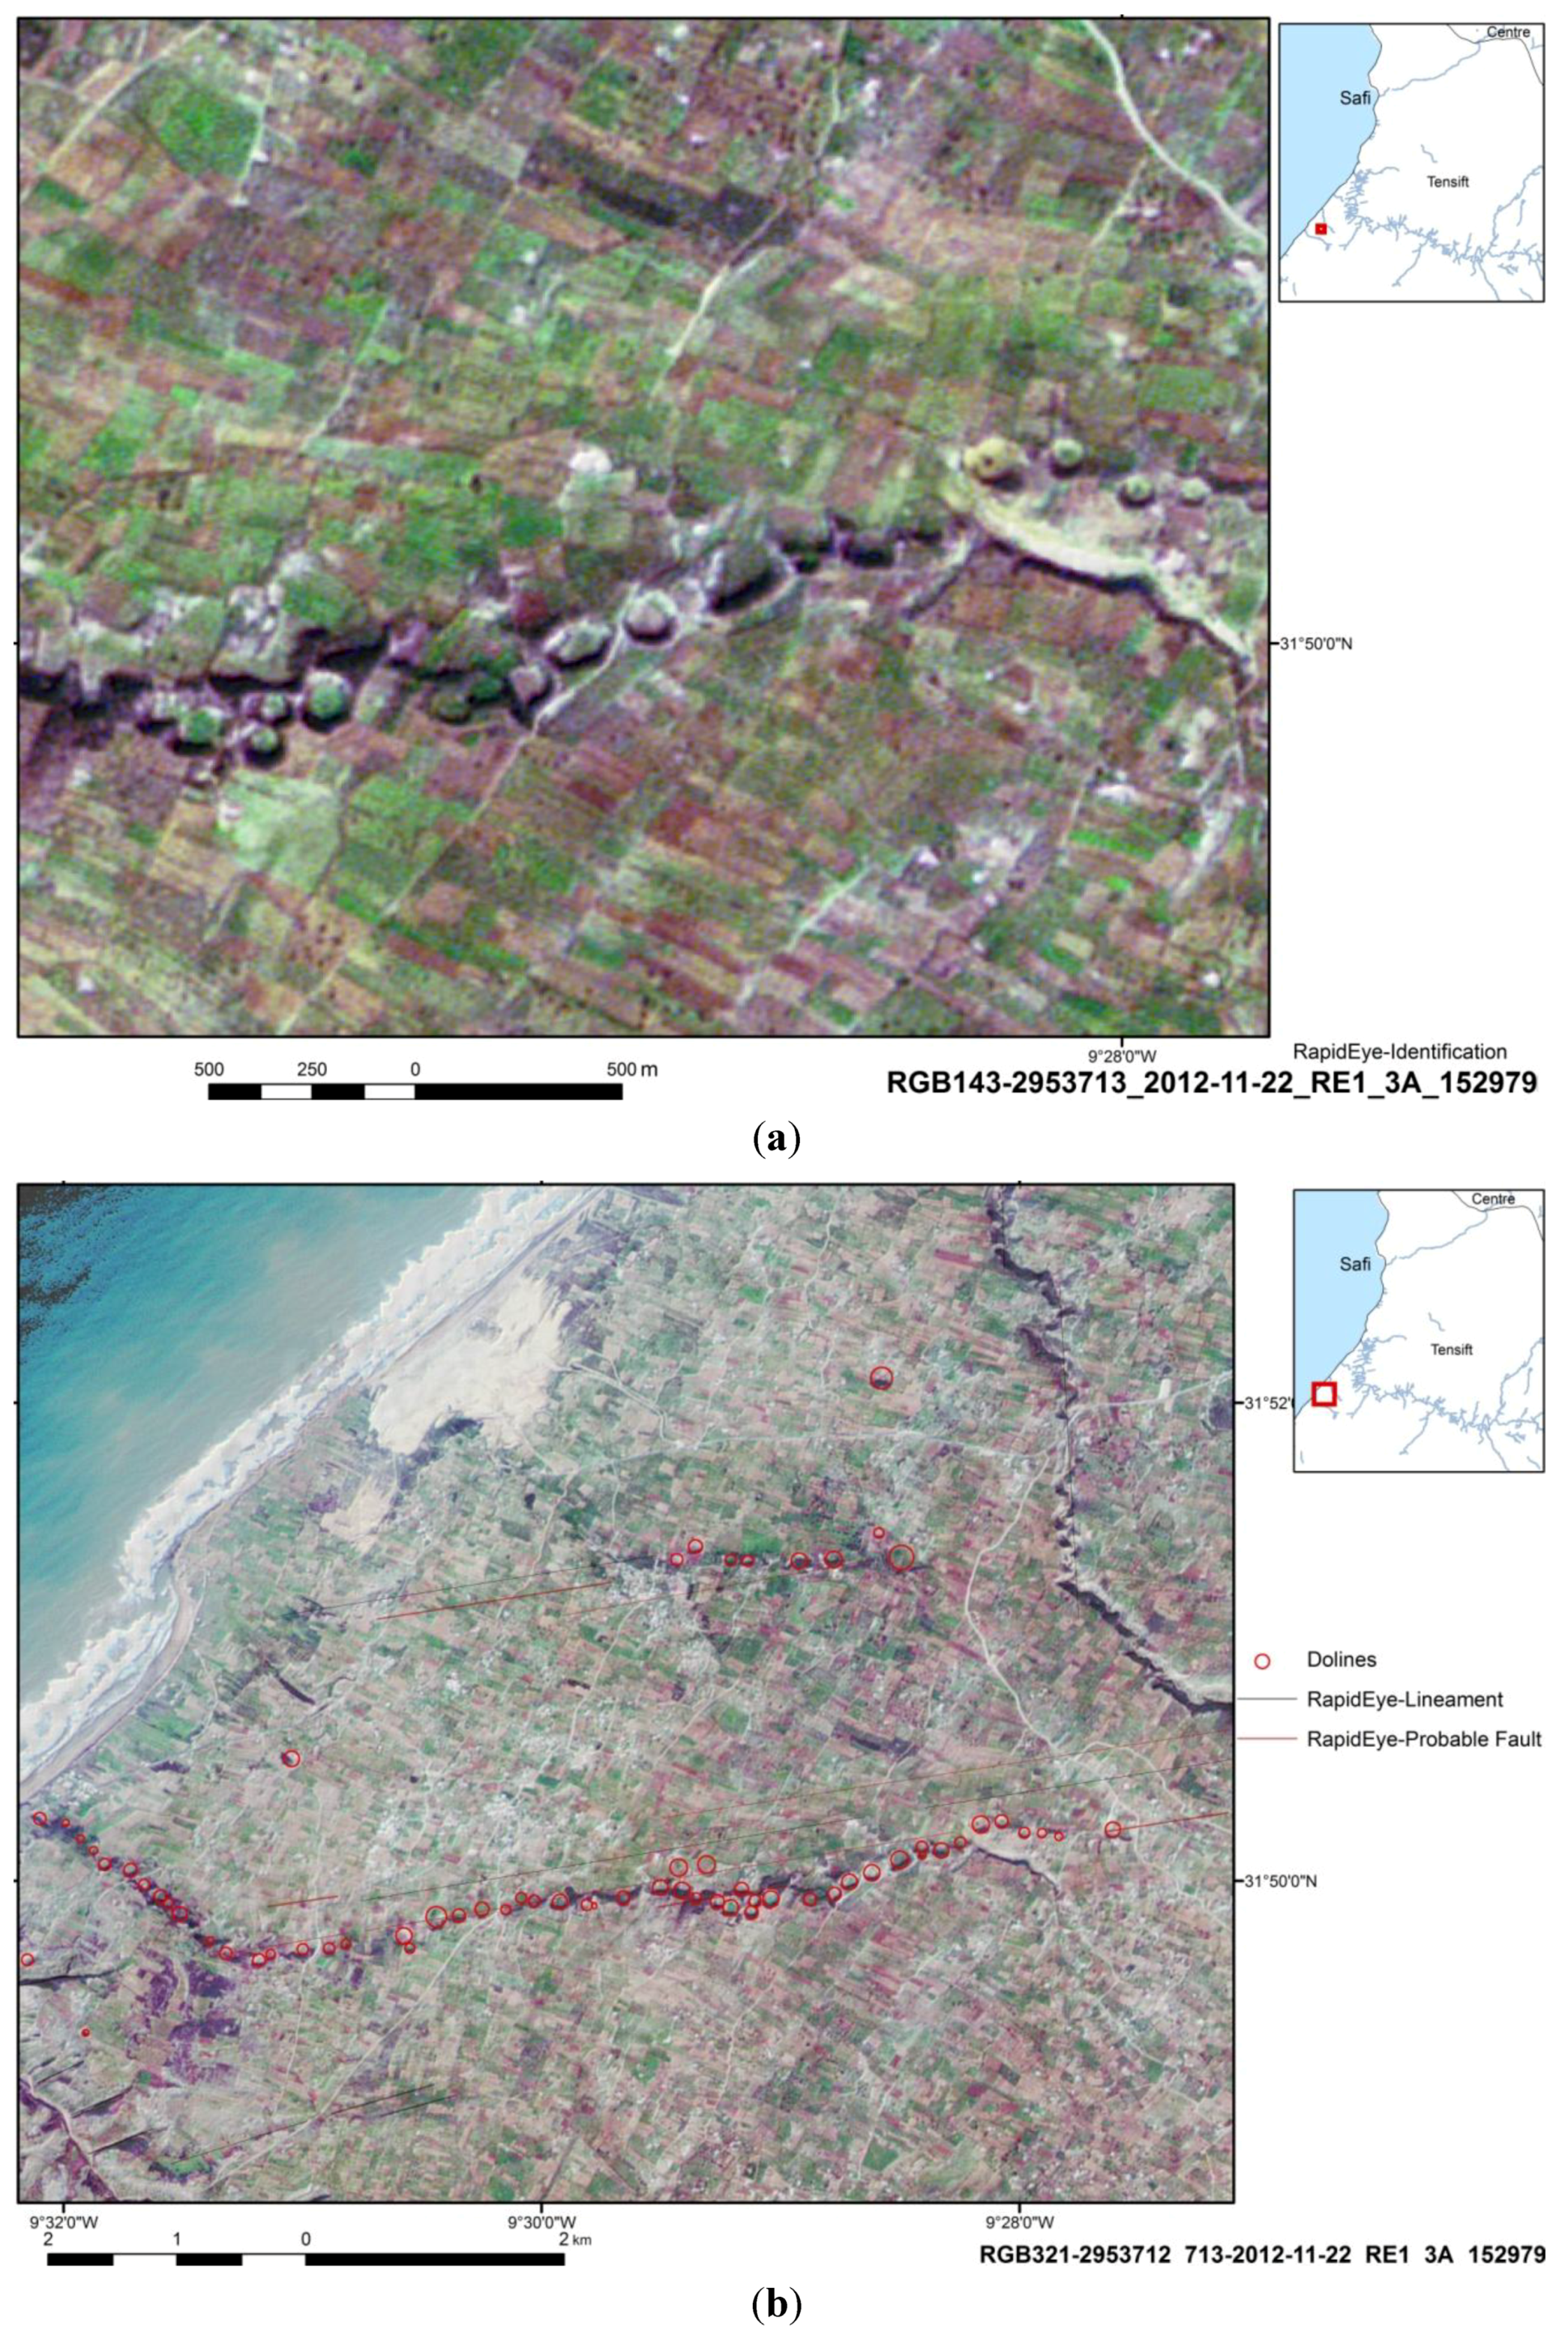
Figure 15.
(a) Uvalas in a linear arrangement in the south of the Tensift-river as visible on a RapidEye scene (acquisition date: 22 November 2012, 5-m spatial resolution) and (b) lineament analysis based on the RapidEye satellite scene of the uvala area.
Figure 15.
(a) Uvalas in a linear arrangement in the south of the Tensift-river as visible on a RapidEye scene (acquisition date: 22 November 2012, 5-m spatial resolution) and (b) lineament analysis based on the RapidEye satellite scene of the uvala area.
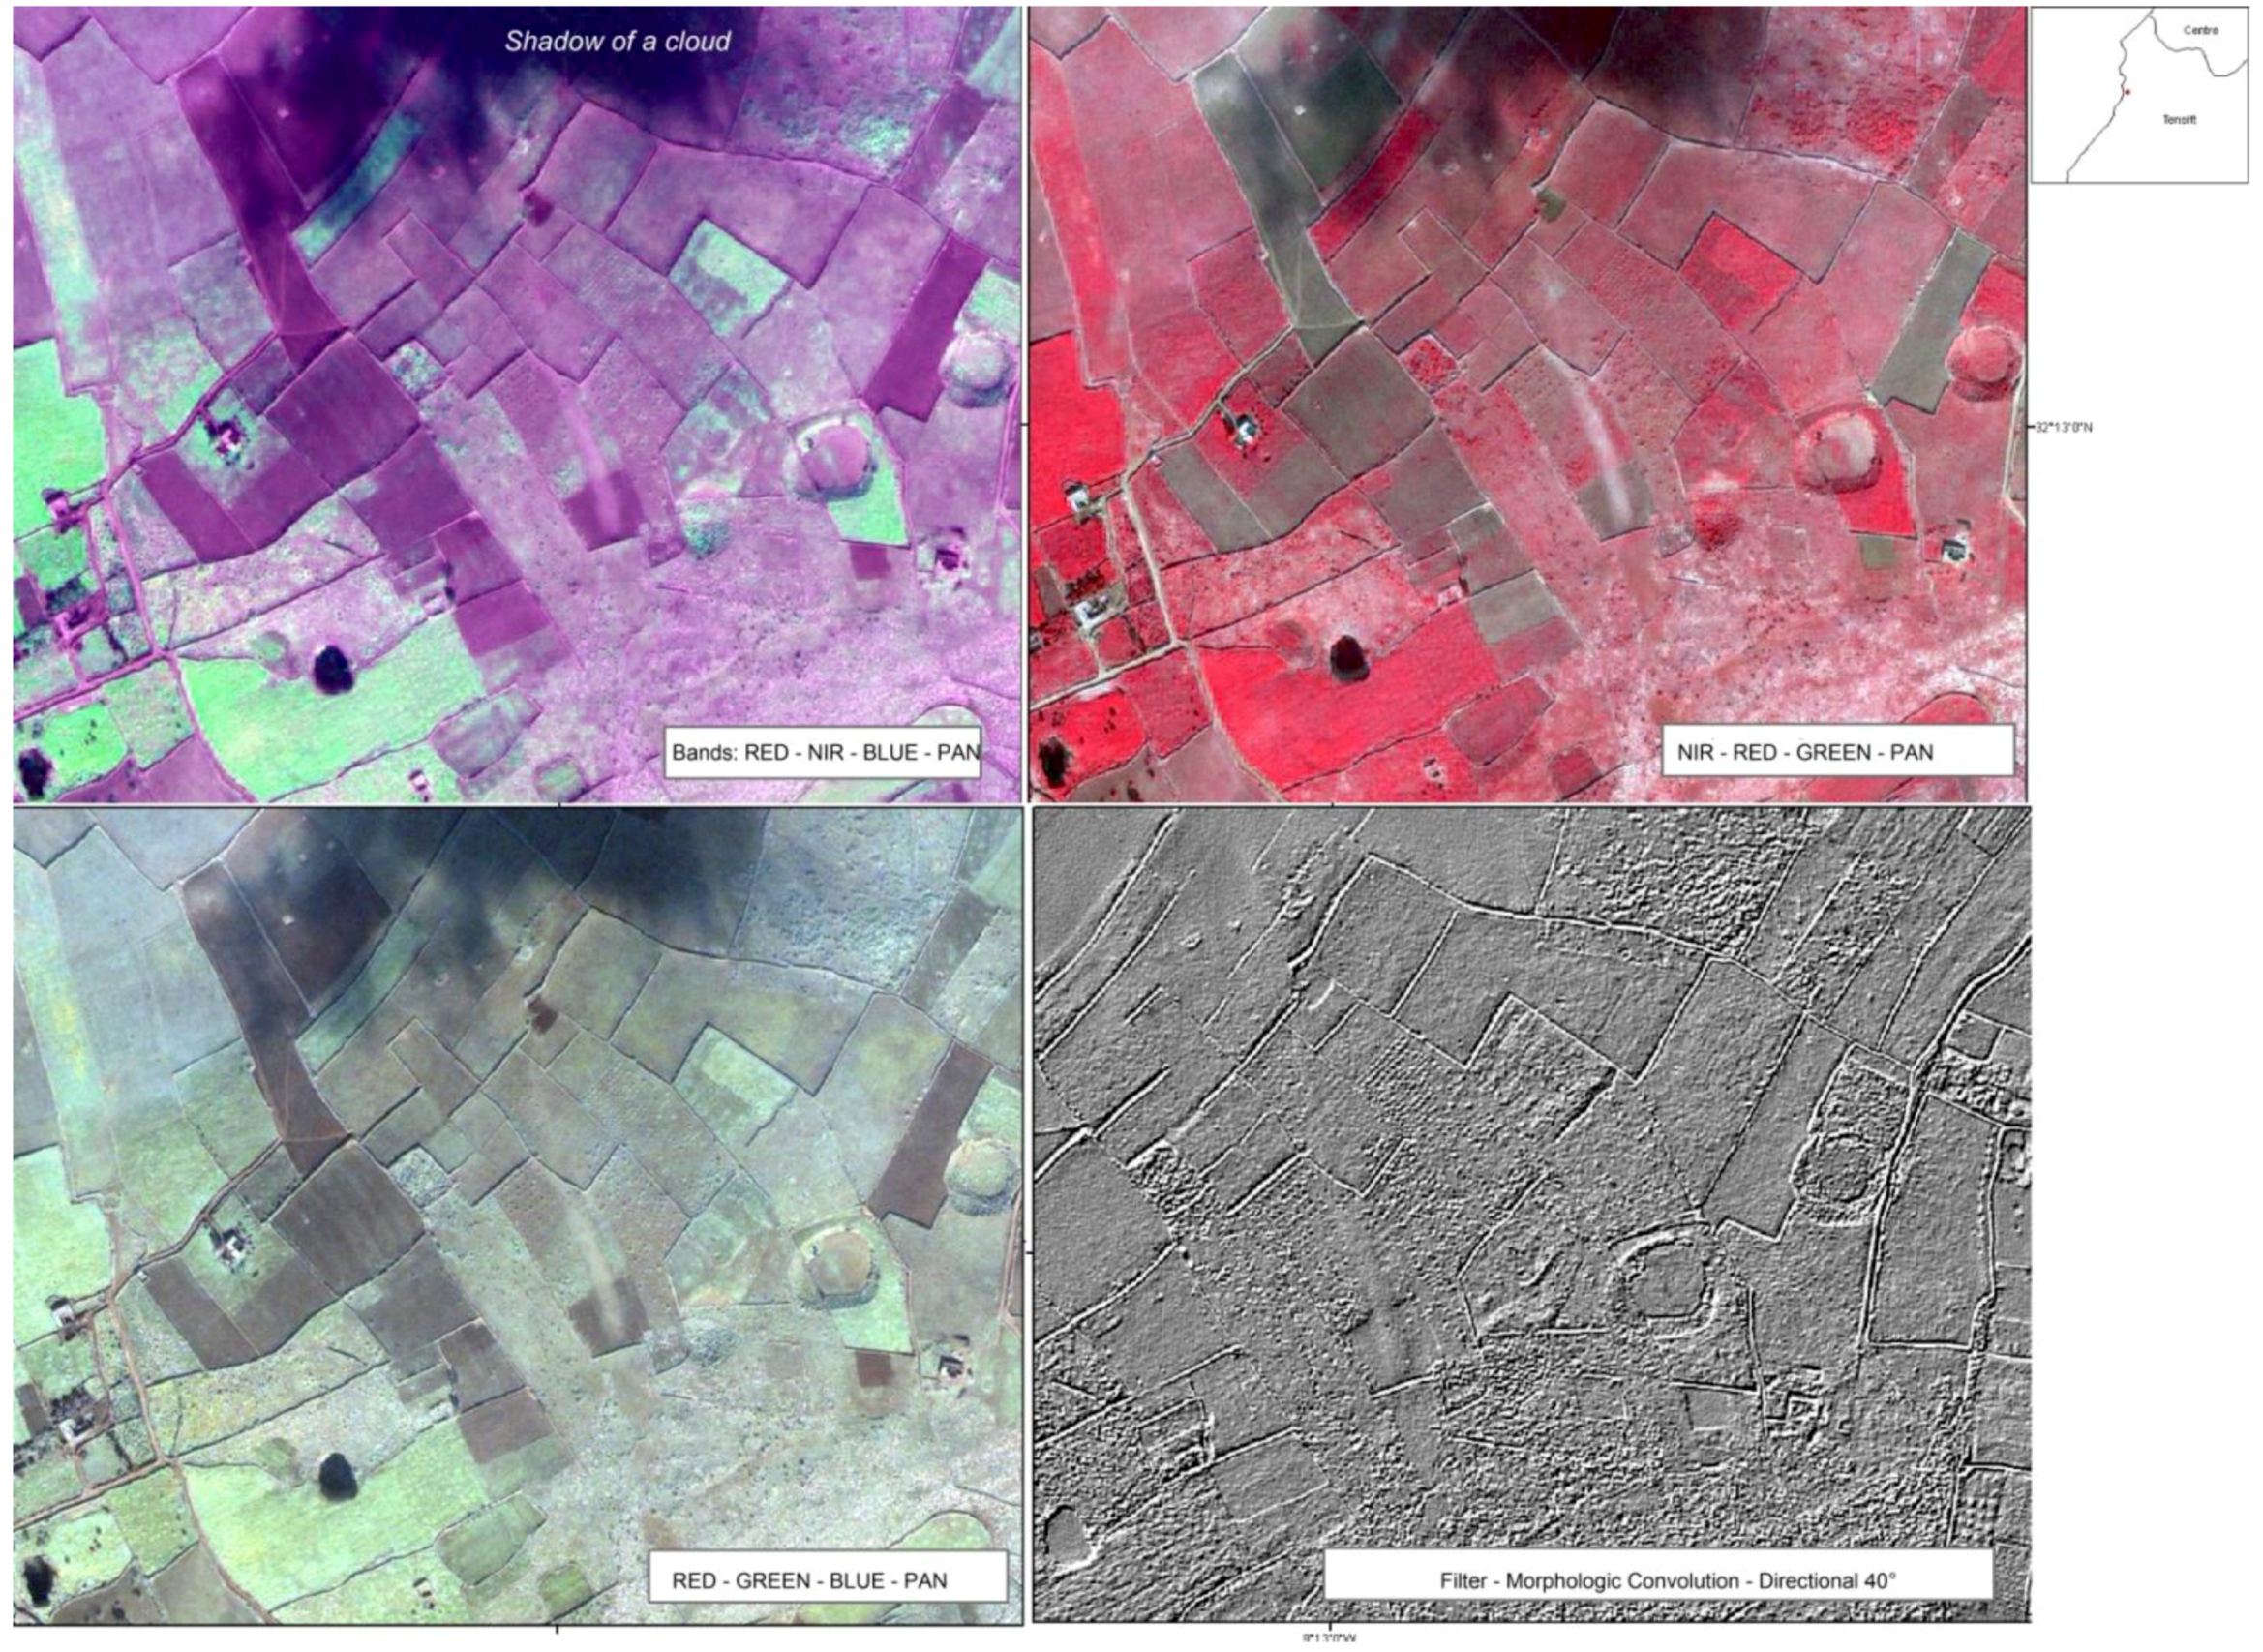
Figure 16.
Dolines in the south of Safi visible on IKONOS_2 scenes (acquisition date: 14 January 2006) as flat, bowl-shaped depressions and circular, water-filled ponds in different band combinations.
Figure 16.
Dolines in the south of Safi visible on IKONOS_2 scenes (acquisition date: 14 January 2006) as flat, bowl-shaped depressions and circular, water-filled ponds in different band combinations.
When evaluating the results of the structural analysis based on remote sensing data and geologic and geophysic data, the occurrence and development of karst features generally seems to be more influenced by fault zones striking mainly in SW-NE than by structural features, such as anticlines or domes. Based on Landsat and RapidEye images, mainly SW-NE oriented and SSW-NNE oriented lineaments were mapped, intersecting each other. Dolines appear to occur in clusters, especially in these intersecting areas of lineaments and in near-coast areas below 100-m elevation (
Figure 17a). The linear arrangement of the uvalas south of the Tensift River, in the SW-NE direction, then abruptly changing towards the coast into the NW-SE direction, seems to trace subsurface fault zones, as visible in
Figure 16b. Of course, further field control of the mapped features is still necessary for validation.
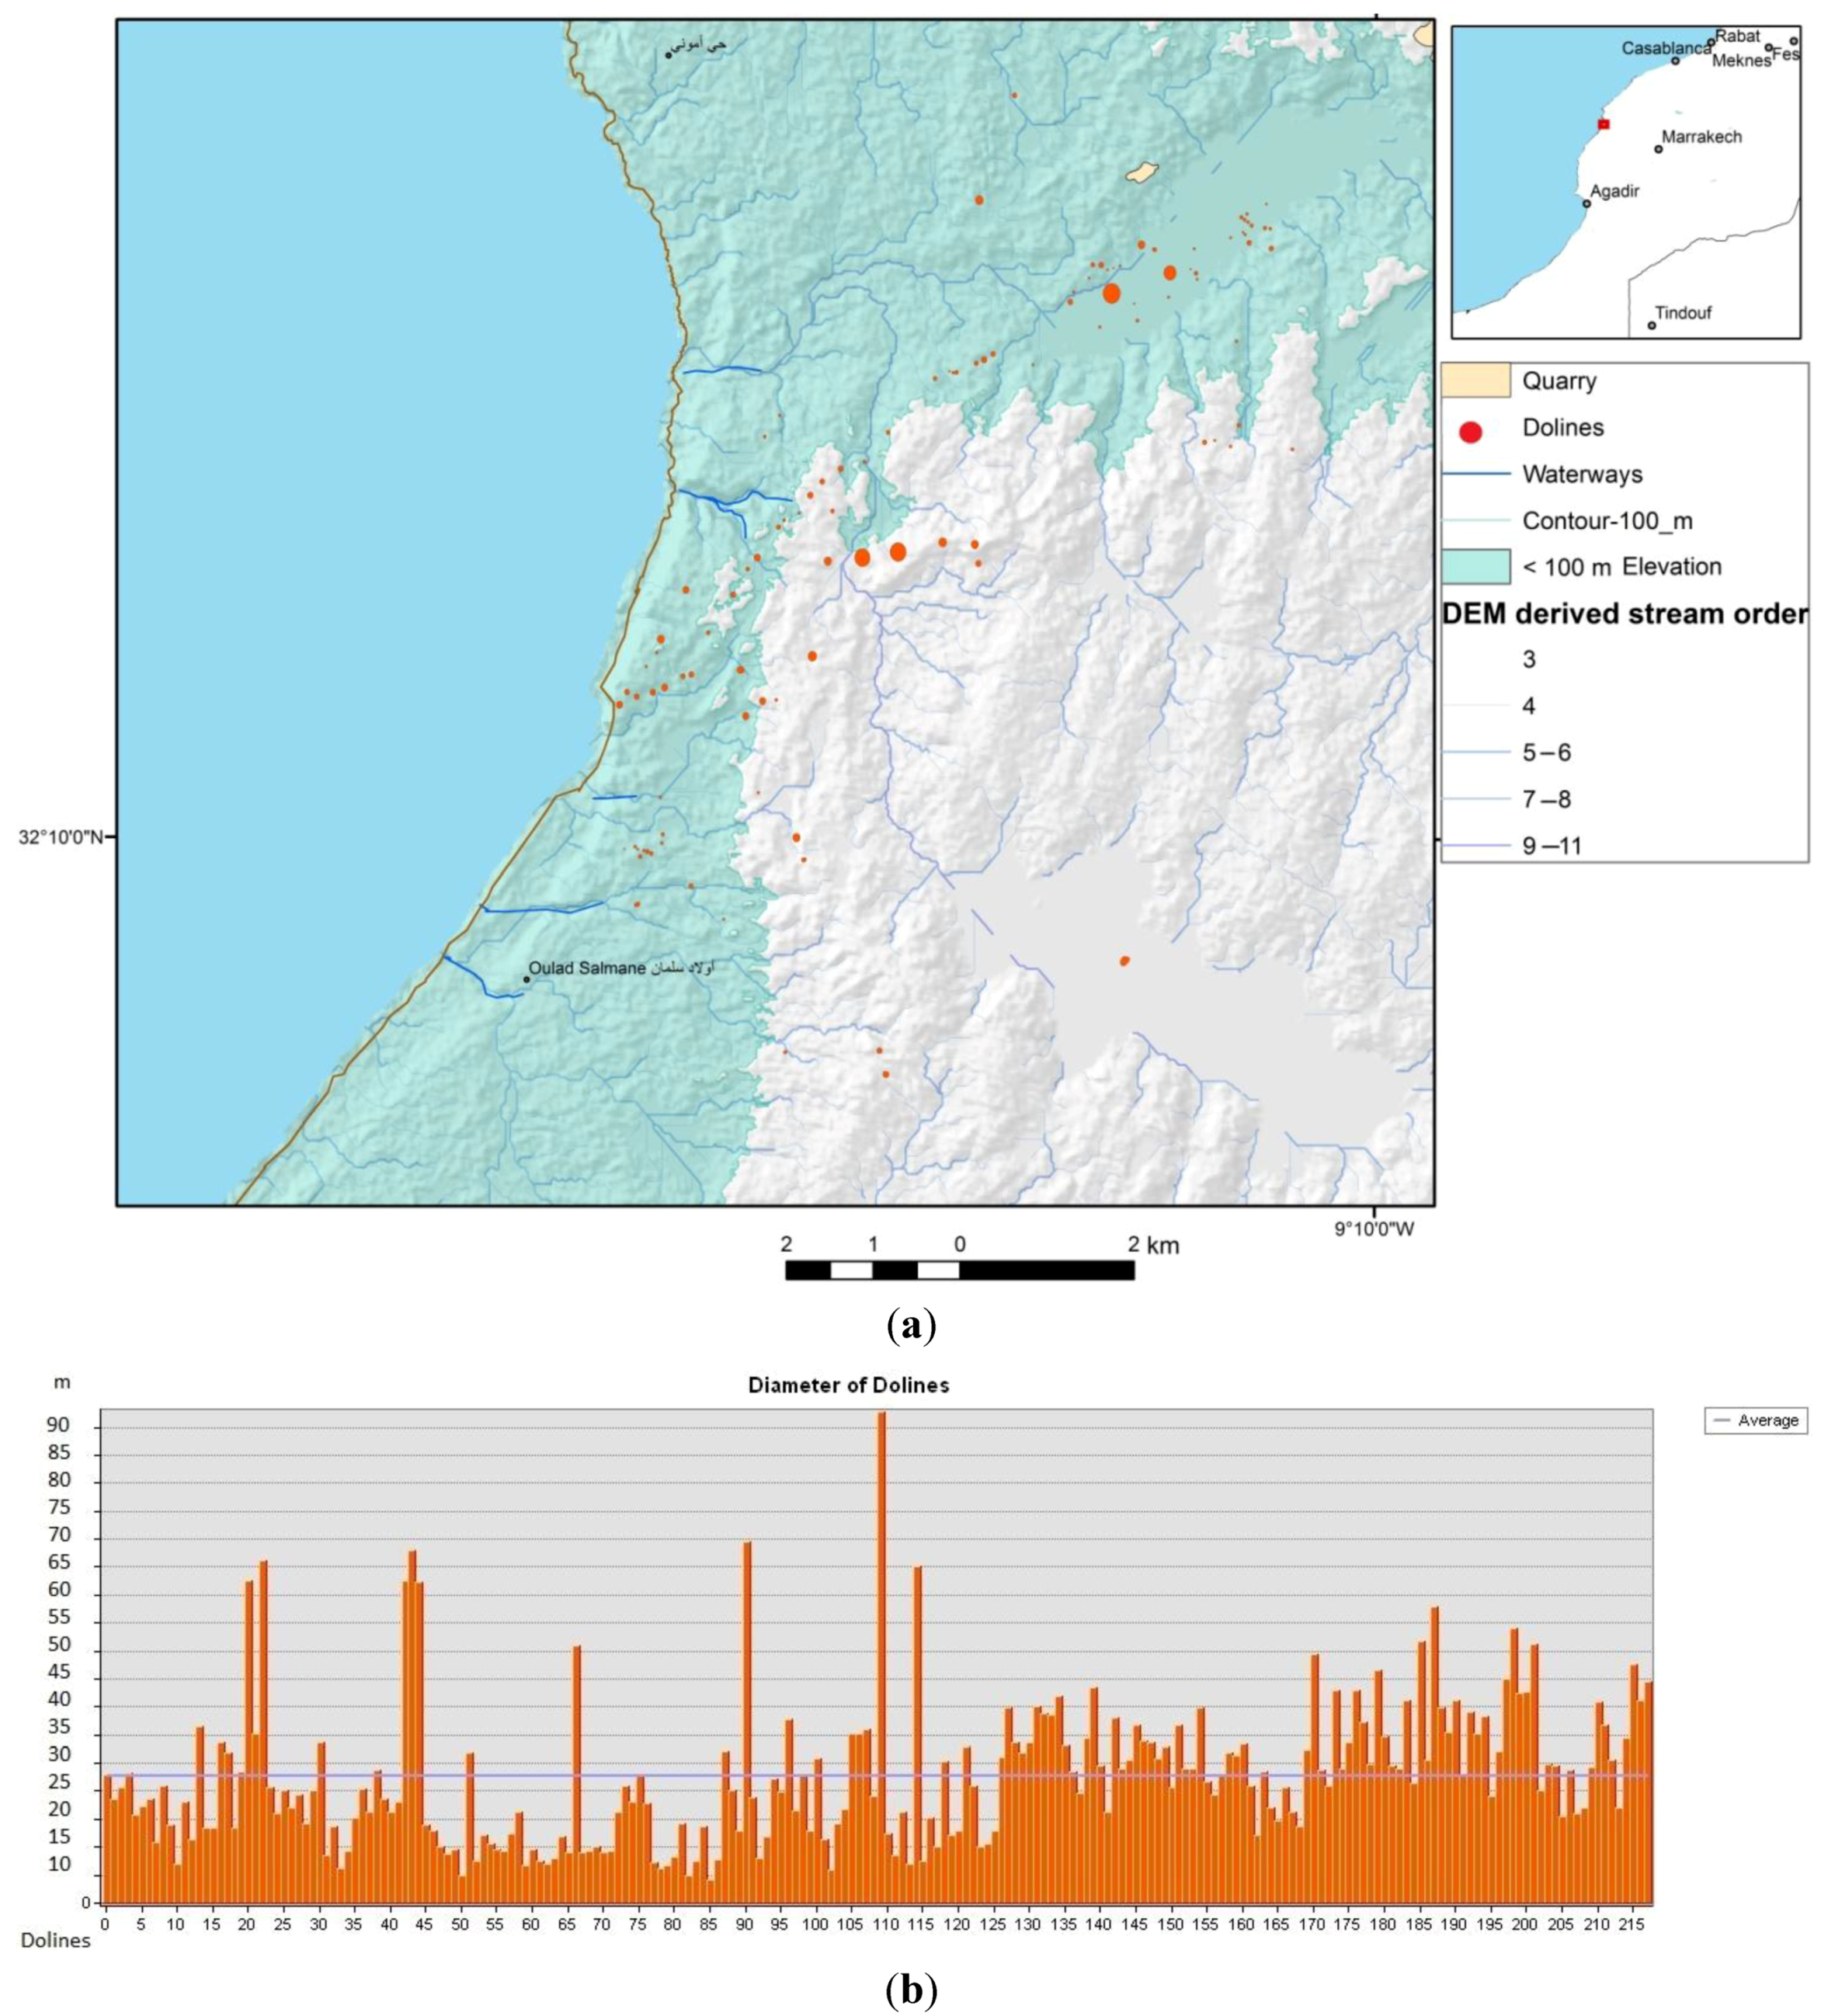
Figure 17 provides an overview of the sizes in the investigation area. The dolines and uvalas, occurring here as chains of smaller individual sinkholes, are usually circular and bowl-shaped and tens to hundreds of meters in diameter. However, most of them range from 15 to 50 m (
Figure 17b). Dolines and circular features with diameters below 30 m cannot be identified on ASTER GDEM data (about 30 m spatial resolution). Therefore, the automated processing tools based on the digital elevation model data within ArcGIS for the delineation of sinkholes, as proposed by [
21], cannot be used for their identification.
Figure 17.
(a) Sizes of visually-digitized dolines and circular features assumed to be dolines based on satellite images and (b) diagram of the diameter sizes of dolines. Each segment and number on the x-axis of the histogram presents one, single, digitized doline, whereas the y-axis presents the diameters in m.
As areas with higher soil moisture show characteristic spectral properties, they can be detected on images derived from water index calculations (
Figure 18). Thus, both the information of the morphometric disposition to higher surface water input and the higher soil moisture availability at a given acquisition time of the satellite data can now be combined.
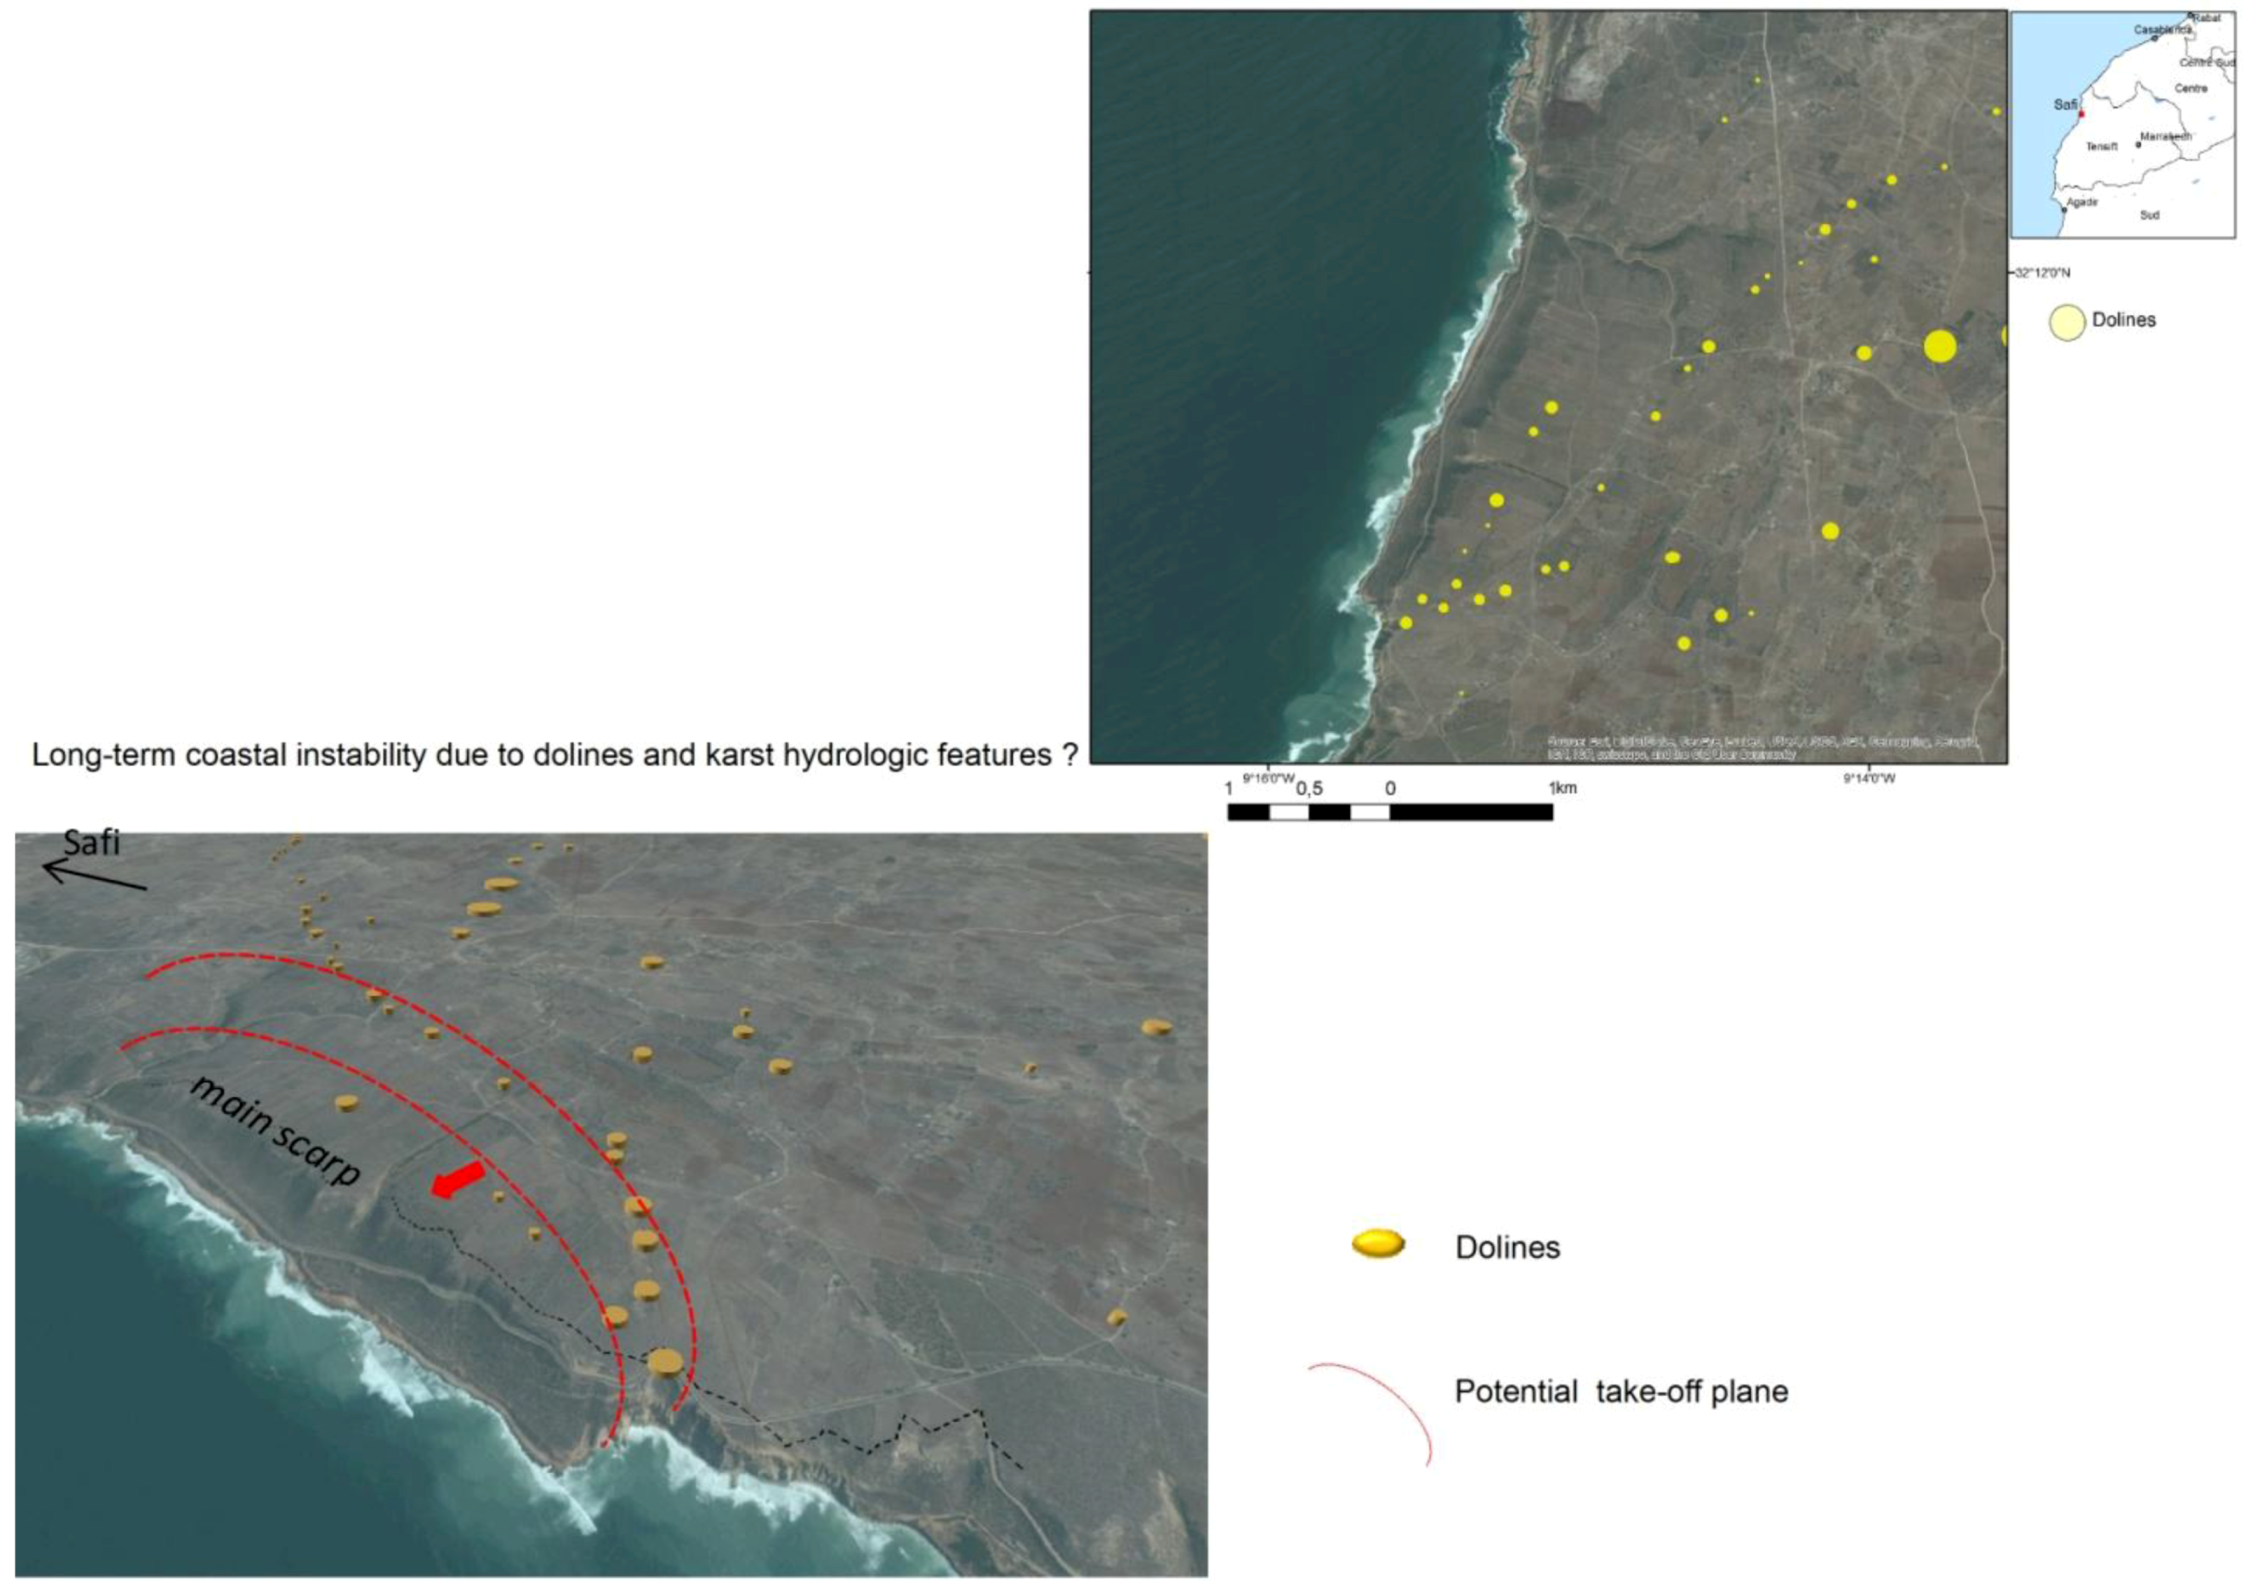
Figure 18.
Perspective 3D view of near-coast dolines in the south of Safi looking towards the NE.
Figure 18.
Perspective 3D view of near-coast dolines in the south of Safi looking towards the NE.
Perspective views of the near-coast areas merging DEM and high resolution satellite data visualize a nearly arc-shaped arrangement of the dolines in the south of Safi (
Figure 18). These arc-shaped zones of weakness might have a long-term influence on the stability of the slopes, especially during wet seasons. Stronger earthquakes could be another triggering factor, as well as on a long-term halotectonic and plate tectonic movements in this area.
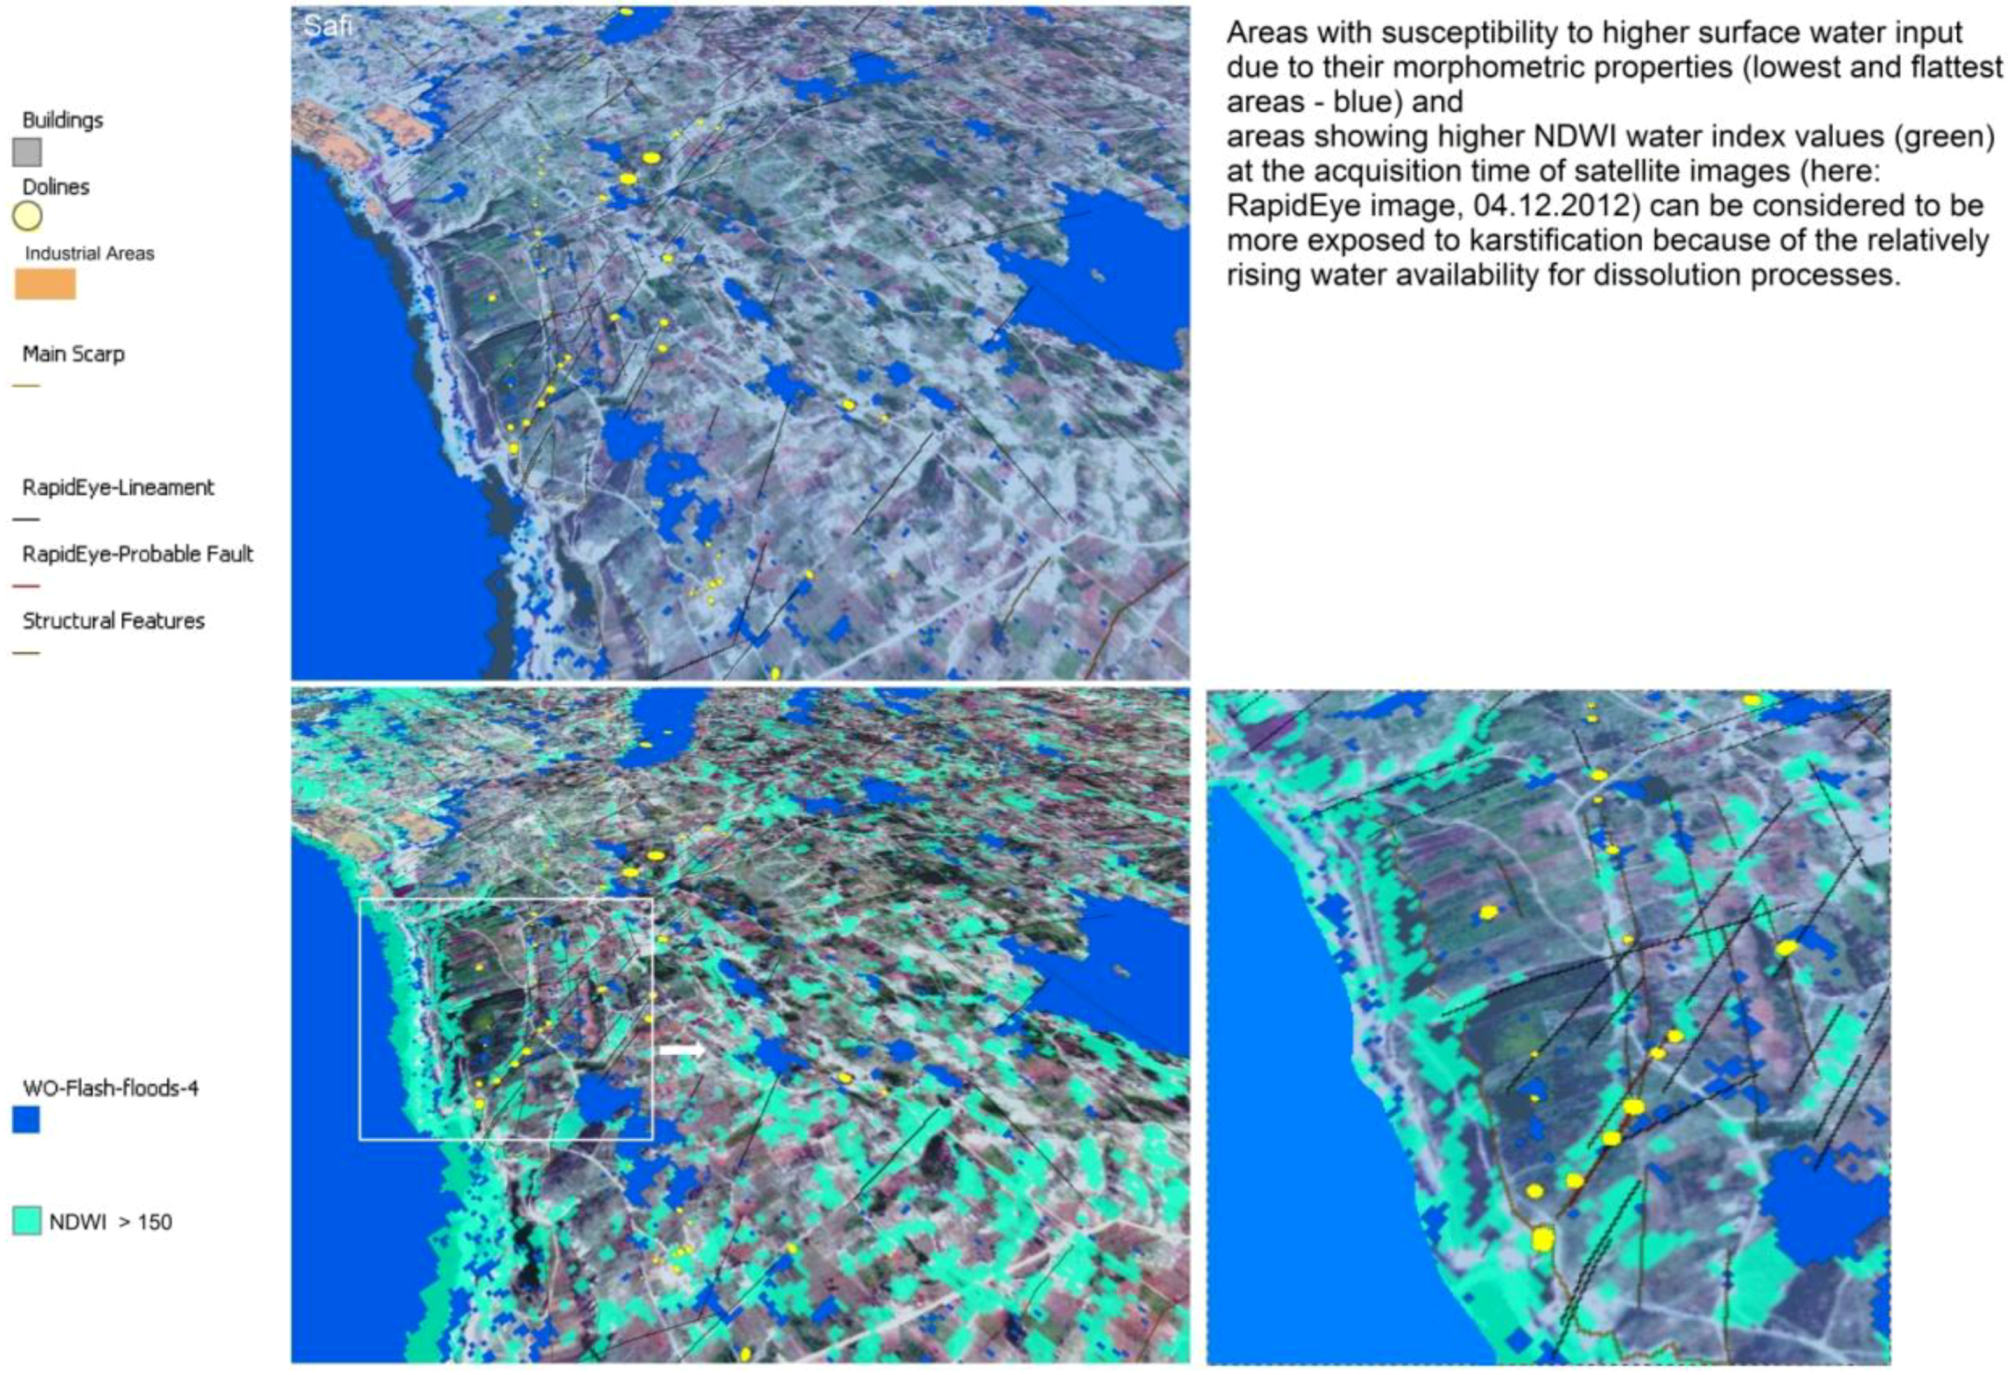
By combining the available information from the weighted overlay approach, the results of the NDWI-calculation with the extraction of higher NDWI values and the structural evaluations of the satellite data by mapping linear features (lineament analysis) in a perspective view of the same area, it becomes obvious that the arc-shaped, potential take-off zone is traced also by higher NDWI values (
Figure 19).
Figure 20 presents the merged results of the weighted overlay calculation (blue colors) and the extracted, higher NDWI values (green) derived from Landsat data. Areas with susceptibility to higher surface water input due to their morphometric properties (lowest and flattest areas: blue) and areas showing higher NDWI water index (green) at the acquisition time of the Landsat image are shown. Of course, it is necessary to monitor the NDWI values of a longer time sequence to get a more reliable overview of areas with higher surface water input.
Figure 19.
Higher NDWI values (green) calculated based on RapidEye data, indicating areas with higher soil moisture, combined with the weighted overlay results for the detection of areas susceptible to higher surface water flow (blue).
Figure 19.
Higher NDWI values (green) calculated based on RapidEye data, indicating areas with higher soil moisture, combined with the weighted overlay results for the detection of areas susceptible to higher surface water flow (blue).
Figure 20.
Combination of different approaches and results: merging weighted overlay results with extracted higher Landsat 8- NDWI values and structural analysis.
Figure 20.
Combination of different approaches and results: merging weighted overlay results with extracted higher Landsat 8- NDWI values and structural analysis.
6. Conclusions
The inventory of the karst landscape in the area in the south of Safi based on satellite and aerial imagery and ASTER DEM data and the DEM-derived evaluation of morphometric properties has led to the detection of karst-related phenomena.
When combining the results of the weighted overlay of morphometric factors influencing the susceptibility to relatively higher surface water input and flooding, the results of NDWI calculations and the extraction of higher NDWI values corresponding to relatively higher soil moisture, the results of the lineament analysis and the results of the inventory of dolines and sinkholes, a better understanding and visualizing of some of the different factors influencing the development of karst phenomena can be achieved.
The potential influence of dolines on the stability of coastal slopes is demonstrated. By systematically and continuously compiling this knowledge and available resources, by implementing the data into a widely accessible database and by raising awareness for this potential geohazard (subsurface instability), land use planning in this area can be supported.
