Communication

Review of the Electrical Conductivity Inside Mars Calculated Beneath the InSight Landing Site
Higher Polytechnic School, University of Almeria, 04120 Almeria, Spain
Geosciences 2026, 16(8), 336; https://doi.org/10.3390/geosciences16080336
Submission received: 13 July 2026 / Revised: 13 August 2026 / Accepted: 14 August 2026 / Published: 15 August 2026
(This article belongs to the Section Planetary Science and Astrobiology)

Abstract

The first electrical conductivity model determined beneath the InSight landing site is revisited in this study by performing a careful selection of magnetic records from the IFG dataset. This conductivity model is recalculated for the crust and the uppermost mantle (0–182 km depth), considering the data provided by this careful selection. In general, the present model shows a good agreement with synthetic models and other models calculated from magnetic data. In the present model, the conductivity of the crust is 0.0007 S/m, and the conductivity for the uppermost mantle coincides with that determined in the former paper. The crustal conductivity has been calculated for the first time beneath the InSight landing site. Better knowledge can be achieved when more accurate magnetic data are available.

1. Introduction

In a previous pioneer study, Corchete [1] performed the first determination of the electrical conductivity beneath the lander location of the Mars’ InSight mission. From the InSight fluxgate (IFG) magnetometer dataset (version v06), Corchete [1] calculated the first ratios BZ(f)/BH(f) determined at the Martian surface, where f is the frequency and (BZ(f), BH(f)) are the vertical-downward and the horizontal components of the magnetic field. The BH component is calculated from the BX (northward) and BY (eastward) magnetic field components, in the frequency domain. Unfortunately, these ratios were affected by a big error in their determination, due to many signals that have no Martian origin [2]. These artificial signals were recorded because the IFG magnetometer was used to characterize magnetic signals of any origin (artificial or natural). Thus, these undesirable signals produced by the lander (artificial magnetic field variations) were recorded by the IFG magnetometer. This artificial contamination required the removal of these undesirable variations (i.e., a calibration procedure [3]), and a ne5w calibrated data collection dataset (version v07) was produced, which is available from a public repository (see the data availability statement). However, after this calibration procedure, many remaining perturbations persist in the IFG dataset. In the present work, the previous study performed by Corchete [1] is revisited using the new calibrated collection (v07) to calculate a new conductivity model, which will be determined as a modification of that calculated by Civet and Tarits [4], and the new IFG dataset (v07) is carefully analyzed to discard the perturbed records by the persisting artificial signals.

2. Materials and Methods

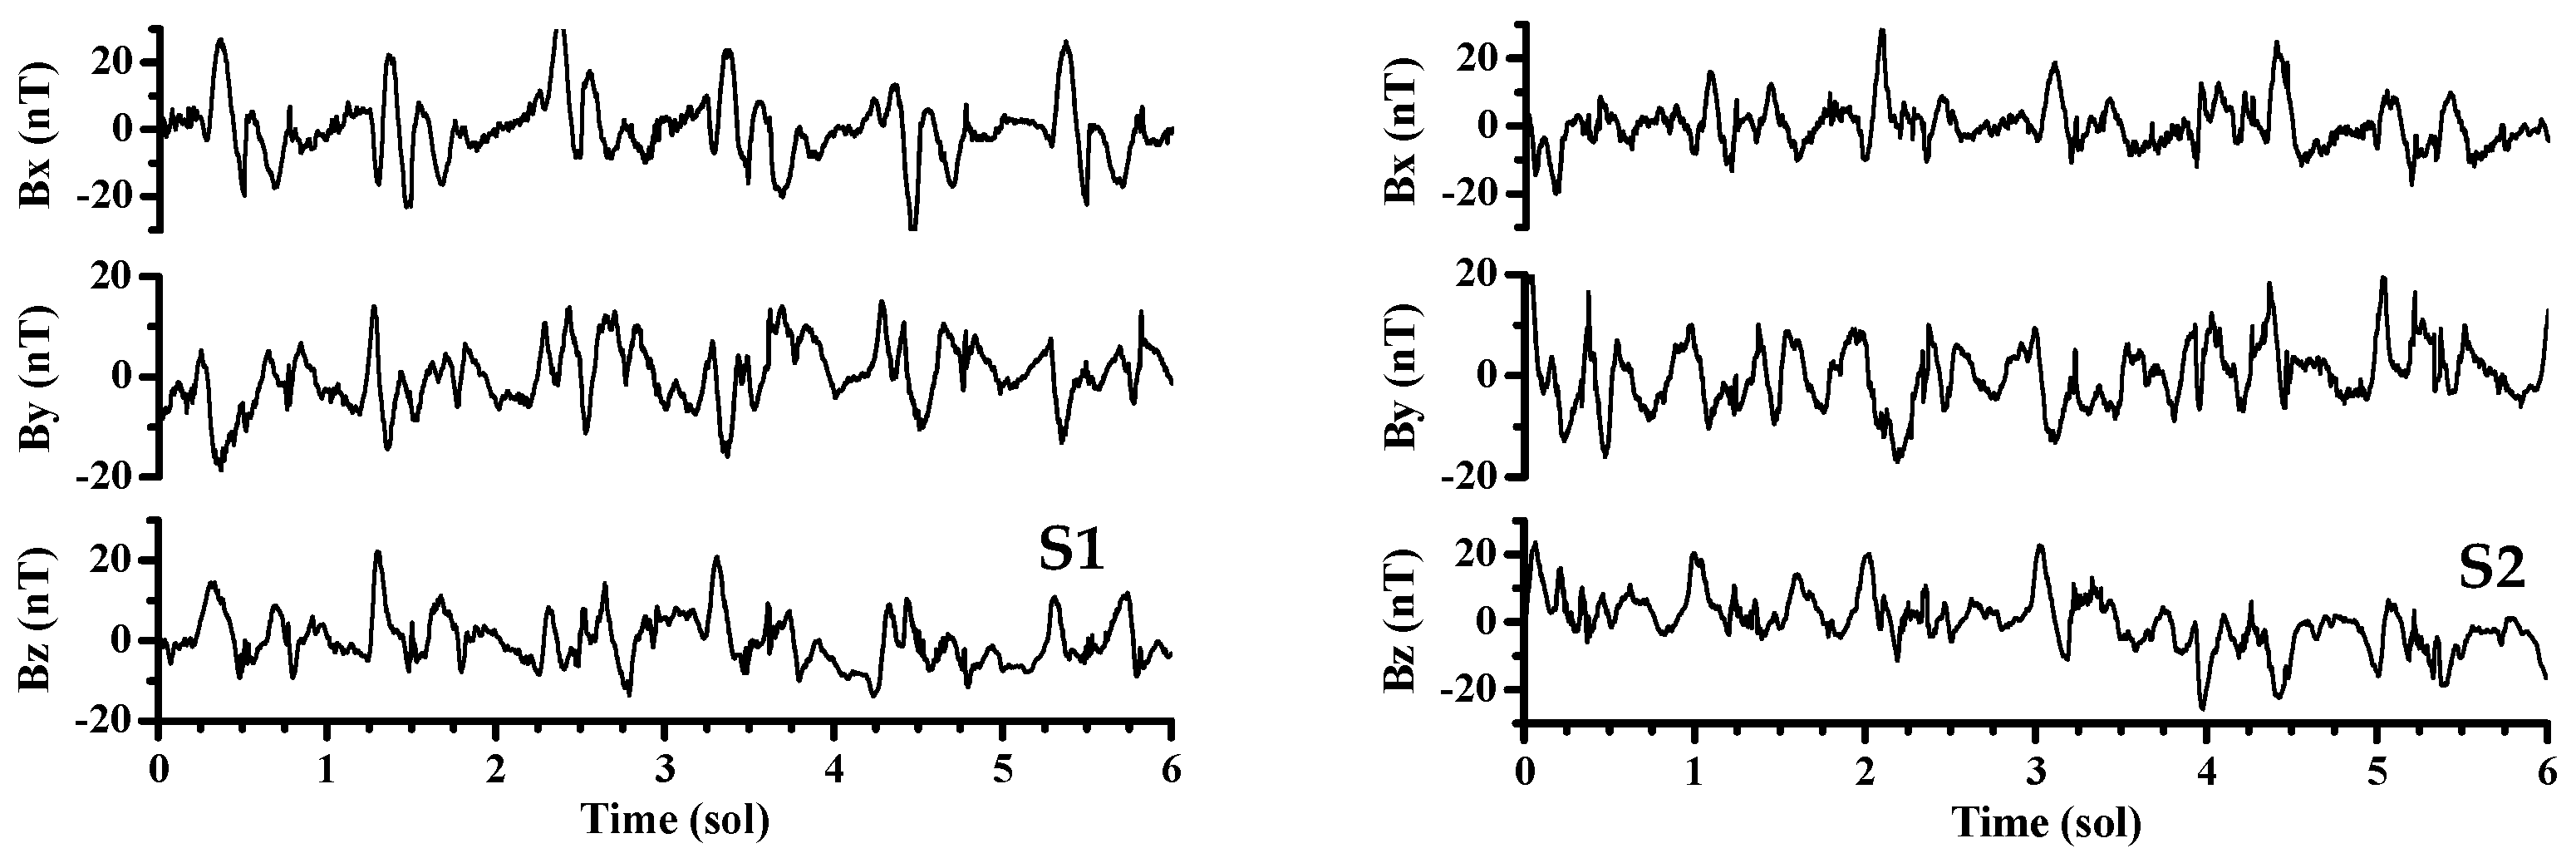
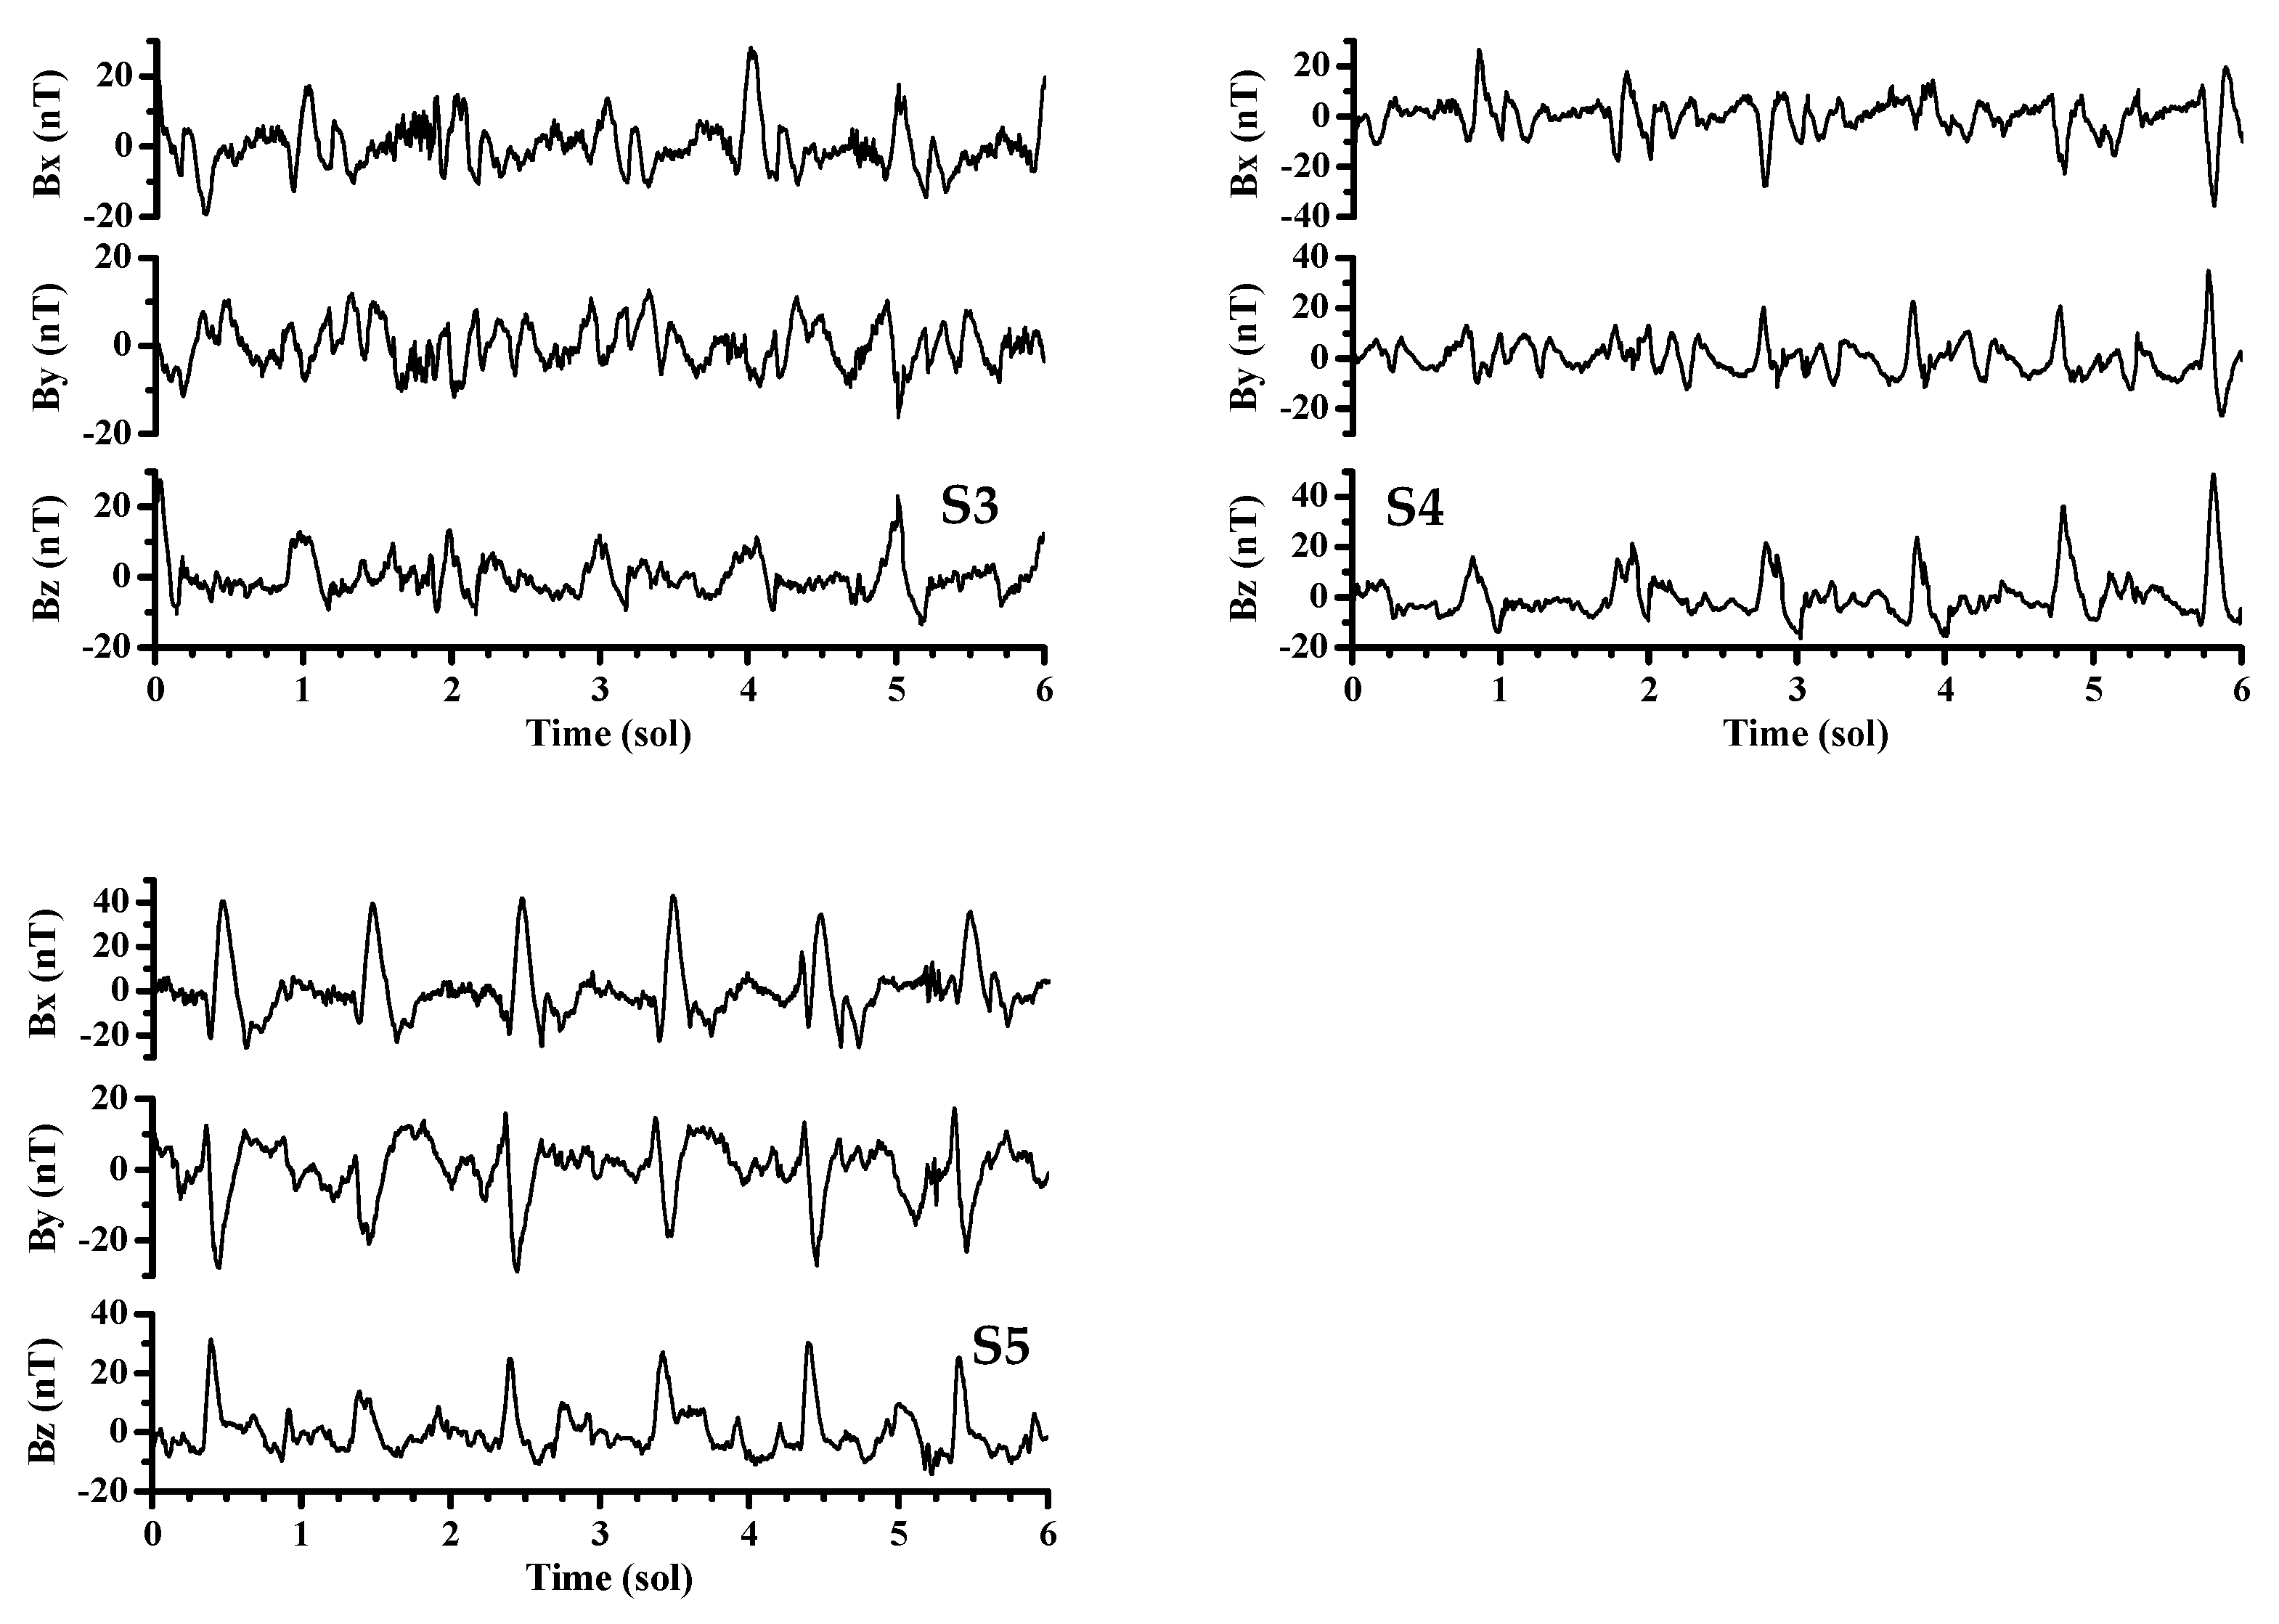
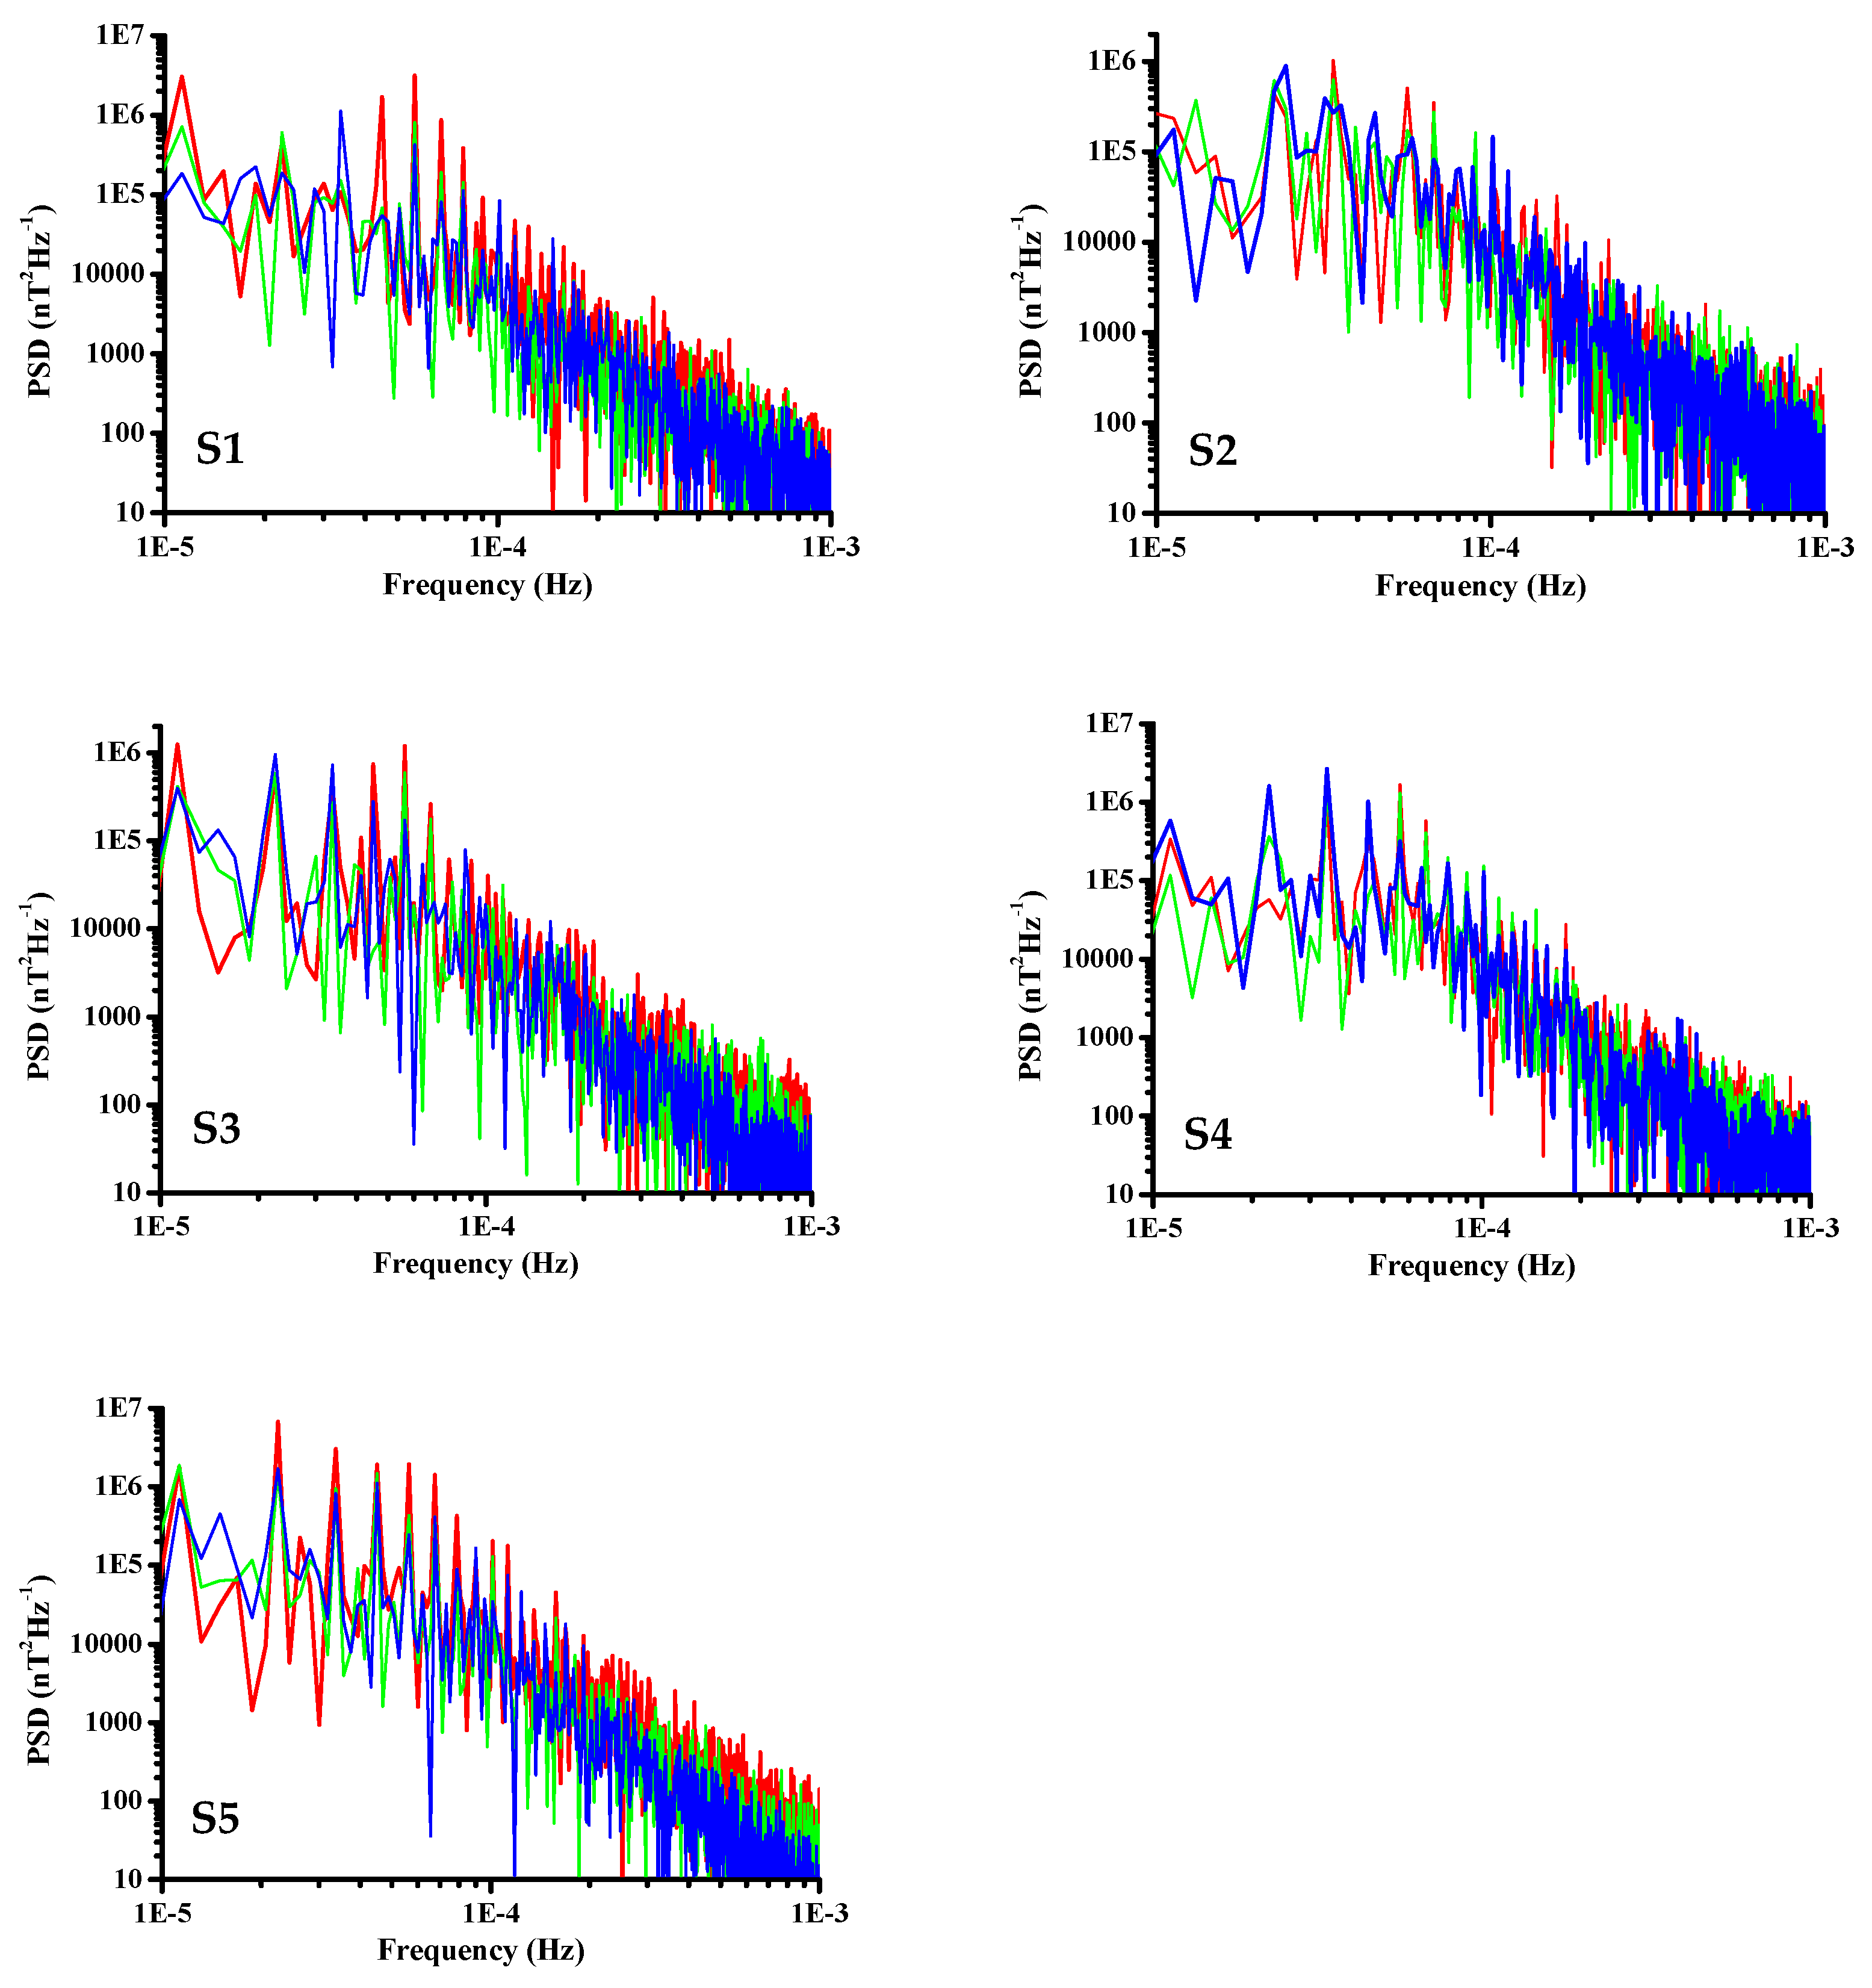
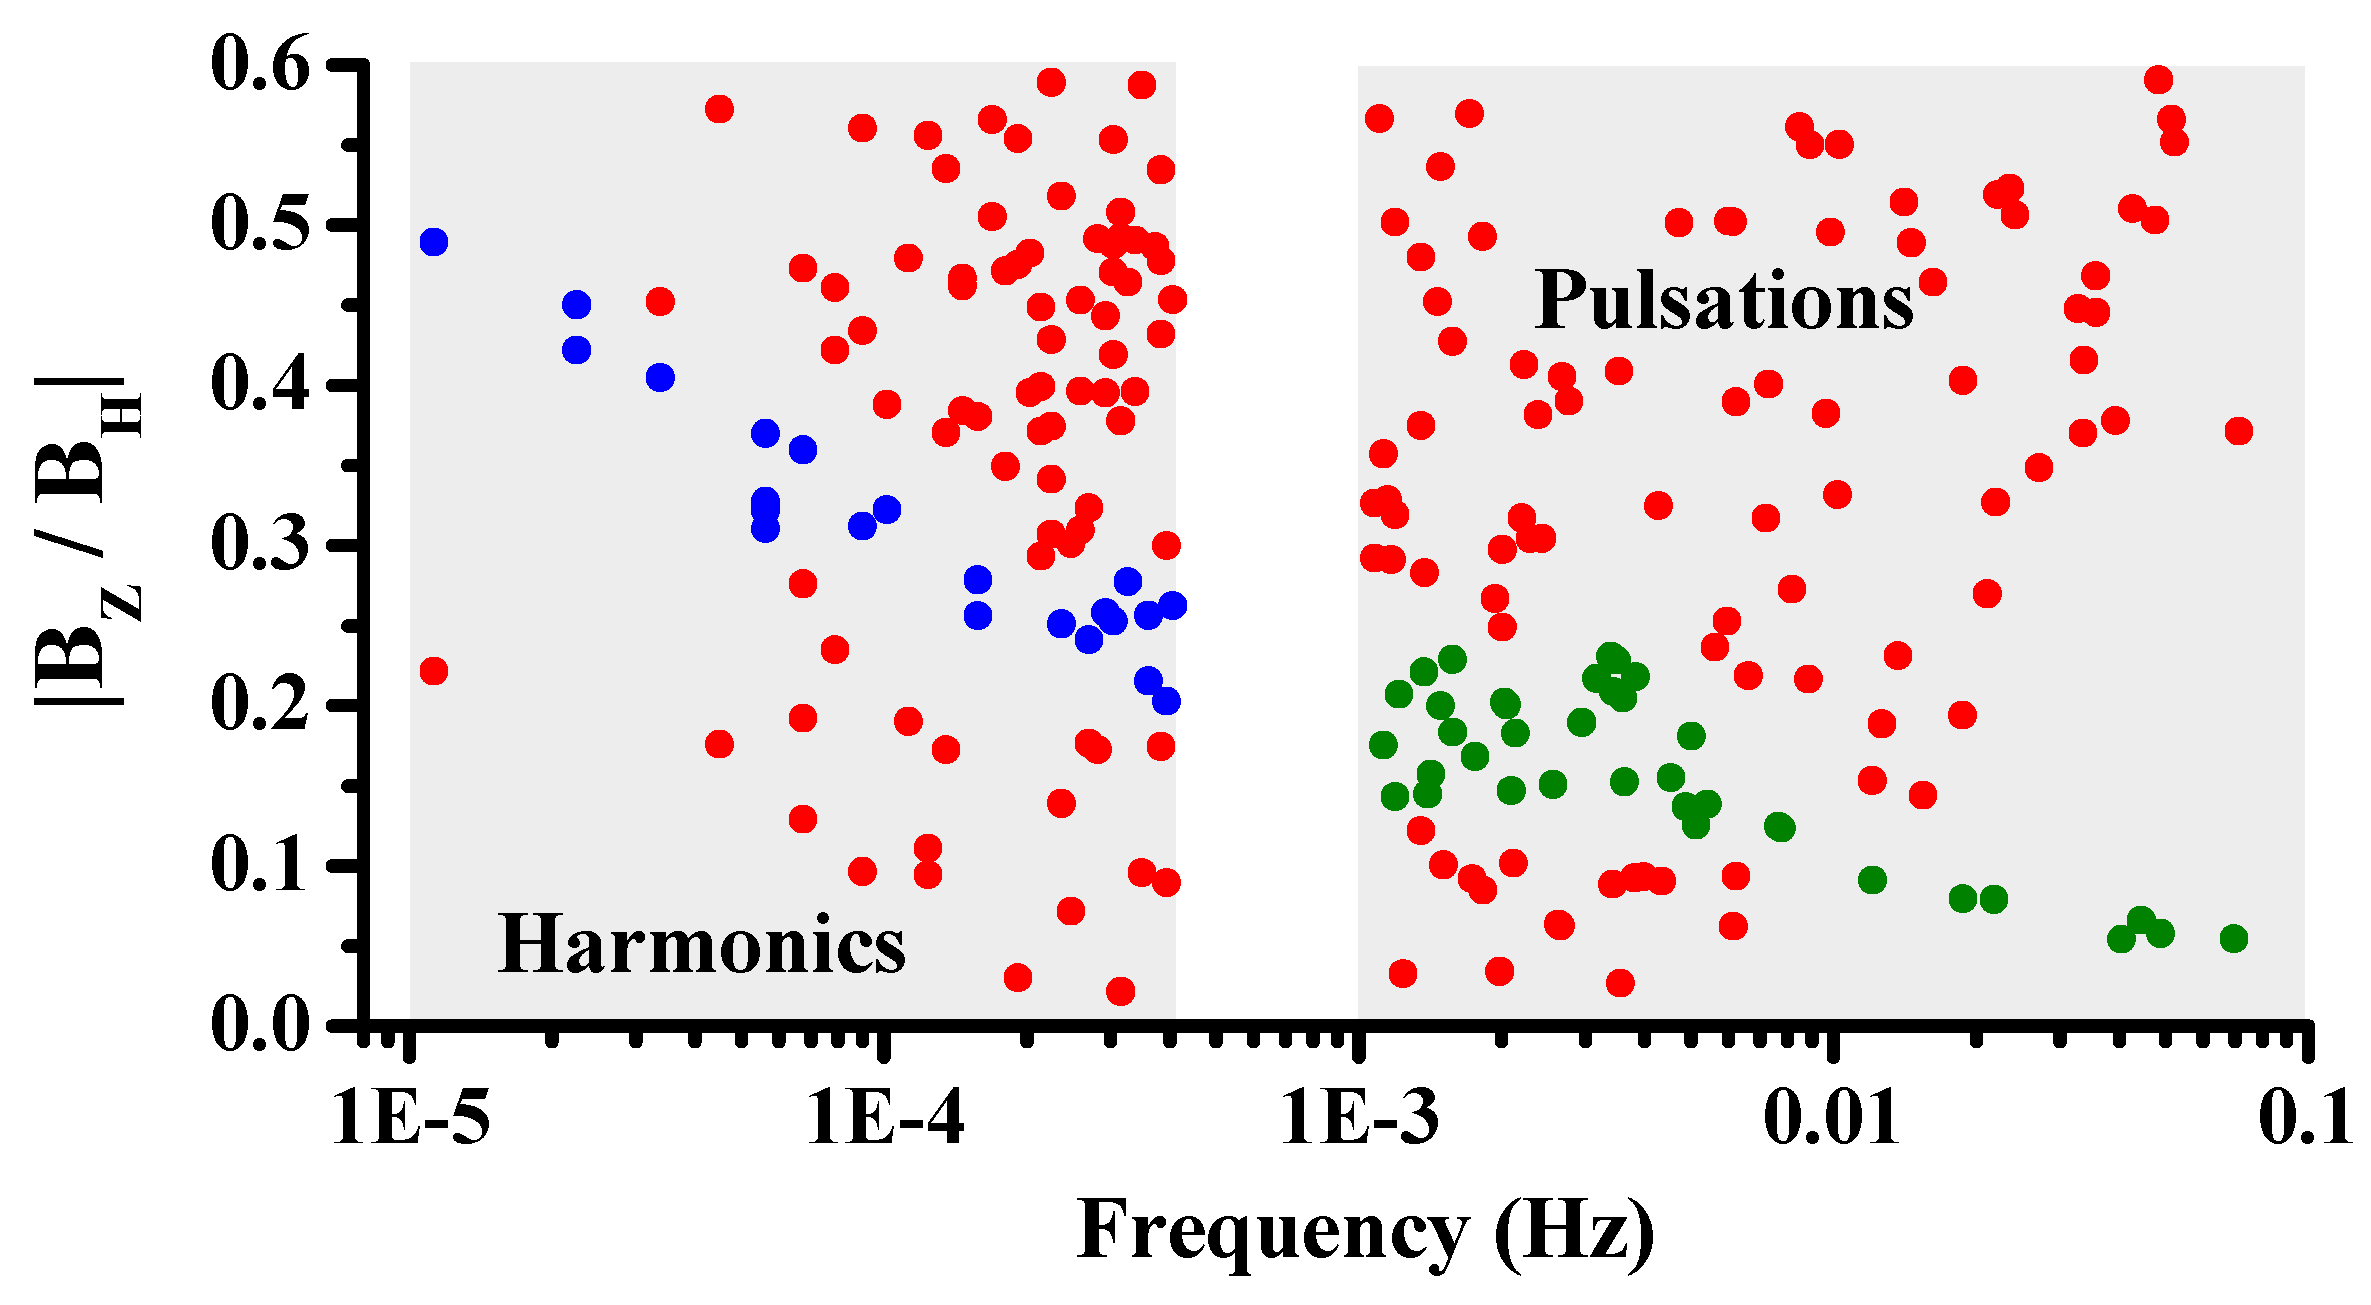
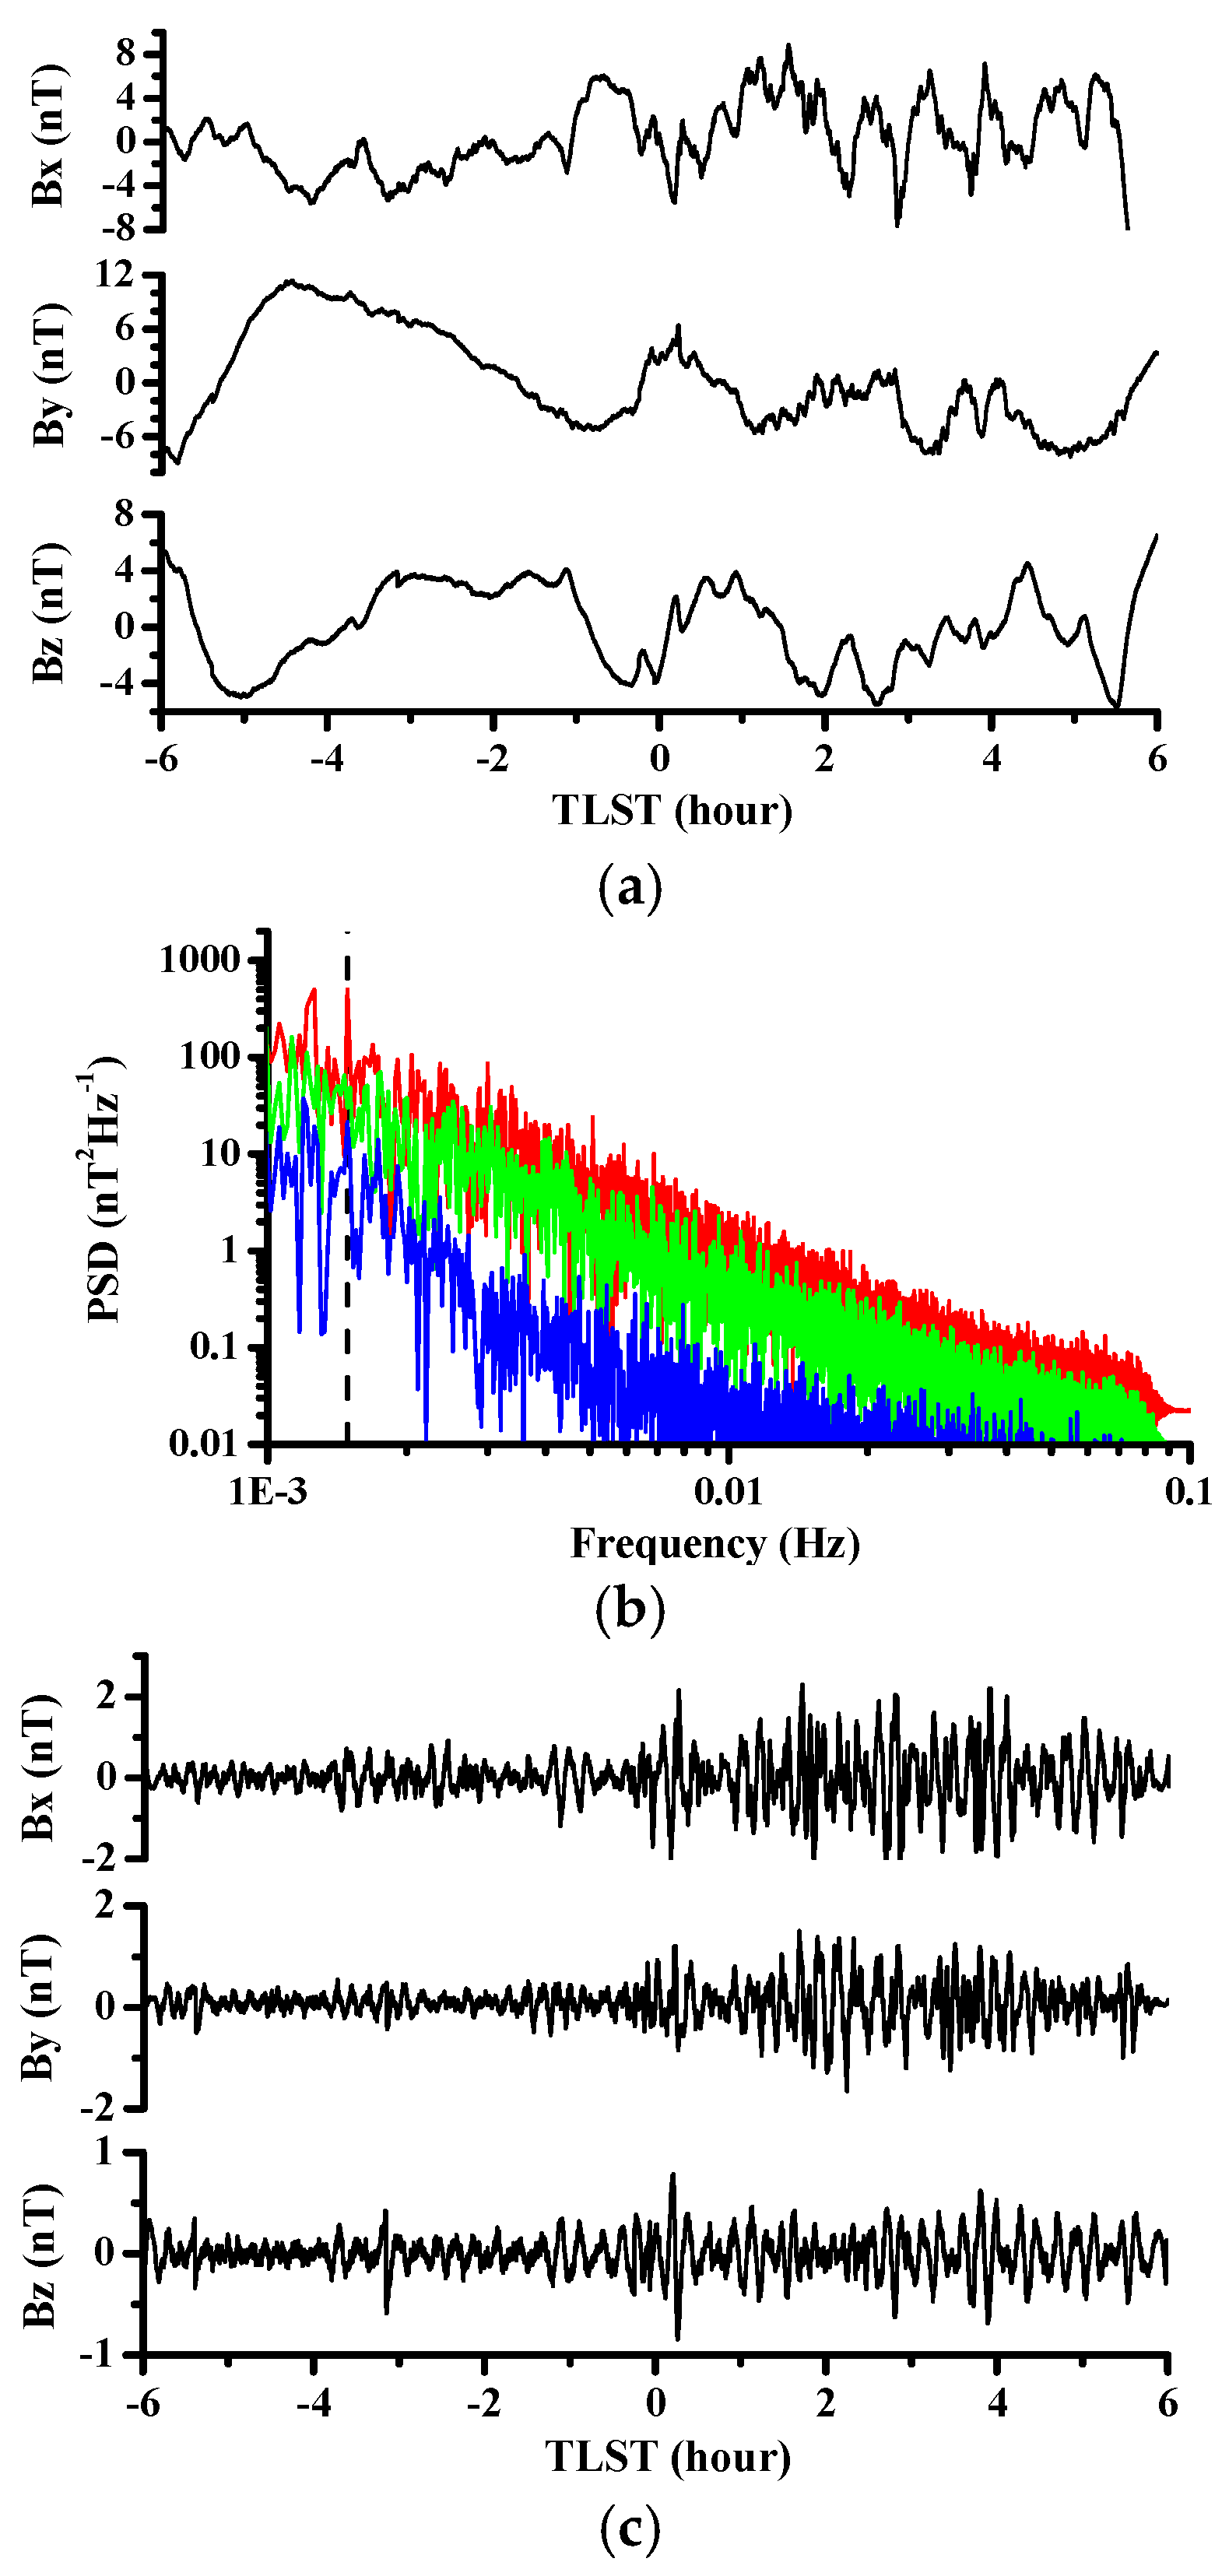
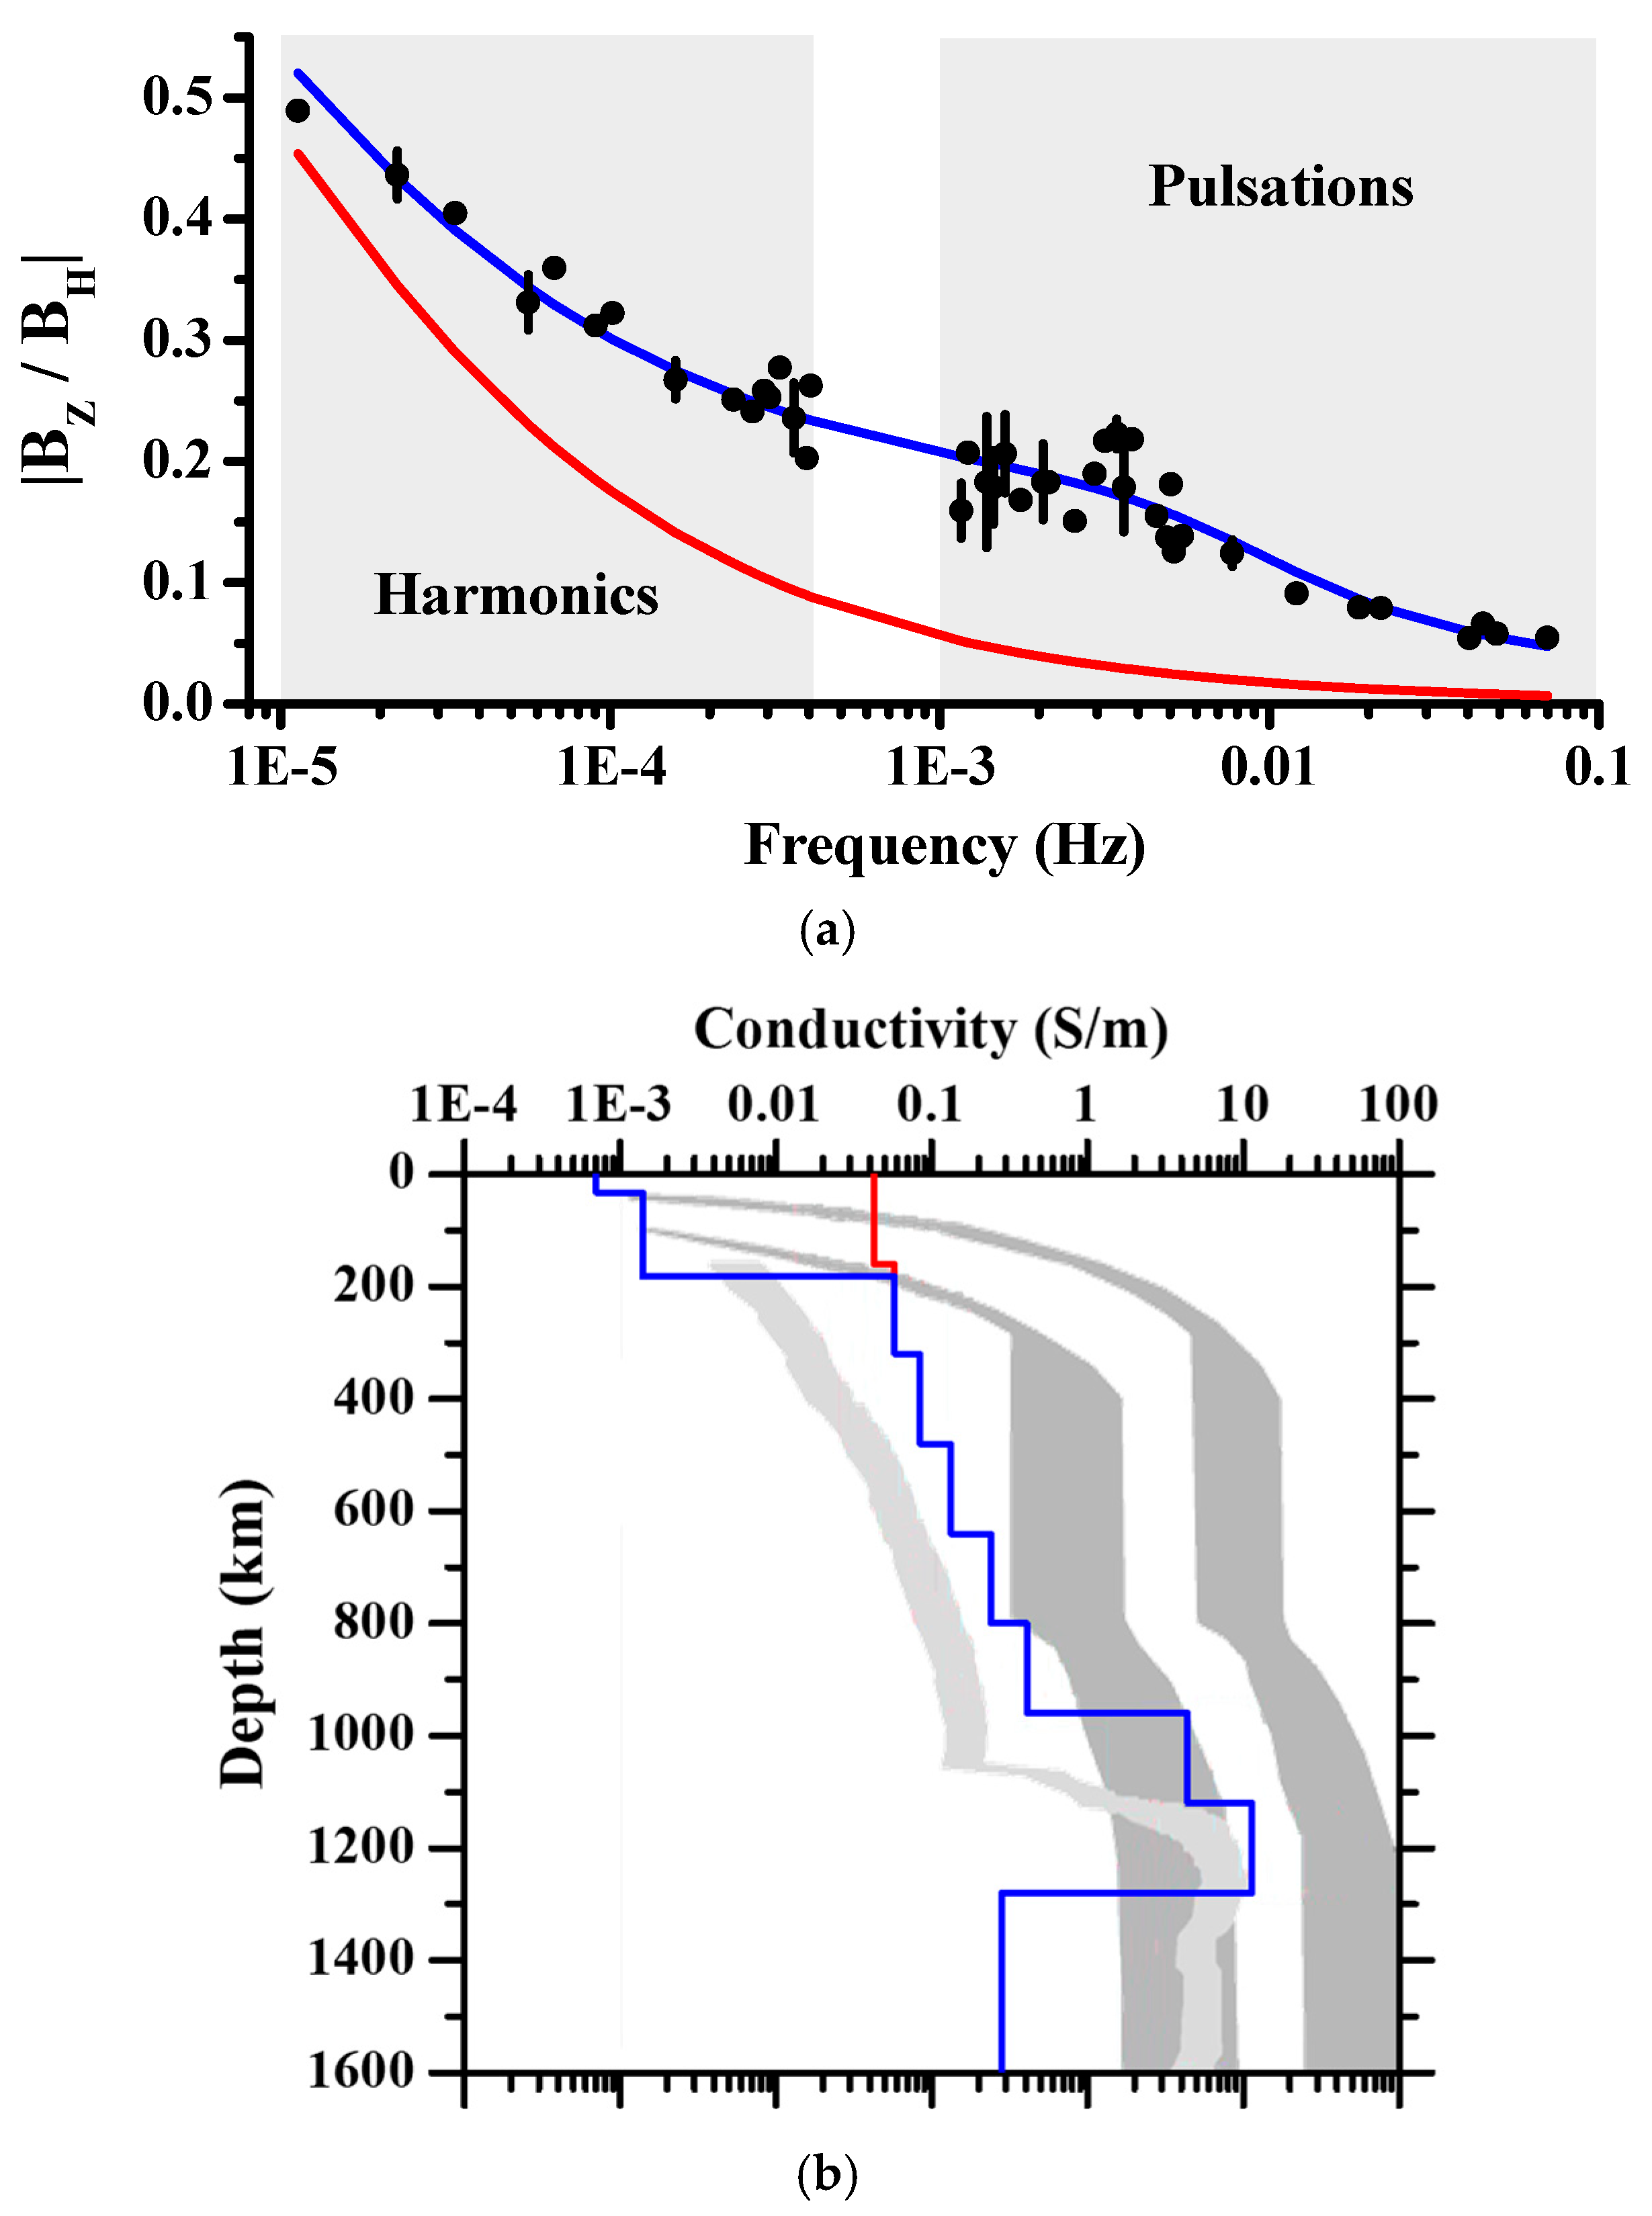
In the former study developed by Corchete [1], the daily variations in the Martian magnetic field and their harmonics were determined by analyzing the five longest time series of the IFG dataset for the three components: (BX, BY, BZ). The horizontal component (BH) was calculated in the frequency domain as B H = B X 2 + B Y 2 . In the present study, shorter time series (with six sol duration) have been considered for the calculation of these daily variations and their harmonics, to dispose of many time series and discard the more perturbed time series. In Supplement S1 are listed the five time series selected from a total of 60 six-sol time series, determined for the IFG dataset. Figure 1 and Figure 2 show these time series and their corresponding amplitude Fourier spectra. The ratios (BZ/BH) are determined in the frequency domain (Figure 3) from these amplitude spectra as described by Corchete [1]. In Figure 3, it can be observed that the ratios corresponding to frequencies of artificial signals are randomly distributed (red points), while those corresponding to Martian origin (blue points) show a clear pattern. The five selected time series (Supplement S1 and Figure 1) are the only time series that show this pattern, and the other time series (55 time series) are discarded for study. This ratios dataset (Figure 3, blue points) is completed with the ratios corresponding to the frequencies of the pulsations (Figure 3, olive points). These ratios are calculated by analyzing 503 time signals around the Martian midnight (18:00:00 to 6:00:00 of true local solar time (TLST)), and from these time series are selected only 85 time series (Figure 3, red and olive points), in which a sharp maximum of the amplitude spectrum is clearly visible. The ratios are calculated at the frequencies of these sharp maxima (Figure 3, red and olive points). For the pulsations, it is also observed that the artificial-signal ratios are aleatorily distributed (Figure 3, red points), while the nature-signal ratios (Figure 3, olive points) show a clear pattern. In Supplement S2, only the time series corresponding to the true pulsations are listed (Figure 3, olive points). Figure 4 shows an example of the analysis performed for the pulsations. The ratios corresponding to the total nature signals (Figure 3, blue and olive points) are considered as the observed data of this study, and they have been averaged for the same frequency (Figure 5a, black circles), determining the mean and standard deviations (Figure 5a, black vertical bars).

3. Results

The methodology described by Corchete [1] is used to calculate a model that fits the observed data (BZ/BH)ob (Figure 5a, black circles), with its theoretical curve (BZ/BH)th (Figure 5a, blue line), minimizing the difference between observed and theoretical data. This difference is calculated by means of an error (ε), defined as the root mean square (RMS) of the difference between the (BZ/BH)ob and the (BZ/BH)th. The theoretical curve is calculated from a model (Figure 5b, blue line), which is determined as a modification of that calculated by Civet and Tarits [4] (Figure 5b, red line), only tested/modified up to a depth of 182 km: the crust (0–32 km) and the uppermost mantle (32–182 km). The wavenumber k described by Corchete [1] is calculated with n = 3. The crustal thickness beneath the InSight landing site (Elysium Planitia) has already been estimated at 32 km [7]. The errors determined for the present model (ε = 0.022; Figure 5a, blue line) and for the former model (ε = 0.123; Figure 5a, red line) have very different values, with the present model being much more accurate than the former model.

4. Discussion

The present model (Figure 5b, blue line) shows excellent agreement with the conductivity models obtained by Mocquet and Menvielle [5] (Figure 5b, dark gray areas) and that determined by Vacher and Verhoeven [6] (Figure 5b, light gray area). In this study, the conductivity of the crust has been calculated for the first time (0.0007 S/m). Corchete [1] did not calculate the conductivity for the crust (it was assumed as 0.001 S/m [8]), because his observed data were only determined to a frequency of 0.02 Hz, while those were determined to a frequency of 0.07 Hz in the present study. Ruedas and Breuer [9] determined synthetic conductivity models in good agreement with the present model for the Martian crust. With respect to the uppermost mantle (32–182 km depth), the conductivity (0.0014 S/m) determined by Corchete [1] is confirmed in this study. Ruedas and Breuer [9] determined a high conductivity gradient very similar to the sharp discontinuity determined in this study (Figure 5b, blue line). However, a comparison of the present conductivity values with those determined by Ruedas and Breuer [9] is very difficult to perform in detail, because they did not determine conductivity values just beneath the InSight landing site; only Corchete [1] has developed a study of the Martian conductivity just beneath this site.

5. Conclusions

A careful selection of magnetic records from the IFG dataset is performed. From this selection, it is particularly interesting to list the magnetic records that contain true pulsations (Supplement S2), which have been measured for the first time on the Martian surface. The previous model determined by Civet and Tarits [4] has been modified from 0 to 182 km depth (crust and uppermost mantle), using the same methodology applied by Corchete [1], but now considering the new observed data that have been calculated after the above-mentioned careful selection. In general, the present model shows a good agreement with the conductivity models obtained in previous studies. However, a perfect comparison of the present conductivity values with those determined in previous studies, which did not determine just beneath the InSight landing site, cannot be performed in detail. The conductivity of the crust has been calculated for the first time (0.0007 S/m), and the conductivity for the uppermost mantle coincides with that determined by Corchete [1].

Supplementary Materials

The following supporting information can be downloaded at: https://www.mdpi.com/article/10.3390/geosciences16080336/s1, Supplement S1: The origin and final times of the six-sol data series of the magnetic field (Figure 1), selected to calculate the ratios (BZ/BH) at the frequencies corresponding to the diurnal period and its first 35 harmonics, Supplement S2: The data series around the Martian midnight (from 18:00:00 to 6:00:00 TLST) selected to calculate the ratios (BZ/BH) for the pulsations.

Funding

This research received no external funding.

Data Availability Statement

Acknowledgments

The InSight mission has provided the data used in this study.

Conflicts of Interest

The author declares no conflicts of interest.

References

  1. Corchete, V. Electrical conductivity inside Mars calculated beneath the InSight landing site. Geol. Acta 2026, 26, 1–7. [Google Scholar] [CrossRef] [Scilit]
  2. Mittelholz, A.; Johnson, C.L.; Thorne, S.N.; Joy, S.; Barrett, E.; Fillingim, M.O.; Forget, F.; Langlais, B.; Russell, T.C.; Spiga, A.; et al. The origin of observed magnetic variability for a sol on Mars from InSight. J. Geophys. Res. Planets 2020, 125, e2020JE006505. [Google Scholar] [CrossRef] [Scilit]
  3. Joy, S.P.; Mafi, J.N.; Slavney, S. Interior Exploration Using Seismic Investigations, Geodesy, and Heat Transport (InSight) Mission Insight Fluxgate Magnetometer (IFG) PDS Archive Software Interface Specification. Available online: https://pds.nasa.gov/ds-view/pds/viewBundle.jsp?identifier=urn%3Anasa%3Apds%3Ainsight-ifg-mars&version=2.0 (accessed on 10 July 2026).
  4. Civet, F.; Tarits, P. Electrical conductivity of the mantle of Mars from MGS magnetic observations. Earth Planets Space 2014, 66, 85. [Google Scholar] [CrossRef] [Scilit]
  5. Mocquet, A.; Menvielle, M. Complementarity of seismological and electromagnetic sounding methods for constraining the structure of the Martian mantle. Planet. Space Sci. 2000, 48, 1249–1260. [Google Scholar] [CrossRef] [Scilit]
  6. Vacher, P.; Verhoeven, O. Modelling the electrical conductivity of iron-rich minerals for planetary applications. Planet. Space Sci. 2007, 55, 455–466. [Google Scholar] [CrossRef] [Scilit]
  7. Smrekar, S.E.; Lognonné, P.; Spohn, T.; Banerdt, W.B.; Breuer, D.; Christensen, U.; Dehant, V.; Drilleau, M.; Folkner, W.; Fuji, N.; et al. Pre-mission InSights on the Interior of Mars. Space Sci. Rev. 2019, 215, 3. [Google Scholar] [CrossRef] [Scilit]
  8. Johnson, C.L.; Mittelholz, A.; Langlais, B.; Russell, C.T.; Ansan, V.; Banfield, D.; Chi, P.J.; Fillingim, M.O.; Forget, F.; Haviland, H.F.; et al. Crustal and time-varying magnetics fields at the Insight landing site on Mars. Nat. Geosci. 2020, 13, 199–204. [Google Scholar] [CrossRef] [Scilit]
  9. Ruedas, T.; Breuer, D. Electrical and seismological structure of the Martian mantle and the detectability of impact-generated anomalies. Icarus 2021, 358, 114176. [Google Scholar] [CrossRef] [Scilit]
Figure 1. Representation of the data series listed in Supplement S1.
Geosciences 16 00336 g001aGeosciences 16 00336 g001b
Figure 2. The power spectral density (PSD; BX (red), BY (green), BZ (blue)), determined for the data series shown in Figure 1.
Geosciences 16 00336 g002
Figure 3. The values of the ratios (BZ/BH) determined from the amplitude spectra of the six-sol data series (red and blue points) and the pulsations (red and olive points). The term |BZ/BH| denotes that the complex quantity (BZ/BH) is calculated in amplitude. The values that show a clear pattern are denoted in blue and olive. The red points denote the ratios corresponding to artificial signals.
Geosciences 16 00336 g003
Figure 4. (a) The time series #6 (BX,BY,BZ) listed in Supplement S2. (b) The PSD determined for (a): BX (red), BY (green), BZ (blue). The vertical dashed line (black) denotes the frequency of the pulsation (0.0015 Hz). (c) The time series determined after a high-pass filter of (a), at the frequency of 0.001 Hz.
Geosciences 16 00336 g004
Figure 5. (a) Fitting of the observed data (circles) achieved by the theoretical data (blue line), calculated from the present model plotted (b, blue line). The term |BZ/BH| denotes that the complex quantity (BZ/BH) is calculated in amplitude. The vertical bars denote standard deviation. The theoretical data corresponding to the model of Civet and Tarits [4] (red line) are plotted for comparison. (b) The electrical conductivity determined in this study (blue line) is compared with that calculated by Civet and Tarits [4] (red line). The theoretical conductivity models determined by Mocquet and Menvielle [5] (dark gray areas) and Vacher and Verhoeven [6] (light gray area) are also shown for comparison.
Geosciences 16 00336 g005
Disclaimer/Publisher’s Note: The statements, opinions and data contained in all publications are solely those of the individual author(s) and contributor(s) and not of MDPI and/or the editor(s). MDPI and/or the editor(s) disclaim responsibility for any injury to people or property resulting from any ideas, methods, instructions or products referred to in the content.