Article

A Geochemical Study of Near-Shore Sediment Cores from Utah Lake, UT, USA

by
Jacob B. Taggart
,
Lauren M. Woodland
,
Kaylee B. Tanner
and
Gustavious P. Williams
*
Department of Civil & Construction Engineering, Brigham Young University, Provo, UT 84602, USA
*
Author to whom correspondence should be addressed.
Geosciences 2025, 15(9), 363; https://doi.org/10.3390/geosciences15090363
Submission received: 4 June 2025 / Revised: 9 September 2025 / Accepted: 11 September 2025 / Published: 15 September 2025

Abstract

Several sediment core studies have been performed on Utah Lake over the past century, with recent studies providing detailed depositional history based on shallow core samples. To offer additional coverage, we collected 10 deeper sediment cores that extended at least 140 cm below the sediment–water interface from various locations across the lake and analyzed them for ICP-OES detectable elements, fractional calcium carbonate, and loss on ignition (as a proxy for fractional organic matter). Despite high water levels and equipment limitations restricting us to near-shore areas, our samples effectively represented the lake. Our findings revealed significant chemostratigraphic variability, indicating non-homogeneous lakebed sediment. Elements with higher min–max normalized mean concentrations showed strong correlations. Depth trends in the sediments indicated positive correlations for Mn, Al, Fe, K, and V, and negative correlations for Ba, Cu, Pb, Sr, and Zn, with P showing variable correlations. Some of our multidimensional scaling results exhibited geochemical shifts at 30–40 cm, supporting claims that this depth marks the onset of European settlement. Elevated Pb levels in the upper sediment layers are likely the result of mid-20th century leaded gasoline pollution. Sediment P is linked to Ca, Fe, and trace metal pollutants, suggesting both natural processes and human activities influence elemental distribution, though only a few cores showed P changes aligning with European settlement.

1. Introduction

1.1. Study Motivation

Of the various techniques used for paleolimnological research, sediment core collection has proven to be an invaluable means of revealing a lake’s environmental and depositional history. In comparison to seismic imaging and ground penetrating radar which are used to broadly characterize a lake’s stratigraphy and bathymetry, sediment cores are the principal method for determining the biogeochemical properties of lakebed sediment and characterizing how lake conditions have changed throughout time [1].
Despite the large quantity of data that can be extracted from a single sediment core, the spatially heterogenous nature of lakebed sediment necessitates the collection of numerous sediment cores from different areas to adequately represent an entire lake. This is especially true for large lakes as their size makes them prone to localized impacts from anthropogenic and physiographic phenomena. As such, Last and Smol [2] recommend collecting a minimum of five to ten core samples to generate representative sediment profiles for a lake.
Over the past century, a variety of paleolimnology studies have been performed on Utah Lake sediments, including several which indicate that the lake experienced an ecological regime shift beginning in the mid-to-late 19th century, coincidental to the onset of European settlement in the area [3,4,5,6,7,8,9,10,11,12,13,14,15]. For example, Brahney [14] and King et al. [15] reported that prior to European settlement, Utah Lake supported extensive macrophyte beds as evidenced by macrophyte eDNA, gastropod remains, and photopigments, suggesting less turbid conditions than those observed today. Modeling by Brothers et al. [10] likewise indicated that historical mean Secchi depths of ~1 m would have allowed significant macrophyte communities to stabilize sediments and reduce resuspension, compared to modern averages near ~0.2 m. These findings, coupled with historical accounts of clearer conditions in parts of the lake [7], support the idea that the introduction of carp and lake management practices in the late 1800s triggered a shift to a more turbid, phytoplankton-dominated system [10,12,14,15,16].
While phosphorus (P) is known to play a prominent role in the productivity of aquatic environments, a fairly small number of paleolimnological studies have measured the concentration of P in Utah Lake sediment cores [5,11,12,13,14]. These existing studies presented high-resolution analyses of multiple variables on a small number (n ≤ 4) of relatively shallow core samples, with analytical costs likely prohibiting the collection and assessment of additional samples or deeper cores. Most of these studies included core samples from semi-isolated portions of the lake, such as Provo Bay and Goshen Bay. This consequently left only one or two core samples from each study to represent the main body of Utah Lake, leading to a significant over-representation of the isolated bays compared to the much larger lake area. With the exception of Bolland [5], the sediment depths of these core samples were all less than one meter.
A further limitation encountered in previous work concerns sediment chronology. Estimates of sedimentation rates in Utah Lake have varied widely, from ~3 cm/year in the early 20th century [5,6] which was later amended to ~1–2 mm/year in long-term reconstructions [7,8,9]. More recent efforts using 210Pb, 137Cs, and 14C have faced challenges due to sediment resuspension, low fallout rates, and reservoir effects, leading Williams et al. [13] and others to conclude that precise dating is problematic in Utah Lake. Nevertheless, there is broad agreement that sediments deeper than ~30–40 cm predate European settlement [13], making depth a pragmatic age proxy consistent with prior studies.
Other investigations of sediment phosphorus provide various perspectives on its sources and behavior. Abu-Hmeidan et al. [17] found no significant difference in total phosphorus between lacustrine and geologic sediments, concluding that Utah Lake’s large natural phosphorus reservoir may limit the influence of external loadings. Additionally, Randall et al. [18] reported that nearly half of sediment P is bound to redox-sensitive Fe minerals, meaning that under reducing conditions, substantial P release to the water column is possible. Devey [12] further observed marked increases in CaCO3-bound P in Goshen Bay sediments, consistent with human activity in the last century. Williams et al. [13] found modest increases in TP in deep-water core sediments but noted elevated TP concentrations in Goshen and Provo Bays, attributing these increases to nutrient loading from anthropogenic sources starting in the early 1900s, especially near wastewater treatment plants. At the same time, Taggart et al. [19] similarly suggested that the lake functions as a buffered sorption system, complicating efforts to attribute P trends solely to external loadings. This ongoing discussion highlights the importance of spatially distributed, deeper cores to better distinguish anthropogenic influences from natural background processes.
Given Utah Lake’s large area, we sought to provide a more balanced representation of sediments throughout the lake by collecting 10 deeper sediment cores. We obtained our geochemical data by analyzing our core samples for 25 ICP-OES detectible elements, fractional calcium carbonate (CaCO3), and loss on ignition (LOI) as a proxy for fractional organic matter (OM). These cores, which ranged from a depth of 140 to 240 cm below the sediment water-interface, were intentionally deep enough to include pre-settlement deposits found below 30–40 cm deep, which is the depth associated with the arrival of European settlement, as determined by previous Utah Lake sediment core studies [13,14,15]. Because the arrival of European settlers is the only age-constraining event referenced in our study, we used sediment depth as a proxy for age and noted when significant geochemical trends occurred above or below the 30–40 cm depth range. In the absence of direct age-dating capabilities, the use of sediment depth as a proxy for age represents a practical and widely accepted approach, consistent with methodologies employed in comparable sediment core studies. We hypothesize that while European settlement may have influenced Utah Lake sediments to some extent, certain lakebed features, such as sediment P profiles, are more likely dominated by natural processes and not significantly impacted by European settlement [17,18,19].
Throughout this paper, “depth” refers to depth below the sediment–water interface unless otherwise specified. “Length” refers to the physical length of a sediment core, which differs from the original sediment depth due to core shortening, which occurred during the retrieval process. When referring to water column depth, we explicitly use the term “water depth”.

1.2. Background on Utah Lake

Utah Lake is a semi-terminal, basin-bottom lake in north-central Utah, USA. Despite its large surface area (~380 km2), Utah Lake is relatively shallow (~3 m) [19,20,21,22]. Fluctuations in storage consequently result in a highly dynamic shoreline, as a water depth change of 30 cm can alter the lake’s surface area by over 10 km2 [22].
Since the formation of Utah Lake as a remnant of Lake Bonneville approximately 13,000 years ago, several Native American tribes have lived adjacent to the lake and relied on it for sustenance. Europeans began establishing settlements around Utah Lake in the mid-1800s, eventually driving out the native inhabitants and altering the lake in many significant ways [16,23]. These changes include the following: the overharvesting of native fish species and introduction of nonnative fish species such as the Common Carp (Cyprinus carpio) [15], the construction of a dam and pump house at the lake’s outlet for managing lake levels and the flow of water downstream [24], and the introduction of pollutants from industrial, municipal, and agricultural sources [13,16]. This period also marked a broader trophic transition in Utah Lake. Several studies [12,14,15] describe an abrupt late-19th-century shift from a less turbid, macrophyte-dominated system to a turbid, eutrophic state dominated by phytoplankton. These changes are widely attributed to a combination of carp introduction and regulated water levels.
Utah Lake functions as a wildlife habitat for a variety of flora and fauna, notably the threatened June Sucker fish species and waterfowl that migrate along the Pacific Flyway [25,26]. For humans, the lake is primarily used for recreational activities and as a reservoir for downstream irrigation [19,21]. However, these uses are threatened by harmful algal blooms which occur in the lake on a near-annual basis. Algal blooms are typically a product of nutrient-laden waters, with P often presumed to be the limiting nutrient. Remote sensing studies have shown there is no increasing trend in algal blooms in Utah Lake outside of Provo Bay [22] which supports research that P concentrations in the water column are buffered by sediments and sorption processes [19].
At the same time, sediment studies have demonstrated variable P accumulation and mobility across the lake. For example, Devey [12], Williams et al. [13], and Randall et al. [18] individually observed localized P enrichment in the upper sediments near wastewater treatment plant (WWTP) inputs and in semi-isolated areas such as Provo Bay and Goshen Bay, and in the case of Randall et al. [18], broad enrichment across the eastern side of the lake. Moreover, Randall et al. [18] highlighted that Fe-bound P fractions could be mobilized under reducing conditions, further complicating management efforts aimed at external load reductions. Meanwhile Taggart et al. [19] reported that dissolved P concentrations have remained relatively stable over the past three decades (1989–2023), attributing this to a long-term equilibrium between sediments and the water column. This finding contrasts with studies documenting localized P enrichment, suggesting that while sediment processes vary spatially, lake-wide dissolved P concentrations may have reached a buffered state in recent decades.
These findings underscore the importance of collecting sediment cores that are deeper and more spatially representative in order to better distinguish between natural and anthropogenic drivers of P dynamics. Ongoing efforts to understand P cycling in Utah Lake highlight the value of sediment studies in revealing how P and other elements have varied across space and time, particularly in relation to European settlement and subsequent population growth. Such insights are critical for evaluating how the lake’s geochemistry responds to human activities and for guiding effective management strategies for Utah Lake.

1.3. Core Collection Sites

We chose core collection sites in Utah Lake based on three factors: (1) the number of cores, (2) our equipment’s ability to reach the lakebed, and (3) the suitability of the sediment for sampling. As mentioned, Last and Smol [1] recommend collecting 5–10 sediment cores to adequately represent an entire lake. Due to Utah Lake’s large size, we chose to collect 10 sediment core samples from within the lake.
The target depth for each of our core samples was 2.4 m (8 feet) beneath the sediment surface. While our equipment had a total reach of 6.7 m (22 feet), much of this length was needed to extend the equipment through the water column and into the lake sediment. The Utah Lake watershed experienced an exceptionally good water year at the time of this study, causing the lake to be particularly full during field sampling in the summer of 2024. We were consequently limited to sampling in near-shore areas along the lake’s perimeter, as the offshore portions of the lake were too deep to be accessible for our equipment. A few of the previous Utah Lake paleolimnological studies [5,11,12,13,14], were conducted during typical water years when the lake level was lower and collected core samples toward the center of the lake. By limiting our collection sites to near-shore areas, we acquired a unique dataset that complements the data collected by previous studies.
We found that the near-shore lakebed areas next to the Lake Mountains and West Mountain were too rocky to collect core samples. This limited us to collecting 10 sediment cores in near-shore areas that were nonadjacent to mountainous terrain. Details regarding all sediment cores are found in Table 1. The sites for these core samples as well as the approximate location of Utah Lake’s shoreline are shown in Figure 1.
We generally named our core samples after nearby geographic features, though they were not always collected directly from those locations. For example, the Lindon Marina sample was taken about ½ km (⅓ mile) north of the marina itself to avoid collecting sediments disrupted by the construction and use of the marina.

1.4. Core Shortening

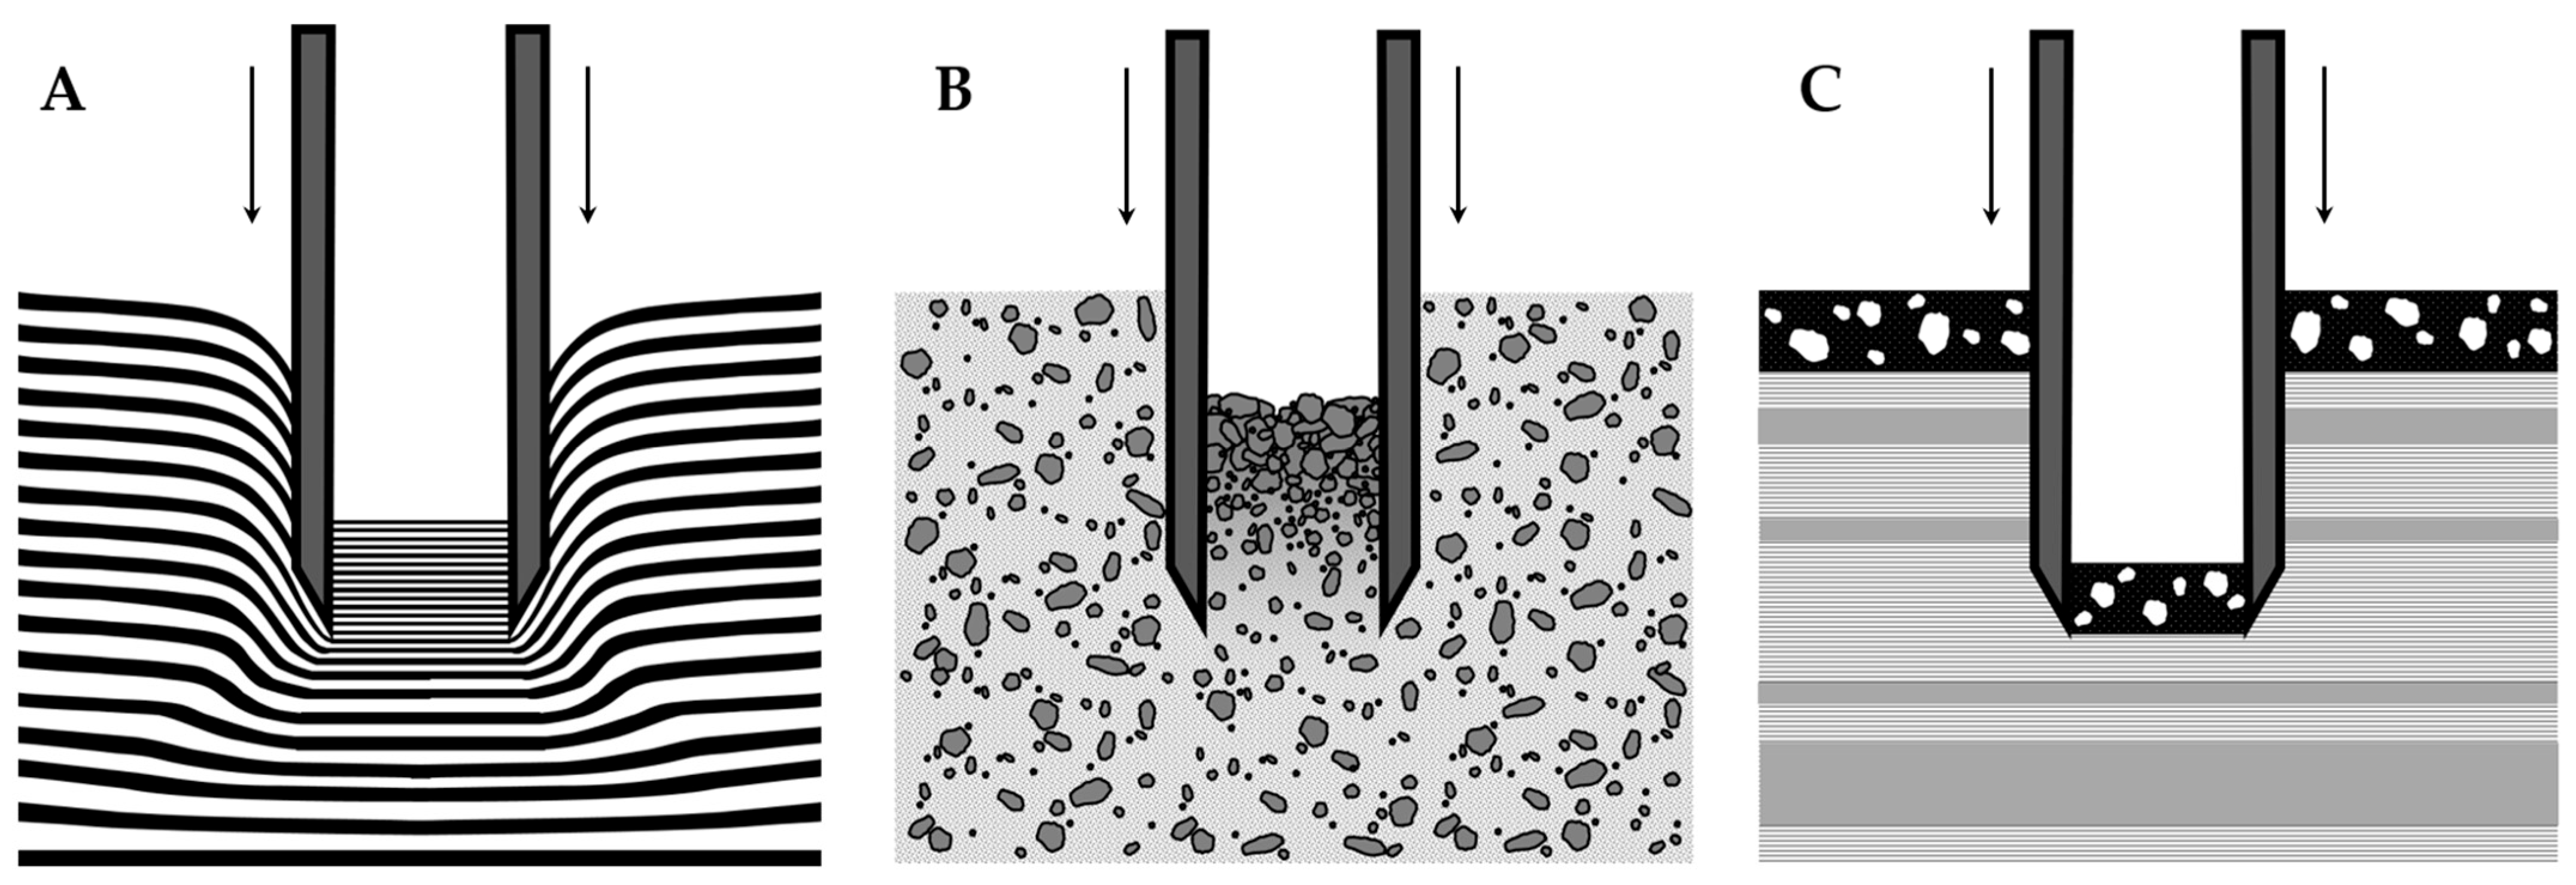
The use of open-barrel core samplers often produces sediment cores that are shorter than the penetrated depth. This phenomenon, known as core shortening, can be caused by multiple processes, including sediment thinning, physical compaction, and sediment bypassing [1,27,28]. Sediment thinning (Figure 2A) is the most common form of core shortening. It occurs when a penetrating object stretches and compresses the sediment as the sampling cylinder is forced downward. In sediment thinning, all the sediment layers are still present, but both the mass and volume of the sediment are reduced, as manifested by thinner sediment layers within the core sample [1,27,28]. A second form of core shortening is physical compaction (Figure 2B) which occurs when water or air is forcibly expelled from a sediment layer, causing the sediment to become more densely packed, reducing the sediment’s volume while maintaining its mass [28]. A third form of core shortening is sediment bypassing (Figure 2C). It occurs when a core sampler becomes clogged and excludes sediment layers during the sampling process. Sediment bypassing typically occurs when sampling firm sediment layers overlying softer sediment [28].
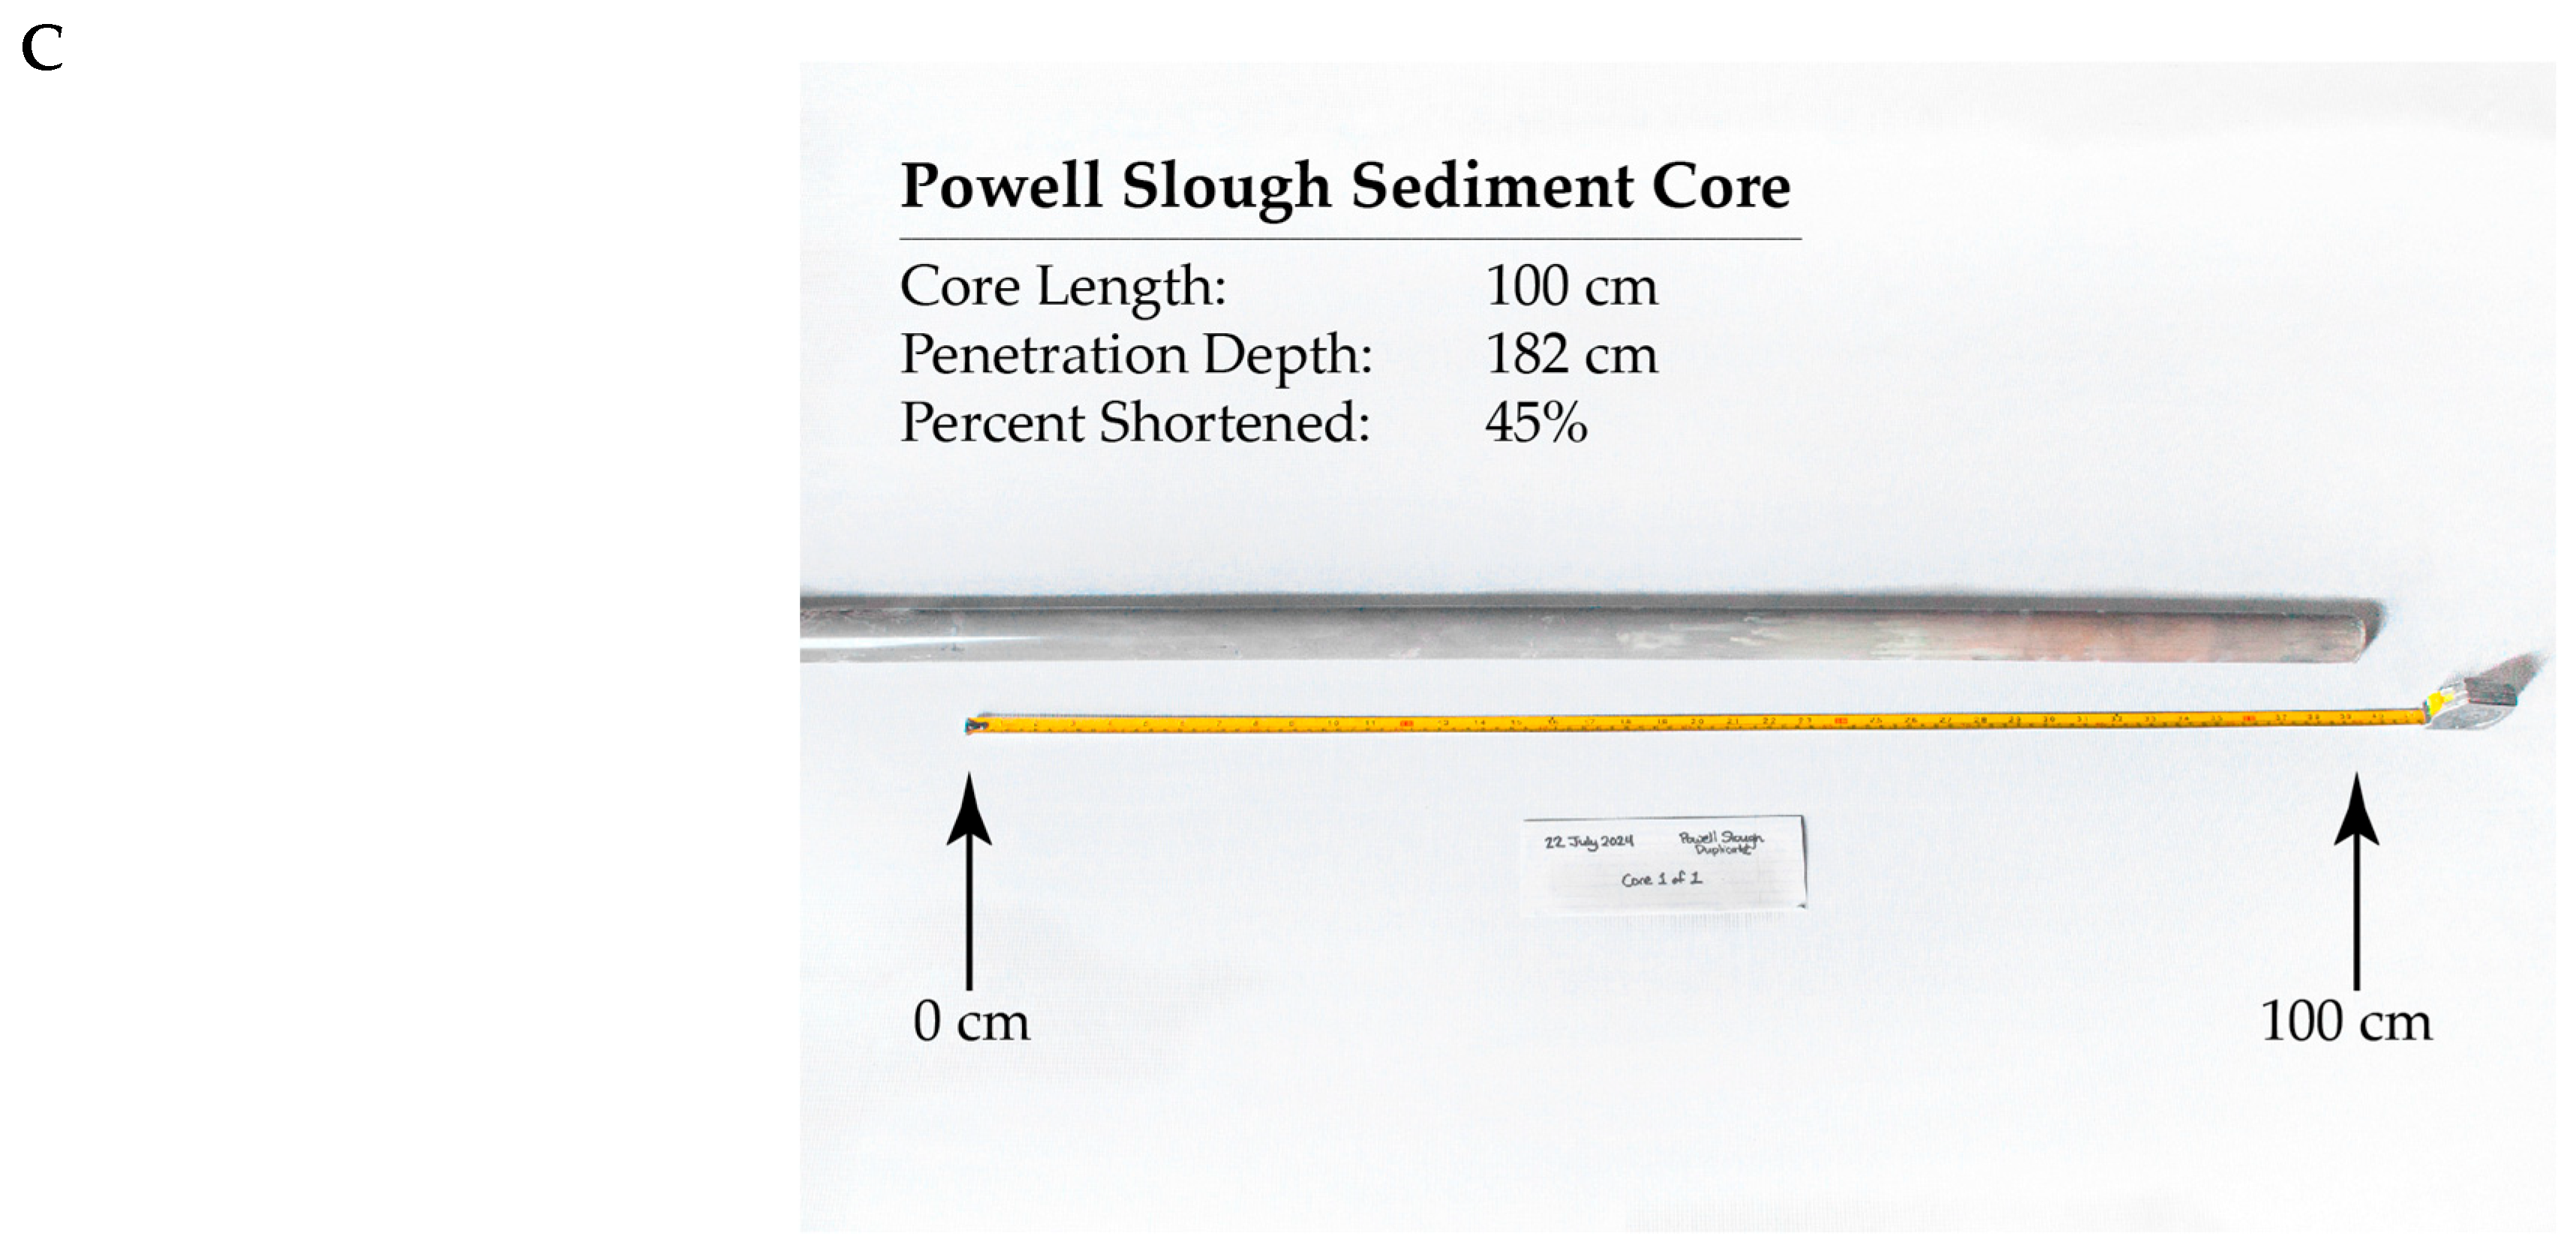
We used an open-barrel sampler and observed significant core shortening in all the cores we collected, with an average reduction of 50%. Based on our visual analysis of the core materials, with one exception, the core shortening was from a combination of sediment thinning and compaction. Following the recommendation by Zheng et al. [29], we included the amount of shortening for each core in Table 1 to facilitate comparison with both these and future sediment cores from Utah Lake.
The sediment–water interface throughout Utah Lake is poorly defined due to sediment resuspension caused by wind-driven wave action, boating, and the bottom-feeding behavior of the Common Carp (Cyprinus carpio). This causes significant sediment reworking from both the wave action and the bioturbation, which means that there are no annual varves and that deposition at any point in time can be mixed across 10s of centimeters of core length. Together, these phenomena result in a loosely consolidated layer of sediment at the top of the lakebed that gradually transitions downward into firmer sediments. We therefore expect that the uppermost sections of our lakebed samples experienced more core shortening in the form of physical compaction, while the primary cause of core shortening in the underlying layers was through sediment thinning. Although sediment bypassing may have affected the Mosida core due to the presence of a gravel layer overlying layers of silt, the occurrence of sediment bypassing is difficult to confirm without stratigraphic and sedimentological assessments of the lakebed in that location. Except for the Mosida core, we did not see any indication of barrel plugging.
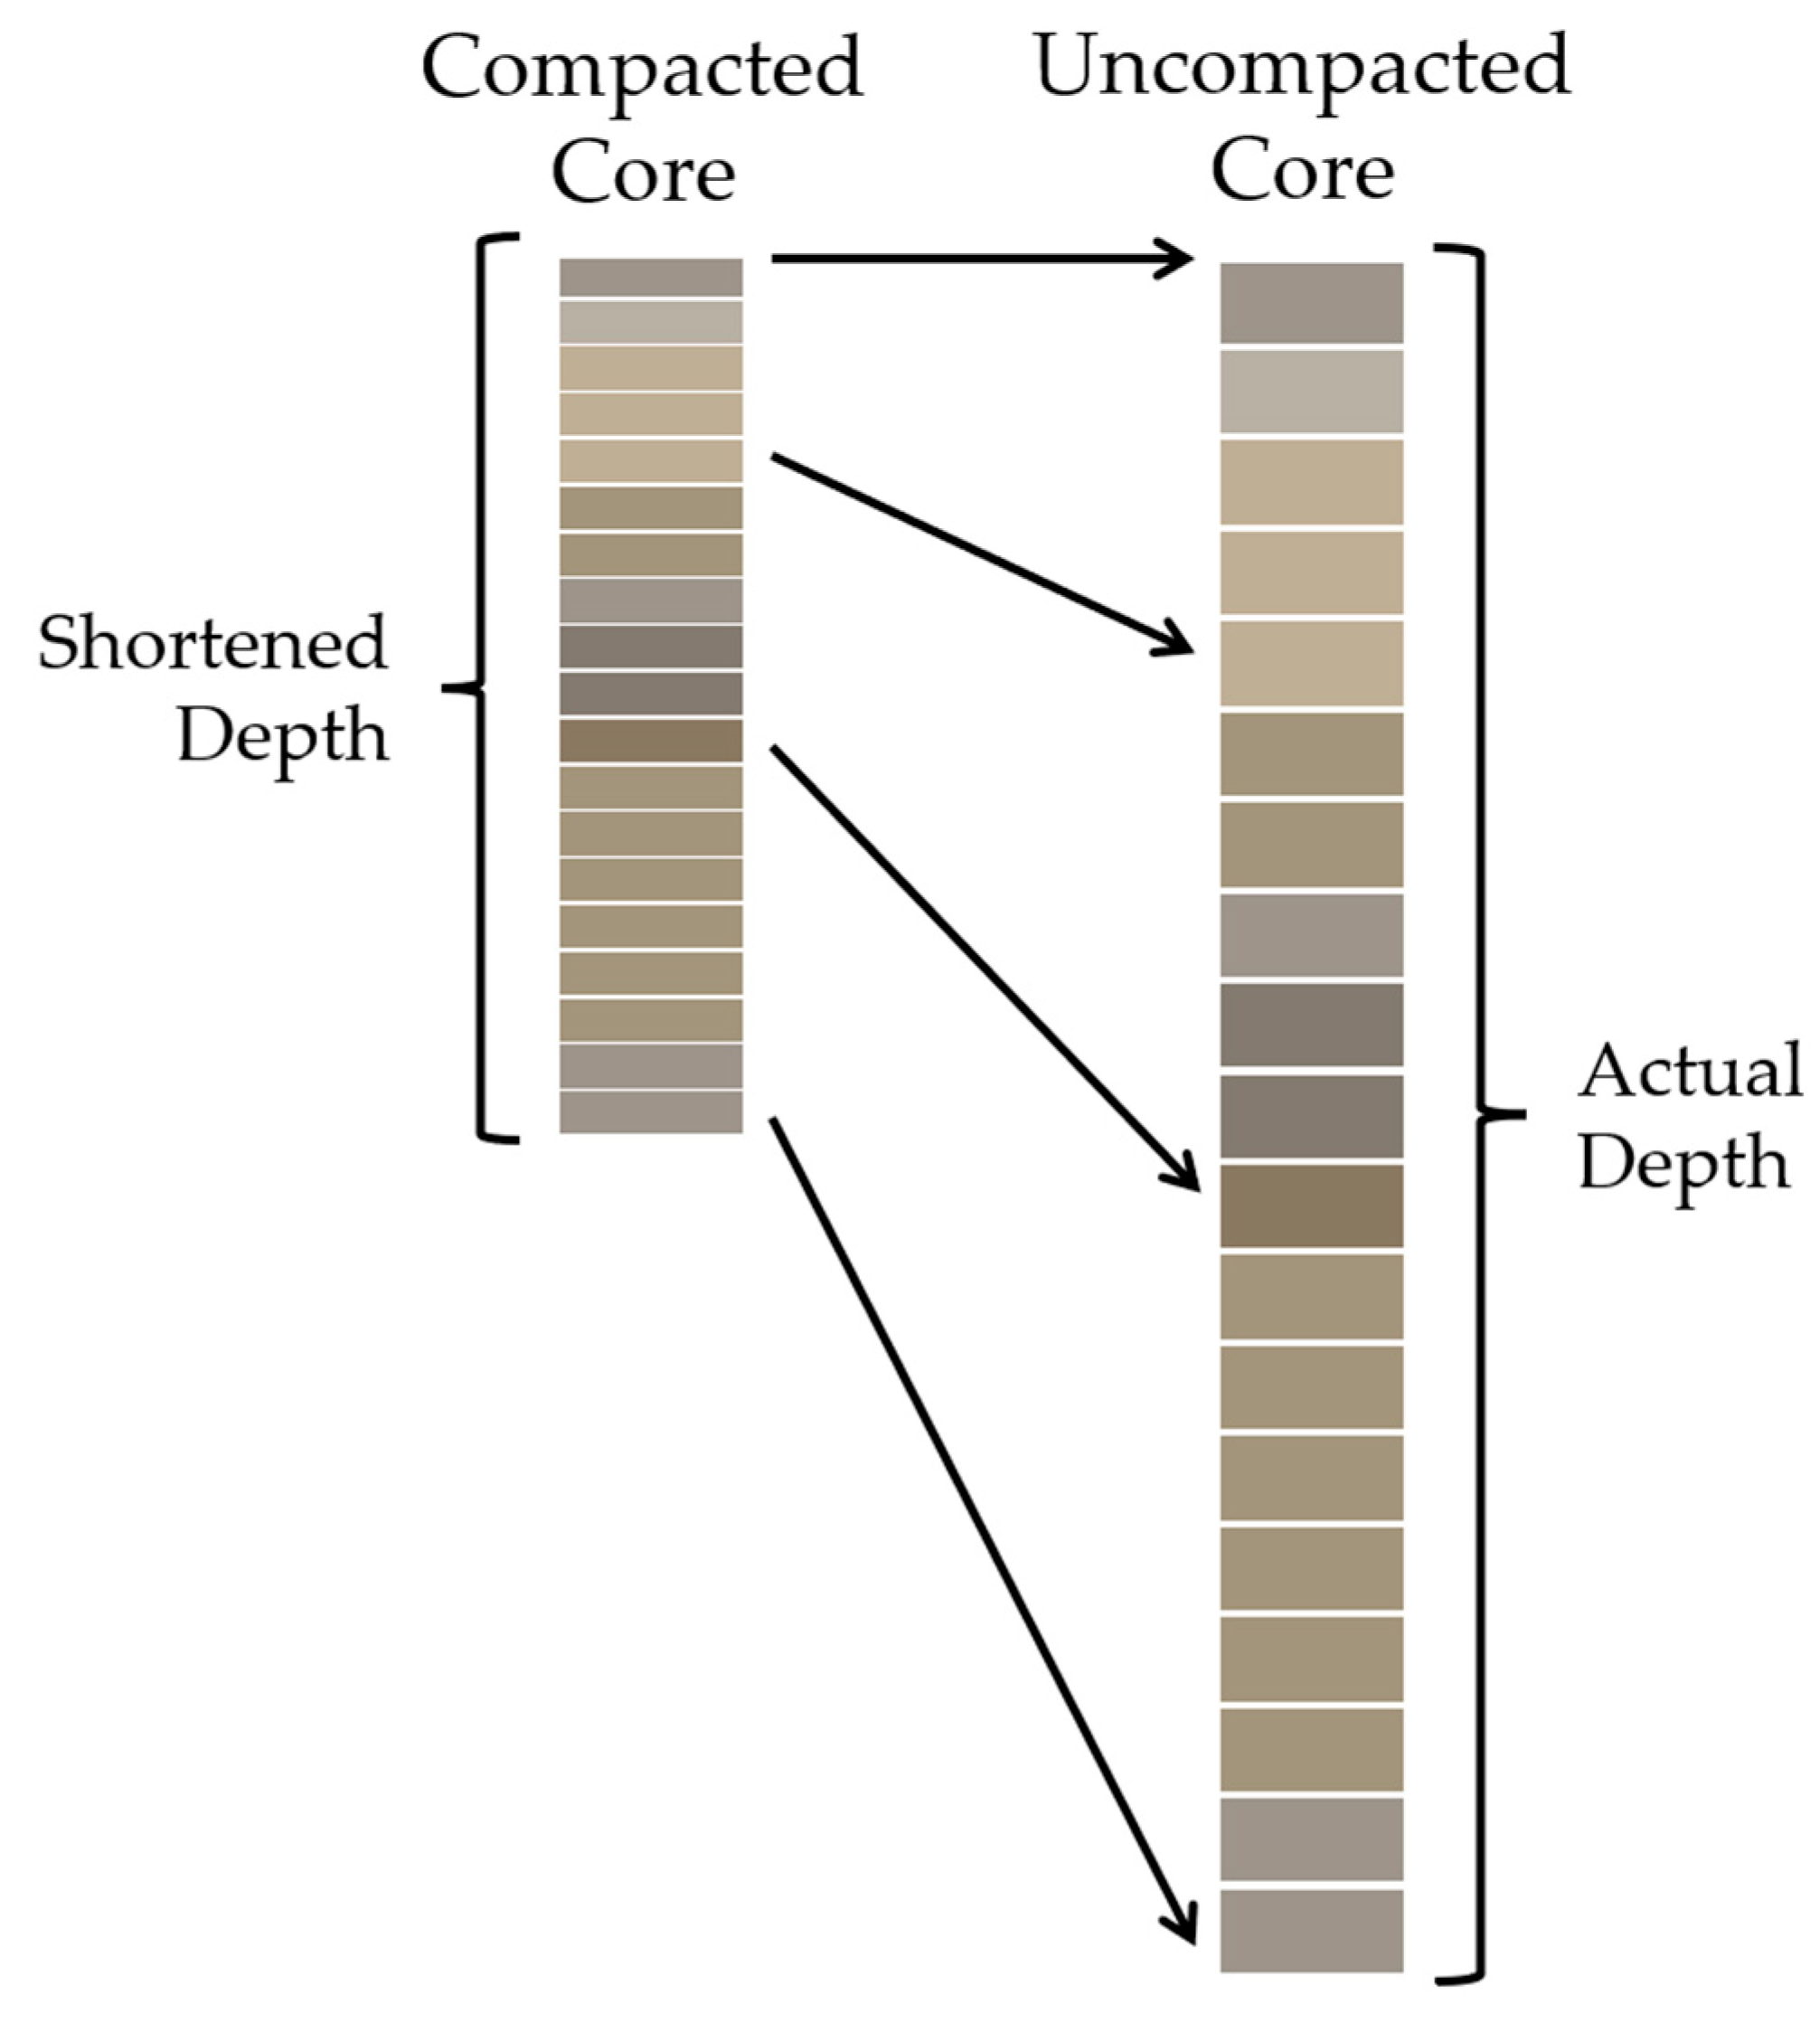
To account for core shortening, we linearly corrected the sample length and subsample intervals of the cores to match their approximate depth in the undisturbed sediments (Figure 3). We performed these corrections under the assumption that all sediment layers within a given sample were equally impacted by core shortening. Core shortening can affect sediment layers unequally depending on sediment type and their degree of consolidation. For the sake of this study, we assumed that these effects were insignificant. While we recognize that some sediment layers may be more susceptible to shortening than others, detailed stratigraphic data necessary for layer-specific corrections were unavailable. Given that our analyses use depth primarily as a comparative framework across cores rather than for fine-scale chronological resolution, we consider the errors associated with a linear correction to be minor and unlikely to affect the main conclusions of this study.
We collected sediment subsamples from our cores at even intervals, but because the cores experienced varying amounts of core shortening, the intervals between the actual subsample depths were not the same for each core. To compare the data among the different cores using the same depth below the surface of the sediment, we interpolated the elemental concentration data from the corrected subsample depths using Piecewise Cubic Hermite Interpolating Polynomials (PCHIP) using R version 4.4.1 and the pracma package. This enabled comparative analysis of our sediment cores in 5 cm intervals down to 140 cm, the depth of the shortest core. PCHIP interpolation uses a non-linear polynomial that has a continuous first derivative and a discontinuous second derivative. This results in a smooth interpolation that honors the data extent—i.e., without any over- or under-shooting that often occurs with spline interpolation methods [30,31].

2. Materials and Methods

2.1. Sample Collection and Preparation

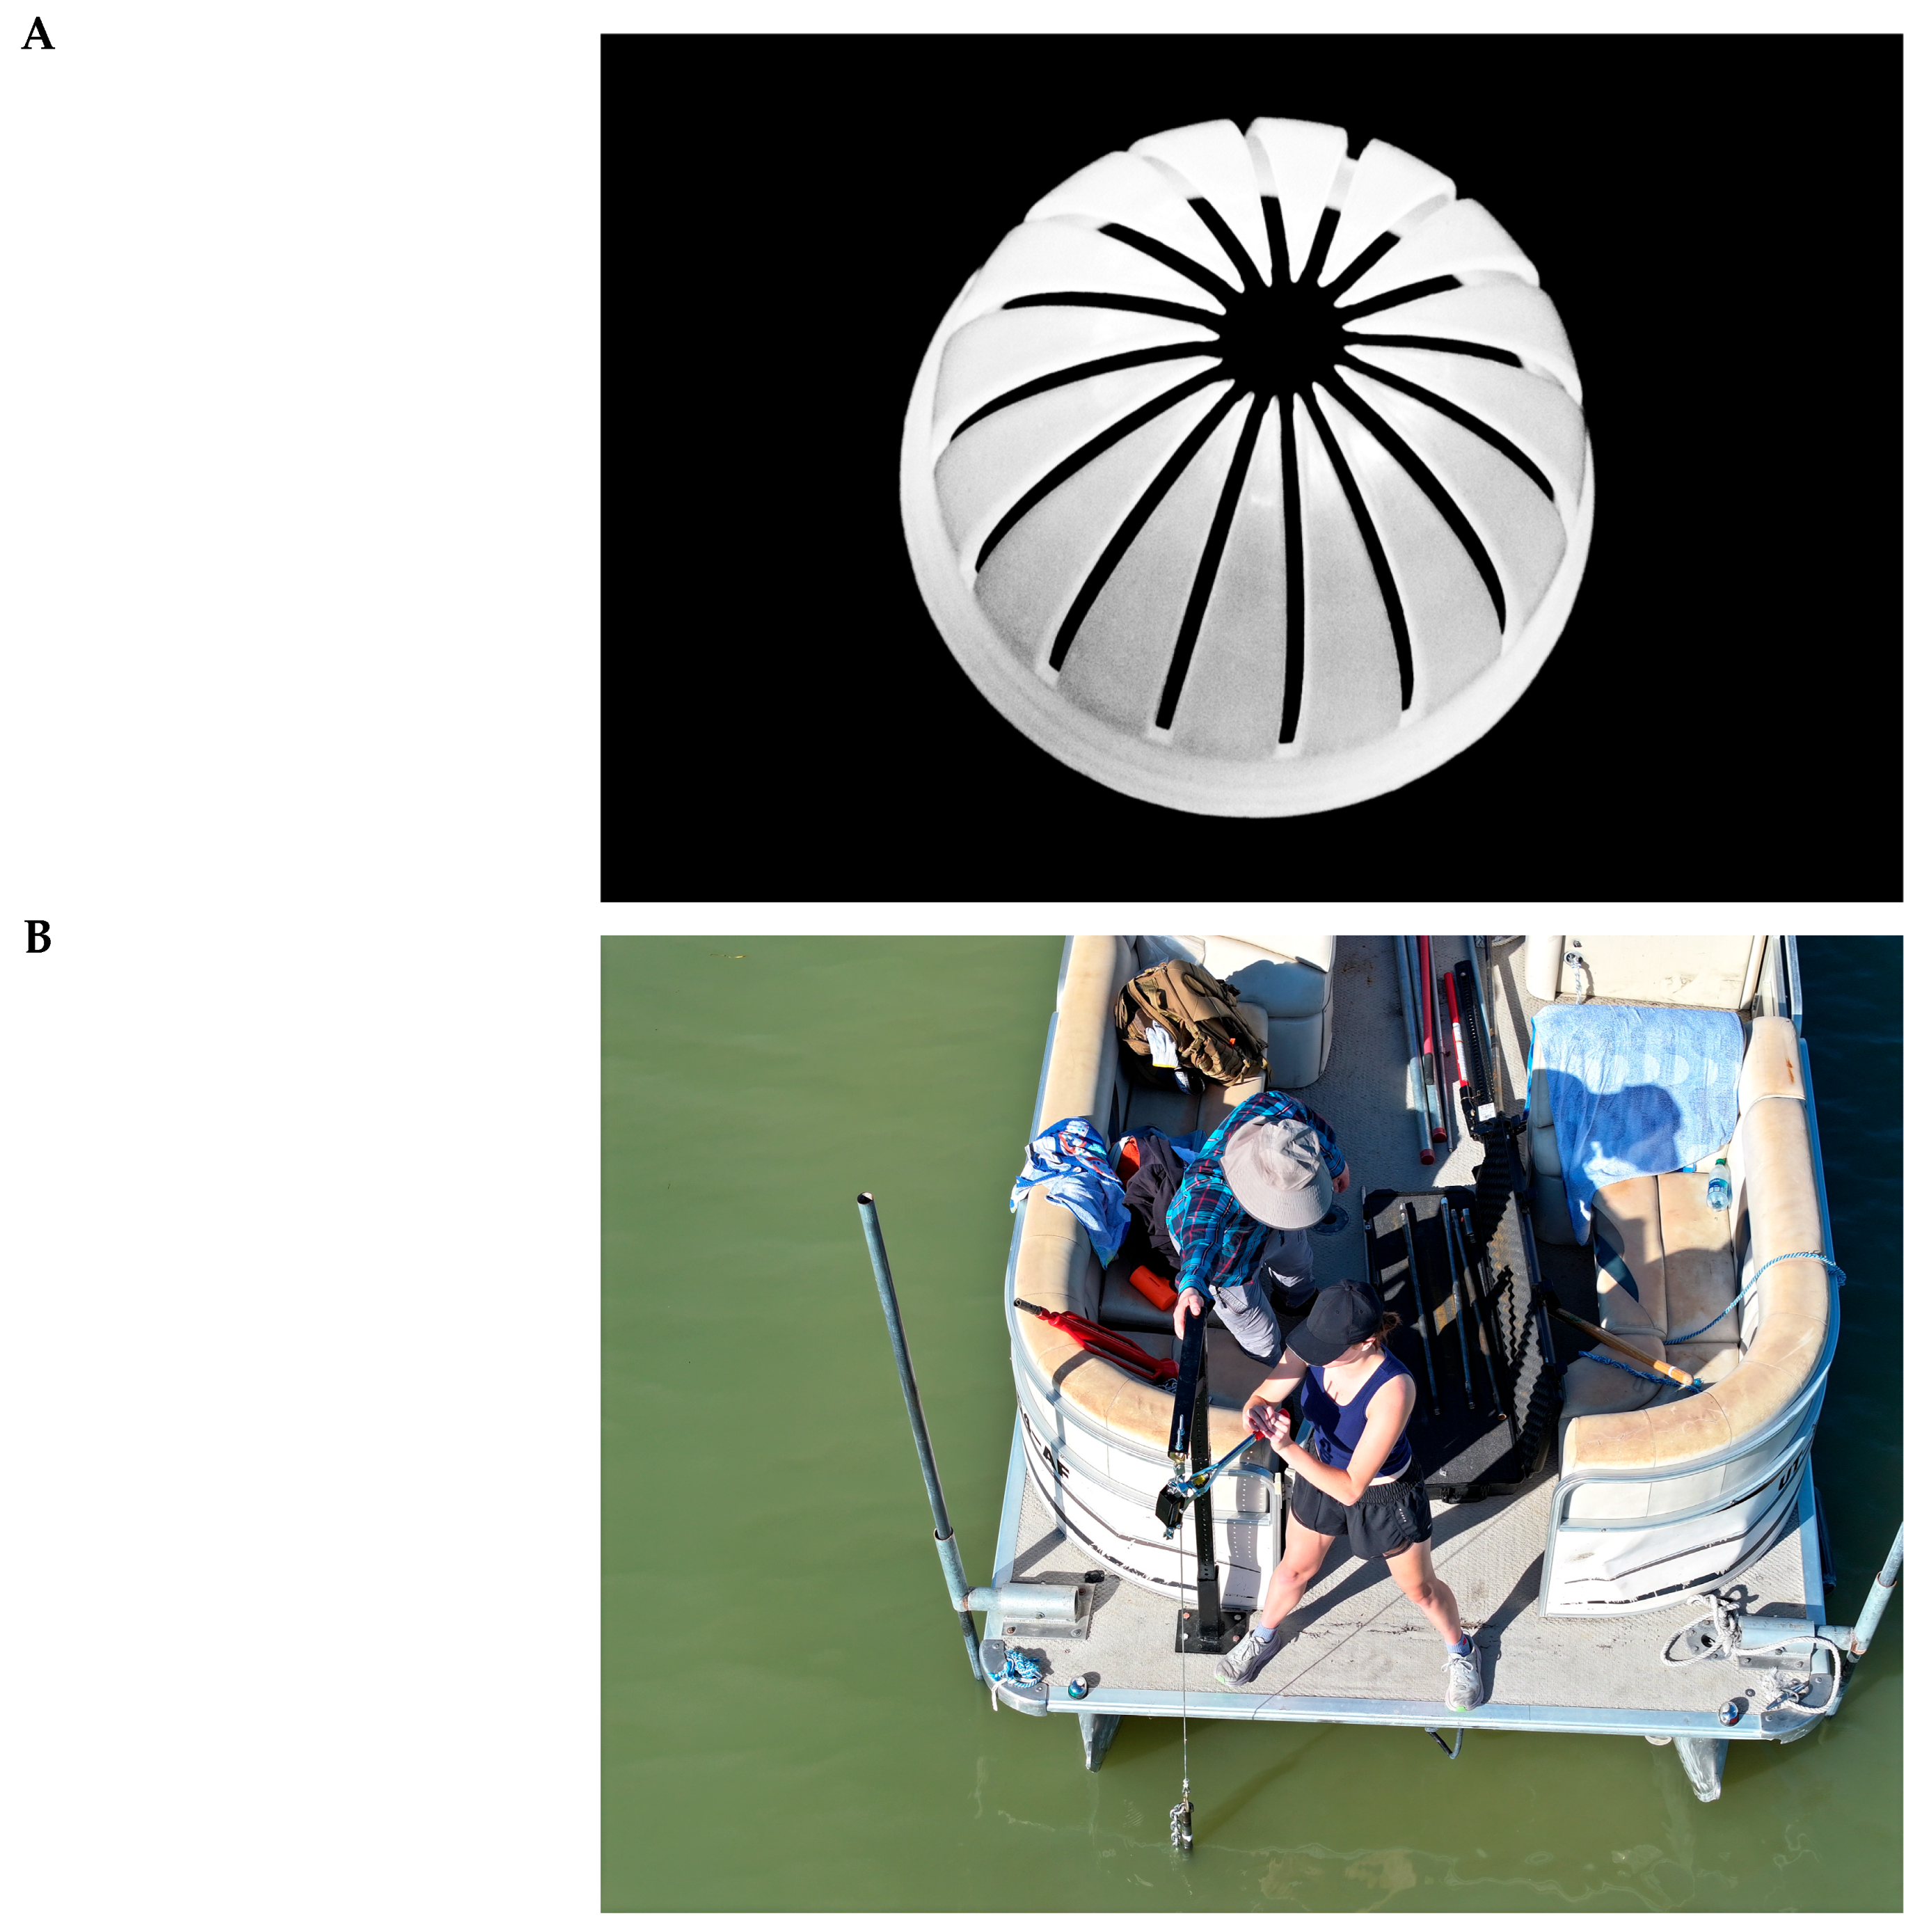
We used an AMS® Soggy Bottom Sampling System (Art’s Manufacturing & Supply, Inc., American Falls, ID, USA) to collect our sediment core samples. This system includes an open barrel, manually driven sampler with removeable plastic liners that are 4 cm in diameter and either 61 cm or 122 cm long (1.5 inches in diameter and either 2 feet or 4 feet long) to contain core samples during and after extraction. Instead of using a hydrostatic seal to prevent sample loss, the Soggy Bottom Sampler uses core catchers that are inserted into the bottom of each liner prior to sampling. Core catchers have small plastic fingers that are curled inward to allow material to enter the liner as the sampler is driven into the lakebed. These fingers then close together when the core sampler is extricated from the lakebed, preventing the sample from sliding out of the liner (Figure 4).
We attached 91 cm (3-foot) metal extenders to the core sampler so it could be lowered through the water column to the lakebed. We then attached a slide hammer to the top-most metal extender, allowing us to drive the sampler down to the desired sediment depth. This depth was typically deeper than the length of the core sampler due to core shortening which, as previously mentioned, is a phenomenon that causes sediment cores to be shorter than the penetrated depth of the core sampler. After we drove the sampler to the desired depth, we extracted it by either reverse hammering with the slide hammer or by ratcheting the sampler upward with a fixed crane. We then removed the plastic liner containing the sediment core from the sampler and sealed the ends with parafilm followed by duct tape. We placed the core sample on ice with the top elevated while in transit to our laboratory. Within 24 h of acquiring a core sample, we cut the core open to collect subsamples. We then dried and ground the subsamples for laboratory analysis. As recommended by Wrath [32], we collected subsamples from the center of each core to avoid contamination from sediments smeared along the inner walls of the plastic liners during sampling. We collected ~2 g subsamples every 5 cm along each core for elemental analysis as well as ~15 g subsamples from 6 sites along each core for the analysis of fractional CaCO3 and fractional OM.

2.2. Microwave Digestion and ICP-OES

We used U.S. EPA Method 3051A [33] to conduct microwave assisted acid digestion on our sediment core subsamples. This method involves combining 0.1 g of sample material with nitric acid and microwaving the mixture at 175 ± 5 °C for 10 min to digest the sample. As this method does not include hydrofluoric acid or total digestion steps, Si and Ti likely reflect only the environmentally available fraction and may underestimate total concentrations. Complete digestion of refractory minerals (e.g., silicates, TiO2 phases) was not achieved, so Si and Ti data should be interpreted accordingly. After sample digestion, we performed elemental analysis using a Thermo Scientific iCAP™ 7400 ICP-OES (Thermo Fisher Scientific, Waltham, MA, USA), which has detection limits in the 10s of a part-per-billion (ppb) range. We assumed that the liquid from our digested samples had a mass density of 1 g mL−1 (the same density as water) and converted our results from units of ppm to mg L−1. We then converted the results from the ICP analysis to units of mass concentration (mg kg−1) by multiplying them by the sample volume (L) produced from digestion and dividing them by the mass of the sediment (kg) used for digestion.

2.3. Fractional Calcium Carbonate

We used the Plant, Soil and Water Reference Methods for the Western Region (WREP) Carbonate Qualitative Test [34] to measure the fractional CaCO3 content of our sediment core samples. This is a gravimetric method that involves weighing samples before and after immersion in hydrochloric acid. The acid reacts with the CaCO3 to form carbon dioxide, calcium chloride, and water. The mass lost due to the formation of carbon dioxide is used to calculate the mass of CaCO3 present in the original sample.

2.4. Loss on Ignition

We used the WREP Loss On Ignition (LOI) Method [34] as a proxy for fractional soil OM in our sediment core samples. We heated the samples at 105 °C for 24 h to remove all traces of moisture, including the water incorporated into the molecular structure of clay minerals. We then weighed the samples before and after incinerating them at 360 °C for 4 h. The sample mass lost due to the combustion of OM is used to calculate the mass of OM present in the original sample.

2.5. Color and Texture

We used Munsell Soil Color Charts [35] to identify the Munsell color categories of each subsample. Due to insufficient mass for particle size analysis, we classified the texture of the subsamples based on their feel and appearance as either sand, silt, gravel, or a transitional phase between two textures. We did not differentiate between clay and silt, instead categorizing all fine-grained subsamples as having a silty texture.

2.6. Analysis Methods

We analyzed three categories of data—chemical composition, core depth, and sample location—and evaluated their interrelationships. The category of chemical composition can be further divided into the elemental concentration for 25 ICP-detectible elements and the fractional mass content for CaCO3 and OM.
Before analysis, we used Microsoft Excel 365 to normalize the data using min-max normalization which transforms each of the variables to a range of 0–1 using its minimum and maximum values. We then used the Pearson Correlation Coefficient to quantify the strength of a relationship between two variables, which is computed by dividing the covariance of the two samples by the product of their standard deviations [36,37].
We explored clustering and relationships among our data using multidimensional scaling (MDS) which is a statistical technique used to visually represent high-dimensional distances between multiple datasets in two dimensions, with similar samples (i.e., samples that are close to each other in high-dimensional variable space) are plotted close together, while dissimilar samples (i.e., samples that are far from each other in high-dimensional space) are plotted far apart from each other. MDS maintains the multidimensional distances between each sample pair while presenting all the samples in two-dimensional plots. The patterns in the MDS plots are not relevant, only the relative distance among the points.
Any distance metric can be used to construct MDS plots. For our analysis, we evaluated six different distance measures: Euclidean, Manhattan, Minkowski, Canberra, Spectral Angle, and Pearson Correlation (which can be considered a measure of distance in high-dimensional space). While they can all provide insight into the relationships among our data, we give the greatest weight to the distance measures that produced the highest Spearman Rank Correlation Coefficients (ρ), as those measures are considered the best relational representations of the data. We generated these distance measures and MDS plots using R version 4.4.1 and the base R stats package.

3. Results and Discussion

3.1. Core Depth, Color, and Texture

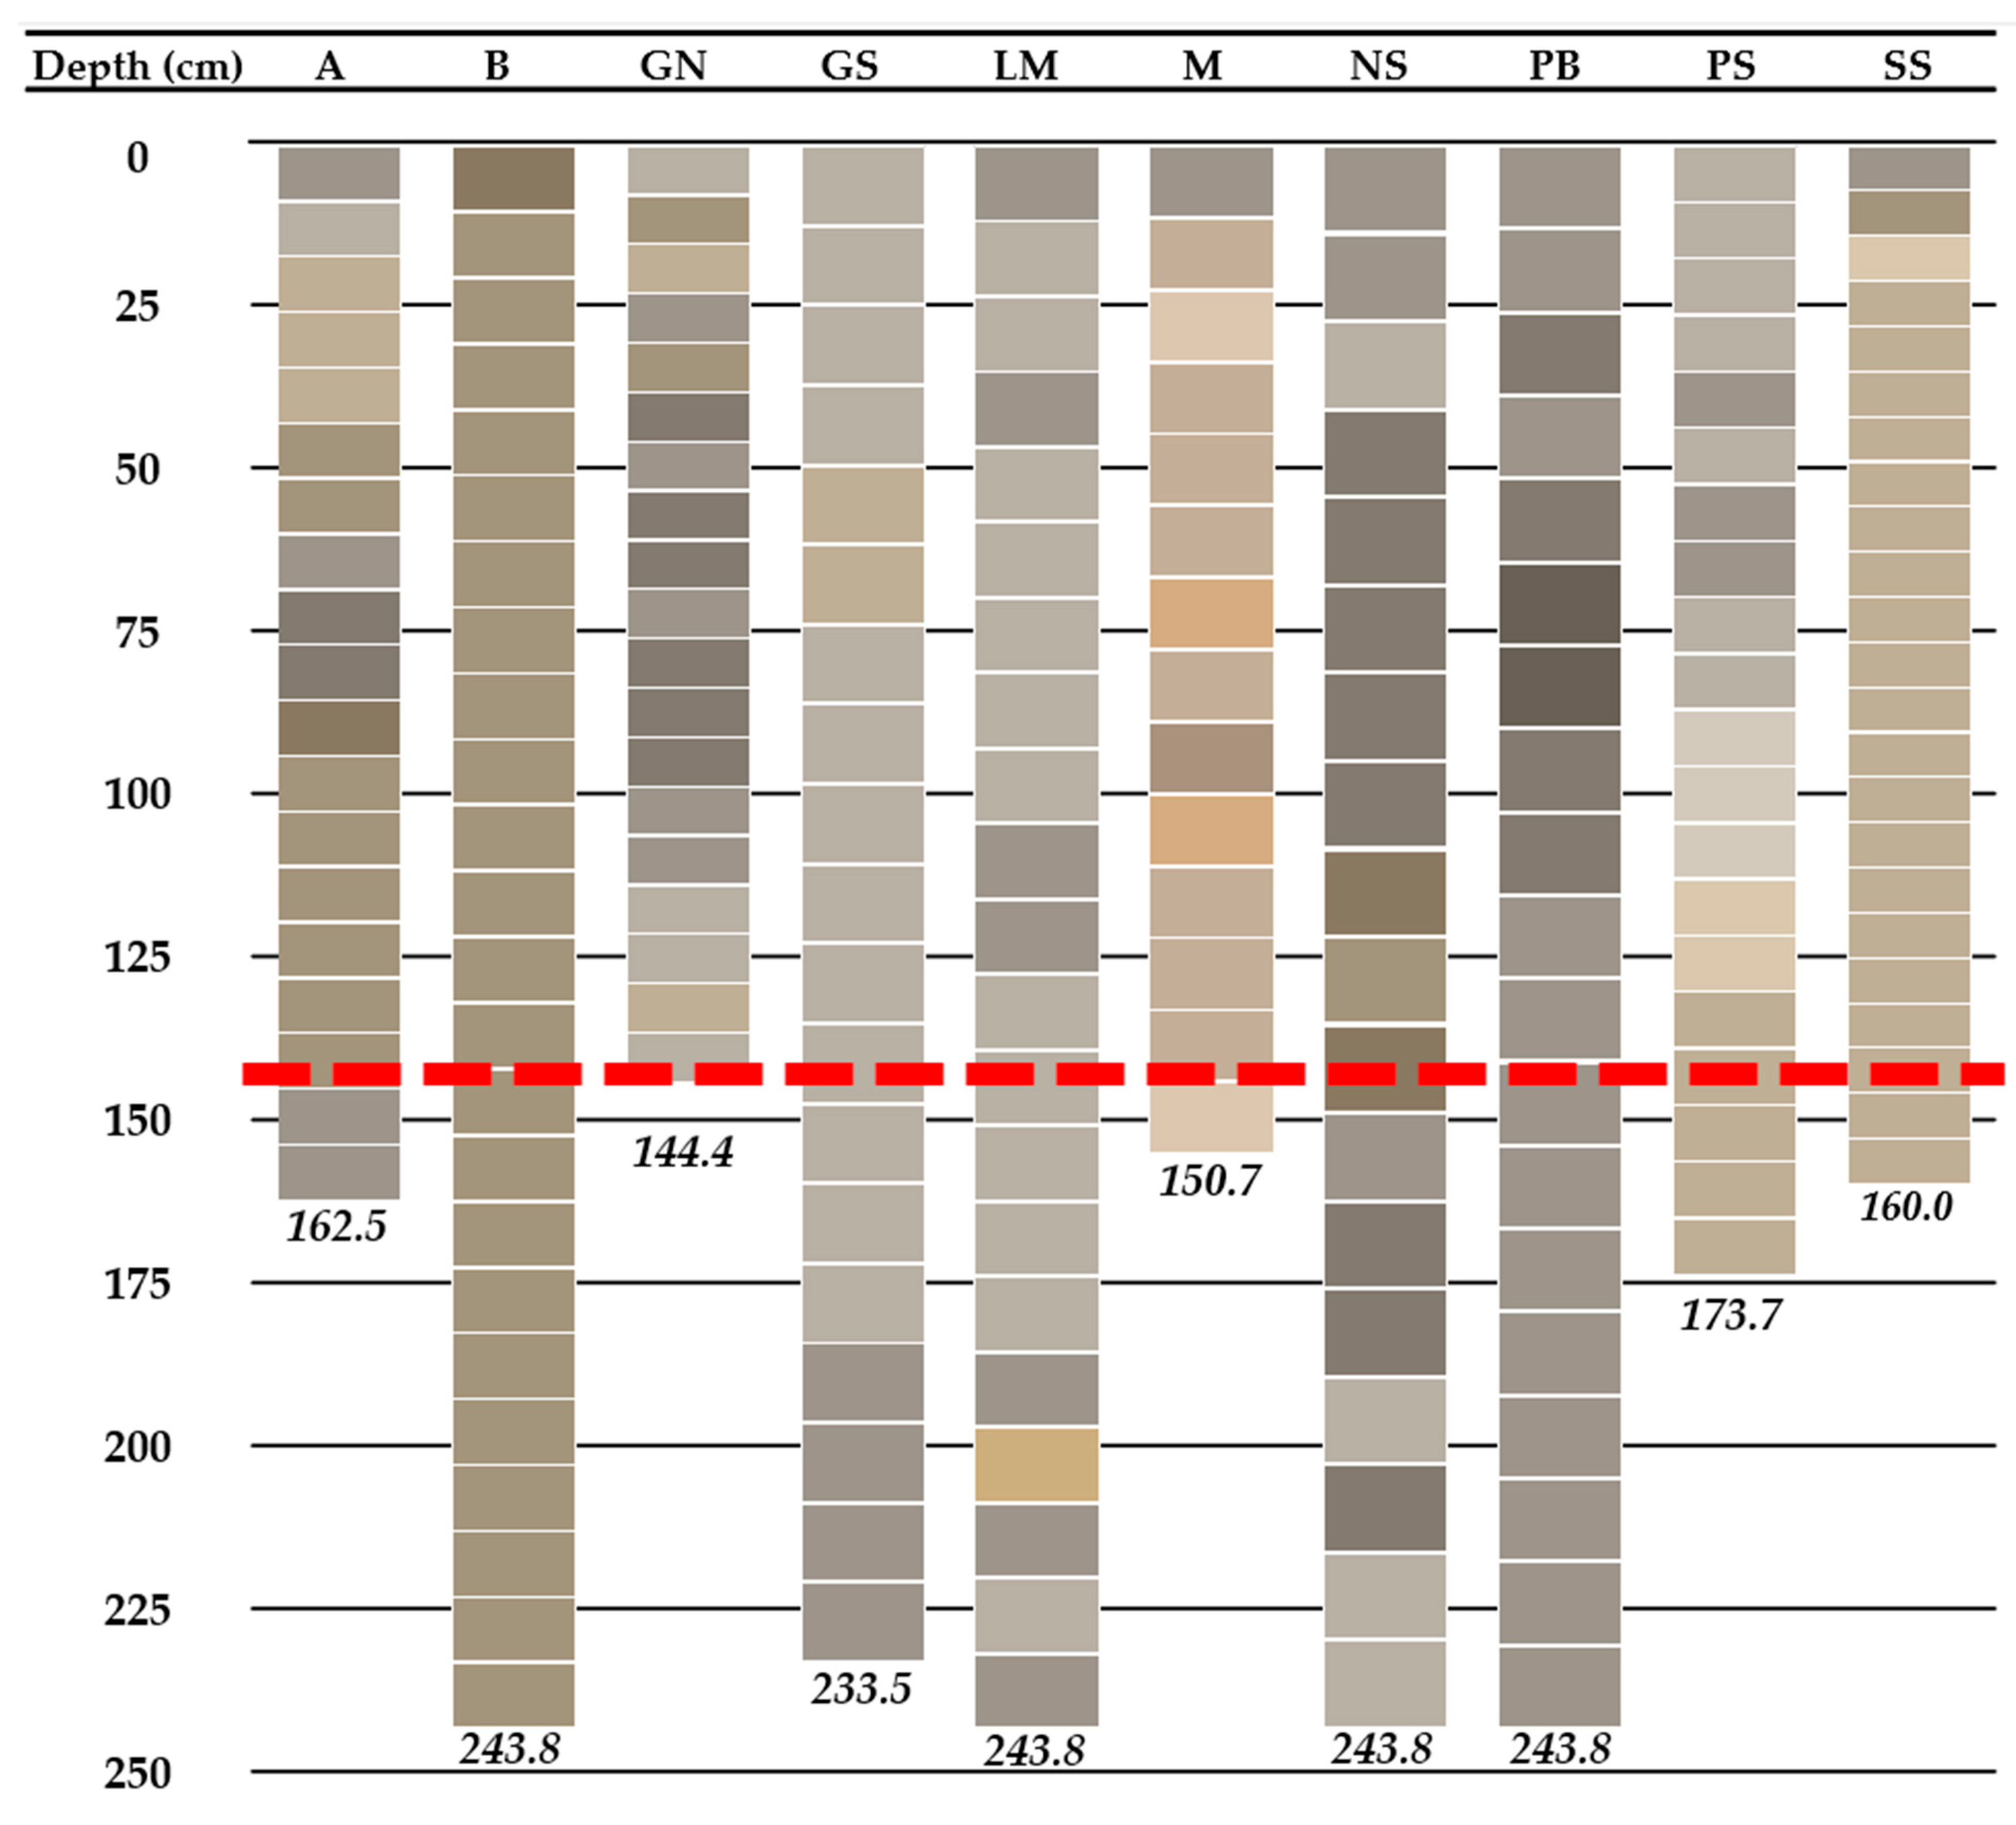
Our initial experimental design was to collect 2.4-meter-deep cores from each sampling site, and while we managed to do this for several core samples, we could not drive the core sampler to the full 2.4 m at most locations. To ensure fair comparisons across core samples, we excluded sediment core data beyond the depth of the shortest core when making comparisons between cores. We established this limit at a depth of 1.4 m, the depth of the Goshen North core sample, which was the shortest core we collected.
Figure 5 presents a comparison of core depths and colors, with subsamples shown as individual rectangles bounded by white lines within each core. In Figure 5 the core depths have been corrected for core shortening, resulting in unequal intervals between subsamples (see Section 1.4). The subsample colors are the actual colors observed using Munsell color matching charts [35] and were generally classified as gray or brown, with hues in the 2.5Y and 10YR categories, lightness values between 4 and 8, and chroma values between 1 and 3. The red dashed line indicates the depth of the shortest core sample (rounded to 140 cm), which was used as the comparison limit for sediment core data across all samples above this depth.
When compared side by side, the cores show no clearly defined lithofacies within the top 140 cm. Both our study and previous studies indicate that the upper 10–20 cm of sediment is continually reworked, preventing the formation of annual varves. Moreover, our nearest core samples are over 5 km apart, with typical spacing being closer to 15 km. While deeper cores (on the order of 10s of meters deep) might reveal stratigraphic patterns, factors such as sediment reworking, a stable geological environment over the past 300 years, and wide core spacing hinder lithofacies assignment and stratigraphic correlation.
Core samples lake-wide were primarily silty with occasional gravel and sandy layers (we did not distinguish between clay and silty textures). The Airport core appeared to be an anomaly among the core samples, being composed almost exclusively of sand. Other studies have observed sandy sediments along the shoreline of Utah Lake and near the mouths of its major tributaries [4,8] and known submerged springs [17]. Because the site of the Airport core is 3.15 km (2 miles) south of the mouth of the Provo River, the sand in this core was likely transported to the lake by the Provo River and then moved southward by longshore drift. A summary of the textures and colors exhibited by the Airport core in comparison to the Benjamin core, a more typical core from Utah Lake, is shown in Table 2; similar information for the other sediment cores is provided in the Supplementary Tables.

3.2. Elemental Concentrations

3.2.1. Analysis and Detection

Elemental analysis with a Thermo Scientific iCAP 7400 ICP-OES allowed us to measure the concentration of the following 25 elements from our sediment core subsamples: Al, As, B, Ba, Ca, Cd, Co, Cr, Cu, Fe, K, Mg, Mn, Mo, Na, Ni, P, Pb, S, Se, Si, Sr, Ti, V, and Zn (Table 3) in the 10s of a part-per-billion (ppb) range. It should be noted that these values were derived using a partial digestion method and have most likely underestimated the concentrations for Si and Ti. Based on our results, Ca was the predominant element across all cores, followed by major elements Al, Fe, K, and Mg. Minor elements included Ba, Mn, Na, P, S, Si, Sr, and Ti, and the remaining ICP-detectable elements were considered trace elements based on their low concentrations.
As mentioned in Section 2.2, U.S. EPA Method 3051A is not necessarily a complete digestion, sometimes leaving behind oxides and silicates as undigested residue. This likely explains the unexpectedly low Si concentrations in our core samples. Although a visual examination revealed small amounts of residue in a few of our samples, most samples showed no visible residue after digestion.
For all the core samples around the lake, we found that elemental concentrations were right-skewed, suggesting that while relatively high levels of any element were uncommon, they did occur occasionally (Table 3 and Figure 6). Measurements for all the ICP-detectable elements were generally within detection limits, with the minimum detection limits ranging between 2 and 50 ppb, depending on the element. On the occasion when measurements did fall below these limits—most often for Se and Mo—we replaced the values with zeroes for analysis.

3.2.2. Relationship Between Elements

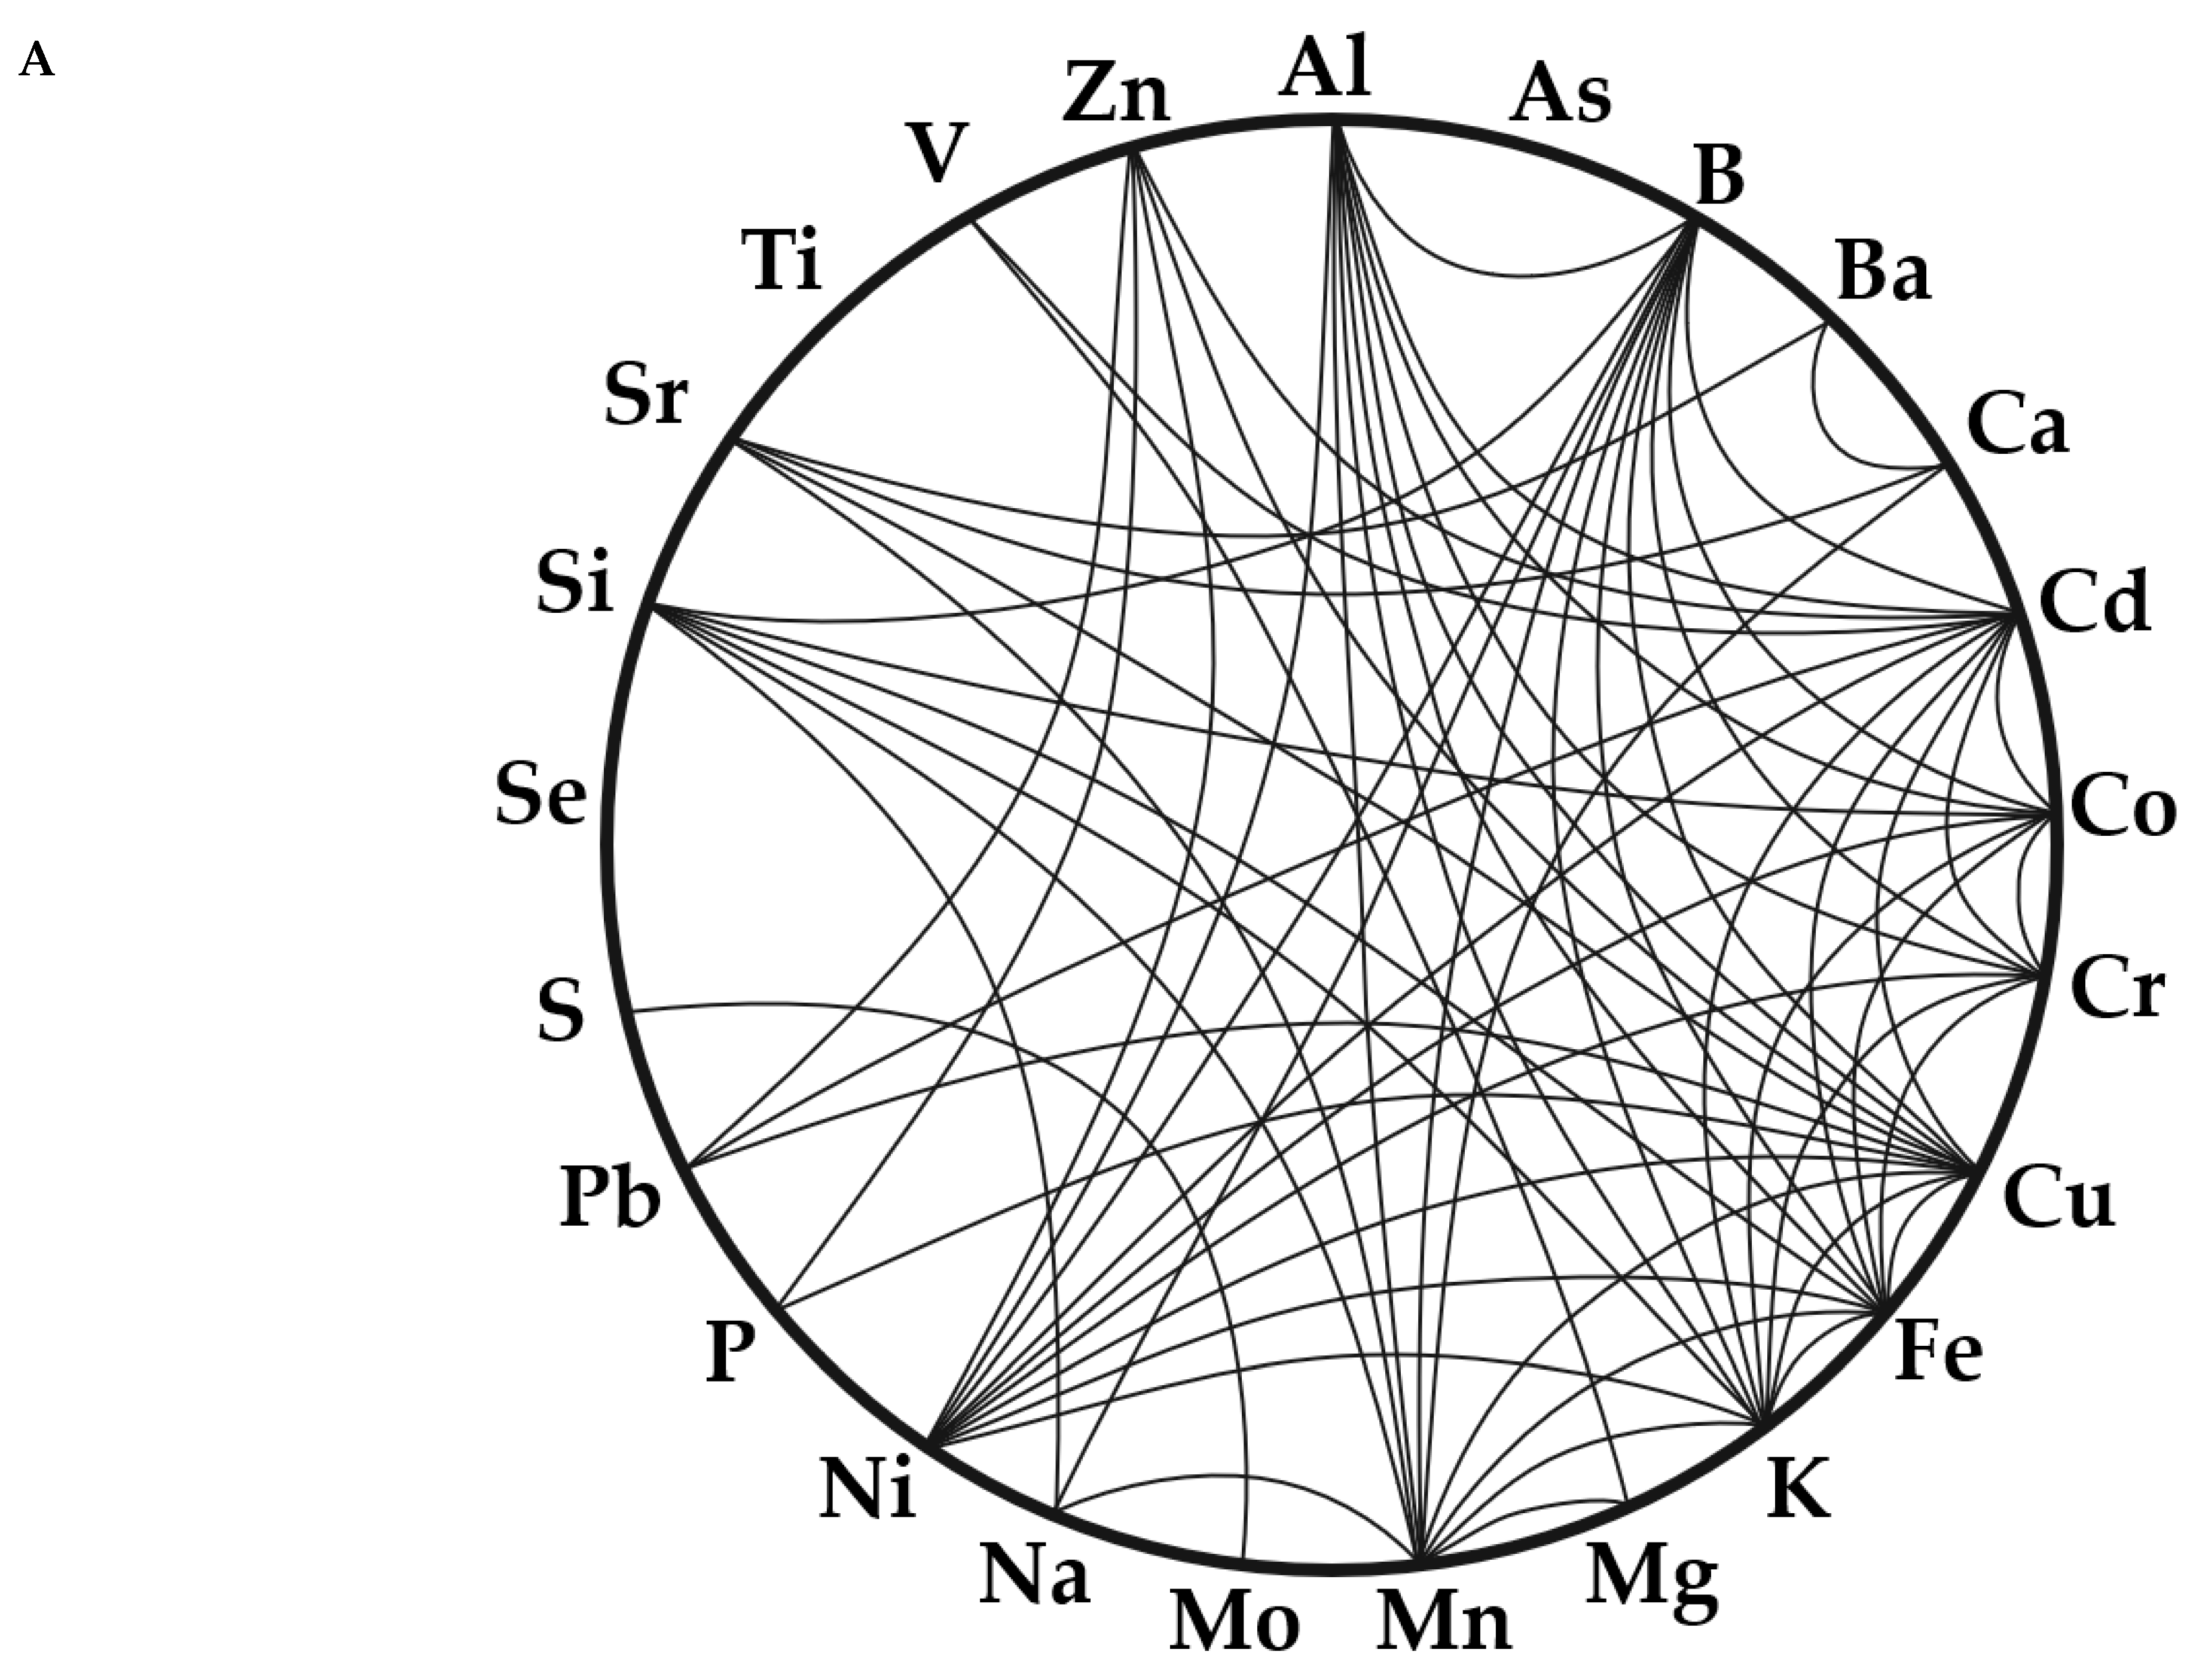
Pearson Correlation Coefficient analysis of all sediment cores revealed that 43% of all element pairs were strongly correlated (r > 0.5; Figure 6). B, Cd, Cu, Fe, K, and Mn were correlated with multiple elements, while As, Se, and Ti were not strongly correlated with any other elements. All remaining ICP-detectible elements had strong correlations with at least one other element. Figure 6 presents a chord diagram illustrating these correlations, with the lines in the diagram connecting the strongly correlated elements.
When the normalized distribution of these elements is plotted (Figure 7), all concentrations fall within the range of 0 to 1. Elements with distributions centered around 0.5 are closer to a normal distribution, while those near the extremes are more skewed. Because all the median values (represented by the vertical line in the box) are less than 0.5, all the data are right skewed, with some being more skewed than others.
Figure 6 and Figure 7 show that the elements having strong correlations with others also tend to have the highest normalized mean concentrations or the least amount of skew. Thus, distributions that are more normal are generally correlated with each other. There are several notable exceptions to this, such as P, Ca, and V which have high normalized mean concentrations, or lower skew values, but only show strong correlations with a few other elements. Another notable exception is K, which only has a moderate normalized mean concentration while having a high number of strong correlations.
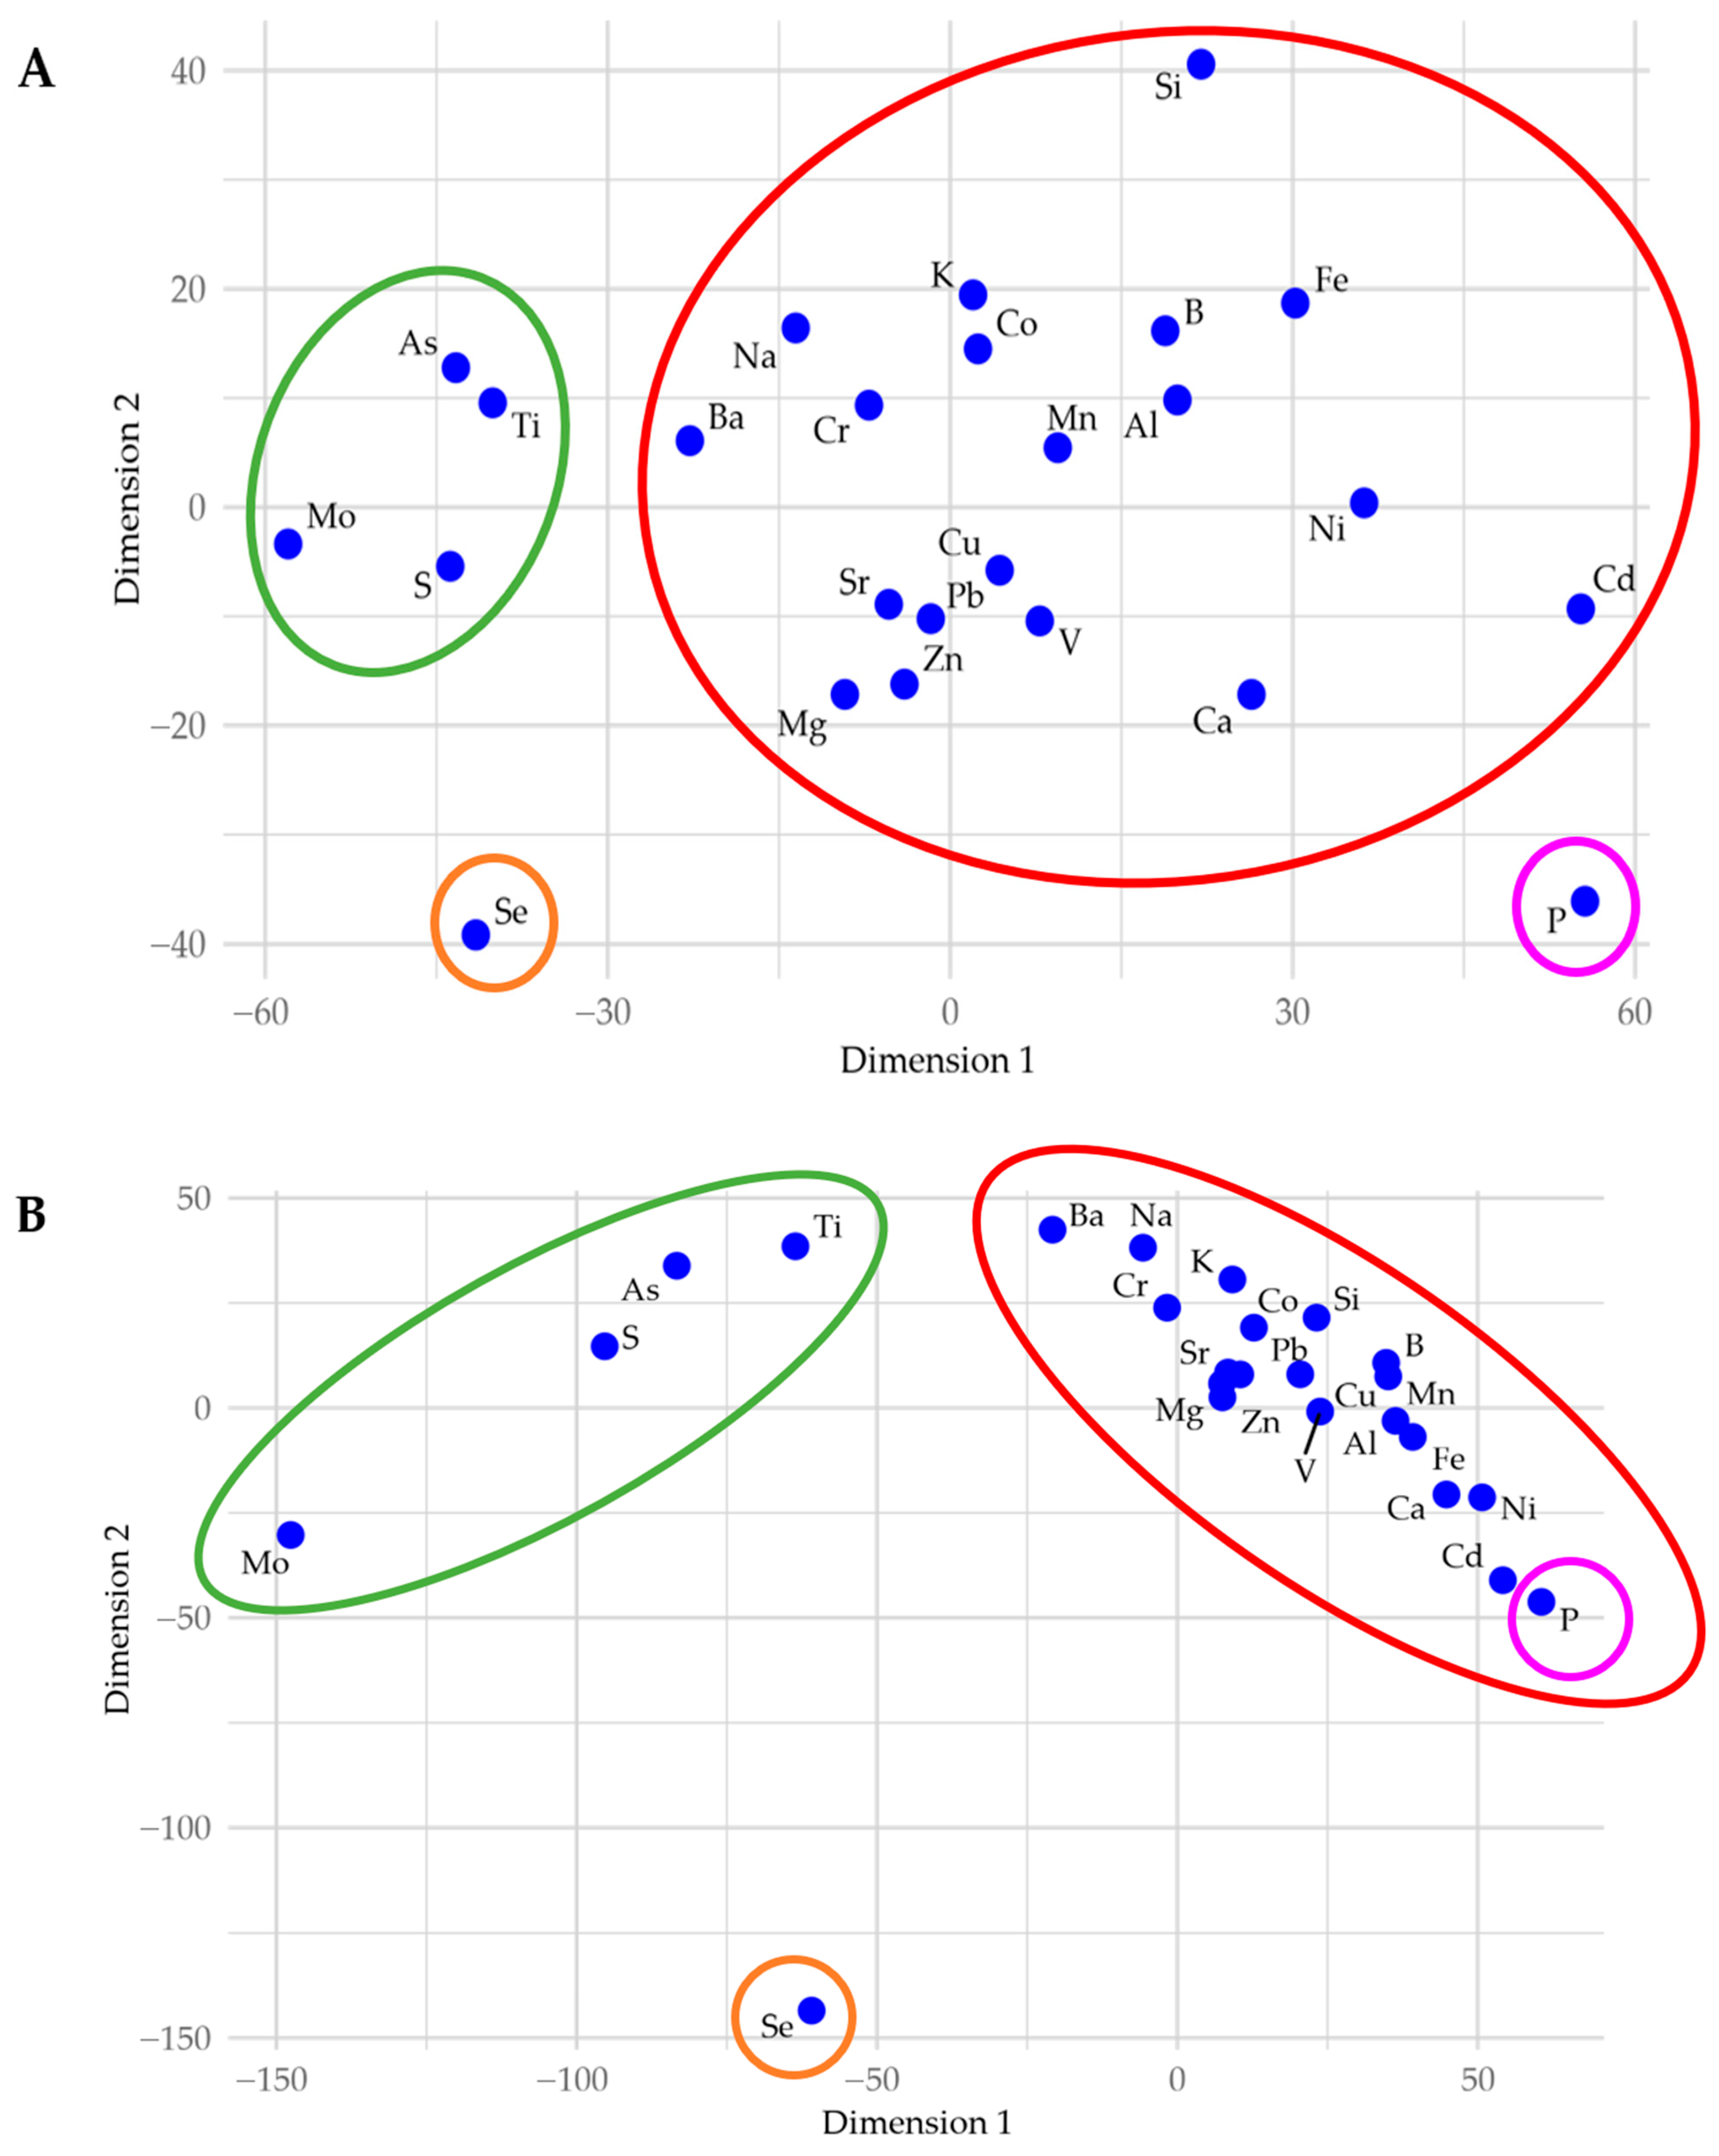
For our MDS analyses of elemental concentration (Figure 8), the Manhattan and Euclidean distance metrics had the highest Spearman rank correlations, with ρ = 0.922 and 0.875, respectively. When plotted in two-parameter MDS-space, the Manhattan and Euclidean distances form a similar distribution patterns, isolating P and Se, while creating a loose cluster with As, Mo, S, and Ti, as well as a larger cluster encompassing most other elements. The MDS plot with Canberra distances (ρ = 0.874) emphasizes this clustering pattern, further isolating Se while distancing the loose cluster of As, Mo, S, and Ti even more from the cluster of the remaining elements.
In summary, our analytical methods found connections and groupings between elemental concentration and correlation frequency among most ICP-detectible elements in Utah Lake sediments.

3.2.3. Relationship with Sample Depth

When assessed collectively, the Pearson Correlation Coefficient values showed that correlations between sample depths was very strong, with 89% of elements strongly correlated with sediment depth. Individual trends emerged when we assessed single core samples, demonstrating the presence of localized effects across Utah Lake. When evaluating the correlation of concentration with depth, the elements that most frequently correlated positively with depth (i.e., increased with depth) were Mn, Al, Fe, K, and V. The elements that most frequently correlated negatively with depth (i.e., decreased with depth) were Ba, Cu, P, Pb, Sr, and Zn, while the elements that most frequently exhibited little-to-no correlation with depth were Se, Cr, Mo, Si, B, Cu, P, S, Ti, and Zn. Some elements, such as Cu and P, show up in more than one category depending on the individual core, thus demonstrating different depositional patterns across Utah Lake sediments.
All the core samples exhibited similar depth trends for multiple elements. The cores with ≥10 elements that showed moderate to strong positive correlations with depth were the Benjamin, Goshen North, Lindon Marina, North Shore, and Powell Slough cores. On the other hand, the cores with ≥10 elements that showed moderate to strong negative correlations with depth were the Airport, Goshen South, and Provo Bay cores. We expected these cores to have the most anthropological impact because they are located near shallow bays receiving direct inflows or, for the case of the Airport core, near the mouth of the Provo River. The majority of the elements in the remaining two sampling sites, Mosida and Saratoga Springs, showed little-to-no correlation with depth. Figure 9 displays the elemental trends in Benjamin and Provo Bay as examples of positive and negative correlations with depth for the majority of the elements.
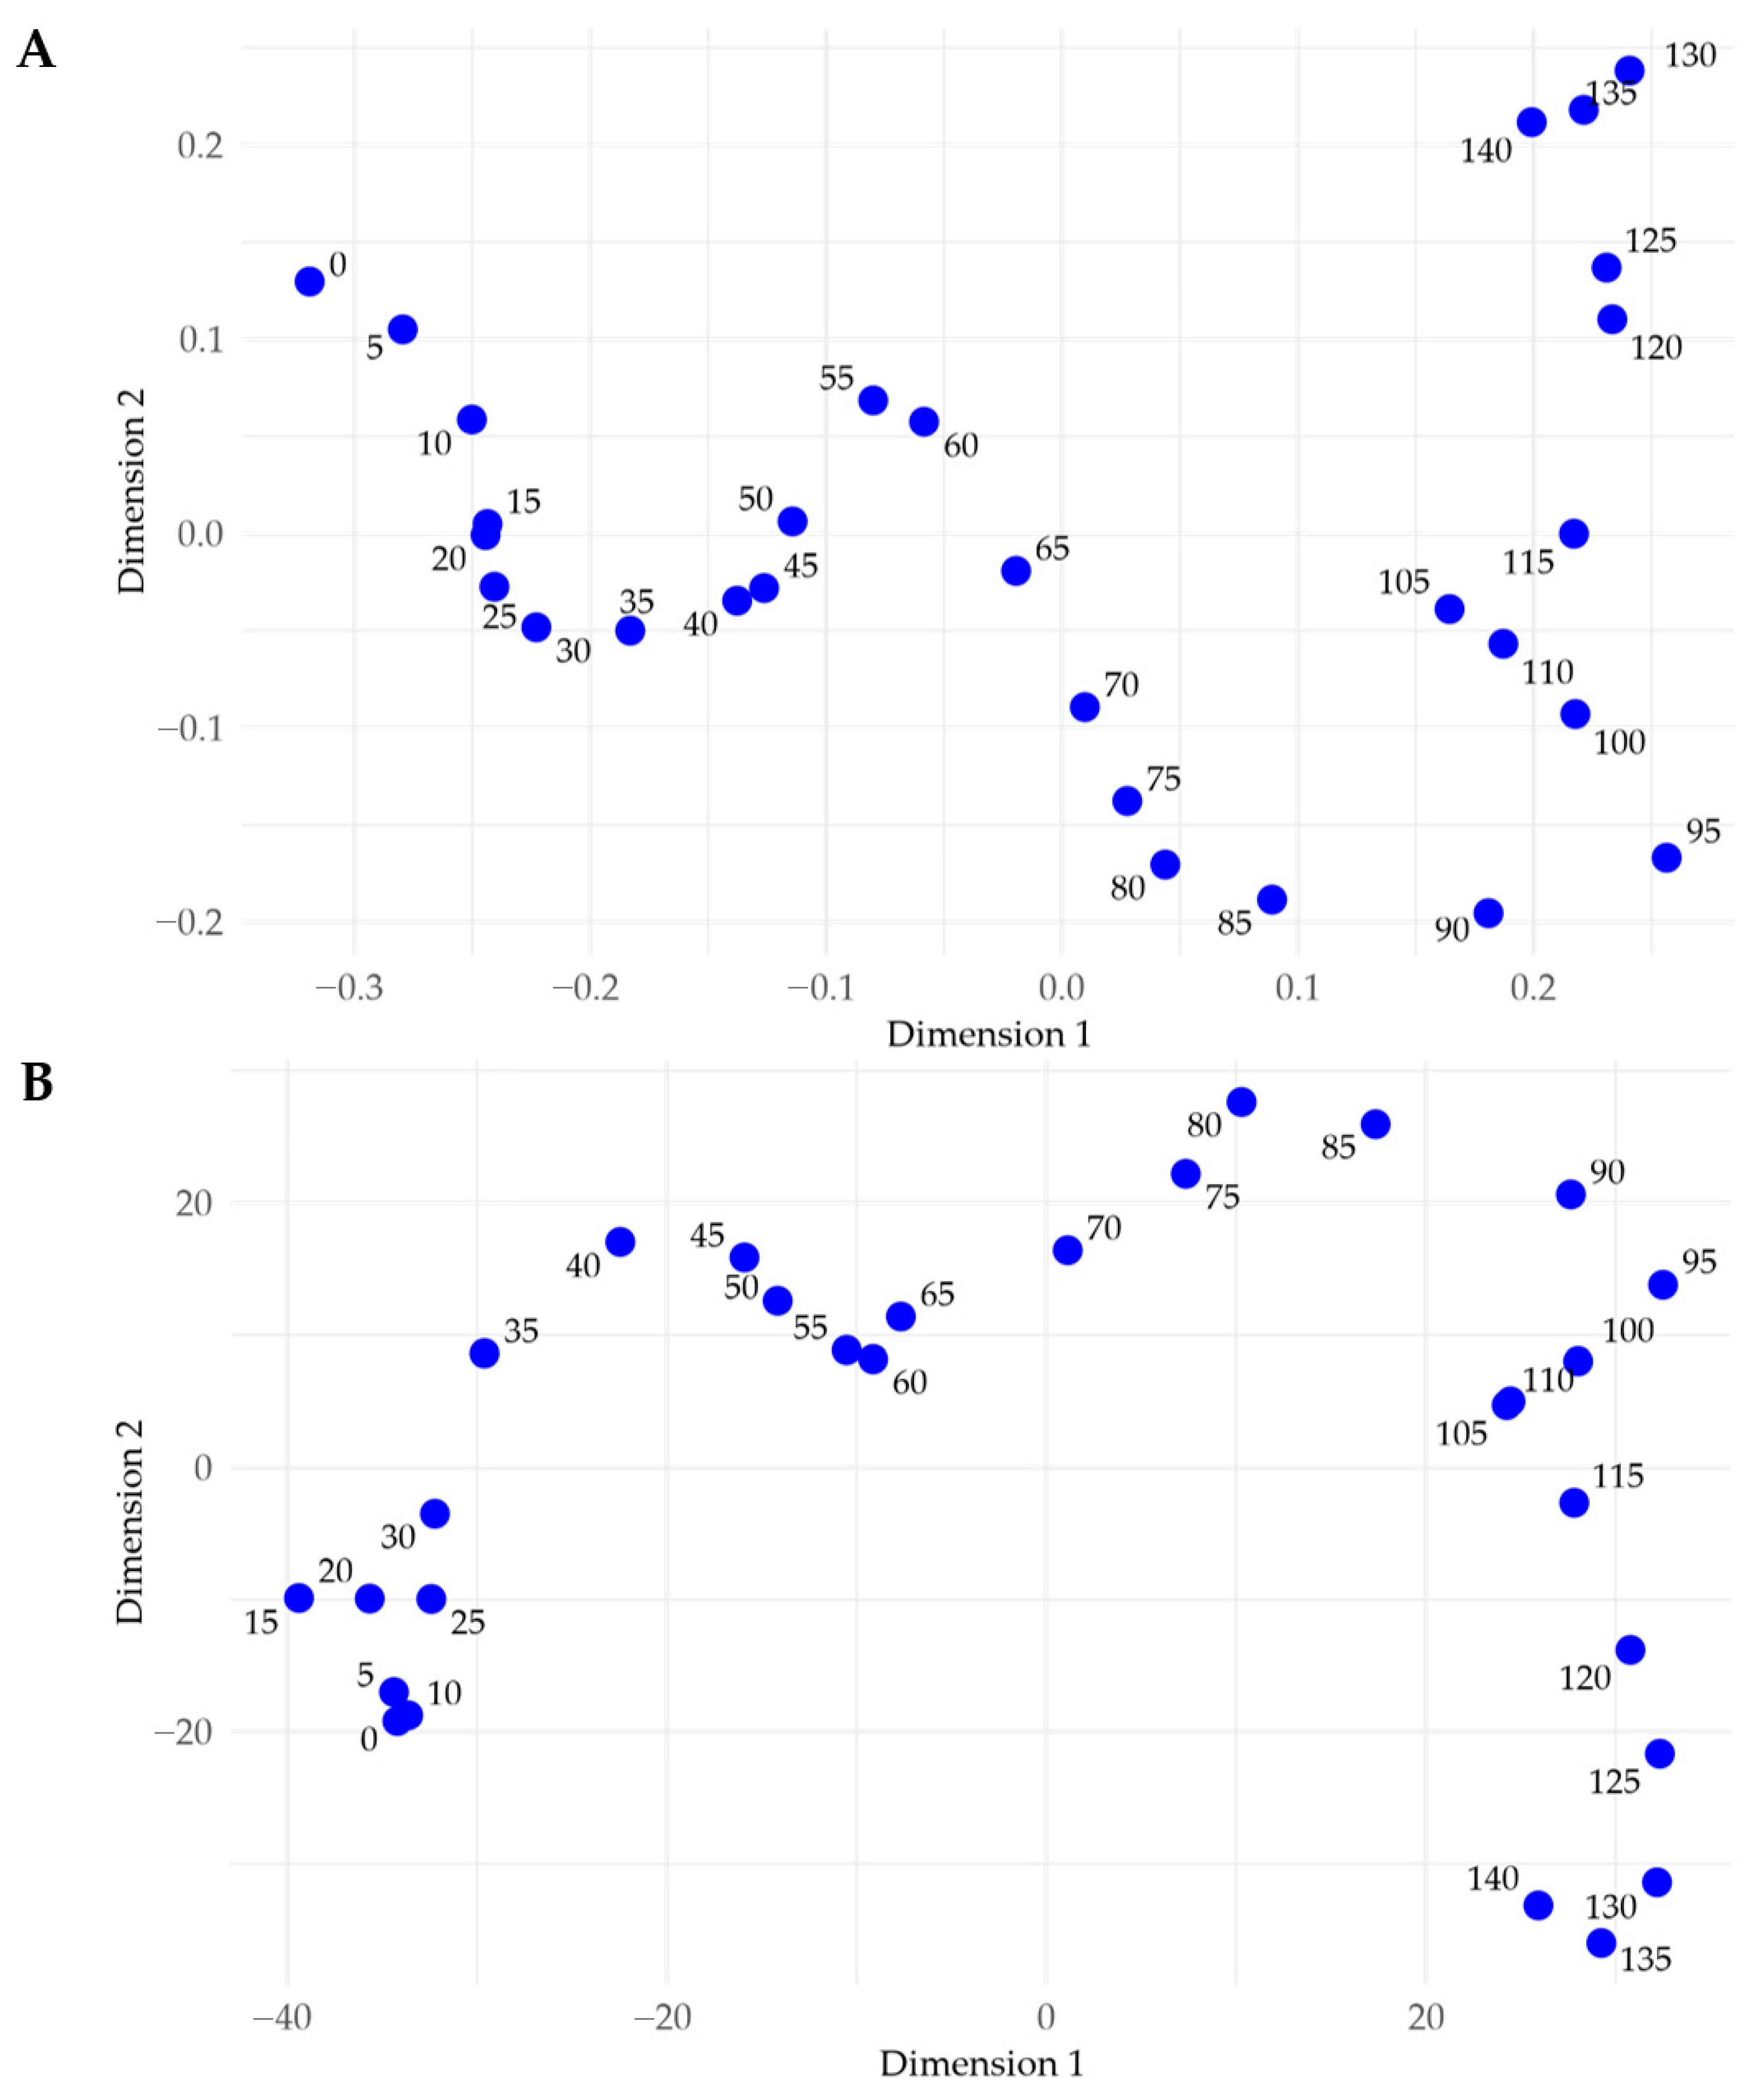
For the MDS analyses of sample depth, the Pearson Correlation Coefficient and Spectral Angle distance metrics had the highest Spearman rank correlations, with ρ = 0.963 and 0.925, respectively. The MDS plots for these and other distance measures all display meandering patterns of sample points arranged in an approximately sequential order (Figure 10). This demonstrates a continuous transition between subsample concentrations indicating that samples near the same depth are correlated with each other, as would be expected for depth-related data. Large breaks in these patterns suggest a shift in elemental composition. While breaks occur at different points for different distance measures, perhaps the most interesting break occurs between 30 and 40 cm in the plots for both the Canberra and Manhattan distances (ρ = 0.916 for both; this break is not present in the MDS plots using Pearson Correlation Coefficient distances). Previous Utah Lake sediment core studies have identified the approximate sediment depth coinciding with the arrival of European settlers at 30–40 cm depth [13,14,15]. A gap at this position supports the notion that Utah Lake experienced geochemical changes following European settlement and 20th century technology impacts. This break is supported and visible in Pb concentrations (Figure 9), which are high above about 40 cm, and low below that, which can be attributed to leaded gasoline in the mid-20th century. We attribute Pb in the lower part of this range, which is related to the late 19th and early 20th century, to sediment reworking and mixing. While Figure 10 displays several other notable gaps between data points, we did not assign chronological interpretations to them due to the absence of age constraints. Other breaks are apparent in the charts, with notable breaks between the depths of 85–90 and 115–120. These breaks likely represent changes in sedimentation processes, geologic changes, or environmental changes. However, as the goal of this paper is to characterize spatial patterns and anthropomorphic impacts, we did not attempt to characterize the processes that caused these breaks. Without dating the sediments at these levels, which we did not do, we cannot associate these breaks with other processes.
In summary, a variety of relationships exists between elemental concentration and sample depth. Mn, Al, Fe, K, and V often increase with depth, whereas Ba, Cu, Pb, Sr, and Zn often decrease with depth. For the three cores with larger anthropological impacts (i.e., A, PB, and BG), P decreases with depth unlike the majority of the lake. We found Se, Cr, Mo, Si, B, Cu, P, S, Ti, and Zn concentrations tend to remain consistent with depth. Broad trends in elemental concentration are often observed in Utah Lake sediments, with most core samples exhibiting a general increase with depth, although the opposite trend has been observed in some cores. Canberra and Manhattan distance metrics indicate that a geochemical shift occurs in Utah Lake sediments between 30 and 40 cm deep, coinciding with the arrival of European settlers, with Pb concentrations being the most visible indication of this trend [13,14,15].

3.2.4. Relationship with Sample Location

Pearson Correlation Coefficient analysis of sample locations revealed that only 4% of location comparisons yielded a strong correlation. The correlated locations were the Lindon Marina core with the North Shore core (r = 0.60), and the Mosida core with the Saratoga Springs core (r = 0.54). These correlations seem reasonable as the sites for these correlated samples share some geographic similarities. Both the Lindon Marina and North Shore cores were collected from the northern end of Utah Lake, and the Mosida and Saratoga Springs cores were collected as close as possible to the Lake Mountains before we encountered rocky sediment. While strong correlations between sampling sites were not common, most showed moderate correlations with at least one other site except for the Goshen North core, which did not correlate with any other locations.
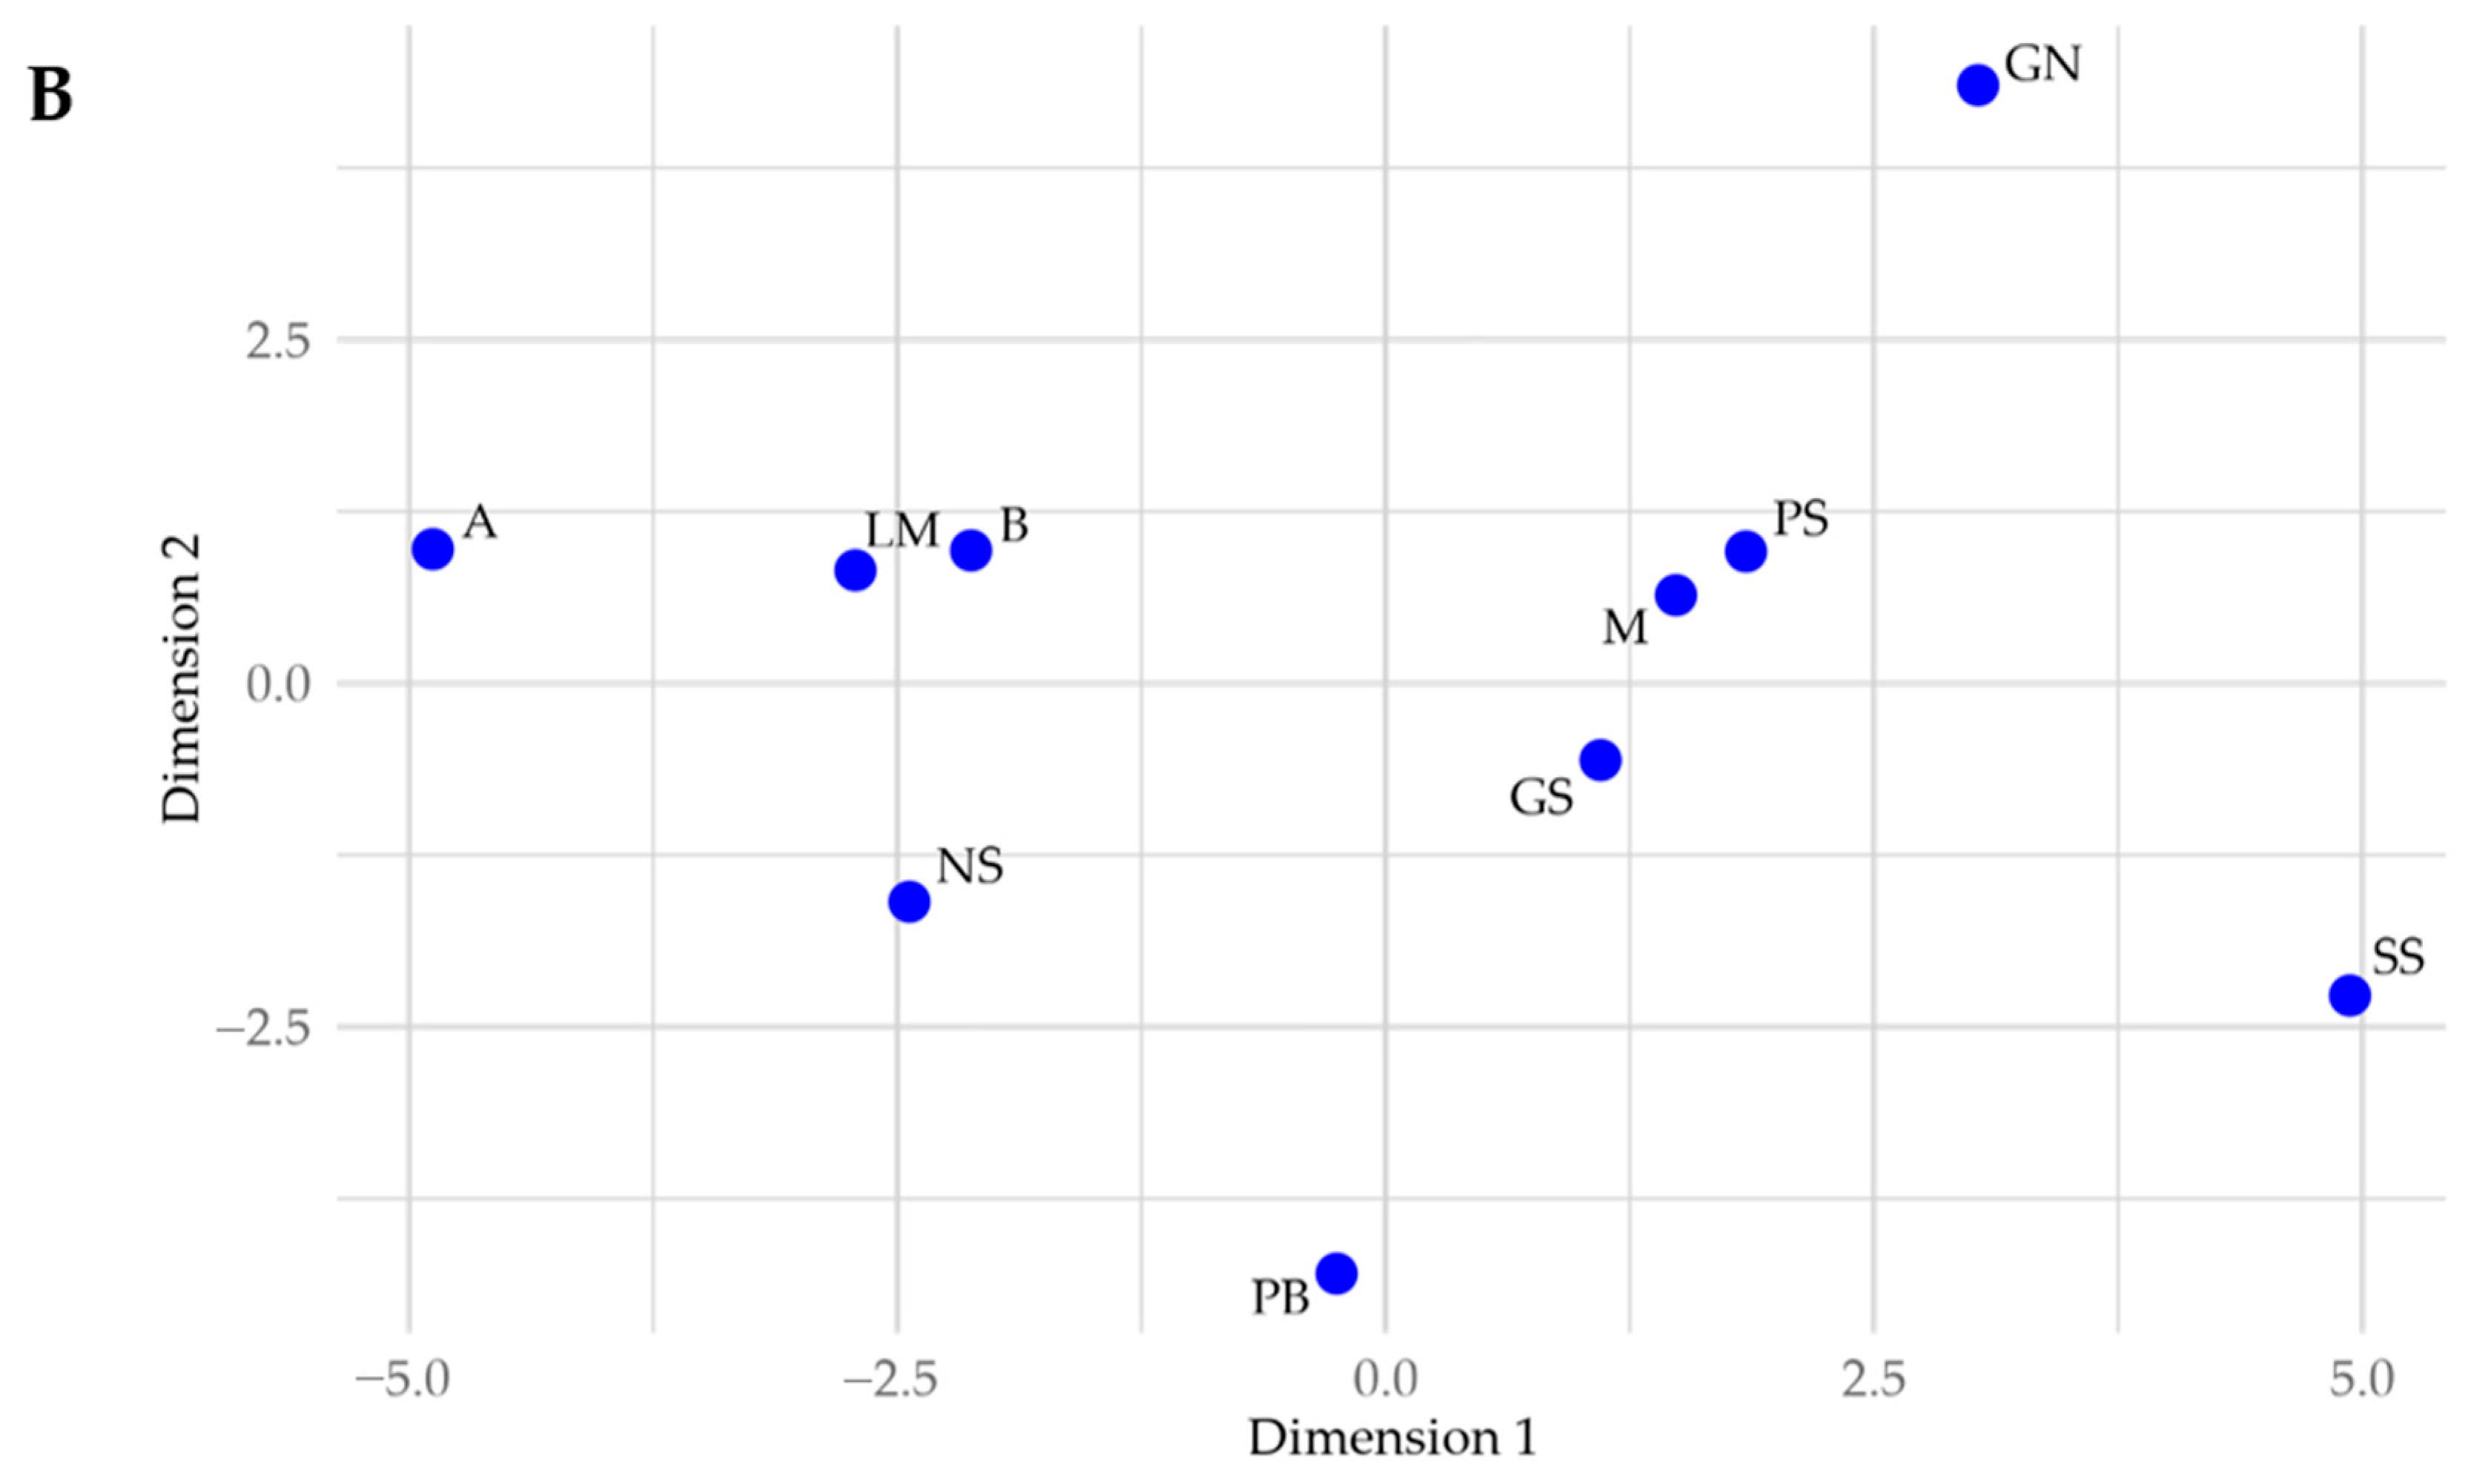
For the MDS analyses of sample locations, the Canberra and Euclidean distance metrics had the highest Spearman rank correlations, with ρ = 0.929 and 0.917, respectively. However, MDS plots generated using each distance metric isolate different sampling locations (Figure 11), with the Canberra distances primarily isolating the Airport core while the Euclidean distances also isolating the Airport core in addition to the Goshen North, Saratoga Springs, and Provo Bay cores. The uniqueness of some of these cores is readily apparent, such as the large anthropogenic impact on Provo Bay or the sandiness of the Airport core. The uniqueness of the other isolated cores is less obvious.
In summary, considering that we compared data from only 10 sampling sites, our analytical methods had limited capacity to detect extensive relationships or irregularities. However, we found that the Lindon Marina and North Shore cores were geochemically correlated, as were the Mosida and Saratoga Springs cores. In contrast, the Airport, Goshen North, and Provo Bay cores appeared to be the most geochemically distinct from the other cores around the lake.

3.3. Fractional Calcium Carbonate

We collected six subsamples from each of the 10 sediment cores for fractional CaCO3 analysis, totaling 60 samples (Figure 12). While there were no apparent CaCO3 trends with sediment depth, the CaCO3 content appears to be associated with sediment texture, with siltier samples having moderate to high levels of CaCO3, whereas sandy samples exhibited much lower levels of CaCO3. The median CaCO3 content for all subsamples was 23 wt.%, with three quarters of the subsamples falling between 15 and 30 wt.%. Of the remaining subsamples, nearly a tenth exceeded 30 wt.% with the remainder falling below 15 wt.%. The samples above 30 wt.% included the topmost portions of the Powell Slough core (<75 cm) and the deepest subsamples from the Mosida core (>80). On the other hand, the samples below 15 wt.% included all samples from the Airport core, the topmost subsamples from the Saratoga Springs core (0 cm), and deeper subsamples from the Goshen North core (112 cm). This high CaCO3 level can be attributed to the surrounding mountains, which are predominantly limestone, as well as the geochemistry of the lake. In the late summer, Utah Lake loses about half of is volume to evaporation, resulting in CaCO3 precipitation from the water column [20].

3.4. Loss on Ignition

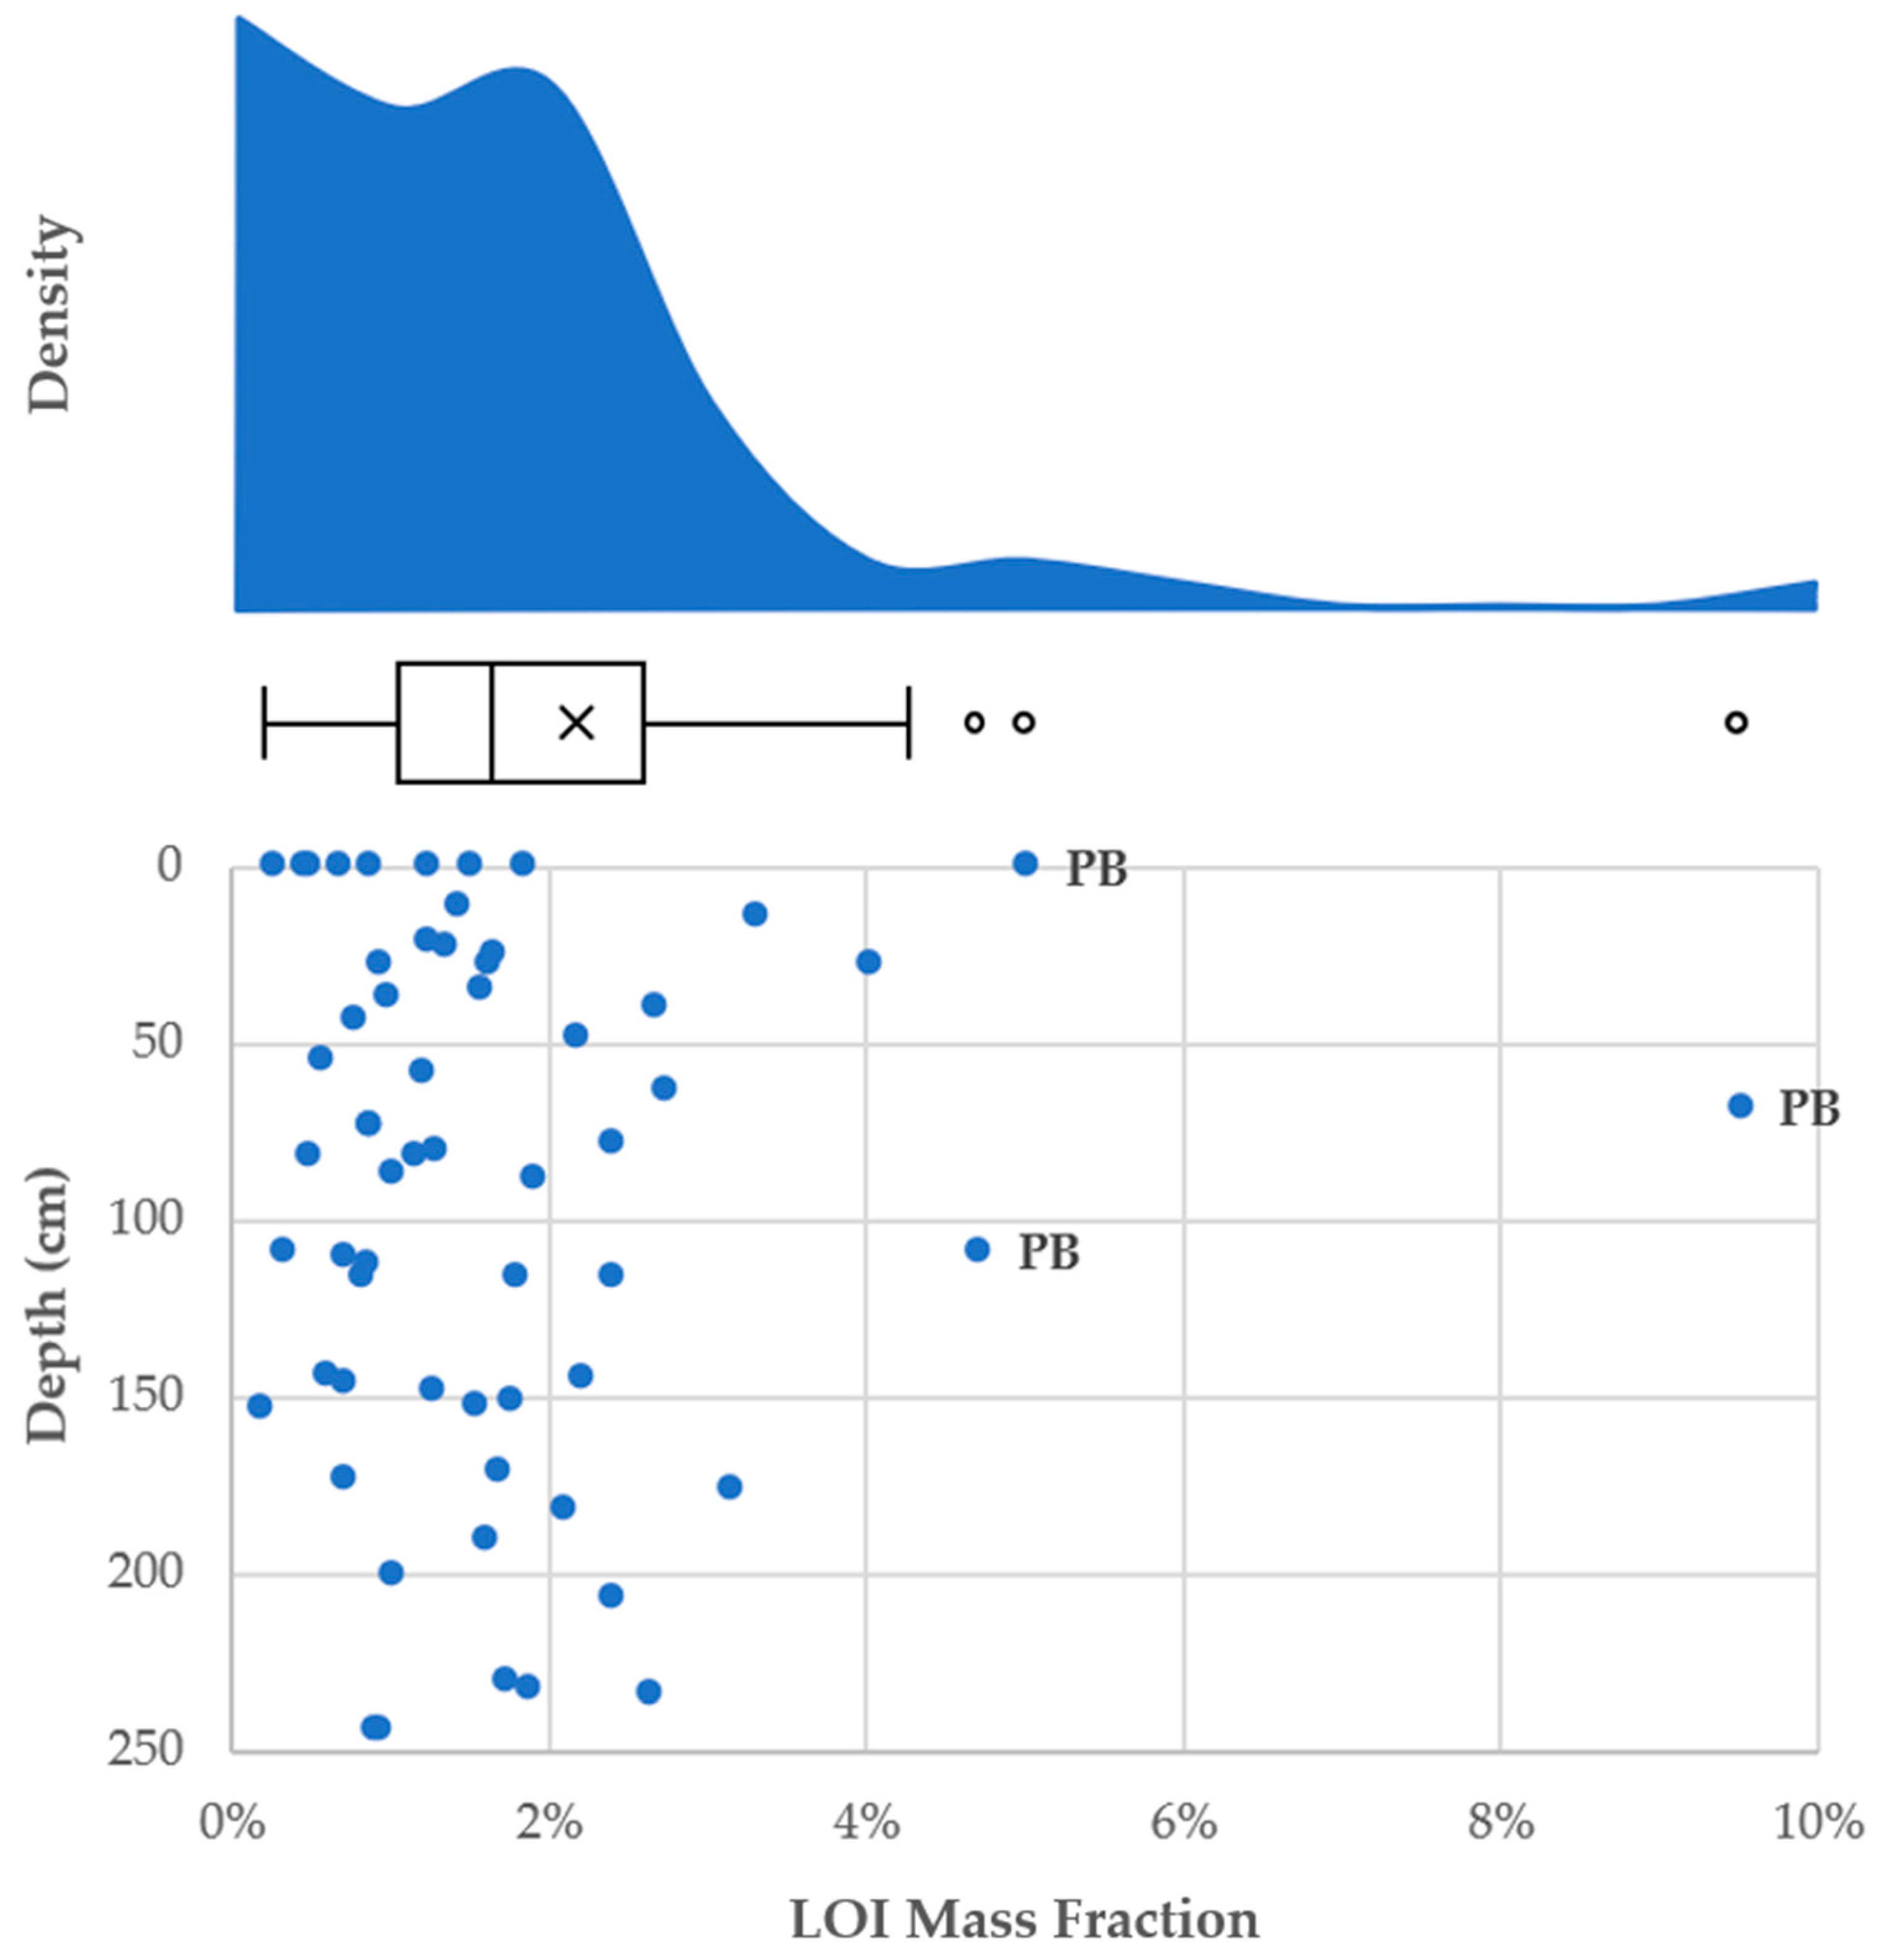
We collected duplicate subsamples for proxy fractional OM analysis from the same sediment layers sampled for fractional CaCO3 analysis, producing 60 LOI samples (Figure 13). The samples have a median LOI value of 1.3 wt.%, with the majority of subsamples (90%) falling below 3.0 wt.%. The subsamples that exceed 3.0 wt.% came exclusively from the bays and were usually less than 1 m deep. These samples included most subsamples from the Provo Bay core (<230 cm) and the topmost and bottommost subsamples from the Goshen South core (<40 cm and 234 cm, respectively). This, in part, explains why these cores exhibit different patterns or trends than the other cores, as OM can strongly sorb the metals analyzed as part of this study.

3.5. Sediment Phosphorus

3.5.1. The Use of Sediment Phosphorus for Paleolimnological Studies

Because P is a key nutrient that regulates the productivity of water bodies, sediment core P has the potential to reveal historical trends in P loading and trophic status. This process, however, is not always straightforward. Sediment profiles for total P (as measured in this study) are useful for determining the current trophic status of a lake [38], but the mobility of P in sediments (particularly P associated with redox-sensitive materials along with sediment reworking from waves and bioturbation) causes total P depth trends to not necessarily reflect historical P loading to lakebed sediments [39].
The analysis of less-mobile P fractions through sequential extraction procedures is a promising alternative, but such methods must account for the unique chemical behavior of each water body and its sediments [2]. Researchers are developing a method to use P coprecipitated with CaCO3 to study historical P loading and trophic status of Utah Lake prior to the arrival of European settlers [12,14]. While this method shows potential, sediment reworking will still be an issue. Further research is needed to determine whether CaCO3-P extraction is more effective than Ca-P extraction and to determine how the formation of autogenic CaCO3-P or the potential dissolution of CaCO3-P might affect the reliability of a CaCO3-P extraction method.
The sediment core data from this study cannot be used to determine Utah Lake’s past trophic status or historical P loading. However, the key objective for this study was to provide additional data to better describe P distribution in sediment cores across Utah Lake. These data also provide a means for addressing and understanding the limitations of previous studies that relied on ≤4 shallow core samples to characterize the lake. By collecting 10 deeper lakebed cores from throughout Utah Lake and analyzing them for 25 ICP-detectible elements along with fractional CaCO3 and OM, we have created a dataset that provides deeper insights into P and its relationship with other chemical constituents in Utah Lake sediments. Brahney [14]

3.5.2. Phosphorus Concentration-Depth Profiles

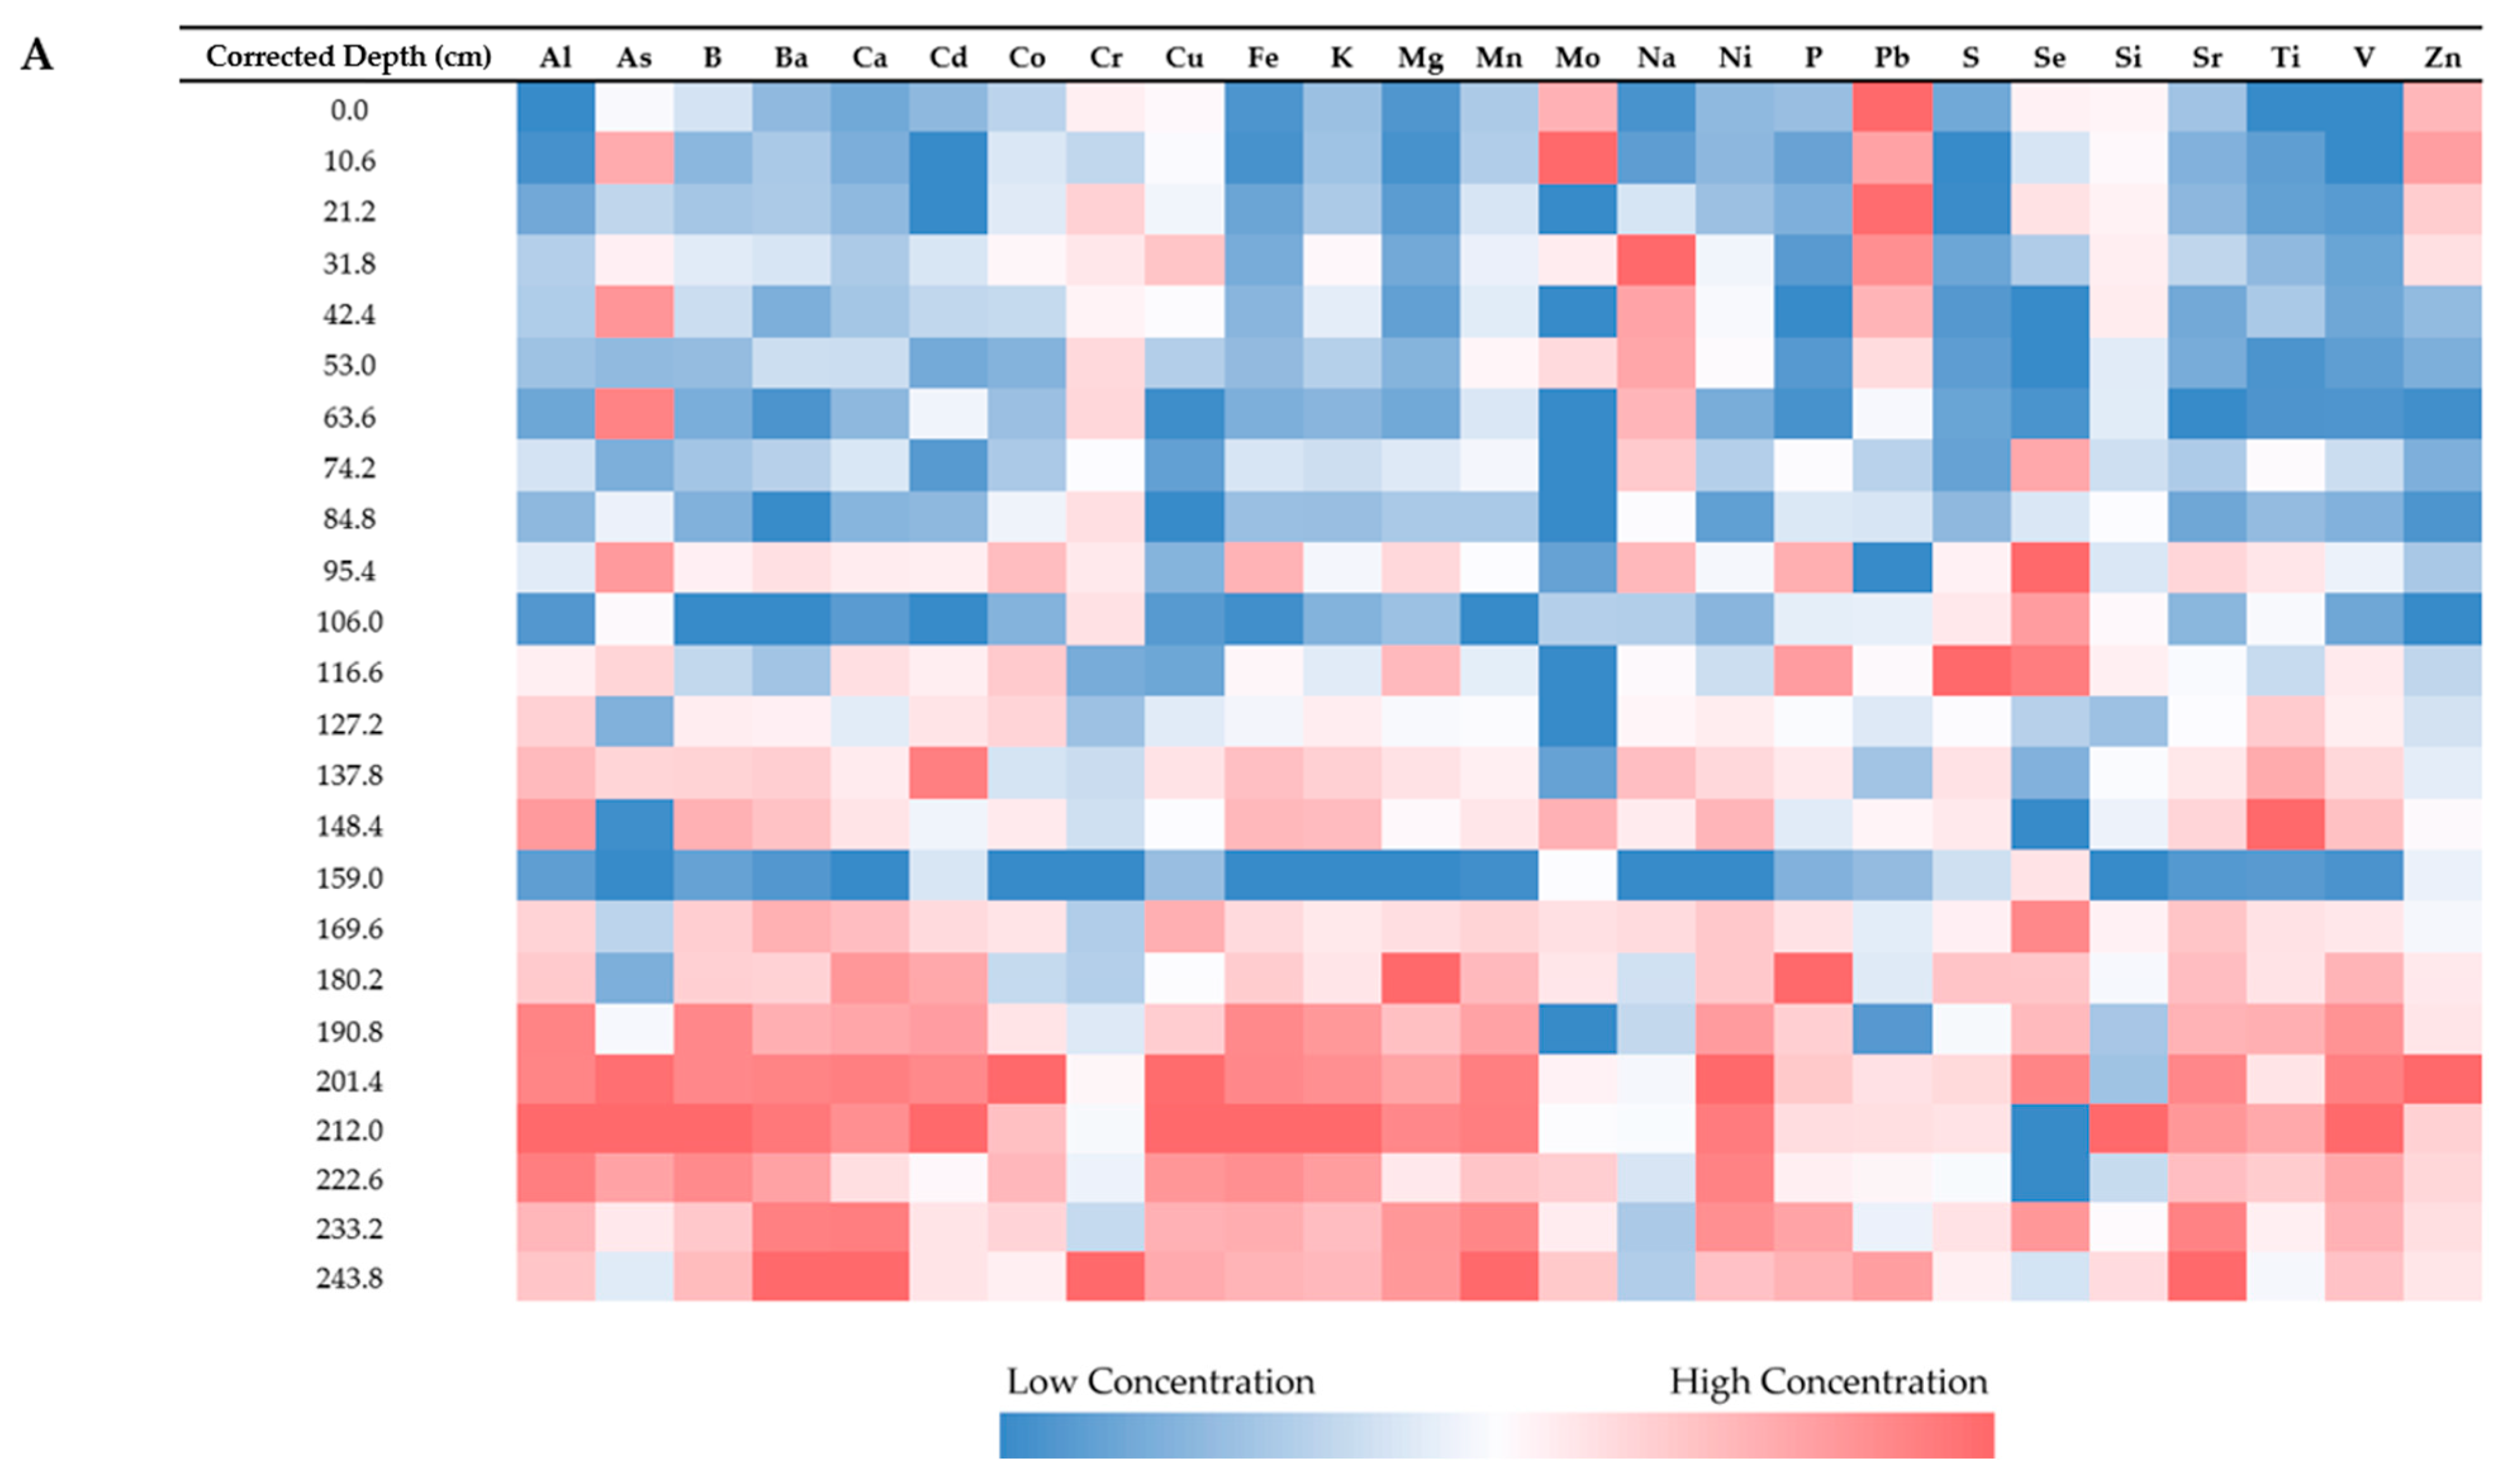
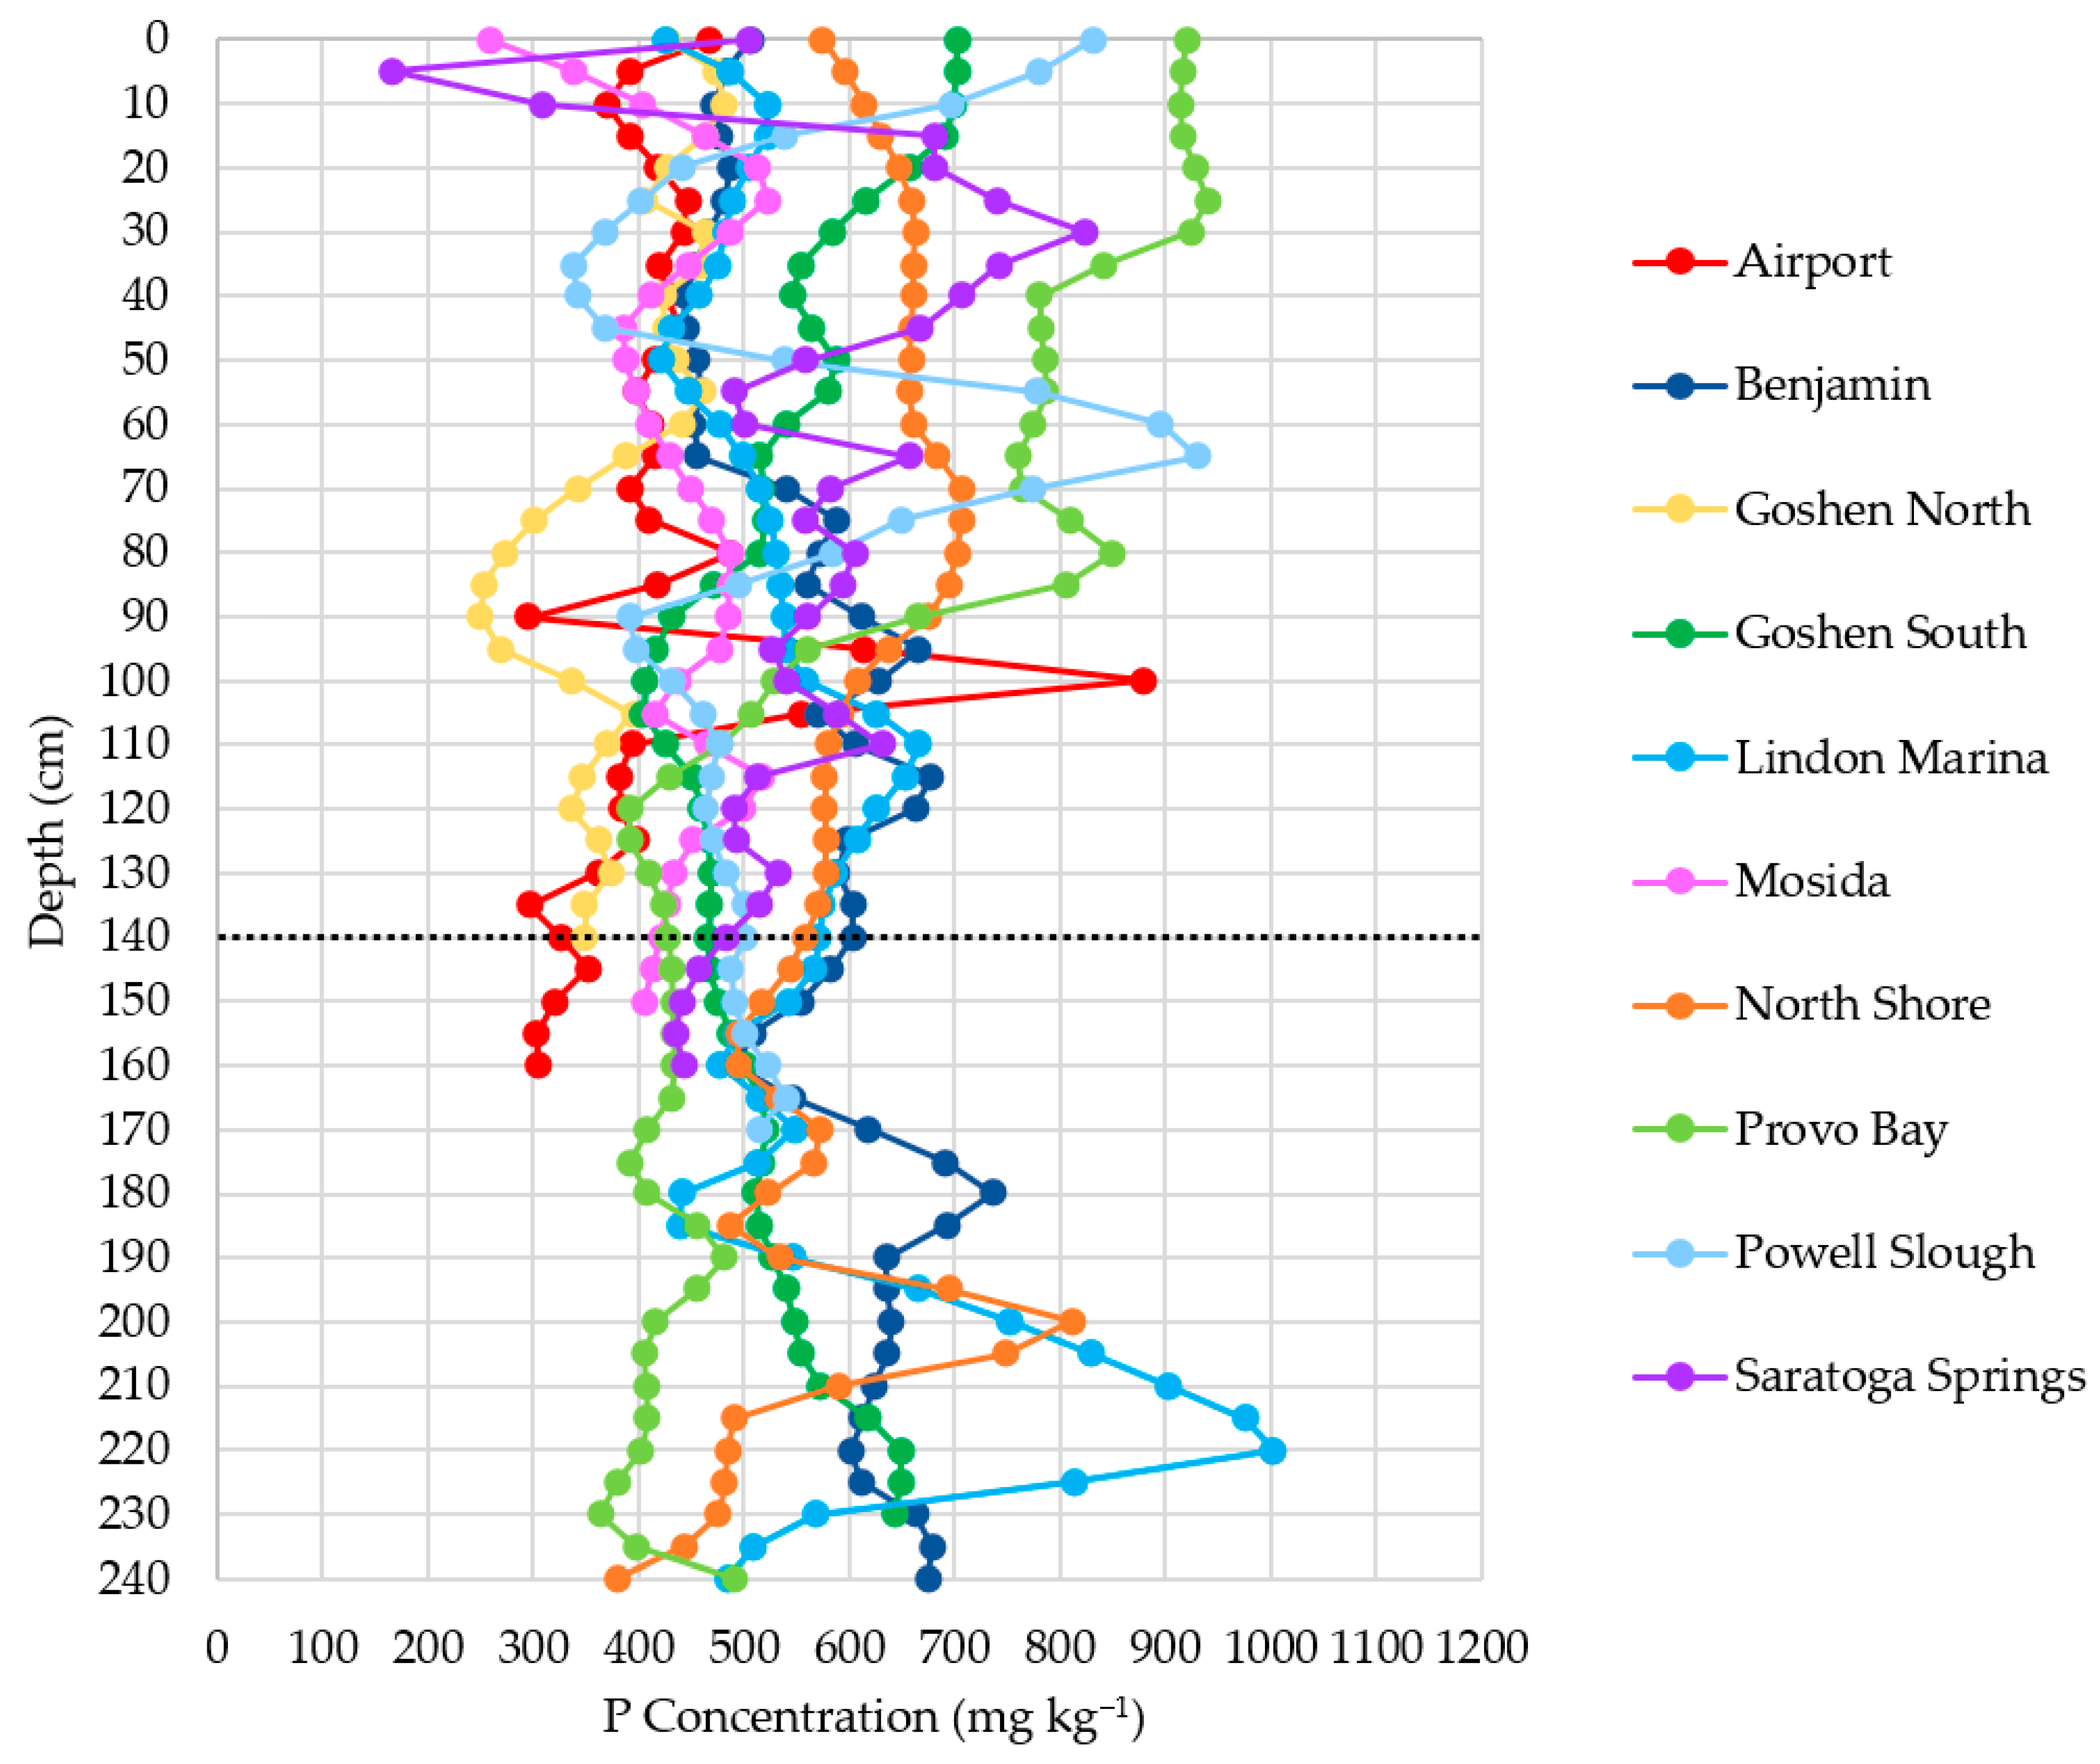
Sediment core P concentrations from our 10 sediment cores ranged from 166 to 941 mg kg−1, with an interquartile range of 428–606 mg kg−1, a median concentration of 498 mg kg−1, and a mean concentration of 530 mg kg−1. These data are visualized in greater detail in Figure 14, Figure 15 and Figure 16, which, respectively, present a connected scatterplot, depth distributions, and a normalized heatmap of the data. These figures show that while P generally decreases with depth in the cores taken near the shallow bays (i.e., the Goshen North, Goshen South, and Provo Bay cores), this trend is not ubiquitous throughout the lake. The Benjamin and Lindon Marina cores instead show P increasing with depth, while most other core samples show elevated levels of P at intermediate depths, with lower concentrations in the shallower and deeper portions of the cores.
Carey and Rydin [38] explain that the mean sediment P profile within the top 30 cm of lakebed sediment corresponds to the trophic status of a lake. They found that sediment P increases with depth in oligotrophic lakes, remains consistent with depth in mesotrophic lakes, and decreases with depth in eutrophic lakes—a pattern confirmed by studies on other lakes [40,41]. This assumes that deposition profiles are not strongly mixed, and the deposited sediments are not mixed with material deposited at other times.
Figure 14 shows P concentrations with depth across all 10 of our sediment cores. This figure shows that while the cores generally follow similar patterns, there are large differences, especially from the surface to about 40 cm. The Provo Bay core is the most extreme example of this, having significantly high concentrations down to a depth of about 90 cm.
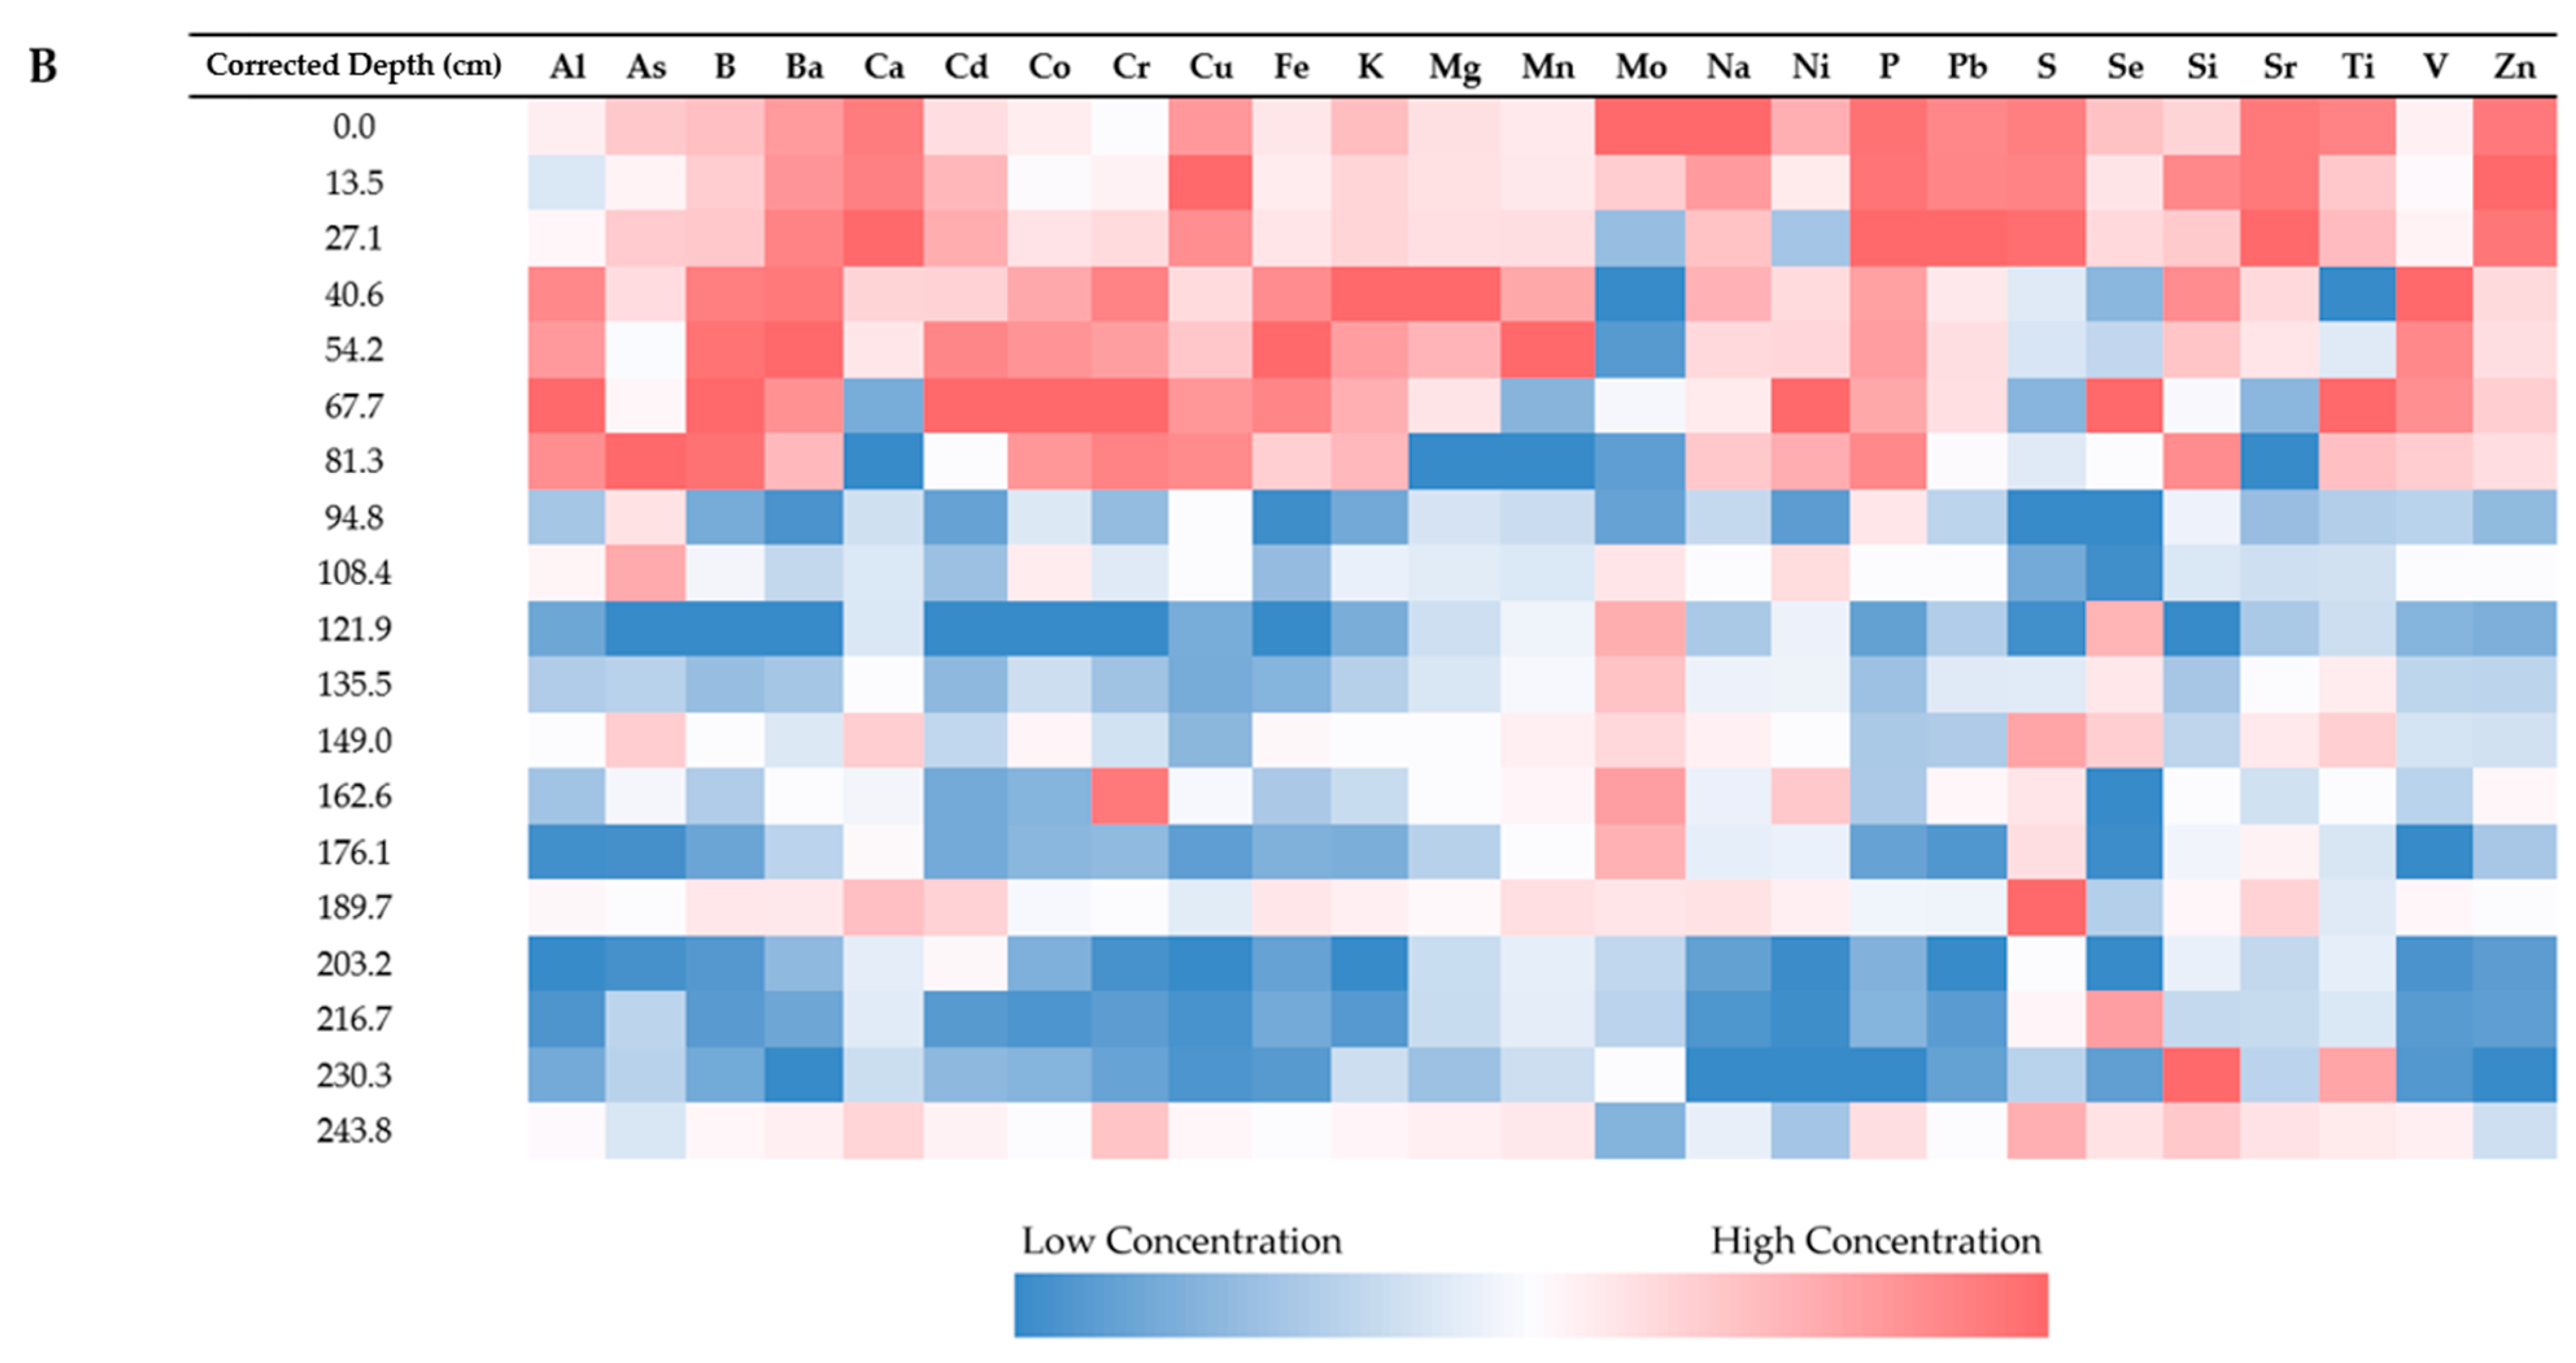
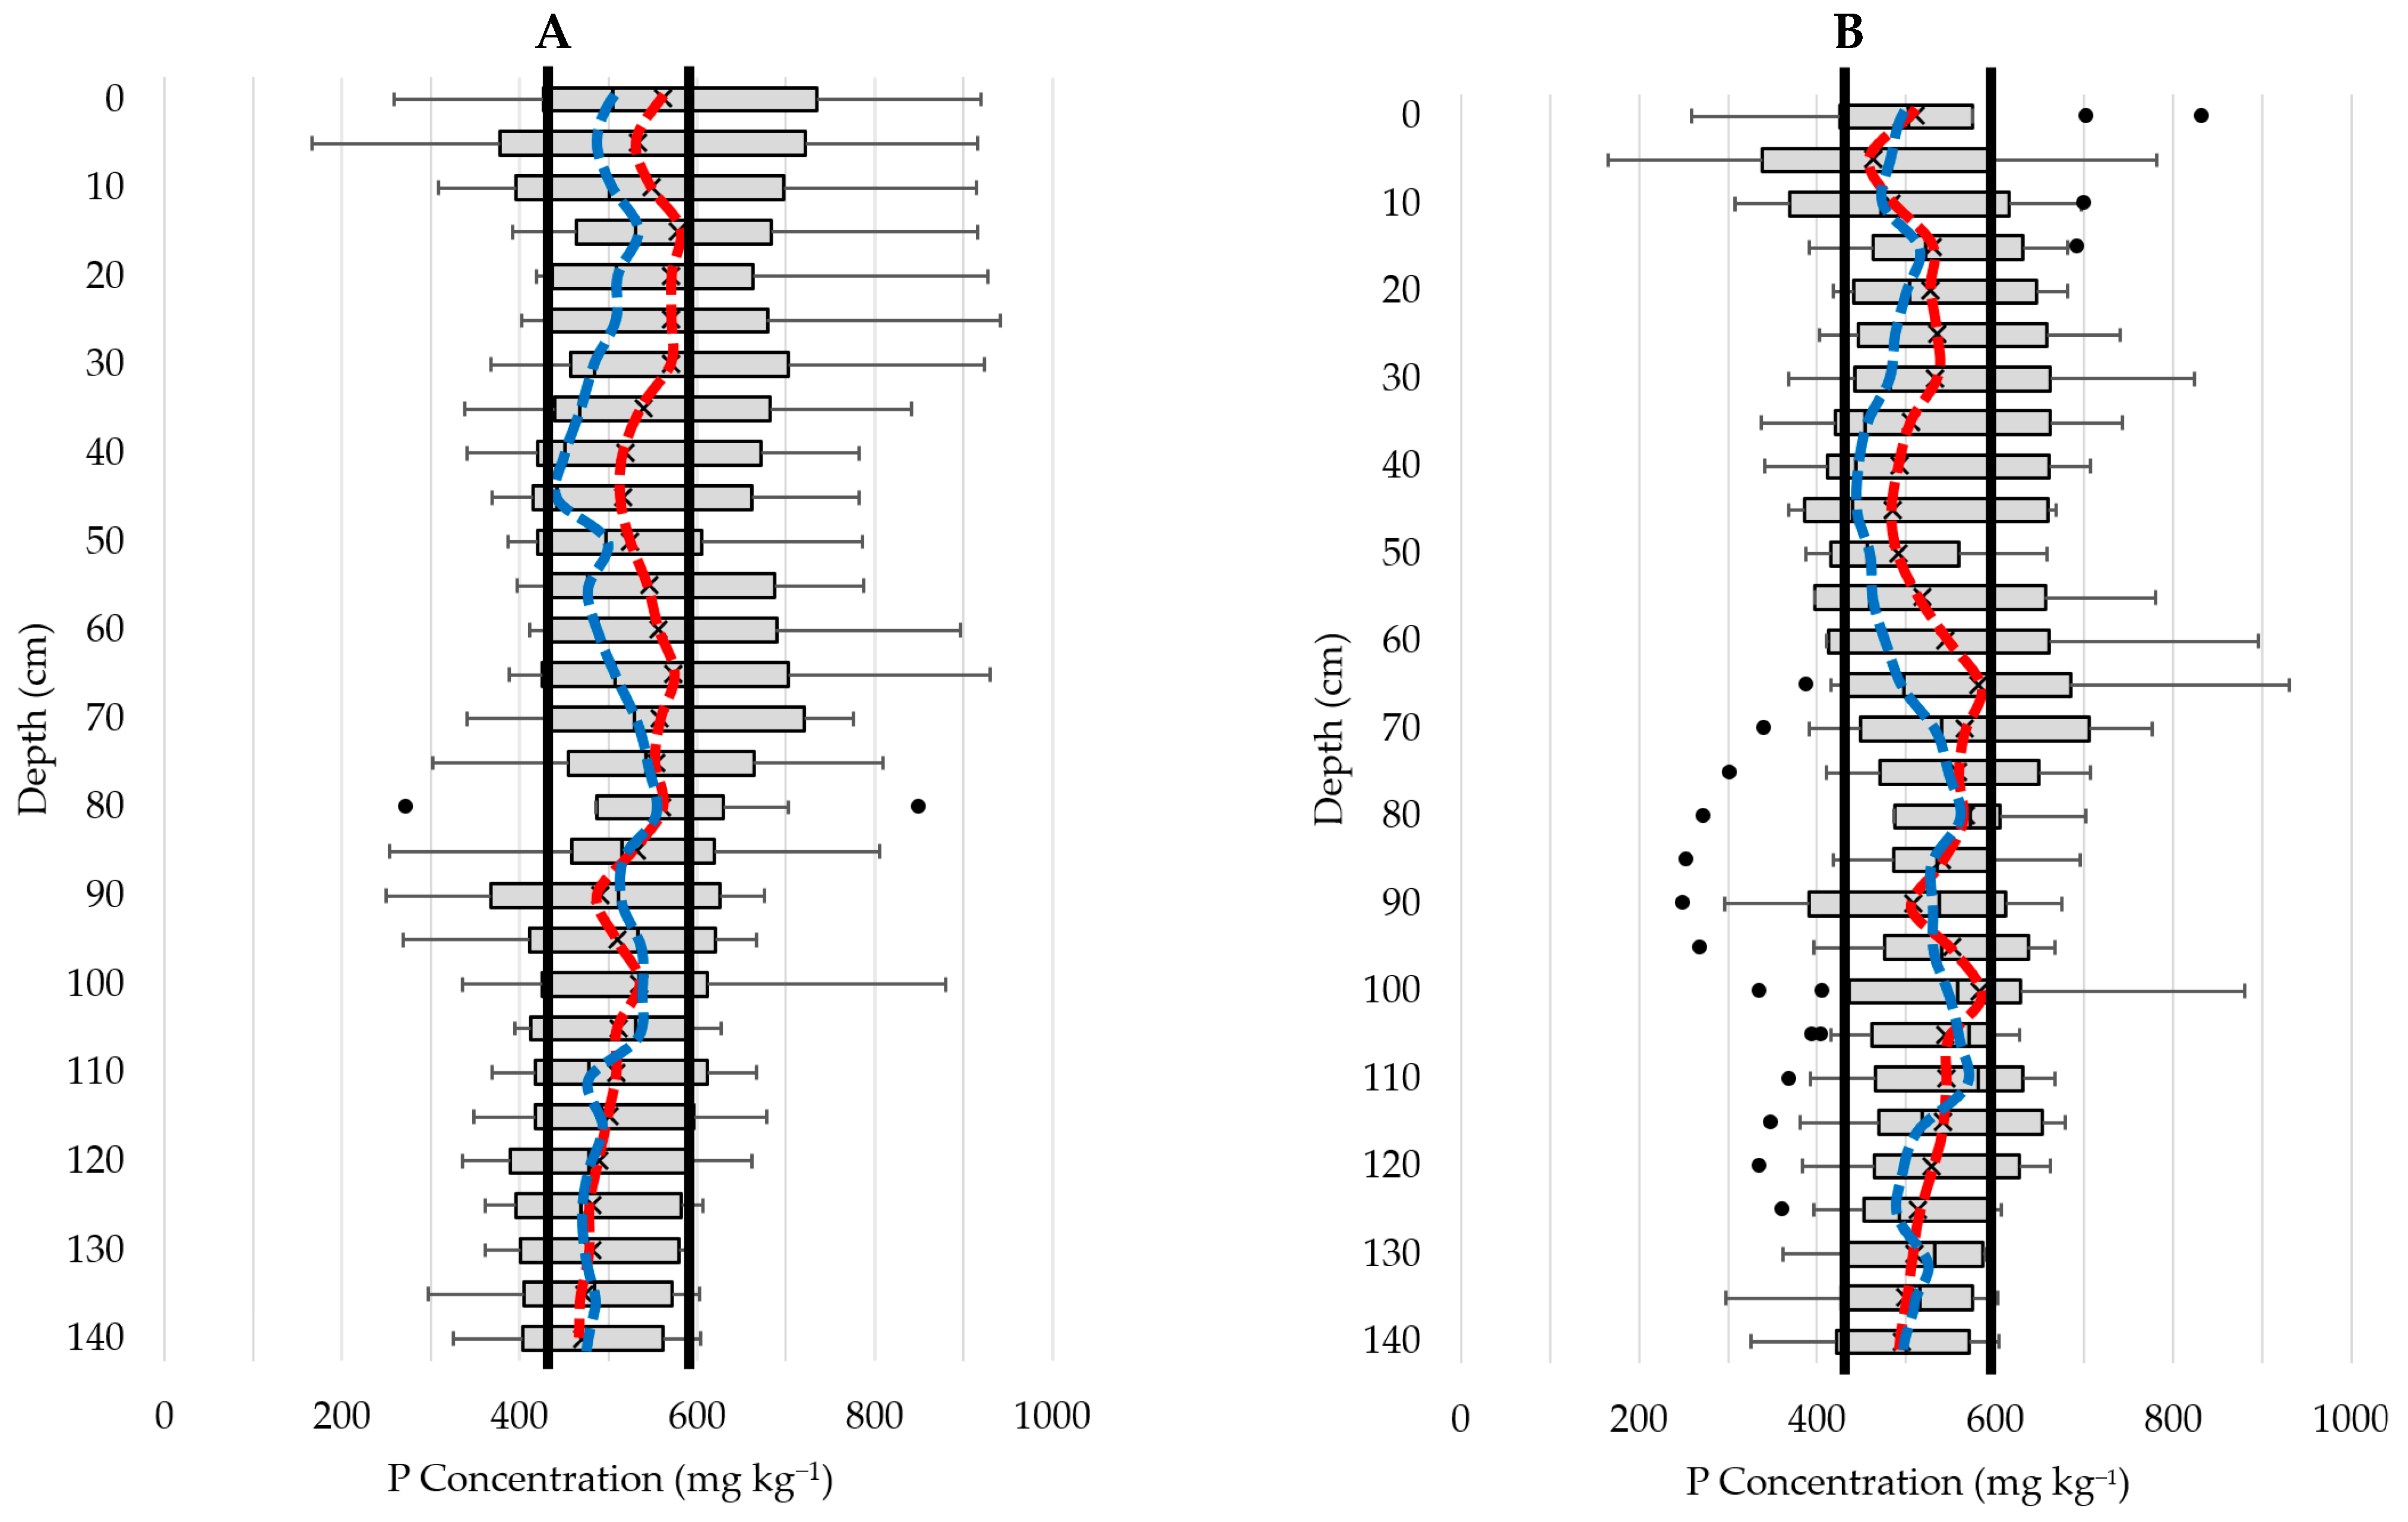
Figure 15A,B show the distribution of P at each depth for all the cores (Figure 15A) and all the cores excluding the cores from the shallow bays (Figure 15B). The figures show box-and-whisker plots with the median and mean values at each depth shown by blue and red dots, respectively. Figure 15A shows that the highest mean sediment P occurs at the surface, with concentrations dipping slightly before returning to elevated levels, and then remaining consistent down to 30 cm deep. After 30 cm the concentration drops until it increases to match the higher values at about 60 cm. The median values exhibit a similar trend, though less defined. Examining the shallow profile by itself suggests that Utah Lake is oligotrophic. However, when the entire profile is examined down to 140 cm deep, the overall trend is a gradual decrease in P with depth.
Figure 15B, which excludes the GN, GS, and PB cores (which were from the bays), presents a different insight into the trends of P concentrations with depth. The cores from the main body of the lake, unlike the cores near the bays, show that sediments from the surface to about 20 cm have relatively low P concentrations, with concentrations from 20 to 35 cm depth being relatively high. Concentrations dip until about 50 cm of depth, then rise to highest concentrations at about 70 cm, and continue to be high until approximately 100 cm, then decline slowly with depth. These data show that the lake outside the bays does not exhibit high P concentrations in the top 20 cm, which would be expected if P loads have increased since European settlement. However, there is an increase from about 20 to 40 cm depth, which would correlate with early settlement and changes in erosional patterns. Similar to Figure 15A, the median values show a less distinct pattern, although the trends generally align. Since the median is less influenced by outliers (defined as points below Q1 - 1.5 × IQR or above Q3 + 1.5 × IQR), it may provide a more accurate summary of lake behavior. This is particularly relevant because the P data are right-skewed, making the median a better indicator of the data’s central tendency.
While Utah Lake is unquestionably eutrophic, the sediment P profiles of individual core samples do not correspond with the sediment P profiles expected in a eutrophic lake apart from the cores taken near the bays (Figure 14 and Figure 15B). This phenomenon may be unique to Utah Lake and other shallow lakes because their lakebed sediments are more susceptible to being reworked, thus obscuring sediment P within the topmost portions of the lakebed. Deeper lakes with a more stable lakebed likely do not require more than 30 cm to identify the lake’s trophic status, but we hypothesize that shallow lakes require deeper sediment P profiles in order to accurately determine their trophic status. A more likely explanation unique to Utah Lake is that Utah Lake sediments have a high P concentrations attributed to geologic sources [17,18,42]. Thus the sediments act not only as a P sink, but can act as a P source due to sorption and diffusion [19], which means that the pattens normally exhibited by lake sediments in relation to trophic states may be less apparent and driven by geologic deposition.
This mismatch between the expected P profiles and the trophic state of Utah Lake for most of the cores underscores the importance of collecting numerous core samples to accurately represent large lakes, as variations in sediment composition across different areas may lead to misleading assessments of the lake’s trophic status. A larger number of samples is therefore needed to ensure a more reliable measurement of the lake’s sediment P content. It also highlights the need to consider other processes and environments in which published patterns may not exist because of unique local conditions.

3.5.3. Connection to Calcium and Iron

Our analysis identified P as having distinct behavioral trends among the ICP-detectible elements in Utah Lake sediments, and we attribute this to the following reasons:
  • P concentrations are less skewed than the other elements and have fewer outliers (Figure 7).
  • P has variable sediment depth trends, decreasing in concentration in some cores, remaining stable in others, and even increasing in some cases (Figure 14).
  • P is geochemically isolated, as highlighted by Manhattan distances in a multidimensional scaling (MDS) plot of lake-wide elemental concentrations (Figure 8A).
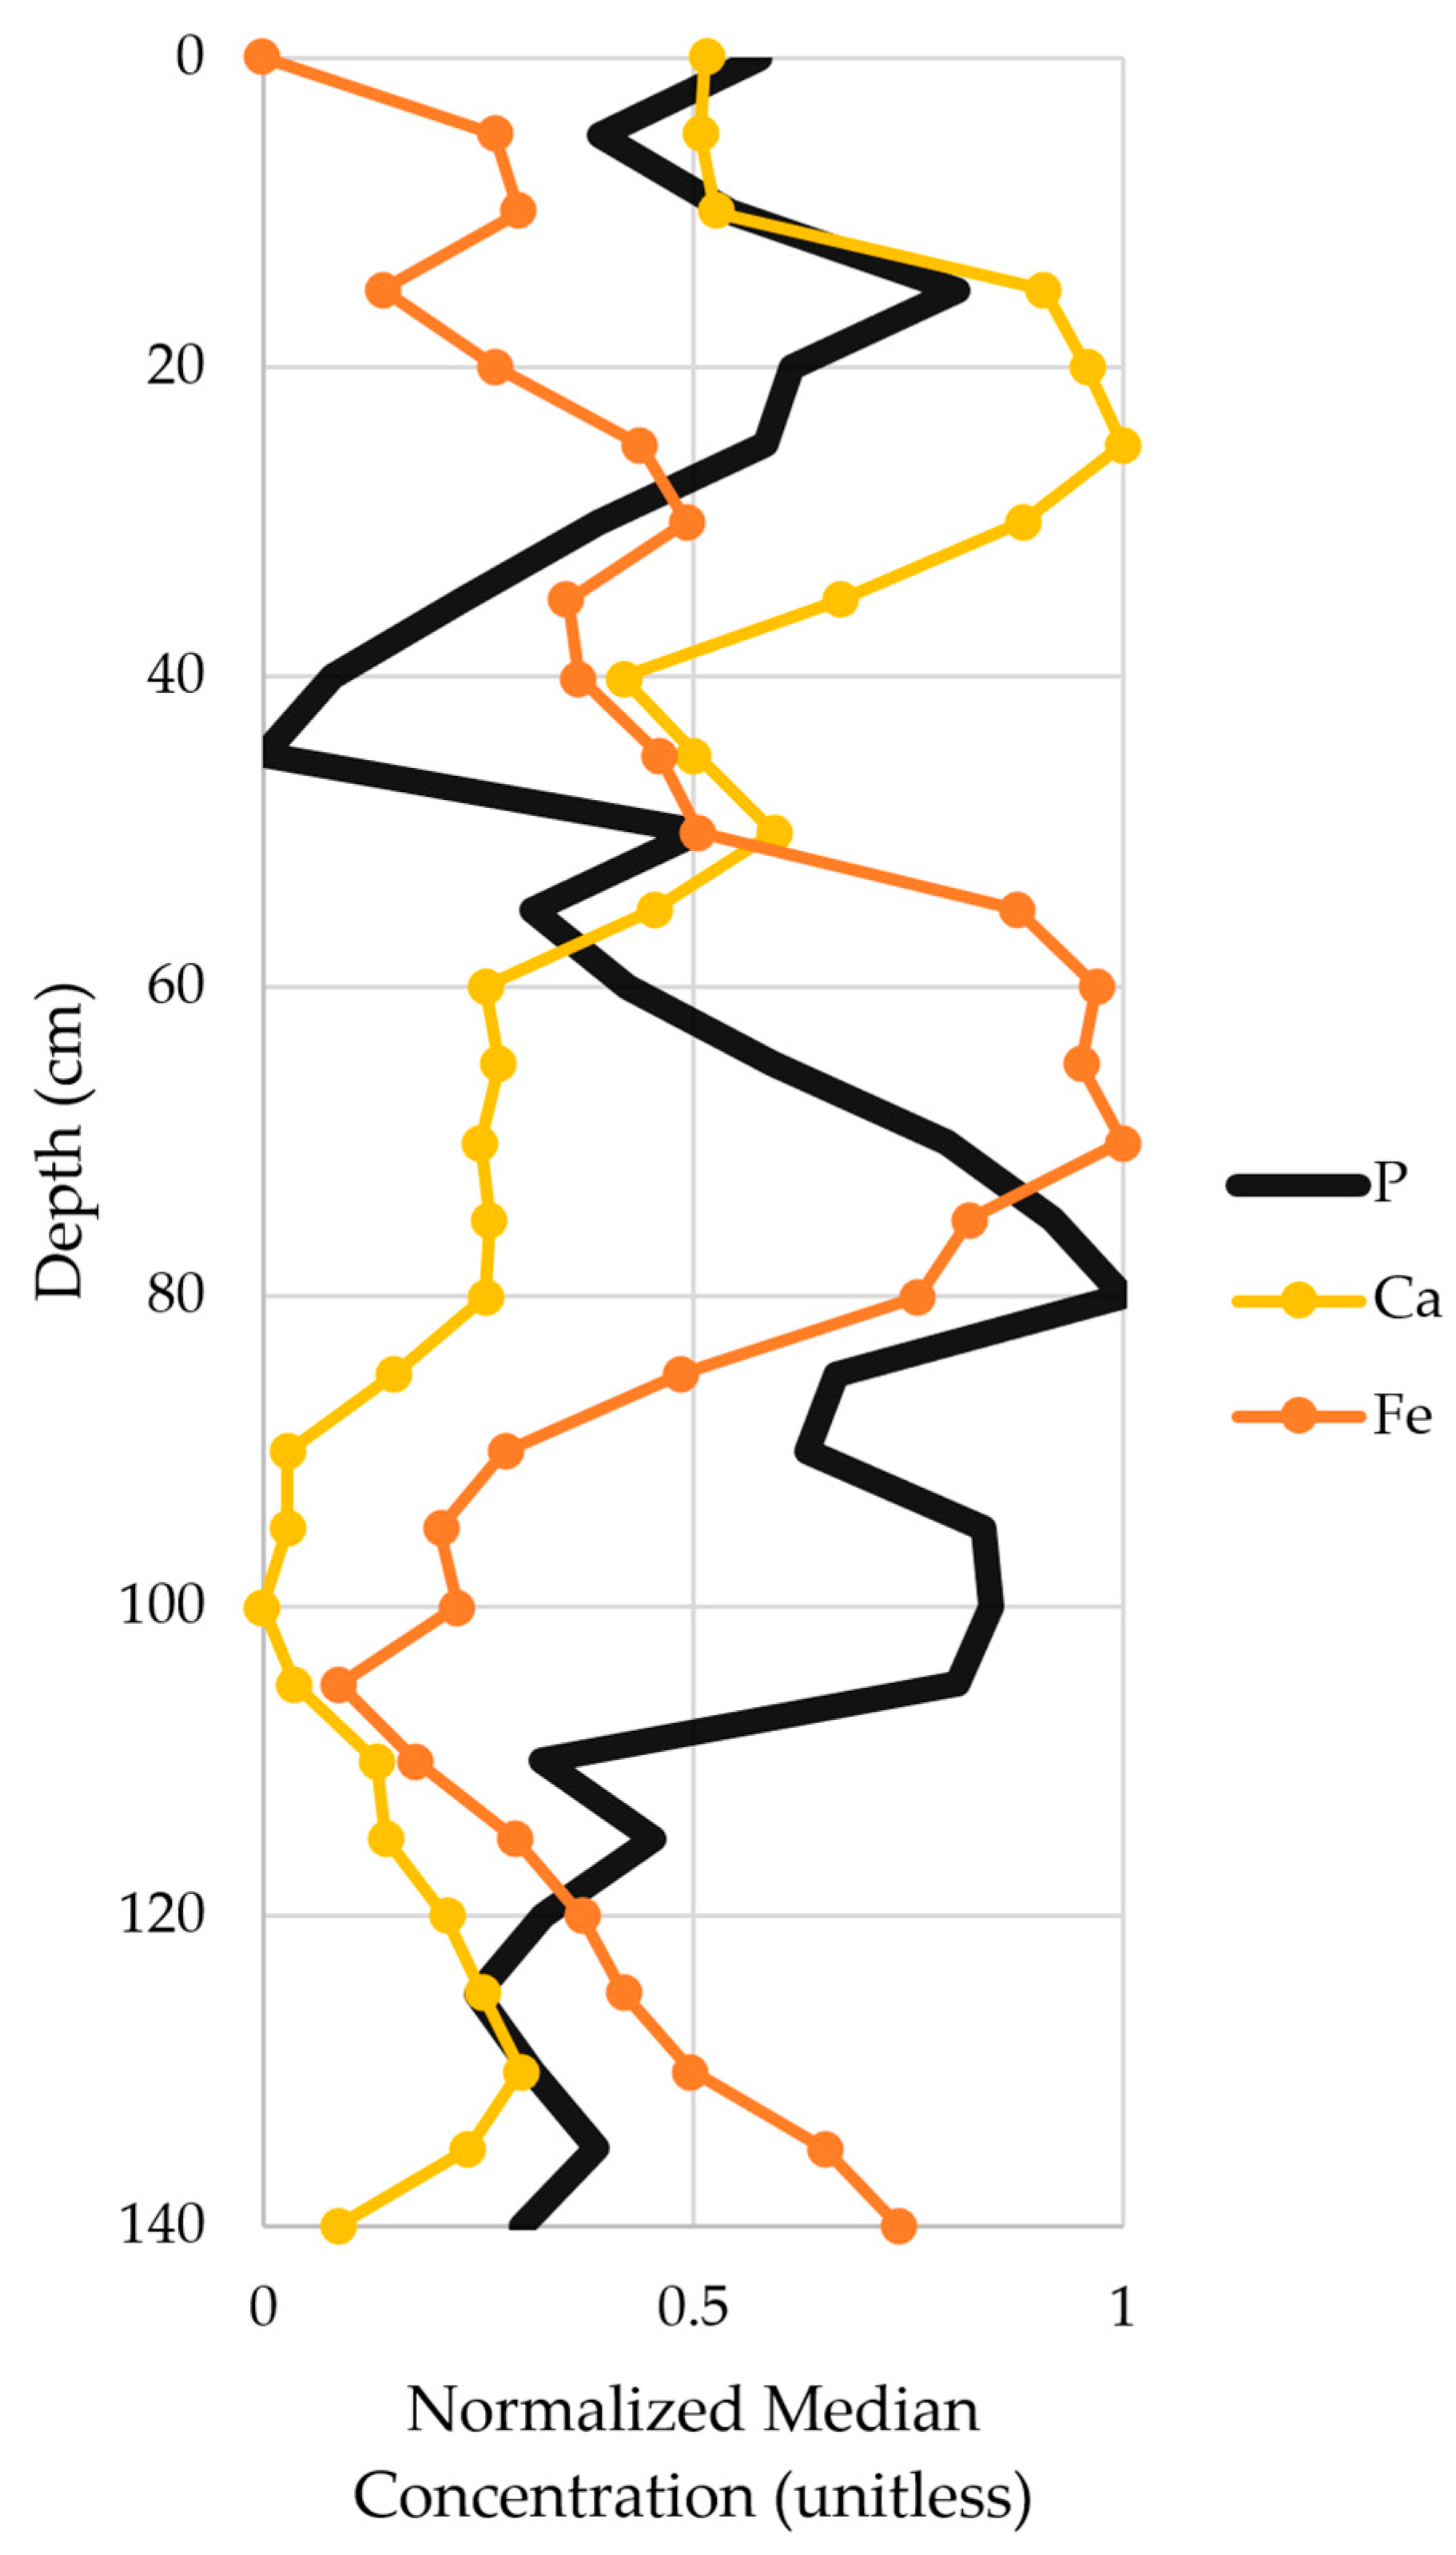
Despite its unique behavior, P has noteworthy geochemical relationships with Ca and Fe, which, like P, exhibit less skewed distribution than most of the other elements in our core samples (Figure 7 and Figure 17).
We expected P to correlate with Ca as CaCO3 coprecipitates with P. Previous studies found that Ca-bound P is one of the largest P fractions in the lake and shoreline sediments, containing over 50% of the total P [18,20,43]. Despite this relationship, P shows only weak correlations with Ca and CaCO3 in our data (r = 0.26 and 0.27, respectively). This weak correlation can be attributed to the different geochemical behaviors of P and Ca in lake sediments. Ca tends to form stable minerals such as CaCO3, which are less prone to dissolution and mobility under typical lake conditions [44]. In contrast, P can exist in various forms, including forms that are more mobile and reactive. For instance, ion-exchangeable P and P bound to redox-sensitive materials can be released and migrate through the sediment under changing environmental conditions, such as variations in pH and redox potential [39].
The interaction between P and Fe is influenced by redox conditions. Under aerobic conditions, Fe(III) forms stable complexes with P, such as with Fe-oxyhydroxides, effectively immobilizing the P. However, under anoxic conditions, Fe(III) is reduced to Fe(II), which dissolves and releases P bound to the Fe(III) compounds [18]. The weak correlation between P and Fe in our core samples (r = 0.19) may reflect ongoing mobilization of P bound to redox-sensitive Fe. Additionally, the vertical distribution of Fe appears to even throughout the sediment while P concentrations remain elevated in the surface layers for some cores associated with the bays, further complicating their relationship.
Complete sediment concentration data for P, Ca, and Fe as well as the other ICP-detectible elements for all 10 sediment cores are provided in the Supplementary Tables.

3.5.4. Connection to Immobile Pollutants

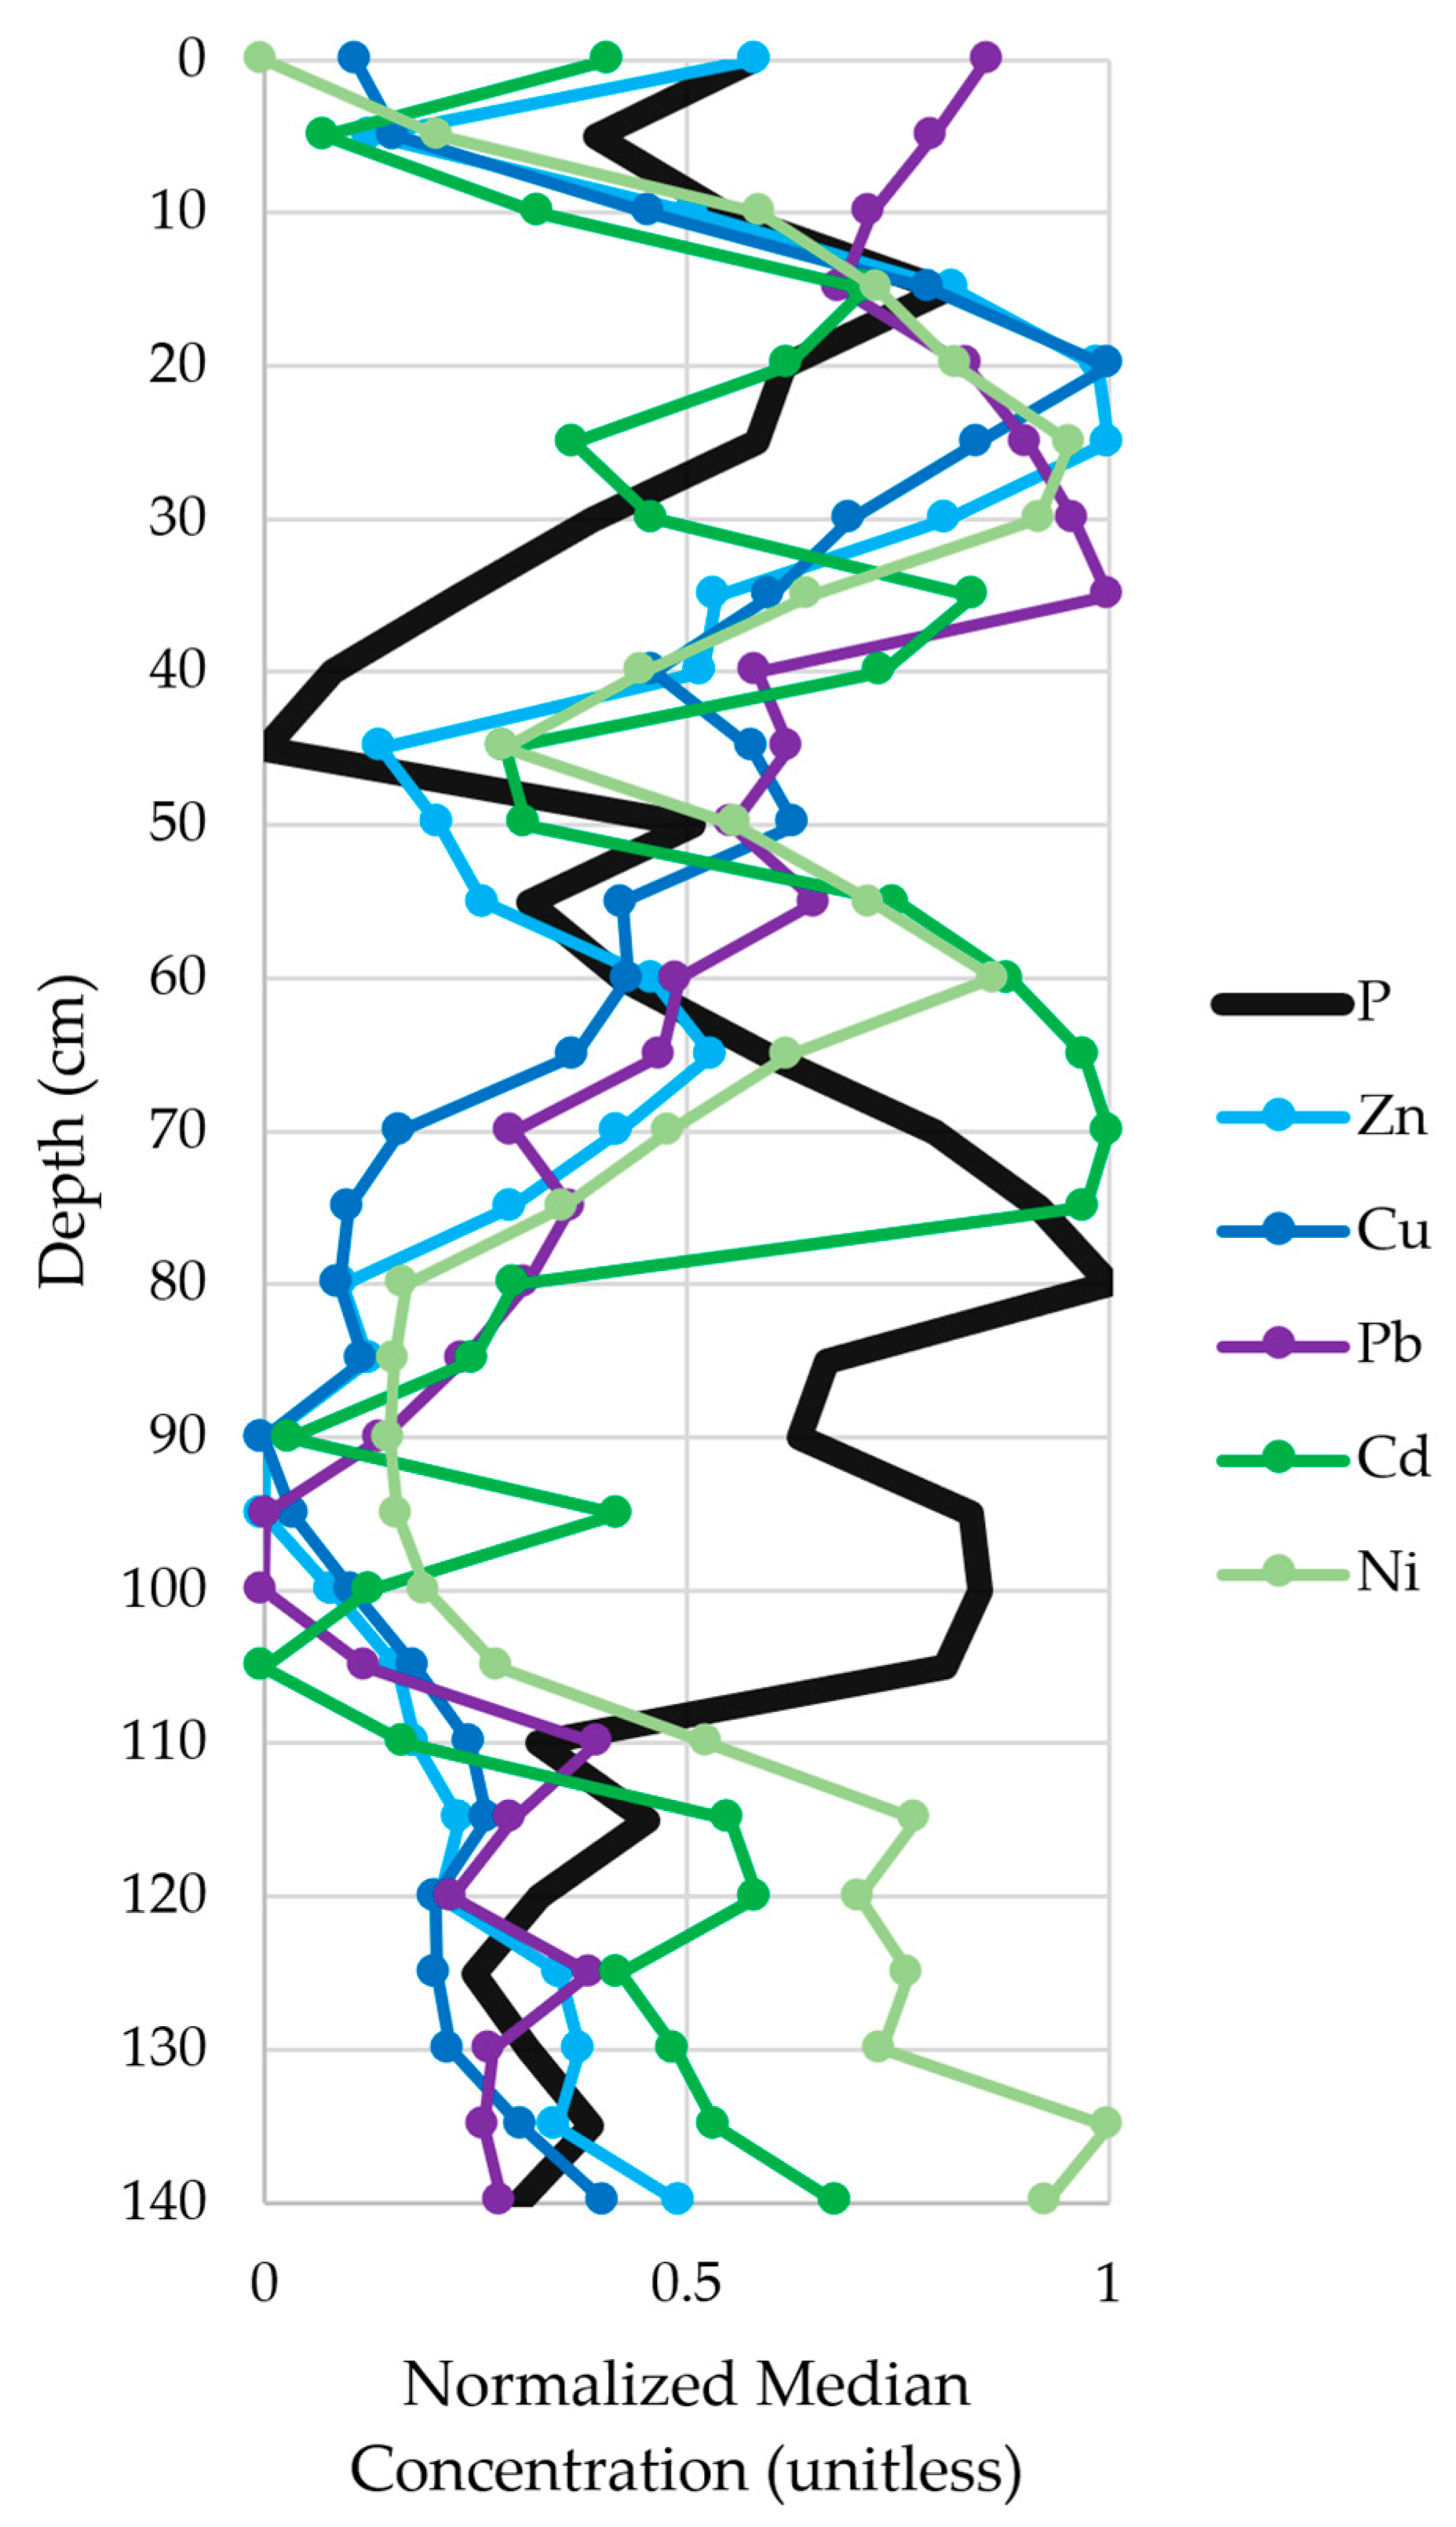
Across Utah Lake, our sediment core data revealed correlations between P and Zn, Cu, Pb, Cd, and Ni (r = 0.62, 0.50, 0.47, 0.47, and 0.42, respectively). Trace metals, such as these, are generally considered immobile elements in lakebed sediments as explained by Bertrand et al. [45]. Previous studies, such as Williams et al. [13], observed increases in Pb, Zn, and Cu concentrations near the surface of Utah Lake core samples, and attribute this to industrial emissions, urban runoff, and coal combustion aerosols over the last century. Our data (Figure 18) similarly demonstrated elevated levels of these metals above 40 cm deep, coinciding with post-European settlement, followed by declining levels above 20 cm except for P and Pb.
Elevated surface concentrations of P in some cores are likely the result of sediment–water interactions in a eutrophic water body, while elevated Pb levels are most likely connected to leaded gasoline pollution. Leaded gasoline was introduced in the United States in the 1920s and was widely used in motor vehicles until it was phased-out in the 1980s and 1990s due to public and environmental health concerns [46]. The combustion of leaded gasoline released tetraethyl lead into the atmosphere, which settled into soils and sediments and transported to water bodies through runoff [47]. Given Utah Lake’s proximity to both an interstate highway and a growing metropolitan area, the deposition and reworking of Pb from leaded gasoline into the shallow sediments of Utah Lake is not unexpected. Our samples clearly show elevated lead (Pb) levels in the top 35 cm which corresponds with the sediment layers we attribute to the period with leaded gasoline. Within this range, concentrations decrease from the surface to about 15 cm, then increase with the highest concentrations occurring at about 35 cm. There is then a sharp decrease until about 50–60 cm, with continuing decreases until about 80–90 cm. We attribute the high concentrations between 15 and 30 cm to the use of leaded gasoline up through the 1980s. While we do not have data to support this, we attribute the concentration gradient below this level to sediment remixing in the lake. We attribute the higher concentrations above 15 cm to both remixing and sediment runoff. It is possible that the recent building boom in the basin distributed near-surface soils and contributed to recent Pb deposition, but we have no data to support this supposition.
These elements are likewise correlated by location. P, Zn, Cu, Pb, Cd, and Ni all tend to be elevated in the Provo Bay, Goshen South, Powell Slough, and Saratoga Springs cores when compared to other portions of the lake. This correlation, alongside the tendency for P to be elevated in the upper portions of the Goshen North, Goshen South, and Provo Bay cores (Figure 16), suggests that Goshen Bay and Provo Bay have likely been impacted by anthropogenic P loading. Lower levels of trace metal pollutants found elsewhere throughout the lake and the non-eutrophic sediment P profile observed when excluding core samples from Goshen Bay and Provo Bay (Figure 15B) suggest that lakebed sediments in the main body Utah Lake are less impacted by anthropogenic P loading.
It is important to recognize that the correlation between P and trace metal pollutants does not necessarily imply that they originate from the same sources. While recent trends in these elements may be influenced by human activities following European settlement, the increase in phosphorus deposition in lakebed sediments in the bays is likely attributed to urban and agricultural runoff, wastewater discharge, and heightened erosion rather than to heavy industrial pollution. Determining the exact cause of these elemental relationships will require further research.
Sediment concentration data for P, the trace metal pollutants, and the other ICP-detectible elements for all 10 sediment cores are provided in the Supplementary Tables.

4. Conclusion

4.1. Key Findings

Our analysis of Utah Lake sediments revealed that elements with less skewed distributions tend to correlate with each other while those with more skewed distributions and more high-concentration outliers are less correlated. Clustering patterns show that As, Mo, S, and Ti form a distinct group with relatively low concentrations and few correlations, while Se is isolated as its own cluster.
Elemental depth trends show that Mn, Al, Fe, K, and V tend to be positively correlated with depth, while Ba, Cu, Pb, Sr, and Zn tend to be negatively correlated with depth. P can be either positively, negatively, or uncorrelated with depth depending on the location. Se, Cr, Mo, Si, B, Cu, P, S, Ti, and Zn often exhibit no correlation with depth. These profiles suggest that terrigenous input (e.g., Al, Fe, K, V) increases with sediment burial—consistent with deeper layers reflecting older, mineral-rich sedimentation. In contrast, metals such as Ba, Cu, Pb, Sr, and Zn increase upward in the lakebed, indicating enrichment in recent, anthropogenically influenced sediments. The variable behavior of P further hints at diagenetic remobilization under changing redox conditions across cores—consistent with depth shifts tied to Fe–P interactions noted earlier.
Geochemical shifts identified by Canberra and Manhattan distance metrics at 30–40 cm deep support other studies which found that this sediment depth corresponds to the onset of European settlement near Utah Lake during the mid-1800s. We assert that part of this geochemical shift is due to changes in Pb concentrations, which are high above this depth and low below it, likely because of leaded gasoline pollution from the mid-20th century. The high Pb values in sediments from the late 19th and early 20th centuries are likely due to sediment reworking, which mixed in Pb from more recent deposits.
CaCO3 accounts for about 20 wt.% of lake-wide sediment, and is typically associated with fine-grained sediment layers, while OM averages 1.3 wt.% and peaks near the surface. Lake-wide trends in sediment core P indicate that Utah Lake is eutrophic, though individual cores vary in their depositional behavior, highlighting the need for numerous core samples that extend deeper than 30 cm in order to accurately represent large, shallow lakes with reworked sediments.
Sediment P in Utah Lake is connected to several elements. Geochemically, it shares processes with Ca (via CaCO3 coprecipitation) and with Fe (via redox-related coprecipitation) but is weakly correlated with either, likely because of differences in mobility. P is also correlated with several trace metal elements, including Zn, Cu, Pb, Cd, and Ni. Elevated P levels in the upper sections of the Goshen North, Goshen South, and Provo Bay cores, combined with high concentrations of immobile metals, indicate that Goshen Bay and Provo Bay have likely been more significantly impacted by anthropogenic P loading compared to other portions of the lake. The correlation between P and these metals likely arises from the influence of multiple simultaneous human activities in these lake regions. Elevated P levels in the bay cores are more likely driven by urban and agricultural runoff, wastewater discharge, and increased erosion rather than by heavy industrial pollution.
This paper addresses a critical knowledge gap by analyzing 10 deep cores (140–240 cm below the sediment-water interface) for 25 ICP-detectible elements, CaCO3, and LOI, significantly expanding spatial coverage compared to prior studies. Methodological rigor is demonstrated through robust sampling strategies, core shortening corrections, and multivariate statistical analyses. Key findings, including the validation of a geochemical shift at 30–40 cm depth correlating with European settlement and elevated Pb levels linked to 20th-century leaded gasoline use, provide compelling evidence of human influence. The discussion of P dynamics and its relationships with Ca, Fe, and trace metals enhances understanding of nutrient cycling in this shallow eutrophic system. While limited to near-shore areas due to water levels, the study complements existing central-lake datasets and provides a foundation for future management strategies. The work advances paleolimnological research in dynamic lacustrine environments.

4.2. Study Limitations and Suggestions for Future Research

This study involved collecting 10 near-shore lakebed cores from Utah Lake and analyzing them for ICP-detectible elements, CaCO3, and OM. We assessed the relationships between chemical constituents, sediment depth, and sample location while relying on the geochronological work of other studies to provide a historical reference point when evaluating our cores. Researchers who want to incorporate an age component into future sediment core studies should identify and analyze specific isotopic, radiometric, or stratigraphic markers. This will help establish the age and historical timeline of the sediment cores, providing a clearer understanding of the relationship between elemental concentrations and the time of deposition.
We were limited to collecting sediment cores that were near or on the shoreline of Utah Lake because of unusually high water levels. Future sediment core studies on Utah Lake may want to consider collecting numerous cores from the interior of the lake. We also suggest collecting core samples that are moderate in length (>1 m) to better capture geochemical trends throughout the reworked sediment and to clearly sample pre-European deposition.
The dataset we assembled from our core samples represents a comprehensive collection of geochemical data from various locations around Utah Lake. While our initial analysis has provided valuable insights into the lake’s sediment composition and depositional history, we recognize that there is still much to uncover. We encourage other researchers to delve into our dataset, apply different analytical techniques, and explore additional questions. We hope this will further enhance our collective understanding of the lake’s geochemical processes and contribute to the broader scientific knowledge of sediment dynamics in shallow lakes.
While this study explored relationships between P and other elements in Utah Lake sediment cores, assessing historical P loading and the lake’s previous trophic state using P was beyond its scope. As researchers examine the potential of CaCO3-P extraction for such assessments, we encourage further investigation into whether CaCO3-P extraction is more effective than Ca-P extraction. Additionally, we suggest evaluating how the formation of autogenic CaCO3-P and the potential dissolution of CaCO3-P could impact the reliability of this extraction method.

Supplementary Materials

The following supporting information can be downloaded at: https://www.mdpi.com/article/10.3390/geosciences15090363/s1, Table S1: Airport Core; Table S2: Benjamin Core; Table S3: Goshen North Core; Table S4: Goshen South Core; Table S5: Lindon Marina Core; Table S6: Mosida Core; Table S7: North Shore Core; Table S8: Provo Bay Core; Table S9: Powell Slough Core; Table S10: Saratoga Springs Core.

Author Contributions

Conceptualization, J.B.T. and G.P.W.; methodology, J.B.T. and L.M.W.; software, J.B.T.; validation, G.P.W.; formal analysis, J.B.T. and G.P.W.; investigation, J.B.T.; resources, G.P.W.; data curation, J.B.T.; writing—original draft preparation, J.B.T.; writing—review and editing, L.M.W., K.B.T. and G.P.W.; visualization, J.B.T.; supervision, G.P.W.; project administration, J.B.T.; funding acquisition, J.B.T. and G.P.W. All authors have read and agreed to the published version of the manuscript.

Funding

This research was funded by the Wasatch Front Water Quality Council and the Brigham Young University Civil & Construction Engineering Department.

Data Availability Statement

Data is contained within the article or Supplementary Material.

Acknowledgments

We would like to thank the Wasatch Front Water Quality Council and the Brigham Young University Civil & Construction Engineering Department for supporting this project, and for the Brigham Young University Environmental Analytical Laboratory for facilitating the analysis of our core samples. We would also like to thank Paige Blocker, Madeline Oxborrow, and Marisa Woodland for assisting us with fieldwork and lab work portions of this study.

Conflicts of Interest

The authors declare no conflicts of interest.

Abbreviations

The following abbreviations for sediment core locations are used in this manuscript:
AAirport
BBenjamin
GNGoshen North
GSGoshen South
LMLindon Marina
MMosida
NSNorth Shore
PBProvo Bay
PSPowell Slough
SSSaratoga Springs

References

  1. Last, W.M.; Smol, J.P. Tracking Environmental Change Using Lake Sediments: Basin Analysis, Coring, and Chronological Techniques; Springer Science & Business Media: London, UK, 2002; Volume 1. [Google Scholar]
  2. Last, W.M.; Smol, J.P. Tracking Environmental Change Using Lake Sediments: Physical and Geochemical Methods; Springer Science & Business Media: London, UK, 2002; Volume 2. [Google Scholar]
  3. Bissell, H.J. Preliminary Study of the Bottom Sediments of Utah Lake, Utah. In Report of the Committee on Sedimentation, 1940-41; National Research Council, Division of Geology and Geography: Washington, DC, USA, 1941; pp. 62–69. [Google Scholar]
  4. Bingham, C.C. Recent Sedimentation Trends in Utah Lake. Master’s Thesis, Brigham Young University, Provo, UT, USA, 1974. [Google Scholar]
  5. Bolland, R.F. Paleoecological Interpretation of the Diatom Succession in the Recent Sediments of Utah Lake, Utah. Ph.D. Thesis, The University of Utah, Salt Lake City, UT, USA, 1974. [Google Scholar]
  6. Brimhall, W.H.; Bassett, I.G.; Merritt, L.B. Reconnaissance Study of Deep-Water Springs and Strata of Utah Lake; Eyring Research Institute: Provo, UT, USA, 1976; pp. 1–21. [Google Scholar]
  7. Bushman, J.R. The Rate of Sedimentation in Utah Lake and the Use of Pollen as an Indicator of Time in the Sediments; 0068-1016, Brigham Young University Geology Studies; Brigham Young University: Provo, UT, USA, 1980; pp. 35–43. [Google Scholar]
  8. Brimhall, W.H.; Merritt, L.B. Geology of Utah Lake: Implications for resource management. Great Basin Nat. Mem. 1981, 5, 24–42. [Google Scholar]
  9. Macharia, A.N. Reconstructing Paleoenvironments Using a Mass-Energy Flux Framework. Ph.D. Thesis, The University of Utah, Salt Lake City, UT, USA, 2012. [Google Scholar]
  10. Brothers, S.; King, L.; Klein, A.; Brahney, J. Final Report to the Utah Division of Water Quality: Littoral-Benthic Primary Production in Utah Lake; Department of Watershed Sciences and Ecology Center, Utah State University: Logan, UT, USA, 2021. [Google Scholar]
  11. Williams, R.R.R. Determining the Anthropogenic Effects on Eutrophication of Utah Lake Since European Settlement Using Multiple Geochemical Approaches. Master’s Thesis, Brigham Young University, Provo, UT, USA, 2021. [Google Scholar]
  12. Devey, M.R. Comparing Multiple Approaches to Reconstructing the Phosphorus History of Marl Lakes: A Utah Lake Case Study. Master’s Thesis, Utah State University, Logan, UT, USA, 2022. [Google Scholar]
  13. Williams, R.; Nelson, S.; Rushforth, S.; Rey, K.; Carling, G.; Bickmore, B.; Heathcote, A.; Miller, T.; Meyers, L. Human-Driven Trophic Changes in a Large, Shallow Urban Lake: Changes in Utah Lake, Utah from Pre-European Settlement to the Present. Water Air Soil Pollut. 2023, 234, 218. [Google Scholar] [CrossRef]
  14. Brahney, J.; Powers, M.; King, L.; Devey, M.; Carter, M.; Carling, G.; Brothers, S.; Provard, A.; Young, B.; West, R. Utah Lake Paleoecology Study Report to DEQ; Watershed Sciences Faculty Publications; Utah State University: Logan, UT, USA, 2024; Volume 1163, p. 44. [Google Scholar] [CrossRef]
  15. King, L.; Devey, M.; Leavitt, P.R.; Power, M.J.; Brothers, S.; Brahney, J. Anthropogenic forcing leads to an abrupt shift to phytoplankton dominance in a shallow eutrophic lake. Freshw. Biol. 2024, 69, 335–350. [Google Scholar] [CrossRef]
  16. Abbott, B.W.; Errigo, I.M.; Follett, A.; Lawson, G.; Meyer, M.M.; Moon, H.; Shurtleff, K.; LeMonte, J.J.; Proteau, M.; Davis, K.; et al. Getting to Know the Utah Lake Ecosystem; Brigham Young University: Provo, UT, USA, 2021. [Google Scholar]
  17. Abu-Hmeidan, H.Y.; Williams, G.P.; Miller, A.W. Characterizing total phosphorus in current and geologic utah lake sediments: Implications for water quality management issues. Hydrology 2018, 5, 8. [Google Scholar] [CrossRef]
  18. Randall, M.C.; Carling, G.T.; Dastrup, D.B.; Miller, T.; Nelson, S.T.; Rey, K.A.; Hansen, N.C.; Bickmore, B.R.; Aanderud, Z.T. Sediment potentially controls in-lake phosphorus cycling and harmful cyanobacteria in shallow, eutrophic Utah Lake. PLoS ONE 2019, 14, e0212238. [Google Scholar] [CrossRef]
  19. Taggart, J.B.; Ryan, R.L.; Williams, G.P.; Miller, A.W.; Valek, R.A.; Tanner, K.B.; Cardall, A.C. Historical Phosphorus Mass and Concentrations in Utah Lake: A Case Study with Implications for Nutrient Load Management in a Sorption-Dominated Shallow Lake. Water 2024, 16, 933. [Google Scholar] [CrossRef]
  20. Taggart, J.B. Inorganic Phosphorus Chemistry of Utah Lake’s Effluent Mixing Zones. Master’s Thesis, Colorado School of Mines, Golden, CO, USA, 2021. [Google Scholar]
  21. Valek, R.A.; Tanner, K.B.; Taggart, J.B.; Ryan, R.L.; Cardall, A.C.; Woodland, L.M.; Oxborrow, M.J.; Williams, G.P.; Miller, A.W.; Sowby, R.B. Regulated Inductively Coupled Plasma–Optical Emission Spectrometry Detectible Elements in Utah Lake: Characterization and Discussion. Water 2024, 16, 2170. [Google Scholar] [CrossRef]
  22. Tanner, K.B.; Cardall, A.C.; Williams, G.P. A spatial long-term trend analysis of estimated chlorophyll-a concentrations in Utah Lake using Earth observation data. Remote Sens. 2022, 14, 3664. [Google Scholar] [CrossRef]
  23. Carter, R.D. Utah Lake: Legacy. In June Sucker Recovery Implementation Program; Utah Department of Environmental Quality: Salt Lake City, UT, USA, 2002. [Google Scholar]
  24. Hooton, L.W., Jr. Utah Lake & Jordan River Water Rights & Management Plan; The Salt Lake City Department of Public Utilities: Salt Lake City, UT, USA, 1989. [Google Scholar]
  25. Department of the Interior, Fish and Wildlife Service. Endangered and Threatened Wildlife and Plants: Reclassification of the Endangered June Sucker to Threatened with a Section 4(d) Rule. In Federal Register; Department of the Interior, Fish and Wildlife Service: Washington, DC, USA, 2021; Volume 86, pp. 192–212. [Google Scholar]
  26. Utah Lake Wetland Preserve. Available online: https://www.mitigationcommission.gov/wetlands/wetlands_ulwp.html (accessed on 10 October 2024).
  27. Hongve, D.; Erlandsen, A.H. Shortening of Surface Sediment Cores During Sampling. Hydrobiologia 1979, 65, 283–287. [Google Scholar] [CrossRef]
  28. Morton, R.A.; White, W.A. Characteristics of and Corrections for Core Shortening in Unconsolidated Sediments. J. Coast. Res. 1997, 13, 761–769. [Google Scholar]
  29. Zheng, G.; Takano, B.; Matsuo, M.; Tanaka, Y. Compaction of modern soft sediments during core sampling—An in situ investigation at an estuary site. Environ. Geosci. 2002, 9, 109–114. [Google Scholar] [CrossRef]
  30. Ramirez, S.G.; Hales, R.C.; Williams, G.P.; Jones, N.L. Extending SC-PDSI-PM with neural network regression using GLDAS data and Permutation Feature Importance. Environ. Model. Softw. 2022, 157, 105475. [Google Scholar] [CrossRef]
  31. Evans, S.; Williams, G.P.; Jones, N.L.; Ames, D.P.; Nelson, E.J. Exploiting earth observation data to impute groundwater level measurements with an extreme learning machine. Remote Sens. 2020, 12, 2044. [Google Scholar] [CrossRef]
  32. Wrath, W.F. Contamination and compaction in core sampling. Science 1936, 84, 537–538. [Google Scholar] [CrossRef]
  33. EPA. Method 3051A (SW-846): Microwave Assisted Acid Digestion of Sediments, Sludges, and Oils; EPA: Washington, DC, USA, 2007.
  34. Gavlak, R.; Horneck, D.; Miller, R.O.; Kotuby-Amacher, J. Soil, Plant and Water Reference Methods for the Western Region, 3rd ed.; Western Region Extension Publication (WREP 125); Colorado State University: Fort Collins, CO, USA, 2003; pp. 1–207. [Google Scholar]
  35. Munsell. Munsell Soil Color Charts; Munsell Color: New Windsor, NY, USA, 2000. [Google Scholar]
  36. Jackson, E.K.; Roberts, W.; Nelsen, B.; Williams, G.P.; Nelson, E.J.; Ames, D.P. Introductory overview: Error metrics for hydrologic modelling—A review of common practices and an open source library to facilitate use and adoption. Environ. Model. Softw. 2019, 119, 32–48. [Google Scholar] [CrossRef]
  37. Roberts, W.; Williams, G.P.; Jackson, E.; Nelson, E.J.; Ames, D.P. Hydrostats: A Python package for characterizing errors between observed and predicted time series. Hydrology 2018, 5, 66. [Google Scholar] [CrossRef]
  38. Carey, C.C.; Rydin, E. Lake trophic status can be determined by the depth distribution of sediment phosphorus. Limnol. Oceanogr. 2011, 56, 2051–2063. [Google Scholar] [CrossRef]
  39. Carignan, R.; Flett, R. Postdepositional mobility of phosphorus in lake sediments. Limnol. Oceanogr. 1981, 26, 361–366. [Google Scholar] [CrossRef]
  40. Wang, L.; Liang, T. Distribution characteristics of phosphorus in the sediments and overlying water of Poyang Lake. PLoS ONE 2015, 10, e0125859. [Google Scholar] [CrossRef] [PubMed]
  41. Kenney, W.F.; Brenner, M.; Curtis, J.H.; Arnold, T.E.; Schelske, C.L. A holocene sediment record of phosphorus accumulation in shallow Lake Harris, Florida (USA) offers new perspectives on recent cultural eutrophication. PLoS ONE 2016, 11, e0147331. [Google Scholar] [CrossRef]
  42. Casbeer, W.; Williams, G.P.; Borup, M.B. Phosphorus distribution in delta sediments: A unique data set from deer creek reservoir. Hydrology 2018, 5, 58. [Google Scholar] [CrossRef]
  43. Taggart, J.; Miller, T.; Navarre-Sitchler, A.; Carling, G. Mineral Precipitation In Utah Lake And Its Effluent Mixing Zones. In Proceedings of the 2022 Intermountain Engineering, Technology and Computing (IETC), Orem, UT, USA, 13–14 May 2022; pp. 1–5. [Google Scholar]
  44. He, J.; Liu, G.; Zhu, D.; Cai, J.; Zhou, W.; Guo, W. Sequential extraction of calcium in lake sediments for investigating the cycle of phosphorus in water environment. Int. J. Environ. Sci. Technol. 2015, 12, 1123–1136. [Google Scholar] [CrossRef]
  45. Bertrand, S.; Tjallingii, R.; Kylander, M.E.; Wilhelm, B.; Roberts, S.J.; Arnaud, F.; Brown, E.; Bindler, R. Inorganic geochemistry of lake sediments: A review of analytical techniques and guidelines for data interpretation. Earth-Sci. Rev. 2024, 249, 104639. [Google Scholar] [CrossRef]
  46. Kovarki, B. A Century of Tragedy: How the Car and Gas Industry Knew About the Health Risks of Leaded Fuel but Sold It for 100 Years Anyway. Available online: https://theconversation.com/a-century-of-tragedy-how-the-car-and-gas-industry-knew-about-the-health-risks-of-leaded-fuel-but-sold-it-for-100-years-anyway-173395 (accessed on 27 March 2025).
  47. U.S. Energy Information Administration. Leaded Gasoline Was Gradually Taken off the U.S. Market. Available online: https://www.eia.gov/energyexplained/gasoline/gasoline-and-the-environment-leaded-gasoline.php (accessed on 27 March 2025).
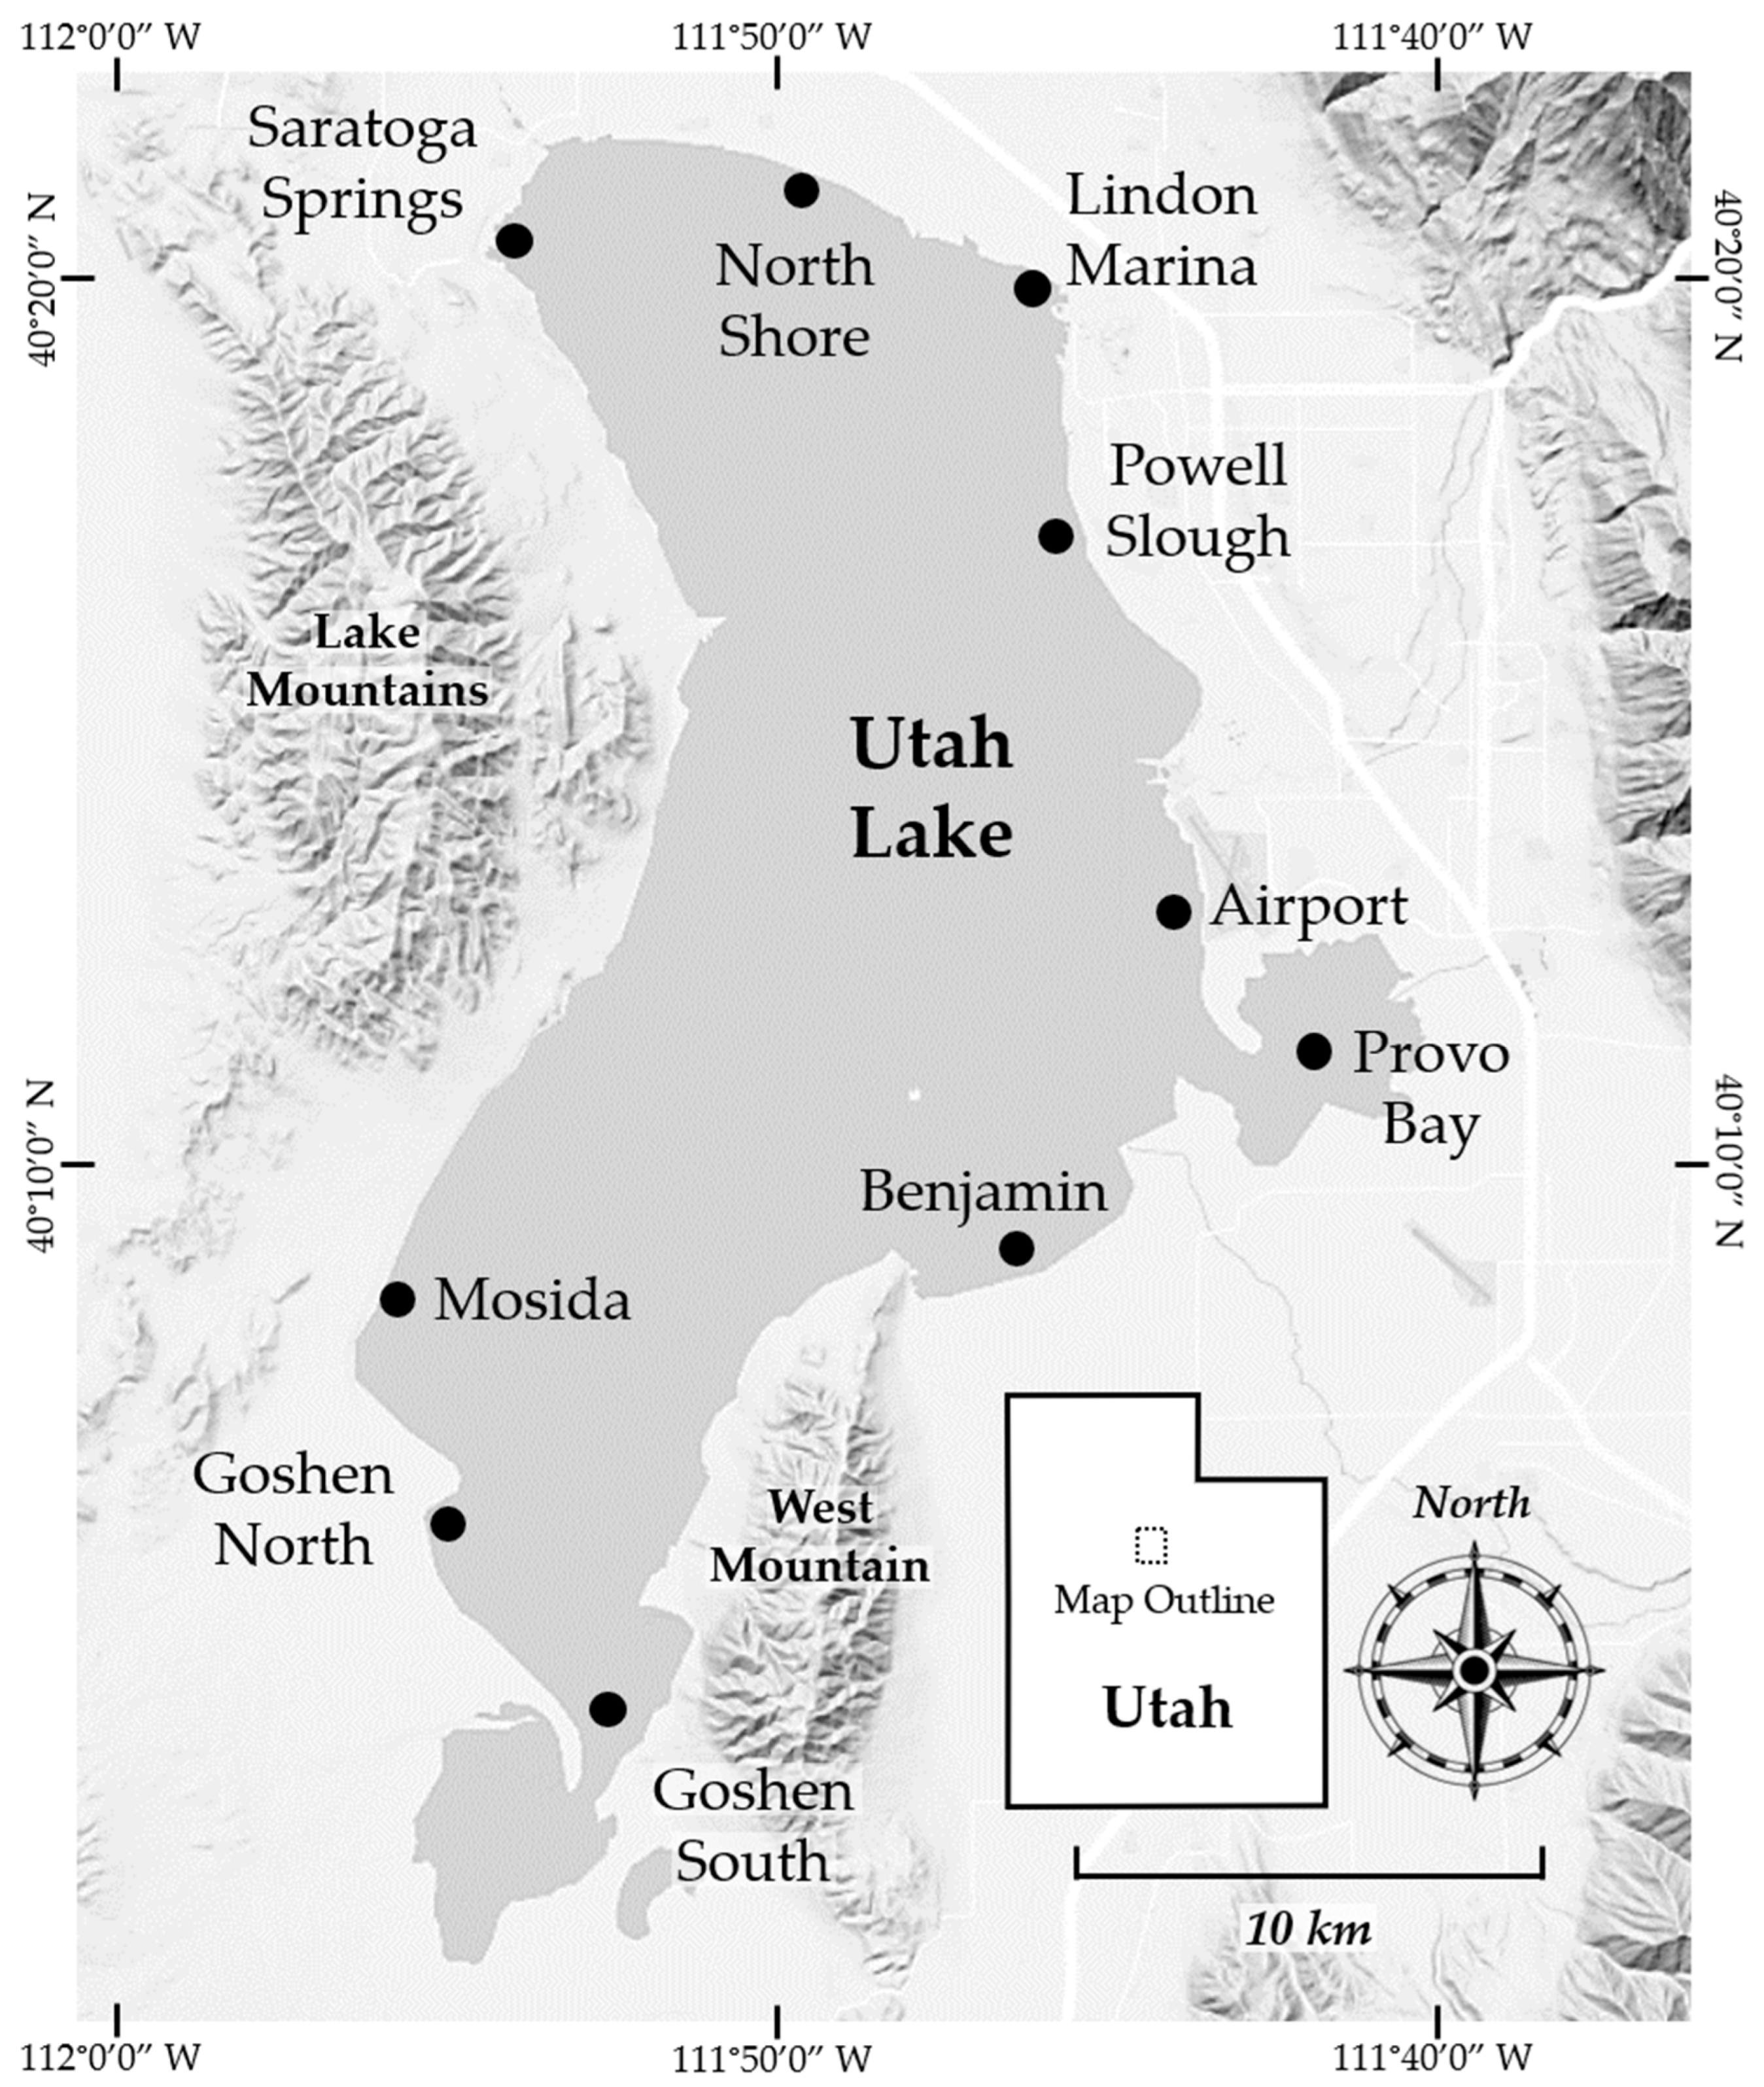
Figure 1. Core sampling locations throughout Utah Lake. European settlement and ongoing human activity affect virtually all sides of Utah Lake. An urban corridor borders the northern and eastern shores, while agricultural areas dominate the southern and western margins.
Geosciences 15 00363 g001
Figure 2. Side view of core shortening mechanisms within an open-barrel core sampler, including sediment thinning (A), physical compaction (B), and sediment bypassing (C). Arrows indicate the downward motion of the sampler during core extraction. Subfigure A is adapted from Hongve and Erlandsen [27]. Multiple core shortening mechanisms can occur simultaneously during sample extraction.
Geosciences 15 00363 g002
Figure 3. Depth comparison between a compacted and uncompacted sediment core sample. Cores collected from open-barrel samplers are prone to core shortening and require depth correction to represent the correct layer placement of undisturbed sediment.
Geosciences 15 00363 g003
Figure 4. Overview photographs of sediment sampling equipment and field collection at Utah Lake, including a core catcher (A), researchers collecting a core sample from the lake (B), and an annotated photograph of the Powell Slough sediment core sample (C).
Geosciences 15 00363 g004aGeosciences 15 00363 g004b
Figure 5. Comparison of core depths and colors, with subsamples shown as individual rectangles within each core. The core depths have been corrected for core shortening, resulting in unequal intervals between subsamples (see Section 1.4). The subsample colors are the actual colors observed using Munsell color matching charts [35]. The red dashed line indicates the depth of the shortest core sample (rounded to 140 cm), which was used as the comparison limit for sediment core data across all samples above this depth.
Geosciences 15 00363 g005
Figure 6. Pearson correlations between ICP-detectible elements from all 10 sediment cores down to a depth of 140 cm. The chord diagram (A) shows strong positive correlations (r > 0.5) as connecting lines between elements. The correlation matrix heatmap (B) displays all pairwise correlations, regardless of strength.
Geosciences 15 00363 g006aGeosciences 15 00363 g006b
Figure 7. Min-max normalized distribution of elemental concentrations across all 10 core samples. The elements are listed in descending order by mean concentration, with the means represented by an X in each boxplot. Outliers are plotted as individual dots and are defined as points below Q1 - 1.5 × IQR or above Q3 + 1.5 × IQR. The numbers in parentheses next to each element symbol indicate the number of strong correlations that element has with other ICP-detectable elements. As these are normalized values, distributions towards the center of the graph are less skewed, while those near the edge are more skewed. Note: Si and Ti values may be inaccurate due to incomplete digestion.
Geosciences 15 00363 g007
Figure 8. Multidimensional scaling results for ICP-detectible elements from all 10 sediment cores using Manhattan distances (A); (ρ = 0.922) and Canberra distances (B); (ρ = 0.874). Element groupings are highlighted with colored ellipses. Although Canberra distances have a slightly lower rank correlation (ρ) than Euclidean distances, we chose to display them here because they better emphasize the clusters among the elements. MDS plots based on Euclidean distances display a similar pattern to the Manhattan distances, and so they are not shown. Note: Si and Ti values shown may be inaccurate due to incomplete digestion.
Geosciences 15 00363 g008
Figure 9. Min-max normalized elemental concentrations for the Benjamin (A) and Provo Bay (B) cores. The Benjamin core shows high elemental concentrations at greater depths while the Provo Bay core shows high concentrations near the surface, thus exhibiting opposite depth correlations. Chemostratigraphic variation is apparent in both cores as shown by the layer of low elemental concentration at 159.0 cm deep in the Benjamin core as well as the layer of moderate elemental concentration at 189.7 cm deep in the Provo Bay core. Notably, both sediment cores show high Pb concentrations near the surface, strongly indicating recent regional anthropogenic activity. Note: Si and Ti values shown are most likely underestimated due to incomplete digestion.
Geosciences 15 00363 g009aGeosciences 15 00363 g009b
Figure 10. Multidimensional scaling results for sample depths 0–140 cm from all 10 sediment cores using Pearson Correlation distances (A); (ρ = 96.3) and Canberra distances (B); (ρ = 0.916). We show the MDS plot of Canberra distances rather than Spectral Angle distances (ρ = 0.925) because the Canberra distances display a gap between 30 and 40 cm. This depth coincides with the arrival of European settlers and is therefore expected to be a point of shifting geochemical trends in Utah Lake sediments. We did not assign chronological interpretations to any other gaps in the profile due to the absence of age constraints.
Geosciences 15 00363 g010
Figure 11. Multidimensional scaling results for all 10 sample locations using Canberra distances (A; ρ = 0.929) and Euclidean distances (B; ρ = 0.917). These plots appear to be better at identifying geochemically unique cores, such as the Airport core, rather than clustering similar cores together.
Geosciences 15 00363 g011aGeosciences 15 00363 g011b
Figure 12. Fractional CaCO3 from near-shore core samples from Utah Lake. CaCO3 appears to be more closely associated with sediment texture than it is with sediment depth, with non-silty sediments exhibiting lower levels of CaCO3. Outliers are plotted as points labeled by location (A for Airport; M for Mosida; and PS for Powell Slough) and are defined as points below Q1 - 1.5 × IQR or above Q3 + 1.5 × IQR.
Geosciences 15 00363 g012
Figure 13. Fractional LOI from near-shore core samples from Utah Lake. Elevated levels of LOI tend to be associated with core samples collected from the bays, often less than 1 m deep below the sediment-water interface. Outliers are plotted as dots labeled by location (PB for Provo Bay) and are defined as points below Q1 - 1.5 × IQR or above Q3 + 1.5 × IQR.
Geosciences 15 00363 g013
Figure 14. Interpolated P concentrations across all 10 sediment core samples. The dotted black line shows the depth of the shortest core, marking the point reached by all sediment cores.
Geosciences 15 00363 g014
Figure 15. Distribution of sediment P down to 140 cm deep from all 10 core samples (A) and the non-bay core samples (excluding Goshen North, Goshen South, and Provo Bay); (B). Outliers are plotted as individual dots and are defined as points below Q1 - 1.5 × IQR or above Q3 + 1.5 × IQR. The red dashed line represents mean concentration while the blue dashed line represents median concentration. Black vertical lines are shown on either side of the means and medians to emphasize the trends with depth. The consistency shown in the top 30 cm of both plots resembles the sediment P profile of mesotrophic lakes. However, a look at the overall trend down to 140 cm is consistent with a eutrophic sediment P profile (decreasing with depth) in panel A, and an oligotrophic sediment P profile (increasing with depth) in panel B. Inclusion of the Goshen Bay and Provo Bay cores is critical for creating a lake-wide sediment P profile that aligns with Utah Lake’s eutrophic status. Conversely, the exclusion of the Goshen Bay and Provo Bay cores indicates that sediments across most of Utah Lake are not significantly impacted by P.
Geosciences 15 00363 g015
Figure 16. P concentrations for each of the 10 sediment cores, with the color scale of each core corresponding to that core’s minimum and maximum concentrations. While P generally decreases with depth as shown by the Goshen North, Goshen South, and Provo Bay cores, this trend does not occur universally across all core samples.
Geosciences 15 00363 g016
Figure 17. Median normalized concentration for P, Ca, and Fe for all 10 core samples.
Geosciences 15 00363 g017
Figure 18. Median normalized concentrations for P and strong to moderately correlated immobile pollutants, including Zn, Cu, Pb, Cd, and Ni.
Geosciences 15 00363 g018
Table 1. Sediment core sample information.
Site NameWater DepthPenetration DepthCore Length% Shortened
Airport (A)2.33 m/7.66 ft1.62 m/5.33 ft0.90 m/2.95 ft45%
Benjamin (B)1.80 m/5.91 ft2.44 m/8.00 ft1.15 m/3.77 ft53%
Goshen North (GN)1.73 m/5.67 ft1.52 m/5.00 ft0.95 m/3.12 ft38%
Goshen South (GS)1.75 m/5.75 ft2.44 m/8.00 ft0.94 m/3.08 ft61%
Lindon Marina (LM)1.72 m/5.63 ft2.44 m/8.00 ft1.00 m/3.28 ft59%
Mosida (M)1.73 m/5.67 ft1.60 m/5.25 ft0.69 m/2.26 ft57%
North Shore (NS)1.17 m/3.83 ft2.44 m/8.00 ft0.85 m/2.79 ft65%
Powell Slough (PS)1.65 m/5.42 ft1.83 m/6.00 ft1.00 m/3.28 ft45%
Provo Bay (PB)2.18 m/7.16 ft2.44 m/8.00 ft0.90 m/2.95 ft63%
Saratoga Springs (SS)1.74 m/5.72 ft1.60 m/5.25 ft1.10 m/3.61 ft31%
Table 2. Texture and color of the Airport and Benjamin core samples. The Airport core appears to be an anomaly among the core samples due to its proximity to the Provo River. In contrast, the Benjamin core is more representative of the typical sediment composition found in our study. Details regarding the other sediment cores can be found in the Supplementary Tables.
Airport Core Benjamin Core
Length (cm)Depth (cm)TextureMunsellColor Length (cm)Depth (cm)TextureMunsellColor
NotationNotation
00.00Sandy2.5Y 6/1 00.00Silty2.5Y 5/2
59.03Silty Sand2.5Y 7/1 510.6Silty10YR 6/2
1018.05Silty2.5Y 7/2 1021.2Silty10YR 6/2
1527.08Silty2.5Y 7/2 1531.81Silty10YR 6/2
2036.1Silty2.5Y 7/2 2042.41Silty10YR 6/2
2545.13Silty Sand2.5Y 6/2 2553.01Silty10YR 6/2
3054.15Silty Sand2.5Y 6/2 3063.61Silty10YR 6/2
3563.18Silty Sand2.5Y 6/1 3574.21Silty10YR 6/2
4072.2Sandy2.5Y 5/1 4084.81Silty10YR 6/2
4581.23Sandy2.5Y 5/1 4595.42Silty10YR 6/2
5090.25Sandy2.5Y 5/2 50106.02Silty10YR 6/2
5599.28Sandy2.5Y 6/2 55116.62Silty10YR 6/2
60108.31Sandy2.5Y 6/2 60127.22Silty10YR 6/2
65117.33Sandy2.5Y 6/2 65137.82Silty10YR 6/2
70126.36Sandy2.5Y 6/2 70148.42Silty10YR 6/2
75135.38Sandy2.5Y 6/2 75159.03Silty10YR 6/2
80144.41Sandy2.5Y 6/2 80169.63Silty10YR 6/2
85153.43Sandy2.5Y 6/1 85180.23Silty10YR 6/2
90162.46Sandy2.5Y 6/1 90190.83Silty10YR 6/2
95201.43Silty10YR 6/2
100212.03Silty10YR 6/2
105222.64Silty10YR 6/2
110233.24Silty10YR 6/2
115243.84Silty10YR 6/2
Table 3. Summary statistics for elemental concentrations (mg kg−1) across all sediment cores. Note: Si and Ti values shown are most likely underestimated due to incomplete digestion.
ElementMeanMedianStandard DeviationSkewnessElementMeanMedianStandard DeviationSkewness
Al3577302419211.3Mo1.90.773.53.1
As7.04.69.23.2Na5374633031.8
B13126.10.8Ni8.37.43.60.6
Ba112.585862.5P5304981430.7
Ca89,54384,94143,8190.5Pb6.95.94.61.8
Cd0.710.660.30.5S146257818792.1
Co3.22.91.41.2Se0.980.311.31.5
Cr26.325111.1Si3723782020.3
Cu7.76.24.60.8Sr2802172121.4
Fe6906630929920.7Ti121102844.1
K1491109611151.7V3128141.2
Mg9484860049791.8Zn3328182.1
Mn3873331931.2
Disclaimer/Publisher’s Note: The statements, opinions and data contained in all publications are solely those of the individual author(s) and contributor(s) and not of MDPI and/or the editor(s). MDPI and/or the editor(s) disclaim responsibility for any injury to people or property resulting from any ideas, methods, instructions or products referred to in the content.